icabr2009 biorefineries and biobased...
TRANSCRIPT

BIOREFINERIES AND BIOBASED PRODUCTS FROM THE CONSUMER’S POINT OF VIEW
Stefan Kurka1, Klaus Menrad1
1Chair of Marketing and Management of Biogenic Resources, Straubing Center of Science, University of Applied Sciences Weihenstephan,
Straubing, Germany
Paper prepared for presentation at the 13th ICABR International Conference on Agricultural Biotechnology: “The emerging bio-economy”
Ravello (Italy), 18th to 20th June 2009
Copyright 2009 by authors. All rights reserved. Readers may make verbatim copies of this document for non-commercial purposes by any means, provided that this copyright notice appears on all such copies.

Biorefineries and biobased products from the consumer’s point of view
Kurka Stefan, Prof. Dr. Klaus Menrad

Table of contents
Figures ..................................................................................................................................................... 4
Tables ...................................................................................................................................................... 5
1. Introduction ..................................................................................................................................... 6
2. Methodology and data gathering procedure .................................................................................. 7
3. Contents of the questionnaire and description of the sample ....................................................... 8
4. Results of the survey ..................................................................................................................... 11
I. Attitude towards biorefinery concepts ..................................................................................... 11
II. Consumer assessment of bioplastic .......................................................................................... 14
III. Knowledge about biobased products .................................................................................... 16
IV. Willingness to pay for biobased products ............................................................................. 17
i. Direct questions about shampoo and washing‐up liquid with biobased ingredients ............... 18
ii. Discrete‐choice experiments about orange juice in a bioplastic bottle .................................... 24
5. Summary ....................................................................................................................................... 29
6. References ..................................................................................................................................... 31

Figures Figure 1: Principles of biorefineries ......................................................................................................... 6
Figure 2: General attitudes of respondents .......................................................................................... 10
Figure 3: General attitude towards different manufacturing systems ................................................. 11
Figure 4: Attitude towards partial aspects of biorefinery concepts ..................................................... 13
Figure 5: Importance of attributes for consumers purchasing bioplastic products .............................. 15
Figure 6: Level of knowledge – divided into different questions .......................................................... 16
Figure 7: Willingness to pay for washing‐up liquid with biobased ingredients .................................... 19
Figure 8: Attitude towards the environment / Willingness to pay for washing‐up liquid with biobased
ingredients ............................................................................................................................................. 20
Figure 9: Attitude towards future generations / Willingness to pay for washing‐up liquid with
biobased ingredients ............................................................................................................................. 21
Figure 10: Attitude towards one’s health / Willingness to pay for washing‐up liquid with biobased
ingredients ............................................................................................................................................. 22
Figure 11: Willingness to pay for shampoo with biobased ingredients ................................................ 23
Figure 12: Examples of choice sets ........................................................................................................ 26

Tables
Table 1: Number of dispatched and received questionnaires ................................................................ 8
Table 2: Attributes and levels of orange juice ....................................................................................... 25
Table 3: Estimation results of the model with Tetra Pak cartons as reference level ............................ 27
Table 4: Estimation results of the model with glass bottles as reference level .................................... 28

1. Introduction It is expected that petrochemical raw materials will become scarcer in the years to come. Several experts estimate that the mid-depletion point of crude oil has already been reached or will be reached at the latest in 2030; most experts predicting the year 2010. It is expected that the crude oil price will increase rapidly due to a supply gap between high, relatively inelastic demand and decreasing production of crude oil in the coming years (Swiss Federal Insitute for Technology (eds), 2006). It should be also taken in mind that the only possibility to produce materials or goods is currently the use of biogenic resources or the recycling of biogenic waste or other residues next to the application of raw materials derived from fossil feedstock. Moreover, to satisfy food needs of a growing population worldwide and to overcome nutritional deficiencies a vast number of measures are considered. Medium- and long-term measures could be avoiding land-use conflicts through a responsible expansion of bioenergy, the introduction of sustainability standards based on the principle that food security has priority, or accelerating the transition to second-generation biofuels which no longer compete with food production. Besides these measures the implementation of biorefinery concepts using multiple and cascading processing systems is considered to contribute against food crises, too (Auswaertiges Amt Deutschland, 2008). This biorefinery concept aims to combine in an optimal way the material and energetic use of biomass in one manufacturing system to maximize the value derived from biomass feedstock by making full use of their components (Thomassen et al., 2008). Both to satisfy a worldwide rising demand for agricultural and forestry products (for food as well as for non-food purposes) and to be able to compete in economic terms with its crude oil competitors it is obvious that (rare) biogenic resources must be used as efficient as possible. Biorefinery concepts could be one option which could contribute to this goal in future. Generally it can be observed that no common understanding concerning the categorization of biorefinery concepts exists, nor a uniform definition of these concepts can be found in scientific literature. Diverse types of activities exist in this field and different stakeholders are involved within these concepts. So it is not very surprising that several scientists, representatives of companies, or representatives of industrial associations propose different concepts and definitions (e.g. Elbersen et al., 2003 or Iowa State University – Bioeconomy Institute (eds), 2008). Van Ree (van Ree et al., 2007) for instance give a holistic overview of existing biorefinery approaches and aggregate them in the Status Report Biorefinery 2007: seven types of biorefineries are distinguished in this report: conventional biorefinery, green biorefinery, whole-crop biorefinery, lignocellulosic feedstock biorefinery, two-platform biorefinery, thermochemical biorefinery, and marine biorefinery. Moreover, within an EU-funded project about biorefineries (called EUROVIEW) further biorefinery concepts are considered next to the already mentioned, i.e.: cereal biorefinery, oilseed biorefinery, waste oil biorefinery, and waste biorefinery (Luguel, 2009). The classifications of these biorefinery types usually base on the feedstock which is used. As for instance the feedstock for green biorefineries could be green grass, lucernes, or immature cereals. The feedstock used in lignocellulosic feedstock biorefineries could be wood or straw for example. Within Figure 1 the general principles and systematic of biorefinery concepts are illustrated and show different value chains from raw material to products.
Figure 1: Principles of biorefineries

Source: (Kamm et al., Principles of biorefineries, 2004)
In Europe, there exist several refineries that convert biomass into marketable products of different kinds, such as chemical products or biofuels. Such plants could be regarded as the forerunners of biorefinery concepts (Nusser et al., 2007). But there currently exist very few plants that process biomass according to the above-mentioned biorefinery concepts. Embedded in an EU-financed project called BIOPOL1 assessing the implications of biorefineries for agricultural and forestry policy this paper is focused on the consumer acceptance of biorefinery concepts and biobased products. Consumers are the final users of biobased products and influence in a crucial way the demand of products derived from biomass raw materials. A positive attitude of those (or at least of some consumer segments) towards biorefineries and biobased products or their willingness to pay a higher price for products that are composed in whole or in significant parts from biomass could be interpreted as a positive signal towards actors of the bio-economy and influence their size. Additionally level of knowledge about biobased products and the reasons why consumers buy such products can provide valuable indications and information for further marketing activities in this field.
2. Methodology and data gathering procedure To analyse the acceptance of biorefinery concepts amongst consumers a survey was conducted in 6 European countries (Germany, Greece, UK, the Netherlands, Sweden and Poland) covered in the BIOPOL-project. This quantitative investigation about market acceptance of the consumers was analysed by means of a standardized questionnaire. The questionnaire was developed at the beginning of 2008. After pre-testing the questionnaire the English version was translated by project partners in their respective languages of the six surveyed countries. After developing the questionnaires, the translated hard copy questionnaires were dispatched from April until July 2008 by mail to people in Germany, Greece, UK, the Netherlands, Sweden and Poland. The addresses of (potential) respondents were gathered by means of a systematic method of selection whereas the different countries were divided into different regions and into rural areas and agglomerations. The proportion of men and women accounted to 50 % each.
1 http://www.biorefinery.nl/eu‐ssa‐biopol/

3. Contents of the questionnaire and description of the sample The following specific thematic priorities were included within the query. These issues represent important topics within the field of consumer behaviour respectively marketing sciences and were transferred to the purchase behaviour of consumers towards biobased products.
Consumers’ attitude towards biorefineries Consumers’ attitude towards bioplastic final products Consumers’ knowledge about biobased products Consumers’ willingness to pay for biobased products Sociodemographic data and consumers’ general attitudes
Description of the sample: Table 1 shows the number of questionnaires which were distributed in the different countries and the response rates respective:
Table 1: Number of dispatched and received questionnaires
Country Dispatched questionnaires Response rate
(absolute figures) Relative response
rate Germany 1,800 289 16.1 % Greece 1,000 68 6.8 % Netherlands 1,000 111 11.1 % Poland 1,000 48 4.8 % Sweden 1,000 125 12.5 % UK 1,000 41 4.1 % Total 6,800 682 10.0 %
Source: Inquiry of University of Applied Sciences of Weihenstephan 2009
It can be seen from Table 1 that most of the questionnaires were received from German respondents with respect to absolute figures. This high response rate can be traced back to the fact that in Germany more questionnaires were dispatched what consequently led to that high number of 289 respondents. Nevertheless, considering the ratio between dispatched and received questionnaires, also a high percentage share (16 %) can be observed in Germany. This number is comprehensible since during the data collection time frame, issues with respect to the competition between biomass for renewable resources and for food/feed purposes were frequently discussed in communication media in Germany and could have led to a higher interest among respondents. An also relatively high absolute response of 111 questionnaires can be observed in the Netherlands and 125 in Sweden. In both countries the relative response rate exceeded 10 %. In contrast only 6.8 % of the approached Greeks did answer. Less than 5 % of the dispatched questionnaires were filled-in in Poland (4.8 %) and in the UK (4.1 %). Gender Aside from less outlier the “total” figures of the six surveyed countries outline generally an almost fifty-fifty distribution between men and women.
Age Regarding the age distribution (weighted averages) of respondents of all six surveyed it can be observed that only 1.1 % of respondents are younger than 20. Nearly one out of four is between 20 and 29 years. About 16 % of interviewees are aged between 30 and 39 years. The
percentage share of the 40 and 49 years-old people is about 14 %. One fifth of the respondents in the sample are between 50 and 59 years old. 60 to 69 years-old people are as often represented as interviewees who are 40 to 49 years old. Finally, the group of respondents which are older than 70 years has a share of 10 % within the sample. Education level Since different school and education systems exist in the six surveyed countries it becomes necessary to standardise their final qualification on a common level. By means of the “International Standard Classification of Education” (United Nations Educational, Scientific and Cultural Organization (UNESCO), 1997) which distinguishes six education levels a standardisation was carried out. Hereby the education levels of the six countries were summarized to 3 groups, i.e.:
ISCED 0, 1, 2 (no qualification, school-leaving qualification) ISCED 3, 4 (training certificate, higher education entrance qualification) ISCED 5, 6 (college/university degree)
With regard to the interviewees in the sample a clear overrepresentation of respondents with a college/university degree or a PhD becomes obvious amongst respondents of the survey. Taking the weighted average of the six countries, almost 62 % of the respondents have a university degree or higher. At least 28.7 % have an ISCED 3 and 4 degree and just 10 % of the respondents have no qualification or only a school-leaving qualification. Given the fact that the questionnaire was relatively long (8 pages) and the questions partly had a hypothetical character about an innovative technical concept with relatively new and unknown products which still have to be partly developed, it cannot be excluded that persons with ISCED level below 4 partly had difficulties to answer the questions and did not respond to the survey. General attitudes of respondents Eagly et al. defines attitude as a kind of psychological tendency that is articulated by assessing a particular entity with some degree of favour or disfavour. Thus attitude can mean the assessment of a person towards another person, idea, situation or an object (Eagly & Chaiken, 1993). Within marketing sciences measuring attitude is crucial important since several investigations could prove that attitude of consumers determines their behaviour. Hereby it can be postulated the better the attitude towards an issue the higher the probability of purchase. Although this must be affirmed it is critical to mention that this correlation between attitude and behaviour is only true if situational, objective and personal aspects don’t contradict (Foscht & Swoboda, 2005). This could happen for instance when a consumer is standing at a counter having a positive attitude towards a commodity and is about to purchase it. However, if he forgot his wallet at home his good attitude doesn’t worth without having money to buy the commodity. Within the next part of the survey general attitudes of respondents were questioned in order to get an insight in the thinking and the value structure of the respondents. Thus, e.g. correlations between the consumers’ attitude towards the environment and the willingness to pay for products which are composed in whole or significant parts of biomass could be detected. These general attitudes were operationalized in the questionnaire (see Figure 2) by generating cognitive and conative statements with respect to different issues which are categorised as follows:
2 statements about environmental issues (A1 +2) 2 statements about sustainable issues (intergeneration responsibility) (B1 +2) 2 statements about health issues (C1 +2) 2 statements about personal prestigious (D1 +2)

2 statements with respect to regional economy issues (E1 +2) 2 statements about personal purchasing behaviour (F1 +2) 2 statements about variety seeking (G1 +2) 2 statements related to the social group (H1 +2)
Based on the theory of the three components respectively prospects attitude comprise generally three components which can be distinguished, i.e. affective, cognitive and a conative/intentional (behavioral) component (Trommsdorff, 2004). The affective component couldn’t be investigated within the survey though the cognitive and conative components which are presented in the following: Considering Figure 2 the statements with the figure “1” after the letters are cognitive statements (e.g. A1). By contrast the statements with the figure “2” are conative ones (e.g. E2). Cognition comprises for example attitudes, opinions or thoughts of people about e.g. their social environment or their past, their future and so forth. Conative issues could be characterized by a kind of willingness to act (Schrader U. 1998). The response behaviour of 639 – 667 interviewees (numbers of interviewees depend on the numbers of given responses to the different statements) is described in the following figure. The percentage values indicate where respondents made their cross on the questionnaire. The column at the right outlines the mean values of each statement from 1 (= “I absolutely don’t agree”) to 5 (= “I strongly agree”) whereas the possibility to answer “don’t know” (=6) was disregarded. Regarding the mean values of the cognitive statements it can significantly be viewed that interviewees assign especially environmental and sustainable issues the highest values (4.65 and 4.52) followed by health issues (mean value of 4.22). The other issues only achieved values under 4.
Figure 2: General attitudes of respondents
Statements I absolutely don’t agree
1
I don’t agree
2
Neutral
3
I agree
4
I strongly
agree 5
Don’t know
?
Mean value
A1 Protection of the environment is an important issue.
0.3 % 0.9 % 2.9 % 25.2 % 70.6 % 0.2 % 4.65
B1 The welfare of future generations is important to me.
0.4 % 0.9 % 5.2 % 33.2 % 60 % 0.1 % 4.52
C1 I take care of my health. 0.6 % 1.6 % 10.5 % 49.6 % 37.4 % 0.3 % 4.22
D1 I am progressive and modern. 1.4 % 6.7 % 34.5 % 40.5 % 14.9 % 2 % 3.62
E1 Regional products are better than overseas products.
1.5 % 6.6 % 27.3 % 29.8 % 32.8 % 1.9 % 3.88
F1 Above all products should be as cheap as possible.
7.1 % 23 % 30.4 % 26.5 % 12.5 % 0.5 % 3.14
G1 I like it when new products are launched.
2 % 11.2 % 39.6 % 37.7 % 8.3 % 1.2 % 3.4
H1 I like to wear clothes that I have seen on other people.
16.5 % 30.2 % 37.7 % 14.1 % 2.3 % 2.3 % 2.54
A2 I save water and electricity for environmental reasons.
1.5 % 5.4 % 17.4 % 42.7 % 32.7 % 0.3 % 4
B2 I frequently buy textiles which were produced without child labour. 3.3 % 9.4 % 31.5 % 22.5 % 15.8 % 17.5 % 3.46
C2 For the benefit of my health I eat fruit or vegetables at least three times every day.
5.4 % 18.9 % 19.2 % 36.3 % 16.9 % 0.3 % 3.47
D2 I frequently buy modern clothes. 11.7 % 22.4 % 31.2 % 26.6 % 7.4 % 0.8 % 2.95

E2 I mostly buy food which is produced in the region.
2.7 % 21.7 % 34 % 30.4 % 8.4 % 2.7 % 3.21
F2 I purchase most products at stores that offer high discounts (e.g. Asda, Tesco)
9.9 % 22.6 % 24.7 % 30.2 % 12.3 % 0.3 % 3.13
G2 Amongst my friends I am often one of the first who tests new technical products.
26.6 % 34.6 % 25.4 % 9.4 % 2.5 % 1.3 % 2.26
H2 Very often I buy similar products as my friends.
17.9 % 40.5 % 32 % 7.3 % 0.3 % 1.9 % 2.3
Source: Inquiry of University of Applied Sciences of Weihenstephan 2009
4. Results of the survey Within that paper a part of the survey shall be presented which focuses on the attitude of consumers towards biorefinery concepts. Although a positive or negative attitude towards new technology concepts doesn’t implement their subsequent usage/acceptance or not-usage/-acceptance2, attitude is an important factor which provides valuable indications whether people accept or do not accept innovative technology systems. To asses this issue people were asked about their attitude towards biorefinery concepts in two questions of the questionnaire. The first question was about their general attitude when comparing different manufacturing systems. Furthermore, people were asked to state their attitudes with respect to partial aspects or attributes of biorefinery concepts.
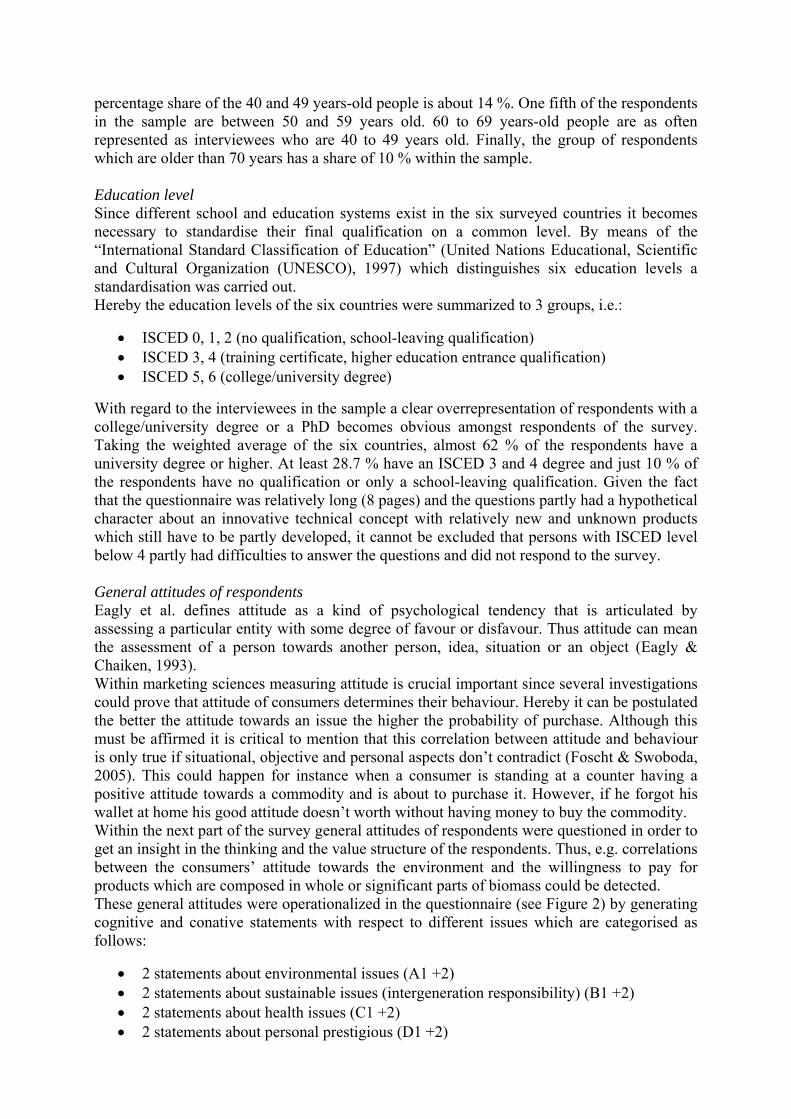
I. Attitude towards biorefinery concepts Attitude towards different manufacturing systems Within the scope of the survey people were asked to state their personal opinion towards:
Petroleum refineries Plants which produce just biofuels (e.g. biodiesel, -ethanol plants) Biorefineries
The choice for these three manufacturing systems was made since petroleum refineries can essentially be compared with biorefineries, but using crude oil instead of biomass as raw materials. People also associate with petroleum refineries big facilities which produce at present a big amount of different kinds of products for the market. Petroleum refineries can serve as a model for biorefineries since biorefineries aim to transfer the efficiency and logic of oil refineries and to produce large proportions of products in future, too (Zwart, 2006). Since experts e.g. (Nusser et al., 2007) consider biofuels producers as forerunner for the establishment of large bio-processing plants these plant types were also regarded within the query. Additionally, in a specific way people associate with biofuels plants biorefineries in the sense that for both biomass is used as feedstock and both produce biobased products. Due to the fact that biorefineries are so far hardly developed in Europe it was assumed that people don’t know much about biorefineries or biorefinery concepts. Hence the biorefinery concept was described in the questionnaire. The results of the question in which respondents had to rate statements on a five point scale that ranges from 1=“clearly negative” to 5=“clearly positive” are illustrated in Figure 3.
Figure 3: General attitude towards different manufacturing systems
2 More information about that topic see e.g. in (Huesing, et al., 2002)
Source: Inquiry of University of Applied Sciences of Weihenstephan 2009
From Figure 3 it can distinctly be observed that respondents (valid numbers N=586-590) have a more positive attitude towards biorefinery concepts than towards biofuels plants and petroleum refineries. Considering this last mentioned manufacturing system all respondents together show a mean value of 2.5 which is positioned between neutral and negative. By contrast biofuels plants are evaluated much more positive with a mean value of 3.7. The most positive attitude in the survey shows interviewees towards biorefinery concepts (mean value of 4.13). Looking closely at the attitude towards petroleum refineries the most negative attitude towards this manufacturing system show respondents of Sweden and the UK who assess petroleum refineries on average as “negative”. Respondents of Germany and Poland have a less negative opinion which tends to “neutral”. With reference to biofuels plants people of Germany show the most negative opinion of all countries although the value still shows a “positive” tendency. In contrast, especially interviewees from Greece showed by far the most positive attitude with a mean value of 4.16 followed by Sweden (mean value = 3.77). This positive attitude could be traced back to the fact that in Greece the first considerable amount of biofuels was produced in 2006 (European Biomass Industry Association (EUBIA), 2007). As a result only few negative messages of the press could exist and the public opinion is still better than in other countries. The highest mean value (4.47) of the survey can be observed by Poles towards biorefineries followed by the Greeks with 4.23. Noticeable, in these countries neither any biorefinery concepts exist nor are planned to be constructed in the short- to medium-term time horizon (Menrad et al., 2008). Like it is the case with the biofuels plants respondents of Germany again showed the most negative attitude towards biorefineries but also with a high mean value of 3.88 which approaches closely to the answering category “positive”. Attitude towards special aspects to biorefinery concepts While a first impression about the attitudes of interviewees towards biorefinery concepts is given in the former section, this part of the paper goes more into detail. Here, respondents had to state their attitude towards special aspects of the biorefinery concept (e.g. their eco-friendliness or economic viability). To examine these aspects a statistical research method was used that is very similar to the semantic differential of Osgood (Osgood et al., 1957). By
2,5
3,7
4,13
1
2
3
4
5
Petroleum refinery Biofuels plant Biorefinery
Achsentitel
Please rate your personal opinion of the below mentioned manufacturing systems.
Germany
Greece
Netherlands
Poland
UK
Sweden
Total
5 = clearly positive
2 =negative
1 = clearly negative
4 =positve
3 =neutral
Mean values

means of this multidimensional attitude measurement method an amount of bipolar adjectives pairs (e.g. “beautiful and ugly” or “good and bad”) are set by researchers. Then respondents are asked to state their opinion between the bipolar adjectives (Foscht et al., 2005). This approach was transferred on this research question but no bipolar adjectives were set in the questionnaire but instead bipolar statements (as for instance “Biorefineries are harmful to the environment” and “Biorefineries are eco-friendly”) were used. Then respondents had to choose on a five-dimensioned scale which statement applies at best to their attitude and where their opinion is placed between the extreme cases. The given contradictory statements about biorefinery concepts (illustrated in Figure 4) can be differentiated into 5 main groups, i.e.:
Ecological awareness (contradictory statements no. 1-3) Economically and business statements (contradictory statements no. 4-6) Biomass as renewable resources in competition to food/feed purposes (contradictory
statements no. 7-8) Political-economic aspects (on a European level) (contradictory statements no. 9-11) Regional aspects (contradictory statements no. 12-14)
Figure 4: Attitude towards partial aspects of biorefinery concepts
Source: Inquiry of University of Applied Sciences of Weihenstephan 2009
1 2 3 4 5
Biorefineries are eco‐friendly.Biorefineries are harmful to the environment.
Biorefineries boost the trend of monocultureswithin agriculture.
Biorefineries destroy the landscape.
Products of biorefineries will always be more expensive than products of petroleum refineries.
It is evident that biorefineries will crash.
Biorefinerieswill never prevail against petroleum refineries.
Biorefineries enhance food prices.
It is negative that agricultural products are also used as technical raw materials.
Biorefineriesmake us more dependent from non‐European countries.
Petroleum refineries generate more jobs than biorefineries.
Biorefineriesweaken the European economy.
Biorefineries in a region would enhance the transport there.
Biorefineries stink and poison the air.
Biorefineries should be more than 25 miles away from my home.
In the mid‐term products of biorefineries will undercut prices for products of petroleum refineries.
In a few years biorefineries will substitute petroleum refineries.
In mid‐term biorefineries can be run economically and draw profit.
Biorefineries stable food prices.
It is positive that agricultural products are also used as technical raw materials.
Biorefineriesmake us more independent from non‐European countries.
Biorefineries generate more jobs than petroleum refineries.
Biorefineries strengthen the European economy.
Biorefineries in a region wouldn’t have any impacts on the transport.
Biorefineries are odourless.
Biorefinerieswhich are close (5‐10 miles) to my home wouldn’t annoy me.
Biorefineries increase plant variety within agricultural cultivations.
Biorefineries can be integrated very well in the landscape.
Contra biorefinery concepts Pro biorefinery concepts
Applies definitely
AppliesApplies NeutralApplies definitely

The response behaviour of 524-578 interviewees is illustrated in Figure 4. Statements against biorefinery concepts are shown on the left side of Figure 4 while on the right side statements which are in favour of biorefinery concepts are illustrated. The different solid lines depict the arithmetic means of the given answers of respondents of the six analysed countries. Considering the solid line which illustrates the opinion of respondents of all participating countries (“total”) it becomes obviously that most of the mean values are positioned on the right side which suggests a positive attitude towards biorefinery concepts. The highest mean value (3.74) found the statement “Biorefineries are eco-friendly” showing that obviously biorefineries are considered to be environmental friendly. The second highest rating (mean value of 3.63) can be observed for the statement that “Biorefineries strengthen the European economy”. Together with a high mean value of 3.52 for the statement “Biorefineries make us more independent from non-European countries” this shows that the political-economic aspects are assessed positively on an European level. Apparently, biorefinery concepts are evaluated as promising manufacturing system which fosters the European economy. On the other hand, three issues of biorefinery concepts were assessed negatively from interviewees of all six countries. The most negative mean value (2.65) has the statement “Biorefineries enhance food prices”. The second lowest mean value (2.7) drifts to the statement “Biorefineries boost the trend of monocultures within agriculture.” Obviously, respondents understand biorefineries in this case as big facilities which on the one hand have relatively strong negative impacts on agriculture and agronomy, decrease plant variety and biodiversity and on the other hand boost food prices. The third negatively assessed biorefinery statement is about the transport in a region. Hereby respondents indicate a mean value of 2.9 to the statement “Biorefineries in a region would enhance the transport there” which is close to a “neutral” assessment.
II. Consumer assessment of bioplastic
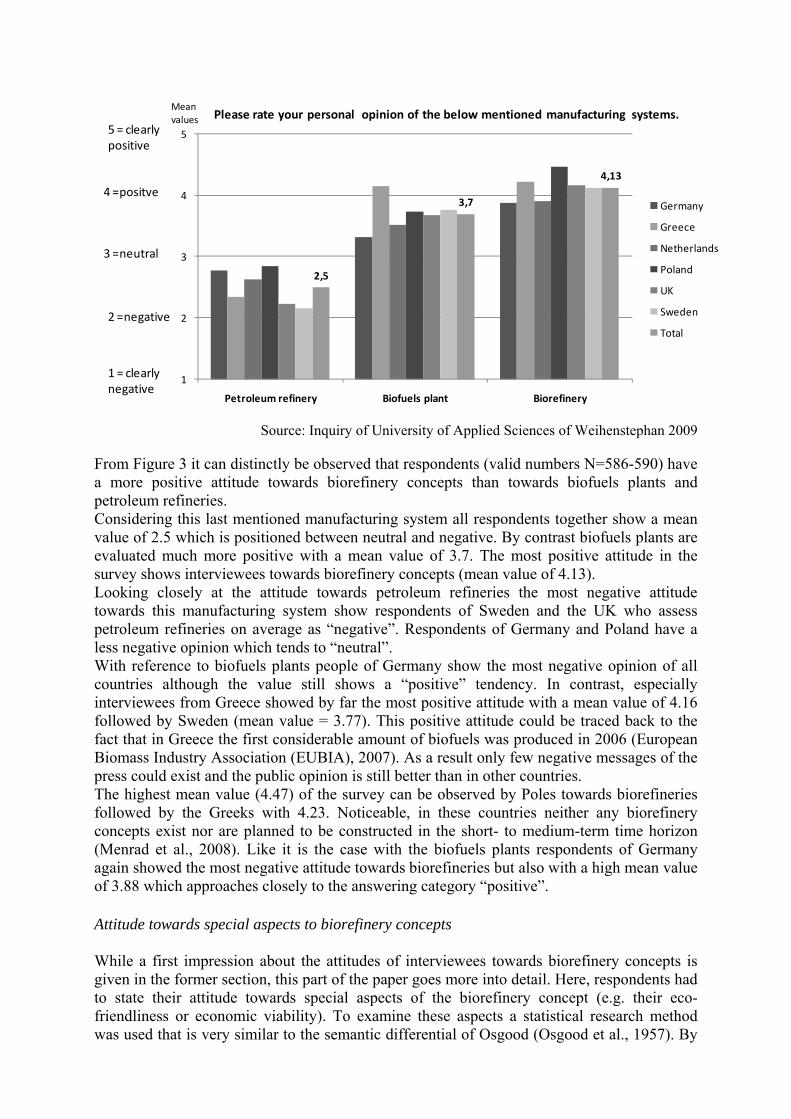
Considering the 3-pillar model of a future biobased economy three product groups are highlighted there, i.e.: bio-energy, bio-fuels and biobased products which can be products in biorefineries (Kamm et al., 2005). In particular, the last mentioned product group is observed within the following part since biobased products can be converted to (or are already) end products for consumers and can be used for a wide product spectrum. The association European bioplastics (European Bioplastics e.V., 2009) estimate the current (2009) market share of bioplastics (as one product group amongst biobased products) still “well under one percent” (estimated consumption: about 50,000 t in Europe). However, experts (e.g. Fachagentur Nachwachsende Rohstoffe e.V. (FNR), 2009) consider bioplastics as products with high market potentials for the years to come. This is why this product group was selected amongst biobased products to survey the attitude of consumers towards biobased products. In the following part interviewees were asked about important attributes purchasing bioplastics. Before doing so some possible consumer products like plastic cutlery, toys or packaging materials were mentioned in the questionnaire to give the interviewees some practical examples. Afterwards they were asked to rate their opinion towards different criteria of these products on a five-dimensioned scale with the following possibilities to tick-off: “1 = Absolutely not important”, “2 = Not important”, “3 = Neutral”, “4 = Important”, “5 = Very important”, and “? = Don’t know”. Regarding Figure 5 the six bars depict the mean values of
the respondents of the respective countries and one bar (“total”) reflects the weighted averages of all six analysed countries.
Figure 5: Importance of attributes for consumers purchasing bioplastic products
Source: Inquiry of University of Applied Sciences of Weihenstephan 2009
The ecological motivation seems to be the most important reason when consumers purchase bioplastic products. This shows a mean value of 4.32 which lies between “important” and “very important”. Also an important motive for buying bioplastic products is the
1 2 3 4 5
To be progressive and modern
To satisfy ones curiosity for a new product
To try a new product
To ease ones conscience
To set an example for others
To get it for low price
To strengthen the regional economy
For health reasons
To conserve resources for future generations
To be more ecofriendly
If I were to buy a bioplastic product it would be important for me...
Total
Sweden
UK
Poland
Netherlands
Greece
Germany
Absolutely not important
Not important
Neutral Important Very important

“conservation of resources for future generations” (“sustainability motive”). Its mean value of 4.15 lies slightly below the mean value o the “ecology”. The last important motive that lies over a mean value of 4 (“important”) that would consumers incite to buy bioplastic products are “reasons of health” (mean value 4.03). These high mean values could be traced backed to the fact that several bioplastic products stand in direct contact to the skin or food (e.g. tupperware for food).
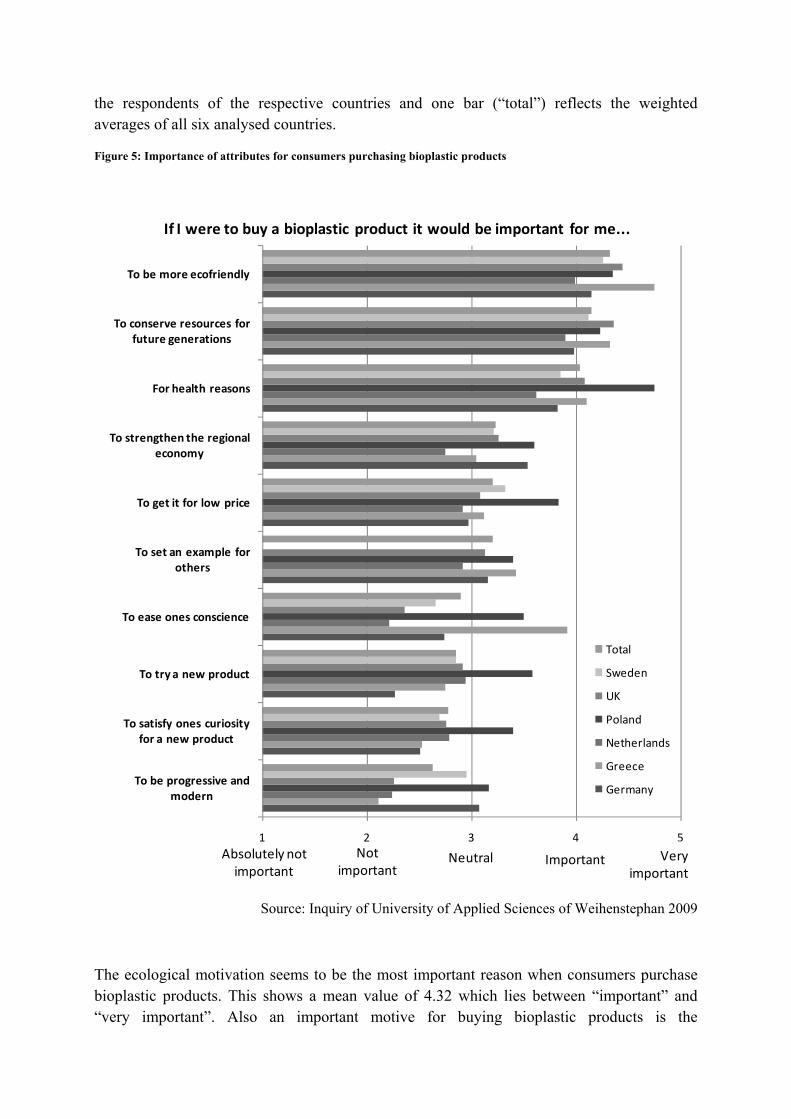
III. Knowledge about biobased products The level of knowledge of consumers (N= 666-670) about biobased products was checked, too. Therefore, seven questions which are related to biobased products respectively biorefineries were incorporated in the questionnaire based on a multiple-choice questions style. Four possibilities to answer were given at all questions. Apart from the correct answer two wrong answers were available for respondents. Additionally, interviewees could indicate that they don’t know the answer. Questions about the following topics were asked:
Raw materials to produce bioplastics Targets of the European Union with regard to biofuels Targets of the European Union with regard to biobased chemicals Biobased materials in Euro banknotes Processing of biobased fibres in cars Common raw materials for biodiesel in Europe Availability of biobased plastic bags on the market
Figure 6 illustrates how respondents answer these questions. Due to the fact that correct answering rates differ between 14 % and 72 %, the initial assumption can be confirmed that the questions reflect different degrees of difficulties. In this context the given answers are ordered from the question that most respondents know answered correctly (left side on the abscissa) to the question with the lowest share of correct answers (right side on the abscissa).
Figure 6: Level of knowledge – divided into different questions

Source: Inquiry of University of Applied Sciences of Weihenstephan 2009
Most respondents (72.5 %) know that most biodiesel in Europe is produced from oilseed rape, followed by the question concerning natural fibres which can currently be used in interior trims of cars (66.5 %). 58 % of the interviewed persons can correctly answer that biobased plastic bags are already on the market. A strong sagging of knowledge of consumers can be noticed concerning the raw materials for the production of bioplastics. Only one third (37.3 %) can answer that question. Similarly, less than one quarter (21.4 %) of the respondents know the targets of the European Union with regard to the market share of biofuels till 2010 (status April 2008). Very few interviewees (19.8 %) ticked-off that Euro banknotes are partly made from cotton. Finally only 13.8 % know that the European Union doesn’t have any targets in the field of biobased chemicals.
IV. Willingness to pay for biobased products Experts respectively representatives of companies consider several problems and barriers for an adoption of biorefinery concepts. Especially aspects like “availability of raw materials”, “technological barriers” or “high investment costs for the mills” seem to be crucial hindering factors (Klein et al., 2008). Due to these facts the economic viability of biorefinery concepts is currently not given and often impedes a cost-efficient implementation of biorefinery concepts. This part focuses on the end of the value chain and concentrates on the final users of biobased products who influence in a crucial way the demand of products derived from biomass raw
0%
10%
20%
30%
40%
50%
60%
70%
80%
90%
100%
Raw materials biodiesel
Natural fibres in cars
Plastic bags on the market
Raw materials bioplastic
EU biofuels targets
Euro banknotes
EU biobased chemicals
targets
[Val
id p
erce
nta
ge]
58.7% not known
41.3% known

materials, their potential willingness to pay a higher price for products that are composed in whole or in significant parts from biomass could be interpreted as a positive signal towards representatives engaged in the related industries. Thus the willingness to pay of consumers with respect to selected biobased products is examined in this part of the survey. In detail these are:
Washing-up liquid with biobased ingredients Shampoo with biobased ingredients Orange juice in a bioplastic bottle
i. Direct questions about shampoo and washingup liquid with biobased ingredients
Washing-up liquid
On the one side washing-up liquid was chosen as interesting product to be analysed since significant ingredients of this detergent can base on biomass raw materials. In detail these can be e.g. sugar tensides, fatty alcohol sulphates, ethanol, benzyl alcohols, proteins, glycerol, lactic acid (Violey GmbH (eds), 2009). Several of these ingredients can be products in terms of e.g. platform chemicals in biorefinery concepts, as for instance glycerol can be produced in whole-crop biorefineries, lactic acids in green biorefineries or alcohols can be manufactured in two platform biorefineries (Kamm et al., 2005). On the other side it is supposed that a large majority of interviewees of the six investigated countries frequently buy and use washing-up liquid for their dish-washings. Additionally, this product is interesting since consumers have direct skin contact doing the dishes and clean their tableware after food is prepared. In the following the results of the survey are presented in which respondents had to answer the following question: “A conventional washing-up liquid (500 ml) is on offer at 1.75 €. What is the maximum price at which you would buy a washing-up liquid where the ingredients are clearly marked (e.g. by labelling) as biobased?” The possibilities to answer were as follows (e.g. prices of the Netherlands): “€ 1.45”, “€ 1.60”, “€ 1.75”, “€ 1.90”, “€ 2.10” and ”I wouldn’t buy it”. Since different currencies and different price structures exist for washing-up liquids in the six analysed countries the initial prices3 vary from country to country. The following initial prices were used for the survey:
Germany: 1.15 € Greece: 1.95 € Netherlands: 1.75 € Poland: 3.99 PLN UK: 0.75 £ Sweden: 29:90 SEK
Figure 7 refers to the responses of 666 interviewees as 16 couldn’t/didn’t answer that question and gives an overview over the respondents’ willingness to pay for washing-up liquid where the ingredients are clearly marked (e.g. by labelling) as biobased.
3 These figures were detected by the project partners of the six countries mid‐2008 by visiting at least 3 retail shops/supermarkets in the respective countries.

Figure 7: Willingness to pay for washing-up liquid with biobased ingredients
Source: Inquiry of University of Applied Sciences of Weihenstephan 2009
Figure 7 shows a given but limited willingness to pay higher prices for a washing-up liquid with biobased ingredients. Considering the “total” figures4 of respondents of the six analysed countries around 10 % would pay the “bottom price” (5.3 %) or a “low price” (4.8 %). About 85 % of the respondents would pay the “initial price” or more. Over the half (58.5 %) would even pay “higher” or the highest price. Considering these findings another important research question emerges, i.e.: Who stands behind these results and who is willing to pay the respective prices? In order to figure this out several correlations respectively contingencies between the willingness to pay for washing-up liquid with biobased ingredients and influencing factors were checked. These factors which influence the willingness to pay for washing-up liquid with biobased ingredients were examined in more detail by using contingency tables. In a first step the following combination was analysed in more detail:
Attitude towards the environment / Willingness to pay for washing‐up liquid with biobased ingredients
For this analysis step statistical tests are necessary to check whether the results of a contingency table appear coincidentally only in the sample or if the results can be transferred on the population (Backhaus et al., 2003). With the so-called chi-square test, which is suitable for categorical variables (Brosius, 2006), the (in-) dependency between the different variables can be measured. In our first case one wants to find out whether respondents with different attitudes towards the environment answered significantly different to the question about their willingness to pay for washing-up liquid with biobased ingredients (compare Brosius, 2006). By running this test with the software SPSS 16 with the two above mentioned variables the
4 The “total” figures/bars within this part were calculated as weighted average including all six countries.
0
10
20
30
40
50
Wouldn't buy it bottom price low price initial price higher price highest price
[Valid percentage]
‐26% ‐13% 0% +13% +26%
Germany Greece Netherlands Poland UK Sweden Total Poly. (Total)
%

value of the chi-square value came to 72.84.5 This value points to the assumption that there exists a high deviance between the observed and the expected value which means that there exist continuities between the two variables (Brosius, 2006). To go more into detail (Backhaus et al., 2003): The chi-square value of 72.84 is higher than the value of the given chi-square table with 18.31 (10 degrees of freedom). As a result the null hypothesis (i.e. no continuities exist) can be rejected with a significance level of 5 % what means that continuities between the two variables should exist. Since the number of cases of the table elements of „I absolutely don’t agree“ and “I don’t agree” are very small these two table elements were combined and illustrated in Figure 8 to “I (absolutely) don’t agree”. Figure 8: Attitude towards the environment / Willingness to pay for washing-up liquid with biobased ingredients
Source: Inquiry of University of Applied Sciences of Weihenstephan 2009
Considering Figure 8 it can be shown that people mostly “strongly agree” or “agree” to the question whether protection of the environment is an important issue. With regard to the price
5 To get valid data of the chi‐square test it is necessary that the expected frequency should have a higher value than 5 within at least 20 % of the table elements (Brosius, 2006). In that case 16 table elements (53.3 %) had an expected frequency less than 5. To solve this problem 3 variables („I absolutely don’t agree“, “I don’t agree”, and “Neutral”) were summarized to one variable (Brosius, 2006). As a result only 3 table elements (16.7%) showed an expected frequency less than 5 hence it can be assumed that by this means valid data were determined.
I (absolutely) don't agree
Neutral
I agree
I strongly agree
0
20
40
60
80
100
120
140
160
180
wouldn't buy it
bottom price
low price initial
price higher price highest
price
9 137
5853
13
11 19 21
102
163
122
Whatmaximum price would you pay for a washing‐up liquid where the ingredients are marked as biobased?
[N]
Protection of the
environment is an
important issue.

maximum for a biobased washing-up liquid that they would pay they ticked especially from “initial price” to “highest price”. With respect to the combination of attitude towards the environment and willingness to pay for a biobased washing-up liquid, the highest willingness to pay can be found among the respondents who “strongly agree” to the environment-related statement, since respondents would pay a “higher price” (163). Additional 122 respondents would pay the “highest price” and only 102 the “initial price”. With respect to the interviewees who ticked-off “I agree” to the environment-related statement it becomes apparent that most of the interviewees would pay the “initial price” (58). Only 13 of them would accept to pay the “highest price”, so that a lower willingness to pay can be observed in this subgroup of the sample.
Attitude towards future generations / Willingness to pay for washing‐up liquid with biobased ingredients
The next continuity is examined between the “attitude towards future generations” and the “willingness to pay for washing-up liquid with biobased ingredients”. Using the chi-square test the (in-) dependency between the two variables was tested during which a chi-square value of 48.466 was figured out which was higher than the value of 18.31 of the chi-square table (10 degrees of freedom). This points to the assumption that there exist continuities between the two variables. Figure 9: Attitude towards future generations / Willingness to pay for washing-up liquid with biobased ingredients
6 Also in that case 15 table elements (50 %) had an expected frequency less than 5. To solve this problem three variables („I absolutely don’t agree“, “I don’t agree”, and “Neutral”) were summarized to one variable (Brosius, 2006). As a result only three table elements (16.7 %) showed an expected frequency less than 5 so that it can be assumed that by this means valid data were determined.
I (absolutely) don't agree
Neutral
I agree
I strongly agree
0
20
40
60
80
100
120
140
9 1510
6277
27
10 1818
92
134
108
The welfare of future generations
is im
portant to me.
Whatmaximum price would you pay for a washing‐up liquid where the ingredients are marked as biobased?
[N]

Source: Inquiry of University of Applied Sciences of Weihenstephan 2009
In view of Figure 9 it can be observed that respondents ticked-off mostly “I strongly agree” and ”I agree” with respect to the statement about “sustainability”. However, in comparison to the former issue (statement about the attitude towards the environment) people answered less often “I strongly agree” but more often “I agree”. With regard to the price maximum that they would pay they ticked especially the answering categories from “initial price” to “highest price”. Considering people who “strongly agree” to the sustainability statement 134 of these respondents would pay a “higher price”, while 108 would pay the “highest price” and 92 the “initial price”. With respect to the interviewees who ticked-off “I agree” to the sustainability it can be seen that most of the interviewees would pay the “higher price” (77), too. The second largest group with 62 respondents is here the group that would pay the “initial price”. Only 27 respondents would accept to pay the “highest price” representing 13.5 % of all interviewees who ticked “I agree”, this percentage is rather low compared to the respondents who “strongly agree” to the sustainability issue and would pay the highest price for the washing-up liquid (28.44%).
Attitude towards one’s health / Willingness to pay for washing‐up liquid with biobased ingredients
In case of this interrelationship the chi-square test results in a chi-square value of 29.077 which is higher than the value of the chi-square value of the chi-square table (18.31) with a 5 % probability of error, i.e. this implies that there exist continuities between the two variables with a 5 % probability of error. Figure 10: Attitude towards one’s health / Willingness to pay for washing-up liquid with biobased ingredients
7 Also in that case 15 table elements (50 %) had an expected frequency less than 5. To solve this problem three variables („I absolutely don’t agree“, “I don’t agree”, and “Neutral”) were summarized to one variable (Brosius, 2006). As a result only three table elements (16.7 %) showed an expected frequency less than 5 so that it can be assumed that by this means valid data were determined.
I (absolutely) don't agree
NeutralI agreeI strongly agree
0
20
40
60
80
100
120
wouldn't buy it
bottom price
low price initial price
higher price
highest price
10 1611
91
117
61
9 14 15
52
7471
It take care of my health.
Whatmaximum price would you pay fora washing‐up liquid where the ingredients are marked as biobased?
[N]

Source: Inquiry of University of Applied Sciences of Weihenstephan 2009
Figure 10 shows that respondents ticked-off mainly “I strongly agree” and ”I agree” with regard to their appraisal about their health. Nevertheless, in comparison to the former two motives (statements about their attitude towards the environment and sustainability) people ticked for the first time “I agree” (306) more often than “I strongly agree” (235). With regard to the maximum price that they would pay for washing-up liquid with biobased ingredients they mostly choose from “initial price” to “highest price”, too. Respondents who “strongly agree” to the health-related statement mostly would pay a “higher price” (74), followed by the “highest price” (71) while 52 persons of the sample would pay the “initial price”. Like it was the case with the environmental and sustainable statement a continuous slope can be observed from the “higher price” to the “bottom price” respectively to the answer possibility “Wouldn’t buy it”. With respect to the interviewees who “agree” to the health related statement it can be seen that most of them would pay the “higher price” (117), too. In comparison to the respondents who ticked “I strongly agree” (30.2 %) a considerably lower proportion (19.9 %) made their cross by ticking the “highest price”. The “initial price” would pay 91 respondents who ticked-off “I agree” to the health statement. Shampoo: Shampoo was chosen as a product category to be analysed within the consumer survey since important ingredients of a shampoo can be produced biomass-derived in biorefinery concepts, e.g. amino acids as one important ingredient of shampoo (Henkel AG & Co. KGaA, 2009) can be produced in whole-crop biorefineries or in green biorefineries (Kamm et al., 2005). Furthermore, it is assumed that most of respondents in the six analysed countries frequently use shampoo as body care product and thus have personal experience with this product category. As it was the case with the washing-up liquid, also for shampoo exists different currencies and different price structures in the six analysed countries. The “initial prices” of shampoo vary from country to country as follows:
Germany: 3.25 € Greece: 4.56 € Netherlands: 3.25 € Poland: 10.99 PLN UK: 2.95 £ Sweden: 25 SEK
The question which should be answered by the interviewees reads as follows: “A conventional shampoo (250 ml) is on offer at 3.25 €. What is the maximum price at which you would buy a shampoo where the ingredients are clearly marked (e.g. by labelling) as biobased? Annotation: Please mark only one price.” The possibilities to answer were as follows (e.g. prices of Germany): “€ 2.25”, “€ 2.75”, “€ 3.25”, “€ 3.75”, “€ 4.25”, ”I wouldn’t buy it”. Figure 11 shows the responses of 620 interviewees as 62 couldn’t/didn’t answer the above mentioned question and gives an overview to the consumers’ willingness to pay for shampoo with biobased ingredients which are clearly marked (e.g. by labelling) as biobased. Figure 11: Willingness to pay for shampoo with biobased ingredients

Source: Inquiry of University of Applied Sciences of Weihenstephan 2009
Figure 11 shows that interviewees would by tendency pay higher prices for shampoo with biobased ingredients. Although the markedness is lower than for washing-up liquid. Calculating with weighted averages the inclination for respondents of the six surveyed countries to tick-off “bottom price” (5.9 %) and “low price” (4.85 %) is nearly similar as it is the case with the washing-up liquid (5.3 % and 4.8 %). About 82 % would pay the “initial price” or more (“higher or highest price”). A bit less than a half (49.1 %) would pay more (“higher or highest price”). As it is the case with the washing-up liquid the highest willingness to pay is to be found for the price bracket “higher price” (34 %) what is equivalent to about one third of respondents of the six countries.
ii. Discretechoice experiments about orange juice in a bioplastic bottle
Another statistical approach to investigate the consumers’ willingness to pay are discrete-choice experiments. Discrete-choice experiments base on the “rational choice model”. This theory implies that subjects (actors) act rational and chose the alternative, amongst an alternative set, which has the most useful utility (cost-benefit equation) (Kreps, 1990). Consumers are assumed as deterministic utility maximizer (Enneking, 2004). Furthermore, discrete-choice experiments base on Lancaster’s approach (Lancaster, 1996) which says that a product is characterised by a bundle of different attributes and its levels. As for instance purchasing a light bulb not only the bulb itself is considered but different product attributes: e.g. their durability, price, or the energy consumption (Sammer et al., 2006). Following this theory consumers always will select those good, either singly or in combination, which shows the most useful effect (Louviere et al., 2000). Within discrete-choice experiments correlations between a dependent discrete variable8 and one or more independent variable(s) are analysed (Albers et al., 2007), e.g. the risk of a heart
8 In contrast to this logit models, linear regression models use continuous variables.
0
10
20
30
40
50
Wouldn't buy it bottom price low price initial price higher price highest price
[Valid percentage]
‐30% ‐15% 0% +15% +30%
Germany Greece Netherlands Poland
UK Sweden Total Poly. (Total)%

attack could be investigated as a function of the age, the body mass index, or the cholesterol level (Backhaus et al., 2003). In order to analyse the willingness to pay of consumers for specific products the dependent discrete variable is usually operationalised by giving interviewees the option between purchase or non-purchase decisions (0 or 1 decision). According to the method of stated preferences a real purchase decision could be simulated within discrete-choice experiments. Hereby consumers have to find their choice towards a product amongst an evoked set of several options. These options are characterised by a number of attributes and their different levels (Burton et al., 2001). The conduction of a discrete-choice experiment could be arranged in 5 steps (Verma et al., 2004), i.e.:
i. Choice of the product and its attributes ii. Choice of the levels of the attributes
iii. Development of the questionnaire/design iv. Conducting the survey v. Estimation of the discrete-choice model
ad i. and ii.) Choice of the product and its attributes incl. their attributes
Orange juice was chosen as subject of the analysis of which a bioplastic9 bottle was one of the attribute levels. By means of that it should be figured out whether consumers are willing to pay higher prices for groceries which are packed in biobased materials. A higher willingness to pay for such products is assumed by experts (Ammann, 2008) or already applied in the market (e.g. PACKAGING-GATEWAY.COM (eds), 2007). The choice of the relevant attributes of orange juice base on investigations of Sparke (2008) who examined the most important attributes of functional orange juice amongst consumers (Sparke, 2008). By means of a conjoint analysis he asked interviewees in Spain, Poland, Germany, and the United Kingdom for the most important product attributes whereas the following product attributes were considered, i.e.: packaging, fruit content, enriched with lycopene or dietary fibres, colour of the juice, and the price10. As a result he figured out that fruit content (importance of 31.4%) is by far the most important attribute followed by packaging (importance of 21.3%). The other attributes only reached 14% (lycopene), 13.4% (dietary fibres), 13.1 (price), or 6.8% (colour of the juice) respectively. On the basis of these results the variables for the discrete-choice experiment of our survey were developed and comprise the following attributes with its levels:
Table 2: Attributes and levels of orange juice
Attributes Levels Price three price levels: -30%; initial price; +30%
e.g. the Netherlands: 0.89 €; 1.29 €; 1.69 € Fruit content 20%; 50%; 100% Packaging biobased bottle; Tetra Pak carton; glass bottle
Source: Inquiry of University of Applied Sciences of Weihenstephan 2009
Regarding the prices of orange juice it must be considered that this survey was conducted in six different EU-countries with their respective prices and packaging sizes. Hence prices were investigated by visiting in each country at least three retails markets of which the mean values of the prices (e.g. in the Netherlands 1.29 €) were determined. Based on these prices about
9 Bioplastics are biomass‐derived plastics. They can base on different starting materials like polylactide acid or starch. These starting materials can be produced in biorefineries (green or whole crop biorefineries). 10 Note: At the time of the data collection (2004) organic orange juice did attract too less interest yet and wasn’t considered within this survey.
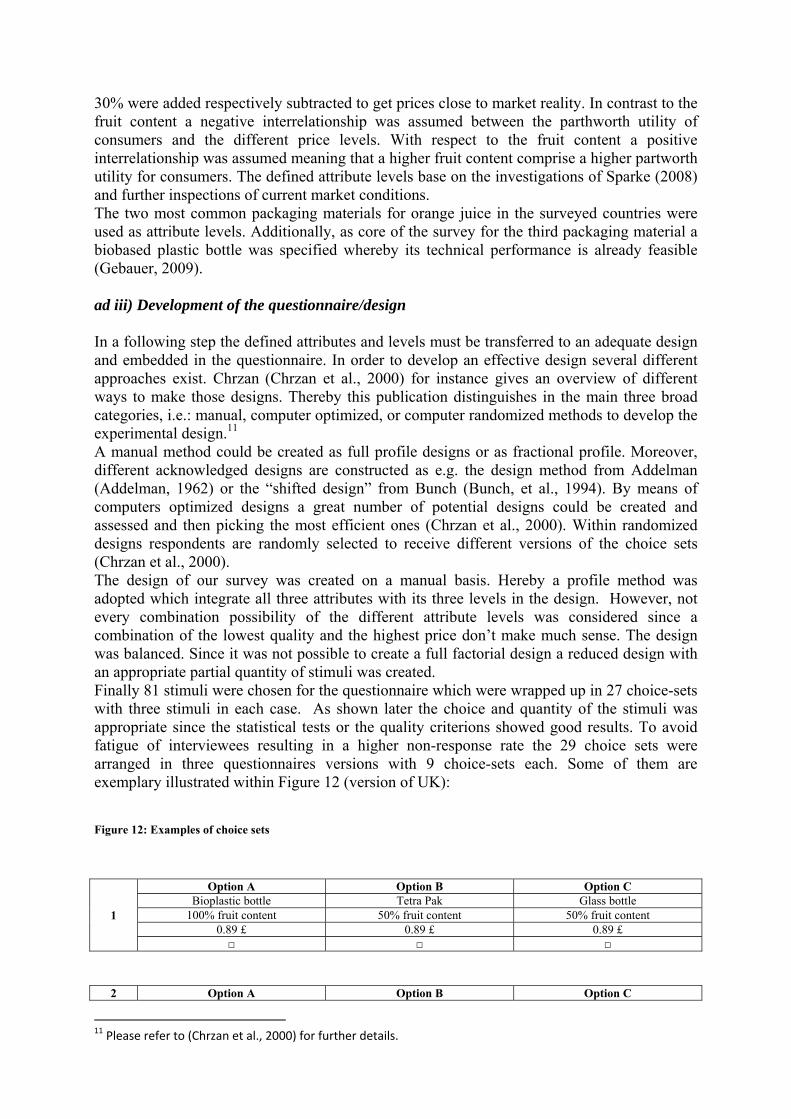
30% were added respectively subtracted to get prices close to market reality. In contrast to the fruit content a negative interrelationship was assumed between the parthworth utility of consumers and the different price levels. With respect to the fruit content a positive interrelationship was assumed meaning that a higher fruit content comprise a higher partworth utility for consumers. The defined attribute levels base on the investigations of Sparke (2008) and further inspections of current market conditions. The two most common packaging materials for orange juice in the surveyed countries were used as attribute levels. Additionally, as core of the survey for the third packaging material a biobased plastic bottle was specified whereby its technical performance is already feasible (Gebauer, 2009). ad iii) Development of the questionnaire/design In a following step the defined attributes and levels must be transferred to an adequate design and embedded in the questionnaire. In order to develop an effective design several different approaches exist. Chrzan (Chrzan et al., 2000) for instance gives an overview of different ways to make those designs. Thereby this publication distinguishes in the main three broad categories, i.e.: manual, computer optimized, or computer randomized methods to develop the experimental design.11 A manual method could be created as full profile designs or as fractional profile. Moreover, different acknowledged designs are constructed as e.g. the design method from Addelman (Addelman, 1962) or the “shifted design” from Bunch (Bunch, et al., 1994). By means of computers optimized designs a great number of potential designs could be created and assessed and then picking the most efficient ones (Chrzan et al., 2000). Within randomized designs respondents are randomly selected to receive different versions of the choice sets (Chrzan et al., 2000). The design of our survey was created on a manual basis. Hereby a profile method was adopted which integrate all three attributes with its three levels in the design. However, not every combination possibility of the different attribute levels was considered since a combination of the lowest quality and the highest price don’t make much sense. The design was balanced. Since it was not possible to create a full factorial design a reduced design with an appropriate partial quantity of stimuli was created. Finally 81 stimuli were chosen for the questionnaire which were wrapped up in 27 choice-sets with three stimuli in each case. As shown later the choice and quantity of the stimuli was appropriate since the statistical tests or the quality criterions showed good results. To avoid fatigue of interviewees resulting in a higher non-response rate the 29 choice sets were arranged in three questionnaires versions with 9 choice-sets each. Some of them are exemplary illustrated within Figure 12 (version of UK):
Figure 12: Examples of choice sets
1
Option A Option B Option C Bioplastic bottle Tetra Pak Glass bottle
100% fruit content 50% fruit content 50% fruit content 0.89 £ 0.89 £ 0.89 £ □ □ □
2 Option A Option B Option C
11 Please refer to (Chrzan et al., 2000) for further details.

Bioplastic bottle Bioplastic bottle Bioplastic bottle 100% fruit content 50% fruit content 20% fruit content
1.19 £ 0.89 £ 0.59 £ □ □ □
3
Option A Option B Option C Tetra Pak Bioplastic bottle Glass bottle
100% fruit content 50% fruit content 50% fruit content 0.89 £ 0.89 £ 0.89 £ □ □ □
4
Option A Option B Option C ... .. .. .. .. .. .. .. .. □ □ □
Source: Inquiry of University of Applied Sciences of Weihenstephan 2009
ad iv) Conducting the survey This step was already described at the beginning of this paper. ad v.) Estimations and results of the discrete-choice experiment The parameters of the discrete-choice model are estimated using the maximum likelihood method (Ben-Akiva et al., 1985). The statistical software “Stata 10” was used to analyse the data. Finally, interviewees of this sample answered to 5,976 choice sets what results to 17,928 observations in the estimation of the model. As it was the case with the contingency tables also for discrete-choice experiments (in that case: conditional choice model) statistical tests are necessary to show the accuracy and quality of the model and its estimations. In the course of this the Pseudo R2 of the model was regarded which shows an acceptable level (0.1639). Furthermore, within a likelihood-ratio test all variables of the model reveal statistically significant values at conventional significance levels.12 A further test which was conducted comprises the Hausman-test (Independence of irrelevant alternatives (IIA)). The IIA forces the odds of choosing one alternative over another to be independent of the other alternatives (Hausman et al., 1984). For all variables in the model negative values becomes apparent. Hence, according to the stata handbook the null hypothesis can’t be rejected and it can be assumed that the IIA is not injured (StataCorp LP, 2007). In Table 3 the results of the estimation are presented whereas Tetra Pak cartons were used as reference level.
Table 3: Estimation results of the model with Tetra Pak cartons as reference level
β-coefficient z-value P>|z|
Bioplastic bottle* 0.7939 18.47 0.000 Glass bottle* 0.1468 3.33 0.001 Price -1.9792 -26.88 0.000
12 At what the null hypothesis can be rejected.

Fruit content 0.03569 49.11 0.000 *Reference level: Tetra Pak cartons
Source: Inquiry of University of Applied Sciences of Weihenstephan 2009
The β-coefficients describe the influence of the respective variable on the choice of the product. Positive values indicate that the likelihood for a product choice increases with increasing values and vice versa (see variable “price” or “fruit content”). In the case of ordinal variables (variable “bioplastic bottle” or “glass bottle”) Tetra Pak carton was used as reference level (Sammer et al., 2006). Regarding Table 3 it can be seen that the variable “price” has a negative β-coefficient meaning that the higher the price the less consumers tend to choose the product, in contrast to the other three variables which show positive β-coefficient values. Concerning the z-values in Table 3 it becomes obvious that interviewees ascribe the variable “fruit content” the highest partworth utility for consumers. The variable “price” is considered as second important13 followed by bioplastic bottles and finally by glass bottles as packaging (compared to the reference level “Tetra Pak cartons” with the lowest partworth utility). P>|z| is a further index for the quality of the estimation. The lower these values the better is the statistical significance of the respective coefficients. Values under 0.1 point to a high quality of the estimation and values under 0.01 point to a very high quality (Sammer & Wuestenhagen, 2006). Taking these values a very good quality must be assumed for all variables of our estimation. To calculate the willingness to pay (WTP) one need to divide the β-coefficient of the single attribute levels by the monetary item (Enneking, 2004). The following calculations describe the WTP of interviewees in the six countries for orange juice which is packed in bioplastic bottles: WTPbioplastic bottle = βbioplastic bottle / (-βprice) The β-coefficients of Table 3 are used to calculate the WTP for orange juice packed in a bioplastic bottle. It results that consumers are willing to pay on average 0.40 €14 more for this product than for orange juice which is packed in a Tetra Pak carton. In a second step the WTP for the same product was calculated but this time with “glass bottle” as reference level. The resulting figures are shown in Table 4. Here, it appears that consumers are willing to pay on average 0.32 € more for orange juice in a bioplastic bottle than for orange juice which is packed in a glass bottle.
Table 4: Estimation results of the model with glass bottles as reference level
β-coefficient z-value P>|z|
Bioplastic bottle* 0.6471 15.06 0.000 Tetra Pak carton* -0.1468 -3.33 0.001 Price -1.9792 -26.88 0.000 Fruit content 0.03569 49.11 0.000 *Reference level: Glass bottle
Source: Inquiry of University of Applied Sciences of Weihenstephan 2009
The same procedure was done for some of the countries which were considered in the survey and calculated by means of Stata 10, too.
13 As with the investigation of (Sparke, 2008). 14 The currencies were standardised in Euros. The current exchange rates on 15th May 2008 were as follows: 1 € = 3.4 PLN, 1 € = 9.32 SEK, and 1 € = 0.8 Pound (European Central Bank (eds), 2009)

Focusing on Germany for instance consumers are willing to pay about 0.26 € (β-coefficients of 0.5915/2.2982) more for orange juice in a bioplastic bottle compared to orange juice in a Tetra Pak carton. Even in comparison to orange juice in a glass bottle German consumers are willing to pay about 0.08 € (β-coefficients of 0.1921/2.2982) higher prices. Also in Sweden as another example, interviewed consumers are willing to pay the highest prices for orange juice which is packed in a bioplastic bottle. In comparison to orange juice in a glass bottle they are willing to pay 0.72 € (β-coefficients of 1.3816/1.907) more.15 But in contrast to German consumers Swedish consumers consider obviously Tetra Pak cartons as a better packaging for orange juice than glass and are willing to pay less surcharge (0.26 € (β-coefficients of 0.5070/1.9076)) comparing bioplastic bottles with Tetra Pak cartons as packaging.
5. Summary To survey the behaviour of consumers towards biorefineries and biobased products a questionnaire was developed at the beginning of 2008 to collect comparable data of each of the six countries participating in an EU-project (Germany, Greece, the Netherlands, Poland, Sweden and the UK) called BIOPOL. After translating the questionnaires into the respective languages they were dispatched mid-2008 in the six countries. Altogether almost 700 respondents can be considered within the questionnaire. At first the attitudes of interviewees towards biorefinery concepts compared to biofuels plants and petroleum refineries were presented. According to the results of the analysis it can be observed that respondents assessed biorefinery concepts as the most positive manufacturing system of the three since biorefineries were assessed as better than “positive” on average. Biofuels plants were assessed between “neutral” and “positive” with a tendency towards “positive” while in contrast petroleum refineries were only assessed between “neutral” and “negative”. Within the next part respondents had to state their attitude towards special aspects of the biorefinery concept (e.g. their eco-friendliness or economic viability). Hereby most of the estimations of respondents show a positive attitude towards biorefinery concepts. It can be detected that biorefineries are especially considered to be environmentally friendly. Also the biorefinery-related political-economic aspects on an European level were assessed above-average positive, like e.g. the view that biorefineries strengthen the European economy or that biorefineries make more independent from raw materials delivered from non-European countries. Altogether it appears that biorefinery concepts are evaluated as manufacturing system which fosters the European economy. On the other hand three issues were assessed negatively from interviewees of all six countries with respect to biorefinery concepts. As most negative point it was assumed by respondents that biorefineries would enhance food prices. Additionally, interviewees consider biorefineries as manufacturing systems which boost the trend of monocultures within agriculture. After dealing with biorefineries itself the following part focus on consumer products which can be produced as end-user products or intermediates in biorefineries. Since experts consider bioplastics as products with high market potentials for the near future one section focuses on bioplastic products like plastic cutlery, toys or packaging materials. In this context respondents had to assess attributes of importance in case consumers are purchasing bioplastic products. Hereby three motives emerged as most important for the respondents, i.e. the ecological motivation, conservation of resources for future generations (“sustainability motive”), and “health reasons”.
15 Current exchange rate (15th May 2008): 1 € = 9.32 SEK (European Central Bank (eds), 2009)

Within another part of the survey the level of knowledge of consumers about biobased products respectively biorefinery concepts is checked. Summarizing the findings it can be concluded that the knowledge is very low concerning three very special questions (EU biofuels targets, cotton in banknotes and EU targets of biobased chemicals). Only a minority of around one quarter of the respondents could answer them. In contrast, knowledge is relatively high in three more general questions (raw materials of biodiesel, natural fibres in cars, and bioplastic on the market). The question with the raw material base for bioplastic is to be found in the middle. The last part of the survey is about the customers’ willingness to pay for selected biobased products. Within this investigation the focus was laid on shampoo and washing-up liquid that are composed in whole or in significant parts from ingredients derived from biomass. Additionally orange juice packed in a bioplastic bottle was surveyed. Significant raw materials for these products can be fabricated in biorefinery concepts. With respect to the washing-up liquid it can be perceived that by tendency respondents that filled-in the questionnaires would pay higher prices for washing-up liquid with biobased ingredients. About 85 % would pay the “initial price” or more (“higher or highest price”) and 58.5 % would even pay the “higher or highest price”. The highest proportion of respondents is to be found for the price bracket “higher price” (36.9 %) what is equivalent to more than one third of respondents of the six countries. Additionally, it could be observed within the analysis that people with a higher ecological awareness, higher awareness for sustainability and with a very high awareness for their own health tend to be willing to pay a higher price for a washing-up liquid whose ingredients are clearly marked (e.g. by labelling) as biobased. With respect to shampoo it can be detected that also interviewees that filled-in the questionnaires would by tendency pay higher prices for shampoo with biobased ingredients but the level is lower than for washing-up liquid. Also for biobased shampoo the highest proportion of respondents is to be found for the price bracket “higher price” (34 %) what is equivalent to about one third of respondents of the six countries. Referring to washing-up liquid 21.9 % of respondents ticked-off the “highest price” brackets, while only 15.5 % of interviewees would do the same for shampoo. Again, referring to washing-up liquid 26.1 % of respondents ticked off the price bracket “initial price”. As against about one third (33 %) of interviewees would do the same for biomass-derived shampoo. Obviously, respondents show higher price sensitivity for shampoo with biobased ingredients than for washing-up liquid. By investigation the willingness to pay for orange juice packed in a plastic bottle, it results that consumers in the six survey country are willing to pay on average 0.40 € more for this product than for orange juice which is packed in a Tetra Pak carton. Besides, the WTP for the same product was calculated but this time with “glass bottle” as reference level. Hereby it appears that consumers are willing to pay on average 0.32 € more for orange juice in a bioplastic bottle than for orange juice which is packed in a glass bottle.

6. References
Addelman, S. (1962). Orthogonal Main Effects Plans for Asymmetrical Factorial Experiments.
Technometrics 4 , pp. 21‐46.
Albers, S., Klapper, D.,Konradt, U., Walter, A.,Wolf, J. (2007). Methodik der empirischen Forschung (2.
ed.). Gabler.
Ammann, R. (2008). Kompostierbar in die Zukunft ‐ Biokunststoffe werden immer beliebter. Retrieved
May 30, 2009, from http://industrie‐
biotechnologie.suite101.de/article.cfm/kompostierbar_in_die_zukunft
Auswaertiges Amt Deutschland. (2008). Food Crisis ‐ The Federal Government's Ten Point
Programme. Retrieved May 30, 2009, from http://www.auswaertiges‐
amt.de/diplo/en/Aussenpolitik/Weltwirtschaft/080715‐nahrungsmittelkrise,navCtx=73530.html
Backhaus, K., Erichson, B., Plinke, W., & Rolf, W. (2003). Multivariate Analysemethoden ‐ Eine
anwendungsorientierte Anwendung (10. ed.). Berlin: Springer.
Ben‐Akiva, M.;Lerman, S.R. (1985). Discrete choice analysis, theory and application to travel demand.
Cambridge: MIT Press.
Brosius, F. (2006). SPSS 14. Heidelberg (Germany): mitp.
Bunch, D. S., Louviere J.J., Anderson, D. (1994). A comparison of experimental design strategies for
multinomial logit models: The case of generic attributes. Working paper, Graduate School of
Management. Davis: University of California.
Burton, M., Rigby, D., Young, T., James, S. (2001). Consumer attitudes to genetically modified
organisms in food in the UK. European Review of Agricultural Economics, Vol. 28 (4) , pp. 479‐498.
Chrzan, K., & Orme, B. (2000). An overview and comparison of Design Strategies for Choice‐Based
Conjoint Analysis. Sequim (USA).
Eagly, A., & Chaiken, S. (1993). The Psychology of Attitudes. Fort Worth (USA).
Elbersen, W., Sanders, J., van Dam, J., Goetheer, E., Boerrigter, H., & van Ree, R. (2003). Transitiepad
Bioraffinage ‐ Voorstel in het kader van de Transitie naar een Duurzame Energiehuishouding.
Enneking, U. (2004, May). Willingness‐to‐pay for safety improvements in the German meat sector:
the case of the Q&S label. European Review of Agricultural Economics, Vol.31 (2) , pp. 205‐223.
European Biomass Industry Association (EUBIA). (2007). Biodiesel. Retrieved March 9, 2009, from
http://www.eubia.org/214.0.html
European Bioplastics e.V. (2009). Bioplastics at a Glance. Retrieved May 31, 2009, from
http://www.european‐bioplastics.org/index.php?id=182
European Central Bank (eds). (2009). Euro foreign exchange reference rates. Retrieved March 9,
2009, from http://www.ecb.de/stats/exchange/eurofxref/html/index.en.html
Fachagentur Nachwachsende Rohstoffe e.V. (FNR). (2009). Biokunststoffe ‐ Einfuehrung. Retrieved
May 31, 2009, from http://www.biowerkstoffe.info/biokunststoffe.html
Foscht, T., & Swoboda, B. (2005). Kaeuferverhalten. Wiesbaden (Germany): Gabler.
Gebauer, B. (2009). Biopolymere ‐ Plastik frisch vom Acker. Retrieved May 30, 2009, from
http://www.faz.net/s/Rub163D8A6908014952B0FB3DB178F372D4/Doc~EBDA2EB7478A746F6839D
CE1A61CF2AD1~ATpl~Ecommon~Scontent.html
Hausman, J., & McFadden, D. (1984). Specification Tests for the Multinomial Logit Model, Vol. 52, No.
5. Econometrica (Vol. 52, No. 5), pp. 1219‐1240.
Henkel AG & Co. KGaA. (2009). Rohstoffe. Retrieved March 10, 2009, from
http://www.henkel.de/SID‐0AC8330A‐708C492B/nachhaltigkeit/rohstoffe‐10204.htm
Huesing, B., Bierhals, R., Buehrlen, B., Friedewald, M., Kimpeler, S., Menrad, K., et al. (2002).
Technikakzeptanz und Nachfragemuster als Standortvorteil. Karlsruhe (Germany).
IEA Bioenergy Task 42. (2007). Biorefineries ‐ Co‐production of Fuels, Chemicals, Power and Materials
from Biomass (network meeting on 22.10.2007 in Vienna). Wien (Austria).
Iowa State University – Bioeconomy Institute (eds). (2008). Glossary of Biorenewables Terms.
Retrieved November 4, 2008, from http://www.biorenew.iastate.edu/resources/glossary‐of‐
biorenewables‐terms.html
Kamm, B., & Kamm, M. (2004, April). Principles of biorefineries. Applied Microbiology and
Biotechnology , pp. 137‐145.
Kamm, B., Gruber, P., & Kamm, M. (2005). Biorefineries ‐ Industrial Processes and Products Status
Quo and Future Directions. Potsdam (Germany).
Klein, A., Menrad, K., Kurka, S., Mozzaffarian, H., & Reith, H. (2008). D 2.1.3 Report of market
acceptance of biorefinery concepts and D 4.1 Note with results questionnaire and interviews market
acceptance for the biorefinery concepts amongst industry ‐ Deliverable within an project of the
European Commission no. 44336 ‐ FP6. Straubing (Germany).
Kreps, D. (1990). A course in microeconomic theory. New York (USA): Harvester Wheat‐sheaf.
Lancaster, K. (1996). A New Approach to Consumer Theroy. Journal of Political Economy 74 , pp. 132‐
157.
Louviere, J., Hensher, D., & Swait, J. (2000). Stated Choice Methods. Cambridge (UK): Cambridge
University Press.
Luguel, C. (2009). Introduction Biorefinery Euroview ‐ Presentation on the BioreFuture 2009
(30.03.2009). Brussels.
Menrad, K., & Steinmetz, V. (2008). Mapping of EU industry and biorefineries. Presentation within
BioreFuture 2008 on 12th February 2008 in Brussels. Brussels (Belgium).

Nusser, M., Hüsing, B., & Wydra, S. (2007). Potenzialanalyse der industriellen, weißen Biotechnologie.
Karlsruhe (Germany).
Osgood, C., Suci, G., & Tannenbaum, P. (1957). The Measurment of Meaning. Urbana (USA).
PACKAGING‐GATEWAY.COM (eds). (2007, September 21). Bio‐Based Packaging Ready to go.
Retrieved Mai 30, 2009, from http://www.packaging‐gateway.com/features/feature1341/
Sammer, K., & Wuestenhagen, R. (2006). Der Einfluss von Öko‐Labelling auf das
Konsumentenverhalten ‐ ein Discrete Choice Experiment zum Kauf von Gluehbirnen. In R. Pfriem, &
K. Fichter, Innovation für Nachhaltige Entwicklung. Wiesbaden (Germany): Deutscher
Universitätsverlag.
Sparke, K. (2008). Verbrauchersegmentierung bei der Neuproduktbeurteilung von Lebensmitteln.
Promotion Technische Universität München. Freising‐Weihenstephan (Germany).
StataCorp LP. (2007). Stata base reference manual ‐ Volume 2 ‐ Reference A‐H. College Station, Texas
(USA): Stata Press.
Swiss Federal Insitute for Technology (eds). (2006). Peak oil or mid‐depletion Point. Zuerich
(Switzerland): SFIT.
Thomassen, D., Simmons, K., Fernandez‐Guiterrez, M., & Lex, M. (2008). EC‐US Task Force on
Biotechnology Research ‐ Workshop on Biotechnology for Sustainable Bioenergy (21.‐22.05.2008).
San Francisco (USA).
Trommsdorff, V. (2004). Konsumentenverhalten (6 ed.). Stuttgart (Germany): W. Kohlhammer.
United Nations Educational, Scientific and Cultural Organization (UNESCO). (1997). International
Standard Classification of Education. Paris (France).
van Ree, R., & Annevelink, B. (2007). Status report biorefi nery 2007. Retrieved September 2, 2008,
from http://www.biorefi nery.nl/fi leadmin/biorefi nery/docs/publications/StatusDocumentBiorefi
nery2007fi nal211107.pdf
Verma, R., Iqbal, Z., & Plaschka, G. (2004). Understanding Custommer Choices in E‐Financial Services.
California Managment Review 46 (4) , pp. 43‐67.
Violey GmbH (eds). (2009). AlmaWin ‐ Spuelmittel. Retrieved March 09, 2009, from
http://www.violey.de/Oko‐Haushaltsmittel/Geschirr‐
Reinigungsmittel/Handwasche/AlmaWin_Spulmittel_8513.html
Zwart, R. (2006). Biorefinery ‐ The worldwide status at the beginning of 2006 ‐ Including the highlights
of the 1st international biorefinery workshop and an overview of markets and prices of biofuels &
chemicals. Wageningen.