identifying key food sources of vitamin a, iron, and zinc and
TRANSCRIPT
Odilia I. Bermudez, Jack Fiedler, Keith Lividini
IDENTIFYING KEY FOOD SOURCES OF VITAMIN A, IRON AND ZINC AND
POTENTIAL FOOD FORTIFICATION VEHICLES IN BANGLADESH
Presented by Odilia I. Bermudez, Tufts University School of Medicine
IUNS 20th International Congress on Nutrition September 16th, 2013
BACKGROUND
• Globally, there is a scarcity of national food consumption data
– Collected with acceptable periodicity and valid representation from all population groups and regions in a particular country
– Collected directly from the food consumers
2

BACKGROUND
• To overcome this scarcity of dietary data, alternative sources of information have to be used.
• For example, food consumption patterns and apparent intakes of energy and nutrients may be obtained from national household consumption and expenditure surveys (HCES)
• This type of surveys…
– Collect national and regional representative data
– Collect data on food acquisition and/or food costs
– Are conducted periodically
3

OBJECTIVES
To use the Household Consumption and Expenditure Survey (HCES) conducted in Bangladesh in 2010 to:
• Assess food sources of energy and of Vitamin A,
Iron and Zinc
• Assess risk for inadequate intakes of those
micronutrients
To inform about potential food vehicles for nutrient fortification
4

METHODS
Data from the 2010 HCES from Bangladesh
– Demographics,
– Income and economic data
– Food and non-food expenditure
– Food acquisition by origin
• Purchased
• Produced
• Gifted (gifts, donations)
• Other (e.g. wage in-kind)
– Foods consumed at home and away from home
5
METHODS
• Food acquisition data was collected over a 14 day period (at household levels)
– Converted into daily food amounts
• Development of a Food Composition Table for foods in the BD-2010 HCES
• Assessment of data plausibility
– Per capita energy intake <500 or >5,000 kcal/d
• Statistical estimations with sample expanded with sample weights
6

METHODS
• Intra-household food and nutrient distribution
– Using FAO adult consumption equivalents (ACE)
– For all household members plus aggregated by household
• Estimation of Nutrient Recommendations per member and aggregated by household
– Applied Estimated Average Requirements from the US Institute of Medicine) for the micronutrients:
• Vitamin A
• Iron: adjusted to 5% bio-availability
• Zinc: with bioavailability based on an unrefined, cereal-based diet, as estimated by the International Zinc Consultative Group
7

RESULTS
DEMOGRAPHICS (2010)
• The average household size was 4.5 members • Higher for rural (4.5) than for urban (4.4) households
Data source: BD-2010 HCES 8
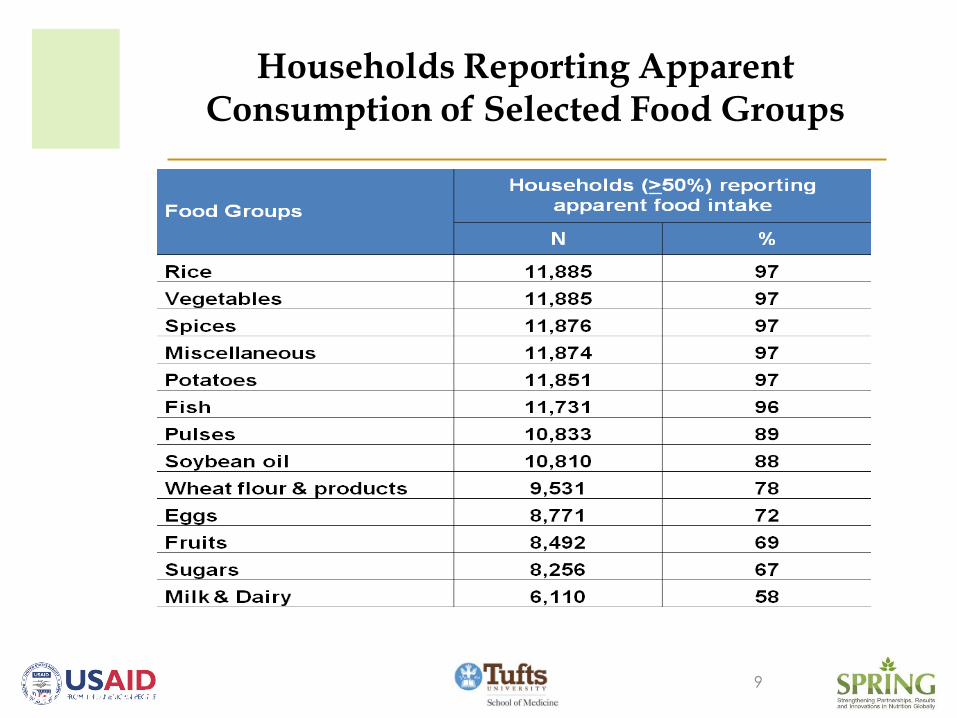
Households Reporting Apparent Consumption of Selected Food Groups
Data source: BD-2010 HCES 9

Ten Main Sources of Dietary Energy
Data source: BD-2010 HCES 10
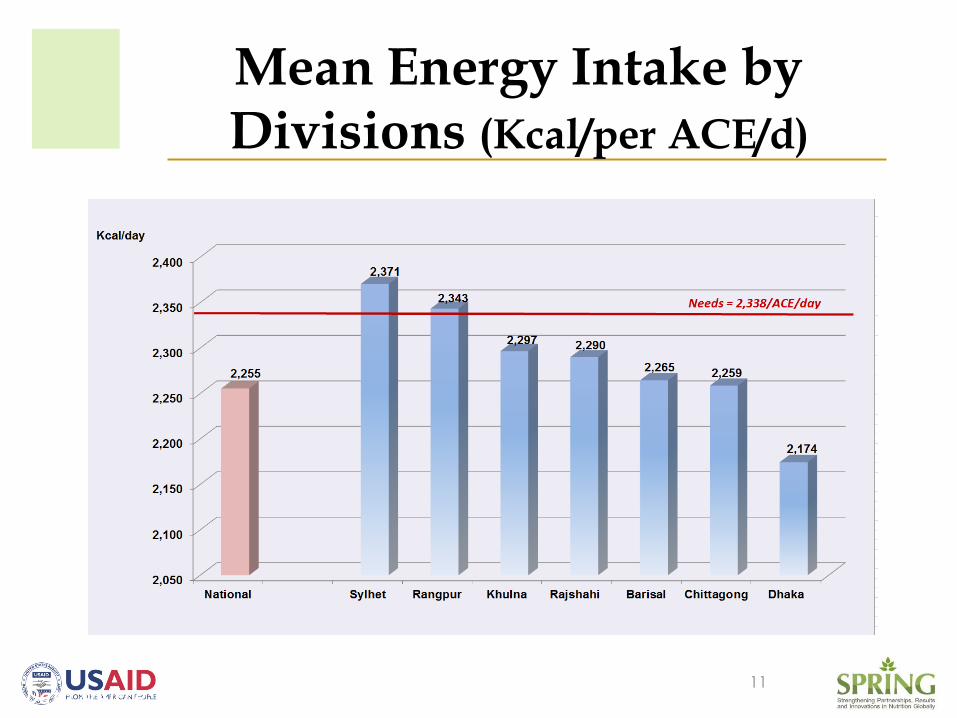
Mean Energy Intake by Divisions (Kcal/per ACE/d)
Data source: BD-2010 HCES 11
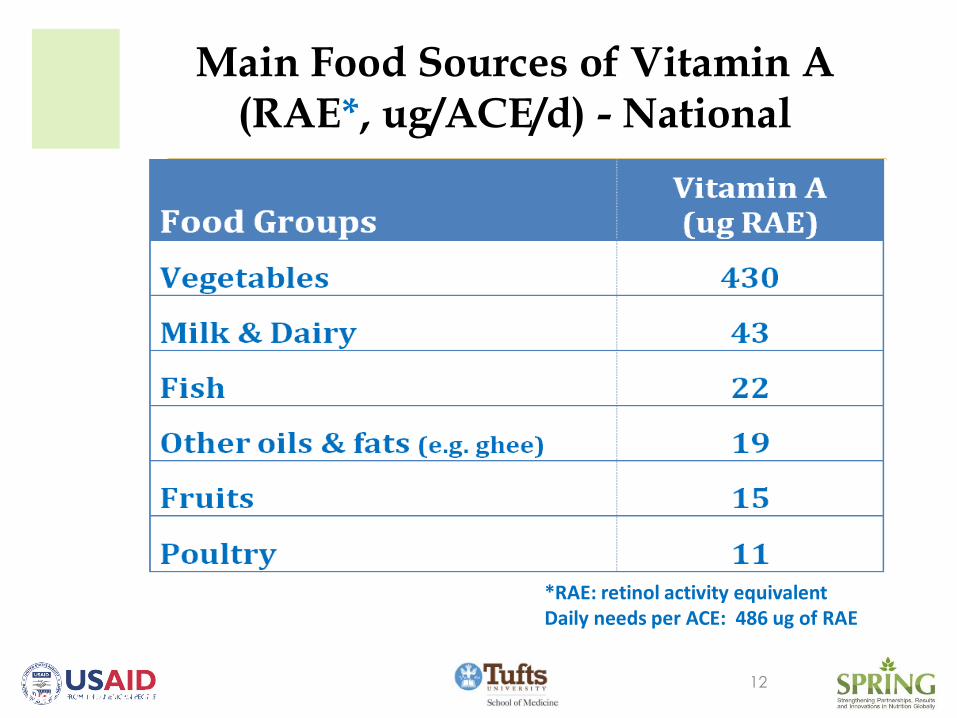
Main Food Sources of Vitamin A (RAE*, ug/ACE/d) - National
Data source: BD-2010 HCES
*RAE: retinol activity equivalent Daily needs per ACE: 486 ug of RAE
12
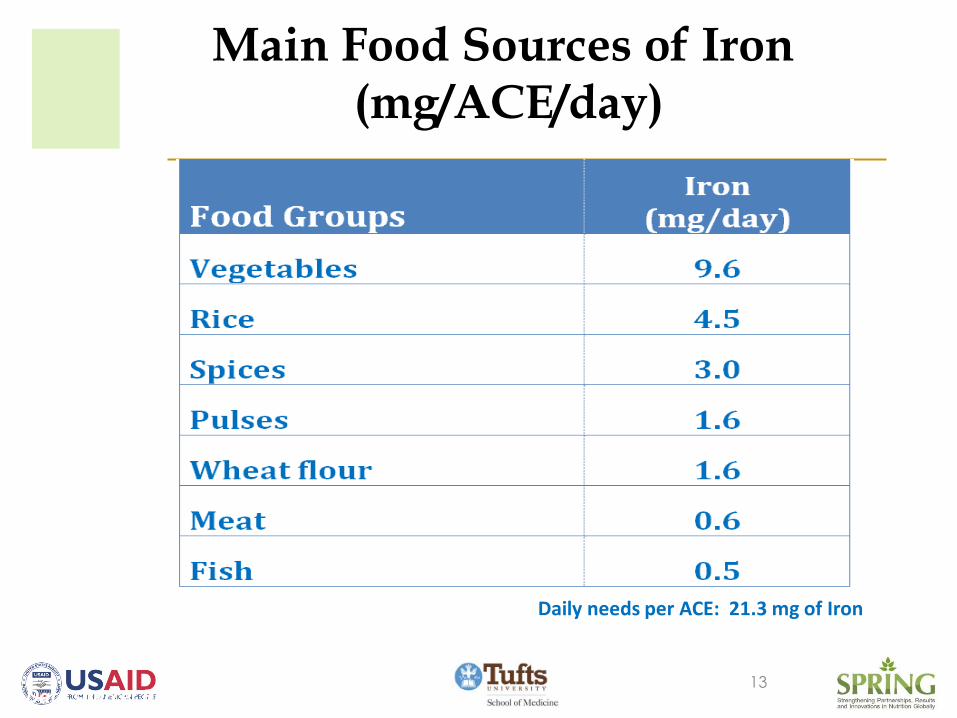
Main Food Sources of Iron (mg/ACE/day)
Data source: BD-2010 HCES 13
Daily needs per ACE: 21.3 mg of Iron
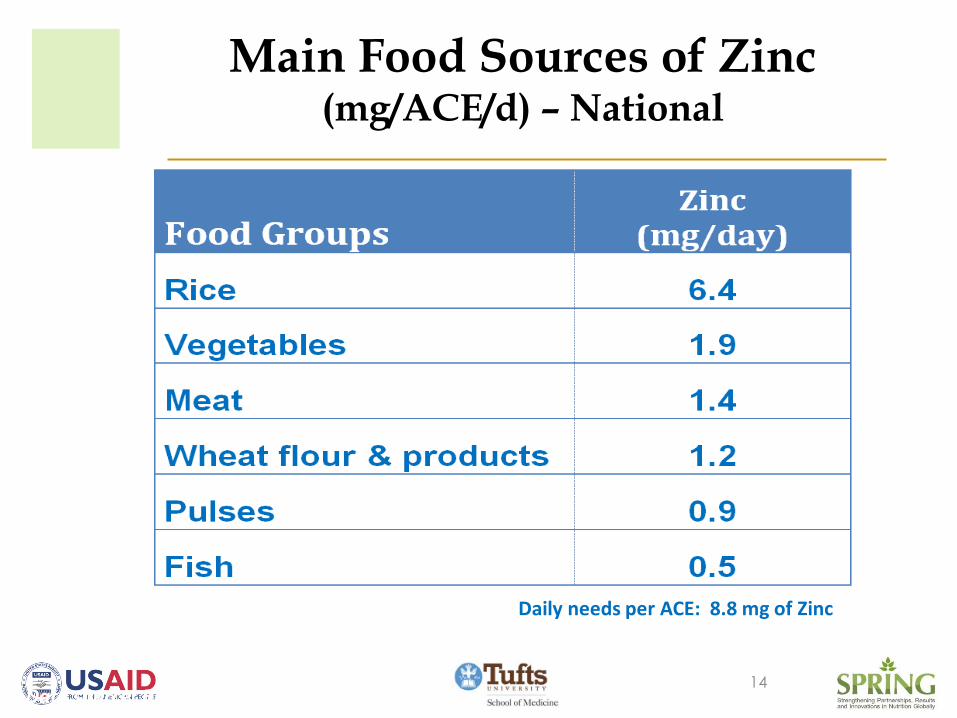
Main Food Sources of Zinc (mg/ACE/d) – National
Data source: BD-2010 HCES 14
Daily needs per ACE: 8.8 mg of Zinc
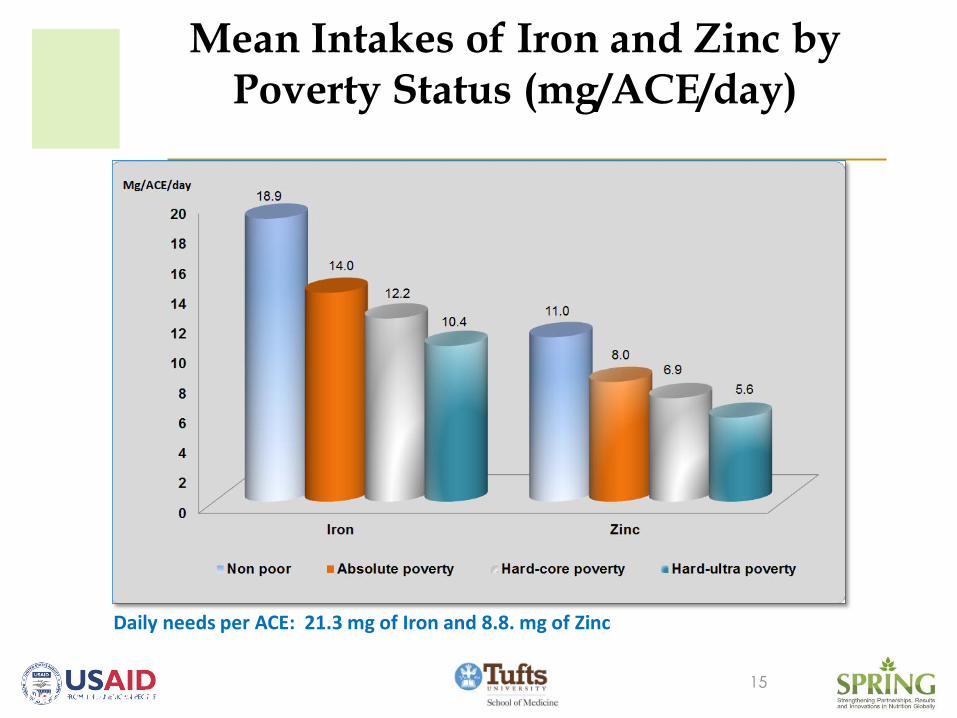
Mean Intakes of Iron and Zinc by Poverty Status (mg/ACE/day)
Data source: BD-2010 HCES 15
Daily needs per ACE: 21.3 mg of Iron and 8.8. mg of Zinc
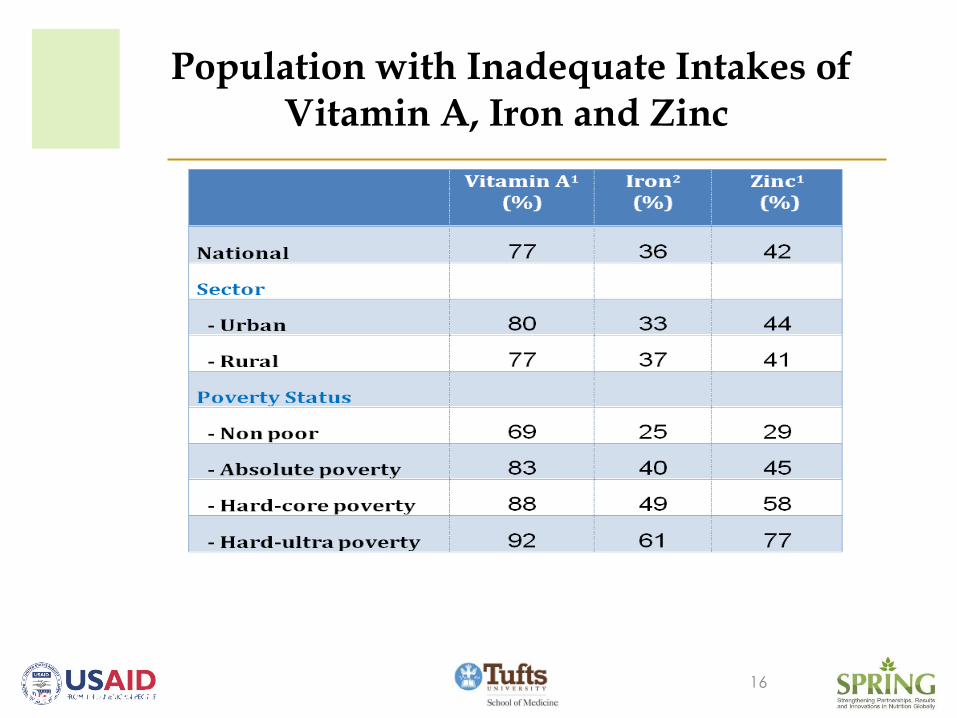
Population with Inadequate Intakes of Vitamin A, Iron and Zinc
Data source: BD-2010 HCES 16

LIMITATIONS
• Use of HCES, non-dietary data, for dietary
purposes
• Assumptions for intra-household food distribution
based on pre-established factors (e.g. ACE)
• Does not address nutrition of pregnant, lactating
and young children
• Potential for over-estimation of consumption due
to over-reporting, wastage and/or stockpiling
17

CONCLUSION
• Apparent intakes of foods and selected micronutrients were successfully estimated with the 2010 HCES of Bangladesh
– We were able to assess inadequate intakes of specific MNs (vitamin A, iron and zinc)
– A particular strength of the data was the inclusion of foods eaten away from home
• The results could guide the identification of vulnerable populations that could be targeted for:
– micronutrient fortification
– supplementation programs or,
– other types of interventions
18
THANK YOU!!!
Questions? Comments?
19