ieri, oggi, domani ieri ggi - idfc · pdf fileieri, oggi, domani nikhil vora / bhushan gajaria...
TRANSCRIPT

1
Indian Consumerism IERI, OGGI, DOMANI
Nikhil Vora / Bhushan Gajaria / Shweta Dewan(M) +91 –9821132471 / (Dir) +91-22-6622 2567
IERI
DOMANI
GGI
May 2010

2000: Indian FMCG industry – USD9bn
2010: Indian FMCG industry – USD25bn
2
2000: Gross block of entire FMCG industry <Rs30bn
2010: Gross block of over Rs110bn
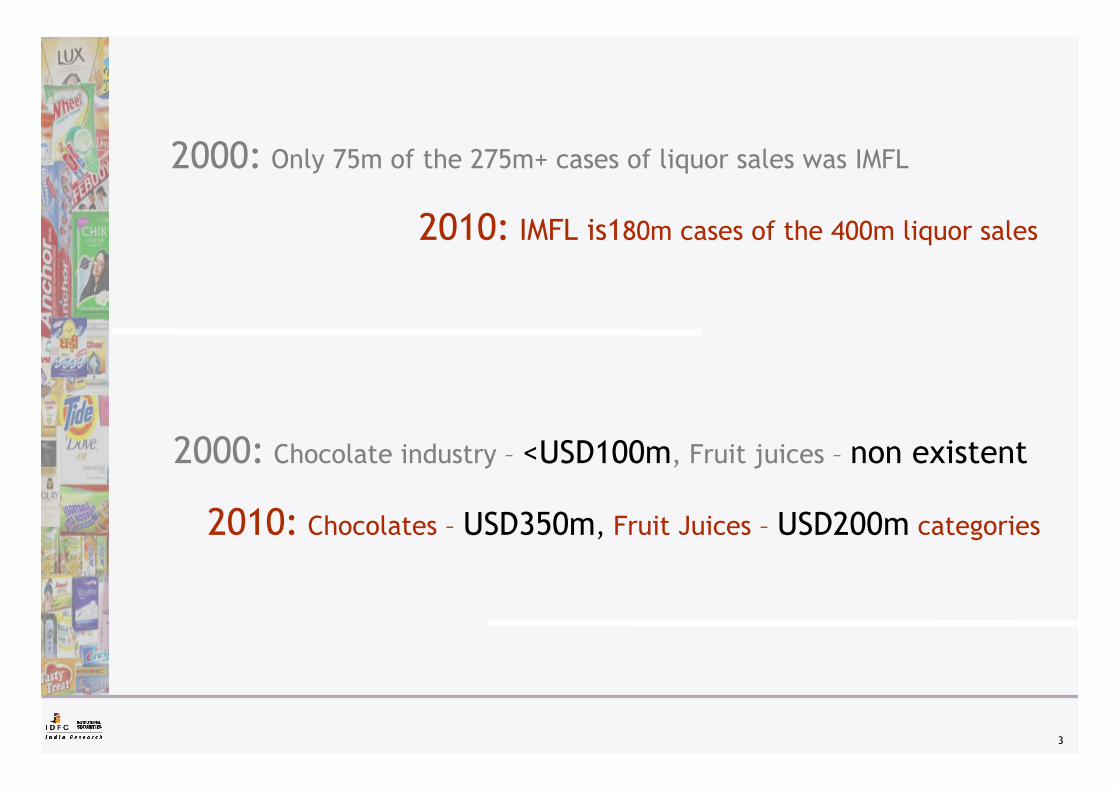
2000: Only 75m of the 275m+ cases of liquor sales was IMFL
2010: IMFL is180m cases of the 400m liquor sales
2000: Chocolate industry – <USD100m, Fruit juices – non existent
2010: Chocolates – USD350m, Fruit Juices – USD200m categories
3

4
2000: Dabur – an ayurvedic company; Marico – an oil company
2010: Dabur a consumer player and Marico pans across
health & beauty space
2000: HUL’s sales > sales of rest of the listed FMCG space
2010: HUL sales <1/2x of rest of the listed FMCG space
Drivers of Yesterday (IERI)…
5

6
Indian FMCG – Growth drivers of yesterday
600m+ rural population finally
became ‘consumer’
600m+ rural population finally
became ‘consumer’
Urban India ‘moved up’ the
ladder
Urban India ‘moved up’ the
ladder
Distribution enhanced
‘penetration’
Distribution enhanced
‘penetration’
Media created‘awareness’
Media created‘awareness’
Organized retail platform built ‘shelf space’
Organized retail platform built ‘shelf space’
Government ‘incentivized’organized players
Government ‘incentivized’organized players
Indian companies went the ‘non-
linear’ way
Indian companies went the ‘non-
linear’ way
FMCG sector‘invested’ Rs80bn+ in
manufacturing
FMCG sector‘invested’ Rs80bn+ in
manufacturing

7
Demand: 600m+ rural India finally became ‘consumer’
Government rural spends: Up from USD5bn in 2006 to USD18bn in 2010
Loan waiver scheme, NREGS, sale of land, infrastructure and telecom industry drive capital in rural India
NREGS provided employment to ~50m homes in FY10E
Trickle down effect of urbanization – repatriation of funds back home
Government rural spends: Up from USD5bn in 2006 to USD18bn in 2010
Loan waiver scheme, NREGS, sale of land, infrastructure and telecom industry drive capital in rural India
NREGS provided employment to ~50m homes in FY10E
Trickle down effect of urbanization – repatriation of funds back home
103.7Sugarcane
204.9Wheat
143.1Soyabeen
112.9Groundnut in shell
121.4Cotton
162.7Maize
162.7Bajra
162.7Jowar
182.3Paddy
CAGR (%)FY07-10
CAGR (%) FY03-07Growth in Minimum Support Price
More in hands of landless labourer… …also in the hands of agri producers
NREGA disbursements
124
195
363390 401
0
90
180
270
360
450
FY07 FY08 FY09 FY10E FY11B
(Rs bn)
8
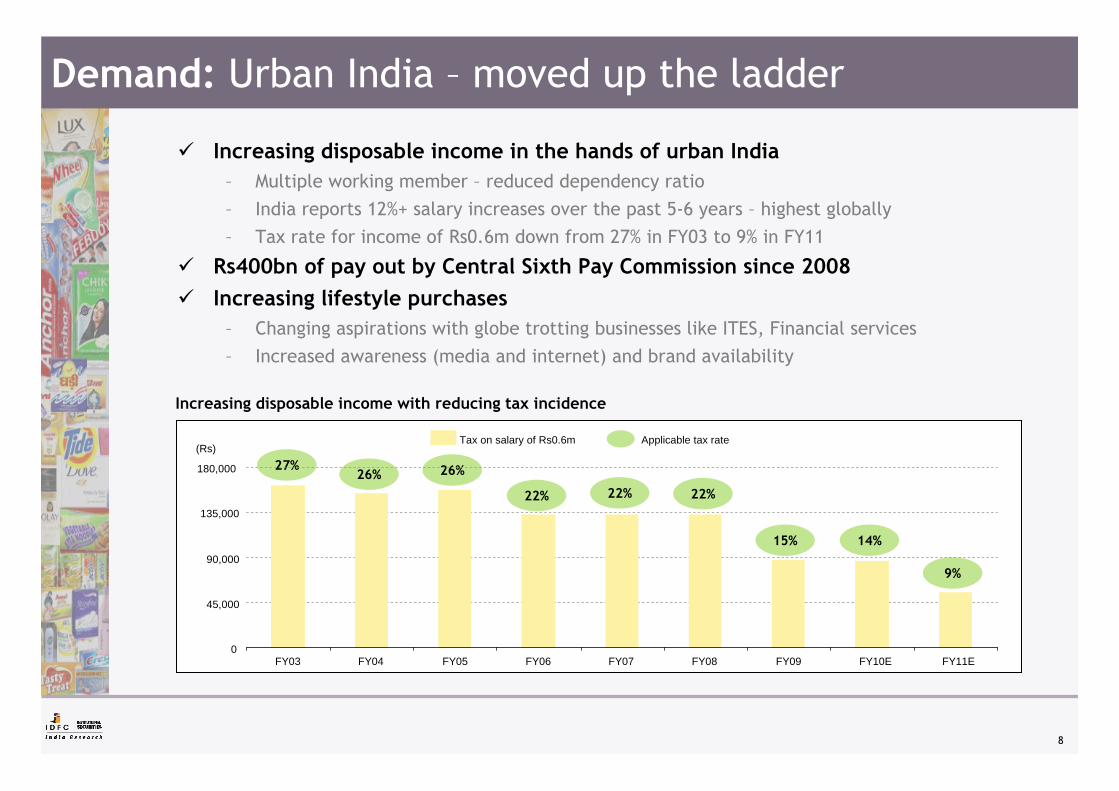
Demand: Urban India – moved up the ladder
Increasing disposable income in the hands of urban India– Multiple working member – reduced dependency ratio– India reports 12%+ salary increases over the past 5-6 years – highest globally– Tax rate for income of Rs0.6m down from 27% in FY03 to 9% in FY11
Rs400bn of pay out by Central Sixth Pay Commission since 2008Increasing lifestyle purchases
– Changing aspirations with globe trotting businesses like ITES, Financial services– Increased awareness (media and internet) and brand availability
Increasing disposable income with reducing tax incidence
Tax on salary of Rs0.6m Applicable tax rate(Rs)
9%
0
45,000
90,000
135,000
180,000
FY03 FY04 FY05 FY06 FY07 FY08 FY09 FY10E FY11E
15% 14%
27%26% 26%
22% 22% 22%

9
Availability: Distribution enhanced ‘penetration’
FMCG – distribution push
Urban distribution – Organized Retail adds to shelf
space visibility
FMCG sector extends its rural distribution by over 50%
since 2004; Coke doubles its distribution in 10 years
Rural distribution thrust through projects like Shakti,
Choupal Sagar, Aadhar and Hariyali Bazaar
Rural market contribution % of total
35Colgate
30HUL
50Dabur
38GCPL
25Marico
2009
11.5
16
19.8
32.3
88
83
2001
46Shampoo
16Dish Wash
33Skin
45Toothpaste
90Personal Wash
89Fabric Wash
2009
Rural Penetration

10
Awareness: Driven by media proliferation
Television media now reaches out to over 50% of Indian population
Total available air time slots across media increased by over 5x
Emergence of DTH takes television media to rural market
Emergence of niche media and regional media drives affordability amongst smaller brands
Indian FMCG spends Rs43bn on ASP - up over 2X over the last decade
11059Circulation (m)
2757Radio stations
450+<50Television Channels
8030C&S homes (m)
20102001Media ASP spends
0
12,500
25,000
37,500
50,000
2000 2005 2010
(Rs m)
8.5 9.1
11.2
ASP spends as a % of sales
As media reach expands multifold… …so does the media spends by FMCG industry

11
Investments: Driven by government ‘incentives’
Tax holidays in Uttaranchal, HP, Assam and J&K invite heavy investments – Rs80bn+ of gross block addition Organized players better off vis-à-vis unorganized players with tax reliefs
Pricing benefit for unorganized players reduced with favorable tax for organized players – Biscuits, noodles, cigarettes, etc
Implementation of VAT and now movement to GST
85
10.2
4.2
38.3
12.1
4.0
5.2
2.4
6.7
1.8
Gross block addition FY00-09 (Rs bn)
1%3.7Britannia
5%1.8Colgate
4%2.8Dabur
6%3.8Godrej Consumer
2%1.7HUL
10%3.8ITC (FMCG)
0%4.6Marico
3%2.5Nestle
2.8Total
7%1.5GSK
Excise duty savings
Gross block FY09 / gross block FY00 (x)
Company
Gross block addition over the last decade

12
Appetite: ‘Non-Linear’ route for scale
India110Balsara, Fem CareDabur
India, Africa85Nihar, Hair Code, Code 10,Fiancée, EnaleniMarico
150
220
600
Amount (USD m)
IndiaZanduEmami
AsiaUnzaWipro
UK, Africa, Indonesia
Keyline brands, Rapidol, Kinky, Tura, 49% in Sara Lee, Megasari
GCPL
GeographiesCompanies acquired over the past 5 yearsCompany
Indian FMCG companies show aggression to take inorganic route to growth in domestic as well as international markets…
…spent nearly billion dollar on acquisition growth since 2007
Indian FMCG companies show aggression to take inorganic route to growth in domestic as well as international markets…
…spent nearly billion dollar on acquisition growth since 2007
Acquisitions by Indian FMCG space since 2004

13
Indian FMCG opportunity surges to USD25bn
Categories that worked– Skin Care, Hair Care, Cosmetics,
Juices
Themes that worked– Unbranded to branded
– Premiumization
– Marginalization of regional players
Companies that worked– Second tier consumer plays gain
at the cost of large cap2000-05: ‘Price wars’ stalls growth to 7.5% CAGR
2005-10: FMCG space grows at 13% CAGR
What worked in the past decade?FMCG growth: 1.5x GDP
9
13
25
2000 2005 2010
(USD bn)
11% CAGR

14
Themes: Unbranded / Unorganized to Branded
Share of IMFL up from 27% to 45% over the decade
Packaged edible oil market has grown by 2.5x since 2005 to
Rs150bn+
Organized biscuits expands from Rs30bn in 2005 to Rs90bn

15
Themes: Marginalization of regional plays
After being a serious threats in early 2000, regional players and price warriors have stagnated since 2005
Likes of Ajanta, Anchor, Nirma, CavinKare, etc have failed to gain market share since 2004
After being a serious threats in early 2000, regional players and price warriors have stagnated since 2005
Likes of Ajanta, Anchor, Nirma, CavinKare, etc have failed to gain market share since 2004
Laundry
0
15
30
45
60
Top 3 players Rest of the market
2005 2009(%)
Toothpaste
0
25
50
75
100
Top 3 players Rest of the market
2005 2009(%)Shampoo
0
20
40
60
80
Top 3 players Rest of the market
2005 2009(%)

16
Themes: Premiumization
Dove’s market share up from 0.1% in 2005 to ~5% in 2010 in hair care
India annually sells 0.4m cars priced at over Rs0.5m –25% of the total cars market in India
14 17 22
1922
25
53 4745
14 14 8
0
25
50
75
100
2005-2006 2008-2009 2011-2012
Scotch & premium Prestige Regular Medium & cheap(%)
33% of total industry
39% of total industry
47% of total industry
Indian Alcohol market profile by value

17
Players: Second tier grew at the cost of HUL
With ~50% market share in most of the segments in 2000 and lack of innovation into ‘relevant categories’, HUL was bound to take a hit
Industry, ex-HUL, grew at 14.5% CAGR; HUL by 5.5% CAGR
Market capitalization of industry, ex-HUL grows 5.7x; HUL down by 10%
Market cap chases revenue growth Market capitalization, barring HUL, grow multifold N
estle
Indi
a
10Yr revenue CAGR
16.5 16.315.3
13.2 13.1 12.6 12.1
6.65.5
0.0
4.5
9.0
13.5
18.0
ITC
God
rej
Con
sum
er
Mar
ico
Dab
urIn
dia
Brit
anni
aIn
ds
Gla
xoS
mith
C H
L
Col
gate
-P
alm
.
Hin
d.U
nile
ver
(%)
6138,612 23,365 Dabur
597,391 19,732 Colgate
5986,059 180,376 ITC
363,098 18,152 GlaxoSmith C H L
237,730 17,267 Britannia
1496,895 536,946 HUL
36,100
3,625
3,048
Mar-00
7254,025 Nestle
1864,310 Marico
2783,157 Godrej Consumer
Multiplier (x)Mar-10Company name (Rs m)
HUL underperforms Sensex by 70% over the last decade ; has been theworst performing consumer stock globally!
Challenges of Today (OGGI)…
18

19
Is the best behind?
Increasing clutter-advent of price
wars?
Increasing clutter-advent of price
wars?
Organized retail –change in balance
of power?
Organized retail –change in balance
of power?
Is distribution a differentiator any
more?
Is distribution a differentiator any
more?
Rural India – is the best ‘delta’ past us?
Rural India – is the best ‘delta’ past us?
‘Food inflation’ an ongoing concern?
‘Food inflation’ an ongoing concern?
Niche media and retail - Product
launches to get easier?
Niche media and retail - Product
launches to get easier?
Global FMCG majorsplan to enter Indian market aggressively
Global FMCG majorsplan to enter Indian market aggressively
Government incentives to
expire in 2010..
Government incentives to
expire in 2010..

20
Is the best ‘delta’ in rural past us?
Rural India - can the pace of growth slowdown in near term?
– NREGA allocation to flatten out in near term
– Is there further scope of MSP price increase, given the food inflation concern?
Rural India - can the pace of growth slowdown in near term?
– NREGA allocation to flatten out in near term
– Is there further scope of MSP price increase, given the food inflation concern?
NREGA disbursements to flatten out… Food inflation – a hurdle for MSP increase
Food articles
0
5
10
15
20
Jan-08 Apr-08 Jul-08 Oct-08 Jan-09 Apr-09 Jul-09 Oct-09 Jan-10
NREGA disbursements
124
195
363390 401
0
90
180
270
360
450
FY07 FY08 FY09 FY10E FY11B
(Rs bn)
After 3x jump in NREGA allocation, its
flattening out

21
Intensifying competitive landscape
Product launches getting ‘easier’ – distribution no more a differentiator
Product launches getting ‘easier’ – distribution no more a differentiator
Organized retail – changing balance of power; threat of private labels
Organized retail – changing balance of power; threat of private labels
MNCs increasing India focus MNCs increasing India focus

22
Product launches getting ‘easier’
Mass segment brand launches – Distribution no more a differentiatorMost of the top 10 FMCG companies have retail reach of over 3m+, as against only HUL and Colgate a decade back
Niche product launches getting favorable
Micro segmentation becoming viable - Relevant market for every niche
Organized Retail, a perfect platform for niche product launches - Accounts for 7% of FMCG sales; but 25%+ in metros and large cities
Brand marketing at low cost - niche and regional media offer visibility

23
Organized Retail – threat of private labels
USD1.8trillion global private label market is growing at 6% annually vis-à-vis 3% growth for national brands
Private labels account for 17% of the FMCG sales globally; for likes of Wal-Mart, Tesco and Sainsbury its is > 40%
Aldi’s (German deep discounter) private label ‘Tandil’ is one of the largest selling washing powders in Germany.
Private label contribution in categories like frozen foods, pet food, feminine hygiene etc is over 20% globally
Personal Care
Alcoholic Beverages
Snacks and confectioneries
Home Care
Non Alcoholic Beverages
Health Care
Diapers and Feminine Hygiene
Pet Food
Paper, Plastic and Wraps
Refrigerated and Frozen Food
Top 10 most susceptible categoriesGlobal experience

24
Organized Retail – threat of private labels
India perspective
Though just 6-7% of FMCG sales all India, Organized Retail already 25%+ of sales in
large cities
98 8
7 76
5 54
3
5 5
0.0
2.5
5.0
7.5
10.0
Ref
ined
ed
ible
oil
Bev
erag
es
Pac
kage
d at
ta
Was
hing
pow
ders
Sha
mpo
o
Ski
n cr
eam
s
Pac
kage
d te
a
Cho
cola
te
Toile
t so
aps
Bis
cuits
Oth
ers
All
Indi
a
(%)
Organized retailer to ‘extract’ more from branded players – margins, placement fees, etc
Contribution from organized retail
Private labels account for 20% of Pantaloons’ grocery sales
Private label share higher in snacking, staples and butter

25
MNCs to increase Indian focus
4.68,10037,550RoW
4200800Russia
34001,200Brazil
850400China
03000India
XCadburyKraft FoodsCountry
Revenue (US$ m)
‘The Cadbury acquisition was aimed primarily at getting a
footprint in markets like India’
- Sanjay Khosla, President, Kraft's Developing markets
20% CAGR in Nestle India’s sales over the past three years. But sales of USD1bn in India today is equivalent to Nestle’s China sales in 2003
Of the 1bn new consumers P&G has targeted by 2015, 500m of them are expected to come from India – India spend less than $1 per person per year on P&G
products compared to $100 in the United States, $20 in Mexico, and >$3 in China
- Bob Mcdonald, CEO, P&G Global
Kraft to potentially bootstrap growth in India through Cadbury
26
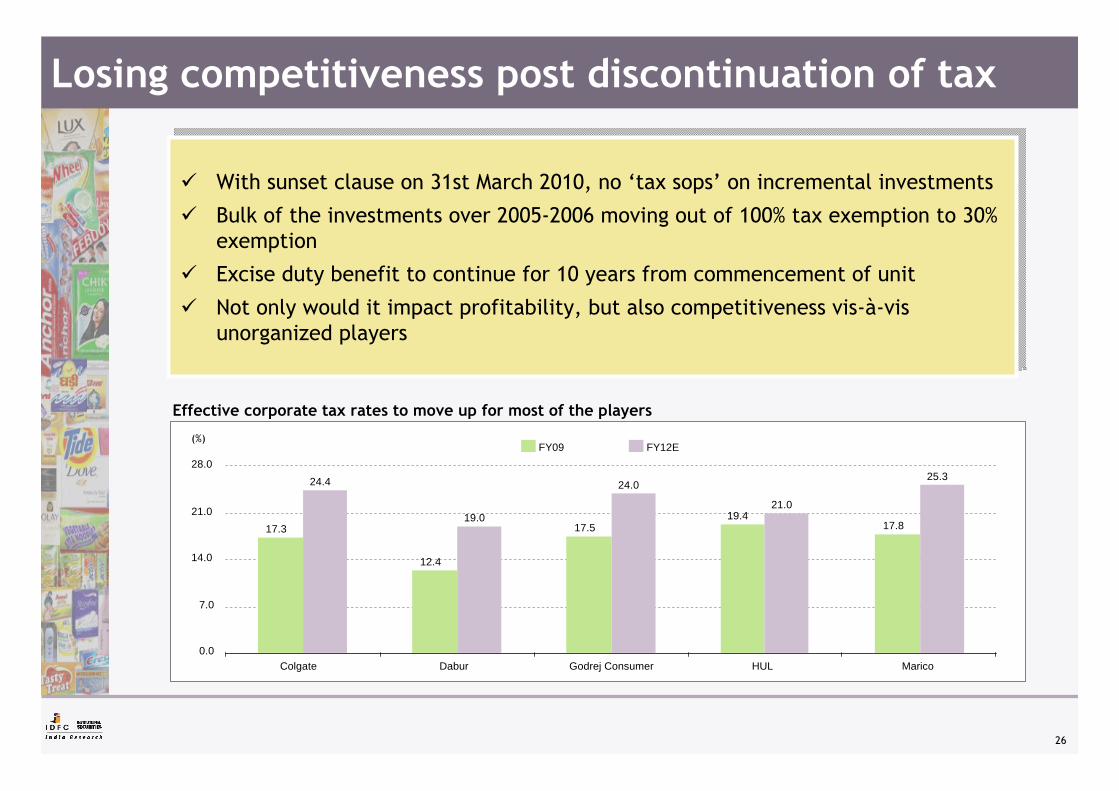
Losing competitiveness post discontinuation of tax
With sunset clause on 31st March 2010, no ‘tax sops’ on incremental investments
Bulk of the investments over 2005-2006 moving out of 100% tax exemption to 30% exemption
Excise duty benefit to continue for 10 years from commencement of unit
Not only would it impact profitability, but also competitiveness vis-à-vis unorganized players
0.0
7.0
14.0
21.0
28.0FY09 FY12E
(%)
17.3
12.4
17.519.4
17.8
24.4
19.0
24.0
21.0
25.3
Colgate Dabur Godrej Consumer HUL Marico
Effective corporate tax rates to move up for most of the players

Opportunities of Tomorrow (DOMANI)
27

28
Indulgence Age – Ability, willingness and mindset
India to be USD1trillion consumption opportunity by 2015;USD350bn Food and FMCG opportunity
I can “SPEND” – INCOME effect
There are MORE like me – BROADBASED growth
I am “WILLING TO SPEND MORE” – MINDSET change
I know “WHERE TO SPEND” – AWARENESS levels
I have “OPTIONS TO SPEND” – AVAILABILITY
I “WANT MORE THAN I NEED” – ASPIRATION effect
Second fastest growing economy -8%+ growth
Multiple job creations and trickle down effect
35% of Indians born in post liberalization
Increased media proliferation and 15m foreign travelers
Increased brand options in each of the business segment
India moving up the value chain -premiumization

29
Changing Consumer…
India, amongst the youngest age profile– 600m+ people below the age of 25 years
170m+ working women– Women account for 1/4th of workforce in India
Increased consumer durable ownership– Increased spends on consumer durables, home furniture, etc
Savvy and informed kids - influencer in decision making– 361m of India in age group below 15 (6x USA)
Increasing health consciousness– India expected to spend USD237bn on lifestyle diseases by 2015

30
Changing retail landscape…
Albeit the affinity for sweets, penetration of chocolates and ice-cream too low in India –refrigeration facilities at retail end the biggest concernMore that 50% of Indian retailers have problem of power supply or load shedding
Changing trend:Rapid infrastructure development – roads and powerIndia to be ‘no power shortage’ by 2015
31
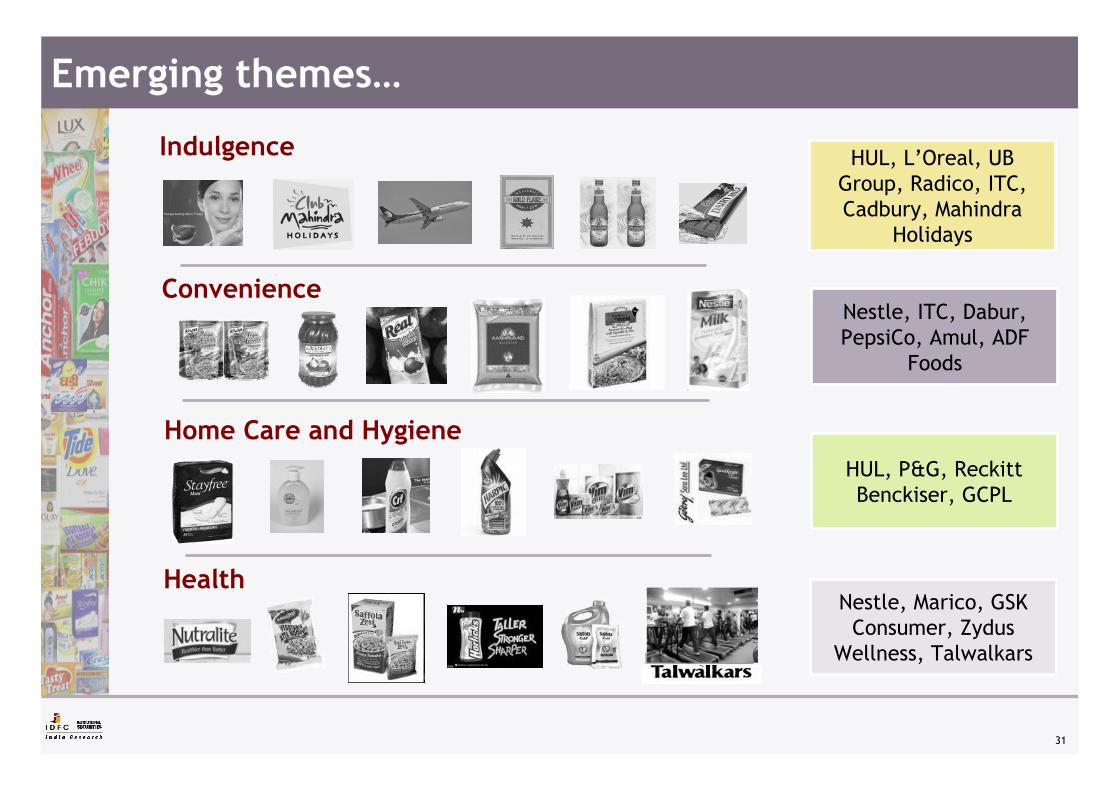
Emerging themes…
Indulgence HUL, L’Oreal, UB Group, Radico, ITC, Cadbury, Mahindra
Holidays
ConvenienceNestle, ITC, Dabur, PepsiCo, Amul, ADF
Foods
Home Care and HygieneHUL, P&G, Reckitt Benckiser, GCPL
HealthNestle, Marico, GSK
Consumer, ZydusWellness, Talwalkars

Value Creators of Tomorrow…
32

33
What has created value globally?
World’s fastest growing FMCG companyPace of growth at 2x the average FMCG industry growth
1
Value driver: NEW PRODUCT FUNNEL
World’s largest FMCG companyUSD90bn of revenues
2
Value driver: HEALTH PORTFOLIO

34
What has created value globally?
World’s most valuable FMCG company (PE Multiple)Trades at 20% premium to nearest peer
3
Value driver: INDULGENCE and PREMIUMIZATION
World’s largest market capitalization companyUSD69bn of acquisitions since 2000
5
Value driver: ACQUISITION
World’s most profitable company25% net profit margins
4
Value driver: HIGH BRAND STICKINESS

35
How do Indian companies stack up?
New Product Funnel1
Health platform2
Indulgence3
Brand Stickiness4
Acquisition5
Value Drivers
Nestle, Marico, Dabur
Nestle, Marico, GSK Consumer
ITC, UB Group, Radico
Nestle, ITC, United Spirits
GCPL, Dabur, Marico
Company demonstrating the trait

36
DisclaimerThis document ha s bee n pr epared by I DFC Se curities Lt d (I DFC SEC). I DFC SE C and its subsidiaries and as sociated com panies a re a fu ll-service, integrated inve stment banking , inve stment manag ement and brokerage group. Our research analysts and sales persons provide important input into our investment banking activities.
This document does not constitute an offer or solicitation for the purchase or sale of any financial instrument or as an official confirmation of any transaction.
The information contained herein is from publicly available data or other sources believed to be reliable. While we would endeavor to update the information herein on reasonable basis, IDFC SEC, its subsidiaries and associated companies, their di rectors and e mployees (“IDFC SEC and affil iates”) are under no obligation to update o r keep t he info rmation current. A lso, there may be regulatory , compliance , or other reasons that may prevent IDFC SEC and affiliates from doing so. We do not represent that information contained herein is accurate or complete and it should not be relied upon as such. This document is prepared for assistance only and is not intended to be and must not alone be taken as the basis for an investment decision. The user assumes the entire risk of any use made of this information. Each recipient of this document should make such investigations as it deems necessary to arrive at an independent evaluation of an investment in the securities of companies referred to in this document (including the merits and risks involved). The investment discussed or views expressed may not be suitable for all investors.
Affiliates of IDFC SEC may have issued other reports that are inconsistent with and reach different conclusions from, the information presented in this report.
This report is not directed or intended for distribution to, or use by, any person or entity who is a c itizen or resident of or located in any locality, state, country or other jurisdiction, where such distribution, publication, availability or use would be contrary to law, regulation or which would subject IDFC SEC and affi liates to any registration or licensing requirement within such jurisdiction. The securities described herein may or may not be eligible for sale in all jurisdictions or to a certain category of investors. Persons in whose possession this document may come are required to inform themselves of, and to observe, such applicable restrictions.
Reports based on technical analysis centers on studying charts of a stock's price movement and trading volume, as opposed to focusing on a company's fundamentals and, as such, may not match with a report on a company's fundamentals.
IDFC SEC and affil iates may have used the information set fo rth herein before publ ication and may have positions in, may from t ime to time purchase o r sell, o r may be m aterially interested in any of the securities mentioned or related securities. IDFC SEC and affiliates may from time to time solicit from, or perform investment banking, or other services for, any company mentioned herein. Without limiting any of the foregoing, in no event shall IDFC SEC, any of its affiliates or any third party involved in, or related to, computing or compiling the information have any liability for any damages of any kind. Any comments or statements made herein are those of the analyst and do not necessarily reflect those of IDFC SEC and affiliates.
This document is subject to changes without prior notice and is intended only for the person or entity to which it is addressed and may contain confidential and/or privileged material and is not for any type of circulation. Any review, retransmission, or any other use is prohibited.
Though disseminated to all the customers simultaneously, not all customers may receive this report at the same.
Though disseminated to all the customers simultaneously, not all customers may receive this report at the same time. IDFC SEC will not treat recipients as customers by virtue of their receiving this report.
Explanation of Ratings:
1. Outperformer: More than 5% to Index
2. Neutral: Within 0-5% to Index
3. Underperformer: Less than 5% to Index
Disclosure of interest:
1. IDFC SEC and affiliates may have received compensation from the company covered herein in the past twelve months for issue management, capital structure, mergers & acquisitions, buyback of shares and other corporate advisory services.
2. Affiliates of IDFC SEC may have received a mandate from the subject company.
3. IDFC SEC and affiliates may hold paid up capital of the subject company.
4. IDFC SEC and affiliates, their directors and employees may from time to time have positions or options in the company and buy or sell the securities of the company(ies) mentioned herein.
Copyright in this document vests exclusively with IDFC Securities Ltd

37
Thank you
Nikhil Vora / Bhushan Gajaria / Shweta Dewan(Dir) +91-22-6622 2567 / 2562 / 2577