ig article pre journal submission - core.ac.uk · pdf fileinternal combustion reciprocating...
TRANSCRIPT

1
An economic evaluation of the potential for distributed energy in Australia
Authors:
Lilley, William E.a, Reedman, Luke J.b1, Wagner, Liam D.c, and Alie, Colin F.d,
Szatow, Anthony R.e
a Saudi Aramco
b Commonwealth Scientific and Industrial Research Organisation (CSIRO)
c Energy Economics and Management Group, School of Economics, The University
of Queensland
d Environment Canada
e ToshEnterprises
Abstract:
Australia’s Commonwealth Scientific and Industrial Research Organisation (CSIRO)
recently completed a major study investigating the value of distributed energy (DE;
collectively demand management, energy efficiency and distributed generation)
technologies for reducing greenhouse gas emissions from Australia’s energy sector
(CSIRO, 2009). This comprehensive report covered potential economic,
environmental, technical, social, policy and regulatory impacts that could result from
the wide scale adoption of these technologies. In this paper we highlight the
1 Corresponding author: Dr Luke Reedman, CSIRO: PH: +61 2 4960 6057, PO Box 330, Newcastle
NSW 2300, Australia. [email protected]

2
economic findings from the study. Partial Equilibrium modeling of the stationary
and transport sectors found that Australia could achieve a present value welfare gain
of around $130 billion when operating under a 450 ppm carbon reduction trajectory
through to 2050. Modeling also suggests that reduced volatility in the spot market
could decrease average prices by up to 12% in 2030 and 65% in 2050 by using local
resources to better cater for an evolving supply-demand imbalance. Further modeling
suggests that even a small amount of distributed generation located within a
distribution network has the potential to significantly alter electricity prices by
changing the merit order of dispatch in an electricity spot market. Changes to the
dispatch relative to a base case can have both positive and negative effects on
network losses.
Keywords:
Distributed energy, Economic modeling, Carbon price, Electricity markets
JEL Codes: E17; Q40; Q42; Q47;
Introduction:
In response to climate change, Australia is developing a suite of options aimed at
delivering more efficient and sustainable low emissions energy. One solution is
distributed energy (DE; collectively distributed generation, demand management and
energy efficiency) which provides energy solutions near the point of use rather than
from generation at remote locations.
DE describes a number of technologies that can significantly reduce the nation’s
greenhouse gas emissions. These reductions result from potential reductions in

3
network losses by using generation near the point of consumption, through
maximizing the use of cleaner fuel sources such as natural gas, biogas, solar and
wind, and through more efficient conversion of primary energy sources to useful
energy services, including recovering heat otherwise wasted.
Distributed generation (DG), sometimes referred to as embedded generation is
generally connected to the electricity grid at low voltage (< 22 kV). Internal
combustion reciprocating engines (ICE) are the most mature prime movers for DG
applications. Advantages include comparatively low installed cost, high efficiency
(up to 45% for larger units), suitability for intermittent operation, high part-load
efficiency, high- and low-temperature exhaust streams for combined heat and power
(CHP) and easy serviceability. These units have been popular for peaking,
emergency, and base-load power generation. The units can run on a variety of fuels
including diesel, natural gas, biogas, compressed natural gas and petrol.
Cogeneration (or CHP) is a process where the heat generated by combustion of a fuel
for electricity production is used for a secondary purpose rather than being a waste
product. The heat is most often used to create hot water or steam but can also be used
for cooling purposes through an absorption cycle. The value of the waste heat
capture can be influenced by the type of technology, its reliability, the timing and
size of the heating and cooling demand in respect to electrical needs, and the type of
system the waste heat equipment is replacing or substituting.
Demand management refers to a suite of technologies and techniques used to
actively alter demand profiles over time. While these measures may reduce total
energy use, they are primarily employed to smooth or shift peaks in demand. By
controlling peak energy patterns, demand management may provide substantial

4
financial savings to consumers by reducing the need to build generation and network
infrastructure required to service this peak demand for only a small number of hours
each year.
A number of technologies are important for demand management. These are
generally storage devices such as batteries, compressed air and thermal materials, in
conjunction with communication and control technologies that allow controlled
cycling of appliances such as compression cycles in air conditioners or discretionary
loads such as pool pumps to be turned off.
Energy efficiency can be thought of in a number of ways. In one sense, it is a
reduction in energy demand as a result of changes in performance efficiency of
individual devices or the substitution of one form of energy for another more
efficient version (using solar energy for heating water for instance). In another sense,
improvements to system efficiency are a form of energy efficiency. This could
include the reduction of network losses by generating energy close to the point of
consumption, or improving the utilisation of a fuel by capturing more of the energy
available as occurs through cogeneration and trigeneration. Improving system
efficiency can help reduce greenhouse gas emissions and energy costs, but can also
mitigate against fuel scarcity risks by creating more efficient use of a limited
quantity of fuel.
Energy efficiency is often seen as the easiest and most cost effective way to reduce
greenhouse gas emissions in the short term. It is important to note that the value of
energy efficiency is not only determined by the quantity of energy that can be saved,
but the timing of those energy savings as energy market costs vary significantly over
the course of the day with costs typically highest when demand peaks.
5
Realizing the full value of DE requires understanding and addressing the complex
issues affecting key stakeholders including government, electricity and gas network
businesses, energy retailers, small to medium enterprises, large energy users and
domestic consumers. Critically important issues include the effects of DE on short
and long term economic drivers; the effects on electrical and gas networks through
introduction of local grid connected devices; environmental sensitivities resulting
from the change in technology type and the location of generation; the acceptance of
the technologies by all forms of society; and the complex interaction with policy and
regulation.
The dominance of centralized electricity supply in Australia means that DG currently
accounts for around 9% of total capacity and around 5% of total generation (WADE,
2006) ranking it well below most other countries and well below the world average
as seen in Figure 1. Generally speaking, countries with high proportions of
distributed generation tend to have relatively cold climates; highly urbanised,
densely populated cities; industrial sectors that account for a large share of economic
activity; concerns over energy supply security and fuel scarcity; and focused
government policy on electricity and heat supply.
European countries generally have greater proportions of DG than other countries.
However, various DG applications are suited for both industrialised countries and
emerging economies. The flexibility of DG as a power source is perhaps highlighted
by the penetration of DG in China and India being approximately average by global
standards, despite having significantly different economic structures to high ranking
countries.

6
Because Australia appears to significantly lag other nations in the adoption of DG
and DE more broadly, CSIRO (2009) has investigated the key barriers and enablers
of DE options in Australia by examining the economic, social, technical,
environmental, policy and regulatory barriers and enablers for wide scale adoption.
In this paper, we consider the potential economic benefits that can be realized
through the use of DE technologies in meeting Australia’s proposed greenhouse gas
reduction targets.
Insert Figure 1
Existing approaches in the literature
The existing literature identifies a number of alternative approaches in examining the
potential uptake of DG in different contexts. Numerous studies have explored real
options methods to examine investment in DG technologies given uncertainty in key
variables. For example, Muroaka and Oyama (2004) construct a theoretical model
using real options analysis to compare investment in DG versus a large-scale
generator in the presence of uncertain demand growth. Due to smaller unit size and
shorter lead times they found that higher investment in DG was preferred when
demand growth is low and uncertainty is high with investment in centralized
generators preferred in the opposing case. Fleten et al. (2007) evaluate the optimal
timing for investment in different capacity micro wind turbines under electricity
price uncertainty and find that increased wholesale price volatility (revenue earned
for excess power production) tends to delay investment in larger size turbines.
Siddiqui and Maribu (2009) explored the trade-off for a microgrid in meeting its
electricity and thermal loads via investment in CHP subject to natural gas price
volatility. They found that that the microgrid prefers investment in a larger-sized unit

7
for low levels of volatility and a modular investment strategy for higher levels of
volatility. Wickart and Madlener (2007) considered uncertainty in electricity and
natural gas prices in investing in a CHP system, or conventional heat-only generation
system (steam boiler) and to purchase all electricity from the grid. They find that
volatile electricity and natural gas prices favor investment in steam boilers rather
than CHP. They also find that a carbon tax can bring forward the optimal timing of
CHP investment in a system with relatively emission intensive grid electricity.
In regard to the empirical literature, some studies focus on the uptake of a particular
DG technology. Nässén et al. (2002) evaluate distributed solar power versus grid
extension in a remote area based on life-cycle cost of the two options. They find that
electricity demand per household, household density and the cost of battery
replacement are critical parameters in the cost competitiveness and therefore uptake
of the two options. Similarly, Corria et al. (2006) conduct an economic and technical
evaluation of Stirling engines in Brazil arguing for policy intervention to facilitate
greater deployment on the basis of lower environmental impacts. Ben Maalla and
Kunsch (2008) extend the Bass Diffusion model (Bass, 1969) to estimate the
possible diffusion of micro combined heat-power generation (µ-CHP) as a substitute
for centralized electricity generation and local boilers in the residential sector in the
EU-25. They find that due to high initial costs, regulatory frameworks that provide
incentives for µ-CHP such as the price received for excess electricity production or
capital grants to reduce upfront costs, can facilitate adoption through learning
effects.
Other studies attempt to define possible upper bounds to the deployment of DG
within an electricity system or region. Myers et al. (2010) estimate that for

8
Wisconsin, solar PV can contribute no more than 20% of the total electrical energy
demand in the state based on a 60% flexibility factor (the degree to which centralized
power generation accommodates increased DG) , assuming no short-term electrical
storage and a demand profile similar to current usage patterns. However, in
simulations for the Electric Reliability Council of Texas (ERCOT) electric power
system, Denholm and Margolis (2007) found that increased system flexibility, load
shifting via demand responsive appliances, and energy storage had the potential to
increase the penetration of solar PV to 50% of the total electrical energy demand.
Previous studies also focus on the uptake of a range of DG technologies to reduce
greenhouse (GHG) emissions. Lund and Østergaard (2000) examine the effects of
greater CHP and wind uptake on grid stability in Denmark. They determine that,
dependent on the timing of CHP generation and scale and volatility of wind
generation, continued investment in and expansion of the transmission network may
still be required. Wijayatunga et al. (2004) focus on the potential for wind, mini-
hydro and biomass distributed power generation technologies to reduce GHG
emissions in Sri Lanka. Banerjee (2006) evaluates eight DG technologies on the
basis of levelised cost of electricity as options for meeting future electricity demand
in India and finds that uptake of each option is dictated by local conditions such as
load factor requirements, fuel availability and remoteness. Similarly, Poullikkas
(2007) evaluated a number of DG technologies for Cyprus and found that load factor
requirements, capital costs, and local fuel cost and availability determined uptake.
Alternate economic analyses have concentrated on extracting maximum economic
benefit from single installations and district scale developments. One prominent
platform for these analyses is the Distributed Energy Resources Customer Adoption
9
Model (DER-CAM; Siddiqui et al., 2005). DER-CAM selects the optimal economic
combination of utility purchase and on-site generation required to meet a site’s end-
use loads based on specific site load and price information and performance data for
available equipment options and has been extended to investigate system wide
impacts of DE installations through the application specific case studies particularly
in the U.S. commercial building sector (Firestone and Marnay, 2007; Marnay et al.,
2008; Stadler et al., 2009; Stadler et al., 2010). The DER-CAM model has also been
used in the Japanese building sector (Zhou et al., 2006).
HOMER is another tool that can evaluate the optimal mix of various DG options
(e.g. cogeneration, wind turbines, solar photovoltaics, hydropower, batteries, fuel
cells, hydropower and biomass), electrical storage and grid-sourced electricity for an
individual or group of buildings. The software can evaluate trade-offs between DG
and grid electricity assuming variation in key inputs such as fuel and electricity
prices. It has been applied in case studies of tourist accommodation (e.g., Dalton et
al., 2008; 2009a; 2009b), island or remote power systems (e.g., Khan and Iqbal,
2005; Zoulias and Lymberopoulos, 2007; Oliva, 2008; Demiroren and Yilmaz, 2010;
Lau et al., 2010) evaluation of energy storage (e.g., Weis and Ilinca, 2008; Nair and
Garimella, 2010) and alternatives to grid extension (e.g., Nandi and Ghosh, 2010).
The Balmorel model was developed from a project to support modeling and analyses
of the energy sector with emphasis on the electricity and CHP sectors. The initial
focus of the model was the Baltic Sea region (Ravn et al., 2001). The model is
formulated as a linear programming optimization problem and has been extended in
several projects (e.g., Jensen and Meibom, 2008; Karlsson and Meibom, 2008;
Meibom and Karlsson, 2010). The objective function minimizes system costs

10
consisting of annualised investment costs of new investments, fixed operation and
maintenance costs of existing units and new investments, and operational costs of
units. The model evaluates optimal shares of distributed and centralized electricity
and heat generation and can be used for scenario analysis.
Economic models that estimate the uptake of a portfolio of different centralized and
distributed electricity generation technologies for a national electricity system under
alternative scenarios are becoming more common.
MARKAL (MARKet ALlocation model) is a widely applied bottom-up, dynamic,
linear programming optimization model. MARKAL is under continual development,
supported by the International Energy Agency (IEA) via the Energy Technology and
Systems Analysis Program (ETSAP) and has been used in wide-ranging energy
policy studies, most notably the IEA Energy Technology Perspectives (ETP) project
(IEA, 2010). Recent applications of the UK MARKAL model have demonstrated the
potential for increased DG in combination with large scale renewable electricity
generation technologies in various carbon mitigation scenarios (Kannan, 2009;
Kannan and Strachan, 2009; Jablonski et al., 2010).
Another approach for valuing a portfolio of generation assets for DG is Portfolio
Theory. Awerbuch and Berger (Awerbuch, 2008), applied portfolio theory to
generation assets in the European Union and emphasised that the portfolio-based
approach should be used to evaluate alternative generation asset portfolios. Unlike
the traditional planning approach for electricity generation investment (i.e., least cost
basis), a portfolio approach means that an asset is evaluated on how it affects the
generating costs of the portfolio relative to how it affects the economic risk of the
portfolio (Awerbuch, 2008). Thus, portfolio approach has shown that the addition of

11
wind and solar PV to a portfolio of conventional generation assets reduces the
overall portfolio cost and risk, even if the stand-alone generating cost of some assets
could be higher (Awerbuch, 2008).
A non-optimization approach is the World Alliance for Decentralized Energy
(WADE) model developed by Casten and Collins (2002). Based on an extensive
variety of input data and user defined assumptions, the WADE model builds
electricity generation, transmission and distribution (T&D) capacity and compares
future alternative energy systems under different penetrations of decentralized and
centralized energy. Its primary objective is to weigh the costs and benefits of DG
against that of centralized electricity generation in supplying demand growth over a
maximum twenty-year period. It also compares the two generation methods in terms
of GHG and pollutant emissions and fuel use. The model simultaneously creates new
capacity to meet demand growth and to replace retiring plant given user-defined
growth in electricity demand over the projection period. The use of the WADE
model in a number of country and regional analyses has afforded it significant
international credibility. A summary of previous applications is contained in Dijkstra
(2006).
In Australia previous attempts have been made to quantify the market value of
demand management specifically excluding network benefits, with estimates ranging
from $363M – $954M over the period 2007 – 2025 (Hoch et al., 2006). The partial
equilibrium model used in this study also excludes network benefits at the
distribution level and to a lesser extent the transmission level. Difficulties and
potential methodologies in apportioning this value are examined in CSIRO (2009).
12
Methodology
In this paper we consider the potential economic benefits that can be realized
through the use of DE technologies. We address this issue by firstly considering the
long term uptake of technologies through partial equilibrium modeling of the
stationary and transport sectors of the Australian economy. Secondly we consider the
impact that DG can have on prices in Australia’s National Electricity Market (NEM)
through changes to the market dispatch of electricity and finally to economic and
power flow changes in an IEEE test grid.
Part A: Partial equilibrium modeling
In this analysis a partial equilibrium model was used to examine the long term
change in technology mix that may result in the electricity and transport sectors from
the imposition of a price on carbon. This framework was chosen because it is
relatively less resource intensive than general equilibrium modeling and because it
offers the best opportunity to study the detailed technological implications of
alternative scenarios.
Partial equilibrium models cannot directly model the economy wide impacts of the
introduction of carbon prices. This limitation can be overcome via suitable
integration with general equilibrium models and this type of framework has been
applied in other studies (CSIRO and ABARE, 2006; BITRE and CSIRO, 2008). In
this study, the economy wide impacts have been exogenously imposed based on
observing the economic impact of a given carbon price in these past studies. This
introduces some inconsistency in the modeling results since the economy wide
impacts are not recalibrated for each scenario.

13
The partial equilibrium model employed is called the Energy Sector Model (ESM).
ESM is an Australian energy sector model co-developed by the CSIRO and the
Australian Bureau of Agricultural and Resource Economics (ABARE) in 2006.
Since that time CSIRO has significantly modified and expanded ESM. ESM is a
partial equilibrium (bottom-up) model of the electricity and transport sectors. It has a
detailed representation of the electricity generation sector with substantial coverage
of DG technologies. The transport module considers the cost of alternative fuels and
vehicles as well as detailed fuel and vehicle technical performance characterisation
such as fuel efficiencies and emission factors by transport mode, vehicle type, engine
type and age. Competition for resources between the two sectors and relative costs of
abatement are resolved simultaneously within the model.
ESM is solved as a linear program where the objective function is to maximize
welfare which is defined as the discounted sum of consumer and producer surplus
over time. The sum of consumer and producer surplus are calculated as the integral
of the demand functions minus the integral of the supply functions which are both
disaggregated into many components across the electricity and transport markets.
The objective function is maximized subject to constraints which control the
physical limitations of fuel resources, the stock of electricity plant and vehicles,
greenhouse gas emissions as prescribed by legislation or imposed carbon price paths,
and various market and technology specific constraints such as the need to maintain
a minimum number of peaking plants to meet rapid changes in the electricity load.
See Graham and Williams (2003) for an example of the equations required to
construct a similar partial equilibrium model.
The main components of ESM include:

14
• Coverage of all States and the Northern Territory (Australian Capital
Territory is modelled as part of New South Wales)
• Trade in electricity between National Electricity Market (NEM) States
• Sixteen distributed generation (DG) electricity plant types: internal
combustion diesel; internal combustion gas; gas turbine; gas micro turbine;
gas combined heat and power (CHP); gas micro turbine CHP; gas micro
turbine with combined cooling, heat and power (CCHP); gas reciprocating
engine CCHP; gas reciprocating engine CHP; solar photovoltaic; biomass
CHP; biomass steam; biogas reciprocating engine; wind; natural gas fuel cell
and hydrogen fuel cell
• Seventeen centralized generation (CG) electricity plant types: black coal
pulverized fuel; black coal integrated gasification combined cycle (IGCC);
black coal with partial CO2 capture and sequestration (CCS) (50 per cent
capture rate); black coal with full CCS (90 per cent capture rate); brown coal
pulverized fuel; brown coal IGCC; brown coal with partial CCS (50 per cent
capture rate); brown coal with full CCS (90 per cent capture rate); natural gas
combined cycle; natural gas peaking plant; natural gas with full CCS (90 per
cent capture rate); biomass; hydro; wind; solar thermal; hot fractured rocks
(geothermal) and nuclear
• Four electricity end use sectors: industrial; commercial and services; rural;
and residential
• Nine road transport modes: light, medium and heavy passenger cars; light,
medium and heavy commercial vehicles; rigid trucks; articulated trucks; and
buses
15
• Twelve road transport fuels: petrol; diesel; liquefied petroleum gas (LPG);
natural gas (compressed (CNG) or liquefied (LNG)); petrol with 10 per cent
ethanol blend; diesel with 20 per cent biodiesel blend; ethanol and biodiesel
at high concentrations; gas to liquids diesel; coal to liquids diesel with
upstream CO2 capture; hydrogen (from renewables); and electricity
• Four engine types: internal combustion; hybrid electric/internal combustion;
hybrid plug-in electric/internal combustion; and fully electric
• All vehicles and centralized electricity generation plants are assigned a
vintage based on when they were first purchased or installed in annual
increments
• Rail, air and shipping sectors are governed by much less detailed fuel
substitution possibilities
• Time is represented in annual frequency (2006, 2007, …, 2050).
All technologies are assessed on the basis of their relative costs subject to constraints
such as the turnover of capital stock, existing or new policies such as subsidies and
taxes. The model aims to mirror real world investment decisions by simultaneously
taking into account:
• The requirement that the plant is profitable over the term of its investment
• That the actions of one investor or user affects the financial viability of all
other investors or users simultaneously and dynamically
• That consumers react to price signals

16
• That the consumption of energy resources by one user affects the price and
availability of that resource for other users, and the overall cost of energy and
transport services, and
• Energy and transport market policies and regulations.
The model evaluates uptake on the basis of cost competitiveness but at the same time
takes into account the key constraints with regard to the operation of energy and
transport markets, current excise and mandated fuel mix legislation, future carbon
permit prices, existing plant and vehicle stock in each State, and lead times in the
availability of new vehicles or plant. It does not take into account issues such as
community acceptance of technologies but these can be controlled by imposing
various scenario assumptions which constrain the solution to user provided limits.
Greater detail and some further discussion on the model assumptions are contained
in CSIRO (2009).
For given time paths of the exogenous (input) variables that define the economic
environment, ESM determines the time paths of the endogenous (output) variables.
Key output variables include:
• Fuel, engine and electricity generation technology uptake
• Fuel consumption
• Cost of transport services (for example, cents per kilometre)
• Price of fuels
• GHG and criteria air pollutant emissions
• Wholesale and end-user electricity prices, and

17
• Demand for transport and electricity services.
Some of these outputs can also be defined as fixed inputs depending upon the design
of the scenario.
The endogenous variables are determined using demand and production
relationships, commodity balance definitions and assumptions of competitive
markets at each time step for fuels, electricity and transport services, and over time
for assets such as vehicles and plant capacities. With respect to asset markets, the
assumption is used that market participants know future outcomes of their joint
actions over the entire time horizon of the model. That is, they have perfect
foresight.
In addition to the limitations noted above, the approach used in this study contains
two additional limitations. The first is that it includes many assumptions for
parameters that are in reality uncertain and in some cases evolving rapidly.
Parameters of most concern are the future cost, performance and availability of
different technology options. These limitations are only partially addressed by
sensitivity analyses.
A second significant limitation is that ESM only takes account of cost as the major
determining factor in technology and fuel uptake. Therefore, it cannot capture the
behaviour of so-called “fast adopters” who take up new technology before it has
reached a competitive price point. For example, most consumers of hybrid electric
vehicles and solar PV systems today could be considered “fast adopters”. Their
purchase cannot be justified on economic grounds since the additional cost of these
options is not offset by savings in any reasonable period of time (relative to the cost
of borrowing). Nevertheless, these options are purchased and such purchasers may

18
be motivated by a variety of factors including a strong interest in new technology,
the desire to reduce emissions or status. As a result of this limitation, ESM’s
projections of the initial technology uptake for new technologies could be considered
conservative.
However, another factor which ESM overlooks is community acceptance and this
limitation might lead ESM to overestimate the rate of uptake of some fuels and
technologies. For example, greater use of gaseous fuels such as LPG and the
introduction of electricity as a transport fuel might be resisted by the Australian
community which has predominantly used liquid fuels for transport over the past
century. By design, ESM only considers whether the choice is economically viable.
In considering the prospects for DE, a key policy uncertainty is the future value of
the carbon permit price. The carbon permit price will be determined by the emission
target and the cost of abatement throughout the economy and internationally if
trading between countries comes into place. To account for the state of the debate of
this issue within Australia, we examined four emission reduction scenarios for the
Australian economy which cover the broad range of approaches being publically
discussed:
CPRS-5: A carbon pollution reduction scheme is adopted, commencing in 2010,
with an emissions allocation that leads to a reduction in emissions of 5 per cent on
2000 levels by 2020 and 60 per cent below 2000 levels by 2050.
CPRS-15: A carbon pollution reduction scheme is adopted, commencing in 2010,
with an emissions allocation that leads to a reduction in emissions of 15 per cent on
2000 levels by 2020 and 60 per cent below 2000 levels by 2050.

19
Garnaut- 550ppm: An Australian emission trading scheme is adopted, commencing
in 2013, with an emissions allocation that leads to a reduction in emissions of 10 per
cent on 2000 levels by 2020 and 80 per cent below 2000 levels by 2050 for
stabilisation at 550 ppm.
Garnaut -450ppm: An Australian emission trading scheme is adopted, commencing
in 2013, with an emissions allocation that leads to a reduction in emissions of 25 per
cent on 2000 levels by 2020 and 90 per cent below 2000 levels by 2050 for
stabilisation at 450 ppm.
Within the modeling framework, the four scenarios are implemented by imposing the
carbon price paths as estimated in Garnaut Climate Change Review (2008) and
Treasury (2008). Figure 2 shows the carbon price paths for the four scenarios.
Insert Figure 2
The expanded Renewable Energy Target (RET) is also an important policy change
which supports the deployment of solar energy technology and other renewable
electricity generation technologies. It requires that electricity retailers purchase
enough renewable energy certificates (RECs) so that an additional 45,000 GWh of
renewable electricity is generated by 2020. If all of this power were generated by
renewables with a capacity factor of 0.27, then this implies that 19 GW of renewable
electricity generation capacity must be deployed by 2020. If some of the electricity
comes from higher capacity factor plant such as hot fractured rocks and biomass
(with capacity factors of around 0.8), the capacity required is significantly reduced.
However, hot fractured rocks remain unproven at this stage and limited biomass
resources constrain the amount of electricity available from this technology.
Part B: Spot market modeling
20
In this section the impacts of DG on the Australian National Electricity Market
(NEM) and an IEEE test case are considered. The NEM was modeled with PLEXOS
(http://www.plexossolutions.com), a commercial spot market model, while impacts
of passive DG on the IEEE test case were considered with custom software
developed by Alie (2012).
i) PLEXOS
The effects of DG were considered for the Australian NEM by performing economic
modeling with a high temporal resolution economic model PLEXOS; a
commercially available optimization theory based electricity market simulation
platform. At its core is the implementation of rigorous operation algorithms and tools
such as Linear Programming (LP) and Mixed Integer Programming (MIP). PLEXOS
takes advantage of these tools in combination with an extensive input database of
regional demand forecasts, inter-regional transmission constraints and generating
plant technical data to produce price, generator and demand forecasts by applying
the SPD (scheduling, pricing and dispatch) engine similar to that used by the
Australian Energy Market Operator (AEMO) to operate the NEM (known as the
NEMDE).
The solution of Optimal Power Flow (OPF) is one of the core functions of the
PLEXOS simulation engine. The OPF utilises a linear version of the DC
approximation of the optimal power flow problem to model transmission congestion
and marginal losses. Therefore locational marginal prices (LMP) reflect transmission
marginal loss factors as well as congestion. It does not perform any pre-computation
or impose restrictions on how dynamic the network data can be, thus it can model
transmission augmentations and transmission outages dynamically.

21
Modeling the central dispatch and pricing for each of the NEM’s regional reference
nodes (RRN), is achieved by determining the generators which need to be included
for each five-minute dispatch interval in order to satisfy forecasted demand. To
adequately supply consumer demand, PLEXOS examines which generators are
currently online or are capable of being turned on to generate for the market at that
interval. This centralized dispatch process uses the LP dispatch algorithm SPD to
determine the generators in the dispatch set in the given trading interval, taking into
account the yearly average physical transmission network losses and constraints
provided to AEMO by the relevant transmission and distribution companies.
Each day consists of 48 half-hour trading periods, and market scheduled generation
assets have the option to make an offer to supply a given quantity (MW) of
electricity at a specific price ($/MWh) across 10 bid bands used in the NEM. For
each band, the bid price-quantity pairs are then included into the RRN bid stack.
Following the assembly of the generator bid pairs for each band, the LP algorithm
begins with the least cost generator and stacks the generators in increasing order of
their offer pairs at the RRN, taking into account the transmission losses. The LP
algorithm then dispatches generators successively, from the least cost to the highest
cost until it dispatches sufficient generation to supply the forecasted demand with
respect to the inter-regional losses. The price that PLEXOS dispatches the marginal
generating unit to the market determines the marginal price of electricity at the RRN
for that given trading period. The algorithm executes this process for all six five-
minute intervals in the half hourly trading period, and then averages these prices to
determine the spot price of electricity for the period. It should be noted that this
dispatch process has the following important properties:

22
• The dispatch algorithm calculates separate dispatch and markets prices for
each RRN in the NEM
• The prices that determine the merit order of dispatch are the generator offer
pairs which are adjusted with respect to relevant marginal loss factors due to
notional trading occurring at each RRN
• The market clearing price is the marginal price, not the average price, of all
dispatched generation
• Price differences across regions are calculated using inter-regional loss factor
equations as outlined by NEMMCO’s SOO 2008 (NEMMCO, 2008).
• PLEXOS can produce market forecasts, by taking advantage of one of the
following three generator bidding behavioural models:
o Short Run Marginal Cost Recovery (SRMC, also known as economic
dispatch)
o User defined market bids for every plant in the system
o Long Run Marginal Cost Recovery (LRMC).
Three key years from the ESM modeling were chosen to investigate the effects of
DG on the NEM. The periods were chosen to provide a range across the future and
to ensure that large changes predicted by ESM were accounted for. The three years
selected were 2020, 2030 and 2050. Five case studies were designed to investigate
the effects of DG as shown below. These cases provide a base case with current
market conditions, two future policy settings which assume a carbon policy
reduction framework and no additional installation of DG and two cases with the
carbon reduction pathways which include additional DG technology.

23
Business-As-Usual (BAU) case with no carbon trading (Scenario 1): in which
carbon pricing is not implemented. Load growth is met by significant investment in
large centralized generation assets such as base load coal, combined cycle gas
turbines (CCGT), solar thermal, geothermal (hot fractured rocks) and wind turbines
CPRS-15% no DG (Scenario 2): The CPRS is introduced in combination with the
renewable energy target to reach an overall reduction of emissions by 15% below
2000 levels. The price of emissions permits reaches approximately $50 t/CO2 in
2020. Demand growth is reduced compared to the reference case given the increase
in energy costs following the implementation of the CPRS. Increased renewable
generation asset deployment is observed in this scenario compared to the BAU
reference case
Garnaut-450ppm no DG (Scenario 3): The introduction of the CPRS with a deeper
emissions abatement pathway is implemented to achieve an overall reduction of
emissions of 25% below 2000 levels. The emissions permit price reaches around $61
t/CO2 in 2020 which will place more pressure to achieve further energy efficiency
and lower emissions technology deployment across the NEM
CPRS-15% with DG (Scenario 4): Following the introduction of the CPRS,
emissions permit prices stimulate the deployment of small scale DG technologies.
The roll out of small scale decentralized generation will allow for additional cuts in
emissions than the corresponding CPRS -15% case study
Garnaut-450ppm with DG (Scenario 5): With the implementation of deeper cuts
to emissions following the introduction of a 25% target via the CPRS, higher permit
prices stimulate a variety of alternative DG options for deployment across the NEM.

24
Furthermore, increased pressure from permit prices reduces demand, resulting in a
decreased reliance over time on centralized higher emitting generation types.
The modeling presented required a range of assumptions regarding the composition
of the NEM to portray the roll out of DG throughout the grid. Key assumptions
which have been implemented include:
• Electricity demand forecasts
• Thermal plant fuel prices
• Distributed Generator technology specifications
• Policy options with respect to greenhouse gas abatement pathways
• Existing and committed generating assets in all states are distributed across
their respective portfolios as outlined in the 2008 NEMMCO SOO
(NEMMCO, 2008)
• New installed centralized generation capacity output by ESM is attributed to
new generic companies for each region.
Details for each assumption are provided in detail in CSIRO (2009).
ii) IEEE test case
To better understand the potential impacts of DG on transmission systems we
employed custom software to investigate the changes from adding passive DG units
into an IEEE test grid. The grid used was the IEEE ‘1-area’ Reliability Test System
(RTS) ’96. The custom software solves economic dispatch solving for the full AC
power flow equations rather than a DC approximation used by most commercial

25
models such as PLEXOS. This model was used to examine transmission losses,
market price of electricity, capacity utilisation and energy benefit. The computational
limitations of the full AC power flow model limited this initial study to the
simulation of market operations over a one week period.
The model developed by Alie (2012) mimics the mechanics of a deregulated
electricity system where the utility function for each unit is discretized in a step-
wise, linear fashion where each ‘step’ represents an offer to produce a block of
power. The offers from all units are aggregated in order of increasing price and this
forms the composite supply curve for the electricity system.
Other factors informing the selection of offers include constraints related to security,
reliability, and the physical realities of the equipment involved in generating and
transmitting power. These factors include the net real and reactive power injected at
each bus within the system; the real and reactive power flows at each bus; plant ramp
rates; minimum up and down times of each plant; energy balance on generators with
storage and reserve power.
The model is solved in three discrete stages.

26
Pre-dispatch: The economic dispatch of generation units is performed for the
dispatch horizon. During this phase, the economic dispatch model is solved for a
time interval that is at least as long as a dispatch day. Here, an approximate power
flow model is used. The solution of the economic dispatch provides the generation
schedule for those units that are energy-constrained (e.g., hydro-electric units with
reservoirs).
Real-time operation: For each period of the dispatch day, economic dispatch of
generation units is re-calculated but, this time, using an exact power flow model.
Conceptually, this represents the real-time operation of the electricity system.
Market settlement: For each period of the dispatch day, the market settlement is
performed. During this phase, the market price for electricity is determined. The
general procedure is to re-solve the economic dispatch problem with the following
modifications:
• Power flow is ignored. Effectively, the sources and sinks are modelled as
being connected to the same bus
• Offers from units that were not dispatched in the period are removed from set
of available units.
The price of electricity in this period is then the price of the most expensive offer
accepted.
Three cases where considered in this initial study. In the first case, various amounts
of passive DG were installed on the Alder bus (see Grigg et al., 1999 for grid
description). Generation capacities of 10, 20, 40, 50, 80 and 100 MW were used. In
the second case, passive DG was added to the Arne bus with generation capacities of
20, 30, 40, 50 and 60 MW. In the final case, passive DG was added to all demand

27
buses in the system. The overall generation capacity was defined as 5, 10, 15 and 20
% of peak system demand at each bus. In all cases the units were considered to run
100% of the time at the specified generation level.
Results and discussion:
Part A: Partial equilibrium modeling
i) Generation profiles
In Figures 3 and 4 the predicted optimal national technology mix under CPRS-5 and
Garnaut-450 are displayed. Both figures clearly indicate a significant and growing
potential for DG. Both cases show a similar degree of DG use at the end of the
modeling period with CPRS-5 showing around 80 TWh of generation while there is
around 73 TWh in the Garnaut-450 scenario. For CPRS-5 the uptake of DG appears
to be stifled by black and brown coal sequestration while large centralized gas plant
with sequestration becomes a more favorable option in the more stringent reduction
pathway of Garnaut-450 as time approaches 2050. Demand is supplied by large
centralized plant due to restrictions on the uptake of DG which is explored later in a
discussion of sensitivity factors.
Insert Figure 3
Insert Figure 4
In Figures 5 and 6 the breakdown of DG technologies are explored for CPRS-5 and
Garnaut-450 scenarios. When comparing the two charts it is apparent that more DG
is predicted for the lower carbon price and that gas based technologies play a greater
role in this case. By contrast when the economy is faced with a higher carbon price,

28
the relative proportion of DG from solar increases although the total amount of DG
decreases as large centralized low emission plays a more dominant role.
Insert Figure 5
Insert Figure 6
ii) Greenhouse gas emissions
As demonstrated in Graham (2009), the greenhouse gas abatement attributable to
alternative technologies is not only dependent on the assumptions contained in the
emission reduction scenarios but also on the reference case or business as usual
scenario. For example, the inclusion of the expanded RET in the BAU scenario
limited the abatement attributed to large scale renewables up to 2030. Similarly, our
inclusion of DG technologies as generation options in the BAU reduces their share
of abatement. This may underestimate DG as a mitigation option when compared to
a BAU that does not include DG.
To illustrate this difference, Table 1 shows the greenhouse gas abatement in Mt/y
resulting from DG under a BAU that includes DG and a BAU that does not.
Insert Table 1
In proportional terms, Table 1 shows that the differential is greatest in 2020 with DG
abatement increasing four to five fold. In absolute terms, the differential is greatest
in 2050 where DG contributes around 60 Mt of abatement compared to around 40 Mt
when DG is included in the BAU scenario. This reflects the deployment of natural
gas-fired co- and trigeneration technologies over the projection period.

29
iii) Retail electricity prices
In Figures 7 and 8 the effective end-user cost of electricity (in real 2006 dollars)
predicted by ESM for residential and rural end use customers are displayed. The
charts clearly indicate that the stronger carbon prices result in higher prices for
customers in early years but tend to equal out in later years when the stationary
energy sector is essentially decarbonised. Higher prices for rural end-users reflect
premiums to cover higher costs of transmission and distribution of electricity via the
grid. A striking feature of Figure 8 however is that from around 2030 onward, rural
customers face declining costs under the carbon price scenarios. This reflects the
significant deployment of DG in this sector reducing the unit cost of electricity used
by rural customers. In all cases the cost to end-users associated with all scenarios is
higher than those predicted for the BAU case. The results of this modeling
framework however are unable to capture infrequent price spikes which occur on
short time frames which can significantly impact on average prices. The following
section of the report details modeling of this effect via a high resolution spot market
model.
Insert Figure 7
Insert Figure 8
The results of the ESM modeling clearly indicate a potential and significant role for
DG in the Australian market although taking into account the limitations above, the
technology and fuel uptake projections need to be interpreted with caution. In reality,
consumers will consider a variety of factors in fuel and vehicle purchasing decisions.
However, the projections presented in this paper, are nonetheless instructive in that
they indicate the point at which the various abatement options should become widely

30
attractive to all consumers. The projections indicate that an increasing diversity of
options are likely to become attractive compared to the present day fuel and
technology mix.
Part B1: Spot market modeling - PLEXOS
i) Emission intensity
As noted above, PLEXOS was used to examine the potential effects of DG in the
NEM through higher temporal resolution modeling in the years 2020, 2030 and
2050. Table 2 shows that the Emissions Intensity Factor (EIF; t-CO2/MWh) of
delivered energy throughout the NEM is significantly reduced across all three years,
and under both emissions reduction scenarios, when DG has been considered. The
EIF was chosen as the benchmark for analysis to better reflect emissions behaviour
given the different rates of load growth across all scenarios. Table 2 features the
EIF’s of delivered energy across the NEM and shows significant structural change
with respect to the emissions profile, demonstrating that DG could have a significant
impact on curtailing CO2 emissions.
Insert Table 2
ii) Electricity Prices
With the introduction of the CPRS, wholesale electricity prices are set to increase to
meet the marginal cost increase imposed by a carbon price. Consequently, modeling
results indicate that the marginal increase in electricity prices will vary depending on
the price setting generation unit. While there is a significant increase in electricity

31
prices for Scenario 2 (compared to the reference case), it should be noted that there is
a significant shift in installed generating assets.
For example the installed capacity of low-cost coal-fired generation in the reference
case will ensure that energy prices remain relatively low especially with brown coal
generators having a LRMC of less than $30/MWh. Conversely the increased cost of
the generation types such as Combined Cycle Gas Turbines (CCGT) contributes
greatly to the observed average price. Furthermore, the difference in prices between
Scenario 2 and 3 (see Table 3), are due to the lower demand and generation mix
changes due to the higher carbon price observed for a 25% carbon abatement
pathway.
The modeling indicates that the role out of DG can have a significant impact on the
average spot price of electricity throughout the NEM. The drop in average spot
prices for each of the DG scenarios indicates that investment in lower emission
technology stimulated by the CPRS may lower the delivered energy cost across the
NEM. Cheaper prices for the BAU in 2020 reflect low gas prices, unchanged coal
prices and to an extent perfect entry timing. In later years the favorable ramp rates of
DG and their bidding response based on connection for network support results in
reduced prices for Scenarios 4 and 5.
Insert Table 3
iii) Effects on spot price volatility
The modeling indicates that another benefit of the roll out of DG is lower volatility
of observed prices on the wholesale market (see Table 4). Lower volatility of spot
price behaviour also provides significant benefits from a risk management

32
perspective and reduces the cost of serving the retail consumer base. Valuing the
premium on a $100/MWh base cap product (see CSIRO (2009) for explanation of
the cap product), is a simple method of measuring market participant’s exposure to
high and volatile prices.
Insert Table 4
With the deployment of DG, there is a decrease in the incidence of prices above
$100 throughout each simulated year. In the NEM, the frequency and severity of
high prices has been observed on the market in previous years which has resulted in
adverse consequences for the viability of retailers to recover the price of wholesale
electricity from their customers. Lower spot market price volatility should result in
lower tariff price increases over the planning horizon and the deferral of investment
in expensive higher emitting peaking generator plant.
The wholesale prices displayed in Table 3 provide an interesting contrast to the
effective end-user cost of electricity that is estimated by the long term investment
model ESM. In the long term model, the effect of short term fluctuations on
wholesale prices is not captured and modeling here indicates that it can have a
dramatic effect on average prices. Whereas the ESM modeling shows that the lowest
end-user cost occurs in the BAU case, this modeling indicates that in later years the
addition of DG can reduce volatility (see Table 4) and bring down average wholesale
prices. While examining the impacts of DG with both models provides insights into
the potential economic impacts of DG installations, further work is required and is
being carried out to better couple long term investment models such as ESM with
models such as PLEXOS which are more able to realize the impacts of DG on
economics associated with energy spot markets.

33
Part B1: Spot market modeling – IEEE Reliability Test System
It is worth noting here that we are using a test grid to estimate the impacts of DG on
transmission lines. The Institute of Electronics and Electrical Engineers (IEEE)
Reliability Test System (RTS ’96) test case (Grigg et. al., 1999) incorporates a
number of generator and fuel combinations not used within Australia. The purpose
of this analysis however was to examine the impacts of DG on dispatch and
transmission power flows and as such the type of modeling approach is considered
more important than the types of generators and fuels being used. It should also be
noted that the DG units were considered to be passive market participants and as
such their marginal cost of generation was assumed to be zero and their reactive
power contribution was ignored.
Modeling of the IEEE test case with custom software able to solve the full AC power
flow equations found that adding even small amounts of DG can have a significant
impact on the economics and power flow of the test electricity system. Consider the
effect of modeling a small amount of DG (20 MWe or around 0.6% of total system
capacity and 17% of maximum demand at the bus) installed at one location (Alder).
Alder was selected as a site for DG for several reasons including that it is one of five
buses that at some times is a net exporter and at other times is a net importer, and
that the link between Alder and Alger is the only place in the IEEE RTS ’96 where,
for the time period considered, electricity transmission exceeds the line’s continuous
rating.
While the impact is slight in terms of the average electricity price – a reduction of
0.8% is estimated – this small addition of DG has a large impact on the net energy

34
benefit (i.e., difference between a unit’s energy benefit and its generation costs).
Figure 9.provides a chart of the relative change in net energy benefit of existing
generating units and shows units experiencing reductions of as much as 35% and
increases as great as 60%. And, while adding only 20 MWe of DG did not cause
much of a reduction in electricity prices, further reductions in average electricity
price are observed as more DG is installed. Figure 10 provides a chart of the average
hourly prices during the week examined with 120 MWe of DG installed at Alder.
Note that the frequency of price spikes is reduced and, overall, the average electricity
price is now 7% less than in the base case. This example highlights some important
generalised findings of the IEEE study which is that:
• The effects of adding DG aren’t limited to the bus at which the capacity is
installed. They are felt by pre-existing generation units both near and far and,
from the generators’ perspectives, can be positive or negative
• The effects of adding DG may depend more upon where the DG is added
than on how much
• The effects of adding DG depend quite heavily upon specific characteristics
of the target electricity system (e.g., disposition of sources and sinks relative
to one another, types of generation units in the system and electricity
demand).
Insert Figure 9
Insert Figure 10

35
A major reason for examining the impact of DG with the custom AC power flow
model was to consider the impacts of DG on system wide changes on power flow
and associated characteristics such as system wide losses. A common assertion is
that installing DG at a location can be of environmental benefit by reducing losses
from the point of generation to the point of consumption. While this is true for
energy use at the location itself, it ignores the potential changes that may occur on a
system wide basis. In Figure 11 a change in the system wide losses is displayed in
percentage terms. Adding DG capacity at Alder is seen to increase system wide
transmission losses for all weekdays modelled and for weekends for DG installations
of up to 80MW at this bus. This finding is not particular to DG installed at Alder.
Figure 12 shows the results for varying amounts of DG capacity installed at Arne. In
every scenario, adding DG at this bus increases the transmission losses observed for
the week of interest.
These results show that system wide losses can alter as a result of changes to the
merit order of dispatch as the system is optimized for a least cost (i.e. economically
efficient) solution. Essentially the increased losses occur as a result of differences in
conductor properties of individual lines used to transport the electricity and the total
travel path of energy through the entire system. Changes to the merit order of
dispatch in this IEEE test grid mean that the path taken is longer and the losses are
therefore proportionally higher. While there is a cost associated with the increased
system losses, it is more than compensated by the change in energy production price
in the entire system. This simply shows that the system is designed to minimize price
not transmission loss. This method is in keeping with the manner in which the
Australian NEM is operated, but may not reflect likely outcomes for the NEM.
Overall, the results indicate that the outcome of changes to the system can be a
36
function of the type of DG installed, how much DG is installed and at the location it
is installed.
Insert Figure 11
Insert Figure 12
Conclusion:
This paper presents results from three modeling frameworks focused primarily on
the potential impact of that DG may have in terms of economic and greenhouse gas
savings in the Australian energy sector. The modeling indicates that a future energy
system which incorporates wide spread DG has the potential to provide significant
economic and environmental benefits to society.
The modeling shows the primary savings occur through long term reduction in
expenditure on large scale centralized plant and associated transmission
infrastructure. Detailed modeling of the energy market also suggests that DG can
lead to significantly lower and less volatile wholesale prices through better
management of demand supply imbalance. Further work is required to better
establish the linkage and hence robustness of modeling of the long term economic
outcomes with those found from detailed modeling of the spot market.
While the modeling shows that DG can lead to significant economic savings,
outcomes of a full AC power flow model suggest that system wide losses can
increase due to changes in power flows throughout the entire system. While this is a
natural consequence of solving for the most economic solution to dispatching
energy, alternative techniques may be required if accounting for losses becomes
important in the future. In this case potential savings in greenhouse gas emissions for
37
instance from reduced losses within the system will need to be balanced against the
significant savings that can occur from increased uptake of DG.
One area of potentially significant economic effect not presented here is from
increased DE uptake and its impact on expenditure on distribution networks.
Depending on the type and quantity of the technology being installed, it is possible
that network augmentation can be deferred by reducing peak loads which are
responsible for much of the capital expenditure. Typically the need to cater for this
peak demand occurs on a small number of occasions per year and reducing its
magnitude through local supply and/or reduced demand may provide significant
savings. It is also possible that large amounts of DG may lead to two way flows,
fluctuating voltage profiles and alterations to fault current levels that may require
increased spending to mitigate potential issues this may cause. Understanding the
magnitude of these effects and potential control methodologies is worthy of further
research. Translating these effects into an economic framework is part of ongoing
research at CSIRO which takes into account the technical challenges of determining
the true value of DE on distribution networks and possible changes to policy and
regulatory settings.
References:
Alie, C., (2012, anticipatory), A framework for assessing the CO2 mitigation options for the electricity
generation sub-sector. PhD thesis. University of Waterloo, Waterloo, Ontario, Canada.

38
Awerbuch, S. (2008), Energy Security and Diversity in the EU: A Mean-Variance Portfolio
Approach. IEA Working Paper. IEA, Paris.
Banerjee, R. (2006), Comparison of Options for Distributed Generation in India, Energy Policy 34(1),
101-111.
Bass, F. M. (1969), A new product growth model for consumer durables, Management Science
15(5), 215-217.
Ben Maalla, E. M. and P. L. Kunsch (2008), Simulation of micro-CHP diffusion by means of System
Dynamics, Energy Policy 36(7), 2308-2319.
BITRE and CSIRO (2008), Modeling the Road Transport Sector: Appendix to Australia’s Low
Pollution Future - The Economics of Climate Change Mitigation.
http://www.treasury.gov.au/lowpollutionfuture/consultants_report/downloads/Modeling_the_road_tra
nsport_sector.pdf.
Casten, T. and M. Collins (2002), Optimising Future Heat and Power Generation, mimeo, World
Alliance for Decentralized Energy.
Corria, M., Cobas, V. and E. Lora (2006), Perspectives of Stirling Engines Use for Distributed
Generation in Brazil, Energy Policy 34(18), 3402-3408.
CSIRO (2009), Intelligent Grid – A value proposition for distributed energy in Australia. CSIRO
Report ET/IR 1152.
http://www.csiro.au/Outcomes/Climate/Reducing-
GHG/~/media/CSIROau/Flagships/Energy%20Transformed%20Flagship/IntelligentGridReportFullR
eport_ETF_PDF%20Standard.pdf
CSIRO and ABARE (2006), Modeling Energy Futures Forum Scenarios Using ESM, Canberra:
CSIRO, December. http://www.csiro.au/files/files/pb63.pdf
Dalton, G., Lockington, D. and T. Baldock (2008), Feasibility analysis of stand-alone renewable
energy supply options for a large hotel, Renewable Energy 33(7), 1475-1490.

39
Dalton, G., Lockington, D. and T. Baldock (2009a), Feasibility analysis of renewable energy supply
options for a grid-connected large hotel, Renewable Energy 34(4), 955-964.
Dalton, G., Lockington, D. and T. Baldock (2009b), Case study feasibility analysis of renewable
energy supply options for small to medium-sized tourist accommodations, Renewable Energy 34(4),
1134-1144.
Demiroren, A. and U. Yilmaz (2010), Analysis of change in electric energy cost with using renewable
energy sources in Gökceada, Turkey: An island example, Renewable and Sustainable Energy Reviews
14(1), 323-333.
Denholm, P. and R. Margolis (2007), Evaluating the limits of solar photovoltaics (PV) in electric
power systems utilizing energy storage and other enabling technologies, Energy Policy 35(9), 4424-
4433.
Dijkstra, S. (2006), The WADE Economic Model: Previous Results and Future Applications, mimeo,
World Alliance for Decentralized Energy, February.
Firestone, R. and C. Marnay (2007), Distributed generation dispatch optimization under various
electricity tariffs, International Journal of Electronic Business Management 5(3), 197-210.
Fleten, S. E., Maribu, K.M. and I. Wangensteen (2007), Optimal investment strategies in
decentralized renewable power generation under uncertainty, Energy 32(5), 803-815.
Garnaut Climate Change Review (2008), The Garnaut Climate Change Review – Final Report
http://www.garnautreview.org.au/index.htm
Graham, P. (2009), Measuring the contribution of a carbon price to greenhouse gas abatement in the
context of strong complementary policies and low oil prices, paper presented at the International
Energy Workshop, Venice, 18 June.

40
Grigg, C., Wong, P., Albrecht, P., Allan, R., Bhavaraju, M., Billinton, R., Chen, Q., Fong, C.,
Haddad, S., Kuruganty, S., Li, W., Mukerji, R., Patton, D., Rau, N., Reppen, D., Schneider, A.,
Shahidehpour, M. and C. Singh (1999), The IEEE reliability test system—1996, IEEE Transactions
on Power Systems, 14 (3), 1010-1021.
Himri, Y., Boudghene Stambouli, A., Draoui, B. and S. Himri (2008), Techno-economical study of
hybrid power system for a remote village in Algeria, Energy 33(7), 1128-1136.
Hoch, L., Chattopadhyay, D., Fazio, J., Fulford, B. and K. McCall (2006), Assessing the value of
demand response in the NEM. Prepared for the Australian IEA Task XIII Team.
IEA (2010), Energy Technology Perspectives 2010, Paris, IEA.
Jablonski, S., Strachan, N., Brand, C. and A. Bauen (2010), The role of bioenergy in the UK's energy
future formulation and modeling of long-term UK bioenergy scenarios, Energy Policy 38(10), 5799-
5816.
Jensen, S. G. and P. Meibom (2008), Investments in liberalised power markets: Gas turbine
investment opportunities in the Nordic power system, International Journal of Electrical Power &
Energy Systems 30(2): 113-124.
Kannan, R. (2009), Uncertainties in key low carbon power generation technologies - Implication for
UK decarbonisation targets, Applied Energy 86(10): 1873-1886.
Kannan, R. and N. Strachan (2009), Modeling the UK residential energy sector under long-term
decarbonisation scenarios: Comparison between energy systems and sectoral modeling approaches,
Applied Energy 86(4), 416-428.
Karlsson, K. and P. Meibom (2008), Optimal investment paths for future renewable based energy
systems-Using the optimization model Balmorel, International Journal of Hydrogen Energy 33(7),
1777-1787.

41
Khan, M. and M. Iqbal (2005), Pre-feasibility study of stand-alone hybrid energy systems for
applications in Newfoundland, Renewable Energy 30(6), 835-854.
Lau, K., Yousof, M., Arshad, S., Anwari, M. and A. Yatim (2010), Performance analysis of hybrid
photovoltaic/diesel energy system under Malaysian conditions, Energy 35(8), 3245-3255.
Lund, H. and P. Østergaard (2000), Electric Grid and Heat Planning Scenarios with Centralized and
Distributed Sources of Conventional, CHP and Wind Generation, Energy 25(4), 299-312.
Marnay, C., Venkataramanan, G., Stadler, M., Siddiqui, A., Firestone, R. and B. Chandran (2008),
Optimal technology selection and operation of commercial-building microgrids, IEEE Transactions
on Power Systems 23(3), 975-982.
Meibom, P. and K. Karlsson (2010), Role of hydrogen in future North European power system in
2060, International Journal of Hydrogen Energy 35(5), 1853-1863.
Muroaka, Y. and T. Oyama (2004), Generation Planning Including Distributed Generators Under
Uncertainty of Demand Growth, Electrical Engineering in Japan 146(3), 17-25.
Myers, K., Klein, S. and D. Reindl (2010), Assessment of high penetration of solar photovoltaics in
Wisconsin, Energy Policy 38(11), 7338-7345.
Nair, N.K. and N. Garimella (2010), Battery energy storage systems: Assessment for small-scale
renewable energy integration, Energy and Buildings 42(11), 2124-2130.
Nandi, S. and H. Ghosh (2010), Prospect of wind-PV-battery hybrid power system as an alternative to
grid extension in Bangladesh, Energy 35(7), 3040-3047.
Nässén, J., Evertsson, J. and A. Björn (2002), Distributed Power Generation Versus Grid Extension:
An Assessment of Solar Photovoltaics for Rural Electrification in Northern Ghana, Progress in
Photovoltaics: Research and Applications 10(7), 495-510.

42
NEMMCO (2008), Statement of Opportunities, Victoria: National Electricity Market Management
Company. http://www.aemo.com.au/planning/soo2008.html
Oliva, R. (2008), Simulation and measurement procedures for effective isolated wind and hybrid
system development in south Patagonia, Energy for Sustainable Development 12(2), 17-26.
Poullikkas, A. (2007), Implementation of Distributed Generation Technologies in Isolated Power
Systems, Renewable and Sustainable Energy Reviews 11(1), 30-56.
Ravn, H., Hindsberger, M., Petersen, M., Schmidt, R., Bøg, R., Grohnheit, P., Larsen, H.,
Munksgaard, J., Ramskov, J., Esop, M.R., Klavs, G., Galinis, A., Paprocki, R., Wawrzyszczuk, M.
and A. Gloukhov (2001), Balmorel: a model for analyses of the electricity and CHP markets in the
Baltic sea region, available at:
http://www.eabalmorel.dk/files/download/Balmorel%20A%20Model%20for%20Analyses%20of%20
the%20Electricity%20and%20CHP%20Markets%20in%20the%20Baltic%20Sea%20Region.pdf
Siddiqui, A.S., Firestone, R., Ghosh, S., Stadler, M., Marnay, C. and J.L. Edwards (2003), Distributed
Energy Resources Customer Adoption Modeling with Combined Heat and Power Applications,
Lawrence Berkeley National Laboratory Report LBNL 52718, June 2003
Siddiqui, A. and K. Maribu (2009), Investment and upgrade in distributed generation under
uncertainty, Energy Economics 31(1), 25-37.
Siddiqui, A., Marnay, C., Bailey, O. and K.H., LaCommare (2005), Optimal selection of on-site
generation with combined heat and power applications, International Journal of Distributed Energy
Resources 1(1), 33-62.
Stadler, M., Marnay, C., Siddiqui, A.S., Lai, J., Coffey, B. and H. Aki (2008), Effect of Heat and
Electricity Storage and Reliability on Microgrid Viability: A Study of Commercial Buildings in
California and New York States, LBNL-1334E, Berkeley Lab, Berkeley, CA, USA
Stadler, M., Marnay, C., Siddiqui, A.S., Lai, J., Coffey, B. and H. Aki (2009), Effect of Heat and
Electricity Storage and Reliability on Microgrid Viability: A Study of Commercial Buildings in

43
California and New York States, Report No. LBNL-1334E-2009, Berkeley Lab, Berkeley, CA, USA,
March.
Stadler, M., Marnay, C., Siddiqui, A., Lai, J., Cardoso, G., Megel, O. and A.S. Siddiqui (2010), The
Influence of a CO2 Pricing Scheme on Distributed Energy Resources in California's Commercial
Buildings, Report No. LBNL-3560E, Berkeley Lab, Berkeley, CA, USA, June.
Treasury (2008), Australia’s Low Pollution Future: The Economics of Climate Change Mitigation,
Canberra: Treasury.
http://www.treasury.gov.au/lowpollutionfuture/report/downloads/ALPF_consolidated.pdf
WADE (2006), World Survey of Decentralized Energy.
http://www.localpower.org/documents/report_worldsurvey06.pdf
Weis, T. and A. Ilinca (2008), The utility of energy storage to improve the economics of wind-diesel
power plants in Canada, Renewable Energy 33(7), 1544-1557.
Wickart, M. and R. Madlener (2007), Optimal technology choice and investment timing: A stochastic
model of industrial cogeneration vs. heat-only production, Energy Economics 29(4), 934-952.
Wijayatunga, P., Fernando, W. and R. Shrestha (2004), Impact of Distributed and Independent Power
Generation on Greenhouse Gas Emissions: Sri Lanka, Energy Conversion and Management 45(20),
3193-3206.
Zhou, N., Marnay, C., Firestone, R., Gao, W. and M. Nishida (2006), An analysis of the DER
adoption climate in Japan using optimization results for prototype buildings with U.S. comparisons,
Energy and Buildings 38(12), 1423-1433.
Zoulias, E. and N. Lymberopoulos (2007), Techno-economic analysis of the integration of hydrogen
energy technologies in renewable energy-based stand-alone power systems, Renewable Energy 32(4),
680-696.

44

45
Figure 1: Worldwide Distributed Generation installations (WADE, 2006)
0.0
10.0
20.0
30.0
40.0
50.0
60.0
Den
ma
rk
Fin
lan
d
Neth
erla
nd
s
La
tvia
Czech
Rep
.
Hu
ng
ary
Ge
rma
ny
Tu
rkey
Slo
vak R
ep
.
Po
lan
d
Jap
an
Po
rtu
ga
l
Au
str
ia
Ind
ia
Can
ad
a
Sou
th A
fric
a
Esto
nia
WO
RL
D
Ch
ile
Ch
ina
Ko
rea
Lith
uan
ia
Me
xic
o
Uru
gu
ay
Lu
xe
mb
ou
rg
Gre
ece
Sp
ain
Be
lgiu
m
Ita
ly
U.K
.
Sw
ed
en
Slo
ven
ia
Ind
on
esia
Uga
nd
a
AU
ST
RA
LIA
Fra
nce
U.S
.
Th
aila
nd
Bra
zil
Ire
lan
d
Arg
en
tin
a
Dis
trib
ute
d G
en
era
tion
as %
of t
ota
l ele
ctr
icity
ge
ne
ratio
n

46
Figure 2: CO2e permit prices assumed in the ESM modelling
0
50
100
150
200
250
2010 2015 2020 2025 2030 2035 2040 2045 2050
$/t
CO
2e
Garnaut 450ppm
Garnaut 550ppm
CPRS -5
CPRS -15

47
Figure 3: National electricity generation under CPRS-5, 2006-2050
0
50
100
150
200
250
300
350
400
450
TW
h
DG
Hot f ractured rocks
Solar thermal
Wind
Biomass
Gas peak
Gas CCS
Gas combined cycle
Black coal CCS
Black coal pf
Brown coal CCS
Brown coal pf
Hydro

48
Figure 4: National electricity generation under Garnaut-450ppm, 2006-2050
0
50
100
150
200
250
300
350
400
450
TW
h
DG
Hot f ractured rocks
Solar thermal
Wind
Biomass
Gas peak
Gas CCS
Gas combined cycle
Black coal CCS
Black coal pf
Brown coal CCS
Brown coal pf
Hydro
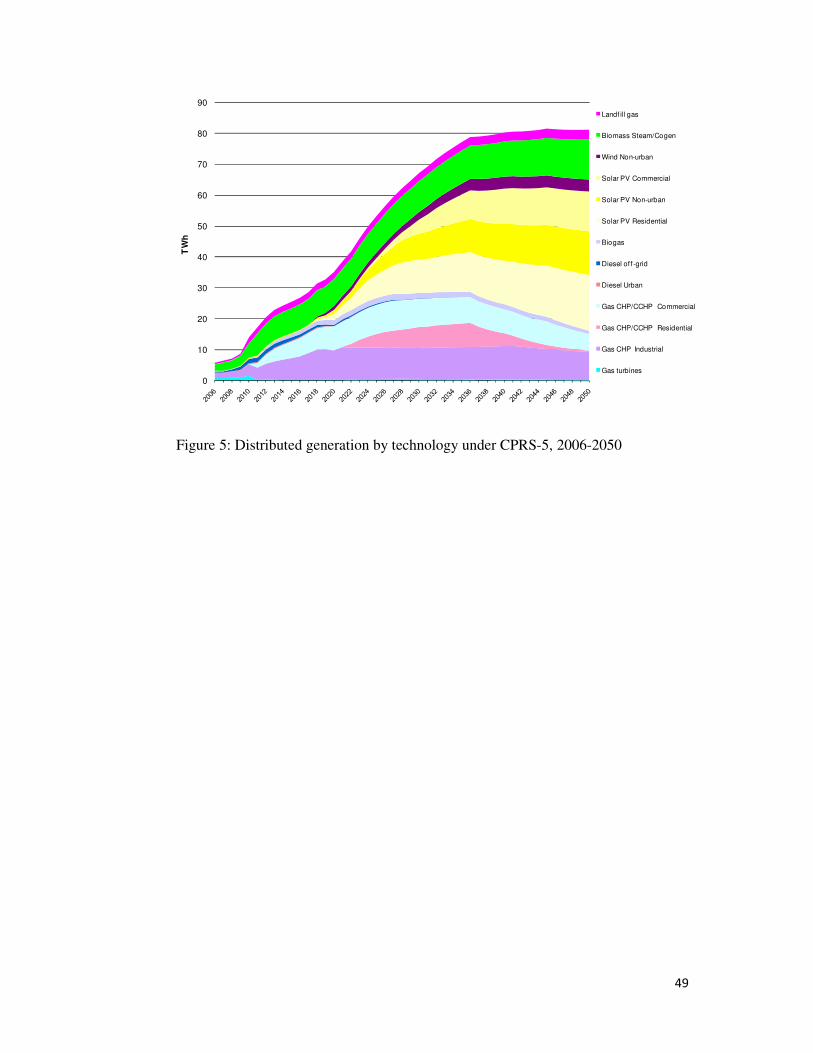
49
Figure 5: Distributed generation by technology under CPRS-5, 2006-2050
0
10
20
30
40
50
60
70
80
90
TW
h
Landf ill gas
Biomass Steam/Cogen
Wind Non-urban
Solar PV Commercial
Solar PV Non-urban
Solar PV Residential
Biogas
Diesel of f -grid
Diesel Urban
Gas CHP/CCHP Commercial
Gas CHP/CCHP Residential
Gas CHP Industrial
Gas turbines

50
Figure 6: Distributed generation under Garnaut-450ppm, 2006-2050
0
10
20
30
40
50
60
70
80
TW
h
Landf ill gas
Biomass Steam/Cogen
Wind Non-urban
Solar PV Commercial
Solar PV Non-urban
Solar PV Residential
Biogas
Diesel of f -grid
Diesel Urban
Gas CHP/CCHP Commercial
Gas CHP/CCHP Residential
Gas CHP Industrial
Gas engines
Gas turbines

51
Figure 7: National average cost of electricity, Residential end-users, 2006-2050
6
7
8
9
10
11
12
13
14
15
16
BAU CPRS-5 CPRS-15 Garnaut 550ppm Garnaut 450ppm
c/k
Wh
(Re
al 2
00
6)

52
Figure 8: National average cost of electricity, rural end-users, 2006-2050
6
8
10
12
14
16
18
20
BAU CPRS-5 CPRS-15 Garnaut 550ppm Garnaut 450ppm
c/k
Wh
(Re
al 2
00
6)

53
Figure 9: Relative change in net energy benefit for 20 MW of DG at Alder
-40
-30
-20
-10
0
10
20
30
40
50
60
70
Abel.1
Abel.2
Abel.3
Abel.4
Adams.1
Adams.2
Adams.3
Adams.4
Alder.1
Alder.2
Alder.3
Arne.1
Arne.2
Arne.3
Arthur.1
Arthur.2
Arthur.3
Arthur.4
Arthur.5
Arthur.6
Asser.1
Astor.1
Attlee.1
Aubrey.1
Aubrey.2
Aubrey.3
Aubrey.4
Aubrey.5
Aubrey.6
Austen.1
Austen.2
Austen.3
Rela
tive c
hange in n
et energ
y b
enefit (%
)
20 MW

54
Figure 10: Average daily electricity price for 120 MW of DG at Alder
20.0
25.0
30.0
35.0
40.0
45.0
Mon Tue Wed Thu Fri Sat Sun
Ele
ctr
icity p
rice (
$/M
Wh)
Time of day
Base
120 MW

55
Figure 11: Relative change in transmission losses for varying amounts of DG
installed at Alder
-4
-2
0
2
4
6
8
10
12
14
16
Mon Tues Wed Thurs Fri Sat Sun
Perc
ent change in losses (
%)
Day of Week
20 MW
40 MW
60 MW
80 MW
120 MW
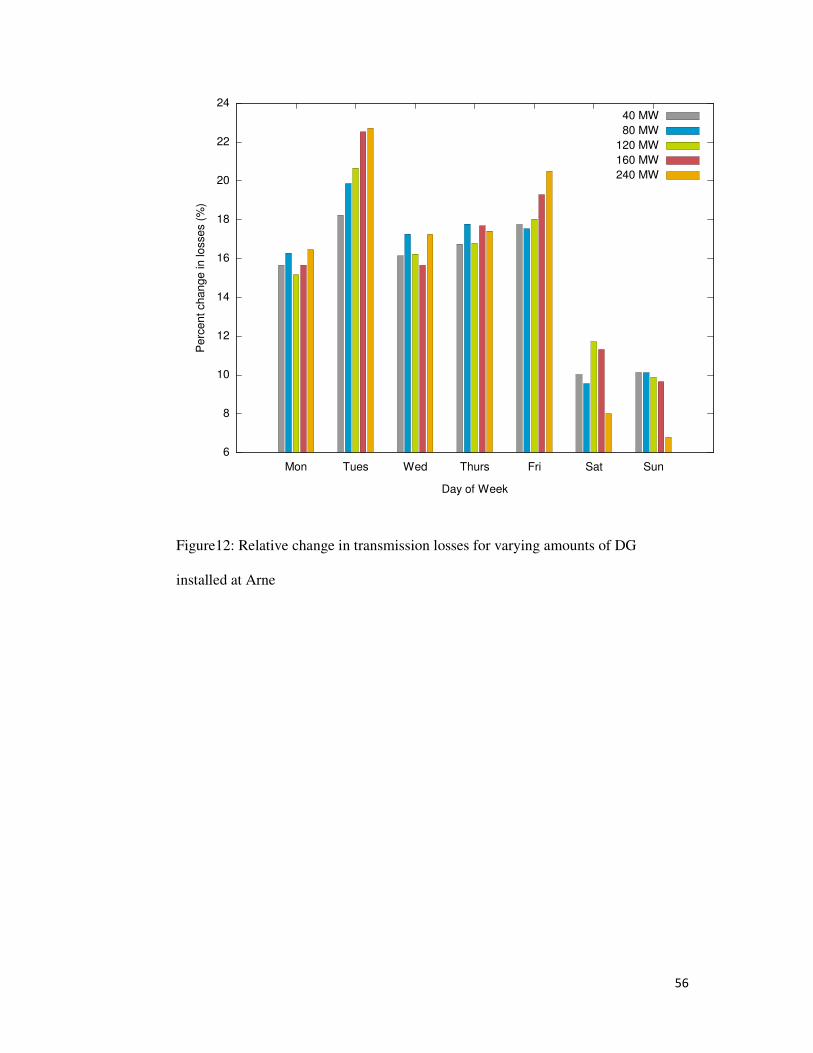
56
Figure12: Relative change in transmission losses for varying amounts of DG
installed at Arne
6
8
10
12
14
16
18
20
22
24
Mon Tues Wed Thurs Fri Sat Sun
Perc
ent change in losses (
%)
Day of Week
40 MW
80 MW
120 MW
160 MW
240 MW

57
Table 1: Greenhouse gas abatement attributed to DG under alternative BAU
scenarios (Mt)
2020 2030 2040 2050
BAU incl. DG
CPRS-5 3.6 23.4 35.1 41.0
CPRS-15 3.9 24.0 33.4 40.6
Garnaut-
550ppm
3.9 23.4 35.1 41.2
Garnaut-
450ppm
4.1 23.6 32.7 40.4
BAU excl.
DG
CPRS-5 17.0 38.8 53.3 61.3
CPRS-15 17.4 39.3 51.1 59.6
Garnaut-
550ppm
17.2 38.9 53.3 61.6
Garnaut-
450ppm
17.6 38.8 49.3 58.1
Table 2: Emissions Intensity Factor (EIF; t-CO2/MWh)
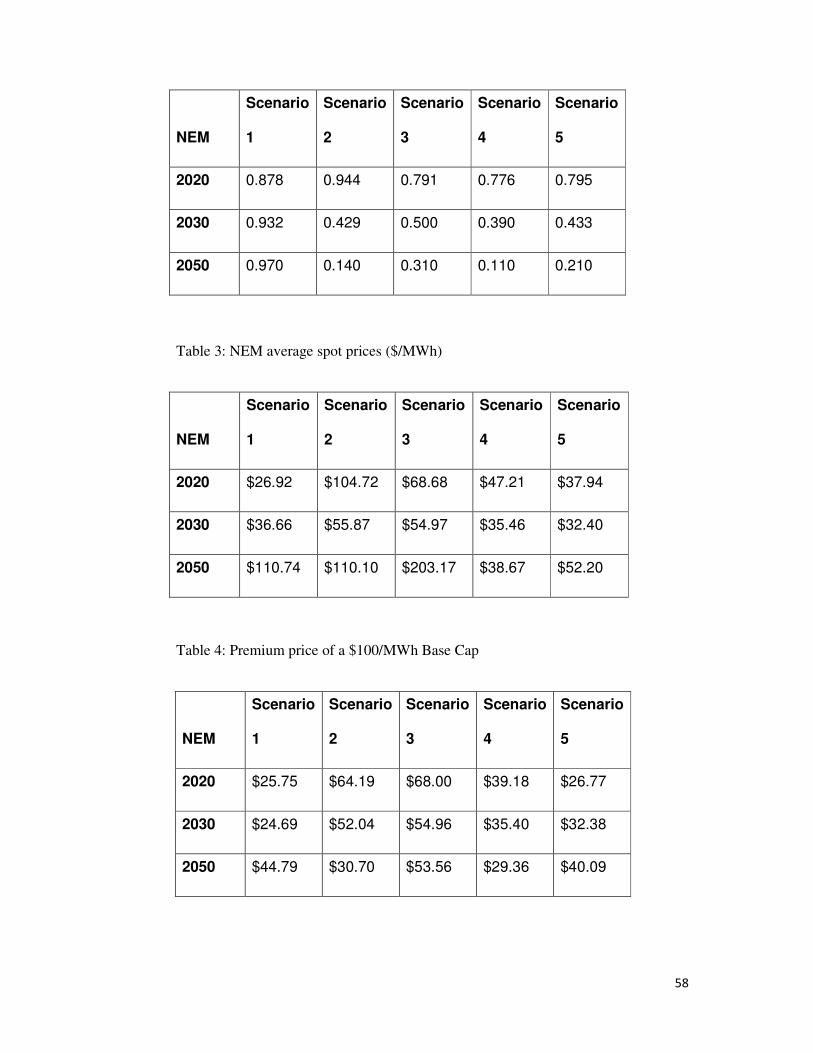
58
NEM
Scenario
1
Scenario
2
Scenario
3
Scenario
4
Scenario
5
2020 0.878 0.944 0.791 0.776 0.795
2030 0.932 0.429 0.500 0.390 0.433
2050 0.970 0.140 0.310 0.110 0.210
Table 3: NEM average spot prices ($/MWh)
NEM
Scenario
1
Scenario
2
Scenario
3
Scenario
4
Scenario
5
2020 $26.92 $104.72 $68.68 $47.21 $37.94
2030 $36.66 $55.87 $54.97 $35.46 $32.40
2050 $110.74 $110.10 $203.17 $38.67 $52.20
Table 4: Premium price of a $100/MWh Base Cap
NEM
Scenario
1
Scenario
2
Scenario
3
Scenario
4
Scenario
5
2020 $25.75 $64.19 $68.00 $39.18 $26.77
2030 $24.69 $52.04 $54.96 $35.40 $32.38
2050 $44.79 $30.70 $53.56 $29.36 $40.09

59