image structure clustering for image quality verification ...sumbaug/retinalprojectpapers/image...
TRANSCRIPT
www.elsevier.com/locate/media
Medical Image Analysis 10 (2006) 888–898
Image structure clustering for image quality verification of colorretina images in diabetic retinopathy screening
Meindert Niemeijer a,*,1, Michael D. Abramoff b,2, Bram van Ginneken a
a University Medical Center Utrecht, Image Sciences Institute, Q0S.459, Heidelberglaan 100, 3584CX, Utrecht, The Netherlandsb Department of Ophthalmology and Visual Sciences, University of Iowa Hospitals and Clinics, 200 Hawkins Drive, Iowa City, IA 52242, USA
Received 20 March 2006; received in revised form 20 July 2006; accepted 14 September 2006
Abstract
Reliable verification of image quality of retinal screening images is a prerequisite for the development of automatic screening systemsfor diabetic retinopathy.
A system is presented that can automatically determine whether the quality of a retinal screening image is sufficient for automaticanalysis. The system is based on the assumption that an image of sufficient quality should contain particular image structures accordingto a certain pre-defined distribution. We cluster filterbank response vectors to obtain a compact representation of the image structuresfound within an image. Using this compact representation together with raw histograms of the R, G, and B color planes, a statisticalclassifier is trained to distinguish normal from low quality images. The presented system does not require any previous segmentationof the image in contrast with previous work.
The system was evaluated on a large, representative set of 1000 images obtained in a screening program. The proposed method, usingdifferent feature sets and classifiers, was compared with the ratings of a second human observer. The best system, based on a SupportVector Machine, has performance close to optimal with an area under the ROC curve of 0.9968.� 2006 Elsevier B.V. All rights reserved.
Keywords: Image quality; Retina; Screening; Diabetic retinopathy; Image structure
1. Introduction
Diabetic Retinopathy (DR) is an ocular complication ofdiabetes. It is the most important cause of blindness in theworking population of the European Union and the Uni-ted States (Klonoff and Schwartz, 2000). It has been shownthat early diagnosis and timely treatment can prevent
1361-8415/$ - see front matter � 2006 Elsevier B.V. All rights reserved.
doi:10.1016/j.media.2006.09.006
* Corresponding author. Tel.: +31 30 250 4635; fax: +31 30 251 3399.E-mail address: [email protected] (M. Niemeijer).
1 Meindert Niemeijer was supported by the Dutch Ministry of EconomicAffairs through IOP IBVA02016.
2 Michael Abramoff is supported by the National Eye Institute R01EY017066, US Department of Agriculture Distance Learning Telemed-icine program, Department of Defense STTR A06-T030, the NetherlandsOrganization for Health Related Research (ZonMW), Research toPrevent Blindness, NY, NY and the Wellmark Foundation.
vision loss in most cases. Yet, for a variety of reasons, lessthan 50% of diabetics are screened for the presence of DR.One important limiting factor is the required scale of aprogram to screen the entire population of diabetics. Forexample, in the US alone, 18 million people would haveto have their eyes examined annually. Computer aideddiagnosis technology could facilitate such a large program.Most of the images in a screening program do not containabnormalities. For example, in the screening program thatsupplied the data used in this work less than 10% of allsubjects showed signs of DR (Abramoff and Suttorp-Schulten, 2005). Our research is focused on the develop-ment of a computerized DR pre-screening system. The sys-tem would make a selection of images that possiblycontain DR and present only these cases to the ophthal-mologist. This could reduce the overall workload of oph-thalmologists significantly.
M. Niemeijer et al. / Medical Image Analysis 10 (2006) 888–898 889
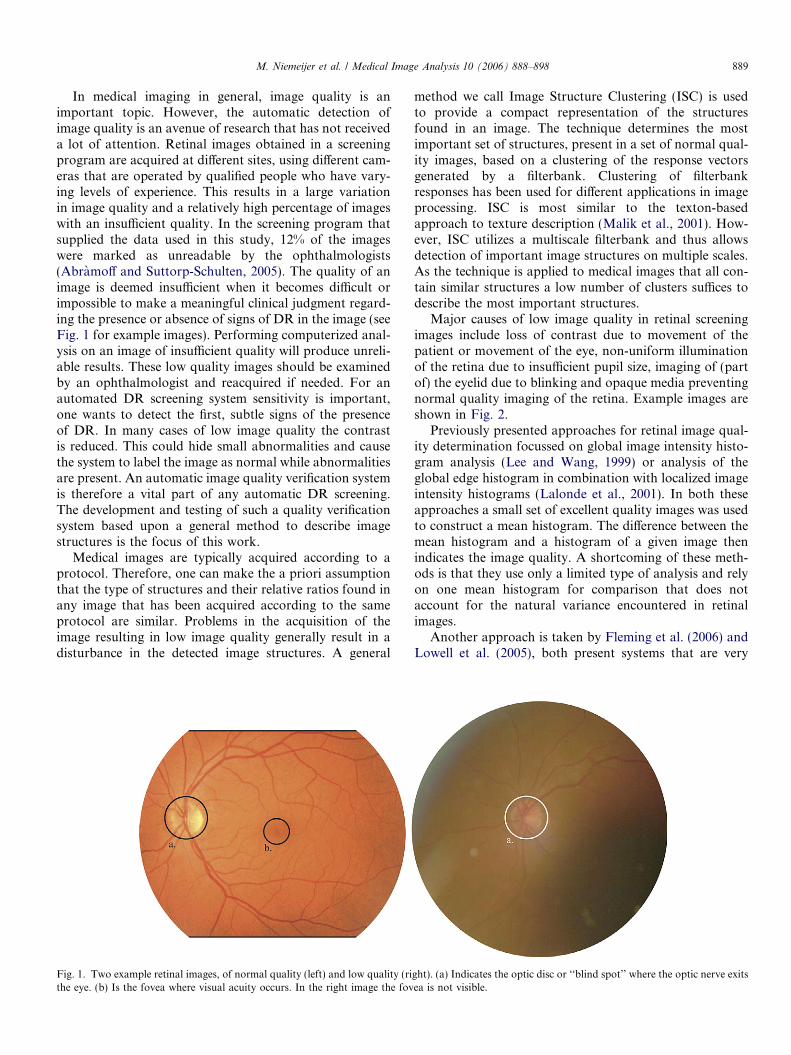
In medical imaging in general, image quality is animportant topic. However, the automatic detection ofimage quality is an avenue of research that has not receiveda lot of attention. Retinal images obtained in a screeningprogram are acquired at different sites, using different cam-eras that are operated by qualified people who have vary-ing levels of experience. This results in a large variationin image quality and a relatively high percentage of imageswith an insufficient quality. In the screening program thatsupplied the data used in this study, 12% of the imageswere marked as unreadable by the ophthalmologists(Abramoff and Suttorp-Schulten, 2005). The quality of animage is deemed insufficient when it becomes difficult orimpossible to make a meaningful clinical judgment regard-ing the presence or absence of signs of DR in the image (seeFig. 1 for example images). Performing computerized anal-ysis on an image of insufficient quality will produce unreli-able results. These low quality images should be examinedby an ophthalmologist and reacquired if needed. For anautomated DR screening system sensitivity is important,one wants to detect the first, subtle signs of the presenceof DR. In many cases of low image quality the contrastis reduced. This could hide small abnormalities and causethe system to label the image as normal while abnormalitiesare present. An automatic image quality verification systemis therefore a vital part of any automatic DR screening.The development and testing of such a quality verificationsystem based upon a general method to describe imagestructures is the focus of this work.
Medical images are typically acquired according to aprotocol. Therefore, one can make the a priori assumptionthat the type of structures and their relative ratios found inany image that has been acquired according to the sameprotocol are similar. Problems in the acquisition of theimage resulting in low image quality generally result in adisturbance in the detected image structures. A general
Fig. 1. Two example retinal images, of normal quality (left) and low quality (rithe eye. (b) Is the fovea where visual acuity occurs. In the right image the fov
method we call Image Structure Clustering (ISC) is usedto provide a compact representation of the structuresfound in an image. The technique determines the mostimportant set of structures, present in a set of normal qual-ity images, based on a clustering of the response vectorsgenerated by a filterbank. Clustering of filterbankresponses has been used for different applications in imageprocessing. ISC is most similar to the texton-basedapproach to texture description (Malik et al., 2001). How-ever, ISC utilizes a multiscale filterbank and thus allowsdetection of important image structures on multiple scales.As the technique is applied to medical images that all con-tain similar structures a low number of clusters suffices todescribe the most important structures.
Major causes of low image quality in retinal screeningimages include loss of contrast due to movement of thepatient or movement of the eye, non-uniform illuminationof the retina due to insufficient pupil size, imaging of (partof) the eyelid due to blinking and opaque media preventingnormal quality imaging of the retina. Example images areshown in Fig. 2.
Previously presented approaches for retinal image qual-ity determination focussed on global image intensity histo-gram analysis (Lee and Wang, 1999) or analysis of theglobal edge histogram in combination with localized imageintensity histograms (Lalonde et al., 2001). In both theseapproaches a small set of excellent quality images was usedto construct a mean histogram. The difference between themean histogram and a histogram of a given image thenindicates the image quality. A shortcoming of these meth-ods is that they use only a limited type of analysis and relyon one mean histogram for comparison that does notaccount for the natural variance encountered in retinalimages.
Another approach is taken by Fleming et al. (2006) andLowell et al. (2005), both present systems that are very
ght). (a) Indicates the optic disc or ‘‘blind spot’’ where the optic nerve exitsea is not visible.
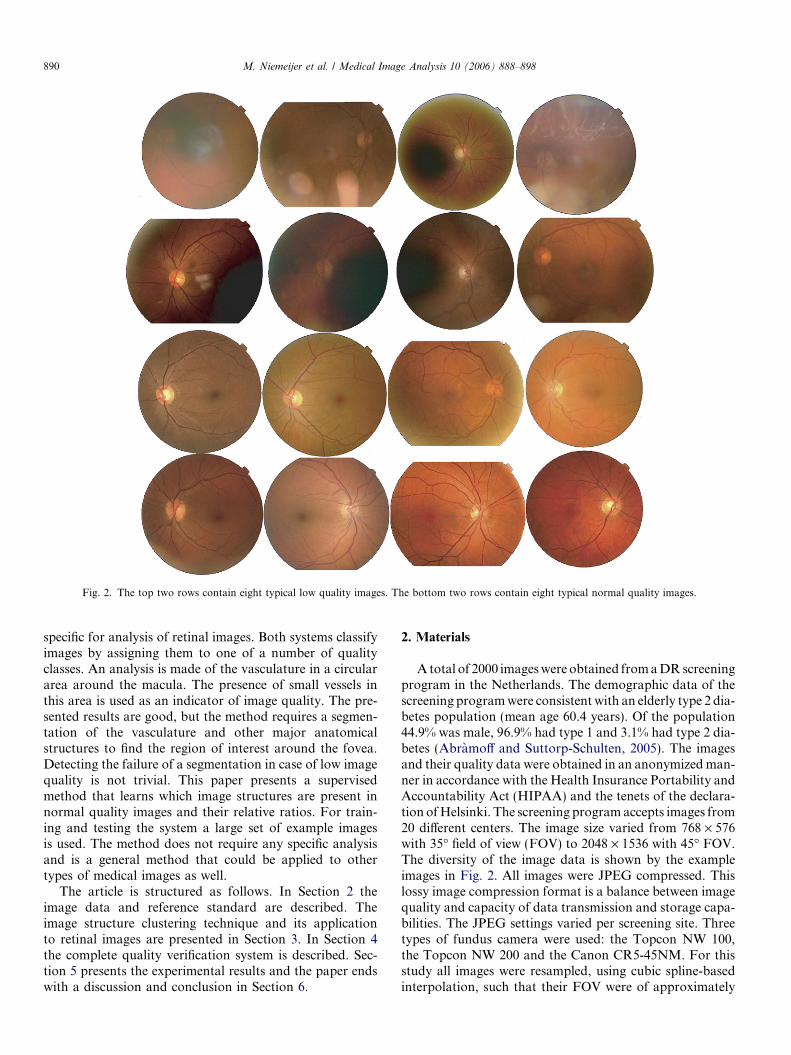
Fig. 2. The top two rows contain eight typical low quality images. The bottom two rows contain eight typical normal quality images.
890 M. Niemeijer et al. / Medical Image Analysis 10 (2006) 888–898
specific for analysis of retinal images. Both systems classifyimages by assigning them to one of a number of qualityclasses. An analysis is made of the vasculature in a circulararea around the macula. The presence of small vessels inthis area is used as an indicator of image quality. The pre-sented results are good, but the method requires a segmen-tation of the vasculature and other major anatomicalstructures to find the region of interest around the fovea.Detecting the failure of a segmentation in case of low imagequality is not trivial. This paper presents a supervisedmethod that learns which image structures are present innormal quality images and their relative ratios. For train-ing and testing the system a large set of example imagesis used. The method does not require any specific analysisand is a general method that could be applied to othertypes of medical images as well.
The article is structured as follows. In Section 2 theimage data and reference standard are described. Theimage structure clustering technique and its applicationto retinal images are presented in Section 3. In Section 4the complete quality verification system is described. Sec-tion 5 presents the experimental results and the paper endswith a discussion and conclusion in Section 6.
2. Materials
A total of 2000 images were obtained from a DR screeningprogram in the Netherlands. The demographic data of thescreening program were consistent with an elderly type 2 dia-betes population (mean age 60.4 years). Of the population44.9% was male, 96.9% had type 1 and 3.1% had type 2 dia-betes (Abramoff and Suttorp-Schulten, 2005). The imagesand their quality data were obtained in an anonymized man-ner in accordance with the Health Insurance Portability andAccountability Act (HIPAA) and the tenets of the declara-tion of Helsinki. The screening program accepts images from20 different centers. The image size varied from 768 · 576with 35� field of view (FOV) to 2048 · 1536 with 45� FOV.The diversity of the image data is shown by the exampleimages in Fig. 2. All images were JPEG compressed. Thislossy image compression format is a balance between imagequality and capacity of data transmission and storage capa-bilities. The JPEG settings varied per screening site. Threetypes of fundus camera were used: the Topcon NW 100,the Topcon NW 200 and the Canon CR5-45NM. For thisstudy all images were resampled, using cubic spline-basedinterpolation, such that their FOV were of approximately
M. Niemeijer et al. / Medical Image Analysis 10 (2006) 888–898 891
equal size, namely 530 pixels in diameter. Images wereacquired according to a fixed screening protocol. Two pho-tos were obtained from each eye, one approximately opticdisc (OD) centered and one approximately fovea centered.
Retinal images with a low quality should be reacquired,and therefore the image quality of each image is scored aspart of the reading process. All readers (three in total) areophthalmologists, with many years of experience in readingfundus photographs and diagnosing diabetic retinopathy.An image is scored as low quality when the ophthalmolo-gist feels he or she is unable to provide a reliable judgementabout the absence or presence of DR in the image. Allother images are marked as normal quality. Independenttraining and test sets were created, each containing 1000images (500 normal and 500 low quality). Each subjectwas represented in a set no more than two times, one imageper eye. However, the images acquired from one subject arealways either in the test or in the training set, never in both.Approximately 10% of all images in both the training andtest set contained pathologies.
To compare the performance of the automatic methodwith that of a second observer, an ophthalmologist(MDA) assigned each image in the test set to one of fourimage quality categories. The four categories were; definitelylow image quality, possibly low image quality, possibly nor-mal image quality and definitely normal image quality.
3. Image structure clustering
Image Structure Clustering is a general way to learn theimage structures that are present in a set of images. Pro-vided with a previously unseen image the output of theISC procedure gives information on the presence orabsence of the image structures found in the training set.One of the possible applications of this technique is inthe image quality verification of medical images, which isthe goal of the present work.
The local image structure at each pixel can be describedusing the outputs of a set of filters. This set of filters (see foran example filterbank Fig. 3) generates response vectors oflength l equal to the number of filters in the filterbank. Theresponse vectors characterize particular image structures.For example, a filterbank consisting of first order Gaussianderivative filters at scale r in the x and y direction (l = 2)will generate different response vectors at intensity edgeswith varying orientation. By using different filters and add-ing filters with varying scales r, structures that exist atvarying scales will generate specific response vectors. It isdifficult to predict the responses of a filterbank to multi-scale, complex image structures. Therefore, it is importantto start with an unbiased set of filters.
One could use histograms of the raw filter outputs overan image as features to characterize the presence or absenceof certain image structures. Even with just a few bins perhistogram the total number of features quickly becomesprohibitively large. Therefore, we propose to use an unsu-pervised clustering algorithm to cluster the response vec-
tors into groups that characterize similar image structuresin the image. This approach is similar to the one describedin Malik et al. (2001) where filterbank responses at a cer-tain scale are clustered to determine a set of texture prim-itives. In that work the authors are developing aframework for image segmentation. ISC attempts to findcharacteristic image structures, at multiple scales, in a setof similar medical images. This should lead to more specificclusters, partially corresponding to anatomical structures.
The characteristic structure clusters are found by apply-ing the filterbank to a large amount of images and randomlysampling a number of response vectors from each image.Next, the resulting set of vectors is clustered using k-meansclustering (Duda et al., 2001). Each cluster represent pixelsthat are on similar image structures, the image structureclusters. The final number of found clusters is equal to theparameter k of the clustering algorithm. Determining theoptimal number of clusters for any given set is an unsolvedproblem and is therefore best determined empirically.
An unseen image is first filtered using the filterbank gen-erating response vectors for all pixels in the image. The dis-tance from the response vector to each cluster mean ismeasured and the pixel is assigned to the cluster with thenearest mean. In this way each pixel in an unseen imagecan now be assigned to one of the k clusters. The numberof pixels in the image assigned to each cluster and their rel-ative ratios then provide a compact description of theimage structures in the image.
3.1. ISC for image quality verification in retinal images
For the specific application of ISC to the image qualityverification of retinal images a number of choices had to bemade. These encompassed the specific set of filters thatshould be used and their number as well as the total num-ber of structure clusters. Important considerations are thatwhen too many filters are applied, computational cost isincreased as well as the correlation and redundancybetween the filter outputs. A set of filters of limited sizeshould be used, that can adequately describe the localimage structure. The filters should be invariant to rotationand translation so as to generate similar responses for spe-cific image structures regardless of their rotation or posi-tion in the image. This invariancy is important becauseone of the most important image structures in retinalimages, the vasculature, can have many different orienta-tions and can be located anywhere in the image.
Invariant filters based on first order gauge coordinates(ter Haar Romeny, 2003) satisfy these requirements. Thegauge coordinate system is a coordinate system defined ineach point of an image L by the first order derivatives. Alocal coordinate frame is defined ð~v;~wÞ where ~w points inthe direction of the gradient vector, dL
dx ;dLdy
� �, and ~v is per-
pendicular to ~w, thus pointing in the direction where thegradient is 0. As the gradient is invariant to rotation andtranslation, any derivatives expressed in gauge coordinatesare invariants as well.
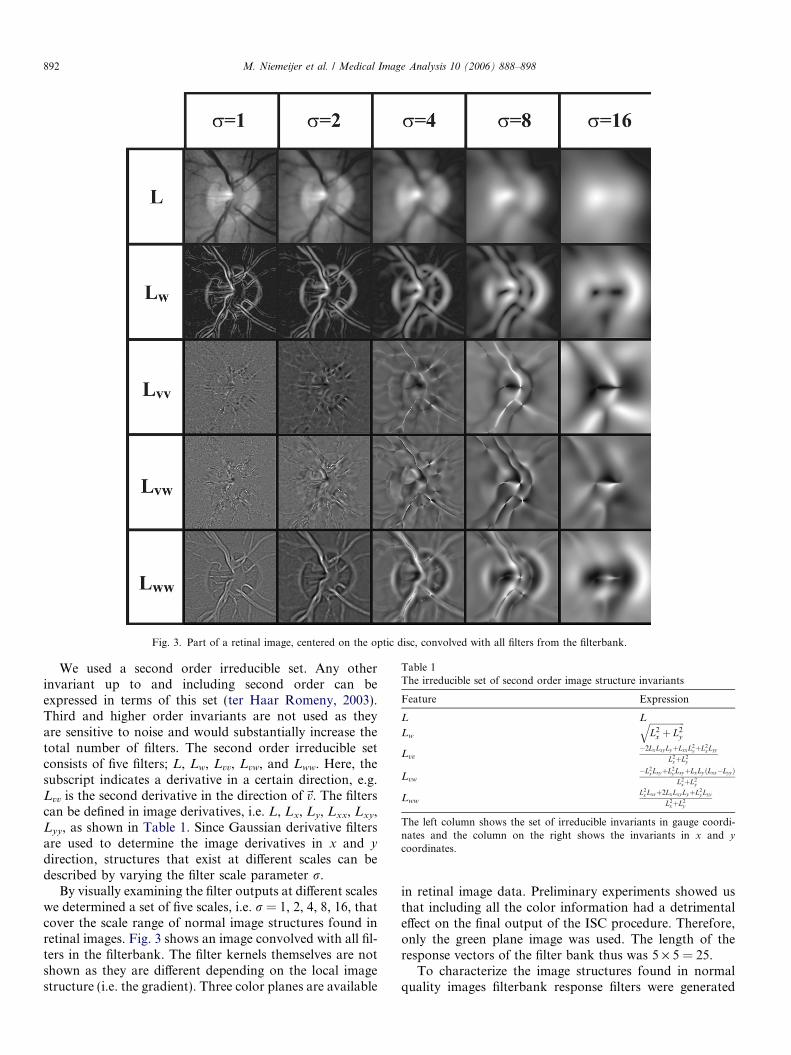
Fig. 3. Part of a retinal image, centered on the optic disc, convolved with all filters from the filterbank.
Table 1The irreducible set of second order image structure invariants
Feature Expression
L L
Lw
ffiffiffiffiffiffiffiffiffiffiffiffiffiffiffiffiL2
x þ L2y
q
Lvv�2LxLxy LyþLxxL2
yþL2x Lyy
L2xþL2
y
Lvw�L2
x LxyþL2y LxyþLxLy ðLxx�Lyy Þ
L2xþL2
y
LwwL2
x Lxxþ2LxLxy LyþL2y Lyy
L2xþL2
y
The left column shows the set of irreducible invariants in gauge coordi-nates and the column on the right shows the invariants in x and y
coordinates.
892 M. Niemeijer et al. / Medical Image Analysis 10 (2006) 888–898
We used a second order irreducible set. Any otherinvariant up to and including second order can beexpressed in terms of this set (ter Haar Romeny, 2003).Third and higher order invariants are not used as theyare sensitive to noise and would substantially increase thetotal number of filters. The second order irreducible setconsists of five filters; L, Lw, Lvv, Lvw, and Lww. Here, thesubscript indicates a derivative in a certain direction, e.g.Lvv is the second derivative in the direction of~v. The filterscan be defined in image derivatives, i.e. L, Lx, Ly, Lxx, Lxy,Lyy, as shown in Table 1. Since Gaussian derivative filtersare used to determine the image derivatives in x and y
direction, structures that exist at different scales can bedescribed by varying the filter scale parameter r.
By visually examining the filter outputs at different scaleswe determined a set of five scales, i.e. r = 1, 2, 4, 8, 16, thatcover the scale range of normal image structures found inretinal images. Fig. 3 shows an image convolved with all fil-ters in the filterbank. The filter kernels themselves are notshown as they are different depending on the local imagestructure (i.e. the gradient). Three color planes are available
in retinal image data. Preliminary experiments showed usthat including all the color information had a detrimentaleffect on the final output of the ISC procedure. Therefore,only the green plane image was used. The length of theresponse vectors of the filter bank thus was 5 · 5 = 25.
To characterize the image structures found in normalquality images filterbank response filters were generated
M. Niemeijer et al. / Medical Image Analysis 10 (2006) 888–898 893
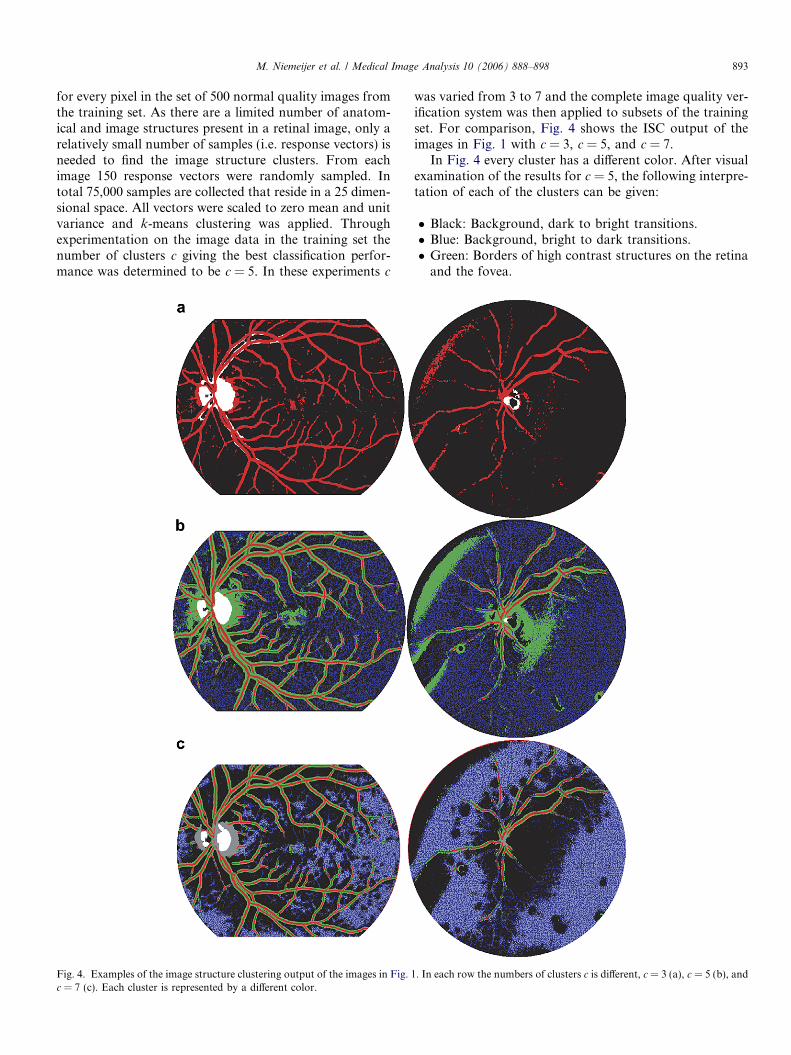
for every pixel in the set of 500 normal quality images fromthe training set. As there are a limited number of anatom-ical and image structures present in a retinal image, only arelatively small number of samples (i.e. response vectors) isneeded to find the image structure clusters. From eachimage 150 response vectors were randomly sampled. Intotal 75,000 samples are collected that reside in a 25 dimen-sional space. All vectors were scaled to zero mean and unitvariance and k-means clustering was applied. Throughexperimentation on the image data in the training set thenumber of clusters c giving the best classification perfor-mance was determined to be c = 5. In these experiments c
Fig. 4. Examples of the image structure clustering output of the images in Fig. 1c = 7 (c). Each cluster is represented by a different color.
was varied from 3 to 7 and the complete image quality ver-ification system was then applied to subsets of the trainingset. For comparison, Fig. 4 shows the ISC output of theimages in Fig. 1 with c = 3, c = 5, and c = 7.
In Fig. 4 every cluster has a different color. After visualexamination of the results for c = 5, the following interpre-tation of each of the clusters can be given:
� Black: Background, dark to bright transitions.� Blue: Background, bright to dark transitions.� Green: Borders of high contrast structures on the retina
and the fovea.
. In each row the numbers of clusters c is different, c = 3 (a), c = 5 (b), and
894 M. Niemeijer et al. / Medical Image Analysis 10 (2006) 888–898
� Red: The vasculature.� White: The optic disc.3
4. The complete image quality verification system
Our complete approach consists of three steps. First aset of features is extracted from the 1000 images in thetraining set. Then, feature selection is used to select themost salient feature sub-set. Finally, a classifier is trainedusing the selected features extracted from the training set.The trained classifier can then be directly applied to the testset to test its performance.
4.1. Features
The features used in the final system consist of a histo-gram of the ISC clustered pixels as well as the raw R, G,and B histograms. To produce the ISC histogram eachcluster was assigned its own histogram bin. The RGB his-togram features were added because they were often usedin previous work. The histograms can help detect imageswith severe non-uniform illumination or low image con-trast. The normalized histograms taken from the R, G,and B image planes formed the second part of the completestarting feature set.
To determine the number of bins for the RGB histo-gram features, histogram sizes of 5, 10, and 20 bins weretested on the training set. A classifier was trained usingRGB histogram features exclusively and the best perfor-mance was found using histograms with 5 bins. The perfor-mance difference between 5 and 10 bins was small so thechoice of the number of histogram bins for the RGB fea-tures does not appear to be a critical parameter.
The complete feature set is now as follows:
(1) The 5 bins of the normalized histogram of the imagestructure clusters.
(2) The 5 bins of the normalized histogram of the redimage plane.
(3) The 5 bins of the normalized histogram of the greenimage plane.
(4) The 5 bins of the normalized histogram of the blueimage plane.
In total 20 features are extracted for a single image.
4.2. Feature selection
Supervised systems often benefit from feature selection.Feature selection attempts to find a set of features, i.e. asub-set of the complete feature set, that allow maximumseparation of different classes of samples in the trainingdata. In case of the proposed system, features that best
3 Colour images are only available in the online version of this paper.
separate normal from low quality images should beselected.
The sequential forward floating selection (SFFS) algo-rithm (Pudil et al., 1994) was used for feature selection.This is a wrapper-based algorithm, which means that ittests the classification performance of a specific classifierusing different feature sets. Compared to other techniques,this algorithm has shown good performance on practicalproblems (Jain and Zongker, 1997). The algorithmemploys a ‘‘plus 1, take away r’’ strategy. Features areadded sequentially to an initially empty feature set butat every iteration features are also removed if thatimproves performance. In this way ‘‘nested’’ groups ofgood features can be found. For the feature selectionexperiments the training set was randomly divided in afeature selection training set, FStrain, and a feature selec-tion test set, FStest. Both sets contained 50% low and50% normal quality images. The SFFS algorithm traineda classifier using the selected feature sub-set and FStrain,next the performance of the classifier and feature sub-setwas tested on FStest. The criterion used to measure theperformance was the area under the ROC curve (Metz,1986), Az this measure lies between 0.5 for a method thatis not better than random guessing and 1.0 for a perfectclassification.
After feature selection had finished, two classifiers weretrained. One with all features and one with the selected fea-tures. Whichever set of features showed the best classifica-tion performance on the training set was used in the finalexperiment.
4.3. Classifiers
It is difficult to predict beforehand which classifier willgive the best performance for a particular classificationtask. Therefore, various classifiers classifiers were tested.These were a non-linear Support Vector Machine withradial basis kernel (SVM) (Chang and Lin, 2001), a Qua-dratic Discriminant Classifier (QDC) (Duda et al., 2001),a Linear Discriminant Classifier (LDC) (Duda et al.,2001) and a k-Nearest Neighbor Classifier (kNNC) (Aryaet al., 1998).
For the kNNC the value of parameter k was determinedusing leave one out experiments on the training set using allfeatures. The found value of k was then used in all experi-ments involving this classifier.
The SVM has a slow training phase in which, throughcross-validation on the training set, the optimal valuesfor its two parameters c and r need to be determined.Parameter c is a penalty term for overlapping classes whileparameter r is the variance of the radial basis kernel usedby the SVM. Both parameter values were found by usingthe ‘‘grid search’’ procedure proposed in Chang and Lin(2001). The fact that these parameters have to be deter-mined make a wrapper based feature selection procedure,such as described previously, impractical. Good parametersettings need to be found for each tested feature combina-
M. Niemeijer et al. / Medical Image Analysis 10 (2006) 888–898 895
tion. It is possible to use the features selected for anotherclassifier in the SVM experiments. The features selectedfor the LDC should give a reasonable linear separationof the data. However, using these features the results onthe training set showed a clear decrease in overall SVMclassification performance for all system setups. Therefore,no feature selection was performed for the SVM.
5. Experiments and results
5.1. Experiments
The general algorithm for image quality verification hasbeen outlined above. The two aspects of the algorithm thatcan be varied are the classifier and the feature set that isused. To show the effectiveness of the proposed ISC-basedfeatures and determine the optimal system configuration,different system setups, using different feature sets and dif-ferent classifiers have been tested.
As far as the features are concerned, three basic systemconfigurations were tested. A combination of ISC andRGB features, (ISC + histogram), only ISC features(ISC) and only RGB features (histogram). For each systemfeature selection was performed, as described earlier, andwhere this improved performance on the training set theselected features were used, otherwise the complete set offeatures was used. All features were always scaled to zeromean and unit standard deviation before feature selectionand training.
For the final experiments on the test set each classifierwas trained using the complete training set and the selectedfeatures. The trained classifier was then applied to the testset. After application of the classifier each image has beenassigned a posterior probability representing the probabil-ity an image has normal quality. This process was done forall three systems and all classifiers resulting in a total of 12
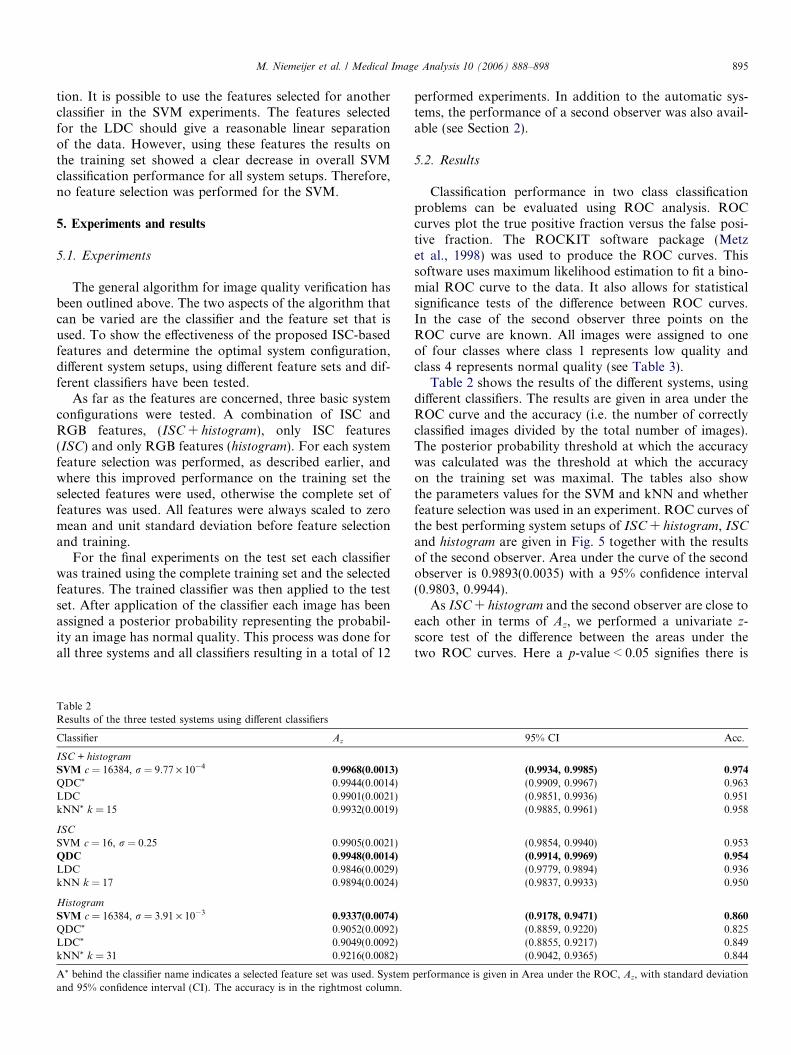
Table 2Results of the three tested systems using different classifiers
Classifier Az
ISC + histogram
SVM c = 16384, r = 9.77 · 10�4 0.9968(0.0013)
QDC* 0.9944(0.0014)LDC 0.9901(0.0021)kNN* k = 15 0.9932(0.0019)
ISC
SVM c = 16, r = 0.25 0.9905(0.0021)QDC 0.9948(0.0014)
LDC 0.9846(0.0029)kNN k = 17 0.9894(0.0024)
Histogram
SVM c = 16384, r = 3.91 · 10�3 0.9337(0.0074)
QDC* 0.9052(0.0092)LDC* 0.9049(0.0092)kNN* k = 31 0.9216(0.0082)
A* behind the classifier name indicates a selected feature set was used. Systemand 95% confidence interval (CI). The accuracy is in the rightmost column.
performed experiments. In addition to the automatic sys-tems, the performance of a second observer was also avail-able (see Section 2).
5.2. Results
Classification performance in two class classificationproblems can be evaluated using ROC analysis. ROCcurves plot the true positive fraction versus the false posi-tive fraction. The ROCKIT software package (Metzet al., 1998) was used to produce the ROC curves. Thissoftware uses maximum likelihood estimation to fit a bino-mial ROC curve to the data. It also allows for statisticalsignificance tests of the difference between ROC curves.In the case of the second observer three points on theROC curve are known. All images were assigned to oneof four classes where class 1 represents low quality andclass 4 represents normal quality (see Table 3).
Table 2 shows the results of the different systems, usingdifferent classifiers. The results are given in area under theROC curve and the accuracy (i.e. the number of correctlyclassified images divided by the total number of images).The posterior probability threshold at which the accuracywas calculated was the threshold at which the accuracyon the training set was maximal. The tables also showthe parameters values for the SVM and kNN and whetherfeature selection was used in an experiment. ROC curves ofthe best performing system setups of ISC + histogram, ISC
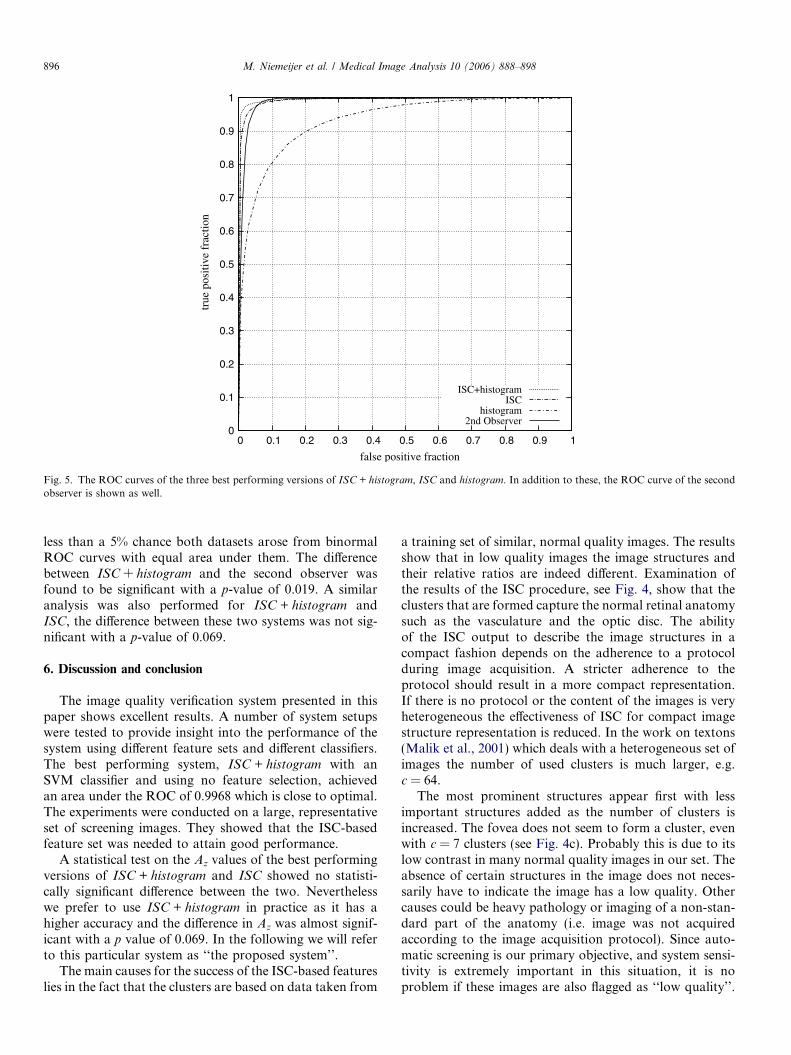
and histogram are given in Fig. 5 together with the resultsof the second observer. Area under the curve of the secondobserver is 0.9893(0.0035) with a 95% confidence interval(0.9803, 0.9944).
As ISC + histogram and the second observer are close toeach other in terms of Az, we performed a univariate z-score test of the difference between the areas under thetwo ROC curves. Here a p-value < 0.05 signifies there is
95% CI Acc.
(0.9934, 0.9985) 0.974
(0.9909, 0.9967) 0.963(0.9851, 0.9936) 0.951(0.9885, 0.9961) 0.958
(0.9854, 0.9940) 0.953(0.9914, 0.9969) 0.954
(0.9779, 0.9894) 0.936(0.9837, 0.9933) 0.950
(0.9178, 0.9471) 0.860
(0.8859, 0.9220) 0.825(0.8855, 0.9217) 0.849(0.9042, 0.9365) 0.844
performance is given in Area under the ROC, Az, with standard deviation
0
0.1
0.2
0.3
0.4
0.5
0.6
0.7
0.8
0.9
1
0 0.1 0.2 0.3 0.4 0.5 0.6 0.7 0.8 0.9 1
true
pos
itive
fra
ctio
n
false positive fraction
ISC+histogramISC
histogram2nd Observer
Fig. 5. The ROC curves of the three best performing versions of ISC + histogram, ISC and histogram. In addition to these, the ROC curve of the secondobserver is shown as well.
896 M. Niemeijer et al. / Medical Image Analysis 10 (2006) 888–898
less than a 5% chance both datasets arose from binormalROC curves with equal area under them. The differencebetween ISC + histogram and the second observer wasfound to be significant with a p-value of 0.019. A similaranalysis was also performed for ISC + histogram andISC, the difference between these two systems was not sig-nificant with a p-value of 0.069.
6. Discussion and conclusion
The image quality verification system presented in thispaper shows excellent results. A number of system setupswere tested to provide insight into the performance of thesystem using different feature sets and different classifiers.The best performing system, ISC + histogram with anSVM classifier and using no feature selection, achievedan area under the ROC of 0.9968 which is close to optimal.The experiments were conducted on a large, representativeset of screening images. They showed that the ISC-basedfeature set was needed to attain good performance.
A statistical test on the Az values of the best performingversions of ISC + histogram and ISC showed no statisti-cally significant difference between the two. Neverthelesswe prefer to use ISC + histogram in practice as it has ahigher accuracy and the difference in Az was almost signif-icant with a p value of 0.069. In the following we will referto this particular system as ‘‘the proposed system’’.
The main causes for the success of the ISC-based featureslies in the fact that the clusters are based on data taken from
a training set of similar, normal quality images. The resultsshow that in low quality images the image structures andtheir relative ratios are indeed different. Examination ofthe results of the ISC procedure, see Fig. 4, show that theclusters that are formed capture the normal retinal anatomysuch as the vasculature and the optic disc. The abilityof the ISC output to describe the image structures in acompact fashion depends on the adherence to a protocolduring image acquisition. A stricter adherence to theprotocol should result in a more compact representation.If there is no protocol or the content of the images is veryheterogeneous the effectiveness of ISC for compact imagestructure representation is reduced. In the work on textons(Malik et al., 2001) which deals with a heterogeneous set ofimages the number of used clusters is much larger, e.g.c = 64.
The most prominent structures appear first with lessimportant structures added as the number of clusters isincreased. The fovea does not seem to form a cluster, evenwith c = 7 clusters (see Fig. 4c). Probably this is due to itslow contrast in many normal quality images in our set. Theabsence of certain structures in the image does not neces-sarily have to indicate the image has a low quality. Othercauses could be heavy pathology or imaging of a non-stan-dard part of the anatomy (i.e. image was not acquiredaccording to the image acquisition protocol). Since auto-matic screening is our primary objective, and system sensi-tivity is extremely important in this situation, it is noproblem if these images are also flagged as ‘‘low quality’’.
M. Niemeijer et al. / Medical Image Analysis 10 (2006) 888–898 897
In a screening setting all low quality images should beexamined by an ophthalmologist.
The ISC output could potentially be used for other pur-poses than image quality detection as well. One could use itas a feature to distinguish different types of medical imagesfrom each other automatically. Or it could be used to lookfor specific patterns in images, for example, in our applica-tion the different clusters could be used to find starting
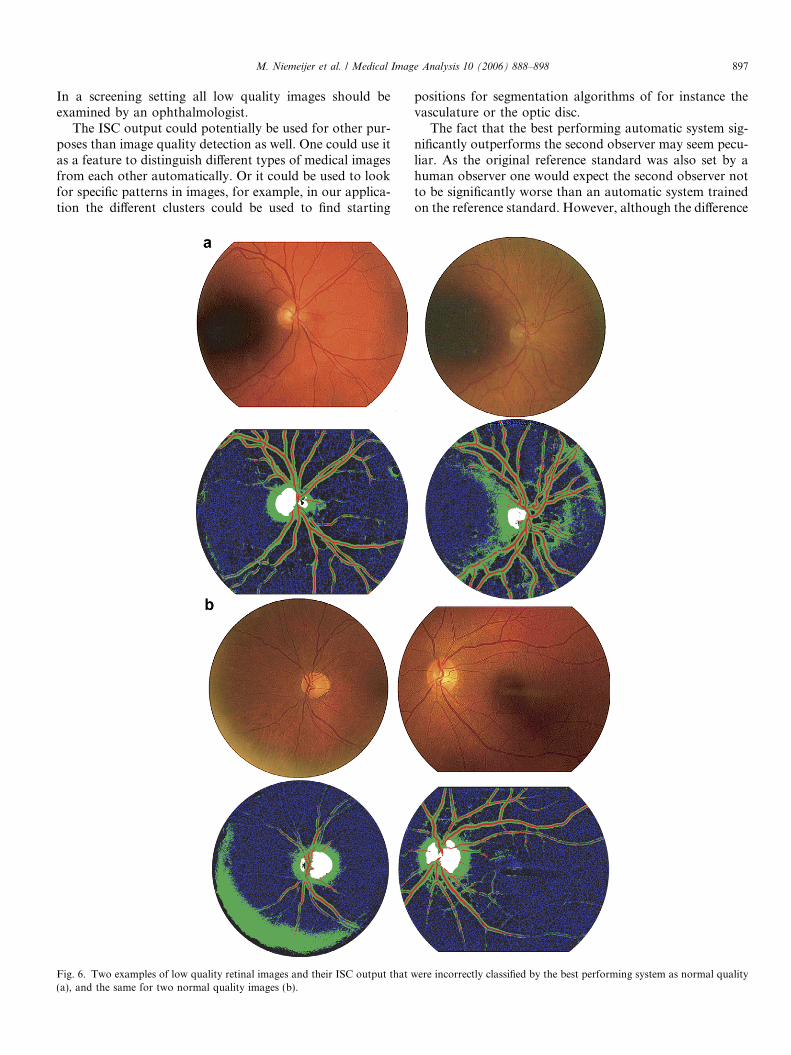
Fig. 6. Two examples of low quality retinal images and their ISC output that w(a), and the same for two normal quality images (b).
positions for segmentation algorithms of for instance thevasculature or the optic disc.
The fact that the best performing automatic system sig-nificantly outperforms the second observer may seem pecu-liar. As the original reference standard was also set by ahuman observer one would expect the second observer notto be significantly worse than an automatic system trainedon the reference standard. However, although the difference
ere incorrectly classified by the best performing system as normal quality

898 M. Niemeijer et al. / Medical Image Analysis 10 (2006) 888–898
is significant it is small and might be explained by the way inwhich the second observer experiment was set up. To plot anROC different operating points of an observer need to beknown. Therefore, the observer was asked to assign eachimage in the test set to one of four classes. The original ref-erence standard only gave one judgment regarding theimage quality, either low or normal. The task assigned tothe observer during the study was therefore different fromthe task of the original reader. When we look at the specificresults given in Table 3 it is clear that the observer has notrouble finding the low quality images as 99.2% of the lowquality images are assigned to the lowest two classes. Forthe normal quality images this is different, as only 67.5%of these images are assigned to the highest two classes.The remaining images are, except 2, all in class 2. This isan indication that had the observer been asked to split theset into normal and low quality images the results couldhave been different and the results would probably be differ-ent. It also indicates that there is a large variation in imagequality amongst the normal quality images in the test set.
Although the best performing system comes close to theoptimal Az of 1, this point is not reached. The attained accu-racy of 0.974 also shows there is still room for improvement.After examination of the false positive (FP) and false nega-tive (FN) results produced by the system (see Fig. 6 forexamples) we noticed that especially images that only exhib-ited low image quality in a localized area of the image weremisclassified. This lead us to perform another experimentwith a system that extracted all the same features as the bestperforming system but then separately from three differentareas in the image. In theory this should allow the systemto better detect images in which only a part of the imagehas low quality. However, the final performance of thesystem measured in Az was slightly worse, although notsignificantly worse with a p value of 0.1389, than that ofthe best performing version of ISC + histogram.
A careful inspection of the cases shown in Fig. 6 allowsus to speculate on what might have caused their misclassi-fication. As we use global histograms as features in our sys-tem if the majority of the image has a good quality (i.e. thecontrast is excellent) local problems can remain undetected(see Fig. 6a). A number of other cases in which this sameproblem occurred were correctly classified, there theRGB features probably allowed the system to detect theproblem. In those cases a disproportionate number of pix-els would have been in the lowest bin of the RGB histo-grams. Fig. 6b shows two normal quality images thatwere incorrectly classified. In these cases low contrast
Table 3Results of Observer II
Class 1 2 3 4
Normal quality images 2 161 122 215Low quality images 448 48 1 3
Classes are numbered 1–4, with 1 signifying low quality and 4 signifyingnormal quality.
caused part of the vascular network to be missed andadded to the background class. The left image also exhibitsa large flash light artifact at the border of the FOV. Thisartifact didn’t cause the ophthalmologists to mark thisimage as low quality however.
The total running time of the system on a new image isapproximately 30 s. The software has not been optimizedextensively and therefore further increases in speed canbe expected.
To summarize, ISC allows for a compact representationof the structures found in an image. Features extractedfrom ISC output significantly improve the classificationperformance of an automatic system for the verificationof retinal image quality. The system does not require anyprevious segmentation of the image in contrast with someprevious work. Image quality is an important problem inlarge scale retinal screening for DR. As such the presentedsystem may prove an essential part of a DR screeningsystem.
References
Abramoff, M., Suttorp-Schulten, M., 2005. Web-based screening fordiabetic retinopathy in a primary care population: the Eye Checkproject. Telemedicine and e-Health 11 (6), 668–674.
Arya, S., Mount, D., Netanyahu, N., Silverman, R., Wu, A., 1998. Anoptimal algorithm for approximate nearest neighbor searching in fixeddimensions. Journal of the ACM 45 (6), 891–923.
Chang, C.-C., Lin, C.-J., 2001. LIBSVM: a library for support vectormachines, software available at http://www.csie.ntu.edu.tw/~cjlin/libsvm.
Duda, R., Hart, P., Stork, D., 2001. Pattern Classification, 2nd ed. JohnWiley and Sons, New York.
Fleming, A., Philip, S., Goatman, K., Olson, J., Sharp, P., 2006.Automated assessment of diabetic retinal image quality based onclarity and field definition. Investigative Opthalmology and VisualSciences 47 (3), 1120–1125.
Jain, A., Zongker, D., 1997. Feature selection: evaluation, application,and small sample performance. IEEE Transactions on PatternAnalysis and Machine Intelligence 19 (2), 153–158.
Klonoff, D., Schwartz, D., 2000. An economic analysis of interventions fordiabetes. Diabetes Care 23 (3), 390–404.
Lalonde, M., Gagnon, L., Boucher, M.-C., 2001. Automatic visual qualityassessment in optical fundus images. In: Proceedings of VisionInterface 2001. Vision Interface.
Lee, S., Wang, Y., 1999. Automatic retinal image quality assessment andenhancement. In: Proceedings of SPIE Image Processing. SPIEConference on Image Processing, pp. 1581–1590.
Lowell, J., Hunter, A., Habib, M., Steel, D., 2005. Automated Quanti-fication of Fundus Image Quality. In: Proceedings of the 3rd EuropeanMedical and Biological Engineering Conference, pp. 1618 (1–5).
Malik, J., Belongie, S., Leung, T., Shi, J., 2001. Contour and textureanalysis for image segmentation. International Journal of ComputerVision 43 (1), 7–27.
Metz, C., 1986. ROC Methodology in radiologic imaging. InvestigativeRadiology 21 (9), 720–733.
Metz, C., Herman, B., Roe, C., 1998. Statistical comparison of two ROCcurve estimates obtained from partially-paired datasets. MedicalDescision Making 18, 110.
Pudil, P., Novovicova, J., Kittler, J., 1994. Floating search methods infeature selection. Pattern Recognition Letters 15 (11), 1119–1125.
ter Haar Romeny, B., 2003. Front-End Vision and Multi-Scale ImageAnalysis, 1st ed. Springer, Dordrecht, The Netherlands.