imaging radar
TRANSCRIPT

8/6/2019 Imaging Radar
http://slidepdf.com/reader/full/imaging-radar 1/45
1
Applications of Satellite Imaging Radar
M.R. Inggs and R.T. Lord
Radar Remote Sensing Group
University of Cape TownSouth Africa

8/6/2019 Imaging Radar
http://slidepdf.com/reader/full/imaging-radar 2/45
2
Presentation Overview
� Synthetic Aperture Radar (SAR) Applications ± On the Oceans
± On the Land
± example: SAR map of Germany
± Palaeodrainage and geological mapping
� Interferometric SAR (InSAR) Applications ± Derivation of Digital Elevation Models (DEMs)
± InSAR for earthquake mapping in South Africa
± Measuring the deflection of the earth's crust
± Recent X-SAR / SRTM mission
� Properties of Digital Elevation Models
� White Sands, New Mexico
� Drakensberg, Lesotho / South Africa

8/6/2019 Imaging Radar
http://slidepdf.com/reader/full/imaging-radar 3/45
3
Overview (continued)
� Along Track Scanning Radiometer (ATSR) Applications� Wind Scatterometer (WSC) Applications
± Ocean Surface Winds
� Global Ozone Monitoring Experiment (GOME)
Applications� Microwave Sounder (MWR) Applications
± Monitoring of the Antarctic Ice Cycle
� Radar Altimeter (RA) Applications
8/6/2019 Imaging Radar
http://slidepdf.com/reader/full/imaging-radar 4/45
4
Overview (continued)
� Coastal Zone Monitoring
± Detection of Oil Spills
� Agriculture
± Agricultural Region in the State of Washington
� Map Compiling and Updating ± Ortho-Rectified Radarsat-SAR Fine Mode Image
� Natural Disasters: Volcanoes
± Guagua Pichincha Volcano
Remote Sensing Applications in the Earth Environment
8/6/2019 Imaging Radar
http://slidepdf.com/reader/full/imaging-radar 5/45
5
Overview (continued)
� Natural Disasters: Earthquakes and Landslides ± Landers Earthquake
� Natural Disasters: Floods
± Flooding on the Yangtze River, China
� Natural Disasters: Hurricanes ± AVHRR Image of Hurricane Floyd
± RADARSAT Image of Hurricane Floyd
� Acknowledgements
8/6/2019 Imaging Radar
http://slidepdf.com/reader/full/imaging-radar 6/45
6
Synthetic Aperture Radar (SAR)
Applications
8/6/2019 Imaging Radar
http://slidepdf.com/reader/full/imaging-radar 7/45
7
On the Oceans
� Detecting and monitoring oil spills.� Ships can be detected and tracked from their wakes.
� Relating radar backscatter from the ocean surface to wind and current fronts,
to eddies, and to internal waves.
� In shallow waters SAR imagery allows inference of bathymetry.
� Deriving the direction of displacement of ocean waves, providing input for wave forecasting and for marine climatology.
� Regional ice monitoring. Information such as ice type and ice concentration
can be derived and open leads detected, which is essential for navigation in
ice-infested waters.

8/6/2019 Imaging Radar
http://slidepdf.com/reader/full/imaging-radar 8/45
8
On the Land
� The ability of SAR to penetrate cloud cover makes it particularly valuable incloudy areas such as the tropics. Image data serve to map and monitor the use
of the land, and are of gaining importance for forestry and agriculture.
� Geological or geomorphological features are enhanced in radar images thanks
to the oblique viewing of the sensor and to its ability to penetrate (to a certain
extent) the vegetation cover.
� SAR data can be used to georeference other satellite imagery to high precision,and to update thematic maps more frequently and cost-effectively, due to its
availability, independent of weather conditions.
� In the aftermath of a flood, the ability of SAR to penetrate clouds is extremely
useful. Here SAR data can help to optimize response initiatives and to assess
damages: NE RSA and Mozambique recently.
� Interferometric SAR (InSAR) can be used, under suitable conditions, to deriveelevation models or to detect small surface movements, of the order of a few
centimeters, caused by earthquakes, landslides or glacier advancement.
8/6/2019 Imaging Radar
http://slidepdf.com/reader/full/imaging-radar 9/45
9
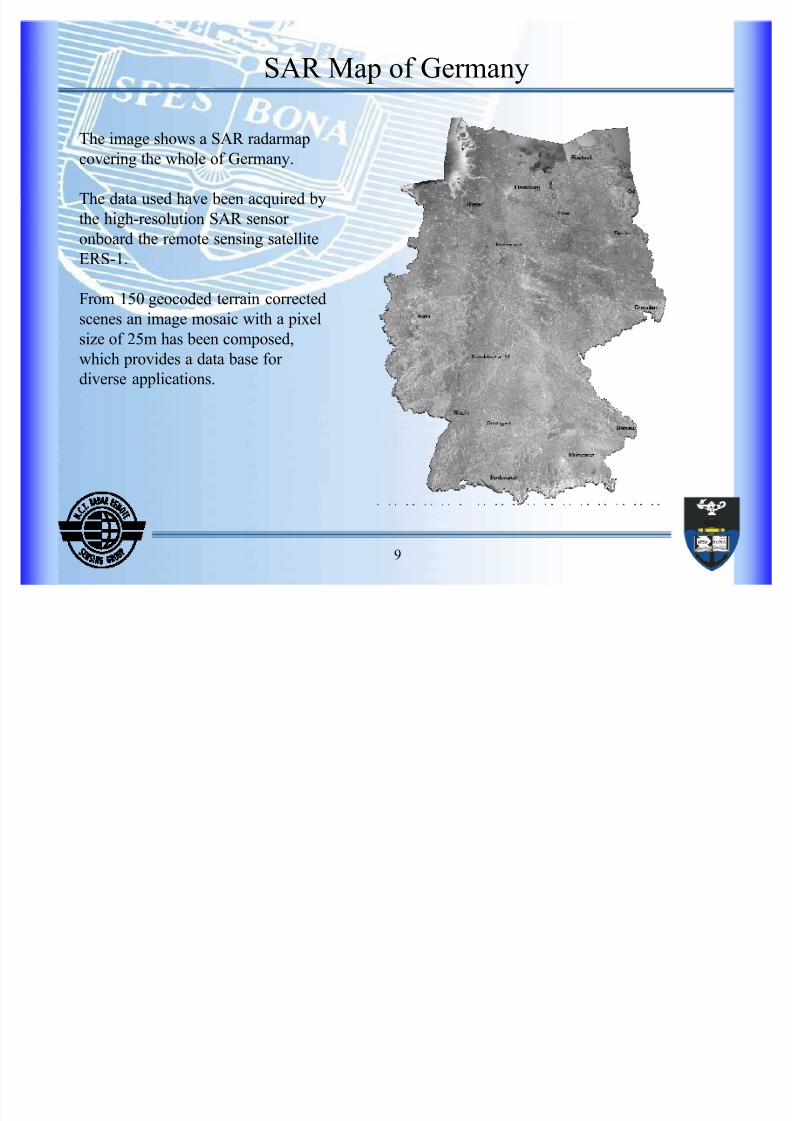
SAR Map of Germany
The image shows a SAR radarmapcovering the whole of Germany.
The data used have been acquired by
the high-resolution SAR sensor
onboard the remote sensing satellite
ERS-1.
From 150 geocoded terrain corrected
scenes an image mosaic with a pixel
size of 25m has been composed,
which provides a data base for
diverse applications.
8/6/2019 Imaging Radar
http://slidepdf.com/reader/full/imaging-radar 10/45
10
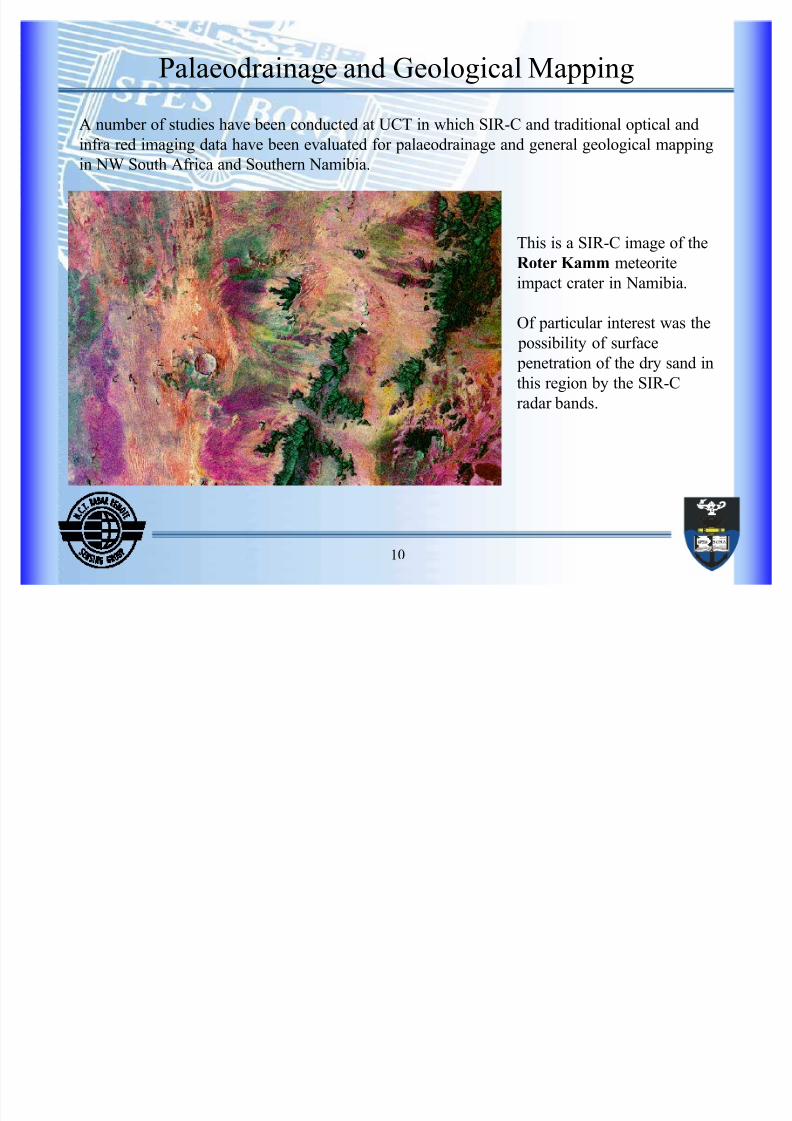
Palaeodrainage and Geological Mapping
A number of studies have been conducted at UCT in which SIR-C and traditional optical and
infra red imaging data have been evaluated for palaeodrainage and general geological mappingin NW South Africa and Southern Namibia.
This is a SIR-C image of the
Roter Kamm meteorite
impact crater in Namibia.
Of particular interest was the
possibility of surface
penetration of the dry sand in
this region by the SIR-C
radar bands.

8/6/2019 Imaging Radar
http://slidepdf.com/reader/full/imaging-radar 11/45
11
Interferometric SAR (InSAR)
Applications
8/6/2019 Imaging Radar
http://slidepdf.com/reader/full/imaging-radar 12/45
12
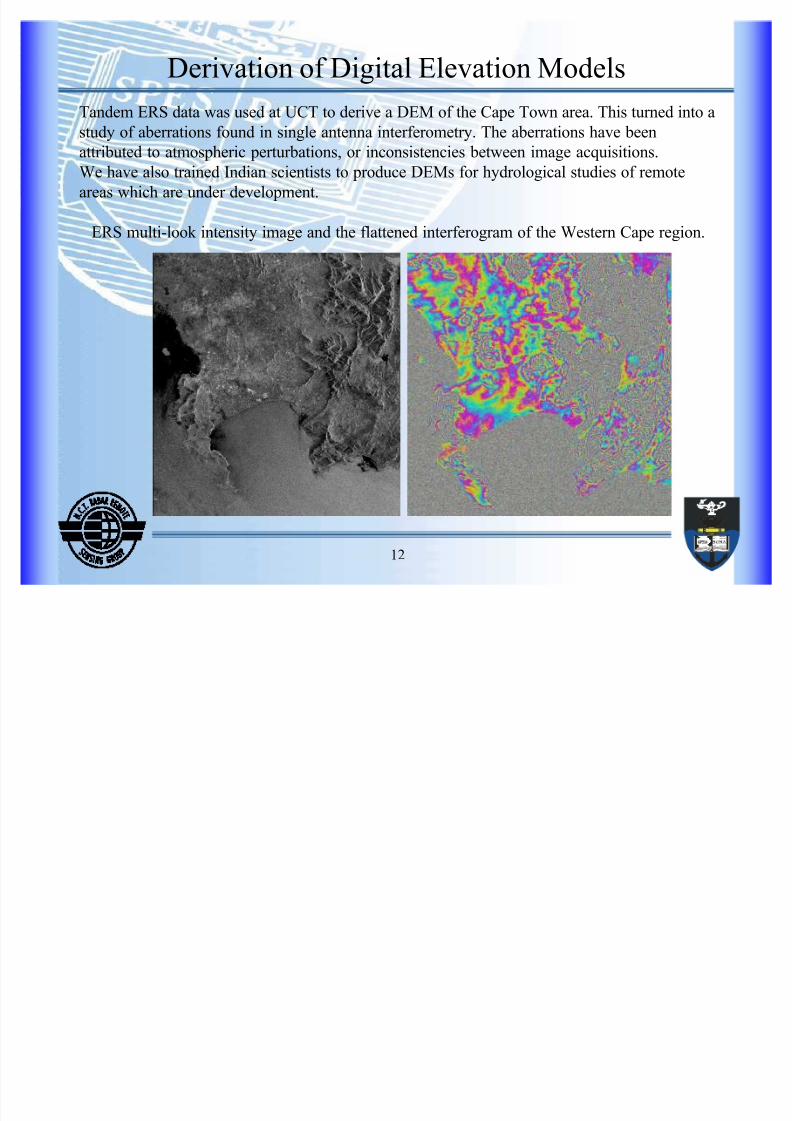
Derivation of Digital Elevation Models
Tandem ERS data was used at UCT to derive a DEM of the Cape Town area. This turned into a
study of aberrations found in single antenna interferometry. The aberrations have beenattributed to atmospheric perturbations, or inconsistencies between image acquisitions.
We have also trained Indian scientists to produce DEMs for hydrological studies of remote
areas which are under development.
ERS multi-look intensity image and the flattened interferogram of the Western Cape region.
8/6/2019 Imaging Radar
http://slidepdf.com/reader/full/imaging-radar 13/45
13
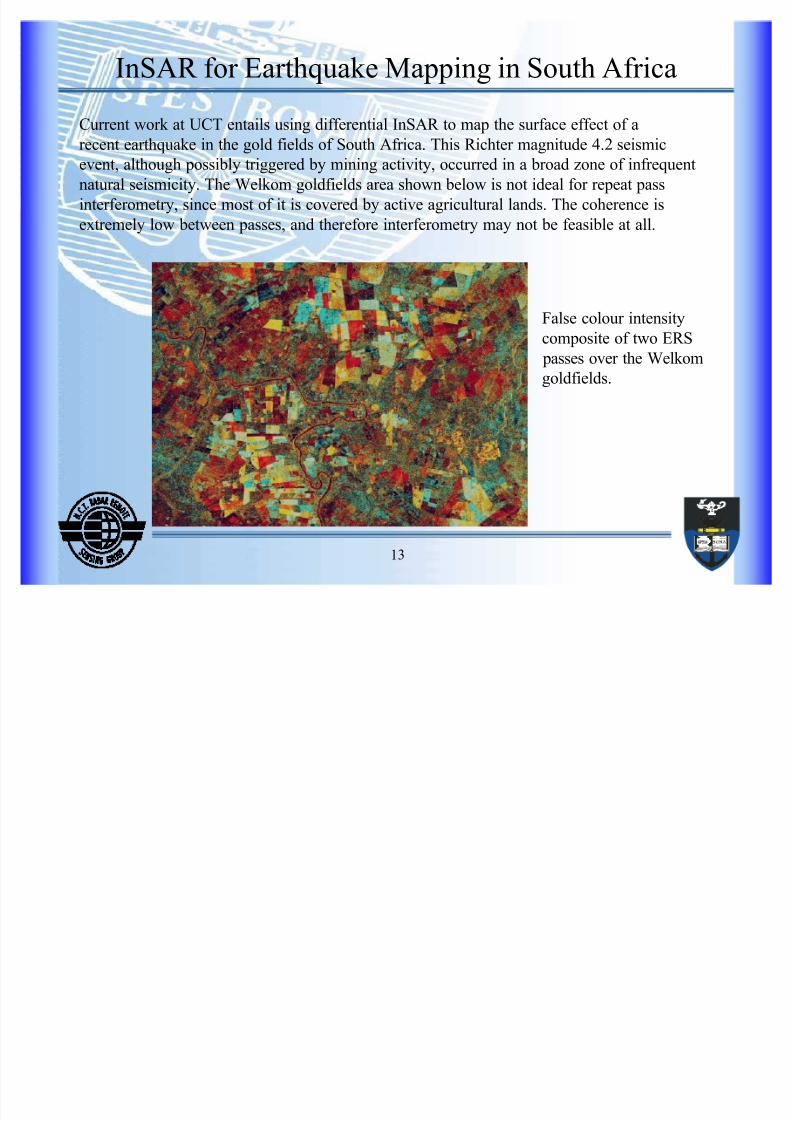
InSAR for Earthquake Mapping in South Africa
False colour intensity
composite of two ERS
passes over the Welkom
goldfields.
Current work at UCT entails using differential InSAR to map the surface effect of a
recent earthquake in the gold fields of South Africa. This Richter magnitude 4.2 seismicevent, although possibly triggered by mining activity, occurred in a broad zone of infrequent
natural seismicity. The Welkom goldfields area shown below is not ideal for repeat pass
interferometry, since most of it is covered by active agricultural lands. The coherence is
extremely low between passes, and therefore interferometry may not be feasible at all.
8/6/2019 Imaging Radar
http://slidepdf.com/reader/full/imaging-radar 14/45
14
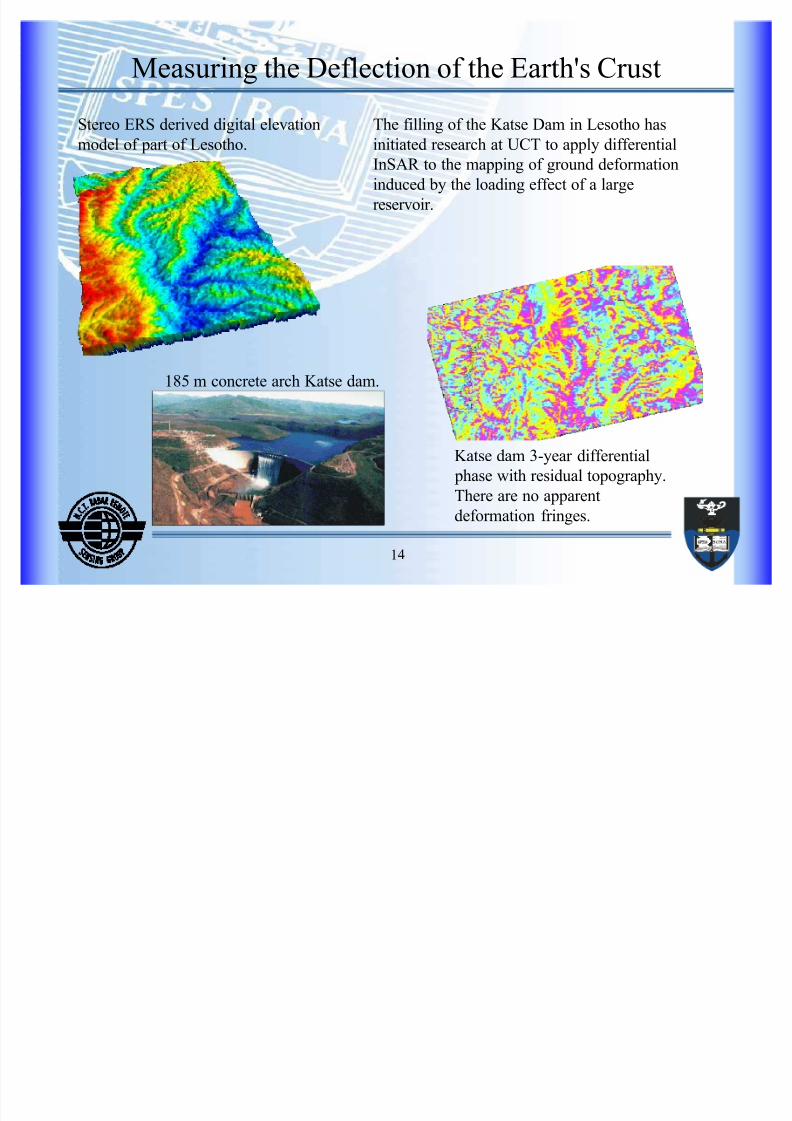
Measuring the Deflection of the Earth's Crust
185 m concrete arch Katse dam.
The filling of the Katse Dam in Lesotho has
initiated research at UCT to apply differentialInSAR to the mapping of ground deformation
induced by the loading effect of a large
reservoir.
Katse dam 3-year differential
phase with residual topography.
There are no apparent
deformation fringes.
Stereo ERS derived digital elevation
model of part of Lesotho.
8/6/2019 Imaging Radar
http://slidepdf.com/reader/full/imaging-radar 15/45
15
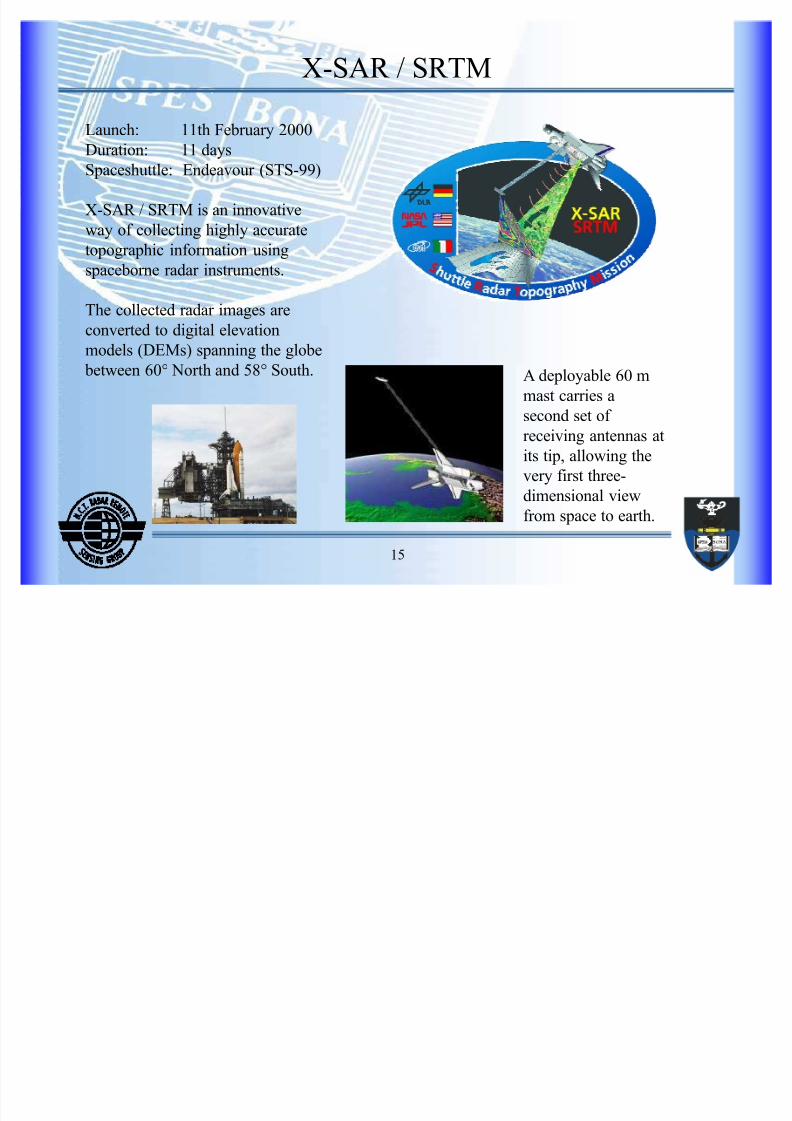
X-SAR / SRTM
Launch: 11th February 2000
Duration: 11 days
Spaceshuttle: Endeavour (STS-99)
X-SAR / SRTM is an innovative
way of collecting highly accurate
topographic information using
spaceborne radar instruments.
The collected radar images are
converted to digital elevation
models (DEMs) spanning the globe
between 60° North and 58° South. A deployable 60 m
mast carries a
second set of receiving antennas at
its tip, allowing the
very first three-
dimensional view
from space to earth.

8/6/2019 Imaging Radar
http://slidepdf.com/reader/full/imaging-radar 16/45
16
Properties of Digital Elevation Models
Single Pass Interferometry
X-SAR / SRTM
Repeat Pass Interferometry
ERS-Tandem
Horiz. Accuracy ca. 20m * ca. 20m *
Vert. Accuracy ca. 4m * ca. 20m *
Horiz. Sampling ** 1" x 1" lat/lon 1" x 1" lat/lon
Vert. Sampling 1m 1m
Projection Geogr. Co-ordinates Geogr. Co-ordinates
Spheroid WGS84 WGS84
Tile Size 15' x 15' lat/lon 15' x 15' lat/lon
Data Format 16 bit signed integer 16 bit signed integer
* accuracy for 66% of the data
** approximately 30m for mid-latitudes
8/6/2019 Imaging Radar
http://slidepdf.com/reader/full/imaging-radar 17/45
17
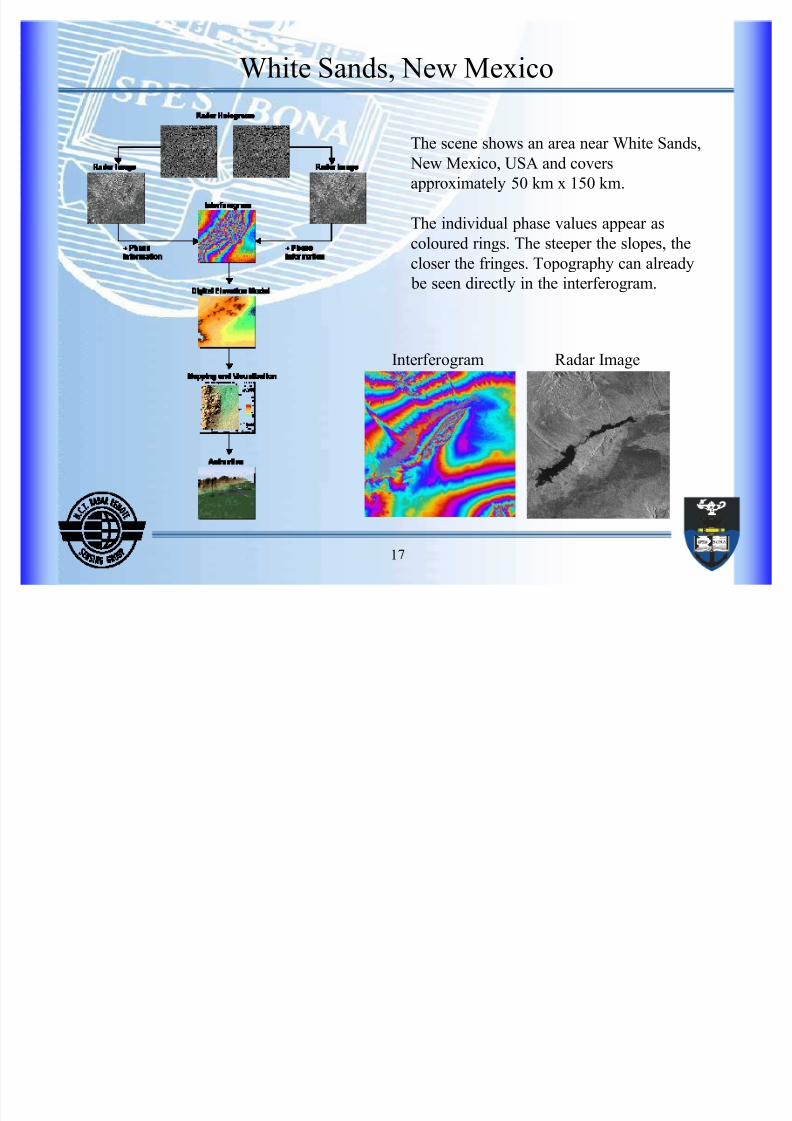
White Sands, New Mexico
The scene shows an area near White Sands, New Mexico, USA and covers
approximately 50 km x 150 km.
The individual phase values appear as
coloured rings. The steeper the slopes, the
closer the fringes. Topography can already
be seen directly in the interferogram.
Interferogram Radar Image
8/6/2019 Imaging Radar
http://slidepdf.com/reader/full/imaging-radar 18/45
18
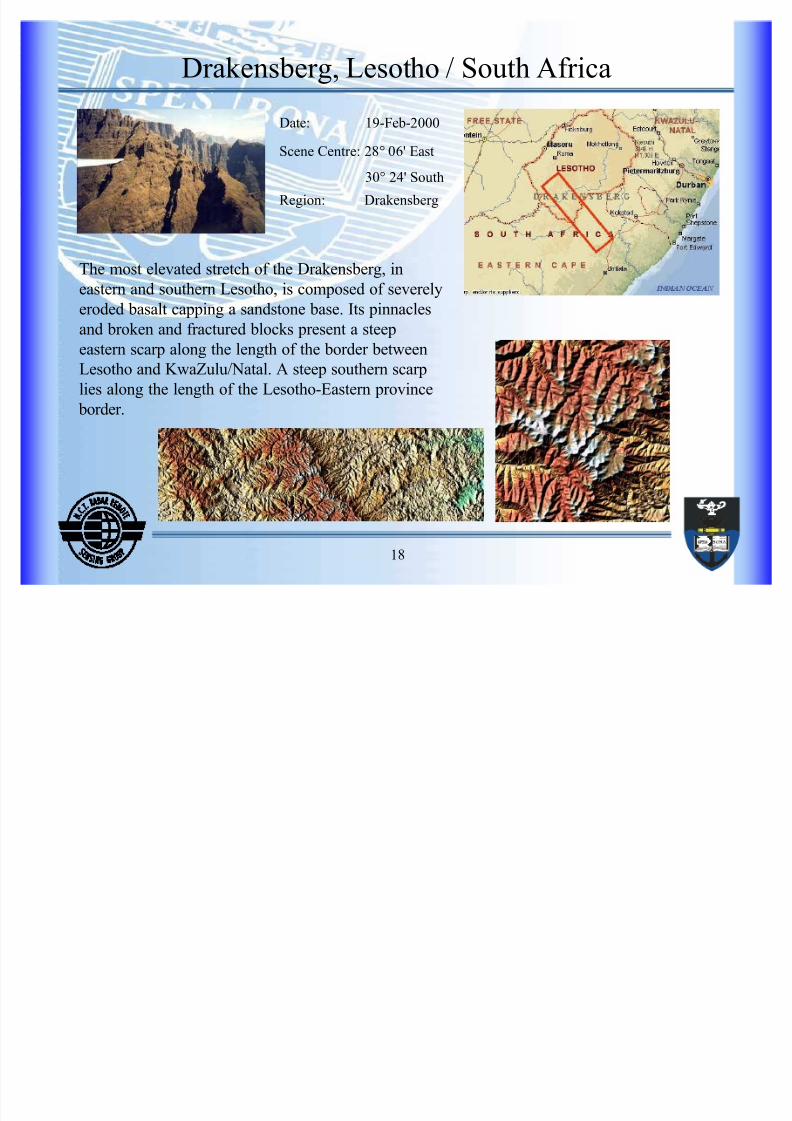
Drakensberg, Lesotho / South Africa
The most elevated stretch of the Drakensberg, in
eastern and southern Lesotho, is composed of severely
eroded basalt capping a sandstone base. Its pinnacles
and broken and fractured blocks present a steep
eastern scarp along the length of the border between
Lesotho and KwaZulu/Natal. A steep southern scarp
lies along the length of the Lesotho-Eastern province
border.
Date: 19-Feb-2000
Scene Centre: 28° 06' East
30° 24' South
Region: Drakensberg

8/6/2019 Imaging Radar
http://slidepdf.com/reader/full/imaging-radar 19/45
19
Along Track Scanning Radiometer
(ATSR) Applications

8/6/2019 Imaging Radar
http://slidepdf.com/reader/full/imaging-radar 20/45
20
ATSR Applications
� Monitoring of agricultural fires and wildfires.
Distribution at global scale and in near real time.
All hot spots (including gas flares) with a temperature higher than 312 K
at night are precisely localised (better that 1 km).
� Volcano monitoring.
� Measuring ocean skin temperatures.

8/6/2019 Imaging Radar
http://slidepdf.com/reader/full/imaging-radar 21/45
21
Wind Scatterometer (WSC)
Applications
8/6/2019 Imaging Radar
http://slidepdf.com/reader/full/imaging-radar 22/45
22
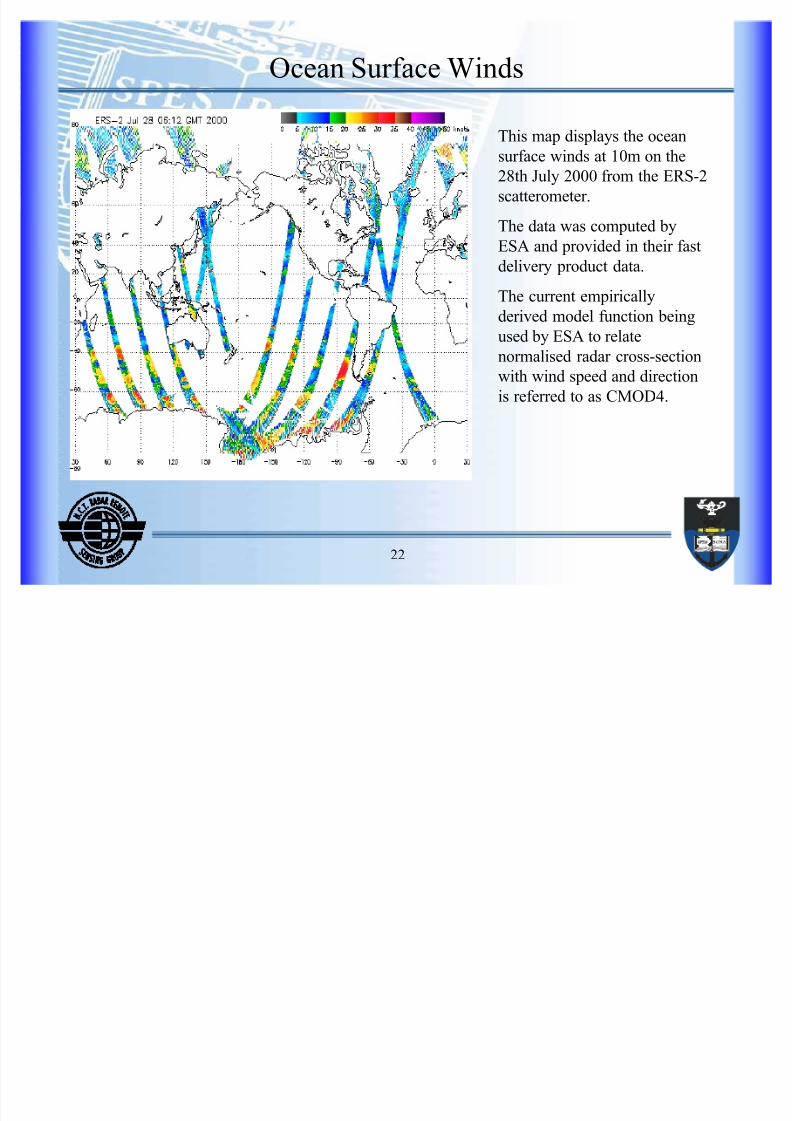
Ocean Surface Winds
This map displays the oceansurface winds at 10m on the
28th July 2000 from the ERS-2
scatterometer.
The data was computed by
ESA and provided in their fast
delivery product data.
The current empirically
derived model function being
used by ESA to relate
normalised radar cross-section
with wind speed and direction
is referred to as CMOD4.

8/6/2019 Imaging Radar
http://slidepdf.com/reader/full/imaging-radar 23/45
23
Global Ozone Monitoring Experiment
(GOME) Applications

8/6/2019 Imaging Radar
http://slidepdf.com/reader/full/imaging-radar 24/45
24
GOME Applications
� Atmospheric ozone and NO2 global monitoring have been going on sinceGOME products became available (July 1996).
� Additional applications could stem from on-going scientific studies as GOME
data can be used also for retrieving other trace gases relevant to the ozone
chemistry as well as other atmospheric constituents and climatic variables like
clouds, aerosols and solar index, crucial for assessing climatic change.
8/6/2019 Imaging Radar
http://slidepdf.com/reader/full/imaging-radar 25/45
25
Microwave Sounder (MWR)
Applications
8/6/2019 Imaging Radar
http://slidepdf.com/reader/full/imaging-radar 26/45
26
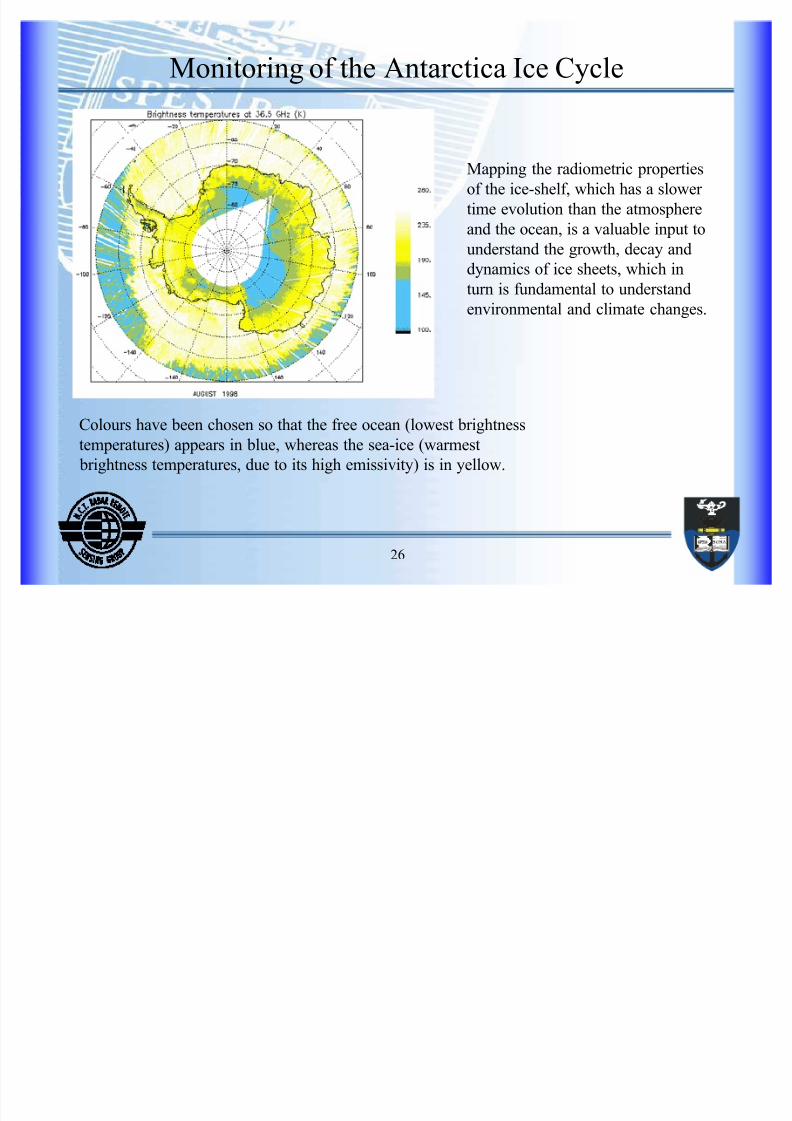
Monitoring of the Antarctica Ice Cycle
Colours have been chosen so that the free ocean (lowest brightness
temperatures) appears in blue, whereas the sea-ice (warmest
brightness temperatures, due to its high emissivity) is in yellow.
Mapping the radiometric properties
of the ice-shelf, which has a slower
time evolution than the atmosphere
and the ocean, is a valuable input to
understand the growth, decay and
dynamics of ice sheets, which in
turn is fundamental to understand
environmental and climate changes.
8/6/2019 Imaging Radar
http://slidepdf.com/reader/full/imaging-radar 27/45
27
Radar Altimeter (RA)
Applications

8/6/2019 Imaging Radar
http://slidepdf.com/reader/full/imaging-radar 28/45
28
Radar Altimeter Applications
� Measuring the marine geoid
� Measuring sea state
� Measuring the topography of the
oceans

8/6/2019 Imaging Radar
http://slidepdf.com/reader/full/imaging-radar 29/45
29
Remote Sensing Applications
in theEarth Environment

8/6/2019 Imaging Radar
http://slidepdf.com/reader/full/imaging-radar 30/45
30
Coastal Zone Monitoring

8/6/2019 Imaging Radar
http://slidepdf.com/reader/full/imaging-radar 31/45
31
Detection of Oil Spills
© Canadian Space Agency, 1996
The ³Sea Empress´, a 147,000 ton supertanker, ran
aground on rocks in the south of Wales, on theevening of February 15th, 1996. Seven days later,
RADARSAT captured this image, clearly delineating
the remaining oil slick. Size, location and disperse-
ment of the oil spill can be conveniently determined
using this type of imagery. The spill appears on the
image in black tones
(A) Oil, which floats on the top of water, suppresses the ocean's capillary waves, creating a
surface smoother than the surrounding water. This smoother surface appears dark in the radar
image.
(B) The discharge from the Tywi River is keeping the immediate shore clear.
(C) The slick is extending south into the Bay.
(D) The potential impact of the oil lessens as the spill starts to emulsify (break-down) and
clean-up efforts begin to take effect.
8/6/2019 Imaging Radar
http://slidepdf.com/reader/full/imaging-radar 32/45
32
Agriculture
8/6/2019 Imaging Radar
http://slidepdf.com/reader/full/imaging-radar 33/45
33
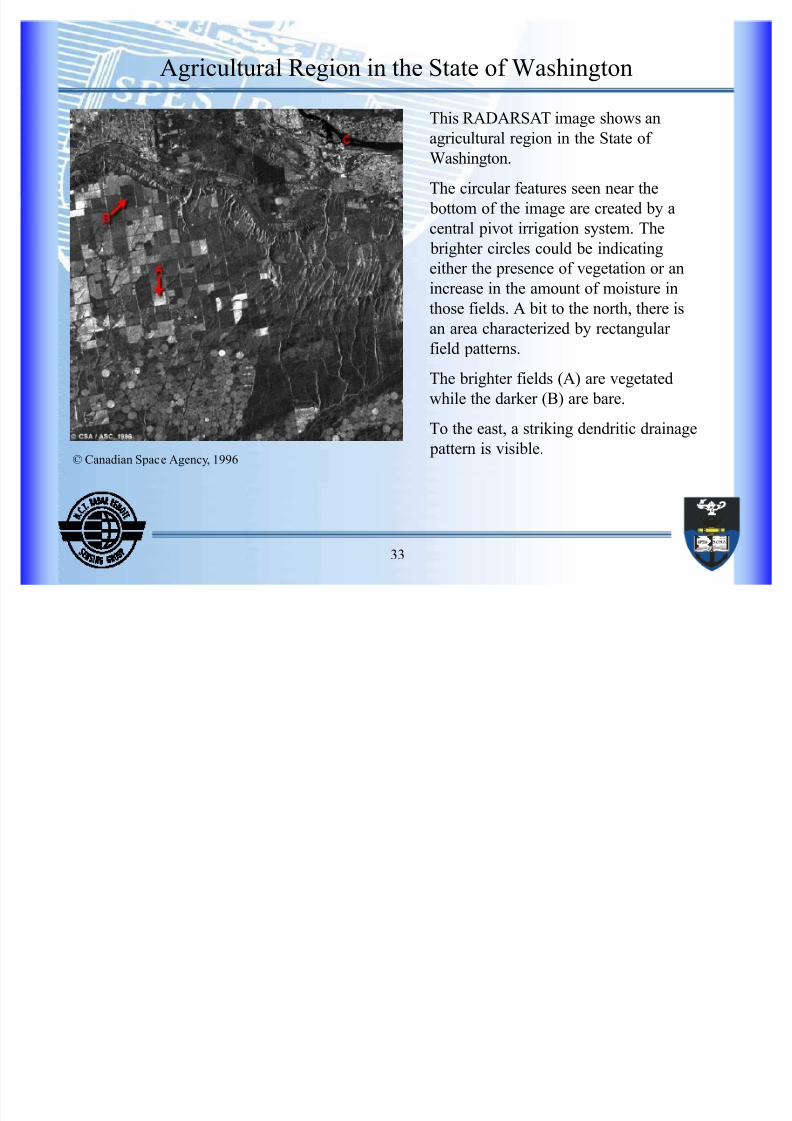
Agricultural Region in the State of Washington
© Canadian Space Agency, 1996
This RADARSAT image shows an
agricultural region in the State of Washington.
The circular features seen near the
bottom of the image are created by a
central pivot irrigation system. The
brighter circles could be indicating
either the presence of vegetation or an
increase in the amount of moisture in
those fields. A bit to the north, there is
an area characterized by rectangular
field patterns.
The brighter fields (A) are vegetated
while the darker (B) are bare.
To the east, a striking dendritic drainage
pattern is visible.

8/6/2019 Imaging Radar
http://slidepdf.com/reader/full/imaging-radar 34/45
34
Map Compiling and Updating

8/6/2019 Imaging Radar
http://slidepdf.com/reader/full/imaging-radar 35/45
35
RADARSAT Image: Courtesy of CSA, 1996
Ortho-Rectified Radarsat-SAR Fine Mode Image
� Main Streets in red
� Secondary Roads in blue
� City Streets in white

8/6/2019 Imaging Radar
http://slidepdf.com/reader/full/imaging-radar 36/45
36
Natural Disasters: Volcanoes

8/6/2019 Imaging Radar
http://slidepdf.com/reader/full/imaging-radar 37/45
37
Guagua Pichincha Volcano
© Canadian Space Agency, 1999
Radarsat Image of Guagua
Pichincha Volcano near Quito,Ecuador.
Red: April 18, 1999
Green: March 25, 1999
Blue: Coherence March-April
Satellite images are revealingthe growth of a lava dome. The
appearance of such a new lava
dome is significant because
(1) it signals the presence of
new magma within the volcano
and
(2) dome growth at volcanoessuch as Guagua Pichincha is
typically accompanied by
explosive activity.

8/6/2019 Imaging Radar
http://slidepdf.com/reader/full/imaging-radar 38/45
38
Natural Disasters:
Earthquakes and Landslides

8/6/2019 Imaging Radar
http://slidepdf.com/reader/full/imaging-radar 39/45
39
Landers Earthquake
(a) Observed interferogram calculated from
ERS-1 SAR images taken before (April 24,1992) and after (June 18, 1993) the
earthquake. Each fringe in parts a, b and c
denotes 28 mm of change in range.
The asymmetry between the two sides of the
fault is due to the curvature of the fault and
the geometry of the radar. Black lines denotethe surface rupture mapped in the field. The
altitude of ambiguity is 220 m.
(b) Modeled interferogram with black lines
denoting fault patches included in the elastic
dislocation model.
(c) Residual (observed minus modeled)interferogram.
(d) Radar brightness (amplitude) image.

8/6/2019 Imaging Radar
http://slidepdf.com/reader/full/imaging-radar 40/45
40
Natural Disasters: Floods
8/6/2019 Imaging Radar
http://slidepdf.com/reader/full/imaging-radar 41/45
41
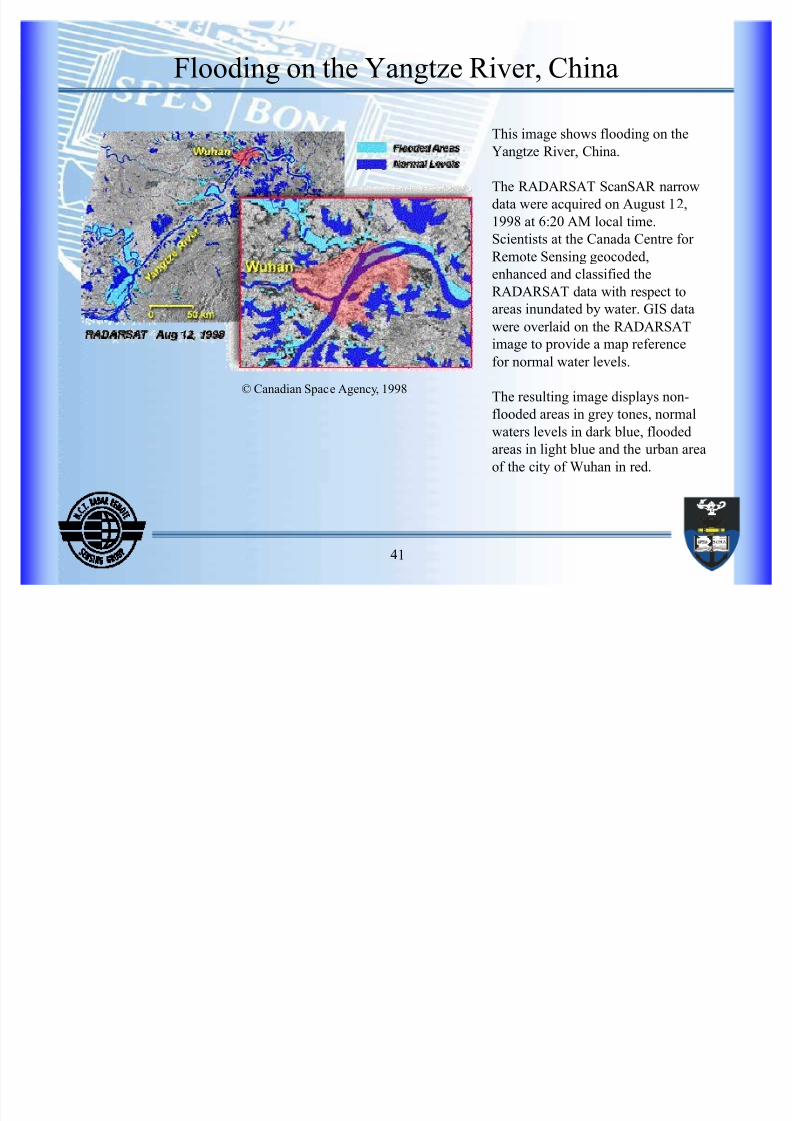
Flooding on the Yangtze River, China
This image shows flooding on the
Yangtze River, China.
The RADARSAT ScanSAR narrow
data were acquired on August 12,
1998 at 6:20 AM local time.
Scientists at the Canada Centre for
Remote Sensing geocoded,
enhanced and classified the
RADARSAT data with respect to
areas inundated by water. GIS data
were overlaid on the RADARSAT
image to provide a map reference
for normal water levels.
The resulting image displays non-
flooded areas in grey tones, normalwaters levels in dark blue, flooded
areas in light blue and the urban area
of the city of Wuhan in red.
© Canadian Space Agency, 1998

8/6/2019 Imaging Radar
http://slidepdf.com/reader/full/imaging-radar 42/45
42
Natural Disasters: Hurricanes
8/6/2019 Imaging Radar
http://slidepdf.com/reader/full/imaging-radar 43/45
43
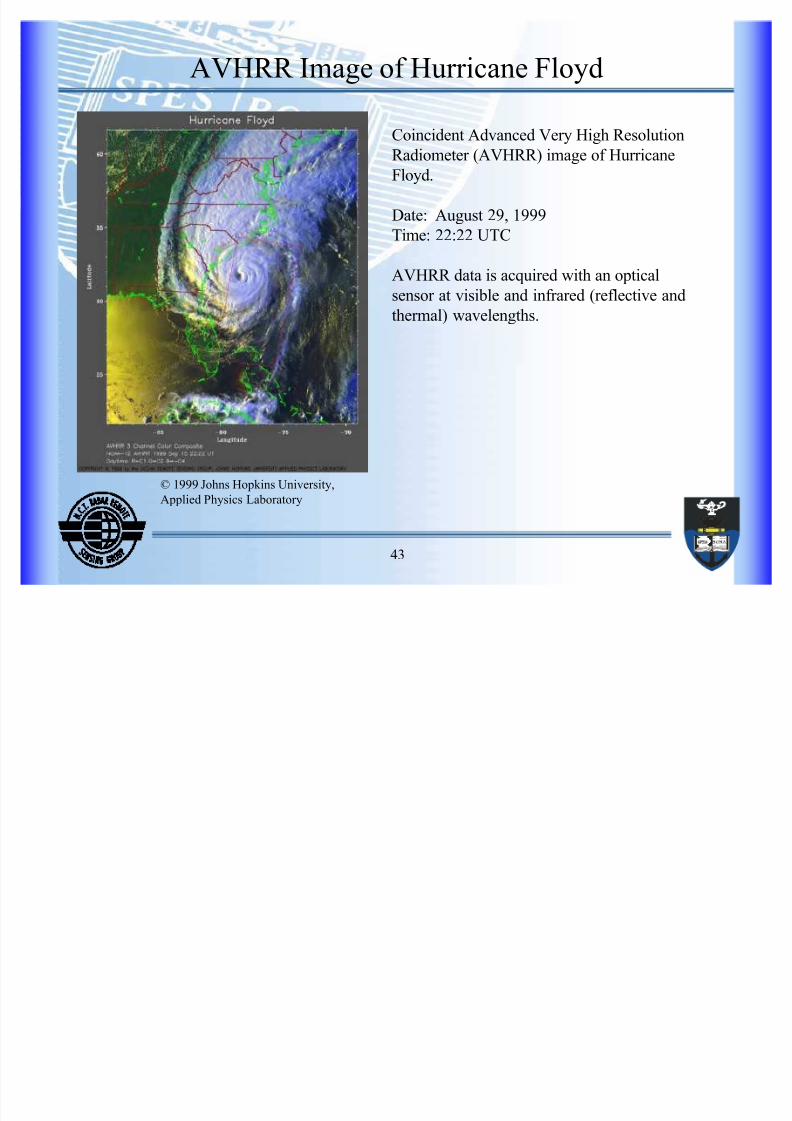
AVHRR Image of Hurricane Floyd
© 1999 Johns Hopkins University,
Applied Physics Laboratory
Coincident Advanced Very High Resolution
Radiometer (AVHRR) image of Hurricane
Floyd.
Date: August 29, 1999
Time: 22:22 UTC
AVHRR data is acquired with an opticalsensor at visible and infrared (reflective and
thermal) wavelengths.
8/6/2019 Imaging Radar
http://slidepdf.com/reader/full/imaging-radar 44/45
44
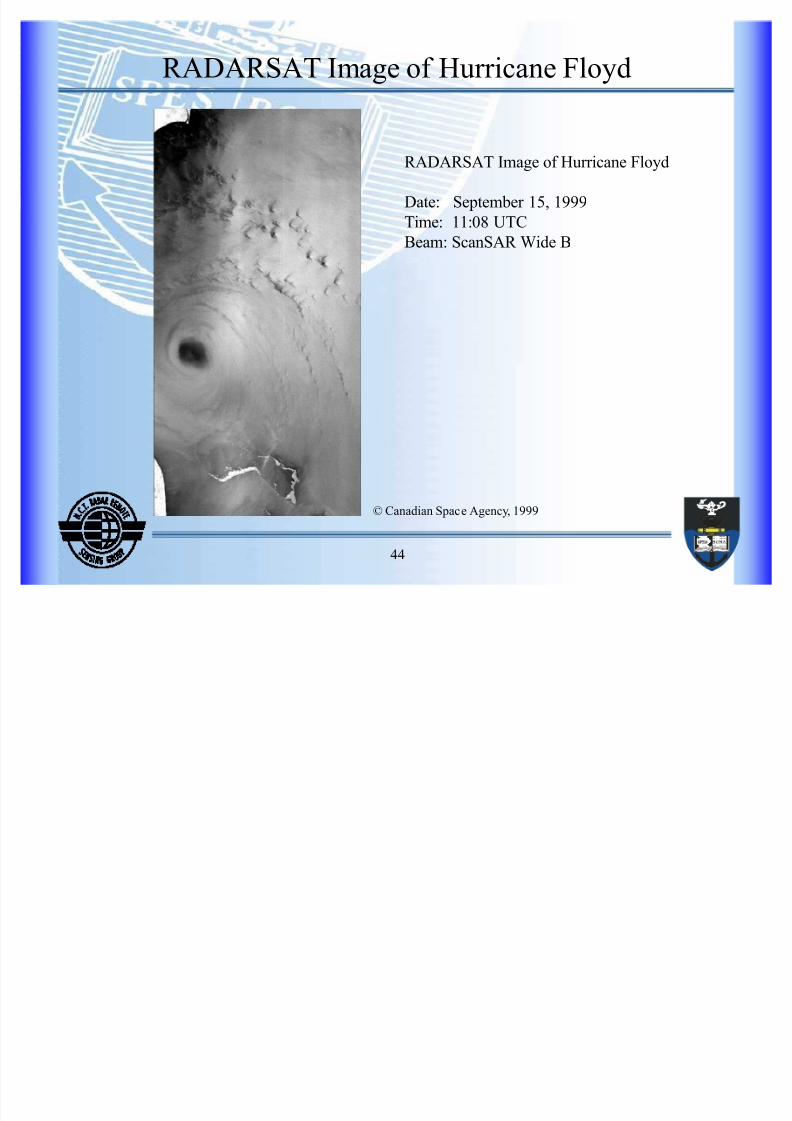
RADARSAT Image of Hurricane Floyd
RADARSAT Image of Hurricane Floyd
Date: September 15, 1999
Time: 11:08 UTC
Beam: ScanSAR Wide B
© Canadian Space Agency, 1999
8/6/2019 Imaging Radar
http://slidepdf.com/reader/full/imaging-radar 45/45
45
Acknowledgements
� ESA Earth Remote Sensing Home Page: http://earth.esa.int/
� Canada Centre for Remote Sensing: http://www.ccrs.nrcan.gc.ca/
� The German Remote Sensing Data Center: http://www.dfd.dlr.de/
� The NASA/JPL Imaging Radar Home Page: http://southport.jpl.nasa.gov/
� Remote Sensing Platforms and Sensors:
http://quercus.art.man.ac.uk/rs/sat_list.cfm
� Radar Remote Sensing Group UCT Home Page: http://rrsg.ee.uct.ac.za/