immunohematology -...
TRANSCRIPT

Volu m e 27, Nu m be r 1, 2011
Immunohematology


37 Instruct Ions for Authors
ImmunohematologyVolume 27, Number 1, 2011
C O N T EN TS
1 cAse report
Performance of an automated solid-phase red cell adherence system compared with that of a manual gel microcolumn assay for the identification of antibodies eluted from red blood cellsR.H. Finck, R.J. Davis, S. Teng, D. Goldfinger, A.F. Ziman, Q. Lu, and S. Yuan
25 cAse report
Molecular RH blood group typing of serologically D–/CE+ donors: the use of a polymerase chain reaction–sequence-specific primer test kit with pooled samplesD. Londero, M. Fiorino, V. Miotti, and V. De Angelis
6 cAse report
Serologic and molecular characterization of D variants in Brazilians: impact for typing and transfusion strategyD.C. Credidio, J. Pellegrino Jr., and L. Castilho
12 cAse report
Red blood cell phenotype matching for various ethnic groupsK.S.W. Badjie, C. Tauscher, C. Van Buskirk, C. Wong, S. Jenkins, C. Smith, and J.R. Stubbs
20 cAse report
Weak D type 42 cases found in individuals of European descentM. St-Louis, M. Richard, M. Côté, C. Éthier, and A. Long
29 communIcAt Ion
ErratumVol. 26, No. 4, 2010, p. 164
30 Announcements
31 Advert Isements

Immunohematology is published quarterly (March, June, September, and December) by the American Red Cross, National Headquarters, Washington, DC 20006.
Immunohematology is indexed and included in Index Medicus and MEDLINE on the MEDLARS system. The contents are also cited in the EBASE/Excerpta Medica and Elsevier
BIOBASE/Current Awareness in Biological Sciences (CABS) databases.
The subscription price is $40.00 (U.S.) and $50.00 (foreign) per year.
Subscriptions, Change of Address, and Extra Copies:
Immunohematology, P.O. Box 40325 Philadelphia, PA 19106
Or call (215) 451-4902
Web site: www.redcross.org/immunohematology
Copyright 2011 by The American National Red Cross ISSN 0894-203X
edItor- In-chIef
Sandra Nance, MS, MT(ASCP)SBBPhiladelphia, Pennsylvania
mAnAgIng edItor
Cynthia Flickinger, MT(ASCP)SBBPhiladelphia, Pennsylvania
senIor medIcAl edItor
Geralyn M. Meny, MDPhiladelphia, Pennsylvania
technIcAl edItors
Christine Lomas-Francis, MScNew York City, New York
Dawn M. Rumsey, ART (CSMLT)Glen Allen, Virginia
Assoc IAte medIcAl edItors
David Moolten, MDPhiladelphia, Pennsylvania
Ralph R. Vassallo, MDPhiladelphia, Pennsylvania
edItor IAl AssIstAnt
Sheetal Patel
copy edItor
Mary L. Tod
proofreAder
Lucy Oppenheim
product Ion AssIstAnt
Marge Manigly
electronIc publ Isher
Paul Duquette
edItor IAl boArd
Patricia Arndt, MT(ASCP)SBBPomona, California
James P. AuBuchon, MDSeattle, Washington
Martha R. Combs, MT(ASCP)SBBDurham, North Carolina
Geoffrey Daniels, PhDBristol, United Kingdom
Anne F. Eder, MDWashington, District of Columbia
George Garratty, PhD, FRCPathPomona, California
Brenda J. Grossman, MDSt. Louis, Missouri
Christine Lomas-Francis, MScNew York City, New York
Gary Moroff, PhDRockville, Maryland
John J. Moulds, MT(ASCP)SBBShreveport, Louisiana
Paul M. Ness, MDBaltimore, Maryland
Joyce Poole, FIBMSBristol, United Kingdom
Mark Popovsky, MDBraintree, Massachusetts
Marion E. Reid, PhD, FIBMSNew York City, New York
S. Gerald Sandler, MDWashington, District of Columbia
Jill R. Storry, PhD Lund, Sweden
David F. Stroncek, MDBethesda, Maryland
emerItus edItor
Delores Mallory, MT(ASCP) SBBSupply, North Carolina
on our cover
Casal Em Verde by Ismael Nery
Ismael Nery was a 20th century Brazilian artist of Dutch, Native-Brazilian, and African heritage. Also a poet and an architect, he focused extensively on the human figure in his paintings. His oil on canvas, Casal Em Verde (Couple in Green), is featured on the cover of this issue of Immunohematology. The subject of the work and its dominant color, which suggests growth and fertility, are doubly relevant, as the issue includes Castilho’s report on D variants in a Brazilian population.
DaViD moolteN, mD

IMMUNOHEMATOLOGY, Volume 27, Number 1, 2011 1
Performance of an automated solid-phase red cell adherence system compared with that of a manual gel microcolumn assay for the identification of antibodies eluted from red blood cellsR.H. Finck, R.J. Davis, S. Teng, D. Goldfinger, A.F. Ziman, Q. Lu, and S. Yuan
IgG antibodies coating red blood cells (RBCs) can be removed by elution procedures and their specificity determined by antibody identification studies. Although such testing is traditionally performed using the tube agglutination assay, prior studies have shown that the gel microcolumn (GMC) assay may also be used with comparable results. The purpose of this study was to compare an automated solid-phase red cell adherence (SPRCA) system with a GMC assay for the detection of antibodies eluted from RBCs. Acid eluates from 51 peripheral blood (PB) and 7 cord blood (CB) samples were evaluated by both an automated SPRCA instrument and a manual GMC assay. The concordance rate between the two systems for peripheral RBC samples was 88.2 percent (45 of 51), including cases with alloantibodies (n = 8), warm autoantibodies (n = 12), antibodies with no identifiable specificity (n = 2), and negative results (n = 23). There were six discordant cases, of which four had alloantibodies (including anti-Jka, -E, and -e) demonstrable by the SPRCA system only. In the remaining 2 cases, anti-Fya and antibodies with no identifiable specificity were demonstrable by the GMC assay only. All seven CB specimens produced concordant results, showing anti-A (n = 3), -B (n = 1), maternal anti-Jka (n = 2), or a negative result (n = 1). Automated SPRCA technology has a performance that is comparable with that of a manual GMC assay for identifying antibodies eluted from PB and CB RBCs. Immunohematology 2011;27:1–5.
Key Words: elution, RBC antibody identification, acid eluate, SPRCA assay, GMC assay
The direct antiglobulin test (DAT) is often performed in the evaluation of patients with suspected immune-mediated hemolysis to detect the presence of immunoglobulin or complement proteins bound to the surface of a patient’s red blood cells (RBCs). A positive result obtained using antisera specific for IgG indicates that IgG antibodies are bound to the patient’s RBCs. These antibodies can be eluted from the patient’s RBCs by a variety of procedures. Their specificity can then be deduced by performing antibody identification studies using a panel of reagent RBCs of known phenotypes.
Gel microcolumn (GMC) and solid-phase red cell adherence (SPRCA) systems are being used in the transfusion laboratory for an increasing number of serologic testing applications, including antibody detection and identification.1 Generally, both methods have shown similar or better sensitivity and specificity when compared with traditional tube testing.2–6 They offer many practical advantages to the transfusion laboratory. Both require smaller sample and reagent volumes, involve less-subjective interpretation, and yield stable results, which facilitate consultation and secondary review. Importantly, these methods also offer a significant advantage in terms of their potential for automation.
It has been previously demonstrated that the GMC assay achieves results comparable with those of the tube agglutination method in identifying antibodies eluted from RBCs.7,8 However, to our knowledge, there has been only a single study from 1997 reporting the utility of the SPRCA system for this application.9 Although the SPRCA system is routinely used for identifying antibodies in plasma samples, there are significant differences between these samples and acid eluates in terms of antibody concentration and the presence of additional plasma proteins. These factors may influence the sensitivity and specificity of antibody identification studies. Therefore, a formal evaluation of the SPRCA system’s performance in this capacity is warranted. We compared the ability of an automated SPRCA system to identify antibodies eluted from RBCs with that of a manual GMC assay.
Materials and Methods
Study DesignThis study protocol was approved by the University of
California, Los Angeles, institutional review board.
Case RepoRt

2 IMMUNOHEMATOLOGY, Volume 27, Number 1, 2011
R.H. Finck et al.
We prepared acid eluates when indicated from patient samples collected during the study period, which began in March 2009 and concluded in October 2009. Antibody identification studies were performed on each eluate using both an automated SPRCA system (ECHO, Capture-R Ready ID, Immucor, Norcross, GA) and a manual GMC system (ID-Micro Typing IgG gel cards, Ortho Clinical Diagnostics, Raritan, NJ). Results from each method were recorded and compared.
Sample InclusionAt our institution, a direct antiglobulin test (DAT)
may be performed as part of RBC antibody identification, a transfusion reaction investigation, evaluation for possible immune-mediated hemolytic anemia, or per protocol on cord blood specimens of newborns at risk for hemolytic disease of the fetus and newborn (HDFN). If the DAT demonstrates the presence of IgG coating the patient’s RBCs, acid eluates may be prepared from these samples under the following circumstances: (1) a first-time positive result, (2) an increase in the strength, compared with a previous result, and (3) when there is clinical suspicion for immune-mediated hemolysis. Following these criteria, all 51 acid eluates prepared from peripheral blood patient samples during the 7-month study period were included. To evaluate the performance of both assays with eluates prepared from cord blood specimens, we also included seven cord blood samples from neonates who were considered at risk for HDFN.
Performance of DAT by Tube AgglutinationDATs were performed by tube agglutination according
to manufacturer’s instructions.10 For a peripheral blood sample, the DAT was performed first with a polyspecific antiglobulin reagent. If positive, then the DAT was performed with monospecific anti-human IgG and anti-C3b, C3d reagents. For a cord blood sample, the DAT was performed with monospecific anti-human IgG only (Immucor).
Preparation of EluatesEluates were prepared using a commercially available
kit (Elu-kit II, Immucor) according to the manufacturer’s instructions.11 Briefly, an aliquot of the patient’s RBCs was serially washed, once with saline and four times with a low-ionic strength wash solution. A sample of the supernatant from the last washing step (last wash) was set aside for control testing to confirm the complete removal of unbound antibodies by washing. The washed RBCs were then mixed with an equal volume of an acidic glycine solution and centrifuged. The resulting supernatant containing the dissociated antibodies was then treated with a buffering
solution to adjust its pH. The eluate was centrifuged once more to remove any precipitate or cell debris.
Identification of Antibodies in Eluates by an Automated SPRCA System
To identify antibodies present in the eluates, the “Antibody Identification” program was selected on the ECHO instrument. Commercially available testing strip sets (Capture-R Ready-ID, Immucor) were used. Each set contains a total of 16 microwells, 14 of which are coated with membranes from group O reagent RBC of known phenotypes. The last two microwells serve as positive and negative controls. For each eluate tested, the last wash was also tested concurrently under the same procedural settings. The instrument added 50 µL of the eluate or last wash to each microwell. One hundred microliters of Capture LISS (Immucor) was then added to each microwell. Automatically, the instrument incubated the strips at 38° ± 0.4°C for 15 minutes and washed the microwells. It then added indicator RBCs to each microwell, centrifuged the test strips, and graded the degree of indicator RBC adherence (0 to 4+).
For cord blood samples, the testing strips that were used depended on the clinical scenario. In instances of non–blood group O neonates born to group O mothers with negative antibody screens, anti-A or anti-B was expected in eluates prepared from these samples. Therefore, testing strips with microwells coated with group A1 and group B RBCs had to be created to detect these antibodies. This was achieved using the “IgG Crossmatch” program on the ECHO instrument. Aliquots of eluate samples (1 mL) were first loaded as “recipient” samples onto the instrument. Aliquots (with a minimal volume of 250 µL) of RBCs obtained from the segments of donor units confirmed to be blood type A1 or B were loaded as the “donor” samples. These RBCs were diluted by the instrument with saline to create 2 to 4% RBC suspensions. The instrument then created the necessary customized microwells by adding 50 µL of the 2 to 4% RBC suspension to coat the empty microwells in test strips (Capture-R Select, Immucor) after centrifuging for 2 minutes. As previously described, 50 µL of either eluate or last wash and 100 µL of Capture LISS were then added to the microwells to allow for antibody identification. The test strips were automatically incubated at 38° ± 0.4°C for 15 minutes and washed, and indicator RBCs were added. After centrifugation, the ECHO instrument graded the degree of indicator RBC adherence (0 to 4+). Alternatively, in the instance of neonates born to mothers who had a history of RBC alloantibody formation, Capture-R Ready-ID (Immucor) strips were used. The method of identifying antibodies in these eluates was identical to that used for eluates prepared from peripheral blood samples.

IMMUNOHEMATOLOGY, Volume 27, Number 1, 2011 3
Antibodies in eluates using SPRCA
Identification of Antibodies in Eluates by GMC AssayEluates were tested manually using the ID-Micro Typing
IgG gel cards according to manufacturer’s instructions.12 To test eluates prepared from peripheral blood samples, a commercially available panel of 11 group O RBC suspensions was used (0.8% Resolve Panel A, Ortho). A 50-µL aliquot of each of these RBC suspensions was pipetted into a microtube on a gel card. Twenty-five microliters of the eluate was then added into each microtube. The gel cards were incubated at 36° to 38°C for 15 minutes, centrifuged, and graded manually. Twenty-five microliters of the last wash was tested in a similar fashion.
In the instances of non–group O neonates born to group O mothers with negative antibody screens, the method varied slightly from the previously described procedure in its ability to detect the presence of anti-A or anti-B in eluates prepared from these samples. Instead of using the commercially available group O RBC panel, 0.8% group A1 and B RBC suspensions were made using a hypotonic buffered saline solution (MTS Diluent 2, Ortho) and the same donor group A1 and B RBCs that were used in the SPRCA method. Fifty microliters of these group A1 and B RBC suspensions was pipetted into the microtubes on a gel card. Twenty-five microliters of the eluate or last wash was then added to these microtubes. The gel cards were incubated, centrifuged, and graded as previously described. For eluates prepared from cord blood samples in which the presence of maternal alloantibodies was being investigated, the method of testing was identical to that for peripheral blood samples.
Results
During the study period, we performed elution studies on a total of 58 patient samples for a variety of clinical scenarios (Table 1).
Identification of Antibodies in Eluates Prepared from Peripheral Blood RBCs
Elution studies were performed on 51 peripheral blood samples (Table 2). All 51 samples had a positive DAT result with anti-IgG. The overall concordance rate of the two testing systems was 88.2 percent (45 of 51) for these samples. This included cases with alloantibodies (n = 8), warm autoantibodies (n = 12), antibodies with no identifiable specificity (n = 2), and negative results (n = 23). There were six cases in which the two systems produced discordant results (11.8%) (Table 3). All instances of discordant results occurred in the investigation of possible delayed hemolytic transfusion reactions. The DAT results were weakly positive in all cases. No antibodies were detected in the last wash fluids by either method for all peripheral blood samples included in the study.
Identification of Antibodies in Eluates Prepared from Cord Blood RBCs
Seven eluates prepared from cord blood samples were analyzed for this study. Two of these were prepared from cord blood samples from neonates whose mothers had a known clinically significant alloantibody. For these two cases, both methods detected anti-Jka in the eluates. The remaining 5 eluates were prepared from cord blood samples from non–group O neonates born to group O mothers who had no evidence of alloantibody formation by routine prenatal screening. For these, both methods detected
Table 1. Classification of patient samples by sample source and clinical indication
Sample category Number
Peripheral bloodFirst-time positive DAT or increased strength in DAT 9Possible delayed hemolytic reaction with positive DAT 32Suspected autoimmune hemolytic anemia with positive DAT 6Acute transfusion reaction with positive DAT 4
Subtotal 51Cord blood
Known maternal alloantibody 2Non-group O neonate born to group O mother 5
Subtotal 7
Total 58
DAT = direct antiglobulin test.
Table 2. Identification of antibodies in eluates prepared from peripheral blood RBCs: concordant and discordant cases between automated SPRCA and manual GMC assays
ABID result
First-time positive/ increased strength
Possible DHTR
Possible AIHA
Possible AHTR Total
Subtotal of concordant cases 9 26 6 4 45
Alloantibody 0 8* 0 0 8
Warm autoantibody 5 4 3 0 12
Weakly reactive, nonspecific 0 2 0 0 2
Negative 4 12 3 4 23
Subtotal of discordant cases 0 6 0 0 6†
Total cases 9 32 6 4 51
Concordance rate 100% 81.20% 100% 100% 88.20%
*Includes 5 cases of anti-Jka, 2 of anti-K, and 1 of anti-E.†See Table 3 for more information on the cases with discordant results.
ABID = antibody identification; AHTR = acute hemolytic transfusion reaction; AIHA = autoimmune hemolytic anemia; DHTR = delayed hemolytic transfusion reaction.

4 IMMUNOHEMATOLOGY, Volume 27, Number 1, 2011
R.H. Finck et al.
anti-A in three cases, anti-B in one case, and neither in the final case. The concordance rate between the two methods in identifying antibodies eluted from cord blood RBCs was 100 percent (7 of 7). No antibodies were detected in the last wash fluids by either method for all cord blood samples included in the study.
Discussion
Elution procedures are important in that they allow for the removal of IgG bound to a patient’s RBCs and produce a concentrated sample of these antibodies. Antibody identification studies performed on eluates yield useful information to aid in the diagnosis of immune-mediated hemolysis caused by alloantibodies and warm autoantibodies, especially when such antibodies cannot be demonstrated in the patient’s plasma.
Until recently, identification of antibodies in eluates was largely performed by a standard tube agglutination assay. Studies have shown that the GMC assay is also a valid method to detect antibodies in eluates. Steiner et al.7 compared a GMC assay with a traditional tube method in its ability to detect antibodies in 25 acid eluates prepared from patient samples with a positive DAT. The two methods produced discordant results in five cases. In all of these discordant cases, the GMC identified antibodies that the tube method did not.7 Similarly, Greco and associates8 tested the acid eluates from a total of 41 cord blood and 30 peripheral blood samples by the GMC and the tube method. They concluded that the results produced by the GMC assay were essentially similar to those obtained with the tube agglutination assay.8
In many regards, GMC assays are a useful alternative to tube assays for most serologic applications. According to the most recent College of American Pathologists interlaboratory comparison survey, this method is becoming widely adopted.1 Between 2001 and 2004, the percentage of laboratories using a GMC system for identifying antibodies in plasma samples increased from
26.1 percent to 42.0 percent. Currently, survey data on the usage of the GMC method to identify antibodies in eluates are not available. However, as manufacturer’s instructions for GMC assays include eluates as appropriate testing samples, the popularity of this format is likely increasing for this application.12 At our institution, the identification of antibodies in acid eluates has been performed using a GMC assay (ID-Micro Typing IgG gel cards, Ortho) for the last 8 years.
As an alternative to the GMC testing format, the SPRCA system has also shown comparable performance to traditional tube methods in the detection and identification of antibodies in plasma samples.2–6 However, the utility of an SPRCA assay in evaluating eluates has not been extensively explored. We were able to find only one previous study that compared the performance of an SPRCA (Capture-R, Immucor) system with a GMC assay (DiaMed-ID, DiaMed AG, Cressier sur Morat, Switzerland) in the detection of antibodies in eluates, which was published in the German medical literature in 1997.9 In this study, Beck and associates evaluated 39 acid eluates from patients with a positive DAT who were suspected of having immune-mediated hemolysis. They tested these samples in both assays and compared results. Importantly, they identified two patients with weakly positive DATs for whom antibody identification in the plasma was either negative or unclear. In the corresponding eluates, an anti-K and an anti-Jka could be identified by the SPRCA technique only. Overall, the authors concluded that the SPRCA assay was a useful technique in this application.
At this time, the manufacturer’s instructions for the SPRCA assay do not include the evaluation of acid eluates as an application for this system.13 There are inherent differences between acid eluates and plasma samples in terms of antibody concentration and the presence of additional proteins. Therefore, it is important that this technology be validated for identifying antibodies in eluate samples. Our study has demonstrated that our automated SPRCA system produces results comparable with those of a GMC assay in the identification of antibodies eluted from RBCs, with a concordance rate of 88.2 percent using peripheral blood samples and 100 percent using cord blood samples. All six cases in which the two systems produced discordant results (Table 3) involved peripheral blood samples from patients who were being assessed for a possible delayed hemolytic transfusion reaction. In four of these samples, the SPRCA system identified alloantibodies in the corresponding acid eluates, which produced either negative or inconclusive results in the GMC assay. The remaining two discordant cases consisted of a case with anti-Fya and another case with antibodies with no apparent specificity, which were detected by the GMC assay only.
Table 3. Summary of cases with discordant results
Case number DAT result ABID by GMC ABID by SPRCA
1 Microscopic+ Negative Anti-Jka
2 1+ WNSR Anti-Jka
3 Microscopic+ WNSR Anti-E
4 Microscopic+ Negative Anti-e
5 1+ Anti-Fya Negative
6 1+ WNSR Negative
ABID = antibody identified; WNSR = weak, nonspecific reactivity.Note: All cases were peripheral blood samples used to evaluate for possible delayed hemolytic transfusion reaction.

IMMUNOHEMATOLOGY, Volume 27, Number 1, 2011 5
Antibodies in eluates using SPRCA
Although our study was somewhat limited in sample size and scope of alloantibodies detected, our data suggest that the automated SPRCA assay is an appropriate method for identifying antibodies in acid eluates prepared from both peripheral blood and cord blood samples as compared with the manual GMC assay. Automated SPRCA systems can serve as an alternative to GMC assays for this application in the transfusion laboratory.
Acknowledgments
We wish to acknowledge Theresa Heflin and Joanne Dupray at Immucor supplying the reagents used in the study. We would also like to thank the technologists in the Transfusion Services at the Ronald Reagan UCLA Medical Center for performing the assays.
This study was supported by the Department of Pathology and Laboratory Medicine Translational Research Fund, David Geffen School of Medicine at UCLA, Los Angeles, CA. Reagents used in the study were donated by Immucor, Norcross, Georgia.
References
1. Shulman IA, Maffei LM, Downes KA. North American pretransfusion testing practices, 2001–2004: results from the College of American Pathologists Interlaboratory Comparison Program survey data, 2001–2004. Arch Pathol Lab Med 2005;129:984–9.
2. Weisbach V, Kohnhäuser T, Zimmermann R, et al. Comparison of the performance of microtube column systems and solid-phase systems and the tube low-ionic-strength solution additive indirect antiglobulin test in the detection of red cell alloantibodies. Transfus Med 2006;16:276–84.
3. Yamada C, Serrano-Rahman L, Vasovic LV, Mohandas K, Uehlinger J. Antibody identification using both automated solid-phase red cell adherence assay and a tube polyethylene glycol antiglobulin method. Transfusion 2008;48:1693–8.
4. Carter JE, Gallego M, Stubbs JR. The identification of red cell antibodies: a comparative study of a solid phase red cell adherence system, a gel system, and agglutination testing (abstract). Am J Clin Pathol 1997;107:486–7.
5. Reilly B, DePalma H, Cosgrove P, Parsi M, Grima K. Comparison study between routine tube test (LISS), PEG tube test, gel technology, and solid phase red cell adherence assays (abstract). Transfusion 1997;37(Suppl):64S.
6. Casina TS. In search of the Holy Grail: comparison of antibody screening methods. Immunohematology 2006;22: 196–202.
7. Steiner EA, Casina TS, Mann NN, Judd WJ. Comparison of acid eluates tested in gel vs. tube (abstract). Transfusion 1998;38(Suppl):37S.
8. Greco VA, Byrne KM, Procter JL, Stroncek DF. Detection of antibodies in acid eluates with the gel microcolumn assay. Transfusion 2002;42:698–701.
9. Beck KH, Kaup N, Ilse R, Beeser H. [Capture-R Ready-ID and DiaMed-ID for identification of erythrocyte bound antibodies after acid elution.] Beitr Infusionsther Transfusionsmed 1997;34:171–5. [Article in German]
10. Anti-Human Globulin, manufacturer’s insert. Norcross, GA: Immucor, 2007.
11. Gamma Elu-Kit II™, manufacturer’s insert. Norcross, GA: Immucor, 2007.
12. ID-Micro Typing System, Gel Test, manufacturer’s insert. Pompano Beach, FL: Micro Typing Systems, Inc, an Ortho-Clinical Diagnostics Company, 2008.
13. Capture-R Ready ID, manufacturer’s insert. Norcross, GA: Immucor, 2006.
Rachel H. Finck, MD (corresponding author), GY3 Pathology Resident, Department of Pathology and Laboratory Medicine, David Geffen School of Medicine at UCLA, 10833 Le Conte Avenue, CHS A7-149, Box 107, Los Angeles, CA 90095; Rebecca J. Davis, MT (ASCP), Senior Specialist CLS, Shih-Mao Teng, MS, MLS (ASCP), SBB, Division of Transfusion Medicine, Department of Pathology and Laboratory Medicine, University of California, Los Angeles, Los Angeles, CA; Dennis Goldfinger, MD, Associate Physician Diplomate, Department of Pathology and Laboratory Medicine, David Geffen School of Medicine at UCLA, Los Angeles, CA; Alyssa F. Ziman, MD, Assistant Professor/Director of Transfusion Medicine, Department of Pathology and Laboratory Medicine, University of California, Los Angeles, Los Angeles, CA; and Qun Lu, MD, Assistant Professor, and Shan Yuan, MD, Assistant Professor, Department of Pathology and Laboratory Medicine, David Geffen School of Medicine at UCLA, Los Angeles, CA.
Important Notice About Manuscripts for Immunohematology
Please e-mail all manuscripts to [email protected]
Immunohematology is on the Web!
www.redcross.org/immunohematology
For more information, send an e-mail to [email protected]

6 IMMUNOHEMATOLOGY, Volume 27, Number 1, 2011
Rh discrepancies are a problem during routine testing because of partial D or weak D phenotypes. Panels of monoclonal antibodies (MoAb) are being developed to identify D variants such as partial D and weak D when there are anomalous D typing results; however, molecular characterization offers a more specific classification of weak and partial D. The weak D and partial D phenotypes are caused by many different RHD alleles encoding aberrant D proteins, resulting in distinct serologic phenotypes and the possibility of anti-D immunization. We evaluated currently used serologic methods and reagents to detect and identify D variants and correlated the results with molecular analyses. A total of 306 blood samples from Brazilian blood donors and patients with discrepant results in routine D typing were analyzed. In total, 166 (54.2%) weak D, 136 (44.4%) partial D, 3 (1%) DEL, and 1 (0.3%) DHAR variants were identified. Among weak D samples, 76 weak D type 1 (45.8%), 75 weak D type 2 (45.2%), 13 weak D type 3 (7.8%), and 2 weak D type 5 (1.2%) alleles were found. Among the partial D samples, 49 type 4.0 weak partial D (36%), 9 DAR (6.6%), 24 DFR (17.6%), 6 DBT (4.4%), 1 DHMi (0.73%), 26 DVI (19%), 14 DVa (10.3%), 5 DIVb (3.7%), and 2 DVII (1.5%) were observed. Two samples identified as DEL by adsorption-elution were characterized by molecular analyses as RHD(IVS5–38DEL4) and one sample was characterized as RHD(K409K). One sample was characterized as DHAR, a CE variant positive with some monoclonal anti-D. Our results showed that the use of different methods and anti-D reagents in the serologic routine analysis revealed D variants that can be further investigated. Molecular methods can help to differentiate between partial D and weak D and to characterize the weak D types, providing additional information of value in the determination of D phenotypes. This distinction is important for optimized management of D– RBC units and for the prevention of anti-D–related hemolytic disease of the fetus and newborn. Immunohematology 2011;27:6–11.
Key Words: RHD alleles, weak D phenotype, partial D, anti-D immunization, Brazilians
Rh epitopes are highly conformational, and single amino acid changes in one part of the protein, including changes within the transmembrane regions, can affect expression of epitopes or result in new epitopes. Single nucleotide polymorphisms (SNPs) and gene conversions between the RHD and RHCE genes are primarily responsible for the large number of variations in expression of the Rh antigens.1,2
The D antigen is the most important blood group antigen determined by a protein, because D– individuals can be easily immunized to make anti-D. A plethora of RHD alleles have been identified at the molecular level, including those that encode partial D, and weak D types, and a particularly weakly expressed D antigen termed DEL, that can only be demonstrated by adsorption and elution.3–9
Weak D phenotypes are characterized by depressed expression of the D antigen, and at the molecular level, D variants are caused by many different RHD alleles carrying single or multiple missense mutations in their RHD coding sequences encoding altered D proteins.3,4,6 No alloanti-D has been found in individuals with the most common weak D types (1, 2, and 3); however, little is known about the anti-D immunization risk in people with the rare RHD alleles with lower antigen density than weak D type 2.4,10 Weak D types generally present all epitopes albeit with some epitopes showing variability depending on the monoclonal anti-D used for testing.11 The classification of variants as weak D does not imply that carriers will not be immunized by exposure to normal D through transfusion or pregnancy as weak D types 4.0, 4.2, 11, and 15 were described to be prone to anti-D alloimmunization and thus should be considered as partial D.4,11–15 Partial D variants lack D antigen epitopes, and individuals who harbor partial D variant alleles have the potential to make alloanti-D.8 Anti-D immunization was also attributed to patients transfused with red blood cell (RBC) units from DEL donors.9
The differentiation and identification of D variants is important for selection of blood products and to prevent anti-D-related hemolytic disease of the fetus and newborn; however, it is not always straightforward, and, occasionally, phenotype discrepancies occur between two reagents.11,16,17
Populations with African admixture, such as the Brazilian population, can present a high variety of RHD alleles.18 A comprehensive investigation of the RHD alleles that encode weak D expression at the RBC surface could have a considerable impact on the typing and transfusion strategy in countries like Brazil where the prevalence of D– phenotypes ranges from 5 percent to 12 percent
Serologic and molecular characterization of D variants in Brazilians: impact for typing and transfusion strategyD.C. Credidio, J. Pellegrino Jr., and L. Castilho
Case RepoRt

IMMUNOHEMATOLOGY, Volume 27, Number 1, 2011 7
D variants in Brazilians
approximately. The use of different methods and anti-D reagents in the routine serologic analysis has revealed some D variants that are being investigated by molecular methods. We here describe the serology and molecular analyses performed to identify such variants among Brazilian blood donors and patients with discrepant results of D typing.
Materials and Methods
Blood SamplesBlood samples, collected over a 2-year period, from
306 Brazilians (117 blood donors and 189 patients) with discrepant results of D typing with different commercial anti-D monoclonal antibodies (MoAbs), or weak reactivity (<3+ at room temperature or reactivity in indirect antiglobulin test [IAT] only) were referred by routine laboratories from different regions of Brazil to our laboratory for molecular characterization and transfusion counseling. D typing in the referring laboratories was performed with two different anti-D MoAbs in conjunction with IAT as is required in Brazil for donors and patients as a result of the deficit of D– RBC units.
Serologic StudiesD, C, E, c, and e status of all RBCs was determined by
hemagglutination in gel neutral cards (DiaMed AG, Cressier sur Morat, Switzerland) using routine anti-D, anti-C, anti-E, anti-c, and anti-e monoclonal reagents (Fresenius Kabi, São Paulo, Brazil). D-antigen reactivity was analyzed by agglutination in tube and gel cards using six anti-D monoclonal reagents: anti-D IgM (clone 175–2) and anti-D IgG (clone ESD1; DiaMed AG); IgM (clone P3X61) and anti-D Blend (clones P3X290, P3X35, P3X61, P3X21223B10; Grifols, Barcelona, Spain); and anti-D IgM (clone MS201) and anti-D IgG (clone MS26; Smart Kit, Fresenius Kabi). Nonreactive samples were tested with anti-D blend (clones MS26/MS201) and anti-D IgG (clone ESD1) using the IAT in tube and two gel matrix techniques (DiaMed and Grifols). An adsorption-elution test was performed on samples that were nonreactive in the IAT and expressed the C antigen.
PCR AssaysDNA was extracted from whole blood samples using
the QIAmp DNA Blood Mini-Kit (Qiagen, Valencia, CA), according to the manufacturer’s recommendations. Two polymerase chain reaction (PCR) assays were used to determine the presence or absence of RHD-specific amplified products from sequences in intron 4 and exon 7.19 The other assays used were a PCR system using sequence-specific primers (SSP) that detect the common weak D
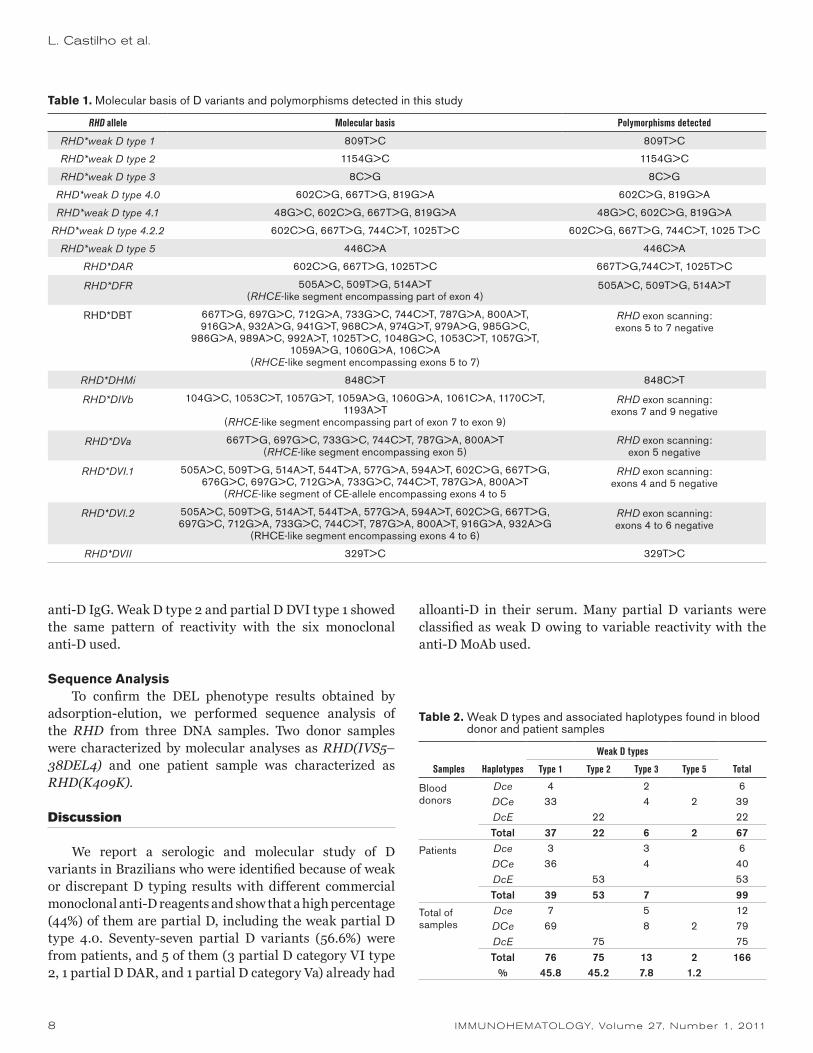
types,6 a multiplex PCR20 that detects the RHD gene hybrid alleles, and specific PCR–restriction fragment length poly-morphisms (RFLP) to distinguish between weak D type 4.2.2 and DAR alleles.21 Table 1 summarizes the RHD alleles investigated and the polymorphisms detected.
Sequence AnalysisSequence analysis was performed to confirm the DEL
phenotypes found by adsorption-elution on PCR products amplified from genomic DNA using RHD-specific primers as previously reported.3 PCR products were purified by elution from 1 percent agarose gels using a Qiaex II gel extraction kit (Qiagen) and sequenced directly, without subcloning, on an ABI 373XL Perkin Elmer Biosystems (PEB) sequencer using the PEB Big Dye reagent BD Half-term (GenPak, Perkin Elmer Biosystems, Foster City, CA).
Results
During a 2-year period blood samples from 117 blood donors and 189 patients with discrepant results or weak reactivity with two monoclonal anti-D reagents in routine diagnostics were tested by hemagglutination with currently used MoAbs in Brazil and by molecular analyses. Although we have separated those two populations (patients and donors) in this study, they are comparable in terms of ethnic background in Brazil.
Molecular AnalysesIn total, 166 weak D (54.2%), 136 partial D (44.4%),
3 DEL (1%), and 1 DHAR (0.3%) variants were identified. Tables 2 and 3 summarize the distribution of weak D and partial D alleles and the associated haplotypes. The weak D types 1, 2, and 3 were the most prevalent weak D types found in this population. Weak D types 1 and 3 were associated with the DCe and Dce haplotypes, and weak D type 2 was associated with DcE .
Serologic ReactivitySix selected monoclonal anti-D (IgG, IgM, and blend)
were used in tube and gel to evaluate the reactivity pattern of these monoclonal anti-D reagents with D variants. The reactivity with the monoclonal anti-D reagents showed a generally consistent pattern among the variant RHD alleles that occurred more than once. Table 4 summarizes the results found in the donor and patient samples studied. Weak D types 1 and 3 and weak partial D type 4.0 and partial D DBT were detected with all anti-D MoAbs in tube and gel. Weak D types 2 and 5 and partial D DAR, DFR, DHMi, and DVI were not detected with the IgM monoclonal anti-D antibodies, whereas DIVb was not detected with
8 IMMUNOHEMATOLOGY, Volume 27, Number 1, 2011
L. Castilho et al.
anti-D IgG. Weak D type 2 and partial D DVI type 1 showed the same pattern of reactivity with the six monoclonal anti-D used.
Sequence AnalysisTo confirm the DEL phenotype results obtained by
adsorption-elution, we performed sequence analysis of the RHD from three DNA samples. Two donor samples were characterized by molecular analyses as RHD(IVS5–38DEL4) and one patient sample was characterized as RHD(K409K).
Discussion
We report a serologic and molecular study of D variants in Brazilians who were identified because of weak or discrepant D typing results with different commercial monoclonal anti-D reagents and show that a high percentage (44%) of them are partial D, including the weak partial D type 4.0. Seventy-seven partial D variants (56.6%) were from patients, and 5 of them (3 partial D category VI type 2, 1 partial D DAR, and 1 partial D category Va) already had
alloanti-D in their serum. Many partial D variants were classified as weak D owing to variable reactivity with the anti-D MoAb used.
Table 1. Molecular basis of D variants and polymorphisms detected in this study
RHD allele Molecular basis Polymorphisms detected
RHD*weak D type 1 809T>C 809T>C
RHD*weak D type 2 1154G>C 1154G>C
RHD*weak D type 3 8C>G 8C>G
RHD*weak D type 4.0 602C>G, 667T>G, 819G>A 602C>G, 819G>A
RHD*weak D type 4.1 48G>C, 602C>G, 667T>G, 819G>A 48G>C, 602C>G, 819G>A
RHD*weak D type 4.2.2 602C>G, 667T>G, 744C>T, 1025T>C 602C>G, 667T>G, 744C>T, 1025 T>C
RHD*weak D type 5 446C>A 446C>A
RHD*DAR 602C>G, 667T>G, 1025T>C 667T>G,744C>T, 1025T>C
RHD*DFR 505A>C, 509T>G, 514A>T(RHCE-like segment encompassing part of exon 4)
505A>C, 509T>G, 514A>T
RHD*DBT 667T>G, 697G>C, 712G>A, 733G>C, 744C>T, 787G>A, 800A>T, 916G>A, 932A>G, 941G>T, 968C>A, 974G>T, 979A>G, 985G>C,
986G>A, 989A>C, 992A>T, 1025T>C, 1048G>C, 1053C>T, 1057G>T, 1059A>G, 1060G>A, 106C>A
(RHCE-like segment encompassing exons 5 to 7)
RHD exon scanning: exons 5 to 7 negative
RHD*DHMi 848C>T 848C>T
RHD*DIVb 104G>C, 1053C>T, 1057G>T, 1059A>G, 1060G>A, 1061C>A, 1170C>T, 1193A>T
(RHCE-like segment encompassing part of exon 7 to exon 9)
RHD exon scanning: exons 7 and 9 negative
RHD*DVa 667T>G, 697G>C, 733G>C, 744C>T, 787G>A, 800A>T(RHCE-like segment encompassing exon 5)
RHD exon scanning: exon 5 negative
RHD*DVI.1 505A>C, 509T>G, 514A>T, 544T>A, 577G>A, 594A>T, 602C>G, 667T>G, 676G>C, 697G>C, 712G>A, 733G>C, 744C>T, 787G>A, 800A>T
(RHCE-like segment of CE-allele encompassing exons 4 to 5
RHD exon scanning: exons 4 and 5 negative
RHD*DVI.2 505A>C, 509T>G, 514A>T, 544T>A, 577G>A, 594A>T, 602C>G, 667T>G, 697G>C, 712G>A, 733G>C, 744C>T, 787G>A, 800A>T, 916G>A, 932A>G
(RHCE-like segment encompassing exons 4 to 6)
RHD exon scanning: exons 4 to 6 negative
RHD*DVII 329T>C 329T>C
Table 2. Weak D types and associated haplotypes found in blood donor and patient samples
Weak D types
Samples Haplotypes Type 1 Type 2 Type 3 Type 5 Total
Blood donors
Dce 4 2 6DCe 33 4 2 39DcE 22 22Total 37 22 6 2 67
Patients Dce 3 3 6DCe 36 4 40DcE 53 53Total 39 53 7 99
Total of samples
Dce 7 5 12DCe 69 8 2 79DcE 75 75
Total 76 75 13 2 166% 45.8 45.2 7.8 1.2

IMMUNOHEMATOLOGY, Volume 27, Number 1, 2011 9
D variants in Brazilians
This 44 percent value corresponds to a prevalence study in a population with a D variant phenotype and not to the ratio between the number of RHD alleles known to encode a partial and weak D and the total number of weak RHD alleles described. That is the reason why our results differ from other results reported, that approximately 5 to 10 percent of weak D are partial D.3,4,11,22
In our study weak D type 2 and D category VI type 1 showed a similar reactivity pattern with the anti-D used, despite their different molecular background. The IgM anti-D used do not detect DVI, whereas the IgG anti-D detect DVI. As observed in Table 4, the IgM
anti-D failed to react with weak D type 2 and DVI type 1, and the patterns of reactivity with the other anti-D used were similar in tube and in gel. One explanation for these results may be the difference in the ability of the IgG anti-D MoAb and blend IgG + IgM anti-D to detect “weak D phenotypes” compared with that of the IgM anti-D. This finding reinforces that there is no well-defined borderline between weak D and some partial D phenotypes that express the D antigen weakly (partial weak D phenotype) that have an aberrant RHD coding sequence,3 and therefore a PCR screen for those variants should be recommended.
Table 3. Partial D and associated haplotypes found in blood donor and patient samples
Partial D
Samples Haplotypes Type 4.0 DAR DFR DBT DHMi DVI DVa DIVb DVII Total
Blood donors Dce 21 1 3 25DCe 5 3 1 12* 21DcE 1† 1Total 21 1 5 3 1 13 3 0 0 47
Patients Dce 28 8 1 11 2 50DCe 16 2 13* 5 36DcE 3 3Total 28 8 19 3 0 13 11 5 2 77
Total of samples Dce 49 9 1 59DCe 21 5 1 25* 14 5 71DcE 3 1† 4
Total 49 9 24 6 1 26 14 5 2 136% 36 6.6 17.6 4.4 0.73 19 10.3 3.7 1.5
*DVI type II. †DVI type I.
Table 4. RHD alleles and reactivity with monoclonal anti-D reagents
MoAbs × reactivity
Tube Gel DiaMed Gel Grifols
Samples RHD Alleles MS201 MS26+MS201P3X35/
P3X61 IAT 175/2 MS26 ESD1 IAT P3X61P3X35/ P3X61
MS26/MS201 IAT
76 RHD*weak D type 1 1+ 2+ 3+ 1+ 2+ 3+ 2+ 3+ 3+
75 RHD*weak D type 2 0 0 1+ 0 (+) 1+ 0 1+ 2+
13 RHD*weak D type 3 2+ 3+ 3+ 3+ 2+ 3+ 3+ 3+ 4+
2 RHD*weak D type 5 0 0 (+) 0 0 1+ 0 1+ 2+
49 RHD*weak partial 4.0 2+ 3+ 3+ 3+ 2+ 3+ 2+ 3+ 3+
9 RHD*DAR 0 1+ 2+ 0 1+ 2+ 0 1+ 2+
24 RHD*DFR 0 1+ 2+ 0 2+ 3+ 0 2+ 3+
6 RHD*DBT 1+ 1+ 2+ 2+ 2+ 3+ 3+ 2+ 3+
1 RHD*DHMi 0 1+ 2+ 0 1+ 2+ 0 2+ 3+
5 RHD*DIVb 2+ 1+ 3+ 2+ 0 3+ 2+ 1+ 2+
14 RHD*DVa 2+ 2+ 3+ 1+ 1+ 2+ 2+ 1+ 2+
25 RHD*DVI.1 0 0 1+ 0 1+ 2+ 0 1+ 2+
1 RHD*DVI.2 0 1+ 2+ 0 2+ 2+ 0 2+ 3+
2 RHD*DVII 0 2+ 3+ 1+ 2+ 3+ 2+ 3+ 3+
(+) = weak. MoAbs = monoclonal antibodies.

10 IMMUNOHEMATOLOGY, Volume 27, Number 1, 2011
Among the weak D samples, 164 of 306 (53.6%) were categorized as weak D types 1, 2, and 3 with the molecular assays, and for those individuals D+ transfusion could be considered safe because no immunization events have been documented yet.4 Such a strategy is estimated to reduce the use of D– blood by 2 to 3 percent. The high prevalence of weak D types 1, 2, and 3 was consistent with other studies in Europe.3,4 In our population we see a higher prevalence of weak partial D type 4.0 (36%), perhaps because of the marriage among Caucasians, Amerindians, and Africans that occurred in our population. For the partial D, we also observed a higher prevalence of DAR, DFR, and DVa, reinforcing that the ethnic background of the population may govern which variants are prevalent.
Weak D and partial D and the associated haplotype found in this study were consistent with those found in other studies,3 although we have also found the Dce haplotype associated with weak D types 1 and 3 (Table 2). Unfortunately, we did not have enough DNA to sequence the full RHD on those samples, and further studies are necessary to confirm this finding.
The three samples identified as DEL by adsorption and elution exhibited known DEL alleles, RHD(IVS5–38DEL4) and RHD(K409K). Donor RBC units from such individuals have been described before as inducing anti-D alloimmunization in D– patients.5,9 Taking these results into account, we recommend performing molecular analyses on donor samples phenotyped as D– C+ but D+ by adsorption and elution to identify the DEL allele and avoid immunization.
The sensitivity of the method used to type donor and patients may depend on the anti-D reagent used and on the exact conditions of the methods. For donor typing all potentially immunogenic D+ samples should be recognized as D+, and based on this we propose the use of two anti-D reagents (one anti-D blend and one IgM anti-D) to minimize the need for the IAT on donor samples. Because anti-D immunization may pose a serious clinical problem mainly in women of childbearing age, we propose that two different anti-D reagents (one IgM anti-D that does not detect DVI and one IgG anti-D that detects DVI) be used routinely to establish the Rh status for obstetric patients and transfusion recipients. When a discrepancy occurs between the two reagents, we recommend that molecular analysis is performed to identify the RHD allele. This strategy of combining serologic and molecular typing can provide a better solution to accurately determine the D-antigen status .
Finally, this study is of interest from a genetic and population perspective because it gives insight into the diversity of the RHD alleles in Brazilians. It is important to remember that much of the recent data on weak D and partial D have come from Europe.
Acknowledgments
This study was financially supported by FAPESP grant no. 2009/05924-0 and CNPq, Brazil. The Hematology and Hemotherapy Center, Hemocentro UNICAMP, forms part of the National Institute of Science and Technology of Blood, Brazil (INCT do Sangue–CNPq/MCT/FAPESP).
References
1. Avent ND, Reid ME. The Rh blood group system: a review [published correction appears in Blood 2000;95:2197]. Blood 2000;95:375–87.
2. Westhoff CM. The structure and function of the Rh antigen complex. Semin Hematol 2007;44:42–50.
3. Wagner FF, Gassner C, Müller TH, Schönitzer D, Schunter F, Flegel W. Molecular basis of weak D phenotypes. Blood 1999;93:385–93.
4. Wagner FF, Frohmajer A, Ladewig B, et al. Weak D alleles express distinct phenotypes. Blood 2000;95:2699–708.
5. Wagner FF. The RhesusBase. Department of Transfusion Medicine, University Hospital, Ulm, Germany. 1998. http://www.uni-ulm.de/~fwagner/RH/RB/. Accessed March 11, 2011.
6. Müller TH, Wagner FF, Trockenbacher A, et al. PCR screening for common weak D types shows different distributions in three Central European populations. Transfusion 2001;41:45–52.
7. Flegel WA, Wagner FF. Molecular biology of partial D and weak D. Implications for blood bank practice. Clin Lab 2002;48:53–9.
8. Denomme GA, Wagner FF, Fernandes BJ, Li W, Flegel WA. Partial D, weak D types, and novel RHD alleles among 33,864 multiethnic patients: implications for anti-D alloimmunization and prevention. Transfusion 2005;45;1554–60.
9. Körmöczi GF, Gassner C, Shao CP, Uchikawa M, Legler TJ. A comprehensive analysis of DEL types: partial DEL individuals are prone to anti-D alloimmunization. Transfusion 2005;45:1561–7.
10. Legler TJ, Maas JH, Köhler M, et al. Sequencing: a new tool for decision making on transfusion therapy and provision of Rh prophylaxis. Transfus Med 2001;11:383–8.
11. Denomme GA, Dake LR, Vilensky D, Ramyar L, Judd WJ. Rh discrepancies caused by variable reactivity of partial and weak D types with different serologic techniques. Transfusion 2008;48:473–8.
12. Flegel WA, Khul SR, Wagner FF. Primary anti-D immunization by weak D type 2 RBCs. Transfusion 2000; 40:428–34.
13. Mota M, Fonseca NL, Rodrigues A, Kutner JM, Castilho L. Anti-D alloimmunization by weak D type 1 red blood cells with a very low antigen density. Vox Sang 2005;88:130–5.
14. Flegel WA. How I manage donors and patients with a weak D phenotype. Curr Opin Hematol 2006;13:476–83.
15. Flegel WA, Wagner FF. RHD epitope density profiles of RHD variant red cells analyzed by flow cytometry. Transfus Clin Biol 1996;3:429–31.
L. Castilho et al.

IMMUNOHEMATOLOGY, Volume 27, Number 1, 2011 11
16. Ansart-Pirenne H, Asso-Bonnet M, Le Pennec P-Y, Roussel M, Patereau C, Noizat-Pirenne F. RhD variants in Caucasians: consequences for checking clinically relevant alleles. Transfusion 2004;44:1282–6.
17. Jones J, Filbey D. Selection of monoclonal antibodies for the identification of D variants: Ability to detect weak D and to split epD2, epD5 and epD6/7. Vox Sang 1996;70:173–9.
18. Castilho L, Carvalho T, Credidio D, Pellegrino J. RHD genotyping in blood donors with highly diverse ancestry phenotyped as D-negative (abstract). Transfusion 2008;48: SP448188A.
19. Singleton BK, Green CA, Avent ND, et al. The presence of an RHD pseudogene containing a 37 base pair duplication and a nonsense mutation in Africans with the Rh D-negative blood group phenotype. Blood 2000;95:12–18.
20. Maaskant-van wijk PA, Faas BH, de Ruijter JA, et al. Genotyping of RHD by multiplex polymerase chain reaction analysis of six RHD-specific exons [published correction appears in Transfusion 1999;39:546]. Transfusion 1998;38: 1015–21.
21. Castilho L, Rios M, Rodrigues A, Pellegrino J Jr, Saad STO, Costa FF. High frequency of partial DIIIa and DAR alleles found in sickle cell disease patients suggests increased risk of alloimmunization to RhD. Transfus Med 2005;15:49–55.
22. Garratty G. Do we need to be more concerned about weak D antigens? (editorial). Transfusion 2005;1547–51.
Débora Castilho Credidio, master student, Jordão Pellegrino Jr, MD, PhD, Director of External Blood Bank Units, and Lilian Castilho, PhD (corresponding author), professor, researcher and director of the Molecular Immunohematology Laboratory, Instituto Nacional de Ciência e Tecnologia do Sangue, Hemocentro, UNICAMP, Rua Carlos Chagas, 480, Caixa Postal 6198, CEP 13081-970 Barão Geraldo, Campinas, SP, Brazil.
D variants in Brazilians
Attention: State Blood Bank Meeting Organizers
If you are planning a state meeting and would like copies of Immunohematology for distribution, please send request, 4 months in advance, to [email protected]
Notice to Readers
All articles published, including communications and book reviews, reflect the opinions of the authors and do not necessarily reflect the official policy of the American Red Cross.
For information concerning the National Reference
Laboratory for Blood Group Serology, including the American
Rare Donor Program, contact Sandra Nance, by phone at
(215) 451-4362, by fax at (215) 451-2538, or by e-mail at
Attention: SBB and BB Students
You are eligible for a free 1-year subscription to
Immunohematology.
Ask your education supervisor to submit the name and
complete address for each student and the inclusive dates
of the training period to [email protected].

12 IMMUNOHEMATOLOGY, Volume 27, Number 1, 2011
Patients requiring chronic transfusion support are at risk of alloimmunization after red blood cell (RBC) transfusion because of a disparity between donor and recipient antigen profiles. This research explored the probability of obtaining an exact extended phenotype match between blood donors randomly selected from our institution and patients randomly selected from particular ethnic groups. Blood samples from 1,000 blood donors tested by molecular method were evaluated for the predicted phenotype distribution of Rh, Kell, Kidd, Duffy, and MNS. A random subsample of 800 donor phenotypes was then evaluated for the probability of obtaining an exact match with respect to phenotype with a randomly selected patient from a particular ethnic group. Overall, there was a greater than 80 percent probability of finding an exact donor-recipient match for the K/k alleles in the Kell system. The probability ranged from 3 percent to 38 percent, depending on the ethnicity and disparities in phenotypic profiles, for the Rh, Kidd, Duffy, and MNS systems. A significant donor-recipient phenotype mismatch ratio exists with certain blood group antigens such that, with current routine ABO and D matching practices, recipients of certain ethnic groups are predisposed to alloimmunization. Immunohematology 2011; 27:12–19.
Key Words: alloimmunization, red cell phenotype, donor ethnicity, donors, RBC serology, blood groups, donor-recipient antigen profiles
As a premier destination medical center, the Mayo Clinic in Rochester, Minnesota, treats thousands of patients yearly. Demographic records in 2007 revealed that 78 percent of patients were from the upper midwestern area of the United States, 20 percent were from other areas of the United States, and 2 percent were international patients.1 The majority of international patients were from the Persian Gulf States region (Saudi Arabia, Qatar, United Arab Emirates, and Kuwait) followed by patients from Canada, Europe, and South America.1
The 2008 population demographics of Olmsted County in southeastern Minnesota showed 86.6 percent Caucasian, 3.0 percent Hispanic/Latino, 3.8 percent Black/African American, 5.1 percent Asian, and 1.4 percent other.2 As expected from this population demographic, blood donors at Mayo Clinic are predominantly Caucasian. In contrast, the Mayo Clinic patient demographics in the past decade
show a steady increase in patients of various ethnic groups, including Somalis, Hispanics, Asians, and patients from Middle Eastern countries.
Because blood transfusion essentially constitutes a temporary transplant, there are risks of alloimmunization from exposure to foreign antigens on donor RBCs that can result in the formation of unexpected alloantibodies.3–6 The development of RBC alloantibodies can lead to adverse complications including acute hemolytic transfusion reactions (AHTR), delayed hemolytic transfusion reactions (DHTR), and hemolytic disease of the fetus and newborn (HDFN), as well as laboratory findings such as delayed serologic transfusion reactions (DSTR) and a positive direct antiglobulin test (DAT).3,4,6,7 Other reports have proposed that allogeneic transfusion also predisposes patients to the formation of RBC autoantibodies, which may result in the development of autoimmune hemolytic anemia (AIHA), a condition that can lead to increased hemolysis of transfused RBCs.8,9
The purpose of our study was to determine the degree of patient and donor matching by comparing the phenotypic distribution of Mayo Clinic blood donors, based on molecular analysis, with the published Rh, Kell, Kidd, Duffy, and MNS phenotypes of various ethnic groups. Identifying, by means of DNA analysis, the predicted donor inventory profiles that closely match certain ethnic patients who may present with unexpected antibodies will help provide the best phenotype blood for these patients as well as triage any transfusion support with faster turnaround time in obtaining compatible blood. Although interethnic RBC phenotypic disparities are well documented, this research is the first comprehensive study comparing phenotypic differences between a predominantly Caucasian donor pool and an international, multiethnic10 group in a single report.
Materials and Methods
The results of molecular analysis of 1,000 blood donors were evaluated after approval from the Institutional Review Board. We limited molecular testing to group O and group
Red blood cell phenotype matching for various ethnic groupsK.S.W. Badjie, C. Tauscher, C. Van Buskirk, C. Wong, S. Jenkins, C. Smith, and J.R. Stubbs
Case RepoRt

IMMUNOHEMATOLOGY, Volume 27, Number 1, 2011 13
RBC phenotype matching and ethnicity
A donors to maximize inventory. Because D– donors were also selectively tested for inventory management purposes, the initial data showed a disproportionate 30 percent D–. To correct for the skewed D– sampling, a random subsample of 800 was selected from the initial 1,000 samples and stratified by D, such that the resulting distribution would simulate the known distribution of D phenotypes in the general Caucasian population of 85 percent D+ and 15 percent D–. These 800 samples were then evaluated for the predicted phenotype distribution of Rh, Kell, Kidd, Duffy, and MNS.
Molecular testing was performed (BioArray BeadChip wHEA, Immucor, Norcross, GA). The BioArray wHEA predicted the RBC phenotype for 28 antigens in 11 blood group systems including Rh, Kell, Kidd, Duffy, MNS, Lutheran, Diego, Colton, Dombrock, Landsteiner-Wiener, and Scianna.
DNA was extracted using Genom-6, a robotic workstation that performs rapid isolation and purification of DNA without using solvent extraction and precipitation steps. The extraction was achieved by the tendency of DNA to bind or adsorb to a silica surface of magnetic beads in the presence of a chaotropic solution.
Statistical MethodsThe antigen frequencies of Rh, Kell, Kidd, Duffy, and
MNS from the 800 random subsamples were estimated with percentages. For the Kell, Kidd, and Duffy groups, overall exact chi-square goodness-of-fit tests (or their Monte Carlo estimates when necessary owing to sparse
data) were used to compare the overall distributions with population estimates for each ethnic group. For the Rh and MNS groups, the percentage of each individual phenotype (i.e., the percent who were DCCee vs. all others) was compared with the corresponding published data of the various ethnic groups using exact chi-square goodness-of-fit tests (or their Monte Carlo estimates when necessary). To adjust for the nine tests done per ethnicity within the Rh and MNS blood groups, the probability values from each of these individual tests were inflated by a factor of 9 (using an approximate Bonferroni methodology11). Further, we compared approximately 10 different ethnicities with our donor pool for each blood group. To adjust for this large number of comparisons, we considered probability values less than 0.01 to be statistically significant (overall type I error rate for a particular antigen group of 0.05/10 = 0.005; approximate Bonferroni methodology). All probability values were calculated using software (SAS version 9 software, SAS Institute, Cary, NC). A statistical summary for the different blood groups is presented in Tables 1, 2, and 3, respectively.
As a separate analysis, we also calculated the probability of getting an exact match with respect to the phenotype from a randomly selected donor from our donor pool and a randomly selected patient from a particular ethnic group within each antigen group. These calculations assumed that the observed antigen distribution from the sample of 800 donors is representative of the population of our donors. See the Appendix for details on these calculations.
Table 1. Statistical summary for the Rh blood group system
Mayo Donors (Reference) Caucasian12
East African13 Somali14 Black12 Chinese15 Thai16
Northern Indian10
Southern Indian17 Asian18 Mexican18
Saudi Arabian19
DCCee 21.4 16.0‡ 0.0§ 2.8§ 3.0§ 47.0§ 55.6§ 42.6§ 41.6§ 41.7§ 27.0† 20.7*
DCcEe 11.3 14.0* 0.7§ 0.7§ 4.0§ 30.0§ 26.7§ 12.1* 9.3* 34.7§ 26.0§ 14.8*
DccEE 2.9 3.0* 2.2* 0.3§ 1.0§ 6.0† 3.6* 2.6* 1.3† 7.1§ 7.0‡ 4.4*
Dccee 2.1 1.5* 81.9§ 64.1§ 42.0§ 0.3§ 0.6§ 1.9* 1.6* 1.7* 2.0* 10.8§
DCcee 35.0 32.0* 2.9§ 15.0§ 26.0§ 8.7§ 8.7§ 35.1* 32.9* 8.4§ 18.0§ 28.1‡
DccEe 12.4 13.0* 8.0‡ 2.5§ 16.0* 5.4§ 1.5§ 5.7§ 5.3§ 3.4§ 8.0‡ 10.3*
dccee 13.8 15.0* 2.9§ 1.4§ 7.0§ 1.0§ 0.0§ 0.0§ 6.0§ 0.2§ 3.0§ 10.3*
dCcee 0.5 0.4* 0.0§ 0.1* 1.0* 0.2* 0.0§ 0.0§ 0.8* 0.2* 0.2* 0.5*
dccEe 0.8 0.2* 0.0§ 0.2* 0.0§ 0.0§ 0.0§ 0.0§ 0.0§ 0.2* 0.2* 0.0§
Probability of finding same phenotype match 0.20 0.04 0.08 0.14 0.17 0.18 0.24 0.23 0.16 0.17 0.19
p-values are for comparison of the percentage of each phenotype in each ethnic group with the Mayo donor percentage.
*p-value ≥ 0.01 (not significant).†0.01 > p-value ≥ 0.001.‡0.001 > p-value ≥ 0.0001.§p-value < 0.0001.
14 IMMUNOHEMATOLOGY, Volume 27, Number 1, 2011
J.R. Stubbs et al.
Results
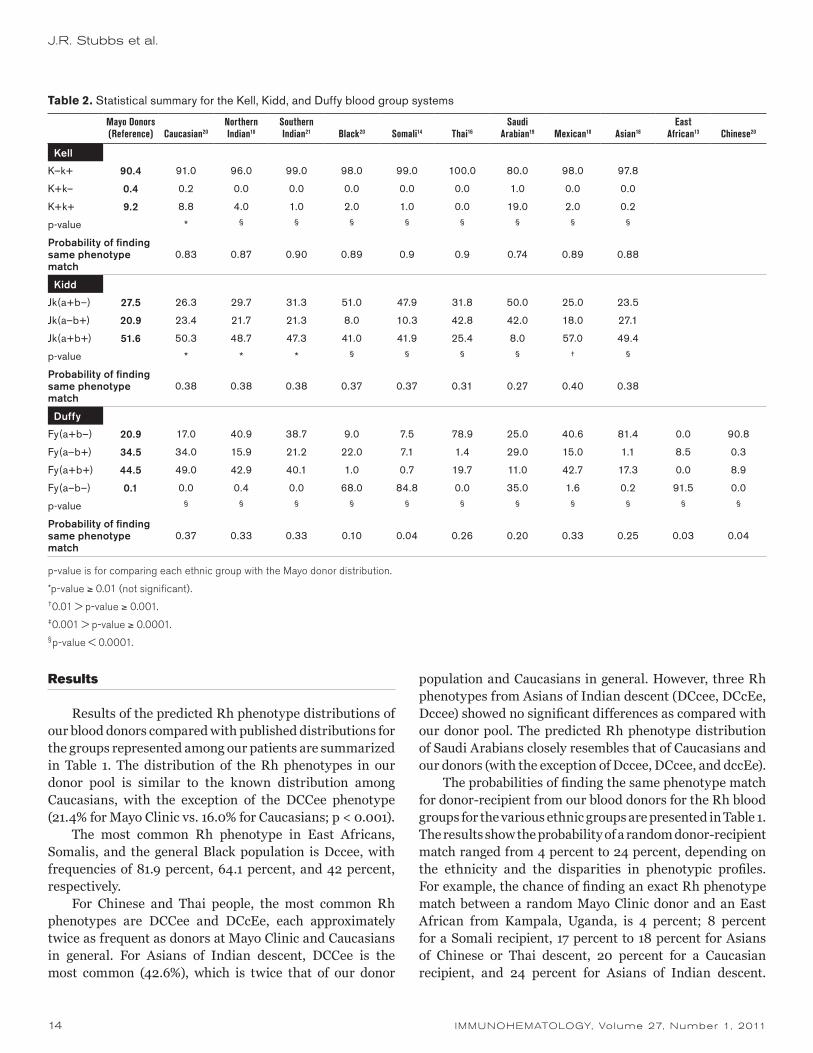
Results of the predicted Rh phenotype distributions of our blood donors compared with published distributions for the groups represented among our patients are summarized in Table 1. The distribution of the Rh phenotypes in our donor pool is similar to the known distribution among Caucasians, with the exception of the DCCee phenotype (21.4% for Mayo Clinic vs. 16.0% for Caucasians; p < 0.001).
The most common Rh phenotype in East Africans, Somalis, and the general Black population is Dccee, with frequencies of 81.9 percent, 64.1 percent, and 42 percent, respectively.
For Chinese and Thai people, the most common Rh phenotypes are DCCee and DCcEe, each approximately twice as frequent as donors at Mayo Clinic and Caucasians in general. For Asians of Indian descent, DCCee is the most common (42.6%), which is twice that of our donor
population and Caucasians in general. However, three Rh phenotypes from Asians of Indian descent (DCcee, DCcEe, Dccee) showed no significant differences as compared with our donor pool. The predicted Rh phenotype distribution of Saudi Arabians closely resembles that of Caucasians and our donors (with the exception of Dccee, DCcee, and dccEe).
The probabilities of finding the same phenotype match for donor-recipient from our blood donors for the Rh blood groups for the various ethnic groups are presented in Table 1. The results show the probability of a random donor-recipient match ranged from 4 percent to 24 percent, depending on the ethnicity and the disparities in phenotypic profiles. For example, the chance of finding an exact Rh phenotype match between a random Mayo Clinic donor and an East African from Kampala, Uganda, is 4 percent; 8 percent for a Somali recipient, 17 percent to 18 percent for Asians of Chinese or Thai descent, 20 percent for a Caucasian recipient, and 24 percent for Asians of Indian descent.
Table 2. Statistical summary for the Kell, Kidd, and Duffy blood group systems
Mayo Donors (Reference) Caucasian20
Northern Indian10
Southern Indian21 Black20 Somali14 Thai16
Saudi Arabian19 Mexican18 Asian18
East African13 Chinese20
Kell
K–k+ 90.4 91.0 96.0 99.0 98.0 99.0 100.0 80.0 98.0 97.8
K+k– 0.4 0.2 0.0 0.0 0.0 0.0 0.0 1.0 0.0 0.0
K+k+ 9.2 8.8 4.0 1.0 2.0 1.0 0.0 19.0 2.0 0.2
p-value * § § § § § § § §
Probability of finding same phenotype match
0.83 0.87 0.90 0.89 0.9 0.9 0.74 0.89 0.88
Kidd
Jk(a+b–) 27.5 26.3 29.7 31.3 51.0 47.9 31.8 50.0 25.0 23.5
Jk(a–b+) 20.9 23.4 21.7 21.3 8.0 10.3 42.8 42.0 18.0 27.1
Jk(a+b+) 51.6 50.3 48.7 47.3 41.0 41.9 25.4 8.0 57.0 49.4
p-value * * * § § § § † §
Probability of finding same phenotype match
0.38 0.38 0.38 0.37 0.37 0.31 0.27 0.40 0.38
Duffy
Fy(a+b–) 20.9 17.0 40.9 38.7 9.0 7.5 78.9 25.0 40.6 81.4 0.0 90.8
Fy(a–b+) 34.5 34.0 15.9 21.2 22.0 7.1 1.4 29.0 15.0 1.1 8.5 0.3
Fy(a+b+) 44.5 49.0 42.9 40.1 1.0 0.7 19.7 11.0 42.7 17.3 0.0 8.9
Fy(a–b–) 0.1 0.0 0.4 0.0 68.0 84.8 0.0 35.0 1.6 0.2 91.5 0.0
p-value § § § § § § § § § § §
Probability of finding same phenotype match
0.37 0.33 0.33 0.10 0.04 0.26 0.20 0.33 0.25 0.03 0.04
p-value is for comparing each ethnic group with the Mayo donor distribution.
*p-value ≥ 0.01 (not significant).†0.01 > p-value ≥ 0.001.‡0.001 > p-value ≥ 0.0001.§p-value < 0.0001.
IMMUNOHEMATOLOGY, Volume 27, Number 1, 2011 15
RBC phenotype matching and ethnicity
Although DCCee (42%) is the most common published Rh phenotype among Asians of Indian descent, many Asians of Indian descent (32.9% to 35.1%; Table 1) also express the DCcee phenotype, which is the predominant phenotype (35.0%) among our donors. On the other hand, Somalis and East Africans predominantly express Dccee (64.1% and 81.9%, respectively). Therefore, greater disparities exist because of the high incidence of the Dce (R0) phenotype and its low incidence among our donor pool (Table 1). Consequently, the large mismatched ratio and large number of donor exposures predisposes these recipients to the risk of alloimmunization to clinically significant antigens such as E and C. This large donor exposure for the mismatched antigens could be significant especially in obstetric and transfusion-dependent recipients.
Table 2 summarizes the phenotype distributions of the Kell, Kidd, and Duffy blood group systems. In the Kell system, the K+k+ phenotype among our donors (9.2%) is higher compared with that among Asians of Indian descent (4.0% and 1.0%, respectively), Somalis (1.0%), and Thai (0.0%), but significantly lower when compared with that among Saudi Arabians (19.0%). Although these discrepancies are statistically significant from a clinical standpoint (p < 0.0001), the probability of finding the same donor-recipient phenotype for the K/k alleles in the Kell blood group system, based on the observed distribution, is 74 percent to 90 percent (Table 2).
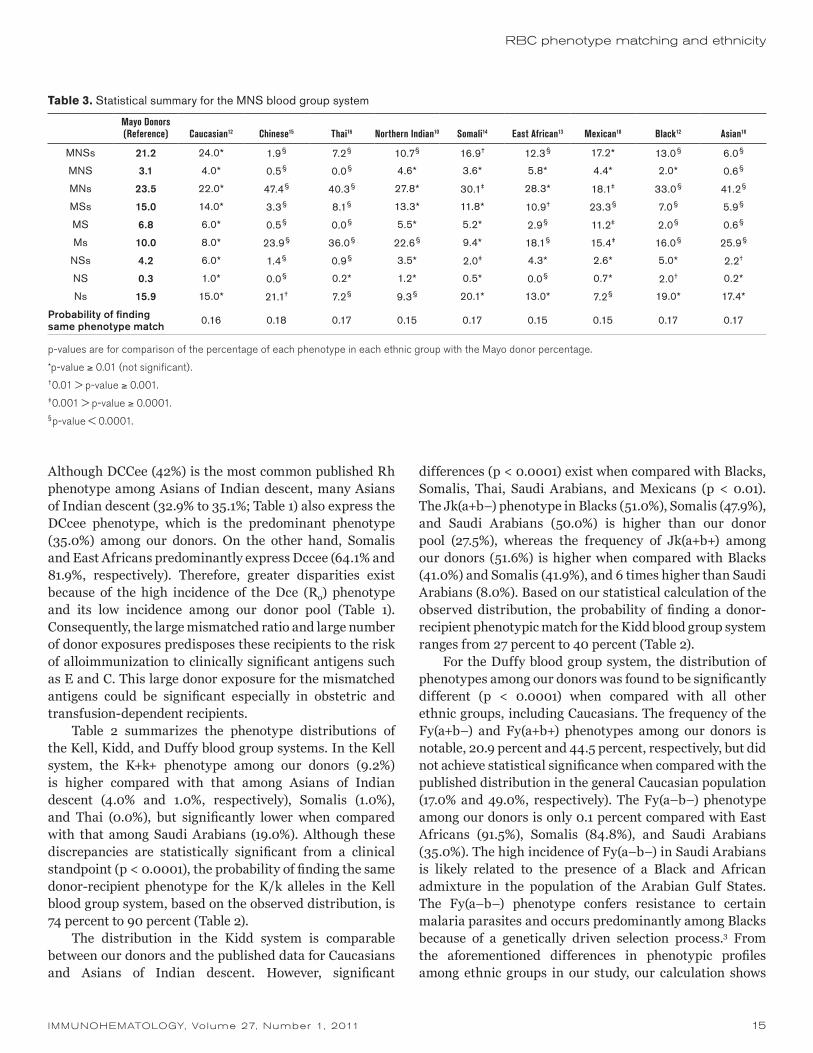
The distribution in the Kidd system is comparable between our donors and the published data for Caucasians and Asians of Indian descent. However, significant
differences (p < 0.0001) exist when compared with Blacks, Somalis, Thai, Saudi Arabians, and Mexicans (p < 0.01). The Jk(a+b–) phenotype in Blacks (51.0%), Somalis (47.9%), and Saudi Arabians (50.0%) is higher than our donor pool (27.5%), whereas the frequency of Jk(a+b+) among our donors (51.6%) is higher when compared with Blacks (41.0%) and Somalis (41.9%), and 6 times higher than Saudi Arabians (8.0%). Based on our statistical calculation of the observed distribution, the probability of finding a donor-recipient phenotypic match for the Kidd blood group system ranges from 27 percent to 40 percent (Table 2).
For the Duffy blood group system, the distribution of phenotypes among our donors was found to be significantly different (p < 0.0001) when compared with all other ethnic groups, including Caucasians. The frequency of the Fy(a+b–) and Fy(a+b+) phenotypes among our donors is notable, 20.9 percent and 44.5 percent, respectively, but did not achieve statistical significance when compared with the published distribution in the general Caucasian population (17.0% and 49.0%, respectively). The Fy(a–b–) phenotype among our donors is only 0.1 percent compared with East Africans (91.5%), Somalis (84.8%), and Saudi Arabians (35.0%). The high incidence of Fy(a–b–) in Saudi Arabians is likely related to the presence of a Black and African admixture in the population of the Arabian Gulf States. The Fy(a–b–) phenotype confers resistance to certain malaria parasites and occurs predominantly among Blacks because of a genetically driven selection process.3 From the aforementioned differences in phenotypic profiles among ethnic groups in our study, our calculation shows
Table 3. Statistical summary for the MNS blood group system
Mayo Donors (Reference) Caucasian12 Chinese15 Thai16 Northern Indian10 Somali14 East African13 Mexican18 Black12 Asian18
MNSs 21.2 24.0* 1.9§ 7.2§ 10.7§ 16.9† 12.3§ 17.2* 13.0§ 6.0§
MNS 3.1 4.0* 0.5§ 0.0§ 4.6* 3.6* 5.8* 4.4* 2.0* 0.6§
MNs 23.5 22.0* 47.4§ 40.3§ 27.8* 30.1‡ 28.3* 18.1‡ 33.0§ 41.2§
MSs 15.0 14.0* 3.3§ 8.1§ 13.3* 11.8* 10.9† 23.3§ 7.0§ 5.9§
MS 6.8 6.0* 0.5§ 0.0§ 5.5* 5.2* 2.9§ 11.2‡ 2.0§ 0.6§
Ms 10.0 8.0* 23.9§ 36.0§ 22.6§ 9.4* 18.1§ 15.4‡ 16.0§ 25.9§
NSs 4.2 6.0* 1.4§ 0.9§ 3.5* 2.0‡ 4.3* 2.6* 5.0* 2.2†
NS 0.3 1.0* 0.0§ 0.2* 1.2* 0.5* 0.0§ 0.7* 2.0† 0.2*
Ns 15.9 15.0* 21.1† 7.2§ 9.3§ 20.1* 13.0* 7.2§ 19.0* 17.4*
Probability of finding same phenotype match 0.16 0.18 0.17 0.15 0.17 0.15 0.15 0.17 0.17
p-values are for comparison of the percentage of each phenotype in each ethnic group with the Mayo donor percentage.
*p-value ≥ 0.01 (not significant).†0.01 > p-value ≥ 0.001.‡0.001 > p-value ≥ 0.0001.§p-value < 0.0001.

16 IMMUNOHEMATOLOGY, Volume 27, Number 1, 2011
the probability of a donor-recipient phenotype match for the Duffy blood group system is 3 percent to 37 percent. Given the high incidence of the Fy(a–b–) phenotype among Somalis, East Africans, and Saudi Arabians, patients from these ethnic groups can be predisposed to alloimmunization to Duffy antigens owing to the relatively high incidence of Fy(a+b+) phenotype among our donor pool. Likewise, finding phenotypically matched blood for recipients of Asian descent, such as Chinese and Thai who are predominantly Fy(a+b–) (90.8% and 78.9% respectively), could be a difficult challenge. On the basis of the phenotypic distribution of our donor pool, some recipients can be predisposed to alloimmunization to Fyb.
The distributions for the MNS blood group system are summarized in Table 3. The most common MNS phenotypes in our donors are comparable with those of the general Caucasian population—MNs (23.5%), MNSs (21.2%), Ns (15.9%), and MSs (15.0%). However, significant differences exist when our donors are compared with the rest of the ethnic groups (probability values range from < 0.01 to < 0.0001; Table 3). For Asians (Chinese, Thai, and Asians of Indian descent), the most common phenotypes are MNs and Ms. Ns in Chinese (21.1%) is notably higher in comparison to Thai (7.2%) and Asians of Indian descent (9.3%). The MNs phenotype is most common in both Somalis and East Africans, with Ns being the second most common phenotype in Somalis (20.1%) and Ms being the second most common phenotype in East Africans (18.1%). Mexicans show a different distribution pattern, with the most common phenotypes being MSs (23.3%), MNs (18.1%), and MNSs (17.2%). On the basis of these observed phenotypic distributions, the probability of finding a donor-recipient phenotypic match is 15 percent to 18 percent for the MNS blood group system.
Discussion
RBC transfusion is a critical component of patient care, providing many benefits to those patients in need of oxygen-carrying capacity, but it also has inherent hazards. Transfusion recipients are at risk of alloimmunization owing to a disparity between donor and recipient antigen profiles. The risk associated with alloimmunization of recipients is attributable to individual and ethnic differences. These risks can be influenced by other factors, including dose, mode of exposure, and immunogenicity of the antigen.3,7,9,22,23 The frequency of RBC-induced alloimmunization has been estimated to be between 2.6 percent and 60 percent, depending on the patient population studied and the method of study.4–7,23 The routine practice for selection of RBCs for blood transfusion has largely been restricted to
matching for ABO and D despite lack of homogeneity of blood groups among individuals and across different ethnic groups. Exceptions include “transfusion responders” and the chronically transfused patients who are transfusion dependent and whose management sometimes dictates extended matching for other antigens because of preformed alloantibodies.4–9,22–24 Moreover, some patient populations, such as sickle cell patients, receive extended antigen matching in advance. The effects of alloimmunization include difficulty with future management and provision of transfusion support for these recipients. The situation is further exacerbated when patients present with multiple antibodies requiring extensive serologic workup that could delay patient care.3–9,22–25
Although some have strongly advocated for a more proactive approach in antigen matching for transfusion, others have suggested a more balanced approach, given the logistical complexities of resource and inventory management.5–7,22 In general, many transfusion experts support extended antigen matching for the chronically transfused patient because the frequency of alloimmunization in these patients can be as high as 60 percent. However, expert opinion varies widely with regard to prophylactic extended antigen matching in nonchronically transfused patients to mitigate or avoid alloimmunization, as not all patients have an inherent risk of RBC sensitization. Higgins and Sloan4 reported evidence of a distinct “responder” phenotype and estimated that only 13 percent of the general patient population were responders. In addition, they reported that the risk of immunologic response attributable to alloimmunization among these patients was only 30 percent and identified only 4 percent of new alloantibodies overall, suggesting that 70 percent of the responder phenotype do not usually make antibodies. Based on these results, the authors proposed a stochastic or nonanamnestic model of RBC alloimmunization.4 Their hypothesis implies that additional alloantibody formation is a rather random process that is not influenced by the number of preexisting patient antibodies.
However, in a 20-year multicenter retrospective study, Schonewille et al.5 reported 21.4 percent (140 of 653) of nonhematologic alloimmunized patients in their cohort study formed additional antibodies resulting in 157 new antibody specificities. In their findings, the authors reported 33.8 percent (221 of 653) of patients demonstrated multiple antibodies, whereas 57 percent (80 of 140) of those found with additional antibodies made the antibodies after receiving just one subsequent transfusion, averaging two units per transfusion episode. The authors further noted that extended phenotype matching for C, E, c, K, Fya, and Jka could have prevented 83 percent of the antibodies in
J.R. Stubbs et al.

IMMUNOHEMATOLOGY, Volume 27, Number 1, 2011 17
316 patients. Given their data, the authors recommended extended antigen matching for nonhematologic patients to avoid extensive RBC alloimmunization.
In a similar study, Schonewille et al.6 also reported high antibody responders in previously alloimmunized hemoncology patients. Their study found that 21.7 percent (25 of 115) of previously alloimmunized hemoncology patients made additional antibodies after subsequent transfusions despite their diagnosis or compromised immune system from treatment. In essence, the findings of these two studies revealed a comparable increased ability to form additional antibodies in these two populations.
Our study explored the probability of obtaining an exact match with respect to phenotype from a randomly selected donor from our institution and a randomly selected patient from a particular ethnic group. As far as we know, our study is the first of its kind attempting to examine the probability of an exact donor-recipient match on the basis of phenotypic profiles. The probability of obtaining an exact phenotypic match from our donor pool and a random patient from various ethnic groups was calculated for Rh, Kell, Kidd, Duffy, and MNS blood group systems. These calculations assumed that the observed antigen distribution from the sample of 800 donors was representative of our donor population.
For example, the phenotype distribution of donors at our institution for K–k+, K+k–, and K+k+ is 90.4 percent, 0.38 percent, and 9.3 percent, respectively, whereas the published distribution in Caucasians is 91 percent, 0.2 percent, and 8.8 percent, respectively. If a single random Mayo Clinic donor and a single random Caucasian recipient are selected, the probability of an exact match is 83 percent. With the exception of Saudi Arabians, there is a greater than 80 percent probability of finding an exact donor-recipient match for the K/k antigens in the Kell system. However, because of the significant disparities alluded to earlier, a high risk of alloimmunization (owing to K) for a mismatch still exists for Asians, Africans/Blacks, and Hispanic groups. Patients from these ethnic groups who are alloimmunized could benefit from additional prophylactic matching for K− units.
For the Rh blood group system, the probability of a random donor-recipient match ranged from 4 percent to 24 percent, depending on the ethnicity and the disparities in phenotypic profiles. Therefore, the low probability of finding the same phenotype match can predispose certain ethnic recipients, such as Somalis and East Africans, to increased risk of alloimmunization to E and C.
In the Kidd system, there was a 27 percent to 40 percent probability of a match across all nationalities. In the Duffy system, the probabilities of a match ranged from 3 percent
for Africans to as high as 37 percent for Caucasians. Given the phenotypic disparities in the Duffy system, Chinese and Thai individuals may be at risk for alloimmunization to Fyb because these two groups predominantly express the Fy(a+b–) phenotype.
In the MNS system, the probability of a donor-recipient match ranged from 15 percent to 18 percent. For the most part, S represents the biggest risk for alloimmunization to ethnic recipients based on phenotypic discrepancies. Therefore, additional prophylactic matching for S− units should be considered for alloimmunized recipients.
In summary, dual donor-patient molecular analysis has the potential for developing comprehensive electronic genotypic profiling and matching to decrease alloimmunization caused by donor-recipient antigen disparity. Furthermore, the practice of electronic genotypic matching has the potential to eliminate the need for repeat pretransfusion testing and additional serologic testing for a majority of patients. This could result in significant financial benefits for patients, hospitals, and governments in the future. Genotypic matching will also ease or eliminate labor-intensive serologic platforms or methods, such as adsorptions or elutions, which subject patients to long delays for management. If the full genotype of a particular patient is known, the turnaround time for finding phenotypically matched donor units can be improved with a computer-assisted database management system that has the ability to query a well-characterized and comprehensive donor genotype profile.
In conclusion, our study showed a significant donor-recipient phenotype mismatch for certain blood group antigens, such that some ethnic groups are predisposed to a higher risk of alloimmunization to clinically significant antigens such as C, c, E, K, Jkb, and Fya. A diversified donor pool that has been characterized genotypically to predict RBC antigen expression has the potential to enable transfusion medicine practitioners to provide individualized RBC products for recipients through extended genotypic matching.
Acknowledgments
This material is made possible by the efforts of the staff of the Division of Transfusion Medicine at Mayo Clinic–Rochester. Our heartfelt thanks to the staff of our Donor Service, Transfusion, Reference, and Component Laboratories. We also thank Denice Bredlow for her secretarial assistance.
RBC phenotype matching and ethnicity
18 IMMUNOHEMATOLOGY, Volume 27, Number 1, 2011
J.R. Stubbs et al.
References
1. Mayo Clinic. Mayo Clinic Rochester 2007 statistics. Rochester, MN: Mayo Clinic, 2007.
2. 2009 Population Estimates by Race and Ethnicity for Southeast Minnesota Counties. http://ctsa.mayo.edu/resources/upload/2009-population-estimates.pdf. Accessed April 7, 2011.
3. Roback JD, Combs MR, Grossman BJ, Hillyer CD. Technical manual. 16th ed. Bethesda, MD: AABB, 2008.
4. Higgins JM, Sloan SR. Stochastic modeling of human RBC alloimmunization: evidence for a distinct population of immunologic responders. Blood 2008;112:2546–53.
5. Schonewille H, van de Watering LM, Brand A. Additional red cell alloantibodies after blood transfusions in a nonhematologic alloimmunized patient cohort: is it time to take precautionary measures? Transfusion 2006;46:630–5.
6. Schonewille H, de Vries RR, Brand A. Alloimmune response after additional red blood cell antigen challenge in immunized hematooncology patients. Transfusion 2009; 49:453–7.
7. Pomper GJ, Simpson MB. The prevention of alloimmunization: a balance of precaution, expectation, and outcome. Transfusion 2009;49:406–8.
8. Young PP, Uzieblo A, Trulock E, Lublin DM, Goodnough LT. Autoantibody formation after alloimmunization: are blood transfusions a risk factor for autoimmune hemolytic anemia? Transfusion 2004;44:67–72.
9. Singer ST, Wu V, Mignacca R, Kuypers FA, Morel P, Vichinsky EP. Alloimmunization and erythrocyte autoimmunization in transfusion-dependent thalassemia patients of predominantly Asian descent. Blood 2000;96:3369–73.
10. Nanu A, Thapliyal RM. Blood group gene frequency in a selected north Indian population. Indian J Med Res 1997; 106:242–6.
11. Bonferroni CE. Teoria statistica delle classi e calcolo delle probabilit’a. Pubblicazioni del R Istituto Superiore di Scienze Economiche e Commerciali di Firenze 1936;8:3–62.
12. Harmening D. Modern blood banking and transfusion practices. 2nd ed. Philadelphia, PA: FA Davis, 1989:78–102.
13. Ssebabi, EC. Characteristics of African blood. CRC Crit Rev Clin Lab Sci 1975;6:19–45.
14. Sistonen P, Koistinen J, Aden Abdulle O. Distribution of blood groups in the East African Somali population. Hum Hered 1987;37:300–13.
15. Hawkins BR, Simons MJ. Blood group studies in an urban Chinese population. Hum Hered 1976;26:441–453.
16. Nathalang O, Kuvanont S, Punyaprasiddhi P, Tasaniyanonda C, Sriphaisal T. A preliminary study of the distribution of blood group systems in Thai blood donors determined by the gel test. Southeast Asian J Trop Med Public Health 2001;32:204–7.
17. Mourant AE, Kopec AC, Domaniewska-Sobczak K. The distribution of the human blood groups and other polymorphisms. 2nd ed. London: Oxford University Press, 1976.
18. Grunbaum BW, Seivin S, Myhre BA, Pace N. Distribution of gene frequencies and discrimination probabilities for 22 human blood genetic systems in four racial groups. J Forensic Sci 1980;25:428–44.
19. Abdelaal MA, Anyaegbu CC, al Sobhi EM, al Baz NM, Hodan K. Blood group phenotype distribution in Saudi Arabs. Afr J Med Med Sci 1999;28:133–5.
20. Reid ME, Lomas-Francis C. Blood group antigens and antibodies: a guide to clinical relevance and technical tips. New York, NY: SBB Books, 2007.
21. Tills D, Kopec AC, Tills RE. The distribution of the human blood groups and other polymorphisms. Supplement 1. Oxford University Press, New York, NY. 1983.
22. Schonewille H, van de Watering LM, Loomans DA, Brand A. Red blood cell alloantibodies after transfusion: factors influencing incidence and specificity. Transfusion 2006;46:250–6.
23. Heddle NM, Soutar RL, O’Hoski PL, et al. A prospective study to determine the frequency and clinical significance of alloimmunization post-transfusion. Br J Haematol, 91: 1000–5.
24. Tormey CA, Stack G. The persistence and evanescence of blood group alloantibodies in men. Transfusion 2009;49: 505–12.
25. Cox JV, Steane E, Cunningham G, Frenkel EP. Risk of alloimmunization and delayed hemolytic transfusion reactions in patients with sickle cell disease. Arch Intern Med 1988;148:2485–9.
Karafa S.W. Badjie, MS, MLS(ASCP)SBBCM, RT-General (CSMLS), (corresponding author), Supervisor, Transfusion Laboratory, Craig D. Tauscher, MT(ASCP), SBB, Technical Specialist, Reference Laboratory, and Camille M. van Buskirk, MD, Medical Director of Component Laboratory, Department of Laboratory Medicine and Pathology, Division of Transfusion Medicine, Mayo Clinic, 200 First Street SW, Rochester, MN 55905; Clare Wong, Education & Training, Gulf Coast Regional Blood Center, Houston, TX; and Sarah M. Jenkins, MS, Biostatistician, and Carin Y. Smith, BS, Statistical Programmer Analyst, Department of Health Sciences Research, Division of Biomedical Statistics & Informatics, and James R. Stubbs, MD, Medical Director, Transfusion and Reference Laboratories, Department of Laboratory Medicine and Pathology, Division of Transfusion Medicine, Mayo Clinic, Rochester, MN.
IMMUNOHEMATOLOGY, Volume 27, Number 1, 2011 19
RBC phenotype matching and ethnicity
Appendix
Additional Details and an Example Calculation for Determining an Exact Match Using Statistical Methods
The probability of getting an exact match with respect to the phenotype from a randomly selected donor from our donor pool and a randomly selected patient from a particular ethnic group within each antigen group was calculated. These calculations assumed that the observed antigen distribution from the sample of 800 donors is representative of the population of our donors. Using the Kell group as an example, the distribution of phenotypes in our donor pool is as follows: K–k+ 90.375 percent, K+k– 0.375 percent, and K+k+ 9.25 percent. The published distribution of these phenotypes in the general Caucasian population is as follows: 91 percent, 0.2 percent, and 8.8 percent. Thus, if a single Mayo Clinic blood donor and a single Caucasian recipient are randomly selected, the probability of an exact match is equal to the chance that the following scenario
occurs: (the randomly selected Mayo Clinic donor is K–k+ AND the randomly selected Caucasian patient is K–k+) OR (the randomly selected Mayo Clinic donor is K+k– AND the randomly selected Caucasian patient is K+k–) OR (the randomly selected Mayo Clinic donor is K+k+ AND the randomly selected Caucasian patient is K+k+), resulting in the following calculation:
= P(K–k+|Mayo) × P(K–k+|Caucasian) + P(K+k–|Mayo) × P(K+k–|Caucasian) + P(K+k+|Mayo) × P(K+k+|Caucasian)= (0.90375 × 0.91) + (0.00375 × 0.002) + (0.0925 × 0.088)= 0.83
In general terms, this calculation uses the following probability rules: (1) if events A and B are independent, then the P(A and B) = P(A) × P(B); and (2) if events A and B are mutually exclusive, then P(A or B) = P(A) + P(B).
Notice to ReadersImmunohematology is printed on acid-free paper.
For information concerning Immunohematology or the Immunohematology Methods and Procedures manual, contact us by e-mail at [email protected]
The editorial staff of Immunohematology welcomes manuscripts pertaining to blood group serology and education for consideration for publication. We are especially interested in case reports, papers on platelet and white cell serology, scientific articles covering original investigations, and papers on new methods for use in the blood bank. Deadlines for receipt of manuscripts for consideration for the March, June, September, and December
issues are the first weeks in November, February, May, and August, respectively. For instructions for scientific articles, case reports, and review articles, see Instructions for Authors in every issue of Immunohematology or on the Web at www.redcross.org/immunohematology. Include fax and phone numbers and e-mail address with all manuscripts and correspondence. E-mail all manuscripts to [email protected]
Manuscripts

20 IMMUNOHEMATOLOGY, Volume 27, Number 1, 2011
Patient samples were referred to our immunohematology reference laboratory to investigate the presence of a weak D antigen. In the last 3 years, 26 samples were received. Serology and molecular analyses were performed to identify the weak D variant. RHD mRNA from all patients was reverse transcribed, and cDNA was sequenced. The results were compared with a normal RHD sequence to identify the polymorphisms causing the weak D phenotype. Five different already known RHD variants were observed: weak D type 1 (5 individuals), weak D type 2 (1 individual), weak D type 42 (17 individuals), weak D type 45 (1 individual), and partial D DNB (2 individuals). Surprisingly, weak D type 42 was prevalent in our population, whereas weak D type 1, 2, and 3 are the most prevalent variants elsewhere. Anti-D was found in six cases of weak D type 42. The higher prevalence of weak D type 42 could be the result of a founder effect. Additional studies are needed to estimate the frequency of this variant in the general population. Immunohematology 2011;27:20–24.
Key Words: Weak D, RH genotyping, anti-D, alloimmunization, Caucasians
The D antigen can induce Rh-incompatible blood transfusion reactions and hemolytic disease of the fetus and the newborn (HDFN). It is the next most clinically significant blood group antigen after ABO.1–5 The lack of RHD in 15 percent of Caucasians, 3 to 5 percent of Africans, and less than 1 percent of Asians and the extreme immunogenicity of its encoded D antigen explain the high incompatibility risk, which is of great concern for blood transfusion specialists.2,3,6
To prevent alloimmunization of D– recipients and to avoid the administration of D+ blood to patients who already have developed an alloanti-D, blood donor typing should identify all donors expressing the D antigen.3,4 Unfortunately, the serologic distinction between D+ and D– RBCs is not always straightforward.7 This can be related to different reagents and to aberrant RHD alleles. Although hundreds of RHD variants have been described in the literature, they remain rare events with an estimated prevalence of 1 to 2 percent in Caucasians and slightly higher rates in African Americans and Hispanics.8 As of January 2011, 76 weak D alleles have been described (types 1–76, plus 8 subtypes9).
These variants are classified according to the serology profile obtained with different anti-D reagents: weak D, partial D, and DEL, which is only demonstrated by adsorption-elution.5,10–14 Weak D phenotypes express a reduced amount of D antigen of otherwise unchanged quality as a result of point mutations in the membrane-spanning domains or cytoplasmic loops of the protein. Anti-D alloimmunization is unusual in these individuals.3,6,8,11,13,15–17
On the other hand, partial D phenotypes lack one or more epitopes of the D protein and present antigenic modifications caused by RHD/RHCE hybrid genes or RHD point mutations mostly affecting external loops of the protein.4–6 These individuals are prone to anti-D alloimmunization.
The weakest D phenotype, DEL, can only be detected by adsorption-elution techniques, from which it gets its name. Individuals with DEL phenotype are routinely typed as D– and are frequent in Asia.4 Molecular analyses have demonstrated that DEL samples retain an intact RHD or have a large RHD portion in their genome.5,13 Transfusion specialists are still debating the potential alloimmunization risk as it relates to the classification of aberrant RHD alleles, especially of DEL donors and patients.5,18,19
Several studies have concluded that weak D type 1, type 2, and type 3 are the most frequent, at least in Germany, Austria, the Netherlands, and France.20 In our cohort of patients, weak D type 42 seems to be the most prevalent, with 17 samples identified in the last 3 years. This weak D was first described in two Canadian blood donors by Denomme et al.7 In this study, we describe the serology and the molecular analyses done for these cases.
Materials and Methods
SerologyFrom October 2006 to January 2010, 26 Caucasian
samples, all multi-generation French Canadians (4 men and 22 women) presenting a weaker D reaction (< 3+ before the indirect antiglobulin test phase (IAT)) or a normal strength
Weak D type 42 cases found in individuals of European descentM. St-Louis, M. Richard, M. Côté, C. Éthier, and A. Long
Case RepoRt

IMMUNOHEMATOLOGY, Volume 27, Number 1, 2011 21
Weak D type 42 in Quebec
of 4+ with anti-D and negative direct antiglobulin test (DAT) were referred to our immunohematology reference laboratory (IRL).
The D phenotype was determined by the classic tube technique using up to three sources of anti-D: Gamma (IgM GAMA401 + IgG F8D8, ImmucorGamma, Norcross, GA), Novaclone (DBL; IgM D175–2 + IgG D4151E4, ImmucorGamma), and BioClone (IgM MAD2 + IgG [polyclonal], Ortho-Clinical Diagnostics, Markham, Ontario, Canada). The D antibodies were identified using the IAT gel card technique (ID-Micro Typing System, Ortho-Clinical Diagnostics) with Héma-Québec’s red blood cell (RBC) panels. To distinguish autoantibodies from alloantibodies, autoadsorptions were performed if the patient had not been transfused in the last 3 months. An acid elution was performed following the manufacturer’s instructions (EluKit Plus, Immucor Gamma) for the samples with positive DAT. The eluate was tested with D+ and D– RBCs.
Molecular BiologyAll samples were analyzed at the molecular level in our
Research and Development Laboratory. Messenger RNA was studied in all cases. Genomic DNA was analyzed only for the weak D type 42.
RNAThe reticulocyte-enriched buffy coat from a 7-mL
EDTA blood tube was transferred to a fresh 2-mL tube containing 1 mL of Trizol (Invitrogen, Burlington, Ontario, Canada) and mixed well, or 500 µL of whole blood was added to RNAlater (Applied Biosystems Inc. [ABI], Carlsbad, CA). The RNA isolation was performed following the manufacturers’ specifications. RNA was quantified, reverse transcribed, and amplified by using the One-Step RT-PCR (Qiagen, Mississauga, Ontario, Canada). Forward primer 397 located in RHD/RHCE 5′ end, 5′-cac-agg-atg-agc-tct-aag-tac-3′, and reverse primer 625 located in RHD 3′UTR, 5′-taa-atg-gtg-aga-ttc-tcc-tc-3′, were used.10,21 The full 1446-bp transcript was gel purified and sequenced (ABI 3130xl Genetic Analyzer). The sequence was compared with Genbank X63097.
DNATwo hundred microliters of EDTA-collected blood
was kept at –80°C before DNA extraction using QIAamp mini blood kit (Qiagen) following manufacturer’s instructions. For weak D type 42 samples, RHD exon 9 was amplified from genomic DNA by classic touchdown PCR procedure. The PCR master mix contained 5% glycerol, 1× AmpliTaq Gold Buffer II, 2.5 mM MgCl2, 200 µM dNTPs, 2.5 U AmpliTaq Gold, and 0.35 µM of forward primer
560-RHD-i8-67F, 5′-tga-gat-act-gtc-gtt-ttg-aca-cac-aat-act-tc-3′ located in RHD intron 8, and reverse primer 561- RGD-i9+62R, 5′-gtt-tta-ctc-ata-aac-agc-aag-tca-aca-tat-atc-ct-3′, located in RHD intron 9.13 The hybrid Rhesus box was also examined following the process published by Wagner and colleagues.22
Weak D Type 42 PCR-SSPA PCR–sequence-specific primer (SSP) assay was
designed to facilitate the analysis of the weak D type 42. Genomic DNA was amplified with forward primer 560 described previously and reverse primer 1034-wRHD-42-as 5′-cta-tca-cgt-taa-tag-gtg-aac-aat-ctt-acC-A-3′ located part in RHD exon 9 and part in intron 9. The ‘c’ was mutated in the primer to avoid a long ‘a’ stretch. A 202-bp product was amplified only when the weak D type 42 allele was present.23
Results
SerologyThe samples described in the course of this study were
referred to our IRL because of a weak D phenotype or the presence of anti-D in D+ patients with negative DAT. Most consisted of prenatal follow-up and surgery patients for whom an alloimmunization was possible through pregnancy or transfusion. Table 1 summarizes the serology and molecular biology results.
The reactivity with the anti-D reagents ranged from 0 to 4+. Most weak D type 42 samples reacted 1+ to 2+ with Gamma-clone and Novaclone. The BioClone gave no reactions, except with patient 11 (3+). Surprisingly, patient 13 showed no reactivity with the three anti-D sources assayed. No adsorption-elution was attempted to clarify between a DEL and a D– phenotype.
In the case of weak D type 1 and weak D type 2, the anti-D reactivity was on average 2+ with the three reagents, except for the sample from patient 18 (4+), which presented autoanti-D and autoanti-C. The situation was different for the weak D type 45 sample and for the two samples with the DNB phenotype: in all three the reactivity was 4+ and an alloanti-D was found.
Molecular BiologyThe mRNA sequence analysis of all 26 samples showed
a polymorphism that could explain the weak D phenotype or the presence of alloanti-D. Seventeen samples were found to be weak D type 42 (65.4%, 1 man and 16 women), five were weak D type 1 (19.2%, 2 men and 3 women), one sample was found to be weak D type 2 (3.8%, 1 woman), one was weak D type 45 (3.8%, 1 woman), and two were
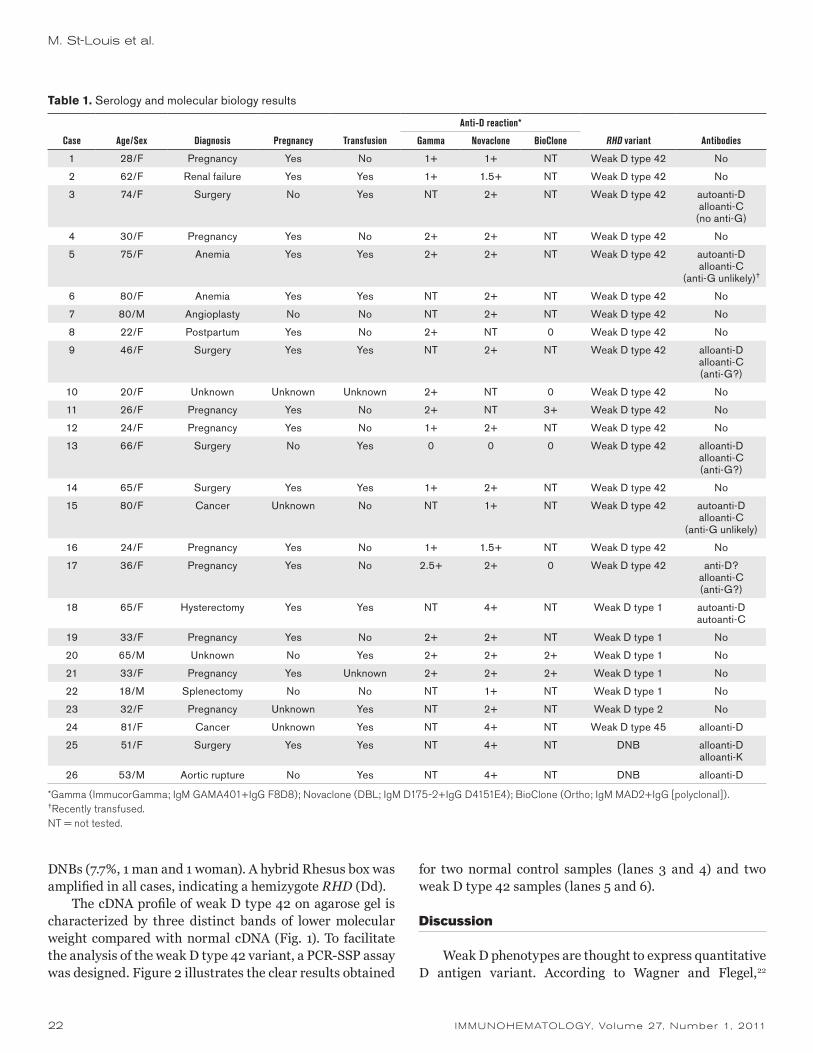
22 IMMUNOHEMATOLOGY, Volume 27, Number 1, 2011
DNBs (7.7%, 1 man and 1 woman). A hybrid Rhesus box was amplified in all cases, indicating a hemizygote RHD (Dd).
The cDNA profile of weak D type 42 on agarose gel is characterized by three distinct bands of lower molecular weight compared with normal cDNA (Fig. 1). To facilitate the analysis of the weak D type 42 variant, a PCR-SSP assay was designed. Figure 2 illustrates the clear results obtained
for two normal control samples (lanes 3 and 4) and two weak D type 42 samples (lanes 5 and 6).
Discussion
Weak D phenotypes are thought to express quantitative D antigen variant. According to Wagner and Flegel,22
Table 1. Serology and molecular biology results
Anti-D reaction*
Case Age/Sex Diagnosis Pregnancy Transfusion Gamma Novaclone BioClone RHD variant Antibodies
1 28/F Pregnancy Yes No 1+ 1+ NT Weak D type 42 No
2 62/F Renal failure Yes Yes 1+ 1.5+ NT Weak D type 42 No
3 74/F Surgery No Yes NT 2+ NT Weak D type 42 autoanti-Dalloanti-C
(no anti-G)
4 30/F Pregnancy Yes No 2+ 2+ NT Weak D type 42 No
5 75/F Anemia Yes Yes 2+ 2+ NT Weak D type 42 autoanti-Dalloanti-C
(anti-G unlikely)†
6 80/F Anemia Yes Yes NT 2+ NT Weak D type 42 No
7 80/M Angioplasty No No NT 2+ NT Weak D type 42 No
8 22/F Postpartum Yes No 2+ NT 0 Weak D type 42 No
9 46/F Surgery Yes Yes NT 2+ NT Weak D type 42 alloanti-Dalloanti-C(anti-G?)
10 20/F Unknown Unknown Unknown 2+ NT 0 Weak D type 42 No
11 26/F Pregnancy Yes No 2+ NT 3+ Weak D type 42 No
12 24/F Pregnancy Yes No 1+ 2+ NT Weak D type 42 No
13 66/F Surgery No Yes 0 0 0 Weak D type 42 alloanti-Dalloanti-C(anti-G?)
14 65/F Surgery Yes Yes 1+ 2+ NT Weak D type 42 No
15 80/F Cancer Unknown No NT 1+ NT Weak D type 42 autoanti-Dalloanti-C
(anti-G unlikely)
16 24/F Pregnancy Yes No 1+ 1.5+ NT Weak D type 42 No
17 36/F Pregnancy Yes No 2.5+ 2+ 0 Weak D type 42 anti-D?alloanti-C(anti-G?)
18 65/F Hysterectomy Yes Yes NT 4+ NT Weak D type 1 autoanti-Dautoanti-C
19 33/F Pregnancy Yes No 2+ 2+ NT Weak D type 1 No
20 65/M Unknown No Yes 2+ 2+ 2+ Weak D type 1 No
21 33/F Pregnancy Yes Unknown 2+ 2+ 2+ Weak D type 1 No
22 18/M Splenectomy No No NT 1+ NT Weak D type 1 No
23 32/F Pregnancy Unknown Yes NT 2+ NT Weak D type 2 No
24 81/F Cancer Unknown Yes NT 4+ NT Weak D type 45 alloanti-D
25 51/F Surgery Yes Yes NT 4+ NT DNB alloanti-Dalloanti-K
26 53/M Aortic rupture No Yes NT 4+ NT DNB alloanti-D
*Gamma (ImmucorGamma; IgM GAMA401+IgG F8D8); Novaclone (DBL; IgM D175-2+IgG D4151E4); BioClone (Ortho; IgM MAD2+IgG [polyclonal]).†Recently transfused.NT = not tested.
M. St-Louis et al.
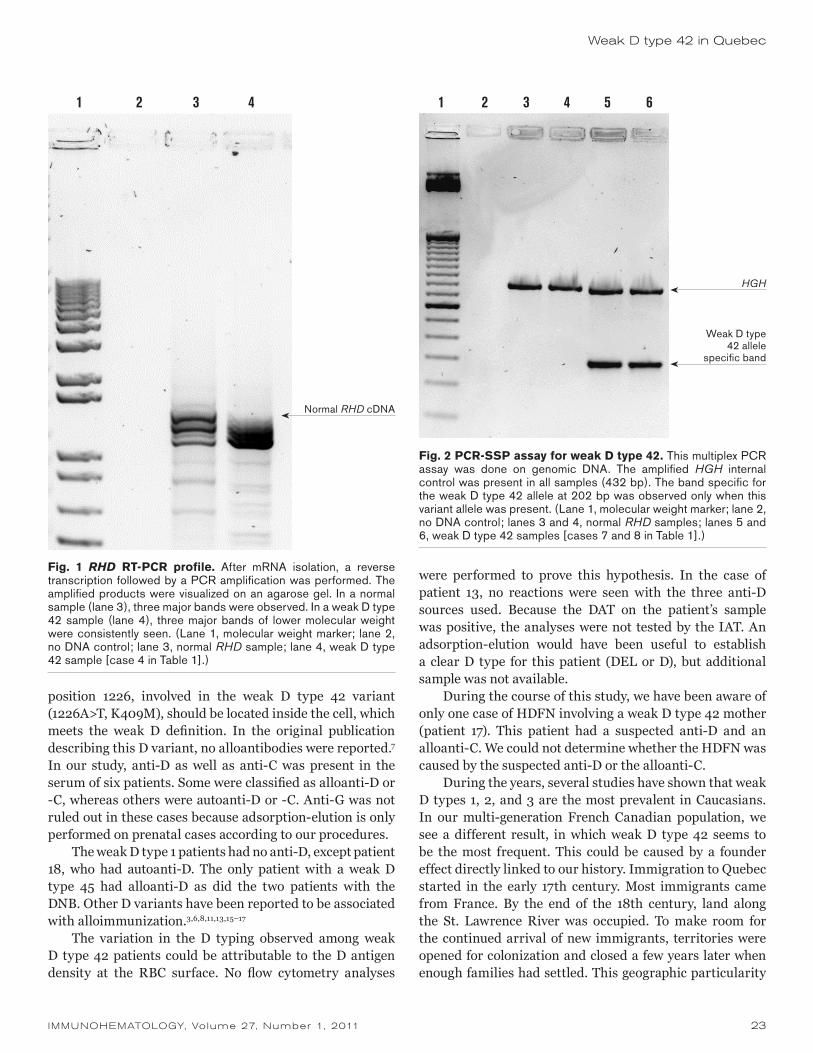
IMMUNOHEMATOLOGY, Volume 27, Number 1, 2011 23
position 1226, involved in the weak D type 42 variant (1226A>T, K409M), should be located inside the cell, which meets the weak D definition. In the original publication describing this D variant, no alloantibodies were reported.7 In our study, anti-D as well as anti-C was present in the serum of six patients. Some were classified as alloanti-D or -C, whereas others were autoanti-D or -C. Anti-G was not ruled out in these cases because adsorption-elution is only performed on prenatal cases according to our procedures.
The weak D type 1 patients had no anti-D, except patient 18, who had autoanti-D. The only patient with a weak D type 45 had alloanti-D as did the two patients with the DNB. Other D variants have been reported to be associated with alloimmunization.3,6,8,11,13,15–17
The variation in the D typing observed among weak D type 42 patients could be attributable to the D antigen density at the RBC surface. No flow cytometry analyses
were performed to prove this hypothesis. In the case of patient 13, no reactions were seen with the three anti-D sources used. Because the DAT on the patient’s sample was positive, the analyses were not tested by the IAT. An adsorption-elution would have been useful to establish a clear D type for this patient (DEL or D), but additional sample was not available.
During the course of this study, we have been aware of only one case of HDFN involving a weak D type 42 mother (patient 17). This patient had a suspected anti-D and an alloanti-C. We could not determine whether the HDFN was caused by the suspected anti-D or the alloanti-C.
During the years, several studies have shown that weak D types 1, 2, and 3 are the most prevalent in Caucasians. In our multi-generation French Canadian population, we see a different result, in which weak D type 42 seems to be the most frequent. This could be caused by a founder effect directly linked to our history. Immigration to Quebec started in the early 17th century. Most immigrants came from France. By the end of the 18th century, land along the St. Lawrence River was occupied. To make room for the continued arrival of new immigrants, territories were opened for colonization and closed a few years later when enough families had settled. This geographic particularity
1 2 3 4
Normal RHD cDNA
Fig. 1 RHD RT-PCR profile. After mRNA isolation, a reverse transcription followed by a PCR amplification was performed. The amplified products were visualized on an agarose gel. In a normal sample (lane 3), three major bands were observed. In a weak D type 42 sample (lane 4), three major bands of lower molecular weight were consistently seen. (Lane 1, molecular weight marker; lane 2, no DNA control; lane 3, normal RHD sample; lane 4, weak D type 42 sample [case 4 in Table 1].)
Fig. 2 PCR-SSP assay for weak D type 42. This multiplex PCR assay was done on genomic DNA. The amplified HGH internal control was present in all samples (432 bp). The band specific for the weak D type 42 allele at 202 bp was observed only when this variant allele was present. (Lane 1, molecular weight marker; lane 2, no DNA control; lanes 3 and 4, normal RHD samples; lanes 5 and 6, weak D type 42 samples [cases 7 and 8 in Table 1].)
HGH
Weak D type 42 allele
specific band
1 2 3 4 5 6
Weak D type 42 in Quebec
24 IMMUNOHEMATOLOGY, Volume 27, Number 1, 2011
limited access to a diversified genetic background, causing a founder effect. It is particularly observed in genetic diseases.24
Our blood donor population consists of 99.6 percent multi-generation French Canadians (Yvan Charbonneau, Ing., VP Exploitation Héma-Québec, personal communication). It would be interesting to evaluate the prevalence of the weak D type 42 in the general population. A preliminary study found no weak D type 42 samples (data not shown) among 500 D+ blood donors originating from different regions of the province. This study should be pursued in the near future.
Additional note: Since this work was submitted, more samples were analyzed. The total number of weak D type 42 samples has now reached 50. Additional RHD variant samples were found: nineteen weak D type 1, four weak D type 2, and six other unique variants.
Acknowledgments
The authors would like to thank the Laboratoire de référence et de cellules souches for the serology workup.
References
1. Liu W, Avent ND, Jones JW, Scott ML, Voak D. Molecular configuration of the Rh D epitopes as defined by site-directed mutagenesis and expression of mutant Rh constructs in K562 erythroleukemia cells. Blood 1999;94:3986–96.
2. Singleton BK, Green CA, Avent ND, et al. The presence of an RHD pseudogene containing a 37 base pair duplication and a nonsense mutation in Africans with the Rh D-negative blood group phenotype. Blood 2000;95:12–18.
3. Wagner FF, Frohmajer A, Flegel WA. RHD positive haplotypes in D negative Europeans. BMC Genet 2001;2:10.
4. Wagner T, Körmöczi GF, Buchta C, et al. Anti-D immunization by DEL red blood cells. Transfusion 2005;45:520–6.
5. Körmöczi GF, Gassner C, Shao CP, Uchikawa M, Legler TJ. A comprehensive analysis of DEL types: partial DEL individuals are prone to anti-D alloimmunization. Transfusion 2005;45:1561–7.
6. Paccapelo C, Truglio F, Sala V, et al. RHD phenotype prediction by molecular analysis to identify weak and partial D (abstract). Transfusion 2008;48:182A–3A.
7. Denomme GA, Wagner FF, Fernandes BJ, Li W, Flegel WA. Partial D, weak D types, and novel RHD alleles among 33,864 multiethnic patients: implications for anti-D alloimmunization and prevention. Transfusion 2005;45: 1554–60.
8. Westhoff CM. The Rh blood group system in review: a new face for the next decade. Transfusion 2004;44:1663–73.
9. Wagner FF. RhesusBase. Available at http://www.uni-ulm.de/%7Efwagner/RH/RB/. Accessed March 7, 2011.
10. Polin H, Danzer M, Gaszner W, et al. Identification of RHD alleles with the potential of anti-D immunization among
seemingly D– blood donors in Upper Austria. Transfusion 2009;49:676–81.
11. Castilho L, Carvalho T, Credidio D, Pelligrino J. RHD genotyping in blood donors with highly diverse ancestry phenotyped as D-negative (abstract). Transfusion 2008;48: 188A.
12. Richard M, St-Louis M. Molecular analysis of appearing RhD negative blood donors genotyped RH2 and/or RH3 positive (abstract). Transfusion 2008;48:186A.
13. Gassner C, Doescher A, Drnovsek TD, et al. Presence of RHD in serologically D–, C/E+ individuals: a European multicenter study. Transfusion 2005;45:527–38.
14. Flegel A, Von Zabern I, Wagner F. RHD gene carriers among serologically D negative donors: alleles and population frequency in central Europe (abstract). Vox Sang 2006;91(Suppl 3):16.
15. Wagner FF, Frohmajer A, Ladewig B, et al. Weak D alleles express distinct phenotypes. Blood 2000;95:2699–708.
16. Legler TJ, Maas JH, Köhler M, et al. RHD sequencing: a new tool for decision making on transfusion therapy and provision of Rh prophylaxis. Transfus Med 2001;11:383–8.
17. Le Maréchal C, Guerry C, Benech C, et al. Identification of 12 novel RHD alleles in western France by denaturing high-performance liquid chromatography analysis. Transfusion 2007;47:858–63.
18. Kumpel B. Are weak D RBCs really immunogenic? Transfusion 2006;46:1061–6.
19. Daniels G, Poole G, Poole J. Partial D and weak D: can they be distinguished? Transfus Med 2007;17:145–6.
20. Flegel WA, von Zabern I, Wagner FF. Six years’ experience performing RHD genotyping to confirm D– red blood cell units in Germany for preventing anti-D immunizations. Transfusion 2009;49:465–71.
21. Richard M, Perreault J, Constanzo-Yanez J, Khalifé S, St-Louis M. A new DEL variant caused by exon 8 deletion. Transfusion 2007;47:852–7.
22. Wagner FF, Flegel WA. RHD deletion occurred in the Rhesus box. Blood 2000;95:3662–8.
23. St-Louis M, Perreault J, Lemieux R. Extended blood grouping of blood donors with automatable PCR-ELISA genotyping. Transfusion 2003;43:1126–32.
24. Laberge A-M, Michaud J, Richter A, et al. Population history and its impact on medical genetics in Quebec. Clin Genet 2005;68:287–301.
Maryse St-Louis, PhD, Scientist (corresponding author), and Martine Richard, PhD, Research Assistant, Research and Development, and Marie Côté, MLT, Chief Red Blood Cell Immunohematology, and Carole Éthier, MLT, Chief Technician, Laboratoire de référence et des cellules souches, Héma-Québec, 1070, avenue des Sciences-de-la-Vie, Québec (Québec) G1V 5C3 Canada; and Anne Long, MD, Physician, Québec, Canada.
M. St-Louis et al.

IMMUNOHEMATOLOGY, Volume 27, Number 1, 2011 25
The known presence of RHD blood group alleles in apparently D– individuals who are positive for C or E antigens leads to an appropriate investigation for the RHD gene on the red blood cells (RBCs) of D– blood donors, thus preventing their RBCs from immunizing D– recipients. Ready-to-use polymerase chain reaction–sequence-specific primer (PCR-SSP) typing kits are available and allow single-sample results. The need to perform this testing on a large number of donors affiliated with the Transfusion Department of Udine (Northern Italy) led to the use of molecular genetic RH blood group typing with PCR-SSP test kits and DNA samples mixed in pools. From a population of 35,000 blood donors screened for D antigen by serologic typing, a total of 235 samples, distributed in pools of 5 DNA samples, were investigated. Positive results were reevaluated by opening the pools and retesting single samples. Validation of DNA-pool typing with commercial kits was done. Among 235 genotyped samples, 12 were found to be PCR positive (5.1%), exhibiting DEL genotype and RHD-CE-D hybrid alleles. Our data demonstrate that the use of a PCR-SSP commercial test kit with pooled samples is a helpful and valid method to correctly detect RHD alleles. As a consequence, we reclassified our donors as carriers of potentially immunogenic alleles. Immunohematology 2011;27:25–28.
Key Words: Rh blood group, D antigen expression, blood donors, PCR-SSP test kit
Antigens of the Rh blood group system are products of RHD and RHCE genes, highly homologous DNA sequences residing closely adjacent on chromosome 1p34–36.2. A large series of molecular events, such as gene conversion, mutation, deletion, and recombination, leads to the existence of 167 RHD alleles and 80 RHCE alleles responsible for Rh phenotypes.1 As stated by Wagner and Flegel2 and Flegel,3 there is no absolute correlation among molecular structures, phenotypes, and clinical relevance of RHD alleles, but in organizing all the known information, they were classified according to their phenotype and molecular variation as partial D, weak D, DEL, D–, and D+. As the purpose of a transfusion service is to enable accurate identification of donor characteristics and avoid the risk
of immunization in recipients, these phenotypes must be distinguished. Thus, to prevent D alloimmunization, D typing approaches for recognition of particularly weak or rare D variants become essential. The use of two different anti-D reagents and of the indirect antiglobulin test (IAT) in routine serology is not always adequate to identify the variants of the Rh system, also considering that these variants often demonstrate ethnic variability.4–8
The most frequent cause for the absence of the D antigen in Caucasians is the lack of the whole RHD gene as a result of a deletion occurring in the Rhesus box.9,10 But approximately 1 percent of the European population carry aberrant RHD alleles, that is RHD alleles associated with reduced D antigen expression, which may be mistyped as D– by standard serologic methods. Moreover, these aberrant RHD alleles may not be discovered by more sensitive serologic methods even if they are clinically important as in the case of weak D type 26 and DEL phenotypes.11,12
Most of these barely expressed or completely unexpressed RHD alleles are associated with the presence of C or E antigens; in particular RHD-CE-D hybrid alleles and DELs alleles were identified. Taking into account that different region-specific alleles were previously demonstrated in central Europe,11 and that molecular typing may overcome the limitations of serologic methods, we investigated RHD alleles among blood donor samples serologically D–/C+ or D–/E+ by means of commercially available PCR-SSP kits. Our opportunity to use these kits in a routine laboratory capable of using only commercially prepared kits led us to adapt them for mass screening of blood donors.
Materials and Methods
A total of 35,000 blood donors affiliated with the Transfusion Department of Udine (Northern Italy) were screened for D antigen by the use of three different reagents: a monoclonal immunoglobulin M (IgM) reagent
Molecular RH blood group typing of serologically D–/CE+ donors: the use of a polymerase chain reaction–sequence-specific primer test kit with pooled samplesD. Londero, M. Fiorino, V. Miotti, and V. De Angelis
Case RepoRt

26 IMMUNOHEMATOLOGY, Volume 27, Number 1, 2011
(immuClone anti-D rapid, Immucor Italia S.p.A., Milan, Italy), a blended monoclonal anti-D reagent (immuClone anti-D duo IgM+ IgG, Immucor), and a blended monoclonal anti-CDE reagent (immuClone anti-CDE IgM+ IgG, Immucor). After investigation by an IAT, a total of 235 samples that were D–/C+ or D–/E+ were selected.
DNA was isolated from 200 µL of whole blood, using QIAamp DNA Blood Mini Kit (QIAGEN S.p.A., Milan, Italy), and the final elution was in 60 µL of distilled water. Determination of DNA concentration was performed by ultraviolet (UV) quantification (OD 260/280 ratio).
After extraction, DNA samples were distributed, on the basis of the exhibiting phenotype, in pools of five samples. Molecular typing was performed by using two ready-to-use PCR-SSP commercial kits for each pool: the BAGene RH-TYPE kit (BAG Health Care GmbH, Lich, Germany) that identifies the most widespread DEL phenotypes, RHD(K409K), RHD(M295I), RHD(IVS3+1G>A); and the BAGene Partial D-TYPE kit (BAG Health Care GmbH) that identifies the hybrid alleles RHCE-D(5)-CE, RHCE(1–9)-D, RHD-CE(2–9)-D, RHE-CE(3–7)-D, RHD-CE(4–7)-D, RHD-CE(8–9)-D, and other partial phenotypes.
Pools with positive results in PCR were reevaluated by opening the pools and retesting single samples with the appropriate kit that gave the positive reaction. In addition, another kit (Ready Gene CDE, Innotrain Diagnostik GmbH, Kronberg/Taunus, Germany), able to identify the involved specificities, was used to confirm molecular typing of hybrid alleles.
Validation of DNA pool typing with commercial kits was performed. Pretyped in-house samples positive for RHD variants were mixed with pretyped negative samples; the sensitivity and specificity of the procedure were verified by the presence of the specific amplification product, at the optimal DNA concentration of 18 ng/µL per sample. DNA concentration was chosen after suitable dilution tests.
To validate the use of pooled samples with a commercial kit, 4 pretyped D–/C+ samples were mixed with one reference sample carrier of D VII partial phenotype in control pool A and with one reference sample carrier of DEL-RHD(M295I) phenotype in control pool B. These two control pools were then investigated with BAGene Partial D Type kit and with BAGene Rh Type kit respectively to verify the presence of known amplification products in pooled samples, thus assessing the specificity of the method. Furthermore, the reference sample DNA concentration was lowered to half of the concentration of the four pretyped samples to test the sensitivity (25 ng/µL versus 12 ng/µL). To provide a procedural negative control, both tests were repeated using pools of four pretyped samples with negative reference samples (pool A becomes pool C and pool B becomes pool D).
Results
Figures 1 and 2 show the comparison of the evaluation diagrams and gel pictures of pools A and C and of pools B and D, respectively.
Reaction No. 1 2 3 4 5 6 7 8 9 10 11 12 13 14 15
PCR product (size in bp) 134 146 118 135 132 132 120 673 184 132 166 107 117 129 140
RHD exons D1 D2/C D3 D4 D5 D6 D7 D7/8 D9 D10 D2 D6 D7 D7 D8
Reaction patterns
D–/C+ – + – – – – – – – – – – – – –
DVII + + + + + + + + + + + — — — —
Gel picture pool A (carrying DVII variant)
Control
Specific
MW 1 2 3 4 5 6 7 8
MW 9 10 11 12 13 14 15
400 bp200 bp50 bp
Gel picture pool C (negative control)
MW 1 2 3 4 5 6 7 8
MW 9 10 11 12 13 14 15
400 bp
200 bp50 bp
Control
Specific
Fig. 1 Comparison of the interpretation diagram of partial D type kit and gel pictures of pool A and pool C.
D. Londero et al.

IMMUNOHEMATOLOGY, Volume 27, Number 1, 2011 27
At the end of validation tests, 235 DNA samples of 35,000 blood donors screened were amplified in pools of 5, each one at the optimal DNA concentration of 18 ng/µL per sample. The numbers of samples and phenotypes investigated were 164 Ccddee, 62 ccddEe, 5 CCddee, 3 CcddEe, and 1 ccddEE. Among these genotyped samples, 12 pools were PCR-positive, eventually yielding 12 individual samples, representing the 5.1 percent of all analyzed samples. Each of these 12 pools was analyzed as a single sample with two different PCR-SSP kits, one used for pooled samples (BAG) and another one used to confirm the results (Innotrain). Finally, 11 RHD-CE-D hybrid alleles and 1 RHD (M295I) allele (DEL phenotype) were revealed. In particular, the identified hybrid alleles including large parts of the RHCE gene were 8 RHD-CE (2–9)-D and 3 RHD-CE-DS. The RHD-CE (2–9)-D alleles represent the most frequent hybrid alleles in the Caucasian population,11 and the RHD-CE-DS alleles are generally encoded by RHD allele cluster DIVa, frequently found in D– black Africans.4–6 As confirmation, 2 of 3 donors exhibiting RHD-CE-DS genotype were of African ethnicity.
Table 1 illustrates the correlation between Rh phenotype and RHD variants identified.
Discussion
This study was mainly carried out to validate a molecular method in transfusion practice that allows assessment of the occurrence of RHD alleles in seemingly D– blood donors to prevent the consequent risk of alloimmunization to the D antigen.
It is not feasible or sustainable in a routine transfusion service to identify by single PCR testing all RHD variants that encode potentially immunogenic products but apparently negative donors; thus, an alternative and less costly pooled method must be approached and validated for donor testing in blood banks with large customer bases.
The method described herein seems to be a useful tool to address the problem, which allows identification in minipools (batches of 5 samples) of those apparently D– (even by IAT) donors with RHD that have the potential to be immunogenic. The choice of pools of five samples was done to guarantee the specificity and sensitivity of the
Table 1. Correlation between Rh Phenotype and Genotype
Genotype D phenotype Associated Cc/Ee antigens Number of cases
RHD-CE(2-9)-D D− Ccee 8
RHD-CE-DS D− Ccee 3
RHD (M295I) D− (DEL) Ccee 1
RHD-CE+ using PCR-SSP
Reaction No. 1 2 3 4 5 6 7 8 9 10 11 12 13
PCR product (size in bp)
224123
390248154
140 113 113 198 143 215 162 145 157 155 181
Genotype D4/4
D7
D7
RHD(W16X)RHD Ψ
D4
RHD Ψ negDELRHD
(K409K) neg
DELRHD
(K409K)
DELRHD
(M295I)
DELRHD
(IVS3+1G>A)
CdeS CCw
c E e Cw
Reaction patterns
D–/C+ – – – – – – – – + + – + –
DEL RHD (M295I) +/+ + + + – + – – + + – + –
Fig. 2 Comparison of the interpretation diagram Rh type kit and gel pictures of pool B and pool D.
Gel picture pool B (carrying DEL variant)
Control
Specific
MW 1 2 3 4 5 6 MW
MW 7 8 9 10 11 12 13
400 bp200 bp50 bp
Gel picture pool D (negative control)
MW 1 2 3 4 5 6 7 8
MW 9 10 11 12 13
400 bp200 bp50 bp
Control
Specific

28 IMMUNOHEMATOLOGY, Volume 27, Number 1, 2011
commercial kit test (CE marked) and to collect and type samples exhibiting the same phenotype in the short term.
Reports in the literature quantify the proportion of RHD positivity among serologically D– individuals, to have a relative occurrence from 0.4 to 1 percent13–15; our results, from testing performed among D– donors expressing C or E antigens, are comparable with the prevalence of 5.2 percent RHD positivity determined in a multicenter study11 carried out with a similar cohort in Austria and Slovenia. Our population, in fact, has ethnic characteristics related to Austrian and Slovenian people because of the geographic closeness.
In our population the most frequent allele found (8 of 12) was the hybrid allele RHD-CE(2–9)-D that is considered the most prevalent allele in the Caucasian population. Current literature shows that these hybrids are not uncommon among D– donors, but RBC units carrying them do not pose any risk to D– recipients because of the known lack of D antigen expression.13,16
The RHD-CE-DS hybrid allele was found in three donors, two of whom were black Africans, and therefore these data correlate with the frequency of this allele in Africa.4,6,7 In particular, one donor was from Nigeria and the other one from Ghana, both countries close to Mali, where the haplotype frequency of (C)ceS is 4.3 percent.5 These hybrid genes, belonging to the DIVa RHD cluster, present multiple amino acid substitutions and are difficult to detect using serologic methods6; furthermore, they produce an abnormal C antigen,7 so that a molecular typing is needed to correctly define the Rh phenotype and avoid anti-Rh development.8
The last allele found in our cohort was a DEL allele, RHD(M295I), considered to be the most frequent DEL allele and included in the Eurasian D cluster.14,17 According to literature data, DEL phenotypes, whose D-antigen density on the RBC’s membrane surface is very low, can stimulate the production of anti-D in a D– patient,12,13 and therefore donors carrying DEL phenotypes should be reclassified as D+.
In summary, we demonstrated that the systematic use of genotyping approaches allows the correct RHD and RHCE characterization in blood banks, and thus improves transfusion safety. Therefore we intend to routinely use this minipool testing for RHD IAT-negative C+/E+ donors, with particular attention to different ethnic groups, at their second donation, to avoid the occurrence of transfusion incidents and for the quality control of D– RBC units.16
References
1. Blumenfeld OO, Patnaik SK. Allelic genes of blood group antigens: a source of human mutations and cSNPs documented in the Blood Group Antigen Gene Mutation Database. Hum Mutat 2004;23:8–16.
2. Wagner FF, Flegel WA. Review: the molecular basis of the Rh blood group phenotypes. Immunohematology 2004;20:
23–36. 3. Flegel WA. Molecular genetics of RH and its clinical
application. Transfus Clin Biol 2006;13:4–12. 4. Faas BH, Beckers EA, Wildoer P, et al. Molecular background
of VS and weak C expression in blacks. Transfusion 1997;37: 38–44.
5. Wagner FF, Moulds JM, Tounkara A, Kouriba B, Flegel WA. RHD allele distribution in Africans of Mali. BMC Genet 2003;4:14.
6. Touinsii M, Chapel-Fernandes S, Granier T, Bokilo A, Bailly P, Chiaroni J. Molecular analysis of inactive and active RHD alleles in native Congolese cohorts. Transfusion 2009;49: 1353–60.
7. Rodrigues A, Rios M, Pellegrino J Jr, Costa FF, Castilho L. Presence of the RHD pseudogene and the hybrid RHD-CE-DS gene in Brazilians with the D-negative phenotype. Braz. J Med Biol Res 2002;35:767–73.
8. Pham BN, Peyrard T, Juszczak G, et al. Heterogeneous molecular background of the weak C, VS+, hrB–, HrB– phenotype in black persons. Transfusion 2009;49:495–504.
9. Colin Y, Cherif-Zahar B, Le Van Kim C, Raynal V, Van Huffel V, Cartron JP. Genetic basis of the RhD-positive and RhD-negative blood group polymorphism as determined by Southern analysis. Blood 1991;78:2747–52.
10. Wagner FF, Flegel WA. RHD gene deletion occurred in the Rhesus box. Blood 2000;95:3662–8.
11. Gassner C, Doescher A, Drnovsek TD, et al. Presence of RHD in serologically D–, C/E+ individuals: a European multicenter study. Transfusion 2005;45:527–38.
12. Wagner T, Körmöczi GF, Buchta C, et al. Anti-D immunization by DEL red blood cells. Transfusion 2005;45:520–6.
13. Polin H, Danzer M, Gaszner W, et al. Identification of RHD alleles with the potential of anti-D immunization among seemingly D– blood donors in Upper Austria. Transfusion 2009;49:676–81.
14. Wagner FF, Frohmajer A, Flegel WA. RHD positive haplotypes in D negative Europeans. BMC Genet 2001;2:10.
15. Denomme GA, Wagner FF, Fernandes BJ, Li W, Flegel WA. Partial D, weak D types, and novel RHD alleles among 33,864 multiethnic patients: implications for anti-D alloimmunization and prevention. Transfusion 2005;45: 1554–60.
16. Flegel WA, von Zabern I, Wagner FF. Six years’ experience performing RHD genotyping to confirm D-red blood cell units in Germany for preventing anti-D immunizations. Transfusion 2009;49:465–71.
17. Kumpel B. Are weak D RBCs really immunogenic? Transfusion 2006;46:1061–2.
Donatella Londero, PhD, Responsible Immunohematology Laboratory, Department of Transfusion Medicine, Mauro Fiorino, MLT, Department of Transfusion Medicine, Valeria Miotti, PhD, Responsible Immunogenetic Laboratory, Department of Transfusion Medicine, and Vincenzo de Angelis, MD, Director of the Department of Transfusion Medicine, AOU “S. Maria della Misericordia”, Udine, Italy.
D. Londero et al.

IMMUNOHEMATOLOGY, Volume 27, Number 1, 2011 29
Erratumvol. 26, no. 4, 2010, p. 164The pathophysiology and prevention of transfusion-related acute lung injury (TRALI): a review
The author has informed the editors of Immunohematology that there is an error on page 164, Fig. 2. Figure 2 should appear thus:
Fig. 2. Three scenarios of how transfused antibodies might prime and activate the recipient’s neutrophils (A–C) to cause transfusion-related acute lung injury (TRALI). (A) Antibody directly binds to antigen on the neutrophil. (B) HLA class II antibody attaches to the patient’s monocytes, stimulating their release of inflammatory mediators, which ultimately affects neutrophils. (C) Antibody to HLA class I antigen binds to pulmonary endothelium in the recipient. The neutrophil’s Fc receptor adheres to the constant region of the antibody, leading to sequestration in the lungs and activation.
CommuniCation
30 IMMUNOHEMATOLOGY, Volume 27, Number 1, 2011
Meeting!
September 15, 2011: National Institutes of Health, Department of Transfusion Medicine, 30th Annual Symposium: Immunohematology and Blood Transfusion.
The National Institutes of Health, Department of Transfusion Medicine, 30th Annual Symposium will be held on September 15, 2011, in Bethesda, Maryland. The event is cohosted by the American Red Cross and is free of charge, but advance registration is encouraged. Contact Karen Byrne at NIH/CC/DTM, Bldg.10/Rm 1C711, 10 Center Drive MSC 1184, Bethesda, MD 20892-1184 or [email protected] or visit the Web site at www.cc.nih.gov/dtm/research/symposium.html
Monoclonal antibodies available at no charge:The New York Blood Center has developed a wide range of monoclonal antibodies (both murine and humanized) that are useful for donor screening and for typing RBCs with a positive DAT. These include anti-A1, -M, -s, -U, -D, -Rh17, -K, -k, -Kpa, -Jsb, -Fya, -Fy3, -Fy6, -Wrb, -Xga, -CD99, -Dob, -H, -Ge2, -Ge3, -CD55 (both SCR2/3 and SCR4), -Oka, -I, and anti-CD59. Most of the antibodies are murine IgG and require the use of anti-mouse IgG for detection (Anti-K, k, and -Kpa). Some are directly agglutinating (Anti-A1, -M, -Wrb, and -Rh17) and a few have been humanized into the
IgM isoform (Anti-Jsb). The antibodies are available at no charge to anyone who requests them. Please visit our Web site for a complete list of available monoclonal antibodies and the procedure for obtaining them.
For additional information, contact: Gregory Halverson, New York Blood Center, 310 East 67th Street, New York, NY 10021/e-mail: [email protected], phone: (212) 570-3026, FAX: (212) 737-4935, or visit the Web site at www.nybloodcenter.org >research >laboratories >immunochemistry >current list of monoclonal antibodies available.
Specialist in Blood Bank (SBB) ProgramThe Department of Transfusion Medicine, National Institutes of Health, is accepting applications for its 1-year Specialist in Blood Bank Technology Program. Students are federal employees who work 32 hours/week. This program introduces students to all areas of transfusion medicine including reference serology, cell processing, HLA, and infectious disease testing. Students also design and conduct a research project. NIH is an Equal Opportunity Organization. Application deadline is December 31, 2011, for the July 2012 class. See www.cc.nih.gov/dtm > education for brochure and application. For further information contact Karen M. Byrne at (301) 451-8645 or [email protected]
announCements
Free Classified Ads and Announcements
Immunohematology will publish classified ads and announcements (SBB schools, meetings, symposia, etc.) without charge.
Deadlines for receipt of these items are as follows:
Deadlines
1st week in January for the March issue 1st week in July for the September issue
1st week in April for the June issue 1st week in October for the December issue
E-mail or fax information to [email protected] or phone (215) 451-2538

IMMUNOHEMATOLOGY, Volume 27, Number 1, 2011 31
adveRtisements
Masters (MSc) in Transfusion and Transplantation Sciences at
The University of Bristol, England
Applications are invited from medical or science graduates for the Master of Science (MSc) degree in Transfusion and Transplantation Sciences at the University of Bristol. The course starts in October 2011 and will last for 1 year. A part-time option lasting 2 or 3 years is also available. There may also be opportunities to continue studies for PhD or MD following the MSc. The syllabus is organized jointly by The Bristol Institute for Transfusion Sciences and the University of Bristol, Department of Pathology and Microbiology. It includes:
• Scientific principles of transfusion and transplantation
• Clinical applications of these principles
• Practical techniques in transfusion and transplantation
• Principles of study design and biostatistics
• An original research project
Application can also be made for Diploma in Transfusion and Transplantation Science or a Certificate in Transfusion and Transplantation Science.
The course is accredited by the Institute of Biomedical Sciences.
Further information can be obtained from the Web site:http://ibgrl.blood.co.uk/MSc/MscHome.htm
For further details and application forms please contact:
Dr Patricia Denning-Kendall
University of Bristol
Paul O’Gorman Lifeline Centre
Department of Pathology and Microbiology
Southmead Hospital
Westbury-on-Trym, Bristol BS10 5NB, England
Fax +44 1179 595 342, Telephone +44 1779 595 455, e-mail: [email protected].
32 IMMUNOHEMATOLOGY, Volume 27, Number 1, 2011
Advertisements, cont.
Antibody identification and problem resolution
HLA-A, B, C, and DR typing
HLA-disease association typing
Paternity testing/DNA
For inFormation, contact:
Mehdizadeh Kashi
at (503) 280-0210
or write to:
Tissue Typing Laboratory
American Red Cross Biomedical Services
Pacific Northwest Region
3131 North Vancouver
Portland, OR 97227
Reference and Consultation Services
CLIA licensed, ASHI accredited
IgA and anti-IgA testing are available to do the
following:
• Identify IgA-deficient patients
• Investigate anaphylactic reactions
• Confirm IgA-deficient donors
Our ELISA for IgA detects protein to 0.05 mg/dL.
For additional inFormation contact:
Janet Demcoe at (215) 451-4914,
or e-mail:
or write to:
American Red Cross Blood Services
Musser Blood Center
700 Spring Garden Street
Philadelphia, PA 19123-3594
ATTN: Janet Demcoe
IgA/Anti-IgA Testing
CLIA licensed
• Effective tool for screening large volumes of donors
• Gel diffusion test that has a 15-year proven track record:
Approximately 90 percent of all donors identified as IgA
deficient by are confirmed by the more sensitive testing
methods
For additional inFormation:
Kathy Kaherl
at (860) 678-2764
e-mail:
or write to:
Reference Laboratory
American Red Cross Biomedical Services
Connecticut Region
209 Farmington Ave.
Farmington, CT 06032
Donor IgA Screening
CLIA licensed
Immunohematology Reference LaboratoryAABB, ARC, New York State, and CLIA licensed
24-hour phone number: (215) 451-4901
Fax: (215) 451-2538
American Rare Donor Program24-hour phone number:
(215) 451-4900Fax:
(215) [email protected]
ImmunohematologyPhone, business hours:
(215) 451-4902Fax:
(215) [email protected]
Quality Control of Cryoprecipitated–AHFPhone, business hours:
(215) 451-4903Fax:
(215) 451-2538
National Reference Laboratory for Blood Group Serology

IMMUNOHEMATOLOGY, Volume 27, Number 1, 2011 33
Advertisements, cont.
Ordering InformationThe book, which costs $25, can be ordered in two ways:
Order online from the publisher •at: www.sbbpocketbook.com
Order from the authors, who •will sign the book. Send a check, made payable to “New York Blood Center” and indicate “Pocketbook” on the memo line, to:
Marion Reid Laboratory of Immunochemistry New York Blood Center 310 East 67th Street New York, NY 10065
Please include the recipient’s complete mailing address.
Blood Group Antigens & AntibodiesA guide to clinical relevance & technical tipsby Marion E. Reid & Christine Lomas-Francis
Pocketbook Education FundThe authors are using royalties generated from the sale of this pocketbook for educational purposes to mentor people in the joys of immunohematology as a career. They will accomplish this in the following ways:
Sponsor workshops, seminars, and lectures•Sponsor students to attend a meeting•Provide copies of the pocketbook•
(See www.sbbpocketbook.com for details to apply for funds)
This compact “pocketbook” from the authors of the Blood Group Antigen FactsBook is a must for anyone who is involved in the laboratory or bedside care of patients with blood group alloantibodies.
The book contains clinical and technical information about the nearly 300 ISBT recognized blood group antigens and their corresponding antibodies. The information is listed in alphabetical order for ease of finding—even in the middle of the night. Included in the book is information relating to:
Clinical significance of antibodies in transfusion and HDN.•
Number of compatible donors that would be expected •to be found in testing 100 donors. Variations in different ethnic groups are given.
Characteristics of the antibodies and optimal technique(s) •for their detection.
Technical tips to aid their identification.•
Whether the antibody has been found as an autoantibody.•
34 IMMUNOHEMATOLOGY, Volume 27, Number 1, 2011
Advertisements, cont.
Diagnostic testing for:• Neonatal alloimmune thrombocytopenia (NAIT)• Posttransfusion purpura (PTP)• Refractoriness to platelet transfusion• Heparin-induced thrombocytopenia (HIT)• Alloimmune idiopathic thrombocytopenia purpura (AITP)
Medical consultation available
Test methods:• GTI systems tests — detection of glycoprotein-specific platelet antibodies — detection of heparin-induced antibodies (PF4 ELISA)• Platelet suspension immunofluorescence test (PSIFT)• Solid phase red cell adherence (SPRCA) assay• Monoclonal immobilization of platelet antigens (MAIPA)• Molecular analysis for HPA-1a/1b
For Further inFormation, contact:
Platelet Serology Laboratory (215) 451-4205
Janet Demcoe (215) 451-4914 [email protected]
Sandra Nance (215) 451-4362 [email protected]
American Red Cross Biomedical ServicesMusser Blood Center
700 Spring Garden StreetPhiladelphia, PA 19123-3594
National Platelet Serology Reference Laboratory
CLIA licensed
Our laboratory specializes in granulocyte antibody detection and granulocyte antigen typing.
Indications for granulocyte serology testing include:• Alloimmune neonatal neutropenia (ANN)• Autoimmune neutropenia (AIN)• Transfusion-related acute lung injury (TRALI)
Methodologies employed:• Granulocyte agglutination (GA)• Granulocyte immunofluorescence by flow cytometry (GIF)• Monoclonal antibody immobilization of neutrophil antigens
(MAINA)
TRALI investigations also include:• HLA (PRA) Class I and Class II antibody detection
For Further inFormation, contact:
Neutrophil Serology Laboratory (651) 291-6797
Randy Schuller (651) 291-6758 [email protected]
American Red Cross Biomedical ServicesNeutrophil Serology Laboratory
100 South Robert StreetSt. Paul, MN 55107
National Neutrophil Serology Reference Laboratory
CLIA licensed

IMMUNOHEMATOLOGY, Volume 27, Number 1, 2011 35
What is a certified Specialist in Blood Banking (SBB)?• Someone with educational and work experience qualifications that successfully passes the American Society for Clinical Pathology (ASCP)
board of certification (BOC) examination for the Specialist in Blood Banking.• This person will have advanced knowledge, skills, and abilities in the field of transfusion medicine and blood banking.
Individuals who have an SBB certification serve in many areas of transfusion medicine: • Serve as regulatory, technical, procedural, and research advisors• Perform and direct administrative functions • Develop, validate, implement, and perform laboratory procedures• Analyze quality issues preparing and implementing corrective actions to prevent and document nonconformances• Design and present educational programs• Provide technical and scientific training in transfusion medicine• Conduct research in transfusion medicine
Who are SBBs?Supervisors of Transfusion Services Executives and Managers of Blood Centers LIS Coordinators EducatorsSupervisors of Reference Laboratories Research Scientists Consumer Safety OfficersQuality Assurance Officers Technical Representatives Reference Lab Specialists
Why become an SBB?Professional growth Job placement Job satisfaction Career advancement
How does one become an SBB?CAAHEP-accredited SBB Technology program or grandfather the exam based on ASCP education and experience criteria.
Fact: In recent years, a greater percentage of individuals who graduate from CAAHEP-accredited programs pass the SBB exam compared to individuals who grandfather the exam. The BEST route for obtaining an SBB certification is to attend a CAAHEP-accredited Specialist in Blood Bank Technology Program.
Which approach are you more compatible with?
Contact the following programs for more information:
Additional information can be found by visiting the following Web sites: www.ascp.org, www.caahep.org, and www.aabb.org
Program Contact Name Phone Contact Email Contact WebsiteOnsite or Online Program
Walter Reed Army Medical Center William Turcan 202-782-6210 [email protected] www.militaryblood.dod.mil/fellow Onsite
American Red Cross, Southern California Region Michael Coover 909-859-7496 [email protected] none Onsite
ARC-Central OH Region Joanne Kosanke 614-253-2740 x 2270 [email protected] none Onsite
Blood Center of Wisconsin Lynne LeMense 414-937-6403 [email protected] www.bcw.edu Onsite
Community Blood Center/CTS Dayton, Ohio Nancy Lang 937-461-3293 [email protected] www.cbccts.org/education/sbb.html Online
Gulf Coast School of Blood Bank Technology Clare Wong 713-791-6201 [email protected] http://giveblood.org/index.php?page=sbb-distance-program Online
Hoxworth Blood Center/University of Cincinnati Susan Wilkinson 513-558-1275 [email protected] [email protected]
www.hoxworth.org Onsite
Indiana Blood Center Jayanna Slayten 317-916-5186 [email protected] www.indianablood.org Online
Johns Hopkins Hospital Lorraine Blagg 410-502-9584 [email protected] http://pathology.jhu.edu/department/divisions/tranfusion/sbb2.cfm
Onsite
Medical Center of Louisiana Karen Kirkley 504-903-3954 [email protected] none Onsite
NIH Clinical Center Department of Transfusion Medicine Karen Byrne 301-496-8335 [email protected] www.cc.nih.gov/dtm/research/sbb.html Onsite
Rush University Veronica Lewis 312-942-2402 [email protected] www.rushu.rush.edu/catalog/acadprograms/chs/cls/clssbbcert.html
Online
Transfusion Medicine Academic Center at Florida Blood Services
Marjorie Doty 727-568-5433 x 1514 [email protected] www.fbsblood.org Online
University Health System and Affiliates, San Antonio Linda Myers 210-731-5526 [email protected] www.sbbofsa.org Onsite
University of Texas Medical Branch at Galveston Janet Vincent 409-772-3055 [email protected] www.utmb.edu/sbb Online
University of Texas SW Medical Center LeAnne Hutson 214-648-1780 [email protected] http://utsouthwestern.edu/mls Online
Becoming a Specialist in Blood Banking (SBB)
Revised August 2009
Advertisements, cont.

36 IMMUNOHEMATOLOGY, Volume 27, Number 1, 2011

IMMUNOHEMATOLOGY, Volume 27, Number 1, 2011 37
I. GENERAL INSTRUCTIONSBefore submitting a manuscript, consult current issues of Immunohematology for style. Double-space throughout the manuscript. Number the pages consecutively in the upper right-hand corner, beginning with the title page.
II. SCIENTIFIC ARTICLE, REVIEW, OR CASE REPORT WITH LITERATURE REVIEW
A. Each component of the manuscript must start on a new page in the following order:1. Title page2. Abstract3. Text4. Acknowledgments5. References6. Author information7. Tables8. Figures
B. Preparation of manuscript 1. Title page
a. Full title of manuscript with only first letter of first word capitalized (bold title)
b. Initials and last name of each author (no degrees; all CAPS), e.g., M.T. JONES, J.H. BROWN, AND S.R. SMITH
c. Running title of ≤40 characters, including spacesd. Three to ten key words
2. Abstracta. One paragraph, no longer than 300 wordsb. Purpose, methods, findings, and conclusion of study
3. Key wordsa. List under abstract
4. Text (serial pages): Most manuscripts can usually, but not necessarily, be divided into sections (as described below). Survey results and review papers may need individualized sectionsa. Introduction — Purpose and rationale for study, including
pertinent background referencesb. Case Report (if indicated by study) — Clinical and/or hematologic
data and background serology/molecularc. Materials and Methods — Selection and number of subjects,
samples, items, etc. studied and description of appropriate controls, procedures, methods, equipment, reagents, etc. Equipment and reagents should be identified in parentheses by model or lot and manufacturer’s name, city, and state. Do not use patient’s names or hospital numbers.
d. Results — Presentation of concise and sequential results, referring to pertinent tables and/or figures, if applicable
e. Discussion — Implication and limitations of the study, links to other studies; if appropriate, link conclusions to purpose of study as stated in introduction
5. Acknowledgments: Acknowledge those who have made substantial contributions to the study, including secretarial assistance; list any grants.
6. Referencesa. In text, use superscript, Arabic numbers.b. Number references consecutively in the order they occur in the
text.7. Tables
a. Head each with a brief title; capitalize the first letter of first word (e.g., Table 1. Results of . . .) use no punctuation at the end of the title.
b. Use short headings for each column needed and capitalize first letter of first word. Omit vertical lines.
c. Place explanation in footnotes (sequence: *, †, ‡, §, ¶, **, ††).8. Figures
a. Figures can be submitted either by e-mail or as photographs (5ʺ×7ʺ glossy).
b. Place caption for a figure on a separate page (e.g. Fig. 1 Results of...), ending with a period. If figure is submitted as a glossy, place first author’s name and figure number on back of each glossy submitted.
c. When plotting points on a figure, use the following symbols if possible: l l s s n n.
9. Author informationa. List first name, middle initial, last name, highest degree,
position held, institution and department, and complete address (including ZIP code) for all authors. List country when applicable.
III. EDUCATIONAL FORUM
A. All submitted manuscripts should be approximately 2000 to 2500 words with pertinent references. Submissions may include:1. An immunohematologic case that illustrates a sound investigative
approach with clinical correlation, reflecting appropriate collaboration to sharpen problem solving skills
2. Annotated conference proceedings
B. Preparation of manuscript1. Title page
a. Capitalize first word of title.b. Initials and last name of each author (no degrees; all CAPs)
2. Texta. Case should be written as progressive disclosure and may
include the following headings, as appropriatei. Clinical Case Presentation: Clinical information and
differential diagnosisii. Immunohematologic Evaluation and Results: Serology and
molecular testingiii. Interpretation: Include interpretation of laboratory results,
correlating with clinical findingsiv. Recommended Therapy: Include both transfusion and
nontransfusion-based therapiesv. Discussion: Brief review of literature with unique features of
this casevi. Reference: Limited to those directly pertinentvii. Author information (see II.B.9.)viii. Tables (see II.B.7.)
IV. LETTER TO THE EDITOR
A. Preparation1. Heading (To the Editor)2. Title (first word capitalized)3. Text (written in letter [paragraph] format)4. Author(s) (type flush right; for first author: name, degree, institution,
address [including city, state, Zip code and country]; for other authors: name, degree, institution, city and state)
5. References (limited to ten)6. Table or figure (limited to one)
Send all manuscripts by e-mail to [email protected]
ImmunohematologyJournal of Blood Group Serology and Education
Instructions for Authors

38 IMMUNOHEMATOLOGY, Volume 27, Number 1, 2011

IMMUNOHEMATOLOGY, Volume 27, Number 1, 2011 39

FIRST CLASSU.S. POSTAGE
PAIDSOUTHERN MD
PERMIT NO. 4144Musser Blood Center700 Spring Garden StreetPhiladelphia, PA 19123-3594
(Place Label Here)