impax asset management group plc analysts... · mackenzie investments uk/ireland iem plc ucits...
TRANSCRIPT

Impax Asset Management Group plc
The specialist asset manager focused on a
more sustainable global economy
Interim results for six months to 31 March 2018

Agenda
• H1 2018 highlights
• Background to the Company
• H1 2018 business update
• H1 2018 financial update
• Milestones and prospects
Ian SimmFounder & Chief Executive
Charlie RidgeChief Financial Officer
2

H1 2018 highlights
1On 18 January 2018 Impax Asset Management Group plc acquired Pax World Management LLC (“Pax”). 2As at 31 March 2018. Assets under advice represent ~3% of total AUM.
3
Robust investment
performance in
Listed Equity and
Private Equity
AUM up 52%
to £11.0bn2.
Increasing to
£11.8bn at
31 May 2018
Net inflows of
£1bn and strong
mandate pipeline
Closing of Pax
acquisition1

4
H1 2018 H2 2017 H1 2017
Assets under management2 £11.0bn3
£7.3bn £5.7bn
Revenue £25.7m £18.7m £13.9m
Adjusted operating earnings4 £7.7m £5.7m £3.6m
Adjusted profit before tax £7.4m £5.7m £3.0m
Adjusted diluted earnings per share 4.83p 3.94p 1.94p
Shareholders’ equity £47.8m £35.6m £28.4m
Interim dividend per share 1.1p - 0.7p
Final dividend per share - 2.2p -
Special dividend 2.6p - -
Financial performance1
1As a result of the acquisition of Pax World Management LLC (renamed "Impax Asset Management LLC") on 18 January 2018 certain KPIs have been prepared on an adjusted basis. A reconciliation of the
IFRS and adjusted KPIs is provided on slide 33. 2Assets under management and advice. 3Increasing to £11.8bn as at 31 May 2018. 4Revenue less adjusted operating costs.

Background to the Company
5

£481m Real Assets
£7.6bn Thematic Equities
£1.2bn Unconstrained Equities
£926m Smart Beta
£804m Fixed Income
London managed // US managed2
The specialist investment manager
focused on the transition to a more
sustainable economy
Impax Asset Management
1As at 31 March 2018. Assets under advice represent ~3, increased to £11.8bn as at 31 May 2018. 2US managed AUM refers to Pax World Funds. Impax acquired Pax World Management LLC on 18 January 2018.
2017 UNPRI assessment: A+
Policies, Processes, Practices, and Governance
£11.0bnAUM1
6

The rapidly changing landscape for investment managers
• Pressure on generalists “Specialist” approach
Differentiated strategies
Institutional scale/quality
Diversified income
Scalable business model
P
MAINSTREAM TRENDS A FORMULA FOR WINNERS IMPAX WELL
POSITIONED
P
P
P
P
• Increasingly complex regulatory environment
• Growing fee pressure on generic products
• Survival of the fittest
• Consolidation to continue
7

Solid track record of growth
AUM FYE £m
1AUM shown as at end of financial years to 2017. 2 As of 31 March 2018, net consolidated AUM, increasing to £11.8bn as at 31 May 2018.
Phase 1:
Establishing the business
Phase 2:
Scale up to critical mass
Phase 3:
Consolidation & investment
Phase 4:
Next stage of AUM growth
With Pax World acquisition17,2611
8
11,0352
7,261
4,502
2,823
2,755
2,197
1,828
1,896
1,823
1,265
1,099
982
429
214
69
66
55
38
39
20
15
2018
2017
2016
2015
2014
2013
2012
2011
2010
2009
2008
2007
2006
2005
2004
2003
2002
2001
2000
1999
1998
£8.221bn

Transitions to a more sustainable economy
COMBUSTION
ENGINE
CLEAN ENERGY
TRANSITION
NATURAL
INGREDIENTS
HEALTH & WELLNESS
TRANSITION
PROCESSED
FOOD
ELECTRIC
VEHICLES
DIAGNOSTIC
TOOLS
TRANSITION TO
PERSONALISED MEDICAL
CARE
LIFESTYLE
DRUGS
Source: Shutterstock/Unsplash.
9
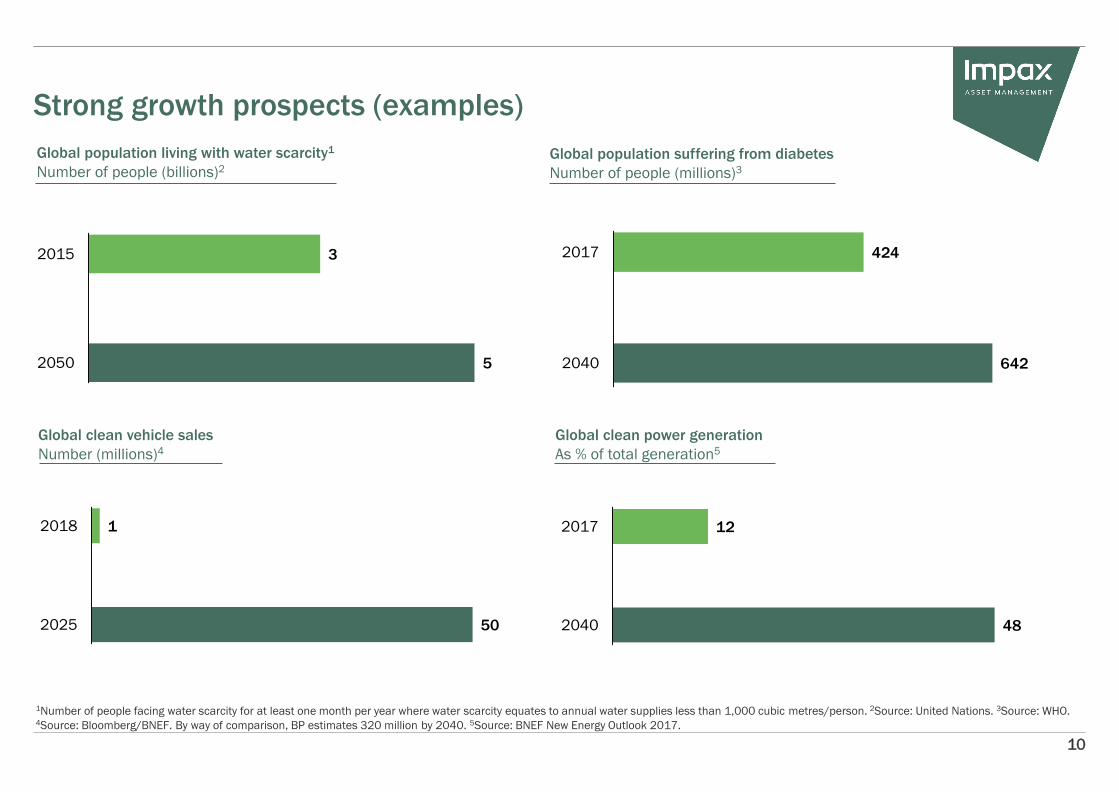
Strong growth prospects (examples)
10
Global population living with water scarcity1
Number of people (billions)2
5
3
2050
2015
1Number of people facing water scarcity for at least one month per year where water scarcity equates to annual water supplies less than 1,000 cubic metres/person. 2Source: United Nations. 3Source: WHO.4Source: Bloomberg/BNEF. By way of comparison, BP estimates 320 million by 2040. 5Source: BNEF New Energy Outlook 2017.
Global population suffering from diabetes
Number of people (millions)3
642
424
2040
2017
Global clean vehicle sales
Number (millions)4
50
1
2025
2018
Global clean power generation
As % of total generation5
48
12
2040
2017
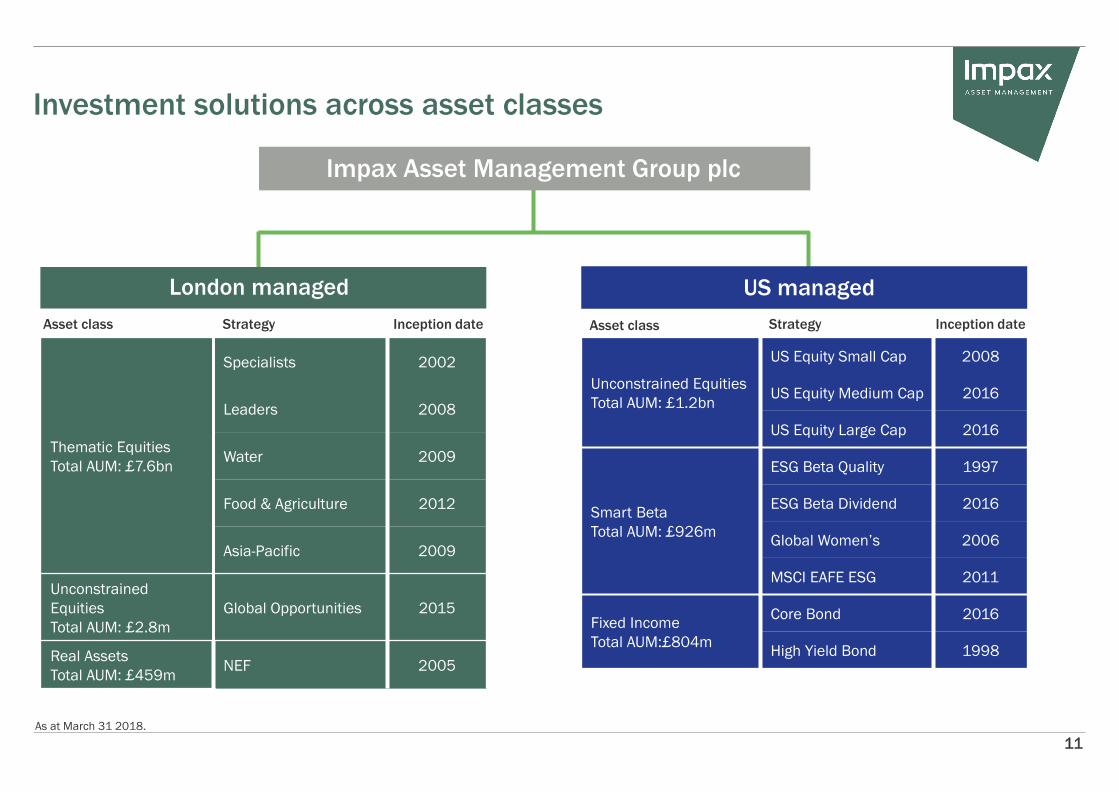
Investment solutions across asset classes
Impax Asset Management Group plc
London managed US managed
Strategy Inception date Strategy Inception dateAsset class Asset class
Thematic Equities
Total AUM: £7.6bn
Specialists 2002
Leaders 2008
Water 2009
Food & Agriculture 2012
Asia-Pacific 2009
Unconstrained
Equities
Total AUM: £2.8m
Global Opportunities 2015
Real Assets
Total AUM: £459mNEF 2005
Unconstrained Equities
Total AUM: £1.2bn
US Equity Small Cap 2008
US Equity Medium Cap 2016
US Equity Large Cap 2016
Smart Beta
Total AUM: £926m
ESG Beta Quality 1997
ESG Beta Dividend 2016
Global Women’s 2006
MSCI EAFE ESG 2011
Fixed Income
Total AUM:£804m
Core Bond 2016
High Yield Bond 1998
11
As at March 31 2018.

Hong Kong
New York
Portland
London
Portsmouth
12
Impax Asset Management LLC2
Impax Asset Management Ltd
Our offices and distribution partners
North America
Pax World Funds
Delaware funds platform
NEI Investments
Desjardins Global Asset Management
Mackenzie Investments
UK/Ireland
IEM plc
UCITS platform
NEF Funds1
1Impax New Energy Investors Funds.2Previously Pax World Management LLC.
Europe
ASN Bank
BNP Paribas
Absalon Capital
Asia Pacific
BNP Paribas in Hong Kong and Australia

H1 2018 business update
13

14
Acquisition of Pax World Management LLC
• On 18 January 2018 Impax completed the purchase of Pax World Management LLC (renamed Impax Asset
Management LLC known as ‘Impax LLC’)1
• Initial implied value (100% of shares) of $52.5m with contingent value of up to $37.5m payable in 2021
• Impax purchased 83.3 per cent of Pax for $44.2m. $38.1m in cash and 2.7m Impax shares valued at $6.1m
• Remaining shares (16.7 per cent) owned by Management are valued at $8.3m and will convert to IPX shares
through put/call options in early 2021 at the prevailing IPX share price
• These results refer to “IPX not including LLC” as shorthand for “The Company not including Impax LLC”
• Further details are provided in Appendix slide 32.
1Post acquisition, we describe the combined business as comprising Impax LLC and Impax Ltd.
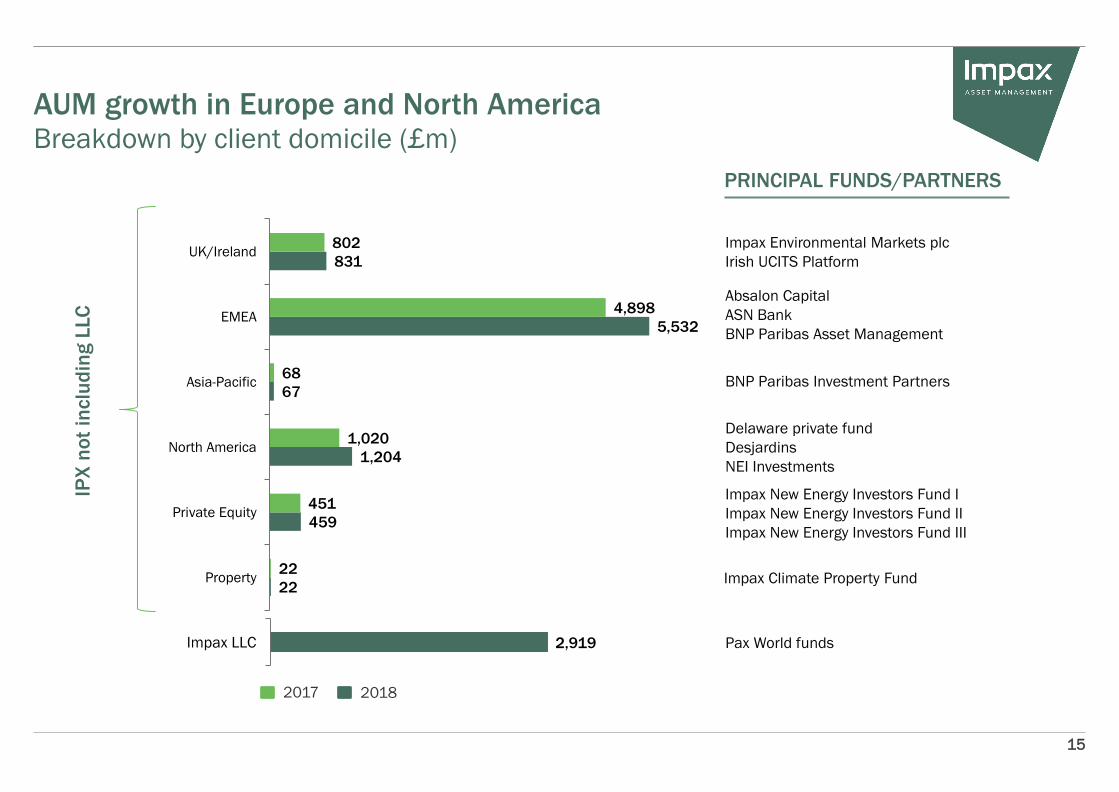
22
459
1,204
67
5,532
831
22
451
1,020
68
4,898
802
Property
Private Equity
North America
Asia-Pacific
EMEA
UK/Ireland
2,919Impax LLC
AUM growth in Europe and North America
PRINCIPAL FUNDS/PARTNERS
Breakdown by client domicile (£m)
15
Impax New Energy Investors Fund I
Impax New Energy Investors Fund II
Impax New Energy Investors Fund III
Absalon Capital
ASN Bank
BNP Paribas Asset Management
BNP Paribas Investment Partners
Delaware private fund
Desjardins
NEI Investments
Impax Climate Property Fund
Impax Environmental Markets plc
Irish UCITS Platform
Pax World funds
2017 2018
IPX
no
t in
clu
din
g L
LC

LONDON MANAGED (LISTED
EQUITY) FUNDS (£m)
16
WEIGHTED AVERAGE REVENUE
MARGIN1 (bps)
1All Impax Ltd managed funds.
Breakdown of AUM increase
5,313
(493)
1,435
303
6,787
(264)
1,500
(160)
7,634
31 March 2017
Outflows
Inflows
Market movement
30 September 2017
Outflows
Inflows
Market movement
31 March 2018
52.9
54.8
52.3
H1 2017
H2 2017
H1 2018
IMPAX LLC: PAX WORLD FUNDS (£m)
3,474
(147)
176
(105)
3,398
18 January 2018
Outflows
Inflows
Market movement
31 March 2018
• Impax LLC weighted average revenue
margin 54.3 bps
• Investment teams
― Will not be integrated
― Channels established to exchange ideas/best practice
• Client service and business development
― Teams have collaborated since 2008
― New CSBD Committee established to co-ordinate activity
• Support teams
― Aiming for integration of all functions
― Implementation progressing well
Integration of Impax Asset Management LLC
17

NEF ll
• Over 95% of total value of portfolio now realised
• Excellent performance track record
• Impax has reserved £3.2m net payments from
carried interest
NEF III
• Final close on 31 May 2018
• Capital commitments of €357m
• Investments in France, Germany and Norway
to date
Current operating & in construction capacity
Owned (Wind)
Owned (Solar PV)
Realised
Under LOI or Contract to Acquire or Build
€
€Key as of 30 June 2017€
138MW
78MW
105MW
82MW
48MW
22MW
MW
€
€
€
€
€
€
€
€€
€
€
€
€€
€
€
€
Private Equity Infrastructure
Map relates to NEF II.
18
€
€
€
€
€
€
€
€
€
€
€
€ €
€ €
€

H1 2018 financial update
19

20
Adjusted IFRS performance measures
As a result of the acquisition, certain financial performance measures have been prepared
on an adjusted basis. “Adjusted” financial metrics are shown after removing the effects of
primarily:
• Acquisition costs incurred as part of the transaction;
• Amortisation (over 11 years) of the intangible asset acquired (principally the investment
management contracts); and
• Mark-to-market effects of national insurance on equity award schemes; these are offset
by tax credits.
A reconciliation of the “IFRS” to “adjusted” performance measures is provided on slide 33.

13.9
18.7
21.2
2.3
0.2
4.5
4.5
H1 2017
H2 2017
Listed Equity flows
and performance
Private Equity PPS
and financing fees
IAM LLC
H1 2018
7.8
10.2
11.2
2.5
2.8
3.4 1.5 1.9
H1 2017
H2 2017
H1 2018
Impax LTD Staff costs Impax LTD Other costs
Impax LLC Staff costs Impax LLC Other
¹Adjusted as per slide 33.
• Listed Equity: strong inflows
• Private Equity: third fund €329m commitments by 31 March 2018
• IAM LLC revenue from acquisition on 18 January 2018
• 31 March 2018 revenue run rate £63.1m per annum • 31 March 2018 adjusted run rate margin of 31.6% and 22.1%
for Impax Ltd and Impax LLC respectively
REVENUE (£m) OPERATING COSTS (adjusted1) (£m)
21
13.0
18.0
Financial highlights
Operating performance
10.3
25.7
Impax LTD
Impax LLC

0.35
0.4
0.6
0.7
0.75
0.9
0.3
0.4
0.5
0.7
1.1
1.2
1.6
2.2
2008
2009
2010
2011
2012
2013
2014
2015
2016
2017
2018
2.9
22
ADJUSTED DILUTED EPS (p) DIVIDEND (p)
• Continuation of progressive policy
• 57% increase in interim dividend
• Special dividend reflects revenue from carried interest of
second private equity fund
0.5
Interim
Final
Special
2.1
1.41.1
1.6
Financial highlights (2)
Earnings and dividends
2.6
• 22% increase driven primarily by adjusted operating
earnings
1.94
3.94
4.83
1.49
(0.08)
(0.18)
(0.22)
(0.12)
H1 2017
H2 2017
Operating earnings
Fair value investments and FX
Interest
Tax adjustments
Share award dilution
H1 2018

20.4
8.6
2.5
(2.8)
1.7
17.5
(24.4)
(6.3)
30 September 2017
Cash generated from
operations after tax
Dividends paid
Other cash movements
Proceeds from bank borrowing
Net cash on acquisition of
Impax LLC
Repayment of bank borrowing
31 March 2018
SEGMENTAL BALANCE SHEET¹
• Other cash movements includes £2.4m of options premiums
received on exercises offset by cash spent on new London office
23
Financial highlights (3)
Balance sheet
¹Excluding third party interest on consolidated funds and cash held in RPAs.
CASH MOVEMENTS1 (£M)
Impax Ltd
£’000
Impax LLC
£’000
Consolidated
£’000
Goodwill 13,347 - 13,347
Intangibles 24,776 - 24,776
Cash 8,397 194 8,591
Investments 8,316 - 8,316
Other assets 18,692 2,793 21,485
Total assets 73,528 2,987 76,515
Debt 11,161 11,161
Other liabilities 15,623 2,909 18,532
Total liabilities 26,784 2,909 29,693
Net assets 46,744 78 46,822
Net cash on acquisition of
Impax LLC

157
179
180
Impax LLC
acquasition to 31
March 2018
Impax Ltd six months
to 30 September
2017
Impax Ltd six months
to 31 March 2018
• “Un-allocated” cash held for share buy-backs, further seed
investments, business development etc.
24
Financial highlights (4)
Cash and long-term trends
CASH RESERVE ANALYSIS (£M) AVERAGE NUMBER OF EMPLOYEES
52
73
81
Impax LLC 31
March 2018
Impax Ltd 30
September 2017
Impax Ltd 31 March
2018
ADJUSTED OPERATING COSTS PER EMPLOYEE (£’000)
Impax Ltd
31 March 2018
Impax Ltd
30 September 2017
Impax LLC
31 March 2018
Impax Ltd
Six months to 31 March 2018
Impax Ltd
Six months to 30 September 2017
Impax LLC
Acquisition to 31 March 2018
(prorated for six months)
1.4
1.1
8.6
(3.3)
(1.4)
(0.6)
0.8
(0.6)
5.4
(7.5)
"Un-allocated" cash
Special dividend
Interim dividend
Seed investment
Option exercise
premium/NIC
Pax transaction costs
Private equity carry and
distributions
"Available" cash
Risk buffer
31 March 2018
Private equity and
carry distributions

136.1
134.7
119.7
130.4
127.7
1.41
15.0
(10.7)
2.7
Gross IPX post acquisition
Acquisition of Impax LLC
management stake
Gross IPX shares
Unexercised ESOP and
RSS
Net IPX shares
Net share buy backs to
date
IPX issued shares
Bonus issue
Pre acquisition
Net share buy backs to date
Unexercised ESOP and RSS
Acquisition of Impax LLC
management stake
1Based on average IPX price for six months to 31 March 2018.2Includes vested shares within sub-funds of the Employee Benefit Trusts (EBTs) from which the individuals and their families may benefit
and other shares held by EBTs in respect of vested LTIP option awards and other employee incentive schemes.
25
IPX SHARES (m)
IPX shareholder register
Significant staff ownership
• Management equity: 1.4m1 shares would be issued to acquire
the 16.7% of Impax LLC owned by management through put/call
options.
• Potential addition on earnout: our current forecast of the
earnout will add 0.9m shares through the put/call options and
restricted stock units issued to management.
BNP Paribas Investment
Partners,
24%
Employee ownership,
33%2
Free float,
43%134.7m IPX
shares
POTENTIAL DILUTION (IN 2021)
CURRENT OWNERSHIP
Issued to Pax vendors
Gross IPX shares
post acquisition

Milestones and prospects
26

Impax’s strong position
Potential for
further
scaling
Acknowledged
global brand
leader
Established
distribution
network
Building
shareholder
value
Attractive
investment
skills/strategies
Scope to
develop/add
new capabilities
27

Appendix
28
29
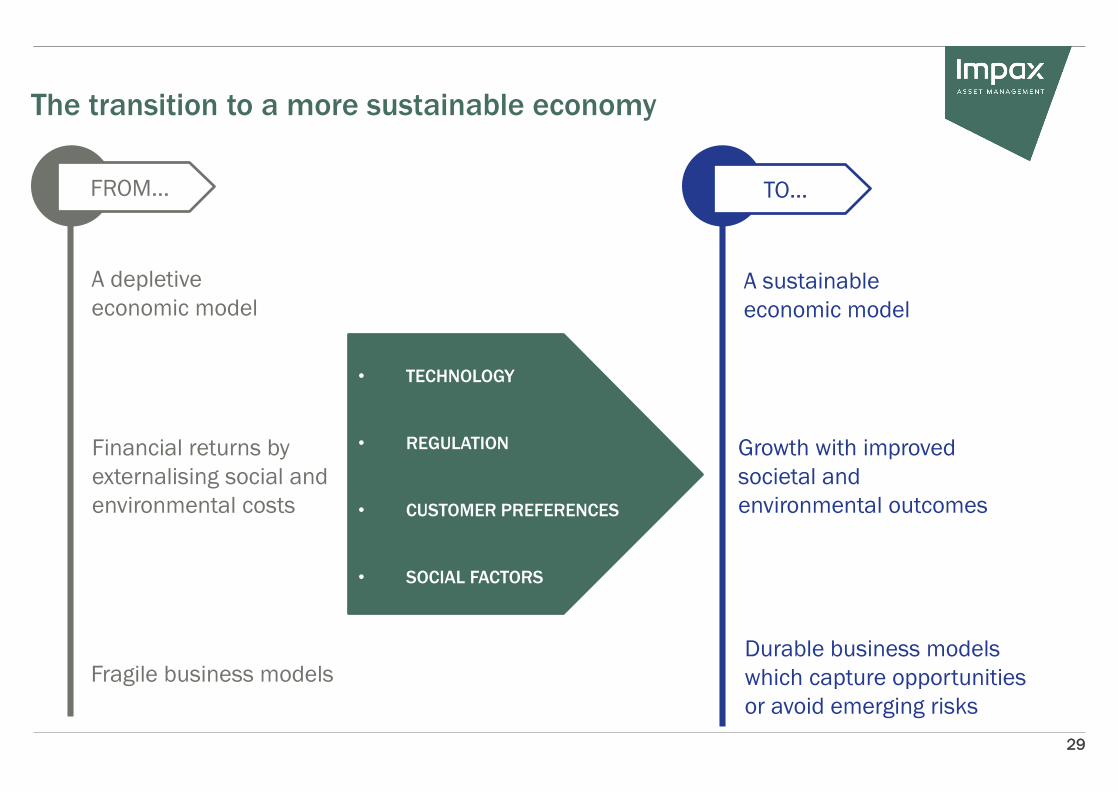
The transition to a more sustainable economy
FROM…
A depletive
economic model
Financial returns by
externalising social and
environmental costs
A sustainable
economic model
Growth with improved
societal and
environmental outcomes
Durable business models
which capture opportunities
or avoid emerging risks
TO…
Fragile business models
• TECHNOLOGY
• REGULATION
• CUSTOMER PREFERENCES
• SOCIAL FACTORS

Impax Asset Management Group plc structure1
30
Impax Asset Management Group
Plc
Impax Asset Management Ltd
Impax Asset Management (AIFM)
Ltd
Impax Asset Management Group
Plc
Impax Asset Management Ltd
Impax Asset Management (AIFM)
LtdIAM US Holdco, Inc.
Impax Asset Management LLC
Pre–acquisition Post closing of Pax acquisition
1Simplified.

Listed Strategies: strong performance record USDPercentage increase to 31 March 2018
31
Past performance of a strategy is no guarantee as to its performance in the future. The value of investments can fall as well as rise and you may get back less than you
have invested. All data is in USD as of 31 March 2018. Composite figures are presented gross of management fees and include the reinvestment of all income. MSCI index is total net return (net
dividend reinvested). (source: FactSet/WM Reuters). Impax Asset Management Limited and Impax Asset Management (AIFM) Limited claim compliance with the Global Investment Performance Standards
(GIPS)®. Further information on composite data is available on request. Reference should be made to the Annual Disclosure Presentation which can be found at the back of this document.
Strategies 1 year 3 years 5 years
MSCI ACWI Benchmark 14.8 26.4 55.3
Specialists Active 18.0 42.4 74.9
Leaders Active 16.6 34.2 66.2
Asia-Pacific Active 17.8 30.2 67.0
Water Active 17.3 43.3 79.8
Food & Agriculture Active 14.2 26.0 45.4
Global Opportunities Active 26.7 37.5 -
32
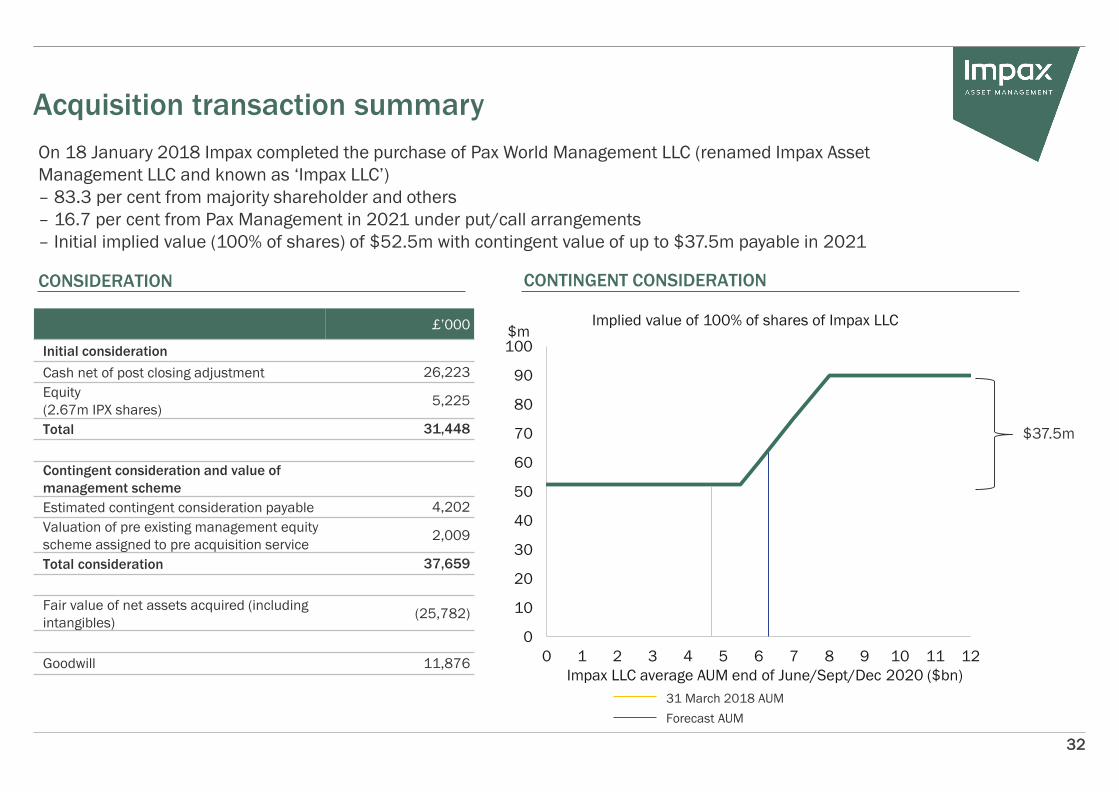
CONSIDERATION CONTINGENT CONSIDERATION
£’000
Initial consideration
Cash net of post closing adjustment 26,223
Equity
(2.67m IPX shares)5,225
Total 31,448
Contingent consideration and value of
management scheme
Estimated contingent consideration payable 4,202
Valuation of pre existing management equity
scheme assigned to pre acquisition service2,009
Total consideration 37,659
Fair value of net assets acquired (including
intangibles) (25,782)
Goodwill 11,876
Acquisition transaction summary
0
10
20
30
40
50
60
70
80
90
100
0 1 2 3 4 5 6 7 8 9 10 11 12
Implied value of 100% of shares of Impax LLC
$37.5m
$m
Impax LLC average AUM end of June/Sept/Dec 2020 ($bn)
31 March 2018 AUM
Forecast AUM
On 18 January 2018 Impax completed the purchase of Pax World Management LLC (renamed Impax Asset
Management LLC and known as ‘Impax LLC’)
– 83.3 per cent from majority shareholder and others
– 16.7 per cent from Pax Management in 2021 under put/call arrangements
– Initial implied value (100% of shares) of $52.5m with contingent value of up to $37.5m payable in 2021
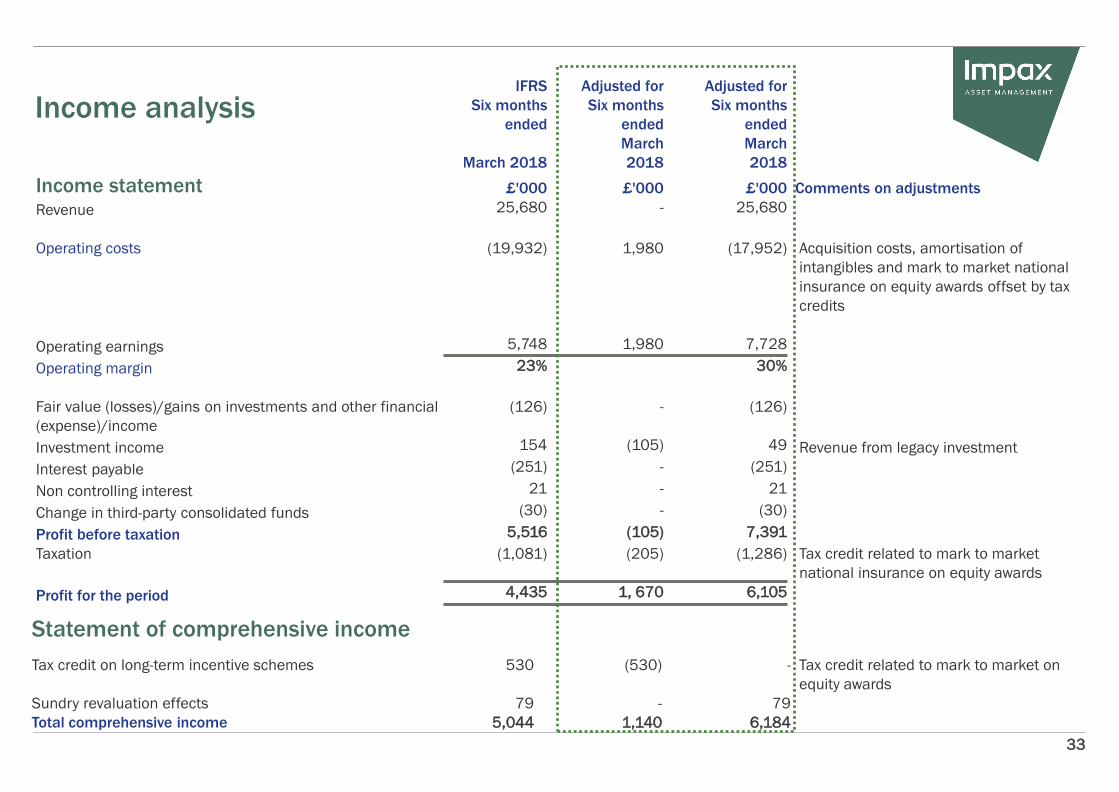
IFRS Adjusted for Adjusted for
Six months
ended
Six months
ended
Six months
ended
March 2018
March
2018
March
2018
Income statement £'000 £'000 £'000 Comments on adjustments
Revenue 25,680 - 25,680
Operating costs (19,932) 1,980 (17,952) Acquisition costs, amortisation of
intangibles and mark to market national
insurance on equity awards offset by tax
credits
Operating earnings 5,748 1,980 7,728
Operating margin 23% 30%
Fair value (losses)/gains on investments and other financial
(expense)/income
(126) - (126)
Investment income 154 (105) 49 Revenue from legacy investment
Interest payable (251) - (251)
Non controlling interest 21 - 21
Change in third-party consolidated funds (30) - (30)
Profit before taxation 5,516 (105) 7,391
Taxation (1,081) (205) (1,286) Tax credit related to mark to market
national insurance on equity awards
Profit for the period 4,435 1, 670 6,105
Statement of comprehensive income
Tax credit on long-term incentive schemes 530 (530) - Tax credit related to mark to market on
equity awards
Sundry revaluation effects 79 - 79
Total comprehensive income 5,044 1,140 6,184
Income analysis
33
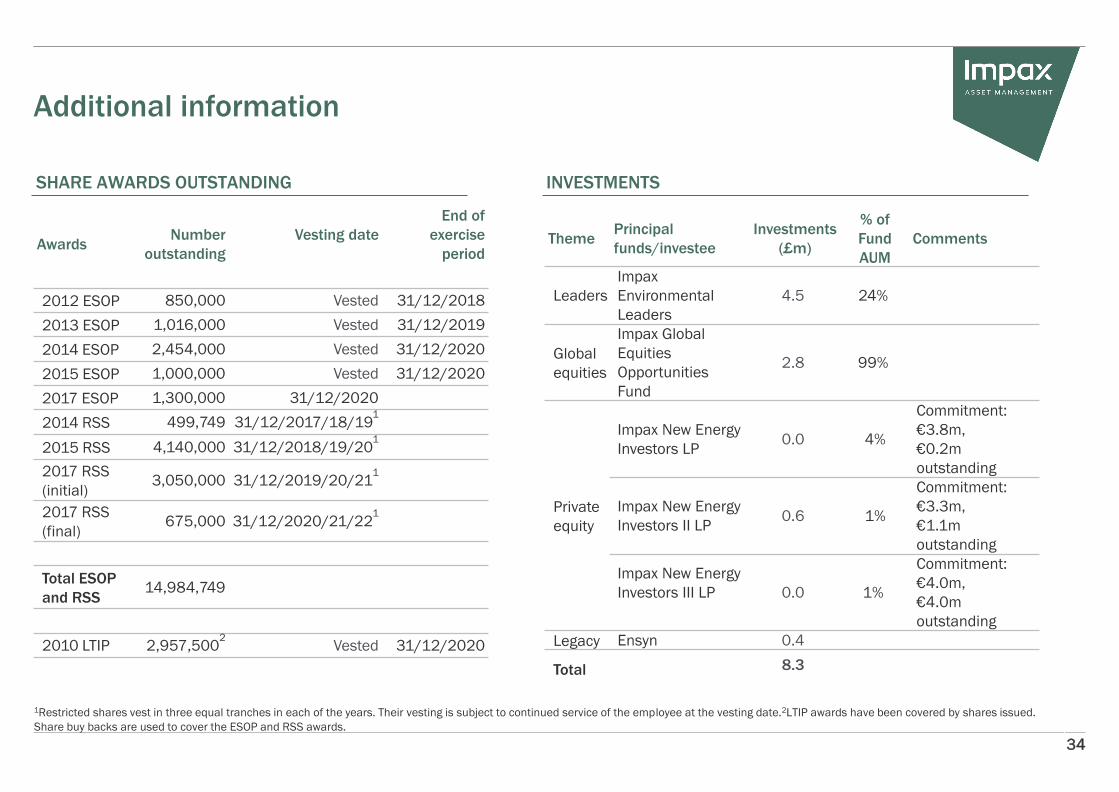
1Restricted shares vest in three equal tranches in each of the years. Their vesting is subject to continued service of the employee at the vesting date.2LTIP awards have been covered by shares issued.
Share buy backs are used to cover the ESOP and RSS awards.
34
SHARE AWARDS OUTSTANDING
AwardsNumber
outstanding
Vesting date
End of
exercise
period
2012 ESOP 850,000 Vested 31/12/2018
2013 ESOP 1,016,000 Vested 31/12/2019
2014 ESOP 2,454,000 Vested 31/12/2020
2015 ESOP 1,000,000 Vested 31/12/2020
2017 ESOP 1,300,000 31/12/2020
2014 RSS 499,749 31/12/2017/18/191
2015 RSS 4,140,000 31/12/2018/19/201
2017 RSS
(initial)3,050,000 31/12/2019/20/21
1
2017 RSS
(final)675,000 31/12/2020/21/22
1
Total ESOP
and RSS14,984,749
2010 LTIP 2,957,5002
Vested 31/12/2020
ThemePrincipal
funds/investee
Investments
(£m)
% of
Fund
AUM
Comments
Leaders
Impax
Environmental
Leaders
4.5 24%
Global
equities
Impax Global
Equities
Opportunities
Fund
2.8 99%
Private
equity
Impax New Energy
Investors LP0.0 4%
Commitment:
€3.8m,
€0.2m
outstanding
Impax New Energy
Investors II LP0.6 1%
Commitment:
€3.3m,
€1.1m
outstanding
Impax New Energy
Investors III LP 0.0 1%
Commitment:
€4.0m,
€4.0m
outstanding
Legacy Ensyn 0.4
Total 8.3
INVESTMENTS
Additional information

Specialists: annual disclosure presentation
March 2018 - USD
35
The Specialists Global Composite contains long only accounts which invest in companies where a majority of the business activities are in the
provision of services, infrastructure and technology in Environmental Markets, particularly those of alternative energy and energy efficiency,
water treatment and pollution control, and waste technology and resource management and sustainable food, agriculture and forestry. For
comparison purposes, the composite is measured against the MSCI All Country World Index and FTSE ET indices. FTSE ET performance is a
combination of FTSE ET100 and FTSE ET50 indices. FTSE ET100 data launched on January 2014, previous data represents FTSE ET50. FTSE
ET50 launched January 2008, data has been back tested by FTSE.
Impax Asset Management Limited and Impax Asset Management (AIFM) Limited claim compliance with Global Investment Performance
Standards (GIPS®) and have prepared and presented this report in compliance with the GIPS standards. Impax Asset Management Limited and
Impax Asset Management (AIFM) Limited have been independently verified for the periods March 1, 2002 through to December 31, 2017. The
verification reports are available upon request.
Verification assesses whether (1) the firm has complied with all the composite construction requirements of the GIPS standards on a firm-wide
basis and (2) the firm’s policies and procedures are designed to calculate and present performance in compliance with the GIPS standards.
Verification does not ensure the accuracy of any specific composite presentation.
Impax Asset Management Limited and Impax Asset Management (AIFM) Limited are subsidiaries of Impax Asset Management Group plc ("IAM")
which is a publicly traded investment management company registered in the United Kingdom, and is headquartered in London, UK. For GIPS
purposes the firm includes discretionary and non-discretionary accounts but excludes accounts which have a mandate to invest entirely in
private equity or property . The firm maintains a complete list and description of composites, which are available upon request.
The MSCI All Country World Index is a free float-adjusted market capitalization weighted index that is designed to measure the equity market
performance of developed and emerging markets. It covers 23 developed and 23 emerging market country indexes. The FTSE ET index is a
combination of FTSE ET100 and FTSE ET50 indices; these two indices are part of the FTSE Environmental Technologies Index Series which
comprise the 50 and 100 largest pure play environmental technology companies globally, by full market capitalisation. The indices are designed
to measure the performance of companies that have a core business in the development and operation of environmental technologies. FTSE
ET100 data launched on January 2014, previous data represents FTSE ET50. FTSE ET50 launched January 2008, data has been back tested by
FTSE. FTSE ET Index has been added starting from March 2015 to match the official marketing material and because it better reflects the
composite strategy. All indices are displayed in USD.
Results are based on fully discretionary accounts under management, including those accounts no longer with the firm. Composite
performance is presented net of foreign withholding taxes on dividends, interest income, and capital gains. Withholding taxes may vary
according to the investor's domicile. MSCI All Country World is presented net of foreign withholding taxes on dividends, interest income
and capital gains while FTSE ET Indices performance is presented gross of foreign withholding taxes on dividends, interest income and
capital gains. Past performance is not indicative of future results.
The U.S. Dollar is the currency used to express performance. Returns are presented gross and net of management fees and include the
reinvestment of all income. Net of fee performance was calculated using the highest fee of 1.1%. The annual composite dispersion
presented is an asset-weighted standard deviation calculated for the accounts in the composite the entire year. Policies for valuing
portfolios, calculating performance, and preparing compliant presentations are available upon request.
Since June 2014 the highest annual management fee for the composite is 1.1%, previously the highest was 1.0% from January 2012 to
May 2014. Previously the highest fee was 0.9863% from January 2011 to December 2011, 1.1% from January 2009 to December 2010,
1% from January 2006 to December 2008, 1.05% from January 2005 to December 2005 and prior to that the highest was 1%. Actual
investment advisory fees incurred by portfolios may vary.
Trading may occur in local currency, but it is converted to base currency based on Bloomberg exchange rates as of 6pm Greenwich Mean
Time each day, therefore performance is affected by currency translation. Since October 2010 base currency is converted using WM
Reuters exchange rates as of 4pm Greenwich Mean Time.
The Specialists Global Composite was created March 31, 2015.
MSCI AC World Index performance presented is net of withholding taxes while FTSE ET performance is gross of withholding taxes given the
unavailability of net of withholding taxes returns by FTSE.
It is not part of the IAM investment philosophy to invest in leverage or derivatives. However the IEM account can borrow up to 20% of its
assets for investment purposes
Results shown for the year 2018 represent a partial performance from January 1, 2018 through March 31, 2018.
Results shown for the year 2002 represent partial period performance from March 1, 2002 through December 31, 2002.
* Information is not statistically meaningful as the composite contains a low number of accounts.
** The 3 years ex-post standard deviation is not shown for the composite and benchmarks if 36 rolling monthly returns are not available.
FTSE ET performance is a combination of FTSE ET100 and FTSE ET50 indices. FTSE ET100 data launched on January 2014, previous data represents FTSE ET50. FTSE ET50 launched January 2008, data has been back tested by FTSE.
YearTotal Firm Assets
(Millions)
Ending Market
Value (Millions)Number of Portfolios
Annual Gross
ReturnAnnual Net Return
MSCI ACWI Annual
Return
FTSE ET Annual
Return
Asset Weighted
StdDev*
3yr Annualized Std
Dev**
MSCI ACWI 3yr
Annualized Std
Dev**
FTSE ET 3yr
Annualized Std
Dev**
2018 YTD 10,240.16 1,449.16 8 -1.14 -1.43 -0.96 -2.91 0.23 11.68 10.72 13.35
2017 9,977.17 2,115.70 9 26.89 25.47 23.97 31.56 0.98 11.62 10.36 13.22
2016 5,456.11 1,398.70 9 14.71 13.44 7.86 2.19 0.91 13.33 11.06 15.04
2015 3,879.17 1,098.62 7 0.41 -0.68 -2.36 -0.77 0.45 12.34 10.79 14.25
2014 3,522.26 1,101.22 6 -3.83 -4.83 4.16 -1.96 0.58 13.11 10.50 13.67
2013 3,231.36 1,202.01 6 35.97 34.62 22.80 44.58 1.52 16.20 13.94 18.48
2012 2,349.66 1,015.88 6 13.32 12.20 16.13 5.82 0.85 19.55 17.13 22.67
2011 2,224.45 1,071.13 6 -18.20 -19.00 -7.35 -27.92 0.48 23.91 20.59 27.65
2010 2,913.42 1,571.81 6 9.32 8.13 12.67 -5.20 0.57 30.07 24.49 36.33
2009 2,162.13 1,351.73 5 45.37 43.79 34.63 29.34 -- 28.14 22.34 35.13
2008 1,199.84 919.32 4 -42.40 -42.97 -42.19 -54.54 -- 25.72 17.97 33.89
2007 1,854.19 1,564.87 3 19.53 18.34 11.66 72.27 -- 15.70 8.65 18.64
2006 760.61 612.82 3 39.97 38.58 20.95 36.47 -- 15.92 8.12 18.02
2005 272.91 230.62 2 10.05 8.91 10.84 11.32 -- 16.67 9.89 15.55
2004 116.71 73.29 1 26.53 25.28 15.23 13.79 -- -- -- --
2003 66.21 59.11 1 37.22 35.86 33.99 32.93 -- -- -- --
2002 48.90 43.86 1 -35.86 -36.39 -16.39 -35.22 -- -- -- --

Leaders: annual disclosure presentation
March 2018 - USD
36
YearTotal Firm Assets
(millions)Ending Market
Value (Millions)Number of Accounts Annual Gross
ReturnAnnual Net Return
MSCI ACWI Annual
Return
FTSE EO All-Share
Total Return
Asset Weighted
StdDev*
3yr Annualized Std
Dev**
MSCI ACWI 3yr
Annualized Std
Dev**
FTSE EO All-Share
3yr Annualized Std
Dev**
2018 YTD 10,240.16 2,191.37 8 -2.91 -3.13 -0.96 -1.44 0.40 11.99 10.72 12.09
2017 9,977.17 2,101.54 8 28.16 27.09 23.97 31.02 0.39 11.86 10.36 11.54
2016 5,456.11 1,039.42 6 11.89 11.03 7.86 11.68 -- 12.85 11.06 12.19
2015 3,879.17 746.22 4 -1.06 -1.60 -2.36 -1.92 -- 11.97 10.79 11.86
2014 3,522.26 639.57 4 -2.03 -2.56 4.16 0.14 -- 12.20 10.50 11.77
2013 3,231.36 538.39 4 33.09 32.36 22.80 31.92 -- 16.29 13.94 16.71
2012 2,349.66 335.13 4 21.70 21.03 16.13 16.65 -- 19.45 17.13 20.25
2011 2,224.45 254.25 5 -12.65 -13.13 -7.35 -13.55 -- 22.01 20.59 23.48
2010 2,913.42 179.50 4 11.63 9.98 12.67 18.18 -- -- -- --
2009 2,162.13 160.66 4 36.66 34.64 34.63 38.23 -- -- -- --
2008* 1,199.84 83.54 3 -34.98 -35.78 -37.22 -37.69 -- -- -- --
Results shown for the year 2018 represent a partial performance from January 1, 2018 through March 31, 2018.
Results shown for the year 2008 represent partial period performance from March 1, 2008 through December 31, 2008.
* Information is not statistically meaningful as the composite contains a low number of accounts.
** The 3 years ex-post standard deviation is not shown for the composite and benchmarks if 36 rolling monthly returns are not available.
The Leaders Composite contains long only accounts which invest in companies that provide services, infrastructure and technology in
Environmental Markets, particularly those of alternative energy and energy efficiency, water treatment and pollution control, and waste
technology and resource management and sustainable food, agriculture and forestry. These accounts contain Leaders companies with leading
environmental divisions, in addition to pure play companies that have a majority of their business activities in Environmental Markets. For
comparison purposes, the composite is measured against the MSCI All Country World Index and FTSE Environmental Opportunities All-Share
indices.
Impax Asset Management Limited and Impax Asset Management (AIFM) Limited claim compliance with Global Investment Performance
Standards (GIPS®) and have prepared and presented this report in compliance with the GIPS standards. Impax Asset Management Limited and
Impax Asset Management (AIFM) Limited have been independently verified for the periods March 1, 2002 through to December 31, 2017.
Verification assesses whether (1) the firm has complied with all the composite construction requirements of the GIPS standards on a firm-wide
basis and (2) the firm’s policies and procedures are designed to calculate and present performance in compliance with the GIPS standards. The
Leaders composite has been examined for the periods March 1, 2008 through to December 31, 2017. The verification and performance
examination reports are available upon request.
Impax Asset Management Limited and Impax Asset Management (AIFM) Limited are subsidiaries of Impax Asset Management Group plc ("IAM")
which is a publicly traded investment management company registered in the United Kingdom, and is headquartered in London, UK. For GIPS
purposes the firm includes discretionary and non-discretionary accounts but excludes accounts which have a mandate to invest entirely in
private equity or property . The firm maintains a complete list and description of composites, which are available upon request.
The MSCI All Country World Index is a free float-adjusted market capitalization weighted index that is designed to measure the equity market
performance of developed and emerging markets. It covers 23 developed and 23 emerging market country indexes. FTSE Environmental
Opportunities All-Share Index includes global companies for which at least 20% of their business comes from Environmental Markets and
technologies. All indices are displayed in USD.
Effective from June 2014 the MSCI All Country World index was added as a new benchmark to better reflect the investment objectives of the
composite.
Results are based on fully discretionary accounts under management, including those accounts no longer with the firm. Composite
performance is presented net of foreign withholding taxes on dividends, interest income, and capital gains. Withholding taxes may vary
according to the investor's domicile. MSCI All Country World performance is presented net of foreign withholding taxes on dividends,
interest income and capital gains while FTSE Environmental Opportunities All-Share performance is presented gross of foreign withholding
taxes on dividends, interest income and capital gains. Past performance is not indicative of future results.
The U.S. Dollar is the currency used to express performance, results are affected by currency translation. Returns are presented gross and
net of management fees and include the reinvestment of all income. Net of fee performance was calculated using the highest fee of
0.80%. Policies for valuing portfolios, calculating performance, and preparing compliant presentations are available upon request.
Since February 2016 the highest annual management fee for the composite is 0.80% prior to that was 0.55% from January 2011 to
January 2016, prior to that the highest was 1.5%. Actual investment advisory fees incurred by portfolios may vary.
Trading may occur in local currency, but it is converted to base currency based on Bloomberg exchange rates as of 6pm Greenwich Mean
Time each day, therefore performance is affected by currency translation. Since October 2010 base currency is converted using WM
Reuters exchange rates as of 4pm Greenwich Mean Time.
The Composite name changed from The Environmental Long Only All Cap Composite to The Environmental Leaders Composite in January
2010.
As of 31 March 2013, the Environmental Leaders Composite has been renamed the Leaders Composite.
The Leaders Composite was created October 1, 2008.
Prior to March 2015 the composite was also measured against MSCI World Index. The index was removed to match the official marketing
material and to simplify the GIPS complaint presentation.
Starting March 2015 the MSCI AC World Index performance presented was changed from gross of withholding taxes to net of withholding
taxes while FTSE Environmental Opportunities All Share Index performance is gross of withholding taxes given the unavailability of net of
withholding taxes returns by FTSE. The amendment was applied retroactively to more accurately reflect the composite performance.

Water: annual disclosure presentation
March 2018 - USD
37
Results shown for the year 2018 represent a partial performance from January 1, 2018 through March 31, 2018.
* Information is not statistically meaningful as the composite contains a low number of accounts.
** The 3 years ex-post standard deviation is not shown for the composite and benchmarks if 36 rolling monthly returns are not available
The Water Composite contains long only accounts which invest in companies that provide services, infrastructure and technology in the water-
related sectors of Environmental Markets. For comparison purposes, the composite is measured against the MSCI All Country World Index and
the FTSE EO Water Technology Index.
Impax Asset Management Limited and Impax Asset Management (AIFM) Limited claim compliance with Global Investment Performance
Standards (GIPS®) and have prepared and presented this report in compliance with the GIPS standards. Impax Asset Management Limited and
Impax Asset Management (AIFM) Limited have been independently verified for the periods March 1, 2002 through to December 31, 2017. A
copy of the verification reports are available upon request.
Verification assesses whether (1) the firm has complied with all the composite construction requirements of the GIPS on a firm-wide basis and
(2) the firm's policies and procedures are designed to calculate and present performance in compliance with the GIPS. Verification does not
ensure the accuracy of any specific composite presentation.
Impax Asset Management Limited and Impax Asset Management (AIFM) Limited are subsidiaries of Impax Asset Management Group plc ("IAM")
which is a publicly traded investment management company registered in the United Kingdom, and is headquartered in London, UK. For GIPS
purposes the firm includes discretionary and non-discretionary accounts but excludes accounts which have a mandate to invest entirely in
private equity or property . The firm maintains a complete list and description of composites, which are available upon
request.
The MSCI All Country World Index is a free float-adjusted market capitalization weighted index that is designed to measure the equity market
performance of developed and emerging markets. It covers 23 developed and 23 emerging market country indexes. The FTSE EO Water
Technology Index covers companies that provide or operate technologies, infrastructure and services for the supply, management and treatment
of water for industrial, residential, utility and agricultural users. The FTSE EO Water Technology Index has been added starting from March 2015
to match the official marketing material and because it better reflects the composite strategy. All indices are displayed in USD.
Effective from June 2014 the MSCI All Country World index was added as a new benchmark to better reflect the investment objectives of the
composite.
Results are based on fully discretionary accounts under management, including those accounts no longer with the firm. Composite
performance is presented net of foreign withholding taxes on dividends, interest income, and capital gains. Withholding taxes may vary
according to the investor's domicile. MSCI All Country World performance is presented net of foreign withholding taxes on dividends,
interest income and capital gains while FTSE EO Water Technology performance is presented net of foreign withholding taxes on
dividends, interest income and capital gain. Past performance is not indicative of future results.
The U.S. Dollar is the currency used to express performance, results are affected by currency translation. Returns are presented gross and
net of management fees and include the reinvestment of all income. Net of fee performance was calculated using the highest fee of
0.35% until January 31, 2014, 1.10% from February 28, 2014 to August 31, 2015 following the introduction of the Impax Fundamental
Long Only Water Fund in the composite, 0.35% from September 30, 2015 to October 30, 2017 following the removal of the Impax
Fundamental Long Only Water Fund and the introduction of the Parvest Aqua Fund in the composite a month before, and 0.57% from
November 01, 2017 following the introduction of the Afdeling Tryghedsgruppen Fund. Policies for valuing portfolios, calculating
performance, and preparing compliant presentations are available upon request.
Trading may occur in local currency, but it is converted to base currency based on Bloomberg exchange rates as of 6pm Greenwich Mean
Time each day, therefore performance is affected by currency translation. Since October 2010 base currency is converted using WM
Reuters exchange rates as of 4pm Greenwich Mean Time.
The Composite name changed from The Environmental Long Only Water Composite to The Water Composite in January
2010.
The Water Composite was created January 1, 2009.
Prior to March 2015 the composite was also measured against MSCI World Index. The indices were removed to match the official
marketing material and to simplify the GIPS compliant presentation.
Starting March 2015 the MSCI AC World Index performance presented was changed from gross of withholding taxes to net of withholding
taxes while FTSE EO Water Technology Index performance is gross of withholding taxes given the unavailability of net of withholding taxes
returns by FTSE. The amendment was applied retroactively to more accurately reflect the composite performance.
YearTotal Firm Assets
(Millions)
Ending Market
Value (Millions)Number of Portfolios
Annual Gross
ReturnAnnual Net Return
MSCI ACWI Annual
Return
FTSE EO Water
Technology Annual
Return
Asset Weighted
StdDev*
3yr Annualized Std
Dev**
MSCI ACWI 3yr
Annualized Std
Dev**
FTSE EO Water
Technology 3yr
Annualized Std
Dev**
2018 YTD 10,240.16 3,585.47 3 -1.62 -1.76 -0.96 -2.23 -- 10.69 10.72 10.37
2017 9,977.17 3,464.57 3 29.82 29.32 23.97 27.16 -- 10.63 10.36 10.07
2016 5,456.11 1,722.83 2 11.20 10.81 7.86 8.09 -- 12.24 11.06 11.19
2015 3,879.17 1,288.46 2 3.21 2.34 -2.36 3.43 -- 11.84 10.79 11.00
2014 3,522.26 1,066.63 2 3.03 1.97 4.16 7.43 -- 12.10 10.50 11.01
2013 3,231.36 706.40 1 29.46 29.01 22.80 31.53 -- 14.25 13.94 14.65
2012 2,349.66 136.95 1 25.25 24.81 16.13 19.27 -- 17.72 17.13 18.16
2011 2,224.45 75.23 1 -9.64 -10.09 -7.35 -10.29 -- 20.20 20.59 21.66
2010 2,913.42 62.31 1 16.66 16.08 12.67 18.40 -- -- -- --
2009 2,162.13 30.01 1 40.26 39.56 34.63 35.19 -- -- -- --

Important information
This document has been Issued in the UK by Impax Asset Management Group plc, whose shares are quoted on AIM. Impax Asset Management Group plc is registered in England
& Wales, number 03262305. Impax Asset Management Group plc is the parent company of Impax Asset Management Limited, Impax Asset Management (AIFM) Limited and
Impax Asset Management LLC. Impax Asset Management Limited and Impax Asset Management (AIFM) Limited are authorised and regulated by the Financial Conduct Authority .
The information and any opinions contained in this document have been compiled in good faith, but no representation or warranty, express or implied, is made to their accuracy,
completeness or correctness. Impax, its officers, employees, representatives and agents expressly advise that they shall not be liable in any respect whatsoever for any loss or
damage, whether direct, indirect, consequential or otherwise however arising (whether in negligence or otherwise) out of or in connection with the contents of or any omissions
from this document. This document does not constitute an offer to sell, purchase, subscribe for or otherwise invest in units or shares of any fund managed by Impax. It may not
be relied upon as constituting any form of investment advice and prospective investors are advised to ensure that they obtain appropriate independent professional advice
before making any investment in any such fund. Any offering is made only pursuant to the relevant offering document and the relevant subscription application, all of which must
be read in their entirety. Prospective investors should review the offering memorandum, including the risk factors in the offering memorandum, before making a decision to
invest. Past performance of a fund or strategy is no guarantee as to its performance in the future. This document is not an advertisement and is not intended for public use or
distribution.
38