implementing automation after making lean improvements
DESCRIPTION
TRANSCRIPT

Implementing AutomationAfter Making Lean Improvements
Implementing AutomationAfter Making Lean Improvements
Tom LawtonTom LawtonPresidentPresident
ADVENT DESIGN CORPORATIONADVENT DESIGN CORPORATION

AUTOMATE or NOT TO AUTOMATENeed to lower costs & reduce cycle times?
AUTOMATE or NOT TO AUTOMATENeed to lower costs & reduce cycle times?
• Too many peopleToo many people•• Layout is bad Layout is bad•• Can’t deliver Can’t deliver ontimeontime•• Equipment too slowEquipment too slow
What Do We Do?What Do We Do?
Analyze & EvaluateAnalyze & EvaluateUsing Lean Concepts &Using Lean Concepts &TechniquesTechniquesImplement LeanImplement LeanManufacturing SolutionsManufacturing SolutionsDesign & implementDesign & implementLEAN AUTOMATION!LEAN AUTOMATION!

Lean Automation ConceptLean Automation Concept

Why Lean Automation?Why Lean Automation?
“After implementing lean“After implementing leanimprovements such as cellularimprovements such as cellular
manufacturing and setup reduction,manufacturing and setup reduction,selective automation can add valueselective automation can add value
and reduce human variability.”and reduce human variability.”
Richard Richard SchonbergerSchonberger, June 2002, June 2002

Lean ManufacturingLean Manufacturing
Any activity or action which doesAny activity or action which doesnot add value to the product is anot add value to the product is a
form of waste and must beform of waste and must beeliminated or minimizedeliminated or minimized..
Fundamental Principle of Lean Manufacturing

Definition of Value -AddedDefinition of Value -AddedValue is added any time the product is physicallyValue is added any time the product is physicallychanged towards what the customer is intendingchanged towards what the customer is intendingto purchase.to purchase.
Value is also added when a service is providedValue is also added when a service is providedfor which the customer is willing to pay (i.e.for which the customer is willing to pay (i.e.design, engineering, etc.).design, engineering, etc.).
If we are not adding value, we are adding cost orIf we are not adding value, we are adding cost orwaste.waste.
90% of lead time is non-value added!

Lean ManufacturingConcepts & Techniques
Lean ManufacturingConcepts & Techniques
Value Stream Map *Value Stream Map *Flow: Setup Reduction, CellularFlow: Setup Reduction, CellularManufacturing, Batch Size Reduction,Manufacturing, Batch Size Reduction,Visual Workplace, Layout *Visual Workplace, Layout *Pull:Pull: KanbanKanban Systems, Supply Chain Management, Systems, Supply Chain Management, Point of Use Point of Use **Others:Others: Quality Improvement & Analysis *,Quality Improvement & Analysis *, Total ProductiveTotal ProductiveMaintenance,Maintenance, TrainingTraining **
* Used most frequently prior to Automation

The value stream map follows the productionThe value stream map follows the productionpath from beginning to end and shows a visualpath from beginning to end and shows a visualrepresentation of every process in the materialrepresentation of every process in the materialand information flowsand information flows
Shows how the shop floor currently operatesShows how the shop floor currently operates
Foundation for the future stateFoundation for the future state
Value Stream Map An Assessment Tool
Value Stream Map An Assessment ToolAn Assessment Tool

CustomersSuppliers
File: VSM-A1
ProductionControl
IProcess
RawMaterials
FinishedGoods
Equipment
CycleTimesChangeOverReliabilityError Rate
LeadTime
Value Stream Map Concept
I
OrdersOrders
Schedules

Soak & Dry Packaging Labeling Case PackingCartoning Shipping
I I I I I I
C/T = 25 - 65 min.C/O = 10 min.Rel. = 100%
C/T = 1 sec.C/O = 5 min.Rel. = 85%
C/T = 3 sec.C/O = 2 min.Rel. = 80%
C/T = 1 sec.C/O = N/ARel. = 100%
C/T = 2 sec.C/O = N/ARel. = 100%
up to 250stonesin WIP
0 01 Operator 1/2 Operator1 Operator 1 Operator1/2 Operator125 Cans of Oil20,640 Round Stones49,000 Shaped Stones
4290Stones
90,504Stones
VariousCustomers
Andrea Aromatics (Scented Oils)
New Jersey Porcelain(Round Stones)
Alanx(Shaped Stones)
30 Cans of OilEvery 2 Weeks
59,000 StonesEvery 2 Weeks
50,000+ StonesEvery 2 Months (via stringer)
Average of 6,000Stones per Dayin Various SizeOrders (8 to 20 case& 200 to 400 caserange mainly)
Production Control Randomly PlacedOrders (Various Sizes)
Orders Every 2 Weeks
Order as Needed
Bi-WeeklyProductionSchedule
Daily Shipping Orders
11.6 Days
65 min.
0.7 Days
7 seconds
15.1 days 27.4 Days Lead Time
65 minutes, 7 seconds Value-Added Time
Value Stream Map (Current State)
DailyShipments
Existing Work Cell
AmeripackFlow Packager
APAIAutomatic Stapler
Manual Manual Multiple Batch Tanks

Soak & Dry Packaging Labeling Case PackingCartoning Shipping
I I I I I
C/T = 25 - 65 min.C/O = 10 min.Rel. = 100%
C/T = 1 sec.C/O = 5 min.Rel. = 85%
C/T = 3 sec.C/O = 2 min.Rel. = 80%
C/T = 1 sec.C/O = N/ARel. = 100%
C/T = 2 sec.C/O = N/ARel. = 100%
up to 250stonesin WIP
0 01 Operator 1/2 Operator1 Operator 1 Operator1/2 Operator75 Cans of Oil40,000 Round Stones25,000 Shaped Stones
4290Stones
30,000Stonesin a supermarkettype arrangementwith stocking levelsby shape and scent
VariousCustomers
Andrea Aromatics (Scented Oils)
New Jersey Porcelain(Round Stones)
Alanx(Shaped Stones)
12 to 16 Cans of Oil Once aWeek
30,000 StonesOnce a Week
25,000 StonesOnce a Month (via stringer)
Average of 6,000Stones per Dayin Various SizeOrders (8 to 20 case& 200 to 400 caserange mainly)
Production Control Randomly PlacedOrders (Various Sizes)
Orders Every Week
Monthly Order
Bi-WeeklyProductionSchedule(largeorders)
Daily Shipping Orders
10.8 Days
65 min.
0.7 Days
7 seconds
5.0 days 16.5 Days Lead Time
65 minutes, 7 seconds Value-Added Time
Value Stream Map (Future State)
DailyShipments
Existing Work Cell
AmeripackFlow Packager
APAIAutomatic Stapler
Manual Manual Multiple Batch Tanks
4 Cases
IncreaseReliability

VSM IMPLEMENTAIONVSM IMPLEMENTAION
LOOP OBJECTIVES PROJECTSSEQUENCE (PRIORITY)
COMPLETION DATE (Mon./Yr)
Supplier Loop * Develop pull system with suppliers 1. Review Weekly/Monthly Requirements With Suppliers 1 Sep-01* Increase number of deliveries per week 2. Revise current blanket orders 1 Sep-01* Reduce raw material inventory to match 3. Send daily consumption data to suppliers 2 Nov-01
4. Setup point of use raw material areas 1 Oct-01
Production Control Loop * Implement daily shipping schedule 1. Single point to schedule( shipping). See pacemaker loop. 1 Oct-01* Work to schedule manufacturing based on shipping requirements 2. Daily production schedule by Operations Manager 1 Oct-01
3. Implement kanban loops as shown on future state VSM 2 Nov-014. Use MRP for materials forecasting 1 Oct-01
Element * Reduce lead time 1. Eliminate WIP between winding & annealing 1 Sep-01Loop * Develop continuous flow 2. Implement supermarket for element prep and kanbans 1 Oct-01
* Develop pull system with element prep supermarket 3. Crosstrain element assembly operations 2 Dec-01
Module Assembly Loop * Reduce cycle time 1. Analyze process variance in environmental test 1 Oct-01* Reduce variation in cycle time in testing 2. Analyze process variance in module drydown 1 Oct-01* Reduce variation in cycle time in drydown 3. Implement supermarket and kanbans for cell installation 1 Oct-01* Establish pull system with supermarket from cell installation 4. Crosstrain module assembly operations 2 Dec-01* Reduce use of carriers 5. Analyze need for carriers vs. subassembly units 1 Sep-01
Pacemaker Loop * Reduce cycle time 1. Improve assembly methods in final mechancial assembly 2 Dec-01
(Unit Assembly/Shipping Loop)* Establish pull system with supermarket from shipping
2. Review design for manufacturing assembly improvements for tubing assembly 3 Feb-02
4. Set up raw material suppermarket for final assembly 1 Oct-015. Crosstrain unit assembly operations 2 Dec-01
NOTES:1. Conduct kanban and point of use training for plant personnel in 2001.2. Priotities as follows: #1(Complete in 2 months), #2(Complete in 4 months), #3(Complete in 6 months)3. Consider use of teams for implementation after training.
FUTURE STATE IMPLEMENTATION PLAN & SCHEDULE
7. Set up leak tested subassembly units in supermarket for final assembly
6. Analyze material handling reductions and layout improvements for element prep operations
3. Consolidate inspection with final mechanical assembly or shipping/packing
Jan-02
Oct-01
Nov-01
3
1
2

Implementing Lean ChangesImplementing Lean Changes“My conclusion is that all of us making a lean leapwill need to deal with capability issues (TQM/SixSigma) and with availability issues (TPM) whileremoving wasted steps and introducing flow andpull in every value stream (TPS). My furtherconclusion is that there is no “right sequence” tofollow in tackling these problems. Rather itdepends on the nature of the product, the nature ofthe process technology, and the nature of thebusiness.”
Jim Womack, October 2002

How Do We Use Lean Techniques for Automation?
How Do We Use Lean TechniquesHow Do We Use Lean Techniques for Automation? for Automation?
Assess the operation using a Value StreamAssess the operation using a Value StreamMap and/or Map and/or PFDsPFDs (Product families & Production data)(Product families & Production data)
Evaluate the layoutEvaluate the layoutIdentify lean improvements & Identify lean improvements & kaizenskaizenswithout automationwithout automationImplement lean improvements using VSMImplement lean improvements using VSMplanplanIdentify lean automation opportunitiesIdentify lean automation opportunitiesDesign and implement lean automationDesign and implement lean automationStart the cycle again!Start the cycle again!

The Lean Automation CycleThe Lean Automation Cycle
Assessment(VSM)
ImplementationPlan
RecommendedSolutions
DO IT!
ContinuousImprovement
Set UpLayoutCellsVisual
Automation
Information Systems
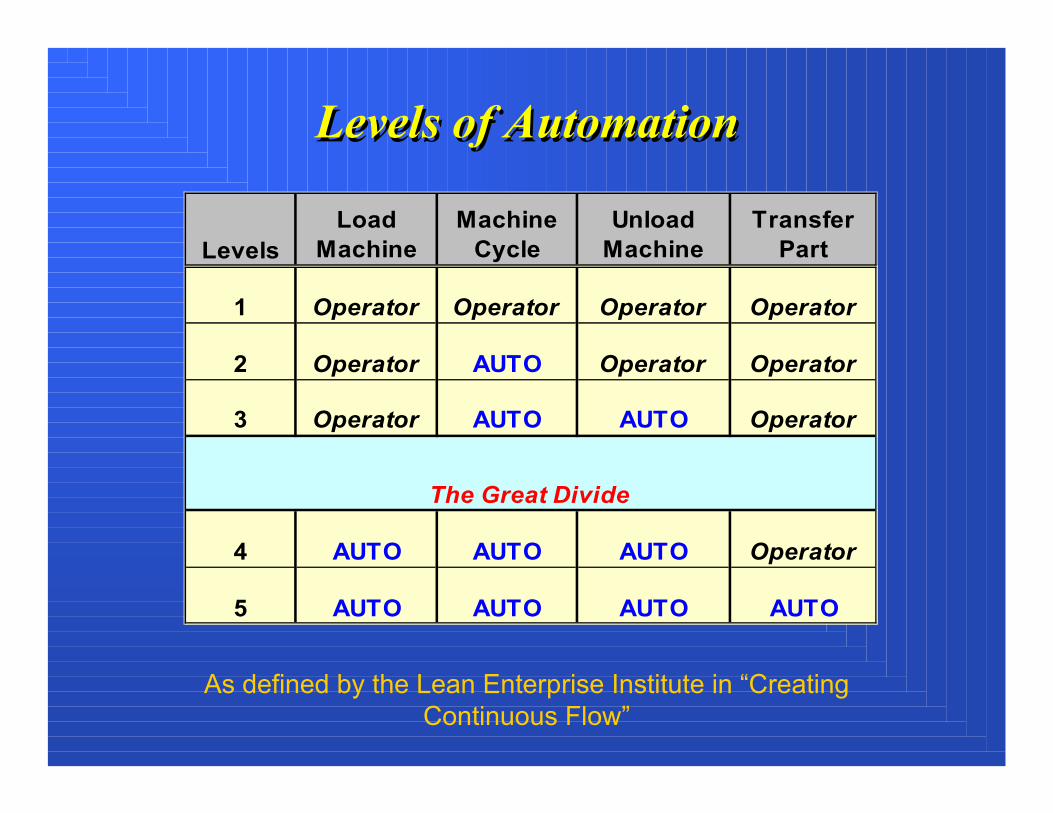
Levels of AutomationLevels of Automation
LevelsLoad
MachineMachine
CycleUnload
MachineTransfer
Part
1 Operator Operator Operator Operator
2 Operator AUTO Operator Operator
3 Operator AUTO AUTO Operator
4 AUTO AUTO AUTO Operator
5 AUTO AUTO AUTO AUTO
The Great Divide
As defined by the Lean Enterprise Institute in “CreatingContinuous Flow”

Low ProductivityElectrical Device AssemblyThe Challenge in Two Steps
Low ProductivityElectrical Device AssemblyThe Challenge in Two Steps
Client wanted waveClient wanted wavesoldering and robotic picksoldering and robotic pickand placeand placeFunctional operationalFunctional operationallayoutlayoutErgonomic problemsErgonomic problemsExtensive material stagingExtensive material stagingNo spaceNo spaceInitially, 13 people inInitially, 13 people inAurora cellAurora cellLow output: 300 units/dayLow output: 300 units/day

Lean Techniques UsedBefore Automation
Lean Techniques UsedBefore Automation
Process flow diagramsProcess flow diagrams
Cellular Manufacturing & LayoutCellular Manufacturing & Layout
Balance Cycle Times Between WorkBalance Cycle Times Between WorkStationsStations
Reduce Batch Size & parts stagingReduce Batch Size & parts staging
Quality Data Collection & AnalysisQuality Data Collection & Analysis(Reduce Reject Rate)(Reduce Reject Rate)

Cellular Assembly LayoutCellular Assembly Layout

Cell ChangesCell ChangesLED
SOLDER& CUT
LEDPLACEMENT
TESTPCBs
ASSEMBLY#1
COLD STAKETEST PCBs
CONTACTSASSEMBLY
&SOLDER
BUTTON &BATTERY
ASSEMBLYLABEL
ATTACHBACK
COVER,STAKE
STRAP &ATTACHSTRAP
TESTSAMPLES
GLUESWITCH/ATTACHSTRAP
PACK
REJECTDATA
WORKSTATION CYCLE TIME: 25sec., 1.25 min.PER 3 UNITS
LEDSOLDER
& CUT
INSERTSWITCH
ACTIVATOR
REJECTDATA
ASSIST
1
2
3
4 5 6 7 8 9
ASSEMBLY#1
COLD STAKETEST PCBs
CONTACTSASSEMBLY
&SOLDER
BUTTON &BATTERY
ASSEMBLYLABEL
ATTACHBACK
COVER,STAKE
STRAP &ATTACHSTRAP
TESTSAMPLES
GLUESWITCH/ATTACHSTRAP
PACK
REJECTDATA
AFTER CHANGES WORKSTATION CYCLE TIME: 25sec.,1.25 min. PER 3 UNITS
PCBs fromsupplier
INSERTSWITCH
ACTIVATOR
REJECTDATA
1 2 3 4 5 6
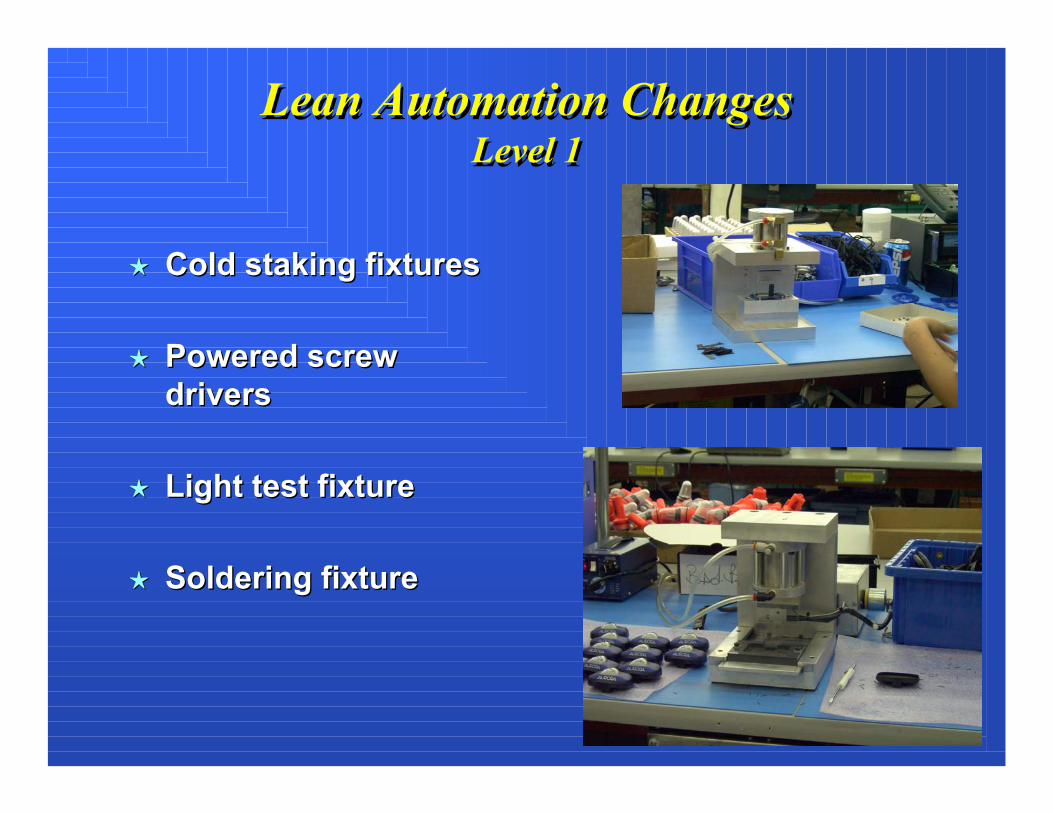
Lean Automation ChangesLevel 1
Lean Automation ChangesLevel 1
Cold staking fixturesCold staking fixtures
Powered screwPowered screwdriversdrivers
Light test fixtureLight test fixture
Soldering fixtureSoldering fixture

With Lean Automation Level 1The ResultsWith Lean Automation Level 1The Results
Balanced cell at 24 secBalanced cell at 24 secper work stationper work stationTwo U-shaped cellsTwo U-shaped cells3 piece flow3 piece flow1000 units/day 1000 units/day per cellper cellvsvs 300 3006 people per cell6 people per cell vs vs 13 13Faster identification ofFaster identification ofquality problemsquality problemsPoint of use storagePoint of use storageBetter teamworkBetter teamworkNo backlogNo backlog
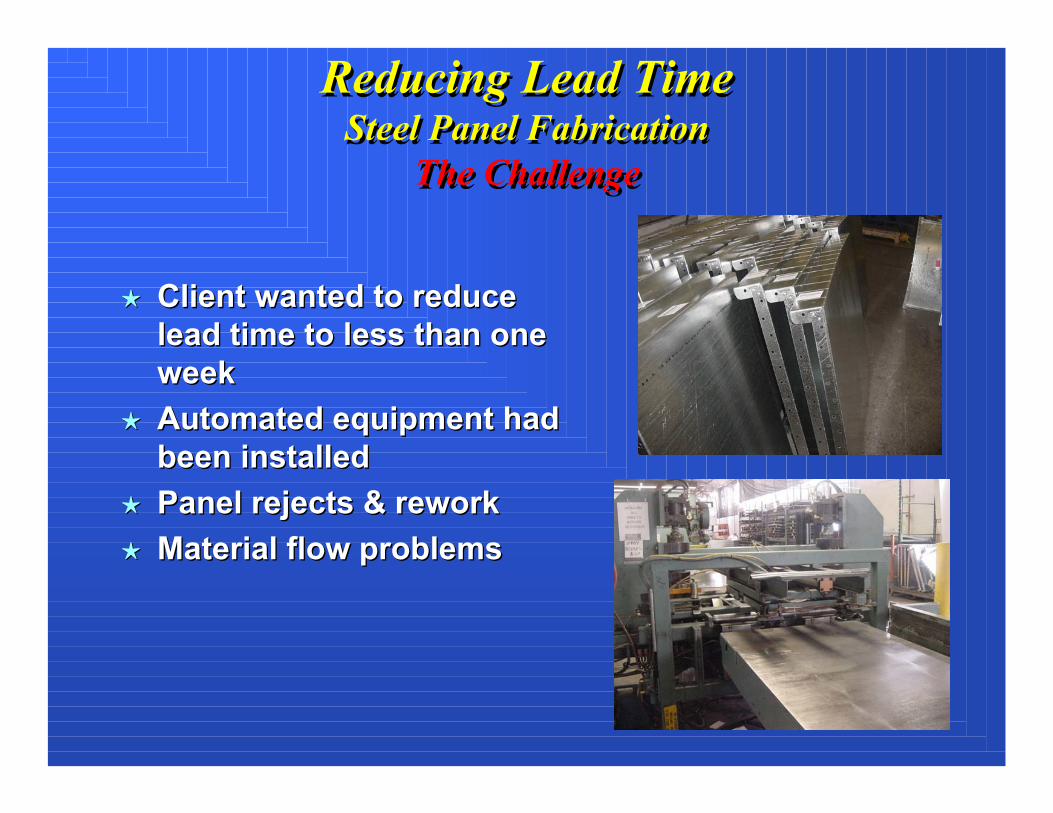
Reducing Lead TimeSteel Panel Fabrication
The Challenge
Reducing Lead TimeSteel Panel Fabrication
The Challenge
Client wanted to reduceClient wanted to reducelead time to less than onelead time to less than oneweekweekAutomated equipment hadAutomated equipment hadbeen installedbeen installedPanel rejects & reworkPanel rejects & reworkMaterial flow problemsMaterial flow problems
Lean Techniques UsedBefore Automation
Lean Techniques UsedBefore Automation
Value Stream MappingValue Stream Mapping
Process flow diagramsProcess flow diagrams
Quality Data Collection & AnalysisQuality Data Collection & Analysis(Reduce Reject Rate)(Reduce Reject Rate)
Setup time AnalysisSetup time Analysis
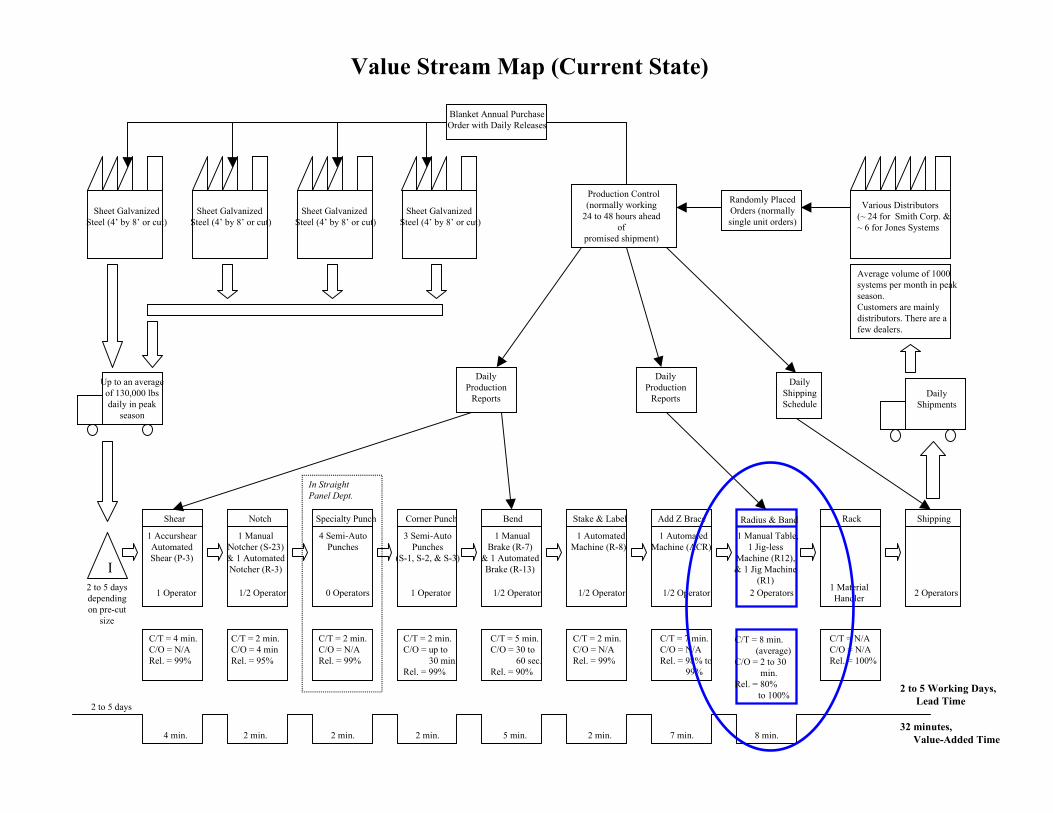
Shear Notch Corner Punch Stake & LabelBend Shipping
I
C/T = 4 min. C/O = N/ARel. = 99%
C/T = 2 min. C/O = 4 min Rel. = 95%
C/T = 2 min.C/O = up to 30 min.Rel. = 99%
C/T = 2 min.C/O = N/A Rel. = 99%
C/T = 5 min. C/O = 30 to 60 sec. Rel. = 90%
1 Operator 1/2 Operator 1 Operator 2 Operators1/2 Operator
Various Distributors(~ 24 for Smith Corp. &~ 6 for Jones Systems
Sheet GalvanizedSteel (4’ by 8’ or cut)
Up to an averageof 130,000 lbsdaily in peak
season
Production Control(normally working
24 to 48 hours aheadof
promised shipment)
Randomly PlacedOrders (normallysingle unit orders)
Blanket Annual PurchaseOrder with Daily Releases
2 to 5 days
4 min.
2 to 5 Working Days, Lead Time
32 minutes, Value-Added Time
Value Stream Map (Current State)
DailyShipments
1/2 Operator
Add Z Brace
C/T = 7 min. C/O = N/A Rel. = 98% to 99%
1/2 Operator
2 min. 2 min. 5 min. 2 min. 7 min.
DailyProduction
Reports
Daily Shipping Schedule
Rack
1 MaterialHandler
DailyProduction
Reports
Average volume of 1000systems per month in peakseason.Customers are mainlydistributors. There are afew dealers.
C/T = N/A C/O = N/A Rel. = 100%
Radius & Band
C/T = 8 min. (average) C/O = 2 to 30 min. Rel. = 80% to 100%
2 Operators
8 min.
Sheet Galvanized Steel (4’ by 8’ or cut)
Sheet Galvanized Steel (4’ by 8’ or cut)
Sheet Galvanized Steel (4’ by 8’ or cut)
2 to 5 daysdependingon pre-cut
size
1 AccurshearAutomatedShear (P-3)
1 ManualNotcher (S-23)& 1 AutomatedNotcher (R-3)
3 Semi-Auto Punches
(S-1, S-2, & S-3)
1 ManualBrake (R-7)
& 1 AutomatedBrake (R-13)
1 AutomatedMachine (R-8)
1 AutomatedMachine (ACR)
1 Manual Table,1 Jig-less
Machine (R12),& 1 Jig Machine
(R1)
Specialty Punch
C/T = 2 min.C/O = N/ARel. = 99%
0 Operators
2 min.
4 Semi-Auto Punches
In StraightPanel Dept.

Rack
1 MaterialHandler
C/T = N/A C/O = N/A Rel. = 100%
Radius & Band
C/T = 8 min. (average) C/O = 2 to 30 min. Rel. = 80% to 100%
2 Operators
8 min.
1 Manual Table,1 Jig-less
Machine (R12),& 1 Jig Machine
(R1)
Improve reliability and changeovercapability of R1 and R12 machines.Reduce panel reject rate.
INITIAL IMPROVEMENT CONCEPTS

6 Foot Long Custom Radius Panel Fabrication
7/19/02
Partially finished panels are stocked insixteen different configurations. Panelsare finished to order. Work is done inthree different areas as noted.
RawMaterial Stock
14 Ga. Galvanized Steel(pre-cut 53-15/16” by 6’3-15/16” sheets)
Notch& Punch(TrumpfMachine)
Ship
Bend& Stake
Add Z Brace(s)(if required)
Label
Radius& Band
(R12 - JiglessMachine) WIP Stock
16 Different Panelswith Various Cutouts
Trumpf Area
Custom Panel Dept.
Straight Panel Dept.
PanelMaterial
Rack
RawMaterial Stock
11 Ga. Galvanized Steel(4’ by 8’ standard sheets)
Shear& Cut
BandMaterial

DON'T MEETCURVATURETEMPLATE
REQUIREMENTS ATSETUP
(4' & 6' RADIUSPANELS)
OPERATORS MEASUREMENT
EQUIPMENT
MATERIAL(PANELS, STEEL)
NO SPECS
SET UP VALUESCHANGE
MAINTENANCECHANGESSETTINGS
OPEATORPREFERENCE
NO TRUST ANGLES
SEGMENTLENGTH
LOCATION PANEL OFSPECIALTY PUNCHES
ON PANEL
NO SPECSPUNCHLOCATION
VARIES
STRAIGHT PANEL
DIFFERENTSTEEL PROPERTIES
GALVINIZED COATINGDIFFERENT ON
PANELS
SURFACE FINISHVARIES
YIELD STRENGTH VARIES
PLATETHICKNESS
VARIES HOT VS COLD ROLL
COATINGVARIES
NO SPECS
PANEL NOTCH POSITIONVARIES
MOUNTINGWRONG
POOR TRANSDUCERSELECTION
INDEXES VARY
CRUDE INDEXSYSTEM DESIGN
AIR CYLINDEROPPOSING
HYDRAULIC INHEAD
ASSEMBLY
NOTCH O.D.SPACING VARIES.09 IN
AIR PRESSURE LOW
MAINTENANCE
BADBEARINGSON LOWERFORMING
TOOL
POOR MAINT
RADIUS VARIESSIDE TO SIDE
NO SPECS 3 SUPPLIERS
DIFFERENTEQUIPMENT
USED
R12 OPERATIONCAUSE AND EFFECT DIAGRAM
Figure 1Red = Most Important Causes
NO SPECS
NO DIMENSIONAL SPECS OR TOLERANCES
RADIUS TEMPLATEACCURACY
DIFFERENTMEASURES USED ON
R1 & R12
DIFFERENT SETUPPROCEDURES
OPERATORJUDGEMENT RADIUS
USE OF AIR vs.HYDRAULICS
SPECIALTY PUNCH
WIDTH OF STEEL BETWEENNOTCHES VARIES 3.75 to 4.0 in.
ACROSS RADIUS
3 SUPPLIERS
3 SUPPLIERS
INDEXES VARY
PANEL WIDTH VARIES
SHEET DIMENSIONSVARY
PANELS CATCH ATLAST 2 BENDS
CONVEYOR NOTADJUSTED
PANEL NOTSQUARE. wIDTH
TOO LARGE
PANELSQUARENESS
DIGITAL READOUTUSELESS
BACKING SHOEADJ.USTMENT.
BANDS HAVECAMBER
3 SUPPLIERS
INACCURATECUTTING

R12 Process ImprovementsSeparate Process & Machine Issues
R12 Process ImprovementsSeparate Process & Machine Issues
Common setup procedureCommon setup procedureReplace measurement gagesReplace measurement gagesEstablished process capabilityEstablished process capabilityImplementing process controlsImplementing process controlsfor panel dimensionsfor panel dimensionsWorking with suppliers toWorking with suppliers tocontrol steel plate dimensionscontrol steel plate dimensionsCompleted identifiedCompleted identifiedmaintenance actionsmaintenance actionsImplementing PM programImplementing PM program

Lean Automation In ProgressLevel 2
Lean Automation In ProgressLevel 2
Modification of RadiusModification of RadiusBending Machine R12Bending Machine R12Operate as a cellOperate as a cellRuns two product familiesRuns two product familiesChangeover in less than 10Changeover in less than 10sec. within product familysec. within product familyChangeover in less than 5Changeover in less than 5min. between productmin. between productfamiliesfamiliesCycle time reduced from 5Cycle time reduced from 5min. to 1.8 min.min. to 1.8 min.

MACHINE MODIFICATIONSMACHINE MODIFICATIONS
• Automated band cuttingAutomated band cutting•• Radius measurement on line Radius measurement on line•• Servo driven adjustments from Servo driven adjustments frompanel bar codespanel bar codes

Long Cycle Times - Low ProductivityElectric Drill Assembly
The Challenge
Long Cycle Times - Low ProductivityElectric Drill Assembly
The Challenge
40 sec. cycle time for40 sec. cycle time for2 parts. Manual2 parts. ManualAssemblyAssembly3 different assemblies3 different assemblies12 “machines” (Four12 “machines” (Fourtooled for threetooled for threeassemblies)assemblies)24 operators on two24 operators on twoshiftsshiftsClient wanted oneClient wanted onelarge machinelarge machine

Lean Techniques UsedBefore Automation
Lean Techniques UsedBefore Automation
Product Family Value Stream MapProduct Family Value Stream Map
Cycle Time Reduction to Produce SmallCycle Time Reduction to Produce SmallBatches (Needed 4 sec. cycle timeBatches (Needed 4 sec. cycle time
Setup Time ReductionSetup Time Reduction
Visual WorkplaceVisual Workplace

Lean AutomationAutomated Pin/Carrier
Assembly System Level 3
Lean AutomationAutomated Pin/Carrier
Assembly System Level 3

AFTER Automated Pin/CarrierAssembly System
The Results
AFTER Automated Pin/CarrierAssembly System
The Results3 semi-automated3 semi-automatedmachines machines vsvs 1 BIG 1 BIGONE! ($1mm savings)ONE! ($1mm savings)Each machine runs aEach machine runs aproduct familyproduct familyNo changeoverNo changeover3 sec. cycle time per3 sec. cycle time percarrier carrier vs vs 40 sec.40 sec.3 operators on 1 shift3 operators on 1 shiftvs vs 2424Small batchesSmall batchesAcceptance in 1 dayAcceptance in 1 day
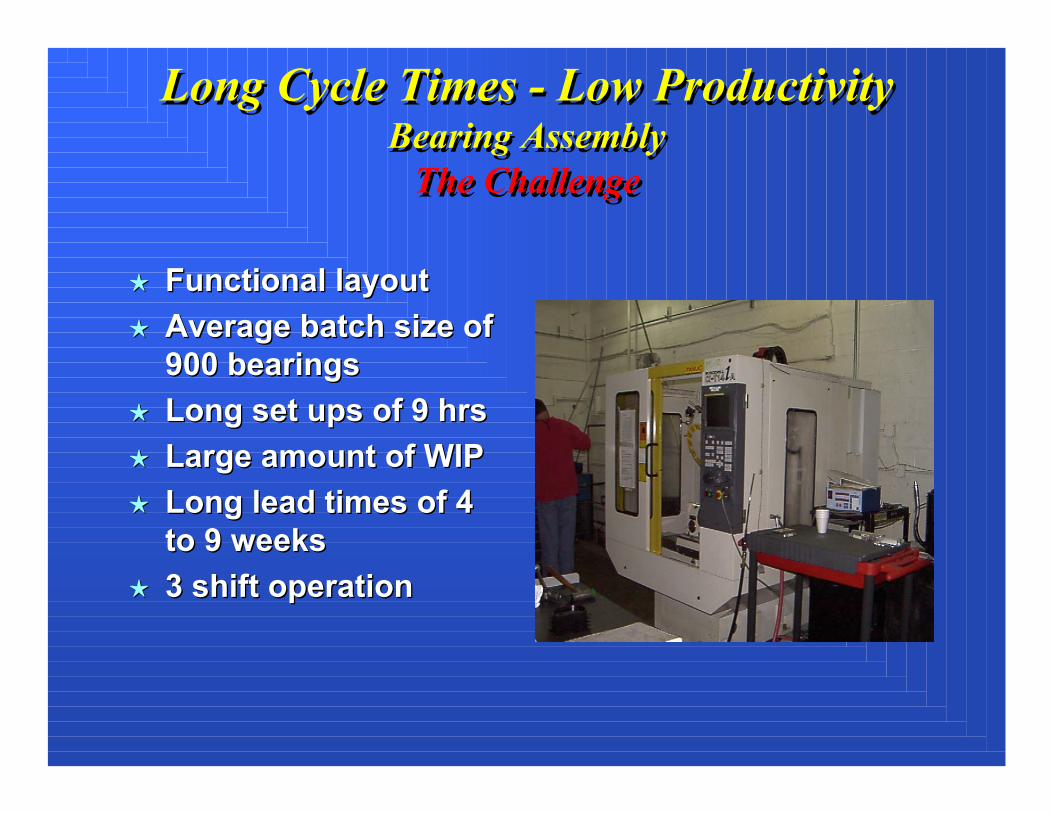
Long Cycle Times - Low ProductivityBearing Assembly
The Challenge
Long Cycle Times - Low ProductivityBearing Assembly
The Challenge
Functional layoutFunctional layoutAverage batch size ofAverage batch size of900 bearings900 bearingsLong set ups of 9 hrsLong set ups of 9 hrsLarge amount of WIPLarge amount of WIPLong lead times of 4Long lead times of 4to 9 weeksto 9 weeks3 shift operation3 shift operation

BEFORE Lean AutomationBEFORE Lean Automation

Lean Techniques UsedBefore Automation
Lean Techniques UsedBefore Automation
Product Family Value Stream MapProduct Family Value Stream Map
Set Up Time Reduction Set Up Time Reduction (quick changeover chuck)(quick changeover chuck)
Cellular Manufacturing & LayoutCellular Manufacturing & Layout
Balance Flow & Cycle Time Reduction toBalance Flow & Cycle Time Reduction toProduce Small BatchesProduce Small Batches
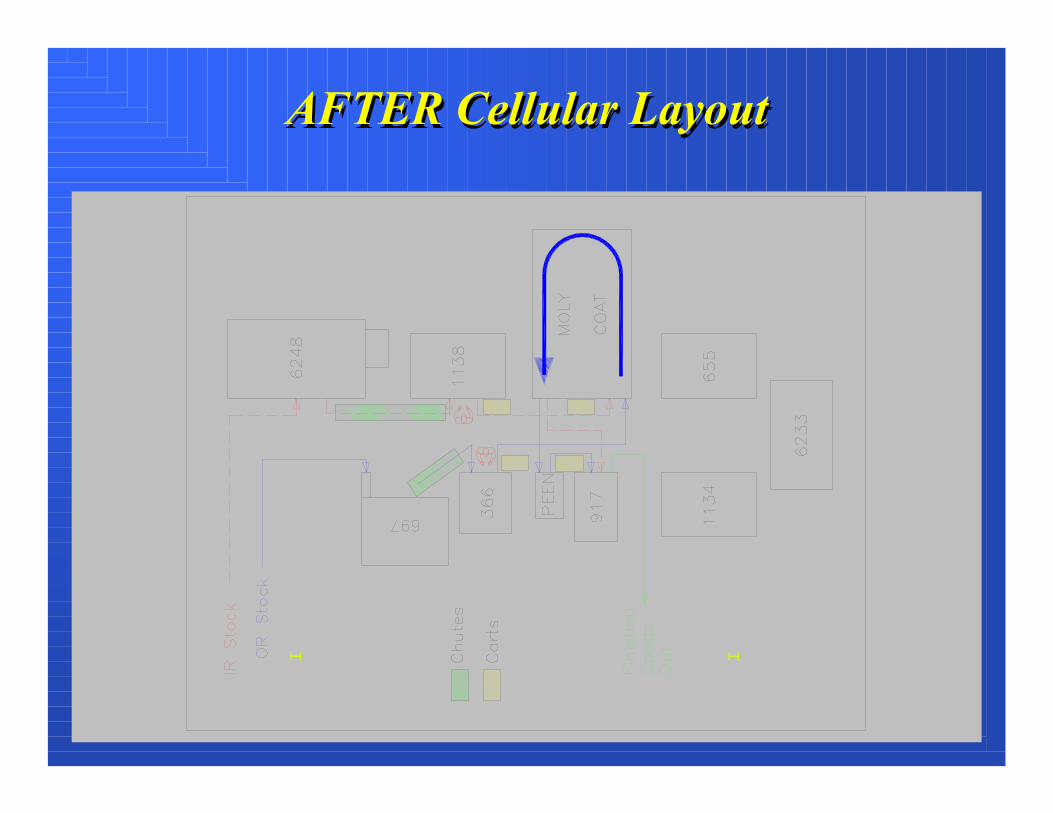
AFTER Cellular LayoutAFTER Cellular Layout

Next Step - Lean Automation Level 3AUTOMATIC LOADER/UNLOADER
Next Step - Lean Automation Level 3AUTOMATIC LOADER/UNLOADER
Automated partsAutomated partsfeeding & reducedfeeding & reducedhandlinghandlingDecouple machineDecouple machinecycle from operatorcycle from operatorCell cycle time at 1Cell cycle time at 1min. per bearingmin. per bearingSetup time reduced toSetup time reduced to2 to 4 hrs2 to 4 hrsOne shift operationOne shift operationAverage batch size ofAverage batch size of100 down to 10100 down to 10

AUTOMATIC LOADER/UNLOADERAUTOMATIC LOADER/UNLOADER

Low Machine Output - Long Cycle TimesToy Parts Bagging Lines
The Challenge
Low Machine Output - Long Cycle TimesToy Parts Bagging Lines
The Challenge
Lines average 5 to 10Lines average 5 to 10bags per minutebags per minuteFeeders not movableFeeders not movablebetween linesbetween linesLines operate differentlyLines operate differentlyOperators dedicated toOperators dedicated tolines. No one wants Linelines. No one wants Line#7#7Large amounts of WIPLarge amounts of WIPClient wanted moreClient wanted morefeeders & linesfeeders & lines

Lean Techniques UsedBefore Automation
Lean Techniques UsedBefore Automation
Process Flow DiagramsProcess Flow Diagrams
Setup Time ReductionSetup Time Reduction
Cycle Time Reduction to Produce SmallerCycle Time Reduction to Produce SmallerOrdersOrders
Visual WorkplaceVisual Workplace

After Lean Automation Level 3Line Electrical and Controls Modifications
After Lean Automation Level 3Line Electrical and Controls Modifications
Average 12 to 20 bagsAverage 12 to 20 bagsper minute per minute vs vs 5 to 105 to 10Feeders interchangeableFeeders interchangeablebetween linesbetween linesAll lines have the sameAll lines have the samecontrol systemcontrol systemControl panels are theControl panels are thesamesameOperators can run anyOperators can run anylinelineNo new feeders requiredNo new feeders required
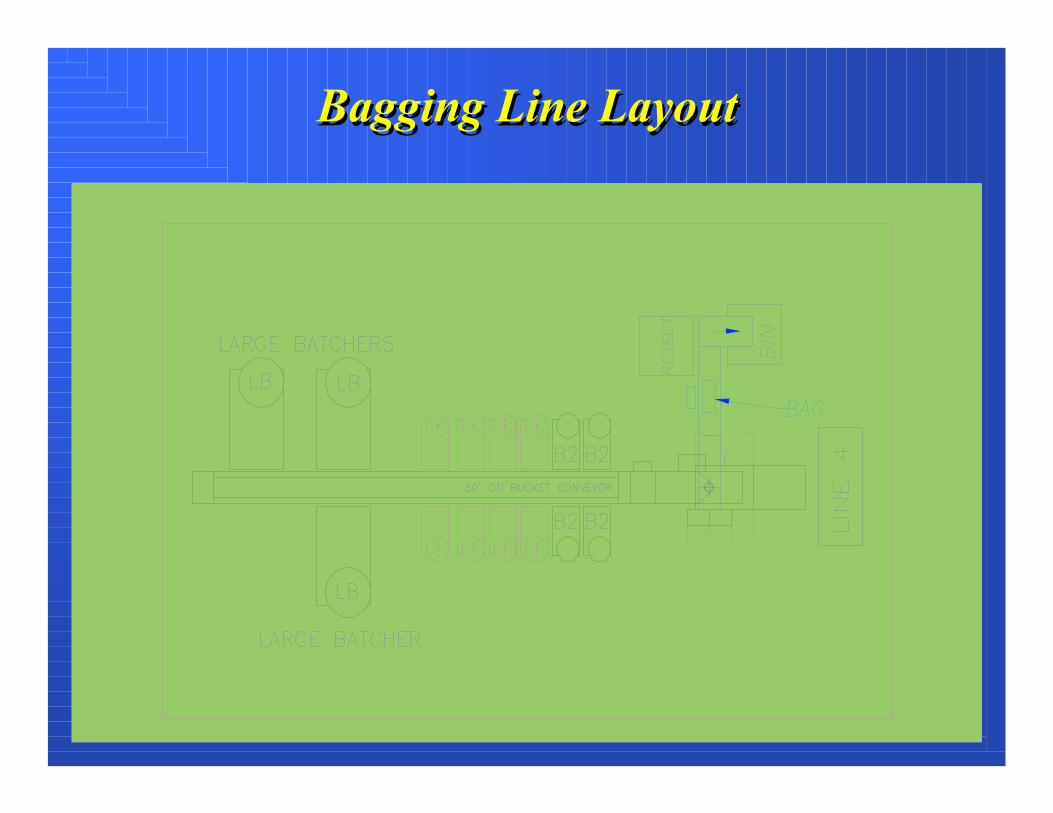
Bagging Line LayoutBagging Line Layout

Lean Automation Part 3Rod Orienter for Improved Parts Feeding
Lean Automation Part 3Rod Orienter for Improved Parts Feeding
BEFOREBEFORE
AFTER

Lean Automation Part 3Continuous Improvement
Reconfiguration Changes to Bagging
Lean Automation Part 3Continuous Improvement
Reconfiguration Changes to Bagging
Two lines installed atTwo lines installed atAdvent DesignAdvent DesignChanged bagChanged bagconfigurationsconfigurationsSlow-feeding, complexSlow-feeding, complexparts run on smallparts run on smallbagging linebagging lineRunning common partsRunning common partson bagging lineson bagging lines

Across the “Great Divide”Across the “Great Divide”
Level 4 AutomationLevel 4 Automation

Low Productivity - Complex FlowStainless Dinner Ware
The Challenge
Low Productivity - Complex FlowStainless Dinner Ware
The Challenge
Functional layoutFunctional layoutManual packing on 3Manual packing on 3shiftsshifts128 packers128 packersErgonomic problemsErgonomic problemsExtensive materialExtensive materialstagingstaging

BEFORE Lean AutomationFunctional Layout with Manual AssemblyBEFORE Lean AutomationFunctional Layout with Manual Assembly

ExistingMachine
(2a)
Shrink WrapIndividual (1b)
Shrink Wrap inBundles (1c)
Strip WrapMachine
(perpendicularto flow) (2e)
CoatingMachine
(2d)
Auto.(3b)
Man.(3a)
Robot(3c)
Strip WrapMachine
(parallel toflow) (2f)
Existing Tray(4a)
RedesignedTray (4b)
Magazine(4c)
Reel(4d)
ManualFeeding
(5a)
(Semi)AutomatedMagazine
(5c)
Robotic Pickand Place
(5b)
Continuous /Tractor TypeFeed and Cut
(5d)
End LoadingCartoningMachine
(with leafletdispenser)
Bomb BayDoor
WrappingMachine (2)
Storage (4)
Feeding(5)
Recommended Automation Option(Coating with Possible Shrink Bundles)
DeckInsertion
(next slide)CoatingRemoval
Bag sealed onthree sides (1a)
Coating(1d)
Strip Wrapping(1e)
WrappingOptions (1)
NewBaggingMachine
(2b)
ShrinkWrap
Machine(2c)
Transfer tostorage (3)
LabelingMachine
CasePacker Palletizer
SHIP
Coated Pieces
Deck(consumerline only)

C a r t o n e r5 P P S &
S e r v i n g S e t s
C a r t o n e r2 0 P i e c e
A u t o m a t e dS h r i n k W r a p
L i n e
C a s e P a c k e r
P a l l e t i z e r
C a r t o n e r4 0 P i e c e
T r a y s
R o b o t i cP i c k & P l a c e
R o b o t i cP i c k & P l a c e
D i s p l a yD e c k s
R o b o t i cP i c k & P l a c e
R o b o t i cP i c k & P l a c e
L a b e l e r L a b e l e r
L a b e l e r
R o b o t i cP i c k & P l a c e
B r o c a d e C a r t o n i n g L i n e O p t i o n s
C a s e P a c k e r( I n n e r C a r t o n )
C a s e P a c k e rC a s e P a c k e r( O u t e rC a r t o n )
C a s e P a c k e r
L a b e l e r
L a b e l e r L a b e l e rL a b e l e r
P a l l e t i z e r
C a r t o n e rF o o d S e r v i c e
L a b e l e r
L a b e l e r

AFTER Lean Automation Levels 2 & 4Focused Product Family Automation with 59 operators vs 128
AFTER Lean Automation Levels 2 & 4Focused Product Family Automation with 59 operators vs 128

How Do Implement Lean Automation?How Do Implement Lean Automation?How Do Implement Lean Automation?
Assess the operation using a Value StreamAssess the operation using a Value StreamMap or Map or PFDsPFDs (Product families & Production data)(Product families & Production data)
Evaluate the layout and flowEvaluate the layout and flow
Identify lean improvements & Identify lean improvements & kaizenskaizenswithout automationwithout automation
Quality improvement Quality improvement TPM TPM Point of Use Point of Use

How Do Implement Lean Automation?How Do Implement Lean Automation?How Do Implement Lean Automation?
Implement lean improvements using VSMImplement lean improvements using VSMplanplan
Identify lean automation opportunitiesIdentify lean automation opportunities Reduce repetitive motion Reduce repetitive motion Reduce material handling Reduce material handling Improve quality Improve quality
Design and implement lean automationDesign and implement lean automation
Start the cycle again!Start the cycle again!

Benefits of Lean AutomationSummary
Benefits of Lean AutomationSummary
Lower cost automationLower cost automation
Simpler implementation & faster acceptanceSimpler implementation & faster acceptance
Greater flexibility for setup & material flowGreater flexibility for setup & material flow
Maximizes operator utilizationMaximizes operator utilization
Better use of floor spaceBetter use of floor space

Where Do We Go From Here?Where Do We Go From Here?
Become knowledgeable of LeanBecome knowledgeable of LeanTechniques (Techniques (MEPsMEPs))Question automation assumptionsQuestion automation assumptionsImplement Lean solutionsImplement Lean solutionsfirst…then automatefirst…then automateDesign engineers must thinkDesign engineers must thinkdifferentlydifferentlyGet work force involved: Use ofGet work force involved: Use ofautomation automation kaizenskaizensEstablish a cycle of continuousEstablish a cycle of continuousimprovementimprovement

Lean Automation Makes Us AllWinners!
Lean Automation Makes Us AllWinners!
Reduced costs
Shorter cycle times
Smaller batch sizes
Reduced inventory
Improved quality
Reduced lead times
Greater flexibility

Advent Design Corporation
925 Canal StreetBristol PA, 19007
(P) 215 781 0500(F) 215 781 0508
Bill Chesterson
Tom Lawton
Frank Garciawww.adventdesign.com
CEO Automation & Product Design215 781 0500 Ext: [email protected]
PresidentContract Manufacturing215 781 0500 Ext: [email protected]
DirectorPlanning & Productivity215 781 0500 Ext: [email protected]