important notice · gmv (group) platform gmv 1 1 2018 ( u s d m ) order contribution (group)...
TRANSCRIPT

IMPORTANT NOTICE
This presentation, and the accompanying oral presentation, contains forward-looking statements within the meaning of the Private Securities Litigation Reform Act of 1995. All statements contained in this presentation and the
accompanying oral presentation that do not relate to matters of historical fact should be considered forward-looking statements, including, without limitation, statements regarding our expected financial performance including
guidance for the first quarter 2019 and full year 2019, as well as statements that include the words “expect,” “intend,” “plan,” “believe,” “project,” “forecast,” “estimate,” “may,” “should,” “anticipate” and similar statements of a future
or forward-looking nature. These forward-looking statements are based on management’s current expectations. These statements are neither promises nor guarantees, but involve known and unknown risks, uncertainties and
other important factors that may cause actual results, performance or achievements to be materially different from any future results, performance or achievements expressed or implied by the forward-looking statements,
including, but not limited to: purchasers of luxury products may not choose to shop online in sufficient numbers; our ability to generate sufficient revenue to be profitable or to generate positive cash flow on a sustained basis; the
volatility and difficulty in predicting the luxury fashion industry; our reliance on a limited number of retailers and brands for the supply of products on our Marketplace; our reliance on retailers and brands to anticipate, identify and
respond quickly to new and changing fashion trends, consumer preferences and other factors; our reliance on retailers and brands to make products available to our consumers on our Marketplace and to set their own prices for
such products; our reliance on information technologies and our ability to adapt to technological developments; our ability to acquire or retain consumers and to promote and sustain the Farfetch brand; our ability or the ability of
third parties to protect our sites, networks and systems against security breaches, or otherwise to protect our confidential information; our ability to successfully launch and monetize new and innovative technology; our
dependence on highly skilled personnel, including our senior management, data scientists and technology professionals, and our ability to hire, retain and motivate qualified personnel; Mr. Neves has considerable influence over
important corporate matters due to his ownership of us, and our dual-class voting structure will limit your ability to influence corporate matters, including a change of control; and the other important factors discussed under the
caption “Risk Factors” in our final prospectus under Rule 424(b) filed with the U.S. Securities and Exchange Commission (“SEC”) on September 24, 2018 in connection with our initial public offering and in our annual report on
Form 20-F filed with the SEC on or about the date of this presentation, as such factors may be updated from time to time in our other filings with the SEC, which are accessible on the SEC’s website at www.sec.gov. In addition,
we operate in a very competitive and rapidly changing environment. New risks emerge from time to time. It is not possible for our management to predict all risks, nor can we assess the impact of all factors on its business or the
extent to which any factor, or combination of factors, may cause actual results to differ materially from those contained in any forward-looking statements that we may make. In light of these risks, uncertainties and assumptions,
the forward-looking events and circumstances discussed in this presentation and the accompanying oral presentation are inherently uncertain and may not occur, and actual results could differ materially and adversely from those
anticipated or implied in the forward-looking statements. Accordingly, you should not rely upon forward-looking statements as predictions of future events. In addition, the forward-looking statements made in this presentation and
the accompanying oral presentation relate only to events or information as of the date on which the statements are made in this presentation and the accompanying oral presentation. Except as required by law, we undertake no
obligation to update or revise publicly any forward-looking statements, whether as a result of new information, future events or otherwise, after the date on which the statements are made or to reflect the occurrence of
unanticipated events. Unless otherwise indicated, information contained in this presentation concerning our industry, competitive position and the markets in which we operate is based on information from independent industry
and research organizations, other third-party sources and management estimates. Management estimates are derived from publicly available information released by independent industry analysts and other third-party sources,
as well as data from our internal research, and are based on assumptions made by us upon reviewing such data, and our experience in, and knowledge of, such industry and markets, which we believe to be reasonable. In
addition, projections, assumptions and estimates of the future performance of the industry in which we operate and our future performance are necessarily subject to uncertainty and risk due to a variety of factors, including those
described above. These and other factors could cause results to differ materially from those expressed in the estimates made by independent parties and by us.
This presentation, and the accompanying oral presentation, includes certain financial measures not presented in accordance with the International Financial Reporting Standards (IFRS) including but not limited to, Adjusted
EBITDA, Adjusted EBITDA Margin, Adjusted Revenue, Platform Services Revenue, Platform Gross Profit, Platform Order Contribution, and Platform Order Contribution Margin. These financial measures are not measures of
financial performance in accordance with IFRS and may exclude items that are significant in understanding and assessing the Company’s financial results. Therefore, these measures should not be considered in isolation or as
an alternative to loss after tax, revenue, gross profit or other measures of profitability, liquidity or performance under IFRS. You should be aware that the Company’s presentation of these measures may not be comparable to
similarly-titled measures used by other companies, which may be defined and calculated differently. See the appendix for a reconciliation of these non-IFRS measures to the most directly comparable IFRS measure.
The trademarks included herein are the property of the owners thereof and are used for reference purposes only. Such use should not be construed as an endorsement of the products or services of the Company.
Certain figures in this presentation may not recalculate exactly due to rounding. This is because percentages and/or figures contained herein are calculated based on actual numbers and not the rounded numbers presented.

1,000+
supply partners
1.4m
active consumers
1 Consumer is deemed to be active if they made a purchase on the Farfetch Marketplace within the last 12-month period.
1
1
$619 2018 AOV$1.4bn 2018 GMV
at a Glance

GLOBAL END-TO-END
LOGISTICS OFFERING
PARTNER
RELATIONSHIPS
TECHNOLOGY
PLATFORM
We are the world’s only marketplace for luxury at scale with powerful network effects
Introducing Farfetch

Farfetch’s 3 Original Insights
Digital will transform the luxury industry
There needs to be a global platform for
curated aggregation of the best brands
and retailers
Existing platforms are not tailored to
service the modern luxury consumer and
not compatible with luxury brands
Revolutionize the luxury
shopping experience
Empower and connect
consumers, curators and
creators through technology
Manage customer
experience end-to-end
1
2
3

Luxury Industry Overview
Craftsmanship
and Heritage
Strong Focus
on Brand Image ScarcityControl
10,000s of smaller brands and independent designers

144 144 142151
164177
190188
174
197
220
245 250259
289 288300 307
2001 2002 2003 2004 2005 2006 2007 2008 2009 2010 2011 2012 2013 2014 2015 2016 2017 2018E
ResetChinese GrowthEntry of ecommerce Luxury Crisis Dawn of
the Digital
Era
M A R K E T S I Z E ( U S D b n )
Source: Bain & Company, “The Future of Luxury: A Look Into Tomorrow to Understand Today (November 2018)”. Data converted from EUR to USD at an exchange rate of 1.1815 (2018 average).
Phases of Development of the Luxury Market
Online Share
9%8%
10%

Attractive Industry Dynamics
Emerging Market Growth Generational Shift Luxury Purchases Online
32%
46%
2017
2025F
Share of Chinese Consumers (by Nationality)
in Personal Luxury Goods Sales
32%
45%
2017
2025F
Gen Y and Z Share in Global Personal
Luxury Goods Sales% Online Penetration
10%
25%
2018E
2025F
~$430bn Global Personal Luxury Goods Market by 2025F
Note: “E” = estimate; “F” = forecast as per Bain & Company. Source: Bain & Company, “The Future of Luxury: A Look Into Tomorrow to Understand Today (November 2018)”. Data converted from EUR to USD at an exchange rate of 1.1815 (2018
average).
9%2017
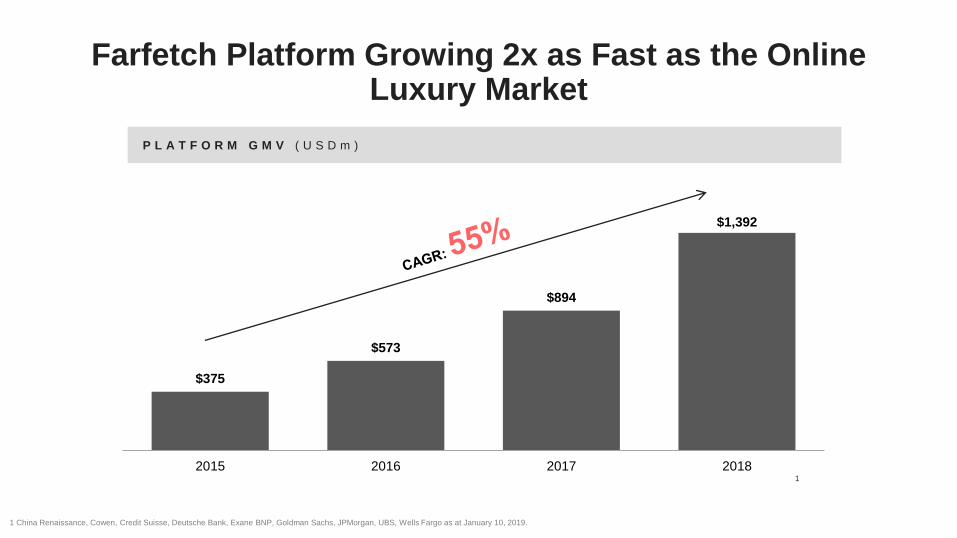
Farfetch Platform Growing 2x as Fast as the Online Luxury Market
$375
$573
$894
$1,392
2015 2016 2017 2018
P L A T F O R M G M V ( U S D m )
1 China Renaissance, Cowen, Credit Suisse, Deutsche Bank, Exane BNP, Goldman Sachs, JPMorgan, UBS, Wells Fargo as at January 10, 2019.
1

Integrated Tools for Luxury Sellers
Marketplaces Farfetch Platform Solutions
PhotographyInventory
ManagementPayments Fulfilment
TechnologyPlatform
Store of the
Future
Black &
White

Premier Luxury Gateway to China
Farfetch’s acquisition of Toplife from JD.com and
Level 1 access on JD app, combined with
Farfetch’s other capabilities in China, creates the
Premier Luxury Gateway to China to help luxury
brands succeed in the Chinese market
TOPLIFE FARFETCH APP
FARFETCH.CN SITE
CURIOSITYCHINA

($156)
($96)
$194
$194
$292
$292
$489
$489
$1,392
$1,392
$7
$98
$16
$16
(200) 0 200 400 600 800 1,000 1,200 1,400 1,600
Revenue (IFRS)
Platform Services Revenue
Adjusted EBITDA (Group)
3
Fulfilment Browns In-StorePlatform
(Technology Expense)
GMV (Group)
Platform GMV
1
1
2 0 1 8 ( U S D m )
Order Contribution (Group)
Platform Gross Profit
Gross
Margin4
60%
Platform
Order
Contribution
40%
Results of Operations
1 GMV is inclusive of product value, shipping and duty and net of returns, value added taxes and cancellations. Platform GMV includes First-Party and Third-Party Platform GMV. 2 Non-IFRS financial measures. Reconciliation to IFRS measures are in the
Appendix. 3 Excluding other items (non-recurring and one-off items). 4 Defined as Platform Gross Profit (which is defined as gross profit, excluding Browns In-Store Gross Profit) as a percentage of Platform Services Revenue.
(General and Administrative)
(Demand Generation Expense)
(Cost of Revenue)
2
2
2
2
Loss after tax

Demand Generation Costs Driving Attractive Unit Economics
Source: Farfetch internal data 1 Includes Affiliates, Display, PPC 2 Includes SEO, Email, Direct, Referral.
~ 50%
D E M A N D G E N E R A T I O N % O F P L A T F O R M G M V
L I F E T I M E V A L U E O F A C O N S U M E R T O C O N S U M E R A C Q U I S I T I O N C O S T R A T I O S
+82 bps
2 0 1 8 G M V ( U S D ) B Y C H A N N E L
Low Cost /
Organic
Channels2
Higher Cost
/ Paid
Channels17%
FY2018
2015 Cohort
2016 Cohort
2017 Cohort
1.42 x
1.81 x
2.71 x
1.53 x
2.04 x
1.77 x
LTV / CACafter 6 months
LTV / CACafter 12 months
LTV / CACafter 24 months

AMERICAS
Farfetch is a Global Platform
Farfetch office
Localized site2
Source: Farfetch GMV in 2018, offices and sites from Company information; industry demand from Bain & Company.1 For the year 2018E excluding RoW which is 5%. Data split by location of consumers. 2 Localized indicates a site with local language and/or currency. 3 Industry demand, according to Bain & Company, based on Europe only. 4 Industry demand, according to Bain & Company, based on Mainland China, Japan and Rest of Asia.
% Industry demand1
% Farfetch GMV
32%
40%
32%
31%
EMEA3
APAC4
31%
29%

APPENDIX

Reconciliation of Non-IFRS Measures
• Adjusted EBITDA, Adjusted EBITDA Margin, Adjusted Revenue and Platform
Services Revenue are supplemental measures of our performance that are not
required by, or presented in accordance with, IFRS. Adjusted EBITDA, Adjusted
EBITDA Margin, Adjusted Revenue and Platform Services Revenue are not
measurements of our financial performance under IFRS and should not be
considered as an alternative to loss after tax, revenue or any other performance
measure derived in accordance with IFRS.
• We define Adjusted EBITDA as loss after tax before net finance costs / (income),
income tax expense / (credit) and depreciation and amortization, further adjusted
for share based compensation expense, other items and share of results of
associates. We define Adjusted EBITDA Margin as Adjusted EBITDA calculated
as a percentage of Adjusted Revenue. We define Adjusted Revenue as revenue
less Platform Fulfilment Revenue. We define Platform Services Revenue as
Adjusted Revenue less Browns In-Store Revenue.
• We caution investors that amounts presented in accordance with our definitions of
Adjusted EBITDA, Adjusted EBITDA Margin, Adjusted Revenue and Platform
Services Revenue may not be comparable to similar measures disclosed by other
companies, because not all companies and analysts calculate Adjusted EBITDA,
Adjusted EBITDA Margin, Adjusted Revenue and Platform Services Revenue in
the same manner.
D E F I N I T I O N S
1 Represents share based payment expense. 2 Represents other items, which are outside the normal scope of our ordinary activities or non-cash, including fair value remeasurement of $3.3 million in second quarter 2017 and legal fees directly related to acquisitions of $0.1 million in fourth quarter
2017, all of which are included within the general and administrative component of selling, general and administrative expenses. There were no other such items in 2018.
(U S D m) FY’18
Loss after tax $ (156)
Net finance costs / (income) (20)
Income tax expense / (credit) 2
Depreciation and amortization 24
Share based payments1
54
Other items2
-
Share of results of associates (0)
A d j u s t e d E B I T D A $ (96)
(U S D m) FY’18
Revenue $ 602
Less: Platform Fulfilment Revenue (98)
Adjusted Revenue 505
Less: Browns ln-store Revenue (16)
P l a t f o r m S e r v i c e s R e v e n u e $ 489

Reconciliation of Non-IFRS Measures (cont’d)
• Platform Order Contribution is defined as Platform Gross
Profit less demand generation expense. Platform Gross Profit,
and Platform Order Contribution are not a measurements of
our financial performance under IFRS and do not purport to
be alternatives to gross profit or loss after tax derived in
accordance with IFRS.
• We believe that Platform Gross Profit and Platform Order
Contribution are useful measures in evaluating our operating
performance because they take into account demand
generation expense and are used by management to analyze
the operating performance of our platform for the periods
presented. We also believe that Platform Gross Profit and
Platform Order Contribution are useful measures in evaluating
our operating performance within our industry because they
permit the evaluation of our platform productivity, efficiency
and performance.
D E F I N I T I O N S
1 Browns In-Store Gross Profit is Browns In-Store Revenue less the direct cost of goods sold relating to Browns In-Store Revenue.
(U S D m) FY’18
Gross Profit $ 298
Less: Browns In-Store Gross Profit1
(7)
Platform Gross Profit 292
Less: Demand Generation Expense (97)
P l a t f o r m O r d e r C o n t r I b u t i o n $ 194