improved conditioning for biosolids dewatering in wastewater treatment … · 2015-12-10 ·...
TRANSCRIPT
Improved Conditioning for Biosolids
Dewatering in Wastewater Treatment Plants
by
Vu Hien Phuong To
A thesis submitted to fulfilment
of the requirements for the degree of
Master of Engineering (by Research)
University of Technology, Sydney
Faculty of Engineering and IT
July, 2015


iii
ACKNOWLEDGEMENT
I would like to express my special appreciation and thanks to my principal supervisor
Dr. Tien Vinh Nguyen and my co – supervisor Professor Saravanamuthu Vigneswaran.
I would like to thank them for encouraging my research and for allowing me to grow as
a research scientist. Their advice on both research as well as on my career have been
priceless. Without their supervision and constant help this thesis would not have been
possible.
I would also like to thank all academic staffs of The Centre for Technology in Water
and Wastewater (CTWW) for their valuable advices, comments, suggestions as well as
encouragement during my study. A special thank to Mohammed Jorhir, laboratory
manager, for his useful helps and advice for my research. I also want to thank Dr Nga
Pham, Dr S. Jeong, Thuy Chung Nguyen for their helpful guidance of laboratory skills.
Thanks to all my colleagues of CTWW for their support and encouragement.
In addition, I would like to thank Professor Long Nghiem and all colleagues in School
of Civil Mining and Environmental Engineering, University of Wollongong, for
assisting with Modified Centrifugal Index (MCI) tests and also to MAU
(Microstructural Analysis Unit), Faculty of Science, University of Technology, Sydney
for their technical support.
My special thanks to Sydney Water Corporation for their supports of both finance and
knowledge for my research. My great appreciation for Dr. S. Murthy, Innovations Chief
for the District of Columbia Water and Sewer Authority (DC Water) and Prof. M.
Higgins from Buckell University, US, who have significant experience in the research

iv
area, by virtue of their helpful consultancy for my study. Also, a grateful thank to UTS
International Research Scholarship (UTS IRS) for tuition fee support for my study of
Master Degree.
The last but not least, I would like to send my special thanks to family and all of my
friends. They were always supporting and encouraging me with their best wishes.

v
TABLE OF CONTENTS
Title page ............................................................................................................................ i
Certificate of Original Authorship .................................................................................... ii
Acknowledgement............................................................................................................ iii
Table of contents ............................................................................................................... v
Nomenclature ................................................................................................................... ix
List of abbreviations .......................................................................................................... x
List of tables ..................................................................................................................... xi
List of figures ................................................................................................................. xiii
Abstract xvii
CHAPTER 1
INTRODUCTION 1-1
1.1. Background 1-2
1.2. Research objectives 1-4
1.3. Scope of the study 1-5
CHAPTER 2
LITERATURE REVIEW 2-1
2.1. Sewage sludge 2-2
2.1.1. Classifications, sources and quantities 2-2
2.1.2. Sludge characteristics 2-5
2.2. Sewage sludge treatment 2-8
2.2.1. Sludge thickening 2-9
2.2.2. Sludge stabilization 2-12
2.2.3. Sludge conditioning 2-14
vi
2.2.4. Sludge dewatering 2-17
2.3. Chemical conditioning of sludge 2-20
2.3.1. Polymer conditioning 2-20
2.3.1.1. Polymer demand for conditioning 2-20
2.3.1.2. Mixing intensity for conditioning 2-21
2.3.2. Other chemical conditioning methods 2-23
2.3.2.1. Dual conditioning 2-23
2.3.2.2. Advanced oxidation (Fenton) conditioning 2-26
2.4. Indicators for sludge dewaterability 2-27
2.4.1. Challenges in measuring sludge dewatering performance 2-27
2.4.2. Indicators for dewatering by filtration processes 2-30
2.4.3. Indicators for dewatering by centrifugation processes 2-32
2.4.4. Other techniques for dewaterability measurements 2-35
2.4.3.1. Moisture distribution 2-36
2.4.3.2. Rheology 2-38
2.4.5. Assessment of dewaterability indicators 2-39
CHAPTER 3
MATERIALS AND METHODS 3-1
3.1. Materials 3-2
3.1.1. Sludge 3-2
3.1.2. Chemicals 3-6
3.2. Experimental studies 3-8
3.2.1. Sludge characterization 3-8
3.3.1.1. Filtrate preparation 3-8
3.3.1.2. Analysis methods 3-8
3.2.2. Conditioning tests 3-9
3.2.2.1. Polymer conditioning – Determining optimal conditioning regimes 3-9
3.2.2.2. Conditioning using other chemicals 3-11
3.2.3. Modified centrifugal index (MCI) test 3-12

vii
CHAPTER 4
RESULTS AND DISCUSSION 4-1
4.1. Sludge characterization 4-2
4.1.1. Wollongong WWTP 4-2
4.1.1.1. Anaerobically digested sludge (ADS) 4-2
4.1.1.2. Dewatered cake and centrate 4-3
4.1.2. St. Marys WWTP 4-5
4.1.2.1. Aerobically digested sludge (AEDS) 4-5
4.1.2.2. Dewatered cake and filtrate 4-7
4.1.3. Quakers Hill WWTP 4-7
4.1.3.1. Waste activated sludge (WAS) 4-7
4.1.3.2. Dewatered cake and centrate 4-9
4.1.4. Feed sludge characterization – Prediction of sludge conditioning demand
and dewaterability 4-11
4.2. Effects of sludge characteristics on sludge conditioning and dewatering 4-13
4.2.1. Sludge properties in relationships with conditioning and dewatering 4-13
4.2.1.1. For each sludge type 4-13
4.2.1.2. For all sludge types 4-20
4.2.1.3. Soluble COD as a surrogate measure of soluble biopolymers 4-24
4.2.2. Selection of appropriate polymer type for an effective sludge dewatering
4-24
4.3. Conditioning tests – Determination of optimal conditioning regimes 4-28
4.3.1. Determination of optimal mixing intensity 4-28
4.3.2. Determination of optimal polymer demand (OPD) 4-29
4.3.2.1. Wollongong WWTP – ADS 4-30
4.3.2.2. St. Marys WWTP – AEDS 4-31
4.3.2.3. Quakers Hill WWTP – WAS 4-32
4.4. Modified centrifugal index (MCI) 4-33
4.4.1. Effects of centrifugal intensity (gt) on solids cake content 4-33
4.4.2. MCI tests – Prediction of maximum cake solids content achievable by
centrifuge 4-36
4.4.3. MCI tests – Determination of Optimal Polymer Dose (OPD) 4-38
viii
4.4.4. MCI tests – Effect of digestion on sludge dewaterability 4-42
4.5. Other chemical conditioning methods 4-44
4.5.1. Dual conditioning 4-44
4.5.1.1. Dual polymer conditioning–Cationic/Anionic polymers conditioning 4-44
4.5.1.2. Iron/Cationic polymer conditioning 4-46
4.5.2. Advanced oxidation (Fenton) conditioning 4-49
CHAPTER 5
CONCLUSION 5-1
5.1. Conclusion 5-2
5.1.1. Sludge characteristics in relationships with sludge conditioning demand and
dewatering 5-2
5.1.2. Comparisons of different indicators for sludge conditioning and dewatering
5-2
5.1.2.1. Traditionally used indicators 5-2
5.1.2.2. Modified centrifugal index (MCI) – A new centrifuge based laboratory
scale sludge dewatering 5-3
5.1.3. Other chemical conditioning methods as promising solutions for saving of
chemical cost 5-4
5.2. Recommendations 5-4
REFERENCES
APPENDIX A-1
List of Publications based on this research A-2
Sludge characteristics on different sampling times A-3
Dewatering equipment in 3 WWTPs studied A-9
Treatment processes of 3 WWTPs studied A-10

ix
NOMENCLATURE
G = Velocity gradient (s-1)
g = Times gravity
R2 = Correlation coefficient
x
LIST OF ABBREVIATIONS
ADS Anaerobically Digested Sludge
AEDS Aerobically Digested Sludge
BOD Biochemical Oxygen Demand
CST Capillary Suction Time
DS Dry Solids
MCI Modified Centrifugal Index
OPD Optimal Polymer Demand
PD Polymer Demand
rpm revolution per minute
sCOD Soluble Chemical Oxygen Demand
sP Soluble Protein
sPS Soluble Polysaccharides
SS Suspended Solids
VS Volatile Solids
WAS Waste Activated Sludge
WWTP Wastewater Treatment Plant
ZP Zeta Potential

xi
LIST OF TABLES
Table 2–1 Sludge characteristic parameters
Table 2–2 Characterization of wastewater sludges and their dewaterability
Table 2–3 Typical solids concentration for various thickening methods
Table 2–4 Comparison of anaerobic and aerobic digestions
Table 2–5 Summary of sludge conditioning methods
Table 2–6 Comparison of typical mechanical dewatering equipment
Table 2–7 Techniques for predicting dewatering performance of filtration devices
Table 2–8 Sludge dewaterabililty classifications for centrifuge
Table 3–1 General information on 3 WWTPs studied
Table 3–2 Sludge characteristic parameters measured in the study
Table 3–3 Properties of the polymer used in the study
Table 3–4 Concentration of conditioning polymers at 3 WWTPs studied
Table 3–5 Conditioning tests and chemical used
Table 3–6 Conversion between times gravity and centrifuge rotor speed for 7cm of
rotor radius
Table 4–1 Characteristics of ADS, dewatered cake and centrate of Wollongong
WWTP
Table 4–2 Characteristics of AEDS, dewatered cake and centrate of St. Marys
WWTP
Table 4–3 Characteristics of WAS, dewatered cake and centrate of Quakers Hill
WWTP
Table 4–4 Relationships (R2) of sludge characteristics with OPD and CST for
xii
ADS, AEDS, WAS and all sludge types
Table 4–5 Relationships (R2) of sCOD with soluble biopolymers for ADS, AEDS,
WAS and all sludge types
Table 4–6 Optimal mixing intensity for conditioning of ADS, AEDS and WAS
Table 4–7 Comparison of OPD determined by traditional indicators (CST and ZP)
and polymer dose currently used at Wollongong WWTP
Table 4–8 Comparison of OPD determined by traditional indicators (CST and ZP)
and polymer dose currently used at St. Marys WWTP
Table 4–9 Comparison of OPD determined by traditional indicators (CST and ZP)
and polymer dose currently used at Quakers Hill WWTP
Table 4–10 Maximum cake solids content determined by MCI tests and full–scale
processes for 3 sludge types
Table 4–11 Effects of dual polymers conditioning on CST values of conditioned
sludge
Table 4–12 Effects of Iron/Cationic polymer conditioning on CST values of
conditioned sludge
Table 4–13 Effects of Fenton oxidation conditioning on CST values of conditioned
sludge

xiii
LIST OF FIGURES
Figure 2–1 Relationship of sludge solids concentration with residual phosphorus
concentration (Xie et al., 2005)
Figure 2–2 A typical wastewater treatment process and sludge generation
Figure 2–3 Relationship of cake solids content and sludge volume
Figure 2–4 A typical sludge treatment process and dry solids content of sludge after
different treatment steps (Manzel, 1989)
Figure 2–5 Effects of feeding solids on performance of a rotary vacuum filter (EPA,
1984)
Figure 2–6 Summary of dewatering methods (Sanin et al., 2011, Turovskiy and
Mathai, 2006, Vigneswaran and Aim, 1989)
Figure 2–7 Determination of optimal polymer dose for sludge conditioning using
(a) SRF (Sanin et al., 2011) and (b) CST measurements (Novak, 2006)
Figure 2–8 Calibration curve for determining velocity gradient (G) as a function of
mixer speed (rpm) (Higgins et al., 2006)
Figure 2–9 Illustrated mechanism of alum sludge conditioned with combination of
anionic polymer (PAA) and cationic polymer (Percol) (Fan et al., 2000)
Figure 2–10 Two phases of sludge dewatering (Novak et al., 1999)
Figure 2–11 (a) A traditional SRF measurement apparatus set–up (Sanin et al., 2011)
and (b) the schematic diagram of the CST apparatus (Vesilind, 1988)

xiv
Figure 2–12 The schematic diagram of centrifuge (Wakeman, 2007)
Figure 2–13 Schematics of the arm–suspended centrifuge (Chu and Lee, 2001)
Figure 2–14 (a) Relationship between bound water content and cake solid
concentration (Subramanian, 2005) and (b) relationship between sludge
water content and dewatering energy demand (Mowla et al., 2013b)
Figure 2–15 (a) Shear stress–shear rate rheogram (Abu-Orf and Dentel, 1999) and
(b) torque rheogram of unconditioned and conditioned sludge with
different polymer doses (Örmeci, 2007)
Figure 3–1 Bench – scale agitator used for conditioning tests in the study
Figure 3–2 (a) The standard CST apparatus and (b) determination of optimal
polymer dose for sludge conditioning using CST test (Novak, 2006)
Figure 3–3 (a) Lab – scale centrifuge and (b) Modified centrifuge cup before (left)
and after (right) MCI test
Figure 4–1 (a) ADS; (b) Dewatered cake and (c) Centrate of Wollongong WWTP
Figure 4–2 (a) AEDS; (b) Dewatered sludge and (c) Filtrate of St. Marys WWTP
Figure 4–3 (a) WAS; (b) Dewatered sludge and (c) Centrate of Quakers Hill
WWTP
Figure 4–4 Relationships between CST and sludge characteristics including: (a)
Soluble COD; (b) Soluble Protein; (c) Soluble Polysaccharides and (d)
Total soluble biopolymers for ADS

xv
Figure 4–5 Relationships between OPD and sludge characteristics including: (a)
Soluble COD; (b) Soluble Protein; (c) Soluble Polysaccharides; (d)
sP/sPS and (e) Total soluble biopolymers for ADS
Figure 4–6 Relationships between OPD and sludge characteristics including: (a)
Soluble COD; (b) Soluble Protein; (c) Soluble Polysaccharides and (d)
Total soluble biopolymers for AEDS
Figure 4–7 Relationships between OPD and sludge characteristics including: (a)
Soluble COD; (b) Soluble Protein; (c) Soluble Polysaccharides and (d)
Total soluble biopolymers for WAS
Figure 4–8 Relationships between CST and sludge characteristics including: (a)
Soluble Protein; (b) Soluble Polysaccharides and (c) Total soluble
biopolymers for all sludge types
Figure 4–9 Relationships between OPD and sludge characteristics including: (a)
Soluble COD; (b) Soluble Protein; (c) Soluble Polysaccharides and (d)
Total soluble biopolymers for all sludge types
Figure 4–10 Conditioning mechanisms based on relationships between OPD and
soluble biopolymer content of ADS and WAS
Figure 4–11 Relationships between OPD and shear intensity (Gt) for ADS
conditioned with zetag8165 and zetag8180
Figure 4–12 OPD determination by CST tests for WAS conditioning (sample on
3/3/2014)
Figure 4–13 Effect of gt on cake solids content of unconditioned and conditioned

xvi
(PD = 12kg/t DS) ADS
Figure 4–14 Effect of gt on cake solids content of unconditioned and conditioned
(PD = 10kg/t DS) AEDS
Figure 4–15 Effect of gt on cake solids content of unconditioned and conditioned
(PD = 6kg/t DS) WAS
Figure 4–16 Cake solids content of conditioned (a) ADS; (b) AEDS and (c) WAS at
different polymer dosages
Figure 4–17 Effect of polymer dose on SS in the centrate of the MCI tests for (a)
ADS; (b) AEDS and (c) WAS
Figure 4–18 Effect digestion on dewaterability (cake solids content) of (a)
unconditioned and (b) conditioned ADS, AEDS and WAS
xvii
ABSTRACT
The aims of this study were to (i) characterize different sludge types, which were
anaerobically digested sludge (ADS), aerobically digested sludge (AEDS) and waste
activated sludge (WAS) obtained from 3 Wastewater Treatment Plant (WWTP) of
Sydney Water, Australia, for the purpose of determining feasible correlations of sludge
properties with polymer demand (PD) for sludge conditioning and dewatering, and (ii)
apply a new method, namely “Modified Centrifugal Index” test, in evaluating the
dewaterability of these sludges after dewatering as well as determining optimal polymer
demand (OPD). Besides polymer conditioning, the study also (iii) investigated several
conditioning methods using other chemicals such as dual conditioning
(Cationic/Anionic polymers and Iron/cationic polymer conditionings) and Fenton
oxidation for improving/maintaining sludge dewaterability while reducing the chemical
cost of sludge treatment.
It is believed that a comprehensive understanding of the sludge characteristics is
essential for optimizing the dewatering process. The study results of sludge
characteristics show that ADS required the highest polymer demand for conditioning
compared to the other sludge types studied. On the contrary, WAS required the least
amount of polymer. The study also proved that there were good correlations between
soluble biopolymers (mainly protein and polysaccharides) and OPD, which highlights
the major role of soluble biopolymers in deciding polymer demand for sludge
conditioning. Besides, these relationships could provide helpful information on suitable
polymer types and dosages for an effective sludge conditioning.

xviii
Although CST is the most common parameter to evaluate the solid – liquid separation
ability, it is often not a reliable indicator. In this study, a modified laboratory – scale
centrifuge apparatus was employed. The experimental results show that Modified
centrifugal index (MCI) test can be successfully used to evaluate the dewaterability of
different sludge types with and without conditioning by estimating the maximum solids
cake achievable by the centrifuge. After conditioning and centrifuge, solids contents
were increased from 16% to almost 30% for ADS and from 19% to 23% for WAS.
These values were similar to the results observed in real WWTPs. This demonstrates
that MCI measurement is good to estimate the final cake concentration as well as
simulate the real centrifuge process. This method can also help to determine optimal
polymer demand (OPD) required for sludge conditioning.
Based on both CST and MCI tests, lower polymer doses than currently used ones were
found to be suitable for sludge conditioning of these 3 WWTPs. This could lead to an
implication of reducing a significant amount of expensive cationic polymers for sludge
conditioning at these plants.
Conditioning methods using other chemicals (besides cationic polymers) which are also
promising solutions for replacing expensive conditioners in the WWTPs were
demonstrated to improve sludge dewaterability in term of CST. However, full – scale
trials or MCI test are needed in the future study to confirm this finding.

1 - 1
UNIVERSITY OF TECHNOLOGY, SYDNEY
FACULTY OF ENGINEERING AND IT
CHAPTER 1
INTRODUCTION
1 - 2
1.1. Background
In recent decades, the quantities of sludge produced are staggering due to the rapid
growth of industrialization and population, causing much of fear in the modern society
(Sanin et al. 2011). As a result, various efforts have been made to search for sustainable
solutions to tackle this problem. Sludge treatment and disposal were used to be
considered merely as a component of water and wastewater treatment and there seemed
to be not sufficient attention paid on this thought–to–be–unimportant subject. However,
as a consequence of increasingly stricter regulations on sludge disposal along with
significant developments of technology, this subject has been becoming no longer a part
but an independent field of study (Gurjar 2001).
The biosolids treatment, transport and disposal are costly major components of
Wastewater Treatment Plants (WWTPs) that account for more than half of treatment
cost of the whole WWTPs (Davis & Hall 1997, Spellman 1997, Wei et al. 2003). This
fact leads to a need of minimizing these costs by reducing biosolids generated. There
have been two solutions for sludge minimization:
- Option 1: Optimization of sludge treatment process, especially conditioning and
dewatering
- Option 2: Reduction of excess sludge production during wastewater treatment
either by reducing provision of oxygen in aerobic processes (Yoon et al. 2004)
or increasing sludge age in MBR (Laera et al. 2009)
Option 2 seems to be quite promising since it results in an immediate savings in sludge
disposal and scaled down downstream processes (Paul & Liu 2012). However,
additional studies, especially full–scale trials, are necessary to identify an optimal
condition where wastewater treatment efficiency and sludge generation rate are

1 - 3
balanced. Although option 1 is widely used in the WWTPs, there is a challenge in
predicting dewatering performance and thus reducing the chemical cost.
Two major difficulties have been attributed to this problem. Firstly, sewage sludge
possesses highly complex and unpredictable nature. In fact, there are numerous factors
having impacts on dewatering characteristics of sludge (Karr & Keinath 1978, Mowla et
al. 2013), which makes it even more complicated and difficult in controlling as well as
predicting dewatering performance. As a result, an inclusive profile of sludge properties
is necessary to elucidate factors which are of greatest concern for both sludge
conditioning and dewatering. Secondly, there seems to be no reliable indicator for
dewatering efficiency yet, especially for centrifuge dewatering. Thus, a good
dewaterability indicator should have ability to simulate the real dewatering process as
well as predict the maximum cake solids content achievable by that process.
It has been known that conditioning treatment is necessary for most of sludge types with
the aim of enhancing water removal rate of dewatering processes. The amount of water
residue in the biosolids is directly proportional to the subsequent cost of transportation
and any further treatments. However, the conditioning for biosolids dewatering in many
WWTPs has not been optimized yet and the dewatered cake produced still has high
water content. As a result, it is important to optimize the conditioning and dewatering
processes to minimize the water content, or in other words to maximize the cake solid
content, and reduce the quantities of biosolids produced. These ultimately lead to
reducing costs for biosolids handling and transport as well as undesirable impacts of
biosolids to environment (Feng et al. 2009).
Although cationic polymers are primarily used for sludge conditioning, they are still
considered as expensive chemicals. Therefore, reducing these agents by using either
1 - 4
combinations of cationic polymers with cheaper conditioners or alternative conditioners
such as oxidation agents could be promising solutions for minimizing the chemical cost
of sludge treatment while maintaining or even improving sludge dewaterability.
1.2. Research objectives
Based on the above mentioned research gaps, the present study was carried out with 5
main objectives:
Obtaining comprehensive knowledge on characteristics of different sewage
sludge types collected from different WWTPs of Sydney Water Corporation;
Determining relationships of sludge properties with sludge dewaterability and
polymer demand for conditioning in order to identify the most influencing
factors of sludge dewatering and conditioning;
Determining optimal conditioning regimes (polymer types, optimal polymer
demand (OPD) and mixing intensity) that lead to the best dewatering
performance of each sludge type studied;
Developing a new method of estimating the ultimate cake solids content
achievable by centrifuge dewatering, namely Modified Centrifugal Index (MCI);
Assessing efficiency of different chemical conditioning methods by performing
conditioning experiments with different conditioning agents (cationic and
anionic polymers, iron and hydrogen peroxide).

1 - 5
1.3. Scope of the study
The study was performed on feeding sludges (unconditioned ones) and by–products
(dewatered cake and centrate/filtrate) of dewatering processes at 3 WWTPs of Sydney
Water Corporation which were St Marys, Quakers Hill and Wollongong WWTPs. The
selection of these WWTPs was based on (i) different sludge types and (ii) opportunities
to improve dewatering at these WWTPs where dewatering has been a problem.

2 - 1
UNIVERSITY OF TECHNOLOGY, SYDNEY
FACULTY OF ENGINEERING AND IT
CHAPTER 2
LITERATURE REVIEW
2 - 2
2.1. Sewage sludge
2.1.1. Classifications, sources and quantities
Sewage sludge is an inevitable by–product of wastewater treatment. However, recently,
the quantities of sludge produced are dramatically rising due to increasingly stringent
wastewater treatment standards and the expansions of sewerage connections. According
to the 2013 survey, the total sewage sludge generation of Australia was about 1.3
million wet tonnes of biosolids which was 200,000 tonnes more than that produced in
2010 (Australian & New Zealand Biosolids Partnership 2013). This led to significant
costs of sludge handling and transports as well as undesirable impacts of biosolids on
the environment.
Sewage sludge quantities as well as characteristics depend not only on types and levels
of wastewater treatments but also on the quality of the influent and effluent (Sanin et al.
2011, Gurjar 2001). A previous study of Xie et al. (2005) showed that the amount of
sludge produced is a function of residual phosphorus concentration in wastewater
(Figure 2–1). It means when reducing phosphorus content in water to near zero, the
sludge solids content is greatly increased. The dependence of sludge characteristics on
various factors leads to a complex nature of sewage sludge (Colin et al. 1988) that
becomes increasingly troublesome to all sludge treatment technologies.
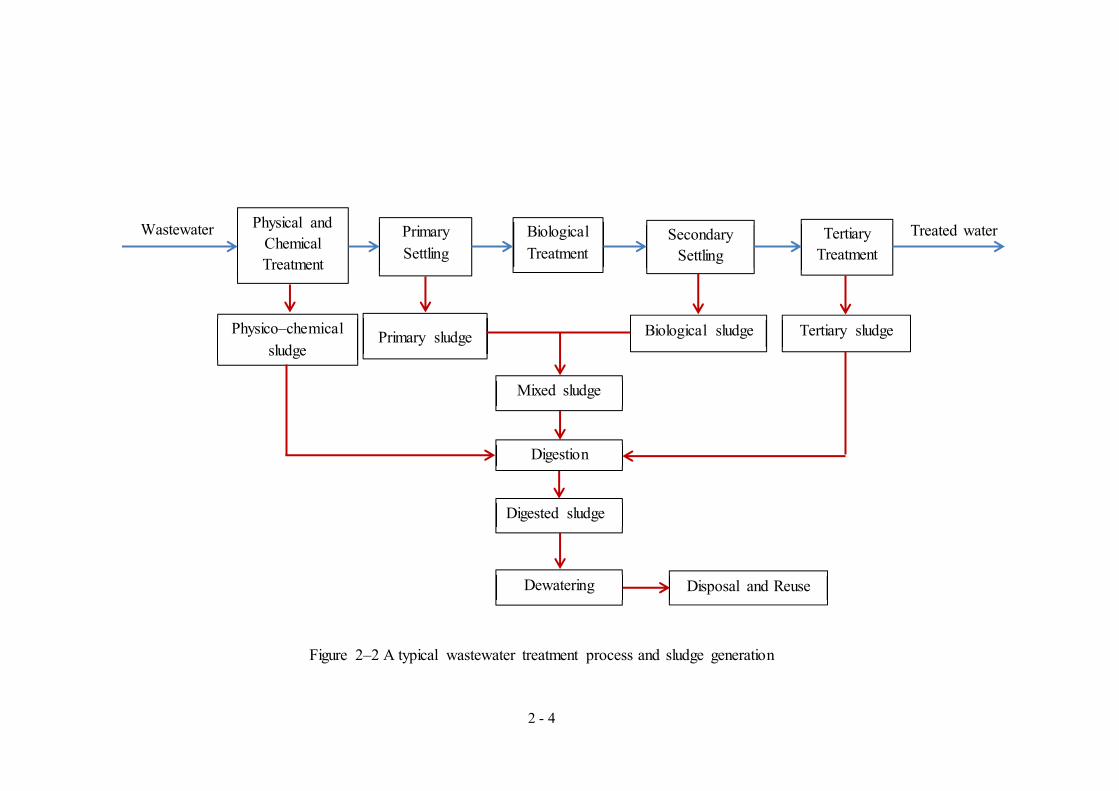
Figure 2–2 shows a typical wastewater treatment system and sludge generation from
different treatment processes. These processes can be categorized into primary
treatment, secondary treatment and tertiary treatment. Different typical types of sludge
generated from these sources are classified (Sanin et al. 2011) as:

2 - 3
Figure 2–1 Relationship of sludge solids concentration with residual phosphorus
concentration (Xie et al. 2005)
- Primary sludge: is produced from the settling process
- Biological sludge: is produced from the biological treatment of wastewater,
made of a mixture of microorganisms. Part of it is recirculated to the reactor
while the excess biological sludge is sent for dewatering
- Mixed sludge: is a blend of primary and biological sludges
- Digested sludge: is produced from a biological stabilizing stage called digestion
which is carried out on biological or mixed sludge
- Physico–chemical sludge: is produced from physico–chemical treatment
(coagulation and/or flocculation) of wastewater. Aluminum sulphate (alum), the
most widely used flocculant in water treatment, produces waste alum sludge.
- Tertiary sludge: is produced from tertiary treatment of wastewater such as
removal of phosphate and specific compounds (pesticides, metals, detergents,
etc.)
30
50
70
90
110
130
150
0 0.5 1 1.5 2 2.5 3
Slud
ge c
onc.
(mg/
L)
Phosphorus conc. (mgP/L)
2 - 4
Figure 2–2 A typical wastewater treatment process and sludge generation
Wastewater Physical and Chemical Treatment
Primary Settling
Biological Treatment
Secondary Settling
Tertiary Treatment
Treated water
Primary sludge Biological sludge Tertiary sludge
Mixed sludge
Dewatering Disposal and Reuse
Physico–chemical sludge
Digested sludge
Digestion

2 - 5
Each kind of sludge has specific properties and their treatment processes basically
depend on their characteristics. This highlights the need for characterizing these sludges
in order to better understand the factors that affect efficiency of sludge treatment.
2.1.2. Sludge characteristics
Sewage sludge generally possesses a highly complex nature with wide variations in
their physical, chemical and biological characteristics (Colin et al. 1988). This attributes
to their unpredictable behaviour which is one of the most difficult and elusive
challenges for sludge treatment systems of WWTPs. Besides, it is relatively difficult to
quantify most of characteristic parameters (Sanin et al. 2011). However, a
comprehensive understanding of these properties is essentially important to identify the
most influencing parameters and evaluate their effects on treatment processes.
Table 2–1 Sludge characteristic parameters
Physical characteristics Chemical characteristics Biological characteristics
- Color and odor
- Specific gravity
- Settleability
- Drainability
- Floc/Particle size & shape
- Water distribution
- Filterability &
Dewaterability - Rheology
- Floc structure & porosity
- Floc density
- Thermal conductivity
- Fuel value or thermal
content
- Compressibility
- Viscosity
- pH
- Alkalinity
- Solids concentration
- Surface charge &
hydrophobicity
- Nutrients & fertilizer value
- Heavy metal & toxic
organics
- Digestibility
- Fat content
- Microbial community
- Surface polymers/
Extracellular Polymeric
Substances (EPS)
- Sludge stability
Sources: Sanin et al. (2011), Gurjar (2001)

2 - 6
In sludge treatment systems, after being pre–treated by thickening, digestion and
conditioning, sludge is often dewatered before any further processing occurs such as
incineration, composting and landfill (Water Pollution Control Federation 1985). This
will result in reduced sludge volume and, consequently, the reduced cost of
transportation (Feng et al. 2009). Sludge dewatering is still a major challenge
particularly in designing sludge treatment systems due to the highly complex nature of
sewage sludge. Many factors influence dewatering characteristics of sludge (as briefly
summarized in Table 2–1); however, there seems to be still a lack of consensus on
which ones are the greatest concern for sludge dewatering. This makes it even more
complicated and difficult in assessing dewatering performance correctly. Many attempts
to identify a proper indicator to truly reflect the efficiency of dewatering process have
been carried out by establishing relationships between these influencing factors and
sludge dewatering properties (Peng et al. 2011, Jin et al. 2004).
The terms ‘filterability’ and ‘dewaterability’ have been used frequently to describe the
ability to dewater of sludge (Sanin et al. 2011) and there seem to be no clear distinction
in the use of these two parameters. Sludge filterability and dewaterability are often
mentioned together and sometimes interchangeable, which possibly results in confusion
and misunderstanding. Bürger et al. (2001) defined filtration as a mechanical method
which is commonly applied for solid–liquid separation while Mowla et al. (2013) stated
that improving sludge cake filterability is one of different ways to enhance biosludge
dewaterability. These could imply that filterability should have been used for measuring
the efficiency of filtration process only instead of the whole dewatering effectiveness.
2 - 7
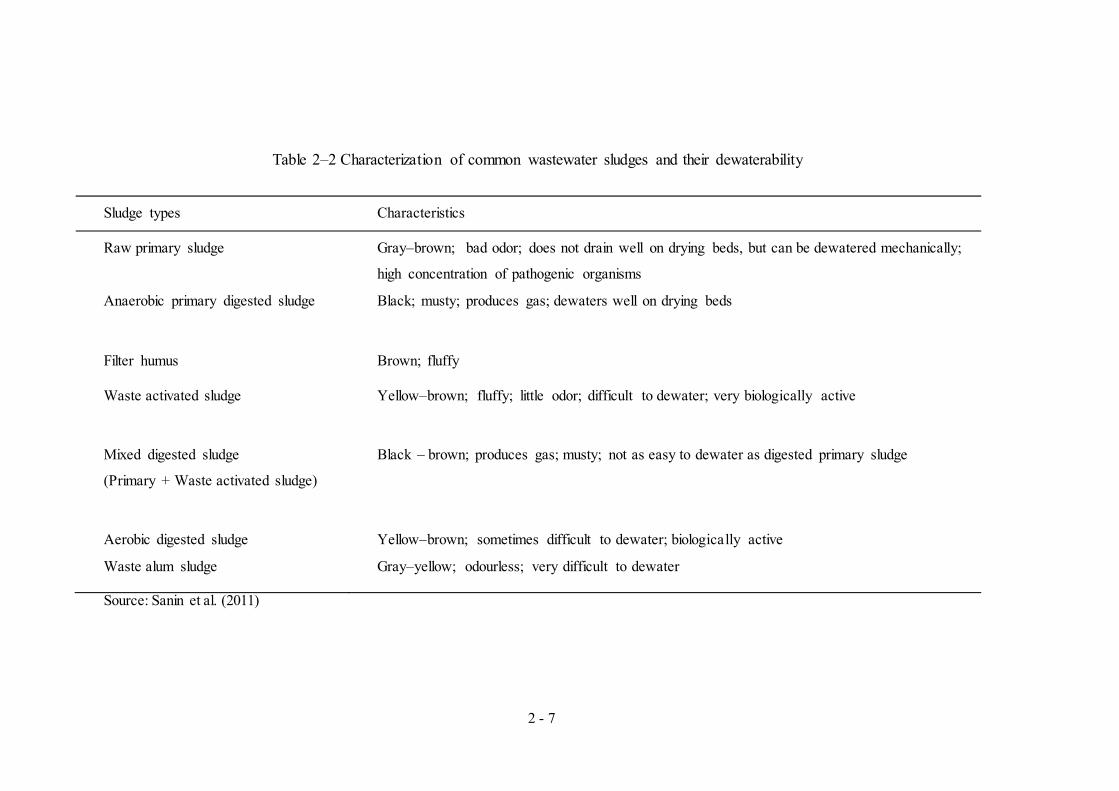
Table 2–2 Characterization of common wastewater sludges and their dewaterability
Sludge types Characteristics
Raw primary sludge Gray–brown; bad odor; does not drain well on drying beds, but can be dewatered mechanically;
high concentration of pathogenic organisms
Anaerobic primary digested sludge Black; musty; produces gas; dewaters well on drying beds
Filter humus Brown; fluffy
Waste activated sludge Yellow–brown; fluffy; little odor; difficult to dewater; very biologically active
Mixed digested sludge
(Primary + Waste activated sludge)
Black – brown; produces gas; musty; not as easy to dewater as digested primary sludge
Aerobic digested sludge Yellow–brown; sometimes difficult to dewater; biologically active
Waste alum sludge Gray–yellow; odourless; very difficult to dewater
Source: Sanin et al. (2011)
2 - 8
Dewaterability indicates for the final water content or the maximum solid content
achievable of sludge cakes since reducing sludge volume is the ultimate target of
dewatering. Nonetheless, in many previous studies, sludge filterability has been used to
primarily decide the output of dewatering process (Scholz 2005, Yukseler et al. 2007,
Sawalha & Scholz 2010). Hence, traditionally used dewatering indexes are developed
for assessing filterability of sludge mainly (Vesilind 2000). This may cause significant
errors and inaccuracies in evaluating the efficiency of dewatering.
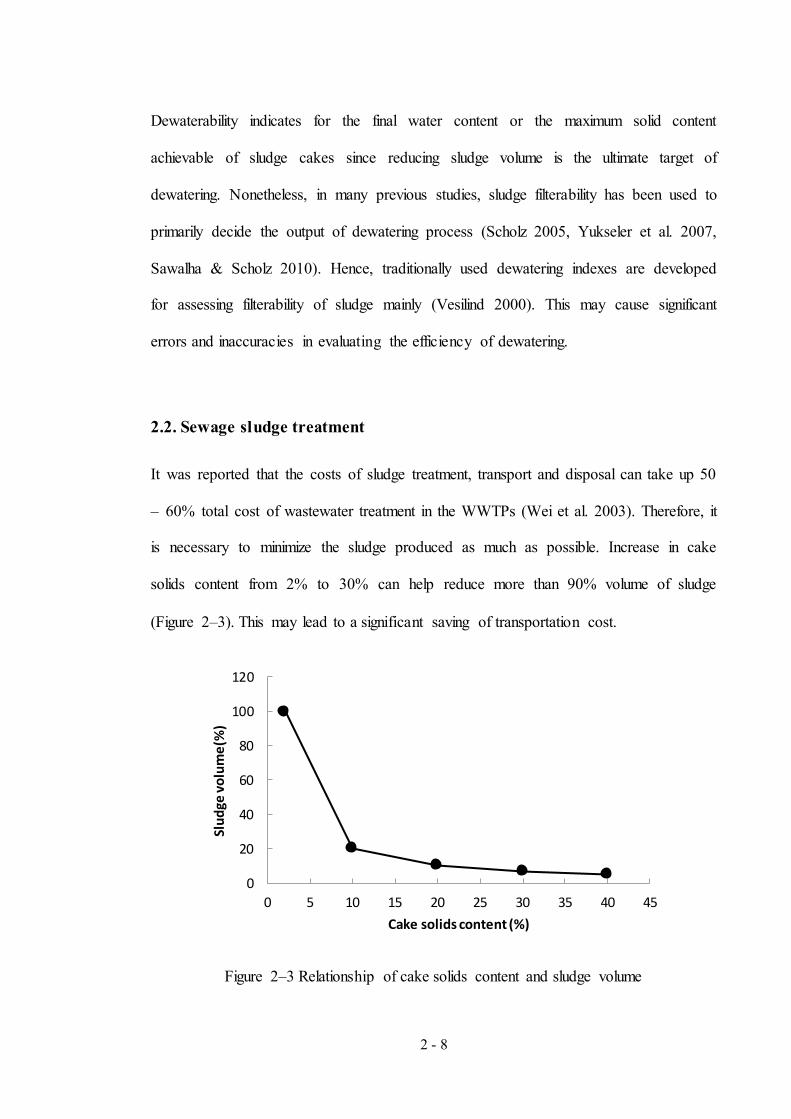
2.2. Sewage sludge treatment
It was reported that the costs of sludge treatment, transport and disposal can take up 50
– 60% total cost of wastewater treatment in the WWTPs (Wei et al. 2003). Therefore, it
is necessary to minimize the sludge produced as much as possible. Increase in cake
solids content from 2% to 30% can help reduce more than 90% volume of sludge
(Figure 2–3). This may lead to a significant saving of transportation cost.
Figure 2–3 Relationship of cake solids content and sludge volume
0
20
40
60
80
100
120
0 5 10 15 20 25 30 35 40 45
Slud
ge vo
lum
e(%
)
Cake solids content (%)

2 - 9
Figure 2–4 displays a typical sludge treatment process. It is believed that optimization
of this process, especially conditioning and dewatering, could result in minimization of
biosolids produced before being sent to further treatments for biosolids disposal and
reuse. Main stages of the processes (such as thickening, stabilization, conditioning and
dewatering) will be discussed in more detail in the following sections.
Figure 2–4 A typical sludge treatment process and dry solids content of sludge after
different treatment steps (Manzel 1989)
2.2.1. Sludge thickening
The purpose of thickening process is to reduce the biosolids volume to be stabilized,
dewatered or transport (Water Pollution Control Federation 1980). There are several
methods of sludge thickening which were described in detail by Sanin et al. (2011).
They are:
Sewage sludge
Thickening
Stabilization
Conditioning
Mechanical Dewatering
Biosolids Disposal & Reuse
Drying
Solids content: 5%Water content: 95%
Solids content: 10% Water content: 90%
Solids content: 35% Water content: 65%
Solids content: 95% Water content: 5%
2 - 10
- Gravitational Thickening: uses gravity to compact sludge solids. It is typically
carried out in a tank which resembles a settling tank, therefore, works best with
heavy sludge such as raw sludge.
- Floatation Thickening: uses tiny air bubbles created by a dissolved air
floatation system, which is often used to thicken activated sludge before
digestion.
- Gravity Belt Thickening: is a solids–liquid separation process that relies on
coagulation and flocculation of a dilute sludge and drainage of free water from
sludge through a moving fabric–mesh belt. The method works well with most
types of sludge, especially WAS.
- Centrifugal Thickening: uses the centrifugal force to separate solid and liquid,
effective for thickening WAS.
For stabilization, a thicker sludge would lead to smaller digesters, which help to save a
significant cost of expensive commodity in wastewater treatment as well as bisolids
transport. For dewatering, thickening substantially removes the soluble biopolymers
attached to the liquid phase which are considered as the major reason for a poor
dewaterability of sludge (Shammas & Wang 2007). Besides, it has been proved that the
moisture of dewatered cake decreased with the increase in feed solids content of sludge
(Figure 2–5), showing the importance of thickening before mechanical conditioning.

2 - 11
Figure 2–5 Effects of feeding solids on performance of a rotary vacuum filter
(EPA 1984)
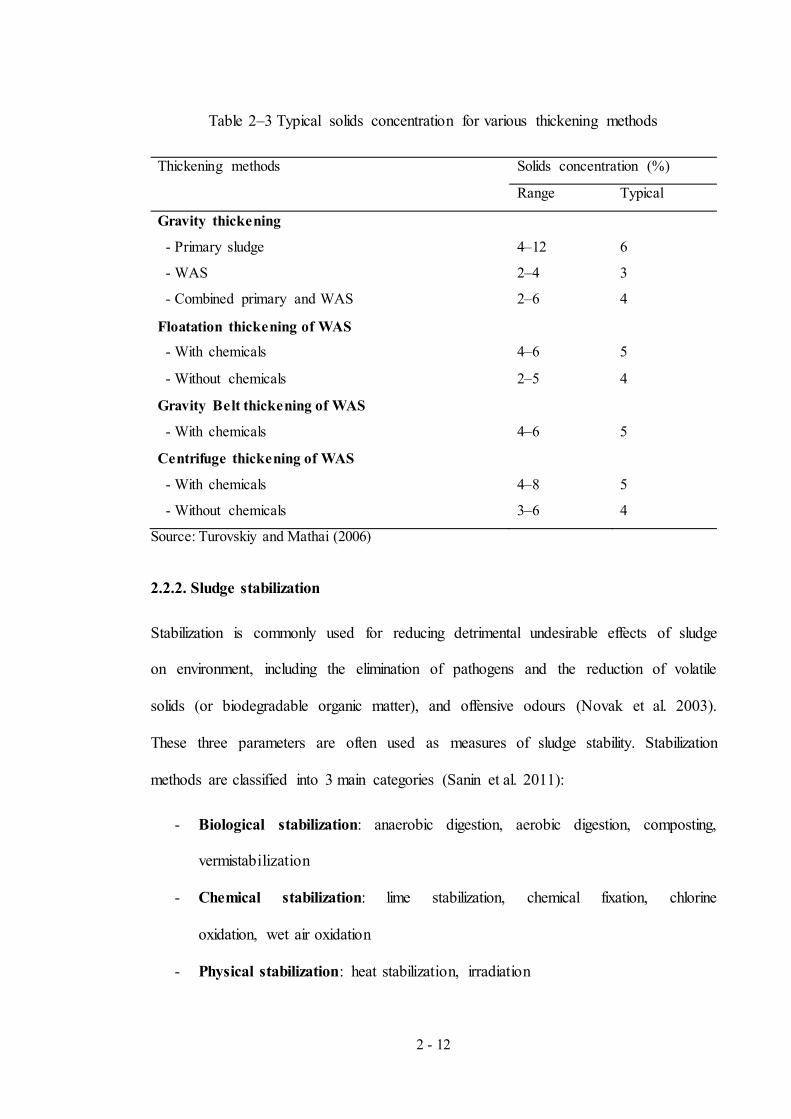
Although both thickening and sludge dewatering result in sludge volume reduction, the
difference is the degree of reduction. Thickening can be defined as the concentration of
solids to less than 15% while dewatering to greater than 15% (Sanin et al. 2011). Table
2–3 summarizes typical solids concentration achieved by various thickening methods.
2 - 12
Table 2–3 Typical solids concentration for various thickening methods
Thickening methods Solids concentration (%)
Range Typical
Gravity thickening
- Primary sludge
- WAS
- Combined primary and WAS
4–12
2–4
2–6
6
3
4
Floatation thickening of WAS
- With chemicals
- Without chemicals
4–6
2–5
5
4
Gravity Belt thickening of WAS
- With chemicals
4–6
5
Centrifuge thickening of WAS
- With chemicals
- Without chemicals
4–8
3–6
5
4
Source: Turovskiy and Mathai (2006)
2.2.2. Sludge stabilization
Stabilization is commonly used for reducing detrimental undesirable effects of sludge
on environment, including the elimination of pathogens and the reduction of volatile
solids (or biodegradable organic matter), and offensive odours (Novak et al. 2003).
These three parameters are often used as measures of sludge stability. Stabilization
methods are classified into 3 main categories (Sanin et al. 2011):
- Biological stabilization: anaerobic digestion, aerobic digestion, composting,
vermistabilization
- Chemical stabilization: lime stabilization, chemical fixation, chlorine
oxidation, wet air oxidation
- Physical stabilization: heat stabilization, irradiation
2 - 13
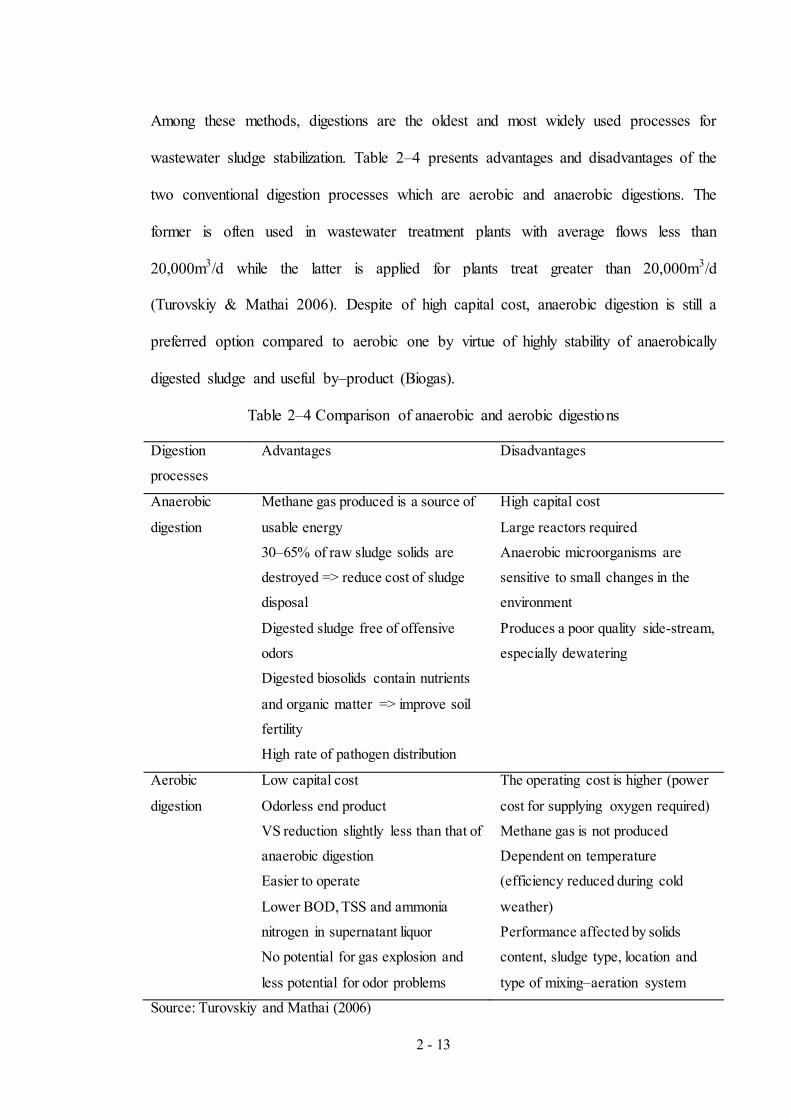
Among these methods, digestions are the oldest and most widely used processes for
wastewater sludge stabilization. Table 2–4 presents advantages and disadvantages of the
two conventional digestion processes which are aerobic and anaerobic digestions. The
former is often used in wastewater treatment plants with average flows less than
20,000m3/d while the latter is applied for plants treat greater than 20,000m3/d
(Turovskiy & Mathai 2006). Despite of high capital cost, anaerobic digestion is still a
preferred option compared to aerobic one by virtue of highly stability of anaerobically
digested sludge and useful by–product (Biogas).
Table 2–4 Comparison of anaerobic and aerobic digestions
Digestion
processes
Advantages Disadvantages
Anaerobic
digestion
Methane gas produced is a source of
usable energy
30–65% of raw sludge solids are
destroyed => reduce cost of sludge
disposal
Digested sludge free of offensive
odors
Digested biosolids contain nutrients
and organic matter => improve soil
fertility
High rate of pathogen distribution
High capital cost
Large reactors required
Anaerobic microorganisms are
sensitive to small changes in the
environment
Produces a poor quality side-stream,
especially dewatering
Aerobic
digestion
Low capital cost
Odorless end product
VS reduction slightly less than that of
anaerobic digestion
Easier to operate
Lower BOD, TSS and ammonia
nitrogen in supernatant liquor
No potential for gas explosion and
less potential for odor problems
The operating cost is higher (power
cost for supplying oxygen required)
Methane gas is not produced
Dependent on temperature
(efficiency reduced during cold
weather)
Performance affected by solids
content, sludge type, location and
type of mixing–aeration system
Source: Turovskiy and Mathai (2006)
2 - 14
In the past, most of researches mainly focused on the efficiency of digestions processes
themselves rather than on their effects on downstream processes such as conditioning
and dewatering. Some studies indicated that digestion generally improves sludge
dewaterability (Rudolfs & Heukelekian 1934, Brooks 1970, Lawler et al. 1986), while
other studies have reported both aerobic and anaerobic digestions lead to poor
dewaterability of sludge as well as high polymer demand for sludge conditioning
(Novak et al. 1977, Katsiris & Kouzeli-Katsiri 1987, Bruss et al. 1993). Several
investigators proposed the reason for these negative effects that anaerobic digestion
results in the change of particle size distribution which is one of the key factors in
controlling sludge dewaterability (Karr and Keinath 1978, Nellenschulte & Kayser
1997). The high polymer demand for conditioning of digested sludge is attributed to the
increase in soluble biopolymers, mainly protein and polysaccharides, which are released
into supernatant solution during digestion (Novak et al. 2003). These protein and
polysaccharides take up a major portion of polymers used for conditioning and make
them unavailable for flocculation of the sludge particles.
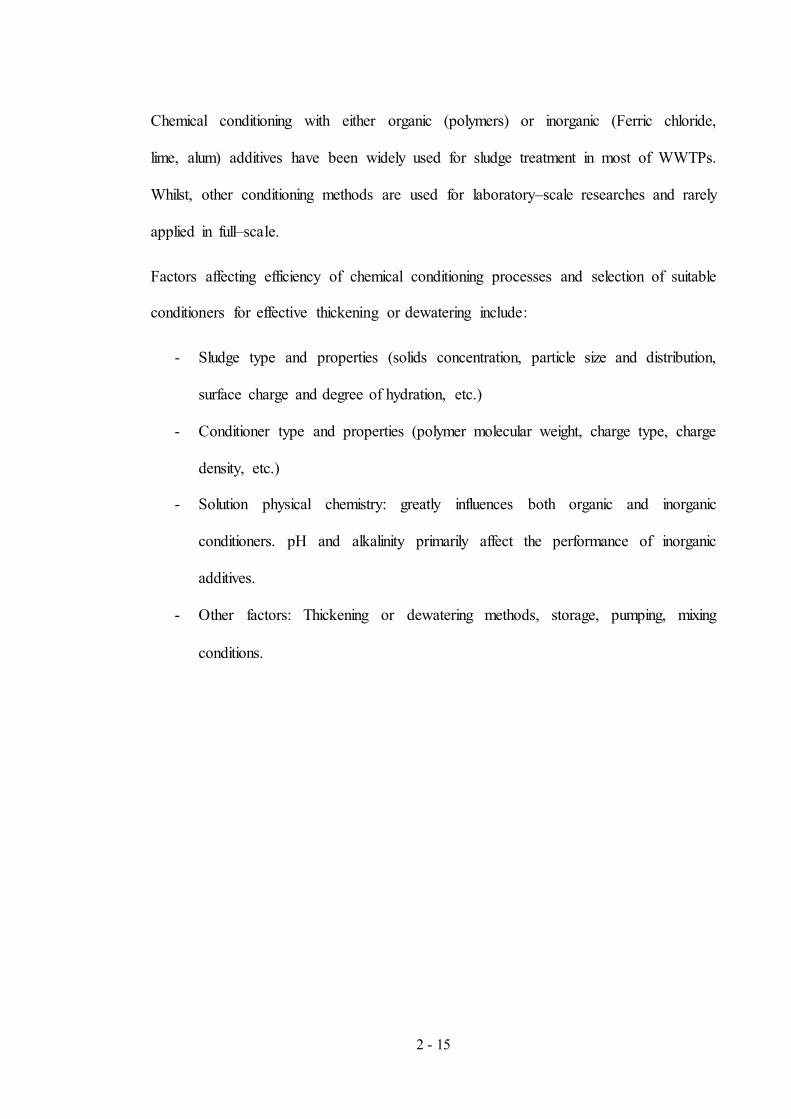
2.2.3. Sludge conditioning
Conditioning is necessary for improving solid–liquid separation of mechanical
thickening and dewatering of sludge. Conditioning of sludge can be performed by
physical or chemical processes, as listed in Table 2–5. These methods are used to
change the sludge characteristics to achieve high dewatering performance in 3 different
ways (Mowla et al. 2013):
- Coagulation/flocculation of sludge particles => improve settleability
- Reducing sludge compressibility => improve cake filterability
- Disintegration of sludge flocs or cells => release trapped water
2 - 15
Chemical conditioning with either organic (polymers) or inorganic (Ferric chloride,
lime, alum) additives have been widely used for sludge treatment in most of WWTPs.
Whilst, other conditioning methods are used for laboratory–scale researches and rarely
applied in full–scale.
Factors affecting efficiency of chemical conditioning processes and selection of suitable
conditioners for effective thickening or dewatering include:
- Sludge type and properties (solids concentration, particle size and distribution,
surface charge and degree of hydration, etc.)
- Conditioner type and properties (polymer molecular weight, charge type, charge
density, etc.)
- Solution physical chemistry: greatly influences both organic and inorganic
conditioners. pH and alkalinity primarily affect the performance of inorganic
additives.
- Other factors: Thickening or dewatering methods, storage, pumping, mixing
conditions.
2 - 16
Table 2–5 Summary of sludge conditioning methods
Conditioning methods Descriptions
Physical conditioning Non–chemical additives Addition of some high porous inert minerals (fly ash, lime, gypsum) or carbonaceous materials (coal, wood chips, wheat
dregs, lignite, etc.) which act as skeleton builders or filter aids => improve mechanical strength and permeability of solids during compression
Cavitation pre–treatment Producing a shock wave causing high temperature (500–15,000K) and high pressure (10–500MPa) locally in the media at a lifetime of a few microseconds => desired changes in biological processes. Effective methods of cavitation generation are acoustic and hydrodynamic cavitation
Thermal pre–treatment Liquid sludge is heated up in the temperature range 60–180oC => sludge gel network is broken and water affinity of the sludge solid is decreased
Freeze/Thaw pre–treatment Sludge is first frozen around -15oC and kept at this state for some time, then it is thawed at room temperature => change floc structure and reduce bound water content in sludge
Elutriation Sludge is washed either by fresh water or plant effluent to reduce sludge alkalinity and fine particles => decrease coagulant amount required
Chemical conditioning Polymer conditioning Addition of polyelectrolytes (polymers) => improve mechanical dewaterability of sludge. Conditioning process could be
explained by 2 mechanisms: charge neutralization and inter-particle bridging. There are 3 types of polymer: cationic, anionic and non–ionic
Other chemical conditioning - Inorganic additives - Dual conditioning
Addition of inorganic chemicals (ferric chloride, lime, alum) or oxidizing agents (ozone (sludge ozonation) or Fenton and Fenton–like reagents (advanced oxidation process)) Addition of different polymer types (Cationic/Anionic, Cationic/Non–ionic) or both organic and inorganic agents (Cationic/Ferric Chloride) => exploit advantages of each conditioner
Sources: Mowla et al. (2013), Wang et al. (2007), Metcalf et al. (1991)

2 - 17
2.2.4. Sludge dewatering
The objective of sludge dewatering is to remove as much water as possible from the
sludge, leading to the reduction of biosolids volume and, as a result, the cost of
transport. Dewatering of sludge is often required prior to thermal drying or incineration
to reduce fuel demand as well as landfill disposal to minimize leachate production
(Turovskiy & Mathai 2006).
Figure 2–6 Summary of dewatering methods (Sanin et al. 2011, Turovskiy & Mathai
2006, Vigneswaran & Ben Aim 1989)
Dewatering methods
Mechanical dewatering
Thermal dewatering
Combined processes
Centrifuges Solid bowl centrifuge
Imperforate basket centrifuge
Filtration devices
Vacuum filter
Belt filter press
Recessed plate filter press
Chamber filter press
Lagoons
Drying beds
Freezing beds
Centripress
Centridry
2 - 18
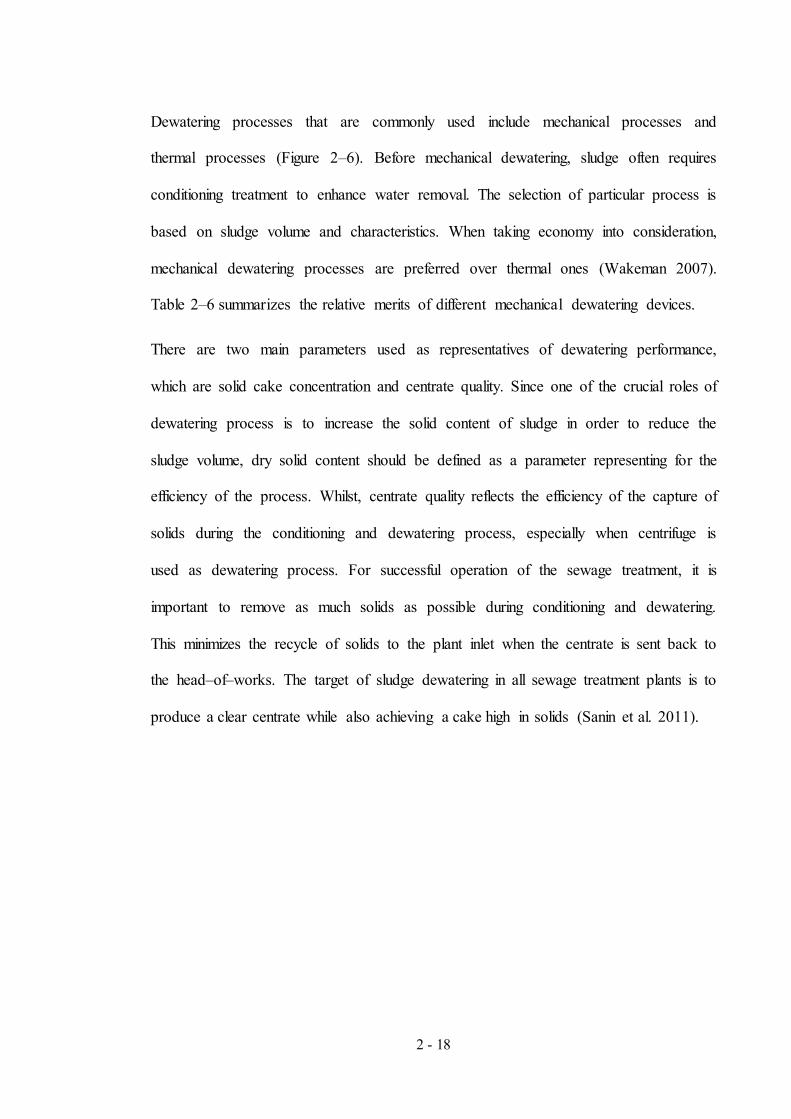
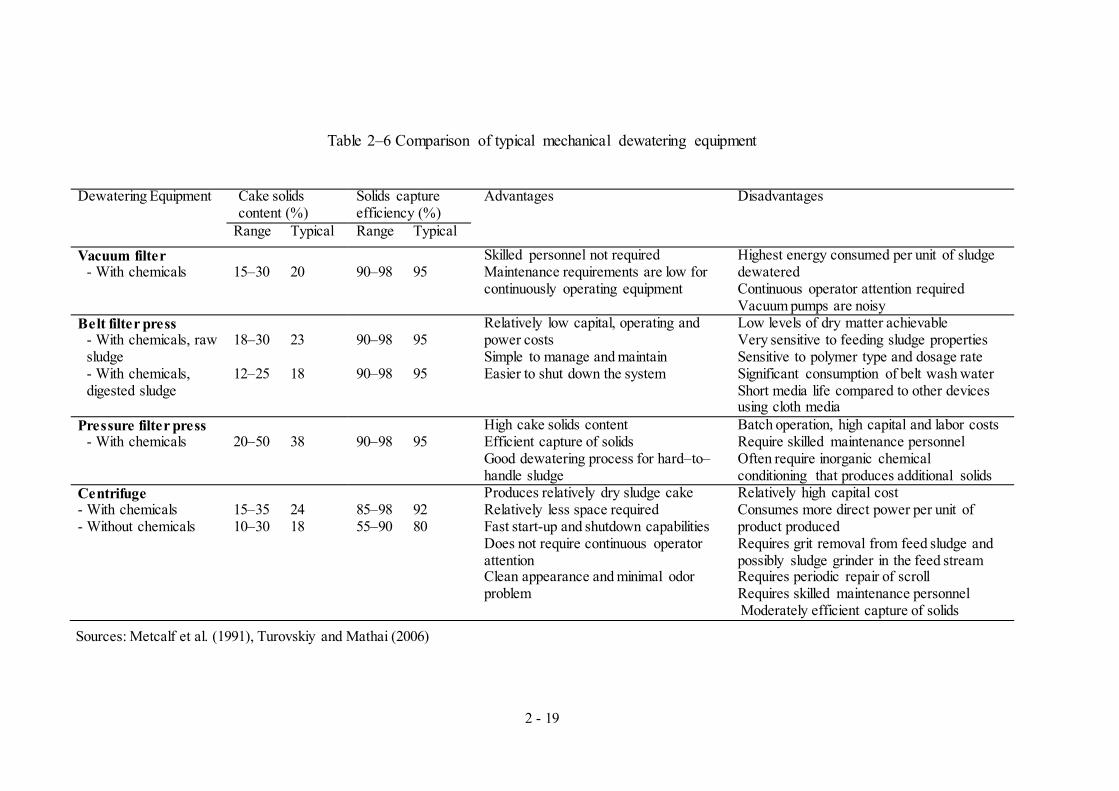
Dewatering processes that are commonly used include mechanical processes and
thermal processes (Figure 2–6). Before mechanical dewatering, sludge often requires
conditioning treatment to enhance water removal. The selection of particular process is
based on sludge volume and characteristics. When taking economy into consideration,
mechanical dewatering processes are preferred over thermal ones (Wakeman 2007).
Table 2–6 summarizes the relative merits of different mechanical dewatering devices.
There are two main parameters used as representatives of dewatering performance,
which are solid cake concentration and centrate quality. Since one of the crucial roles of
dewatering process is to increase the solid content of sludge in order to reduce the
sludge volume, dry solid content should be defined as a parameter representing for the
efficiency of the process. Whilst, centrate quality reflects the efficiency of the capture of
solids during the conditioning and dewatering process, especially when centrifuge is
used as dewatering process. For successful operation of the sewage treatment, it is
important to remove as much solids as possible during conditioning and dewatering.
This minimizes the recycle of solids to the plant inlet when the centrate is sent back to
the head–of–works. The target of sludge dewatering in all sewage treatment plants is to
produce a clear centrate while also achieving a cake high in solids (Sanin et al. 2011).
2 - 19
Table 2–6 Comparison of typical mechanical dewatering equipment
Sources: Metcalf et al. (1991), Turovskiy and Mathai (2006)
Dewatering Equipment Cake solids content (%)
Solids capture efficiency (%)
Advantages Disadvantages
Range Typical Range Typical
Vacuum filter - With chemicals
15–30
20
90–98
95
Skilled personnel not required Maintenance requirements are low for continuously operating equipment
Highest energy consumed per unit of sludge dewatered Continuous operator attention required Vacuum pumps are noisy
Belt filter press - With chemicals, raw sludge - With chemicals, digested sludge
18–30 12–25
23 18
90–98 90–98
95 95
Relatively low capital, operating and power costs Simple to manage and maintain Easier to shut down the system
Low levels of dry matter achievable Very sensitive to feeding sludge properties Sensitive to polymer type and dosage rate Significant consumption of belt wash water Short media life compared to other devices using cloth media
Pressure filter press - With chemicals
20–50
38
90–98
95
High cake solids content Efficient capture of solids Good dewatering process for hard–to–handle sludge
Batch operation, high capital and labor costs Require skilled maintenance personnel Often require inorganic chemical conditioning that produces additional solids
Centrifuge - With chemicals - Without chemicals
15–35 10–30
24 18
85–98 55–90
92 80
Produces relatively dry sludge cake Relatively less space required Fast start-up and shutdown capabilities Does not require continuous operator attention Clean appearance and minimal odor problem
Relatively high capital cost Consumes more direct power per unit of product produced Requires grit removal from feed sludge and possibly sludge grinder in the feed stream Requires periodic repair of scroll Requires skilled maintenance personnel Moderately efficient capture of solids

2 - 20
2.3. Chemical conditioning of sludge
2.3.1. Polymer conditioning
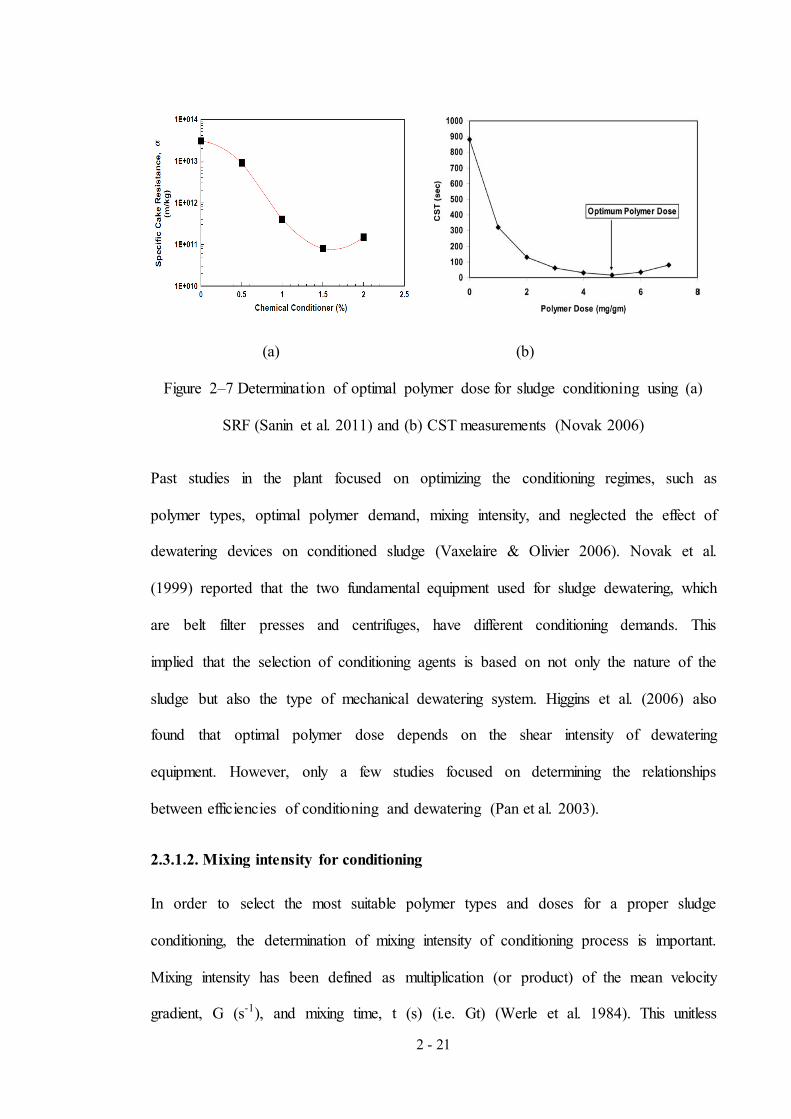
2.3.1.1. Polymer demand for conditioning
It has been known that conditioning treatment is necessary for most of sludge types to
enhance their dewaterability. The biosludges, in particular, are proved to be naturally
difficult to dewater. Among various conditioning methods, polymer conditioning has
been the most frequently used for mechanical dewatering.
The polymers used in water treatment systems are classified as anionic, cationic or non-
ionic (Mowla et al. 2013). Charge neutralization and bridging formation are 2 key
mechanisms for conditioning, and the optimal polymer demand (OPD) theoretically
occurs when particle charge is neutralized. The OPD for a given sludge in one treatment
plant may be different from that of the same sludge in another plant due to the
difference in operation of dewatering devices. The required polymer demand for
conditioning of a particular sludge is typically determined by using bench–scale tests
(such as Capillary Suction Time (CST) or Specific Resistance to Filtration (SRF)). The
minimum cake resistance or CST corresponds to the OPD (Figure 2–7). These
indicators are discussed more detail in section 2.4.2.
2 - 21
(a) (b)
Figure 2–7 Determination of optimal polymer dose for sludge conditioning using (a)
SRF (Sanin et al. 2011) and (b) CST measurements (Novak 2006)
Past studies in the plant focused on optimizing the conditioning regimes, such as
polymer types, optimal polymer demand, mixing intensity, and neglected the effect of
dewatering devices on conditioned sludge (Vaxelaire & Olivier 2006). Novak et al.
(1999) reported that the two fundamental equipment used for sludge dewatering, which
are belt filter presses and centrifuges, have different conditioning demands. This
implied that the selection of conditioning agents is based on not only the nature of the
sludge but also the type of mechanical dewatering system. Higgins et al. (2006) also
found that optimal polymer dose depends on the shear intensity of dewatering
equipment. However, only a few studies focused on determining the relationships
between efficiencies of conditioning and dewatering (Pan et al. 2003).
2.3.1.2. Mixing intensity for conditioning
In order to select the most suitable polymer types and doses for a proper sludge
conditioning, the determination of mixing intensity of conditioning process is important.
Mixing intensity has been defined as multiplication (or product) of the mean velocity
gradient, G (s-1), and mixing time, t (s) (i.e. Gt) (Werle et al. 1984). This unitless
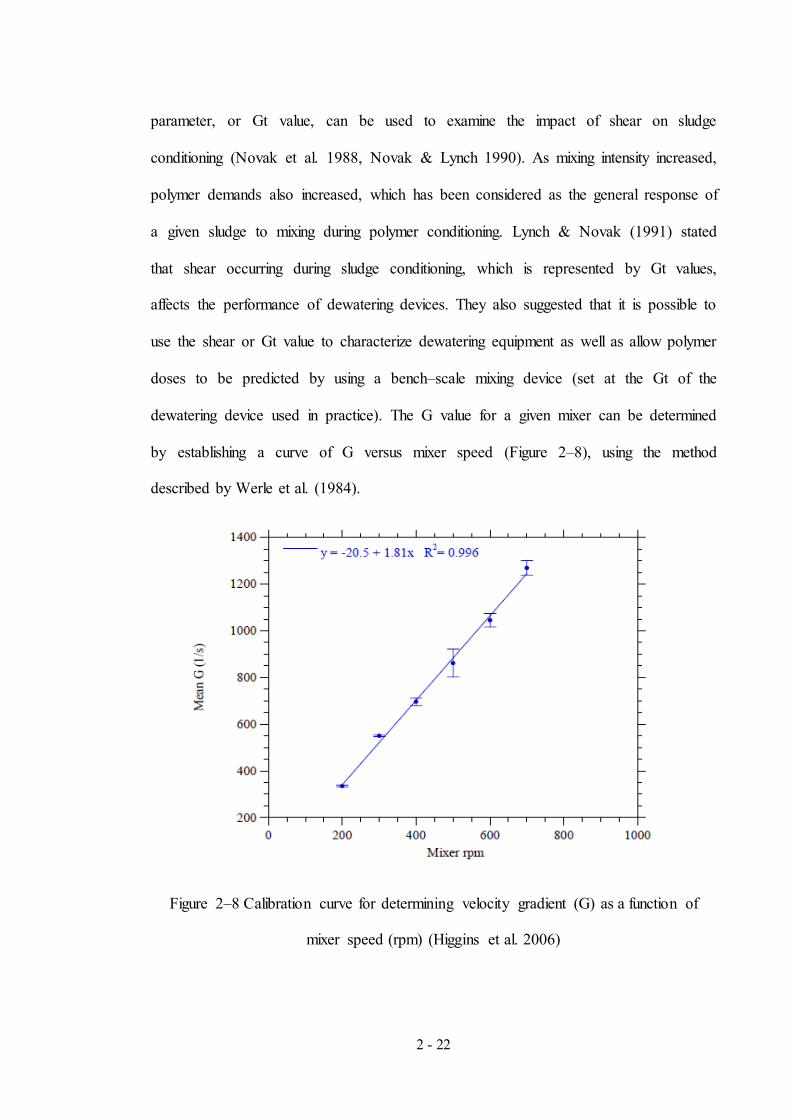
2 - 22
parameter, or Gt value, can be used to examine the impact of shear on sludge
conditioning (Novak et al. 1988, Novak & Lynch 1990). As mixing intensity increased,
polymer demands also increased, which has been considered as the general response of
a given sludge to mixing during polymer conditioning. Lynch & Novak (1991) stated
that shear occurring during sludge conditioning, which is represented by Gt values,
affects the performance of dewatering devices. They also suggested that it is possible to
use the shear or Gt value to characterize dewatering equipment as well as allow polymer
doses to be predicted by using a bench–scale mixing device (set at the Gt of the
dewatering device used in practice). The G value for a given mixer can be determined
by establishing a curve of G versus mixer speed (Figure 2–8), using the method
described by Werle et al. (1984).
Figure 2–8 Calibration curve for determining velocity gradient (G) as a function of
mixer speed (rpm) (Higgins et al. 2006)
2 - 23
2.3.2. Other chemical conditioning methods
2.3.2.1. Dual conditioning
Besides the transportation cost of biosolids, the cost of polymer used for conditioning
has been also considered as one of bothersome issues in sludge treatment. Cationic
polymers are traditionally used as conditioning agents in the wastewater industry and in
sludge conditioning in particular; however, they are still considered as expensive
chemicals. For this reason, concurrent with developments of various types of polymers
in terms of their functions and costs, one should look for ways to reduce polymer
requirement. There are a number of methods to reduce cationic polymer dose in sludge
conditioning. Some of the measures are to use combinations of different conditioners or
adjusting dewatering operations (Higgins et al. 2006). The use of multiple chemical
additives for sludge conditioning may have difficulties in determining proper dose
combinations; however, this might help to improve the efficiency of water removal and
solids capture of dewatering process compared to the single use of polymers (Chitikela
& Dentel 1998, Glover et al. 2004). Dual conditioning where the sludge is treated by
using a combination of a cationic polymer and another organic or inorganic conditioner
has caught attention of numerous investigators working on this field (Agarwal et al.
2005, Ayol et al. 2005, Fan et al. 2000, Chitikela & Dentel 1998, Senthilnathan & Sigler
1993). This study focused mainly on two dual conditioning methods, namely
cationic/anionic polymer conditioning and iron/cationic conditioning.
2.3.2.1.1. Cationic/Anionic polymer conditioning
Among various dual polymer conditioning methods, the combinations of cationic and
anionic polymer seems to be the most popular, both from technical and economic points
of view. Although the consumption of dual polymers is less in comparison with their

2 - 24
single use, however, the total cost of conditioning is not reduced (Sanin et al. 2011).
Thus, the major benefit of these dual–polymer systems is to create stronger flocs to
better withstand the high shear during dewatering process (Chitikela & Dentel 1998,
Lee & Liu 2001). The study of Glover et al. (2004) examining the effect of dual–
polymer flocculation by measuring the compressive yield stress of conditioned
suspensions showed that dual–polymer flocculants of opposite charge give a higher
solids cake than dual flocculants of like charge. Also, Agarwal et al. (2005), utilizing
CST as dewaterability indicator, highlighted the positive effect of cationic/anionic
polymer conditioning on sludge dewatering. Nonetheless, they suggested that full–scale
tests are needed to determine whether this conditioning regime leads to a desirable
dewatering performance.
Besides identifying proper doses of dual–polymers, the dosing sequence is also
important in determining the mechanisms of conditioning. It has been demonstrated that
sequential addition is better than co–addition. The mechanism is shown in Figure 2–9.
For bio–sludge of which negatively charged fraction is more dominant, the addition of
cationic polymer followed by anionic polymer is preferable. On the other hand, alum
sludge is often preconditioned with anionic polymers (Fan et al. 2000).

2 - 25
Figure 2–9 Mechanism of alum sludge conditioned with combination of anionic
polymer (PAA) and cationic polymer (Percol) (Fan et al. 2000)
2.3.2.1.2. Iron/Cationic conditioning
Ferric chloride is also a popular flocculant in wastewater treatment. In the past, ferric
chloride is commonly used with lime for solids conditioning. Like many other inorganic
conditioners, ferric chloride conditioning alone typically cannot produce a solids cake
concentration that can be achieved with much lower dose of polymer (Chitikela &
Dentel 1998). That is the reason why organic polymers have been widely used in
conditioning and dewatering processes despite of their high cost. However, Christensen
& Wavro (1981) indicated that inorganic conditioners are less sensitive to changes in
doses than polymer, leading to a more stable dewatering process. The conjunction of
cationic polymers and ferric chloride may exploit the advantages of both conditioners.
2 - 26
The main mechanism of ferric chloride conditioning is charge neutralization due to the
formation of positively charged iron–hydroxide precipitate. As a result, it could be
substituted for expensive polymers to neutralize the “charge” of the suspending
medium. Once the “charge” has been neutralized or increased to nearly zero level, the
expensive high molecular flocculating polymers can be added at a much lower
concentration (dose) to actually flocculate the particles making them amenable to
dewatering. Besides charge neutralization, bridge formation among particles also
contributes to sufficient sludge dewatering.
From the economic point of view, the use of ferric chloride as a pre–conditioner can
reduce the polymer demand for conditioning; however, whether this is a cost effective
method depending on the specific polymers used and chemical prices relevant to the site
(Chitikela & Dentel 1998).
2.3.2.2. Advanced oxidation (Fenton) conditioning
Although the polymers used in water treatment systems are sometimes biodegradable,
they are generally toxic to human and the aquatic environment at high concentration
(Bolto & Gregory 2007). Therefore, a non–organic polymer approach for sludge
conditioning has been proposed as a response to problems related to potential risks of
using polymers. Fenton’s reagent is one of potential alternative conditioners for bio–
sludge conditioning (Dewil et al. 2005, Mowla et al. 2013). Fenton’s reagent is a
solution of hydrogen peroxide (H2O2) and an iron catalyst (Fe2+) that is used to oxidize
contaminants, especially toxic organic compounds in wastewater (Buyukkamaci 2004).
Fenton peroxidation has been demonstrated to be a promising advanced sludge
treatment method where it is used to rupture flocs or cells to release the trapped water
molecules from extracellular polymeric substances (EPS) (Liu et al. 2013). Lu et al.

2 - 27
(2003) reported that the moisture of solid cake treated with Fenton’s reagent was 75.2%
while those of sludge treated by other processes were about 85%. In terms of sludge
CST and SRF, these values decreased with increasing H2O2 and Fe2+ concentrations in
almost all cases (Buyukkamaci 2004).
Major problem of Fenton oxidation conditioning is to identify the optimal dosages of
Fe2+ and H2O2. Besides, the organic content of the supernatant and the cost of Fenton’s
reagent should also be taken into consideration. Latter studies have developed the use of
Fenton’s reagent as alternative conditioner of polymers but in combinations with
physical conditioners, also known as skeleton builders, to form porous structure in
sludge cakes, which have the ability to withstand high pressure in some dewatering
devices (Qi et al. 2011).
2.4. Indicators for sludge dewaterability
2.4.1. Challenges in measuring sludge dewatering performance
Together with improvements in sludge dewatering to achieve the highest solid content
sludge cake, it is necessary to establish a reliable dewatering index that can fully
express how easily sludge releases its water (Pan et al. 2003). To date, however, there is
no universal indicator yet to properly represent the solid–liquid separation ability of
sludge. The main reasons for this problem are linked to different aspects of sludge
properties, conditioning and dewatering methods.
As mentioned earlier, sewage sludge can vary enormously in terms of physical,
chemical and biological characteristics, leading to its relatively unpredictable behaviour,
especially dewatering behaviour (Colin et al. 1988). This makes it difficult to quantify
most of the parameters (Sanin et al. 2011). Although some parameters can be

2 - 28
quantified, it has never been easy to correlate these properties with sludge dewatering.
Despite this impediment, various typical sludge properties such as pH, particle surface
charge, organic content, porosity, compressibility, particle size, rheological
characteristics, bound water content and solid concentration – variables that can
influence dewaterability of sludge – have been investigated in some studies. These are
summarized in more detail by Karr & Keinath (1978). However, a consensus is still
lacking on which ones have the greatest impact on sludge dewatering.
Figure 2–10 Two phases of sludge dewatering (Novak et al. 1999)
Many studies have suggested that dewatering by filtration equipment consists of two
main phases (Figure 2–10), these being filtration and consolidation or expression (Lee
& Wang 2000). Sørensen et al. (1996) described sludge as a solid–liquid mixture where
solids are either in free suspension or packed closely together to form a cake. The
former is called filtration phase while the latter is known as expression phase. Novak et
al. (1999) stated that the amount of water extracted by filtration alone is not enough to
achieve a desired cake solid; and expression phase accounts for most water removal.
2 - 29
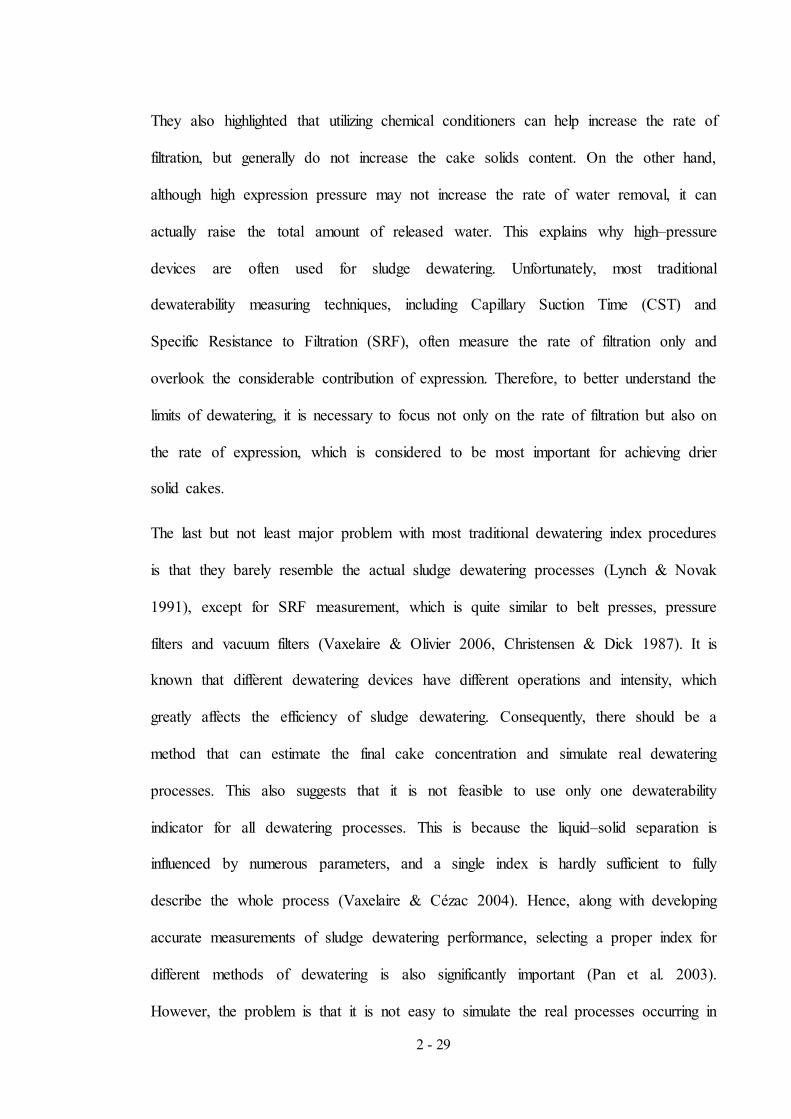
They also highlighted that utilizing chemical conditioners can help increase the rate of
filtration, but generally do not increase the cake solids content. On the other hand,
although high expression pressure may not increase the rate of water removal, it can
actually raise the total amount of released water. This explains why high–pressure
devices are often used for sludge dewatering. Unfortunately, most traditional
dewaterability measuring techniques, including Capillary Suction Time (CST) and
Specific Resistance to Filtration (SRF), often measure the rate of filtration only and
overlook the considerable contribution of expression. Therefore, to better understand the
limits of dewatering, it is necessary to focus not only on the rate of filtration but also on
the rate of expression, which is considered to be most important for achieving drier
solid cakes.
The last but not least major problem with most traditional dewatering index procedures
is that they barely resemble the actual sludge dewatering processes (Lynch & Novak
1991), except for SRF measurement, which is quite similar to belt presses, pressure
filters and vacuum filters (Vaxelaire & Olivier 2006, Christensen & Dick 1987). It is
known that different dewatering devices have different operations and intensity, which
greatly affects the efficiency of sludge dewatering. Consequently, there should be a
method that can estimate the final cake concentration and simulate real dewatering
processes. This also suggests that it is not feasible to use only one dewaterability
indicator for all dewatering processes. This is because the liquid–solid separation is
influenced by numerous parameters, and a single index is hardly sufficient to fully
describe the whole process (Vaxelaire & Cézac 2004). Hence, along with developing
accurate measurements of sludge dewatering performance, selecting a proper index for
different methods of dewatering is also significantly important (Pan et al. 2003).
However, the problem is that it is not easy to simulate the real processes occurring in

2 - 30
dewatering equipment. In the present work, besides SRF which can mimic filtration
processes, another tool that can be applied to other popularly used dewatering
equipment, the centrifuge, is also recommended.
2.4.2. Indicators for dewatering by filtration processes
Specific Resistance to Filtration (SRF) and Capillary Suction Time (CST) are two most
popular indices which have been conventionally used for assessing sludge filterability
(Vesilind 2000) or dewatering rates (Novak 2006).
SRF test, the very first widely used technique developed by Coackley & Jones (1956)
has several important advantages such as independent of solids concentration. It can
especially be used for estimating the final cake concentration after dewatering (Mininni
et al. 1984). Most of techniques developed for measuring dewatering efficiency of
filtration devices such as vacuum filters, belt presses and filter presses were
modifications of SRF measures (Table 2–7). However, these tests were time–consuming
and procedures are quite complicated requiring high skills to perform (Vesilind 2000).
Table 2–7 Techniques for predicting dewatering performance of filtration devices
Filtration devices Techniques for dewaterability measurement
Authors
Filter press Filter pressing test Mininni et al. (1984)
Vacuum filter Filter – leaf test Vesilind (1974)
Belt filter press Drainage tests + Piston press Baskerville et al. (1978)
Modified Filtration Test Heide et al. (1982)
CST measures + Gravity drainage + Vacuum filtration
Spinosa & Mininni (1984)
Crown Press Severin & Collins (1992)
Wedge Zone Simulator Novak et al. (1993)

2 - 31
In comparison, CST measurement developed by (Baskerville & Gale 1968) is much
quicker and easier test and requires fewer skills than SRF (Sanin et al. 2011), making it
increasingly popular recently. CST was originally developed as a substitute for SRF to
measure dewatering rate. Despite of that, CST, in fact, is still not considered as a
fundamental measurement methods for sludge dewaterability. Unlike SRF, CST is
affected by the concentration of solids and cannot predict the final cake solids
achievable by dewatering devices. Besides, CST test is not effective in determining
optimum polymer dose (OPD) for well–flocculated sludge, which often occurs around
OPD point, due to the too–fast escape of water from the floc (Sanin et al. 2011).
Another reason for the unreliability of CST is that since little hydraulic pressure is
applied during CST measurement, it may not truly reflect the floc strength or resistivity
to shear during dewatering stage (Pan et al. 2003).
(a) (b)
Figure 2–11 (a) A traditional SRF measurement apparatus set–up (Sanin et al. 2011)
and (b) the schematic diagram of the CST apparatus (Vesilind 1988)
Various studies have tried to investigate and model the relationship between CST and
SRF with the purpose of obtaining the averaged specific resistance of filtration cake

2 - 32
from the data generated by CST tests. Lee & Hsu (1994) proposed a method that
allowed SRF to be calculated without the liquid invasion volume measurement using
capillary suction apparatus. A similar study by Herwijn et al. (1995) presented a newly
developed model of CST apparatus able to determine specific cake resistances of both
unflocculated and flocculated sludges. Sawalha & Scholz (2010) provided a
mathematical model which related CST, SRF to other parameters, such as temperature
and solids content. These can also predict the results of SRF tests from those of CST
tests. More recently, Peng et al. (2011) obtained a relatively good correlation between
normalized CST and SRF (R2 = 0.9450). They concluded that it is not necessary to use
both these parameters simultaneously to evaluate the dewatering rate.
2.4.3. Indicators for dewatering by centrifugation processes
Besides filtration devices, centrifuge has been also commonly used for sludge
dewatering and increasingly popular by virtue of its high performance of producing
drier cake solids which can be up to 30% from anaerobically digested biosolids
(Higgins et al. 2006). As a consequence of distinctions in operations and conditioning
requirements, filtration and centrifugation effectiveness should be evaluated differently.
If filterability has been used to assess the efficiency of filtration, centrifugability has
been defined as the ability to dewater sludge of centrifugation. Numerous factors have
been proved to affect centrifugability and various attempts have been made to determine
reliable indicators for sludge centrifugation performance. However, there seems not to
be an appropriate parameter yet due to difficulties of reproducing the processes taking
place inside the full–scale centrifuge on a laboratory–scale (Spinosa 1985). Unlike
filtration types, filter skin formation of sludge during filtration, leading to the extent
phase of dewatering, may not occur in centrifugal processes. Therefore, Novak et al.

2 - 33
(1999) suggested that a theoretical assessment of the stresses on sludge during
dewatering would be useful in the case of centrifuge.
Figure 2–12 The schematic diagram of centrifuge (Wakeman 2007)
Regarding the particular operation of centrifuges, the centrifugabilty could be defined as
the ease to be conveyed by the screw of the feeding sludge (Figure 2–12). Spinosa and
Mininni (1984), as a consequence, reported that sludge settleability, scrollability and
floc strength were major sludge characteristics influencing centrifugability.
Unfortunately, no standard methods are available in which the above properties are
considered as a whole.
Compactibility, which was defined as cake solids content of sludge after centrifugation,
has been used by a number of studies (Erdincler & Vesilind 2000, Emir 2002, Emir &
Erdincler 2006) to indicate sludge dewaterability, nevertheless, cannot quantify the
stress imparted on sludge cake during dewatering by centrifuge. Chu & Lee (2001)
introduced an arm–suspended centrifuge (Figure 2–13) to investigate the centrifugal
separation of moisture from conditioned activated sludge and determine an optimal

2 - 34
rotational speed for maximum moisture removal. However, the final cake solids
achievable cannot be predicted using this method.
Figure 2–13 Schematics of the arm–suspended centrifuge (Chu & Lee 2001)
Modified Centrifugal Index (MCI) test – A new centrifuge based laboratory scale
sludge dewatering
The crucial role of dewatering is to maximise the dry solids. For the centrifugal process,
dewatered cake with dry solids content are typically in the range of 26 – 30%, while dry
solids content of less than 22% is considered as ineffective dewaterability (Table 2–8)
(Vigneswaran & Ben Aim 1989). Conventional methods for measuring dewaterability
barely resemble the actual sludge dewatering processes (Lynch & Novak 1991). SRF
can be used to simulate the operation of a filter press (Vaxelaire & Olivier 2006,
Christensen & Dick 1987) but not a centrifuge. Thus, one should establish a method that
has the ability to not only estimate the final cake solids concentration but also simulate
the real dewatering process, especially for dewatering by centrifuge.
It was found that the stresses imparted to sludge during dewatering have a significant
impact on dewatering efficiency in terms of solids cake content. Higgins et al. (2006)

2 - 35
utilized Gt value in determining the effect of shear or mixing intensity on OPD using a
calibrated lab–scale mixer. Here, G was velocity gradient (s-1) and t is time of mixing
(s). By using this dimensionless parameter, they determined the stress of full–scale
dewatering devices using shear stress as equivalent. However, there is a major drawback
that the final cake solids achievable at full–scale cannot be predicted using this bench–
scale method (Dentel & Dursun 2009). Besides, the shear imparted on the sludge cake
during dewatering is different from that applied to the sludge liquid during conditioning.
Table 2–8 Sludge dewaterabililty classifications for centrifuge
Dewaterability Cake solids content (%)
Good 26 – 30
Sufficient to medium 22 – 26
Bad 8 – 22
Source: Vigneswaran & Ben Aim (1989)
Recently, a modified lab–scale centrifuge device, namely modified centrifugal index
(MCI) was suggested and investigated to overcome the difficulties encountered in the
traditional dewaterability indicators. The method proposed by Higgins and colleagues at
Bucknell University (Higgins et al. 2014) has been used by us to evaluate the sludge
dewaterability of centrifugation (To et al. 2014). Here the stress of centrifuge, or the
centrifugal force, is measured using a dimensionless parameter gt, which is the product
of times gravity g (which is related to centrifuge rotating speed and rotor radius) and
centrifugation time t (s).
2.4.4. Other techniques for dewaterability measurements
Using moisture content or rheology of sludge as assessing parameters of sludge
dewatering efficiency are interesting and promising approaches, which have attracted

2 - 36
attention of numerous investigators recently. Many of them have put efforts on
determining the correlation between these parameters and sludge conditioning and
dewatering.
2.4.3.1. Moisture distribution
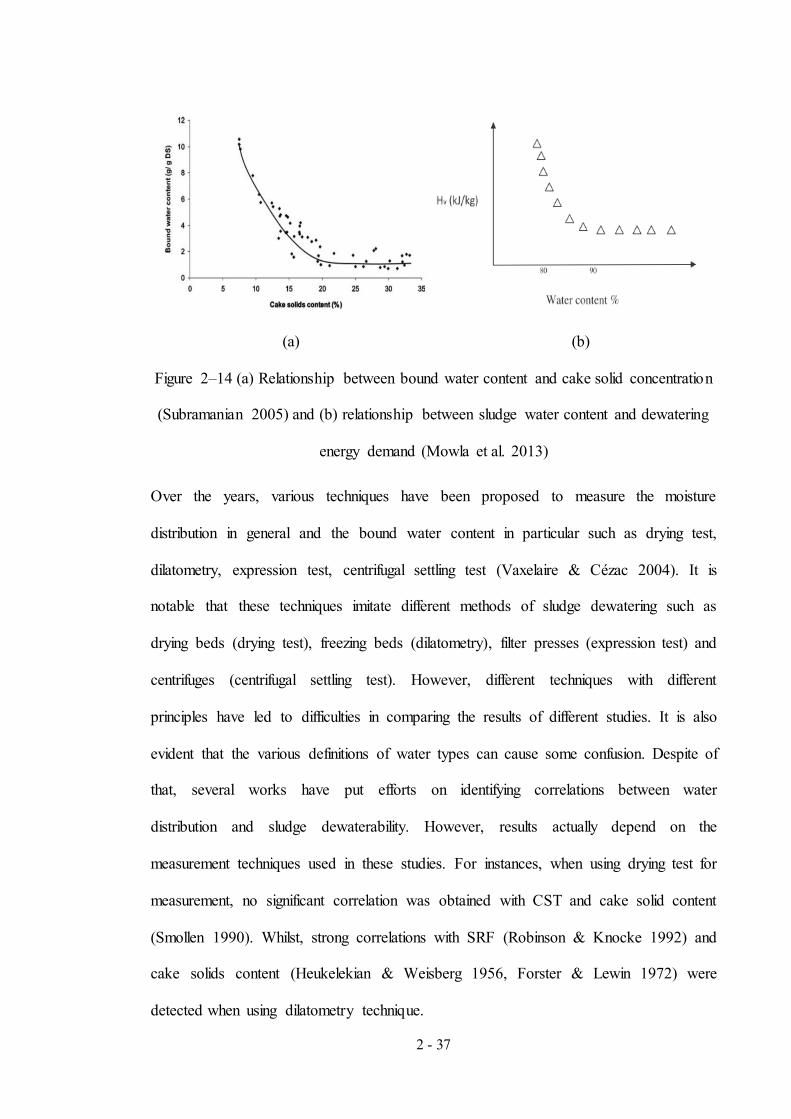
Sewage sludge is hydrophilic by nature and typically has 98 to 99.7% moisture content
which is generally difficult to remove (Smollen 1988). The reduction of sludge volume
is fundamentally achieved by maximizing the cake solid content, or in another word,
minimizing the water content (Figure 2–14a). As a result, a comprehensive
understanding of water distribution in sludge and their relation to sludge dewaterability
may be useful for improving the performance of dewatering system. A relationship
between dewatering energy requirement and sludge water content (Figure 2–14b) shows
that only about 20% of water is easily removed, even for conditioned sludge, but once
water content is reduced to below 80%, the dewatering energy demand dramatically
increases (Lee & Hsu 1994, Chu & Lee 1999, Wang et al. 2010, Mowla et al. 2013).
This implies that the sludge can no longer be mechanically dewatered to obtain a
smaller residual water content, which is also considered the limit of sludge mechanical
dewatering.
2 - 37
(a) (b)
Figure 2–14 (a) Relationship between bound water content and cake solid concentration
(Subramanian 2005) and (b) relationship between sludge water content and dewatering
energy demand (Mowla et al. 2013)
Over the years, various techniques have been proposed to measure the moisture
distribution in general and the bound water content in particular such as drying test,
dilatometry, expression test, centrifugal settling test (Vaxelaire & Cézac 2004). It is
notable that these techniques imitate different methods of sludge dewatering such as
drying beds (drying test), freezing beds (dilatometry), filter presses (expression test) and
centrifuges (centrifugal settling test). However, different techniques with different
principles have led to difficulties in comparing the results of different studies. It is also
evident that the various definitions of water types can cause some confusion. Despite of
that, several works have put efforts on identifying correlations between water
distribution and sludge dewaterability. However, results actually depend on the
measurement techniques used in these studies. For instances, when using drying test for
measurement, no significant correlation was obtained with CST and cake solid content
(Smollen 1990). Whilst, strong correlations with SRF (Robinson & Knocke 1992) and
cake solids content (Heukelekian & Weisberg 1956, Forster & Lewin 1972) were
detected when using dilatometry technique.

2 - 38
2.4.3.2. Rheology
Rheology is the science that deals with the flow and deformation of fluids and solids
under the influence of stresses, which has been becoming an important tool in
characterizing waste sludge, especially sewage sludge (Abu-Orf & Dentel 1999, Örmeci
2007). Although the early works on rheological behaviour of sewage sludge have
already been conducted since the thirties of the last century, most of them were
motivated by the need to predict pumping requirements. Until recently, more studies
have put effort into examining the rheology in relation to sludge dewaterability with the
desire of predicting, controlling and optimizing conditioning and dewatering processes
(Marinetti et al. 2010).
The rheological behaviours of a certain fluid can be schematically described by flow
curves, also known as rheograms. Various researchers have employed rheograms of
conditioned sludge with different polymer doses for determining the OPD (Örmeci
2007). Figure 2–15 displays two commonly used types of rheograms for polymer dose
assessment, shear stress–shear rate (Figure 2–15a) and torque–time curves (Figure 2–
15b). Besides, these rheograms could also allow mixing conditions to be determined but
also the best performing polymers to be selected.

2 - 39
(a) (b)
Figure 2–15 (a) Shear stress–shear rate rheogram (Abu-Orf & Dentel 1999) and (b)
torque rheogram of unconditioned and conditioned sludge with different polymer doses
(Örmeci 2007)
Rheological characteristics are indicative of floc strength. Therefore, most of the
rheology studies on the topic of dewaterability were based on determining relationships
between floc strength or network strength and sludge dewatering properties (Dentel &
Dursun 2009, Abu-Orf & Dentel 1999, Marinetti et al. 2010, Abu-Orf & Dentel 1997,
Yen et al. 2002, Hou & Li 2003). However, none provided a strong correlation between
rheological parameters and sludge dewaterability as measured by standard test methods.
2.4.5. Assessment of dewaterability indicators
Evaluation of sludge dewaterability is critically necessary for any sludge treatment
system where optimizing the dewatering process is the aim. However, this work is
relatively challenging due to the unpredictable and elusive behaviour of all sludge type,
especially bio–sludge as well as variations in solid–liquid separation methods. Since the
establishment of the very first dewatering indices, various indicators for dewatering
process have been developed and applied over the years in tandem with dewatering
technology. Despite these advances, however, there is as yet no universal dewatering
index which can fully reflect the ability to dewater sludge. It is believed that a reliable
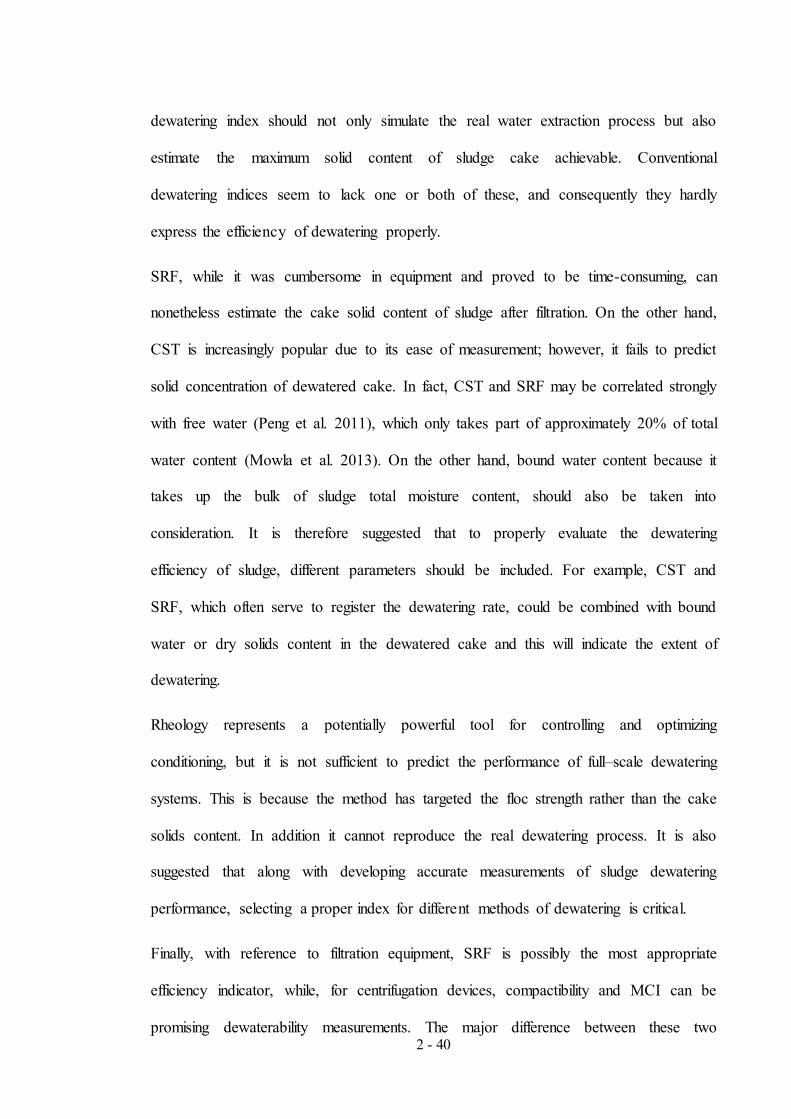
2 - 40
dewatering index should not only simulate the real water extraction process but also
estimate the maximum solid content of sludge cake achievable. Conventional
dewatering indices seem to lack one or both of these, and consequently they hardly
express the efficiency of dewatering properly.
SRF, while it was cumbersome in equipment and proved to be time-consuming, can
nonetheless estimate the cake solid content of sludge after filtration. On the other hand,
CST is increasingly popular due to its ease of measurement; however, it fails to predict
solid concentration of dewatered cake. In fact, CST and SRF may be correlated strongly
with free water (Peng et al. 2011), which only takes part of approximately 20% of total
water content (Mowla et al. 2013). On the other hand, bound water content because it
takes up the bulk of sludge total moisture content, should also be taken into
consideration. It is therefore suggested that to properly evaluate the dewatering
efficiency of sludge, different parameters should be included. For example, CST and
SRF, which often serve to register the dewatering rate, could be combined with bound
water or dry solids content in the dewatered cake and this will indicate the extent of
dewatering.
Rheology represents a potentially powerful tool for controlling and optimizing
conditioning, but it is not sufficient to predict the performance of full–scale dewatering
systems. This is because the method has targeted the floc strength rather than the cake
solids content. In addition it cannot reproduce the real dewatering process. It is also
suggested that along with developing accurate measurements of sludge dewatering
performance, selecting a proper index for different methods of dewatering is critical.
Finally, with reference to filtration equipment, SRF is possibly the most appropriate
efficiency indicator, while, for centrifugation devices, compactibility and MCI can be
promising dewaterability measurements. The major difference between these two

2 - 41
techniques is that the latter can quantify the stress imparted on sludge during dewatering
by centrifuge, which can reflect the influence of dewatering equipment on how well the
solid–liquid separation process performs.

3 - 1
UNIVERSITY OF TECHNOLOGY, SYDNEY
FACULTY OF ENGINEERING AND IT
CHAPTER 3
MATERIALS AND METHODS

3 - 2
3.1. Materials
3.1.1. Sludge
Different types of sludge were obtained from 3 WWTPs of Sydney Water, Australia.
They were anaerobically digested sludge (ADS) from Wollongong WWTP (7 sampling
times from May 1st 2013 – March 25th 2014), aerobically digested sludge (AEDS) from
St. Marys WWTP (6 sampling times from October 25th 2013 – June 24th 2014) and
waste activated sludge (WAS) from Quakers Hill WWTP (7 sampling times from
October 25th 2013 – June 24th 2014). These sludges were blends of primary and
secondary sludges. General information on sludge treatment of these WWTPs, in terms
of sludge pre–treatment processes, conditioning and dewatering, is summarized in Table
3–1. Cake solids content was used as efficiency indicator since reducing sludge volume
is the ultimate target of dewatering process. Besides, centrate quality was also taken into
in assessing sludge dewatering efficiency. Centrate quality was expressed in terms of
suspended solids content in the effluent.
Samples were collected from a sampling point before being conditioned and dewatered
and then were immediately transferred to the laboratory for characterizing their physical
and chemical parameters (temperature, pH, zeta potential (ZP), capillary suction time
(CST), dry solids (DS) content, volatile solids (VS) content, soluble COD (sCOD),
soluble protein (sP) and polysaccharides (sPS)) on the same day itself. Samples used for
conditioning test was stored at 4oC (in order to minimize the microbial activity) and
used for experiments within 4 days from sampling date. All experiments were
conducted in duplicate.
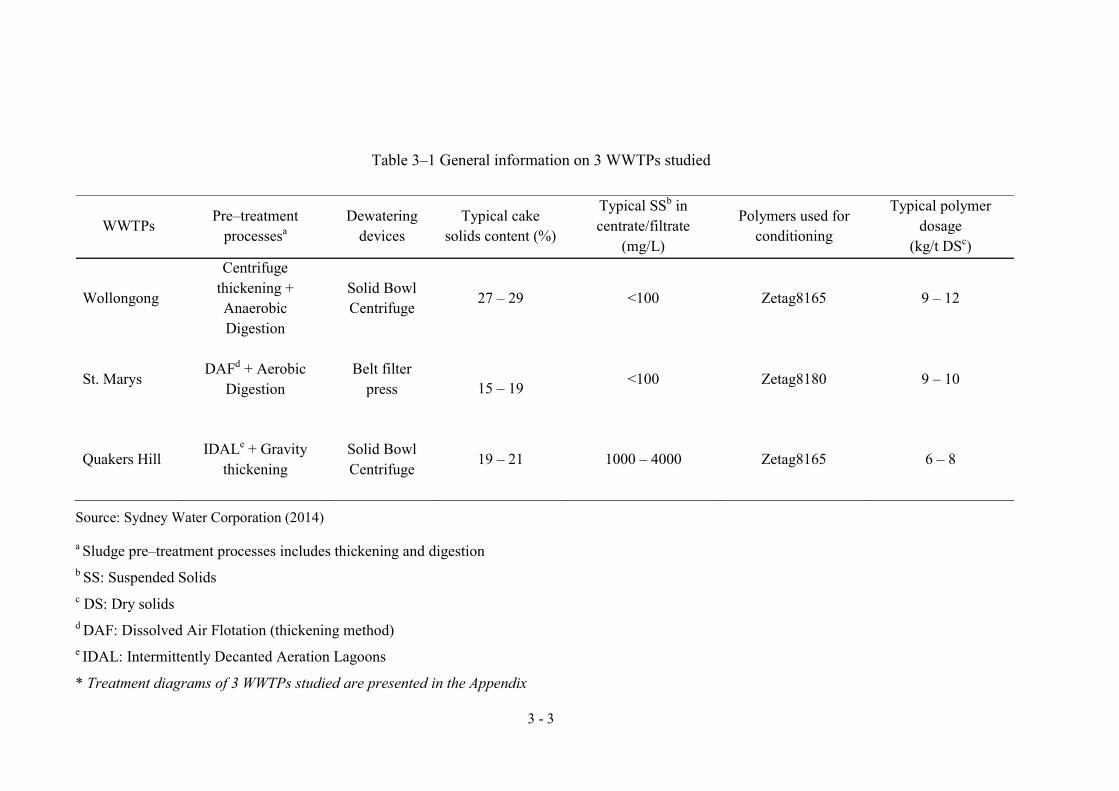
3 - 3
Table 3–1 General information on 3 WWTPs studied
WWTPs Pre–treatment processesa
Dewatering devices
Typical cake solids content (%)
Typical SSb in centrate/filtrate
(mg/L)
Polymers used for conditioning
Typical polymer dosage
(kg/t DSc)
Wollongong
Centrifuge thickening + Anaerobic Digestion
Solid Bowl Centrifuge 27 – 29 <100 Zetag8165 9 – 12
St. Marys DAFd + Aerobic
Digestion Belt filter
press 15 – 19
<100 Zetag8180 9 – 10
Quakers Hill IDALe + Gravity thickening
Solid Bowl Centrifuge
19 – 21 1000 – 4000 Zetag8165 6 – 8
Source: Sydney Water Corporation (2014)
a Sludge pre–treatment processes includes thickening and digestion b SS: Suspended Solids c DS: Dry solids d DAF: Dissolved Air Flotation (thickening method) e IDAL: Intermittently Decanted Aeration Lagoons
* Treatment diagrams of 3 WWTPs studied are presented in the Appendix

3 - 4
The dewatered cake and centrate (filtrate) were also collected on the outlets of
dewatering devices on the same day to evaluate the sludge dewatering performance.
These were measured in terms of cake solids and suspended solids (SS), respectively.
Wastewater sludge possesses highly complicated nature and behaviour, thus it is not
easy to characterize it inclusively. The present study selected the most representative
parameters (as shown in Table 3–2). These parameters were then related with sludge
conditioning and dewatering. The sludge parameters studied were:
a. As–received sludge (before conditioning and dewatering)
Zeta potential (ZP): Since the main mechanism for polymer conditioning is charge
neutralization, zeta potential measurement was made. This helps to determine the
effective charge at the particle surface and can be used as an indirect measure to
estimate polymer dose (Stoll 2013). The more the negative zeta potential, the more the
polymer needed for charge neutralization. Besides, zeta potential of sludge also decides
the type of polymer (cationic or anionic) to be used.
Capillary suction time (CST): CST is the most common parameter used in practice to
evaluate the solid–liquid separation ability as it is a quick and easy test and does not
require high skill to perform (Sanin et al. 2011).
Table 3–2 Sludge characteristic parameters measured in the study
pH
ZP (mV)
CST (s)
DS (%)
VS (%)
sCOD (mg/L)
sP (mg/L)
sPS (mg/L)
SS (mg/L)
As–received sludges
Dewatered cake
Centrate /Filtrate

3 - 5
Dry solids (DS) and Volatile solids (VS) contents: DS and VS are the two important
parameters which are often used to calculate the amount of conditioning polymer for a
given sludge. The polymer dosage is often expressed on a mass basis, commonly
expressed as kilo–grams of polymer per ton of dry solids (kg/t DS).
Soluble Protein (sP) and Soluble Polysaccharides (sPS): Novak et al. (2003) found
that soluble biopolymers, mainly protein and polysaccharides, which are released into
supernatant solution during the digestion, take up a major portion of the polymers used
for conditioning and does not make it available for flocculation of the sludge particles.
Soluble COD (sCOD): Higgins et al. (2006) reported that soluble COD and soluble
biopolymers have relatively good correlations among them. Since soluble protein and
polysaccharides analyses are not typically used for field measurements due to their
specific equipment and reagent requirements, soluble COD could be used as a substitute
to represent the contents of sP and sPS.
b. Dewatered cake and centrate/filtrate
DS of dewatered cake (cake solids content) and SS in centrate/filtrate are the two
major controlling parameters that reflect the effectiveness of dewatering operation. The
objective of sludge dewatering is to produce a clear centrate while also achieving a cake
high in solids. The cake solids content was measured using gravimetric method.
ZP of centrate/filtrate was measured as an indicator to prevent over–dosing. When ZP
of centrate is positive, it could be an indication of excessive polymer dose. In fact,
charge neutralization does not need to be completely achieved in sludge conditioning
since effective flocculation is obtained by both charge neutralization and bridging
formation mechanisms concurrently. Therefore, even ‘zero’ or low negative surface
charge is possibly considered as over–dosing already (Abu-Orf & Dentel 1997, Novak

3 - 6
& Haugan 1979, Agarwal et al. 2005). ZP of the centrate can be used as a qualitative
parameter to quickly check whether any excess amount of cationic polymer used still
remains in the centrate.
Besides physical and chemical characterization, morphology of samples, for example,
shape of dewatered cake and colour of centrate, was also investigated:
- The shape and the dryness level of dewatered cake give information on
dewatering devices used and to some extent the efficiency of dewatering. The
cake from centrifuge looks drier than that of belt filter press. Cake from
centrifuge has pellet shape while cake of belt press has flat shape.
- The colour of the centrate can also be used as an indicator of the centrifuge
performance, for instance, black or gray or foaming centrate is indicative of a
problem in operation.
3.1.2. Chemicals
Table 3–3 summarizes characteristics of polymers used in the study in terms of charge
density, configuration and molecular weight.
Table 3–3 Properties of the polymer used in the study
Trade name Charge type Configuration Charge density Molecular weight
Zetag8165 Cationic Linear Medium–high Very high
Zetag8180 Cationic Linear High High
Zetag4110 Anionic Linear Low High
Zetag4145 Anionic Linear Medium–high Very high
Source: BASF Australia Ltd.
Cationic polymers: This study used cationic polymers currently utilized at the 3
WWTPs, with Zetag8165 at Wollongong WWTP and Quakers Hill WWTP and
3 - 7
Zetag8180 at St. Marys WWTP. Polymer solutions were prepared by dissolving these
powdered polymers in distilled water at same concentrations used at the 3 WWTPs in
order to imitate their full–scale conditioning processes (Table 3–4).
Table 3–4 Concentration of conditioning polymers at 3 WWTPs studied
WWTPs Polymer name Solution concentration (w/v)
Wollongong Zetag8165 0.1
St. Marys Zetag8180 0.3 – 0.4
Quakers Hill Zetag8165 0.2 – 0.3
Source: Sydney Water Corporation (2014)
Anionic polymers: Anionic polymers with different molecular weights and charge
densities (recommended by the chemical supplier, BASF Australia Ltd.) were also used
to evaluate the effect of dual polymers on conditioning. All anionic polymer solutions
were prepared at concentration of 0.1% w/v.
Fenton’s reagent: As mentioned above, Fenton’s reagent is defined as the mixture of
H2O2 and Fe2+. The present study used FeCl2.4H2O as the source of Fe2+ and H2O2 at
30% w/v solution.
Ferric chloride (FeCl3): FeCl3 solution was prepared at a concentration of 0.01% w/v.
3 - 8
3.2. Experimental studies
Sludge samples were warmed to room temperature (20 – 25oC) before all experiments.
Each test was done in duplicate and the average value is reported.
3.2.1. Sludge characterization
3.3.1.1. Filtrate preparation
The purpose of this step is to extract the soluble biopolymers from the sludge. As–
received sludge was centrifuged at 3000 rpm for 15 minutes then the supernatant was
filtered using a Whatman filter paper No. 542 (with 2.7μm pore size) to measure soluble
COD, protein and polysaccharides. The selection of filter paper pore size was based on
the study of Higgins et al. (2006). They concluded that soluble biopolymers, mainly the
ones consisting of protein and polysaccharides with sizes less than 3.0μm account for
much of polymer demand for sludge conditioning.
3.3.1.2. Analysis methods
Soluble COD was analysed using Hatch COD vials while soluble protein and
polysaccharides were measured using modified Lowry (Lowry et al. 1951) and Phenol–
Sulphuric (Dubois et al. 1956) methods, respectively. DS, SS and VS were conducted
following Standard methods 2540B, 2540D and 2540E (APHA 1995), respectively.
CST was determined using 304B Portable CST Unit, Triton Electronics Ltd, UK. The
details on the procedure are given elsewhere (Vesilind 1988). Temperature and pH of
sludge before conditioning were measured by pH meter (Hana, model HI 9025C). Zeta
potential (ZP) was measured using Malvern Instruments Zeta Sizer Nano ZS–90.

3 - 9
3.2.2. Conditioning tests
Table 3–5 summarizes the chemicals used for conditioning tests of the present study.
Table 3–5 Conditioning tests and chemicals used
Conditioning tests Chemicals used
Determination of:
- Optimal mixing intensity
- Optimal polymer demand (OPD)
- Zetag8165 (ADS and WAS)
- Zetag8180 (AEDS)
Cationic/Anionic polymers conditioning
- Cationic polymers: zetag8165 (ADS
and WAS) and zetag8180 (AEDS)
- Anion polymers: Zetag4110 and
Zetag4145
Iron/Cationic polymer conditioning
- Cationic polymers: zetag8165 (ADS
and WAS) and zetag8180 (AEDS)
- FeCl3 solution
Advanced oxidation (Fenton)
conditioning
- FeCl2 solution
- H2O2 30% (w/v)
3.2.2.1. Polymer conditioning – Determining optimal conditioning regimes
a. Optimal mixing intensity
Experiments were carried out by pouring 500 mL of sludge sample into a 1 L beaker.
Pre–determined amount of polymer was mixed with the sludge using a bench–scale
agitator (as shown in Figure 3–1). Optimal mixing intensity including mixing time and
speed were figured out through screening tests. Sludge was conditioned at the currently
used polymer dose at the WWTPs studied with different mixing speed (100 – 500rpm)
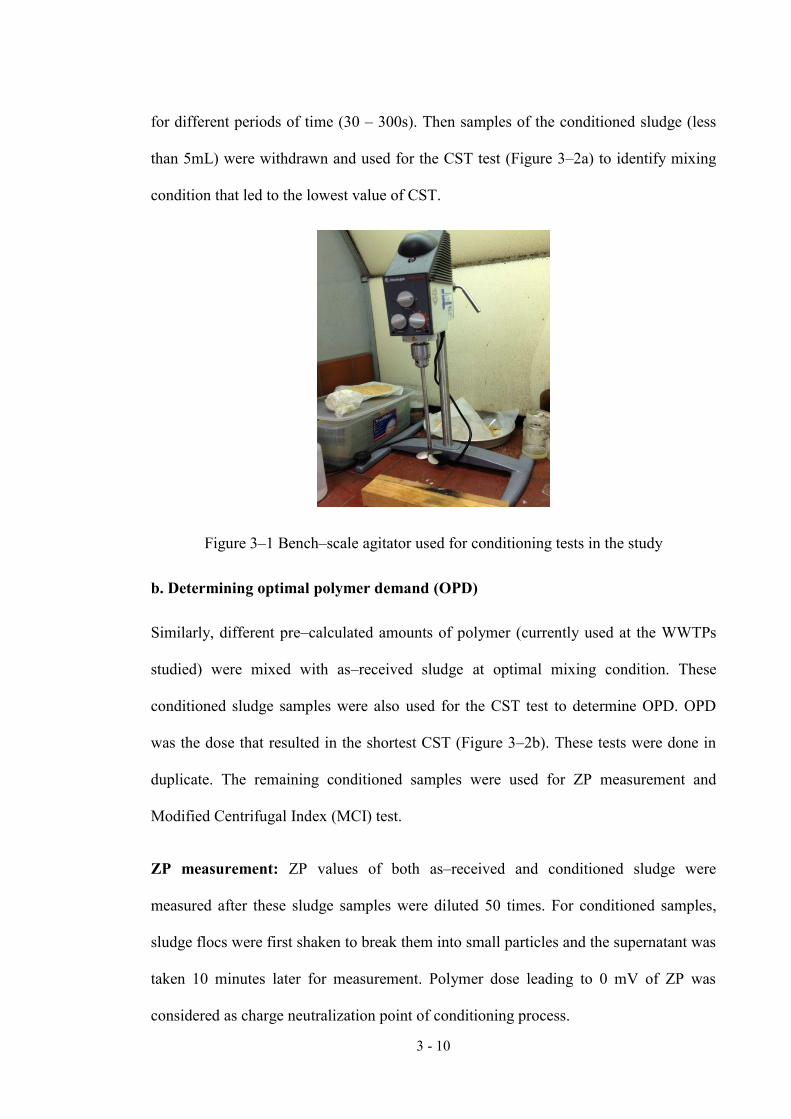
3 - 10
for different periods of time (30 – 300s). Then samples of the conditioned sludge (less
than 5mL) were withdrawn and used for the CST test (Figure 3–2a) to identify mixing
condition that led to the lowest value of CST.
Figure 3–1 Bench–scale agitator used for conditioning tests in the study
b. Determining optimal polymer demand (OPD)
Similarly, different pre–calculated amounts of polymer (currently used at the WWTPs
studied) were mixed with as–received sludge at optimal mixing condition. These
conditioned sludge samples were also used for the CST test to determine OPD. OPD
was the dose that resulted in the shortest CST (Figure 3–2b). These tests were done in
duplicate. The remaining conditioned samples were used for ZP measurement and
Modified Centrifugal Index (MCI) test.
ZP measurement: ZP values of both as–received and conditioned sludge were
measured after these sludge samples were diluted 50 times. For conditioned samples,
sludge flocs were first shaken to break them into small particles and the supernatant was
taken 10 minutes later for measurement. Polymer dose leading to 0 mV of ZP was
considered as charge neutralization point of conditioning process.
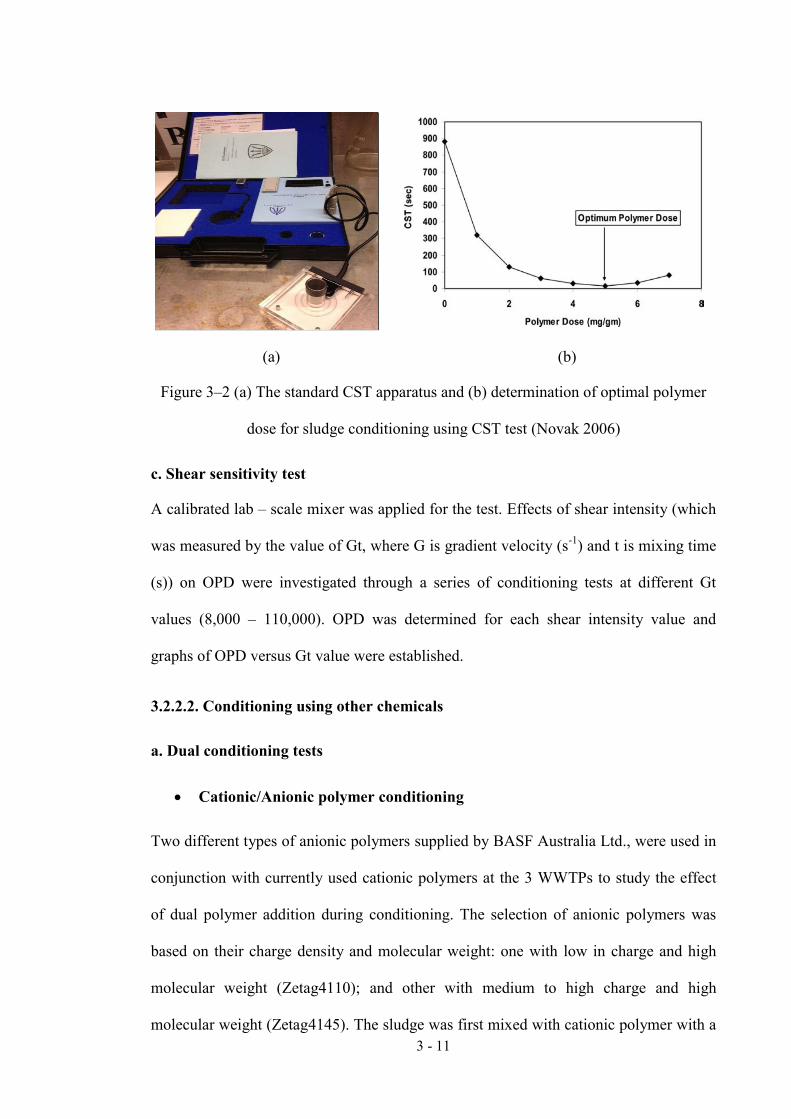
3 - 11
(a) (b)
Figure 3–2 (a) The standard CST apparatus and (b) determination of optimal polymer
dose for sludge conditioning using CST test (Novak 2006)
c. Shear sensitivity test
A calibrated lab – scale mixer was applied for the test. Effects of shear intensity (which
was measured by the value of Gt, where G is gradient velocity (s-1) and t is mixing time
(s)) on OPD were investigated through a series of conditioning tests at different Gt
values (8,000 – 110,000). OPD was determined for each shear intensity value and
graphs of OPD versus Gt value were established.
3.2.2.2. Conditioning using other chemicals
a. Dual conditioning tests
Cationic/Anionic polymer conditioning
Two different types of anionic polymers supplied by BASF Australia Ltd., were used in
conjunction with currently used cationic polymers at the 3 WWTPs to study the effect
of dual polymer addition during conditioning. The selection of anionic polymers was
based on their charge density and molecular weight: one with low in charge and high
molecular weight (Zetag4110); and other with medium to high charge and high
molecular weight (Zetag4145). The sludge was first mixed with cationic polymer with a

3 - 12
dose less than the currently use at the 3 WWTPs and then a pre–calculated amount of
anionic polymer was added to the mixture while being stirred. CST test was also used to
measure dewaterability of conditioned sludge.
Iron/Cationic polymer conditioning
The procedure was the same as that of dual polymer conditioning, except that the sludge
was dosed with different quantities of ferric chloride prior to the addition of cationic
polymer.
b. Advanced oxidation (Fenton) conditioning
A Jar test was used to test the advanced oxidation conditioning. Different Fe2+/ H2O2
concentrations (Fenton’s reagent) were tested to determine the most appropriate
dosages. 500 mL of sludge was placed in a 1 L beaker then pH was adjusted to 3 using
HNO3. After that, the pre–determined amounts of Fe2+ (FeCl2) and H2O2 solutions were
added into the sludge and the mixture was mixed at 100rpm for 30min. The CST of
conditioned sludge was then measured.
3.2.3. Modified centrifugal index (MCI) test
In this study, a modified bench–scale centrifuge apparatus was used to determine cake
solids content of ADS before and after conditioning. This method was developed by
Higgins et al. (2014). In the present study, a lab–scale centrifuge and modified
centrifuge tubes as shown in Figure 3–3, were employed for the test. A support was
provided to hold the filter paper (Whatman paper No. 4 with 20μm pore size) about half
way from the bottom of the centrifuge tube. The sludge sample was placed right on the
filter paper and the centrifuge was operated at different gt values (100,000 – 1,000,000).
After the centrifugation, the corresponding cake solids were measured to evaluate the

3 - 13
dewatering efficiency. Graph of gt values versus cake solids content (%) was made and
compared at different polymer doses to evaluate the effect of both polymer conditioning
and shear intensity on the efficiency of sludge dewatering.
(a) (b)
Figure 3–3 (a) Lab – scale centrifuge and (b) Modified centrifuge cup before (left) and
after (right) MCI test
Values of gt were determined by the following formula:
gt = g x t (1)
Here g is times gravity (or centrifugal force) which is related to centrifuge rotating
speed and rotor radius; t is centrifugation time (s). Table 3–6 displays the conversion
between centrifuge speed (rpm) and times gravity (g).
Table 3–6 Conversion between times gravity and centrifuge rotor speed for 7cm of rotor
radius
Centrifuge rotor speed
(rpm) Times gravity (xg)
2000 313
2500 489
3000 704
3500 959
Source: www.thermo.com/pierce
4 - 1
UNIVERSITY OF TECHNOLOGY, SYDNEY
FACULTY OF ENGINEERING AND IT
CHAPTER 4
RESULTS AND DISCUSSION

4 - 2
4.1. Sludge characterization
4.1.1. Wollongong WWTP
4.1.1.1. Anaerobically digested sludge (ADS)
(a) (b) (c)
Figure 4–1 (a) ADS; (b) Dewatered cake and (c) Centrate of Wollongong WWTP
ADS collected from Wollongong WWTP looked viscous, fluffy and black (Figure 4–
1a); had bad odour and poor settleability. The characteristics of this ADS are
summarized in Table 4–1. It shows that this sludge sample represents a typical
biologically digested sludge, with DS about 25g/L (≈ 2.5%) and VS/DS around 62%. It
also has been noticed that the CST value of ADS was relatively high (1610 ± 75s),
indicating poor dewaterability of this sludge (Vesilind 1988). This result is in agreement
with previous studies which showed that both aerobic and anaerobic digestions
deteriorate the sludge dewatering properties (Novak et al. 2003, Bruss et al. 1993,
Novak et al. 1977). Zeta potential of ADS at pH = 7.4 is highly negative (-29.6 ±
0.9mV), which is considered responsible for hydration and electrostatic repulsion
preventing the particles to naturally form flocs (Turovskiy & Mathai 2006). The protein
concentration of ADS was about three times higher than the polysaccharide
concentration. This result is similar to prior finding by Novak et al. (2003) who

4 - 3
concluded that under anaerobic conditions, the concentration of soluble protein is
considerably greater than that of polysaccharides. Protein may have a more important
role in determining the polymer demand.
4.1.1.2. Dewatered cake and centrate
Dewatered cake
The dewatered cake was also characterized to evaluate the efficiency of the dewatering
system. Dewatered cake looked dry and had pellet shape (Figure 4–1b) resulted from
the effect of high–speed centrifuges. However, sticky cake, which could be due to the
excess amount of conditioning polymer, made it difficult in conveying.
It can be seen from Table 4–1, after conditioning and dewatering, the cake solids
increased from 2.5% to almost 29%. It was classified as a good dewatering performance
for centrifuge (Vigneswaran & Ben Aim 1989) despite the fact that characteristic profile
of ADS indicated a poor dewaterability. It was suggested that this improvement could
be attributed to the effects of both anaerobic digestion and conditioning, which will be
studied in detail latter.
Centrate quality
Centrate quality is one of main controlling parameters reflecting the efficiency of the
solids capture during conditioning and dewatering processes, specifically when
centrifuge is used for dewatering. For plant operation, it is important to remove as much
solids as possible during dewatering operation. This helps minimize the recycle of
solids to the plant inlet when the centrate is sent back to the head–of–works. SS in
centrate is applied for representing the centrate quality. SS in centrate of Wollongong

4 - 4
Table 4–1 Characteristics of ADS, dewatered cake and centrate of Wollongong WWTP
Sludge
types pH
ZP
(mV)
CST
(s)
DS
(%)
VS
(%)
VS/DS
(%)
sCOD
(mg/L)
sP
(mg/L)
sPS
(mg/L) sP/sPS
SS
(mg/L)
ADS 7.4 ±0.1
-29.6 ±0.9
1610 ±75
2.5 ±0.27
1.5 ±0.09
62 ±5
1337 ±71
244.9 ±12
76.5 ±2.4
3.1 ±0.3
-
Dewatered
cake - - - 27 – 29 - - - - - - -
Centrate 8.1
±0.2 (-7.8) - (-1) - - - - - - - - 60 – 90
Sampling times: 7 (May 1st 2013 – March 25th 2014)

4 - 5
WWTP was typically under 100mg/L (Table 4-1), which can be considered as clear
centrate (Figure 4–1c).
Although obtaining high DS in dewatered cake, ZP of centrate was negative, ranging
from -1 to -7.8mV (Table 4–1).It strengthens the concept that neutralization of charge is
not the only mechanism governing the sludge conditioning. Polymer bridging formation
is also an important mechanism.
4.1.2. St. Marys WWTP
4.1.2.1. Aerobically digested sludge (AEDS)
(a) (b) (c)
Figure 4–2 (a) AEDS; (b) Dewatered sludge and (c) Filtrate of St. Marys WWTP
AEDS looked viscous and blackish brown (Figure 4–2a), had bad odour and a better
settleability than that of Wollongong WWTP but not as well as Quakers Hill WWTP.
The feeding sludge had the lowest DS (about 2%) and a moderate VS/DS (64%) among
all 3 WWTPs. Zeta potential of AEDS was moderately negative compared to
Wollongong and Quakers Hill WWTPs (≈ -26mV) while CST value was not so high (≈
300s). Soluble COD and soluble biopolymers concentrations were medium compared to
the other two WWTPs and the ratio of sP to sPS was about 2.5.
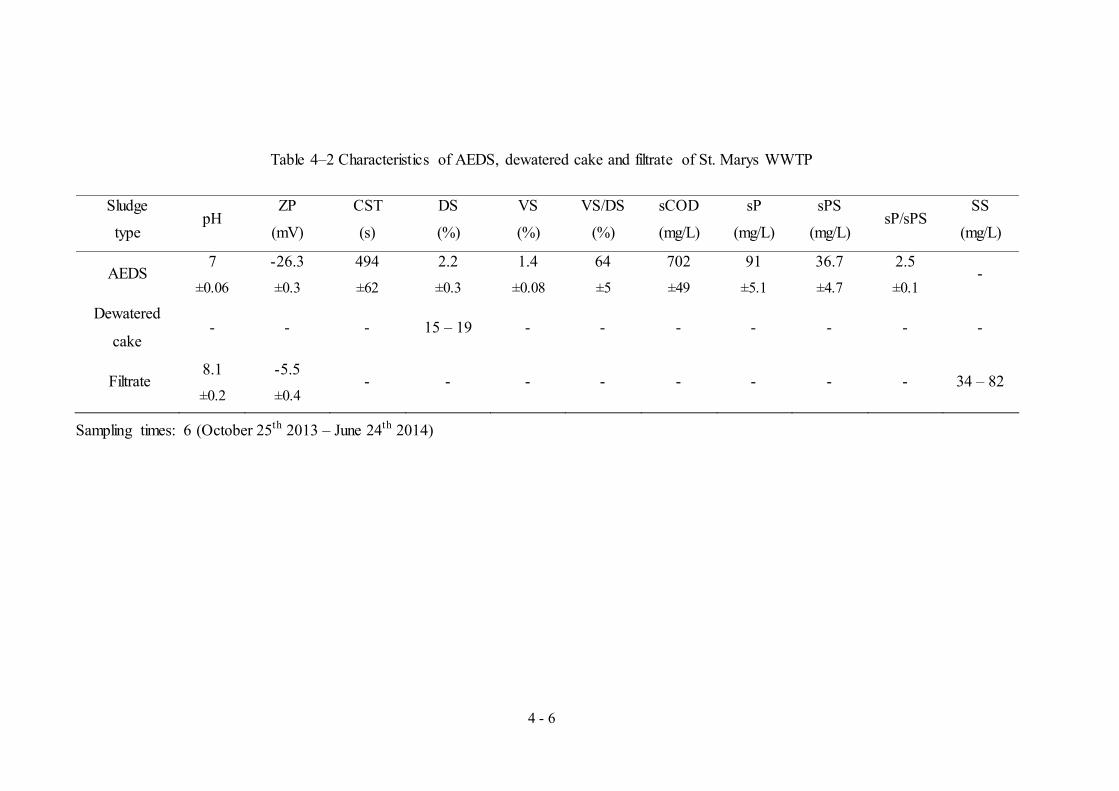
4 - 6
Table 4–2 Characteristics of AEDS, dewatered cake and filtrate of St. Marys WWTP
Sludge
type pH
ZP
(mV)
CST
(s)
DS
(%)
VS
(%)
VS/DS
(%)
sCOD
(mg/L)
sP
(mg/L)
sPS
(mg/L) sP/sPS
SS
(mg/L)
AEDS 7
±0.06 -26.3 ±0.3
494 ±62
2.2 ±0.3
1.4 ±0.08
64 ±5
702 ±49
91 ±5.1
36.7 ±4.7
2.5 ±0.1
-
Dewatered
cake - - - 15 – 19 - - - - - - -
Filtrate 8.1 ±0.2
-5.5 ±0.4
- - - - - - - - 34 – 82
Sampling times: 6 (October 25th 2013 – June 24th 2014)
4 - 7
Similar to ADS, characteristics of AEDS were quite stable at different sampling times
due to the effect of stabilization or digestion process. This makes it easier to precisely
estimate the polymer demand for sludge conditioning.
4.1.2.2. Dewatered cake and filtrate
Dewatered cake
Dewatered cake looked wet and had flat shape (Figure 4–2b), which was representative
for dewatering by belt filter presses. It has been known that, belt presses are not
effective in sludge dewatering when compared to centrifuges, especially the high–speed
ones (Metcalf et al. 1991). As a result, the typical cake solids contents of St. Marys
WWTP were only 15 – 19%.
Filtrate
Despite the low cake solids content, filtrate quality of dewatering system was good and
looked clear (Figure 4–2c), with SS often less than 100mg/L. Zeta potential of filtrate
obtained at different sampling times stabilized at around -5mV (Table 4–2) possibly
because of steady properties of AEDS as well as operational conditions of the plant.
4.1.3. Quakers Hill WWTP
4.1.3.1. Waste activated sludge (WAS)

4 - 8
(a) (b) (c)
Figure 4–3 (a) WAS; (b) Dewatered sludge and (c) Centrate of Quakers Hill WWTP
WAS appeared to be highly viscous and yellowish to brown in colour; had really bad
odour and good settleability (Figure 4–3a). This waste sludge collected from IDALs
underwent gravity thickening stage; thus, had relatively high DS (up to 3.7%) and
VS/DS (about 68%) in comparison with Wollongong and St. Marys WWTPs.
Compared to the typical zeta potential of waste activated sludge, which is -30mV
(Böhm & Kulicke 1997, Chitikela & Dentel 1998), the negative surface charge of
Quakers Hill WWTP’s WAS was much lower (≈ -21mV), possibly leading to a low
polymer demand for sludge conditioning. Besides, low values of CST (71±11s) could
favour dewatering capacity.
Quakers Hill WWTP’s sludge had the lowest concentrations of soluble COD, protein
and polysaccharides among 3 sludge types. This could be due to the effect of thickening
stage which substantially removed the soluble biopolymers attaching with the liquid
phase. It, as a result, may require a small amount of polymer for conditioning. The
content of sP was also higher than that of sPS, nonetheless, the ratio of sP to PS was
lower than those of digested sludges, with sP/sPS about 1.7.
Unlike the other 2 sludge types, characteristics of WAS collected at different sampling
times relatively fluctuated in terms of all parameters, expressing a complex and elusive

4 - 9
nature of WAS. This may be due to the lack of stabilization stage (digestion) before
dewatering at the plant, which could make sludge treatment more difficult.
4.1.3.2. Dewatered cake and centrate
Dewatered cake
In the case of Quakers Hill WWTP, polymer conditioning also helped improve WAS
dewaterability. However, the improvement of cake solid concentration was not as
significant as that of Wollongong WWTP. It led to only about 18 – 19% of cake solid
content although Quakers Hill WWTP also utilized high–speed centrifuges for
dewatering. This was contrary to WAS characterization that indicated a better
dewatering efficiency.
The following reasons may lead to bad dewatering efficiency of Quakers Hill WWTP:
- Regarding sludge properties: WAS was proved to be sensitive to high shear
(Higgins et al., 2006) and easy to be broken even after conditioning. This led to
a centrate with high SS concentration.
- Regarding conditioning regimes: Inefficient mixing time for sludge conditioning
could result in ineffective flocculation.
- Regarding dewatering equipment: Old centrifuge did not work properly.
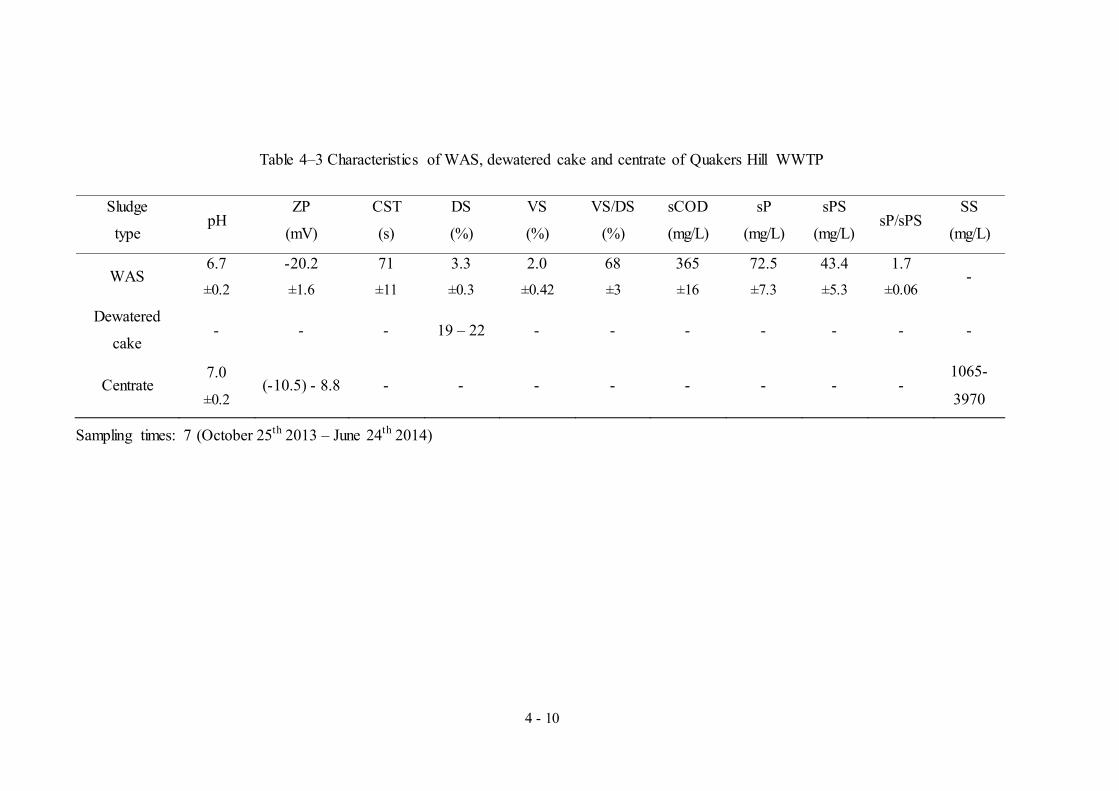
4 - 10
Table 4–3 Characteristics of WAS, dewatered cake and centrate of Quakers Hill WWTP
Sludge
type pH
ZP
(mV)
CST
(s)
DS
(%)
VS
(%)
VS/DS
(%)
sCOD
(mg/L)
sP
(mg/L)
sPS
(mg/L) sP/sPS
SS
(mg/L)
WAS 6.7 ±0.2
-20.2 ±1.6
71 ±11
3.3 ±0.3
2.0 ±0.42
68 ±3
365 ±16
72.5 ±7.3
43.4 ±5.3
1.7 ±0.06
-
Dewatered
cake - - - 19 – 22 - - - - - - -
Centrate 7.0
±0.2 (-10.5) - 8.8 - - - - - - - -
1065-
3970
Sampling times: 7 (October 25th 2013 – June 24th 2014)

4 - 11
Centrate
Centrate of Quakers Hill WWTP looked ‘dark’ in colour (Figure 4–3c), with SS in
centrate typically over 1000mg/L and even up to 4000mg/L (Table 4–3). Zeta potential
of centrate ranged from -10mV to 8.8mV, which was possibly due to under–dosed (-
10mV) or over–dosed (8.8mV) conditioning at the plant in different sampling times.
Unlike the other 2 plants, the operational conditions (such as polymer doses, dewatering
intensity) at Quakers Hill WWTP are adjusted every day, from 6 to 8kg/ton DS. These
adjustments were based on DS of feeding sludge and centrate quality.
4.1.4. Feed sludge characterization – Prediction of sludge conditioning demand and
dewaterability
Dry solids (DS) content of feed sludge
DS content of feeding sludge is the most common parameter which has been often used
for sludge characterization and calculation of conditioning polymer demand. A previous
study demonstrated that higher performance of a rotary vacuum filter relates to the
increase in feeding solids content (Fan et al. 2000), which highlights the effect of
thickening on dewatering as well as the relationship between feeding DS and
dewaterability. In this study, WAS had the highest DS (up to 3.7%) due to post
treatment by gravity thickening while ADS and AEDS had lower DS (2.2 – 2.5%),
perhaps resulted from digestion processes, even though they were both thickened
previously. Thus, it could be suggested that WAS may have better dewaterability than
ADS and AEDS without conditioning treatment.
Zeta potential
Zeta potential (ZP) is an important surface property of sludge flocs in terms of
flocculation and dewatering (Sanin et al. 2011). Typically, sewage sludges originated
4 - 12
from WWTPs usually have negative ZP (Christensen & Wavro 1981). The distinct
feature among them was how much negative values of ZP. It has been confirmed that
the larger magnitude of ZP, the more stability of colloids. It may lead to smaller
probability of flocculation occurring (Christensen & Wavro 1981, Bolto & Gregory
2007) and possibly poorer dewaterability. In this study, the order of absolute ZP value
for sludge studied were ADS > AEDS > WAS (Tables 4–1, 4–2 and 4–3), which means
digested sludge may require higher polymer demand for neutralizing the surface charge
and could be more difficult to be dewatered than WAS.
CST
Lee & Liu (2001) measured the CST values of different feeding sludge types and they
found the mean CST decreased in the order: digested sludge > activated sludge > raw
sludge > mineral sludge. The present study results are in agreement with their finding.
CST values of ADS and AEDS were much higher than that of WAS, especially ADS
with CST over 1600s (Tables 4–1, 4–2 and 4–3). CST is an indication of dewaterability.
It is harder to extract water from digested samples with higher CST than WAS. This
also proves that digestion could be one of major reasons of sludge dewatering reduction
before conditioning (Bruss et al. 1993, Novak et al. 1977, Novak et al. 2003).
Soluble substances
Soluble biopolymers (mainly protein and polysaccharides) which are produced during
digestion process, especially in anaerobic digestion, have been demonstrated to be
responsible for high polymer demand for sludge conditioning (Higgins et al. 2006,
Novak et al. 2003). In the present study, in terms of quantity of biopolymers, ADS had
the highest amount, protein in particular, while the other 2 sludge types had lower
amounts, with AEDS slightly higher than WAS (Tables 4–1, 4–2 and 4–3). This

4 - 13
supports the earlier work of Novak et al. (2003) that protein is released into solution
during anaerobic digestion. In addition, the ratios of sP to sPS were increased by
digestion process. This increases the polymer demand for sludge conditioning. Soluble
COD was proved to have good relationships with soluble biopolymer and OPD
(Higgins et al. 2006, To et al. 2014). Based on these data, it may be suggested that the
order of polymer demand for sludge conditioning is: ADS > AEDS > WAS.
4.2. Effects of sludge characteristics on sludge conditioning and dewatering
4.2.1. Sludge properties in relationships with conditioning and dewatering
One of main objectives of this study was to establish correlations between dewatering
indices and sludge characteristics to identify the most influencing factors of sludge
conditioning and dewatering. Thus a number of feeding sludge properties were
measured and related to CST values of feeding sludge and optimal polymer demand
(OPD). The OPD in this study was measured by CST test. Besides, relationships
between soluble biopolymers and soluble COD were also investigated to clarify whether
soluble COD could be used as a substitute for soluble protein and polysaccharides to
estimate the polymer requirement for conditioning.
4.2.1.1. For each sludge type
4.2.1.1.1. ADS
Dry solids (DS) content and Volatile solids (VS) content
DS and VS are considered as two important parameters that are often used to calculate
the amount of conditioning polymer for a given sludge. The original concept of
conditioning is the neutralization of the surface charge of sludge particles using
oppositely charged conditioners, which primarily decides the polymer demand for
4 - 14
conditioning, until the idea of soluble biopolymers emerged. Results from Table 4–4
show that correlations of DS with both CST (R2 = 0) and OPD (R2 = 0) did not exist.
This is in conflict with a previous study of Vesilind (1988), who found a linearly
positive relationship between CST and solid concentration of a mixed digested sludge
(feeding sludge). Similarly, VS also correlated insignificantly with CST (R2 = 0.02),
however, better with OPD (R2 = 0.20) compared to DS. This may be because VS is a
parameter representative of the organic matter content, therefore it could have impact on
polymer demand for conditioning. Nevertheless, low correlation coefficient value could
be due to the fact that VS consists of many different types of organic substances but not
all of them require polymer for conditioning.
Soluble substances
Among the parameters studied, soluble biopolymers, mainly sP and sPS, correlated well
with CST both separately (R2 = 0.49 for sP; R2 = 0.63 for sPS – Figure 4–4) and
together (R2 = 0.46 for sP+sPS – Figure 4–4). sCOD had a slightly weaker relationship
(R2 = 0.36 – Figure 4–4) with CST. This implies that these soluble substances,
especially soluble biopolymers, hinder sludge dewaterability.

4 - 15
(a) (b)
(c) (d)
Figure 4–4 Relationships between CST and sludge characteristics including: (a) Soluble
COD; (b) Soluble Protein; (c) Soluble Polysaccharides and (d) Total soluble
biopolymers for ADS
Novak et al. (2003) found that soluble biopolymers are responsible for the excessive
polymer for conditioning. Similar results were obtained in this study. Both soluble
protein and PS had good correlations with OPD (R2 = 0.95 for sP and R2 = 0.97 for sPS
– Figure 4–5). These results confirm that soluble biocolloid contents can be used as an
important factor in determining as well as predicting the OPD for sludge conditioning.
Additionally, a good relationship between sCOD and OPD were also recorded, with R2
= 0.90.
y = 0.3153x + 1164.4 R² = 0.36
0
500
1000
1500
2000
0 500 1000 1500
CST(
s)
sCOD(mg/L)
y = 1.2052x + 1192.8 R² = 0.49
0
500
1000
1500
2000
0 100 200 300 400
CST(
s)
sP(mg/L)
y = 9.6001x + 785.95 R² = 0.63
0
500
1000
1500
2000
40 60 80 100
CST(
s)
sPS(mg/L)
y = 1.0412x + 1162.3 R² = 0.46
0
500
1000
1500
2000
0 200 400 600
CST(
s)
sP+sPS(mg/L)

4 - 16
(a) (b)
(c) (d)
(e)
Figure 4–5 Relationships between OPD and sludge characteristics including: (a) Soluble
COD; (b) Soluble Protein; (c) Soluble Polysaccharides; (d) sP/sPS and (e) Total soluble
biopolymers for ADS
y = 0.0043x + 3.0884 R² = 0.90
0
2
4
6
8
10
0 500 1000 1500
OPD
(kg/
t DS
)
sCOD(mg/L)
y = 0.0145x + 3.9355 R² = 0.95
0
2
4
6
8
10
0 100 200 300 400
OPD
(kg/
t DS
)
sP(mg/L)
y = 0.1025x - 0.0217 R² = 0.97
0
2
4
6
8
10
40 60 80 100
OPD
(kg/
t DS
)
sPS(mg/L)
y = 1.866x + 1.5407 R² = 0.81
0
2
4
6
8
10
1 2 3 4 5
OPD
(kg/
t DS
)
sP/sPS
y = 0.0127x + 3.5196 R² = 0.92
0
2
4
6
8
10
0 200 400 600
OPD
(kg/
t DS
)
sP+sPS(mg/L)

4 - 17
Since both soluble biopolymers contribute to the polymer demand, correlation could be
better when considering these two components together (Higgins et al. 2006). The data
displayed relatively good correlations between OPD and total soluble biopolymer
contents (R2 = 0.92); and OPD and ratio of sP to sPS (R2 = 0.81).
Zeta potential (ZP)
It has been known that main mechanism for coagulation/ flocculation is charge
neutralization (Gregory 1993). Our results showed a weak negative linear trend (R2 =
0.25) between ZP and CST. This could imply that the more negative ZP, the less
effective the sludge dewatering. Similarly, a weak correlation of ZP and OPD was
observed as shown in Table 4–4 (R2 = 0.19). Despite of insignificant relationships with
sludge conditioning and dewaterability, this index can give useful indirect information
on determining the conditioning polymer demand based on charge neutralization
(Chitikela & Dentel 1998).
4.2.1.1.2. AEDS
Sludge properties in relationships with CST
For AEDS, as can be noticed from Table 4–4, no significant correlations were observed
between ZP, DS, VS, soluble substances (sCOD, sP, sPS, sP+sPS, sP/sPS), except for
VS/DS, and CST. VS/DS was negatively linear with CST, with R2 = 0.81, which means
the more the VS content, the better the sludge dewatering. This is in disagreement with
prior discussion that increase in VS should have led to poorer sludge dewaterability.
This uncommon feature could be attributed to insufficient experimental data.
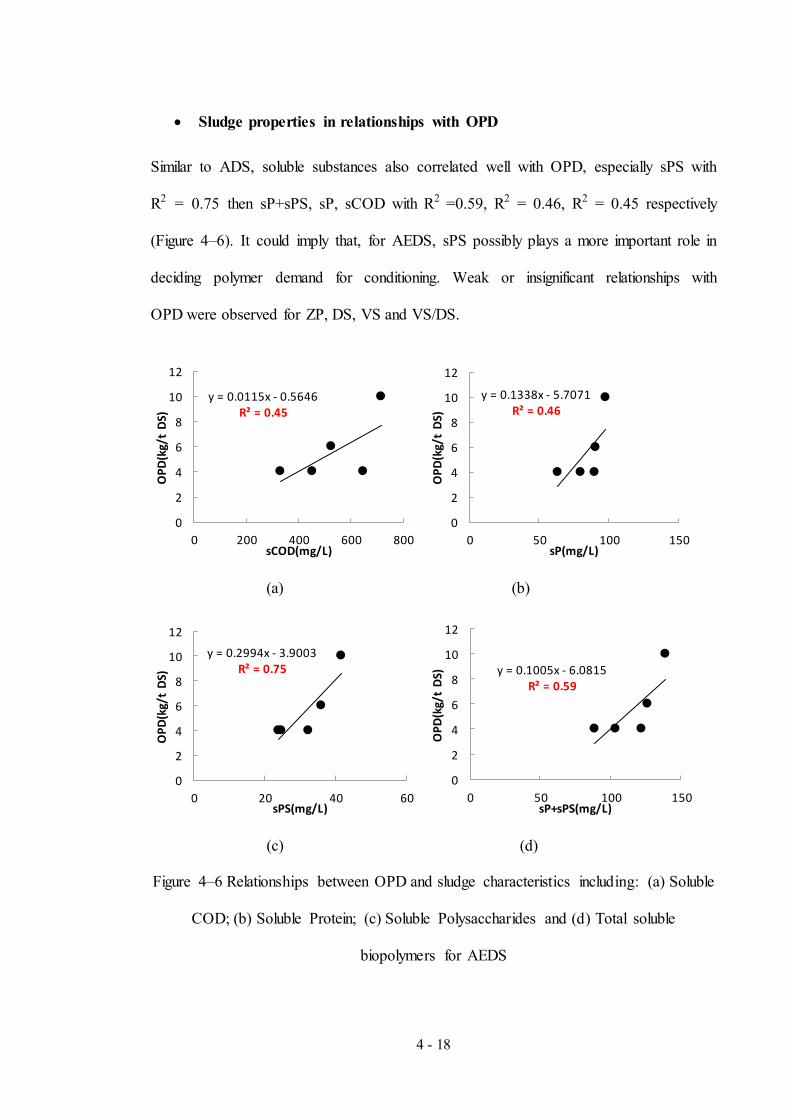
4 - 18
Sludge properties in relationships with OPD
Similar to ADS, soluble substances also correlated well with OPD, especially sPS with
R2 = 0.75 then sP+sPS, sP, sCOD with R2 =0.59, R2 = 0.46, R2 = 0.45 respectively
(Figure 4–6). It could imply that, for AEDS, sPS possibly plays a more important role in
deciding polymer demand for conditioning. Weak or insignificant relationships with
OPD were observed for ZP, DS, VS and VS/DS.
(a) (b)
(c) (d)
Figure 4–6 Relationships between OPD and sludge characteristics including: (a) Soluble
COD; (b) Soluble Protein; (c) Soluble Polysaccharides and (d) Total soluble
biopolymers for AEDS
y = 0.0115x - 0.5646 R² = 0.45
0
2
4
6
8
10
12
0 200 400 600 800
OPD
(kg/
t DS
)
sCOD(mg/L)
y = 0.1338x - 5.7071 R² = 0.46
0
2
4
6
8
10
12
0 50 100 150
OPD
(kg/
t DS
)
sP(mg/L)
y = 0.2994x - 3.9003 R² = 0.75
0
2
4
6
8
10
12
0 20 40 60
OPD
(kg/
t DS
)
sPS(mg/L)
y = 0.1005x - 6.0815 R² = 0.59
0
2
4
6
8
10
12
0 50 100 150
OPD
(kg/
t DS
)
sP+sPS(mg/L)
4 - 19
4.2.1.1.3. WAS
Sludge properties in relationships with CST
Unlike ADS and AEDS, DS and VS of WAS produced better relationships with CST,
with R2 = 0.33 and R2 = 0.53 respectively. sCOD, sP, sP+sPS and sP/sPS were related
weakly with CST while no relationship was noticed with the other parameters.
Sludge properties in relationships with OPD
In contrast with AEDS, sP of WAS seemed to play a more important role in estimating
OPD (with R2 = 0.84) than sPS (with R2 = 0.36) (Figure 4–7). sCOD and total soluble
biopolymers also correlate well with OPD, with R2 = 0.78 and R2 =0.69 respectively
(Figure 4–7). Not much correlation with OPD has been observed for DS, VS VS/DS
and ZP of WAS.

4 - 20
(a) (b)
(c) (d)
Figure 4–7 Relationships between OPD and sludge characteristics including: (a) Soluble
COD; (b) Soluble Protein; (c) Soluble Polysaccharides and (d) Total soluble
biopolymers for WAS
4.2.1.2. For all sludge types
While soluble biopolymer were denoted to have insignificant relationship with CST for
each sludge type individually, better correlations was observed between soluble
biopolymers and CST when taking all sludge types together into consideration (R2 =
0.79 for sP, R2 = 0.73 for sPS and R2 =0.77 for sP+sPS). ZP was also correlated well
with CST, with R2 = 0.72. Results are shown in Figure 4–8.
y = 0.0021x + 2.3578 R² = 0.78
0
1
2
3
4
5
0 200 400 600 800 1000
OPD
(kg/
t DS
)
sCOD(mg/L)
y = 0.0551x + 0.1574 R² = 0.84
0
1
2
3
4
5
6
7
0 50 100 150
OPD
(kg/
t DS
)
sP(mg/L)
y = 0.0451x + 2.5078 R² = 0.36
0
1
2
3
4
5
6
7
0 20 40 60
OPD
(kg/
t DS
)
sPS(mg/L)
y = 0.0296x + 0.951 R² = 0.69
0
1
2
3
4
5
6
7
0 50 100 150 200
OPD
(kg/
t DS
)
sP+sPS(mg/L)

4 - 21
(a) (b)
(c)
Figure 4–8 Relationships between CST and sludge characteristics including: (a) Soluble
Protein; (b) Soluble Polysaccharides and (c) Total soluble biopolymers for all sludge
types
Strong correlations between soluble biopolymers (alone and together) and sCOD with
OPD were also noticed for all sludge types (Figure 4–9), which confirms that soluble
biocolloids create additional polymer demand.
y = 6.1117x - 177.97 R² = 0.79
0
500
1000
1500
2000
2500
0 100 200 300 400
CST(
s)
sP(mg/L)
y = 24.539x - 515.44 R² = 0.73
0
500
1000
1500
2000
0 20 40 60 80 100
CST(
s)
sPS(mg/L)
y = 5.1252x - 275.14 R² = 0.77
0
500
1000
1500
2000
2500
0 100 200 300 400 500
CST(
s)
sP+sPS(mg/L)

4 - 22
(a) (b)
(c) (d)
Figure 4–9 Relationships between OPD and sludge characteristics including: (a) Soluble
COD; (b) Soluble Protein; (c) Soluble Polysaccharides and (d) Total soluble
biopolymers for all sludge types
Table 4–4 summarizes the correlation coefficients (R2) of sludge characteristics with
sludge conditioning and dewaterability for each as well as all sludge types of the 3
WWTPs studied. In general, most of good relationships were noticed with ADS
compared to the other 2 sludge types. The most noticeable feature was that good
correlations were witnessed between soluble biopolymers and OPD for both single
sludge type and all sludge types, which highlights the major role of soluble biopolymers
in deciding conditioning polymer demand.
y = 0.0055x + 1.5343 R² = 0.83
0
2
4
6
8
10
0 500 1000 1500
OPD
(kg/
t DS
)
sCOD(mg/L)
y = 0.0192x + 2.6487 R² = 0.90
0
2
4
6
8
10
12
0 100 200 300 400
OPD
(kg/
t DS
)
sP(mg/L)
y = 0.0755x + 1.711 R² = 0.81
0
2
4
6
8
10
0 20 40 60 80 100
OPD
(kg/
t DS
)
sPS(mg/L)
y = 0.016x + 2.3662 R² = 0.90
0
2
4
6
8
10
12
0 200 400 600
OPD
(kg/
t DS
)
sP+sPS(mg/L)

4 - 23
Table 4–4 Relationships (R2) of sludge characteristics with OPD and CST for ADS, AEDS, WAS and all sludge types
Sludge types ZP DS VS VS/DS sCOD sP sPS sP+sPS sP/sPS
ADS CST -0.25 0.00 +0.02 +0.01 +0.36 +0.49 +0.63 +0.46 +0.22
OPD -0.19 0.00 +0.20 +0.06 +0.90 +0.95 +0.97 +0.92 +0.81
AEDS CST -0.15 0.00 -0.03 -0.81 +0.05 +0.11 +0.01 +0.02 +0.07
OPD -0.12 -0.06 -0.01 +0.20 +0.45 +0.46 +0.75 0.59 -0.41
WAS CST +0.04 +0.33 +0.53 +0.14 +0.33 +0.43 +0.01 +0.26 +0.24
OPD -0.04 +0.12 +0.25 0.00 +0.78 +0.84 +0.36 +0.69 -0.03
All sludge types CST -0.72 -0.03 -0.11 -0.31 +0.55 +0.79 +0.73 +0.77 +0.29
OPD -0.64 -0.09 -0.22 -0.26 +0.83 +0.90 +0.81 +0.90 +0.32
‘ – ‘: negative linear; ‘ + ’: positive linear

4 - 24
4.2.1.3. Soluble COD as a surrogate measure of soluble biopolymers
Since soluble protein and polysaccharides analyses are not typically used for field
measurements due to the specific equipment and reagents requirements, soluble COD
could be used as a representative surrogate parameter because of its frequent use in
many treatment facilities (Higgins et al. 2006).
Table 4–5 presents strong relationships between sCOD and soluble biopolymers both
individually and altogether (except for sP/sPS) for each and all sludge types. However,
as can be observed from table 4–4, in all cases, soluble COD did not correlate with OPD
as well as biopolymers, which was not in agreement with previous report of (Higgins et
al. 2006). Therefore, it is not convincing to use sCOD as a surrogate simple measure of
biocolloid concentration.
Table 4–5 Relationships (R2) of sCOD with soluble biopolymers for ADS, AEDS, WAS
and all sludge types
(All relationships were positive linear)
4.2.2. Selection of appropriate polymer type for an effective sludge dewatering
Selection of appropriate polymer types and demand for effective sludge conditioning
and dewatering is a function of three main factors which are sludge types, polymer
properties and dewatering equipment. Previous parts focused mainly on sludge types in
relationships with conditioning. However, polymer properties such as charge density,
configuration and molecular weight also have significant impact on OPD. The study
ADS AEDS WAS All sludge types
sP 0.81 0.88 0.75 0.75
sPS 0.83 0.71 0.60 0.70
sP/sPS 0.78 0.00 0.00 0.27
sP+sPS 0.83 0.88 0.74 0.77

4 - 25
have developed a method that has ability to determine appropriate polymer type and
dose for an effective dewatering using relationship graphs of sludge properties and
OPD. Here, soluble biopolymers were representative for sludge characteristics since
they were demonstrated to correlate well with OPD in the earlier parts. Then effects of
these polymers on dewatering performance were evaluated through shear sensitivity
tests of conditioned sludge, which considers the influence of shear created by
dewatering devices on OPD. ADS and WAS were chosen to test the method since they
are 2 common sludge types at the WWTPs.
Charge neutralization and polymer bridging are two main mechanisms of sludge
conditioning. In fact, there is one process among two that predominantly governs the
flocculation and it depends on both sludge characteristics and polymers types used. A
concept of ‘y – intercept’ in the OPD versus soluble biopolymer content curve (Figure
4–10) proposed by Higgins et al. (2006) is believed to identify PD for both charge
neutralization and bridging formation in sludge conditioning. The concept was based on
the relationship between OPD and soluble biopolymers (total sP and sPS) which were
demonstrated to have major role in deciding conditioning PD. As can be seen in Figure
4–10, the y – intercept for the graph is about 2kg/t DS. It suggests that this amount of
polymer was not used for charge neutralization since this case presents no soluble
biocolloids. Therefore, 2kg/t DS can be thought of as the polymer used for bridging
formation and the rest of OPD was utilized to neutralize surface charge. Comparing
these two polymer quantity can decide which mechanism is predominant. For ADS, PD
for charge neutralization was superior compared to polymer bridging, as a result, the
former prevailed in flocculation. By contrast, WAS conditioning was governed by
bridging phenomena since PD for this process was dominant.

4 - 26
Figure 4–10 Conditioning mechanisms based on relationships between OPD and soluble
biopolymer content of ADS and WAS.
Besides interactions between sludge particles and polymers during conditioning,
response of both sludge and polymers to shear during dewatering is necessary to
optimize sludge conditioning and dewatering. Higgins et al. (2006) carried out a set of
experiments to examine the response to shear of different sludge types and concluded
that WAS is the most sensitive and ADS is the least sensitive to shear. It means WAS
flocs are easy to be broken during high speed dewatering while ADS has more inherent
floc strength to withstand the shear.
Conditioning polymers are available in different types of charge density, molecular
weight and structure, which interact differently with sludge particles during
conditioning. Since cationic polymers with high and very high molecular weight are
most widely used for conditioning of wastewater sludge (Spinosa & Vesilind 2001), the
other two characteristics are of more concern for flocculation. As discussed in the last
section, ADS conditioning is mainly controlled by charge neutralization, as a result,
polymers with high charge density or mole charge could favour this process. On the
y = 0.0166x + 2.1
0
2
4
6
8
10
12
0 100 200 300 400 500
OPD
(kg/
t DS)
sP+sPS(mg/L)
Charge neutralization
Bridging formation y - intercept
ADS
WAS

4 - 27
other hand, delicate WAS flocs require structured polymers such as branched or cross–
linked polymers to ‘embrace’ tightly or incorporate these sludge flocs into the larger
ones through bridging formation mechanism.
According to the above results, not only OPD but also suitable polymer types could be
predicted for an effective sludge conditioning. Conceptually, this study suggests the use
of high mole charge and branched cationic polymers for better ADS and WAS
conditioning and dewatering, respectively. Effects of these polymers on dewatering
performance were evaluated through shear sensitivity tests of conditioned sludge. This
paper only presents the experiment results of ADS.
Figure 4–11 Relationships between OPD and shear intensity (Gt) for ADS conditioned
with zetag8165 and zetag8180
The above suggestion of polymer type for conditioning was only based on relationship
between sludge and polymer properties, which has not taken the effect of dewatering
equipment into account. The shear sensitivity test examines the response of polymer to
shear. Effect of shear intensity (Gt), which represents the dewatering stress, on cake
solids content of ADS is shown in Figure 4–11. Two linear, high molecular weight
y = 6E-05x + 7.5
y = 4E-05x + 7.6
4
6
8
10
12
14
16
0 30000 60000 90000 120000 150000
OPD
(kg/
t DS)
Gt
Zetag8165
zetag8180
Bridging formation
Charge neutralization y - intercept
4 - 28
cationic polymers with different mole charge (zetag8165 with 60% mole charge and
zetag8180 with 80% mole charge) were tested to elucidate their impacts on OPD.
Similar trends were observed for both polymers with OPD increasing with higher Gt
values. The additional PD could be used for preventing flocs from breakup when
exposing to high shear.
In contrast with the last section, y – intercept in the OPD – shear intensity relationship
indicates the PD needed to neutralize biocolloidal particles at ‘zero’ shear. Figure 4–11
illustrates that higher mixing intensity or Gt values resulted in higher OPD for ADS
conditioning and the additional PD can be considered as demand for bridging formation
among broken flocs during shear.
Besides the y – intercept, slopes of OPD – shear intensity relationships were also
considered for the purpose of comparing the effects of 2 different types of cationic
polymers, in terms of mole charge, on ADS conditioning and dewatering. The y –
intercepts of the 2 polymers were similar (about 7.5kg/t DS – Figure 4–11) whilst the
slope of higher mole charge polymer was less than that of the lower one. This implies a
lower OPD as well as higher resistance to shear of ADS when conditioning with the
higher mole charge polymer.
4.3. Conditioning tests – Determination of optimal conditioning regimes
4.3.1. Determination of optimal mixing intensity
In order to identify the OPD for a specific sludge, it is necessary to determine the
optimal mixing speed and mixing time for conditioning of each sludge type. This study,
bench–scale experiments were carried out by varying mixing speed (100 – 500rpm) and
time (30 – 300s) to determine the most appropriate regimes. Digested sludge from 3

4 - 29
WWTPs were conditioned with currently used polymer types and doses at these
WWTPs. CST tests were used to determine the OPD in each case and the mixing speed
and time that resulted in minimum values of CST were considered as optimal. Table 4–
6 presents the suitable conditioning regime for 3 WWTPs studied.
Table 4–6 Optimal mixing intensity for conditioning of ADS, AEDS and WAS
Sludge types Optimal mixing speed
(rpm)
Optimal mixing time
(s)
ADS 200 60
AEDS 400 60
WAS 400 60
It should be noted that these mixing conditions were tested using lab–scale tests only. In
fact, mixing process at the plants occurs within a short time (even a few seconds such as
Quakers Hill WWTP) at a high mixing speed (more than 3500 rpm). It was observed
from the experiment that high mixing speed could easily break the sludge flocs formed
during conditioning which resulted in dark centrate. On the other hand, short mixing
time, less than 60s, would not be enough for an effective flocculation and consequently
resulting in bad dewatering performance. Similar to previous researches, here Gt value
has been used to measure the shear exerted on sludge floc during mixing.
4.3.2. Determination of optimal polymer demand (OPD)
CST tests and charge neutralization have been commonly applied for OPD
determination in many studies by virtue of their simple and rapid measurement. The
present study also utilized these tests to identify the OPD for each sludge type. Results
show that OPD values determined by CST tests were much lower (up to 50%) while ZP
indicated much higher doses than PD used at the WWTPs, which were seen for all 3
sludge types.
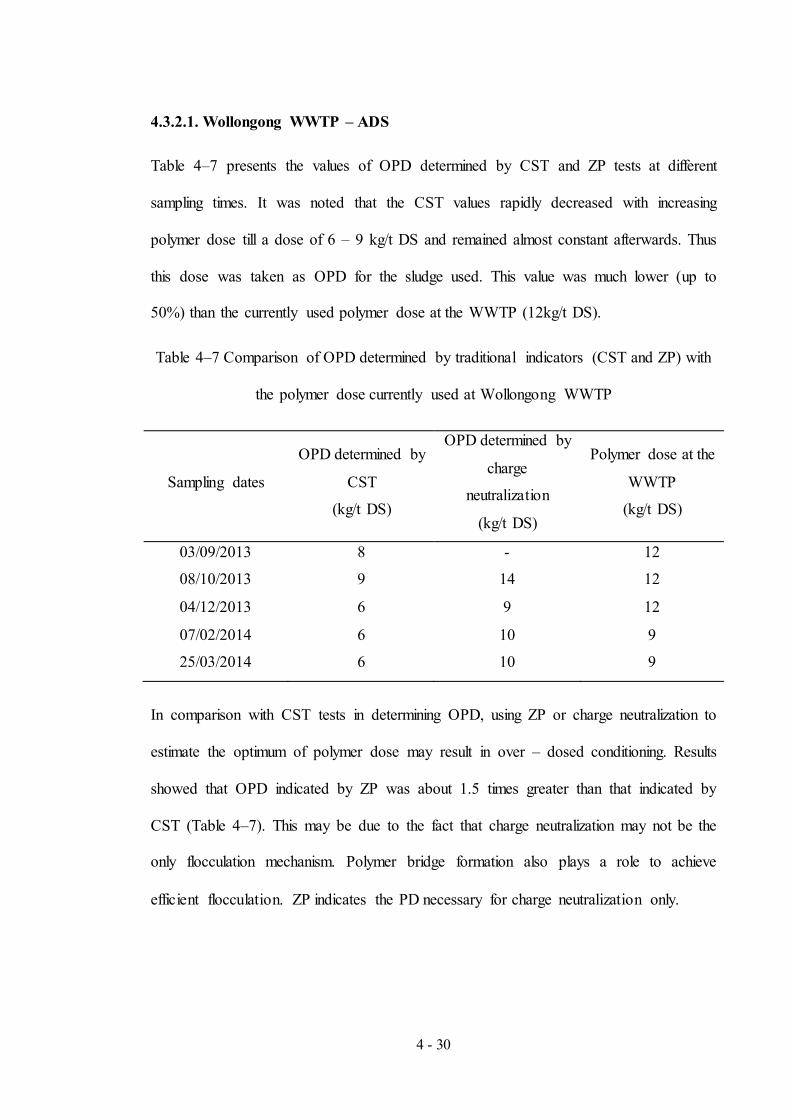
4 - 30
4.3.2.1. Wollongong WWTP – ADS
Table 4–7 presents the values of OPD determined by CST and ZP tests at different
sampling times. It was noted that the CST values rapidly decreased with increasing
polymer dose till a dose of 6 – 9 kg/t DS and remained almost constant afterwards. Thus
this dose was taken as OPD for the sludge used. This value was much lower (up to
50%) than the currently used polymer dose at the WWTP (12kg/t DS).
Table 4–7 Comparison of OPD determined by traditional indicators (CST and ZP) with
the polymer dose currently used at Wollongong WWTP
Sampling dates
OPD determined by
CST
(kg/t DS)
OPD determined by
charge
neutralization
(kg/t DS)
Polymer dose at the
WWTP
(kg/t DS)
03/09/2013 8 - 12
08/10/2013 9 14 12
04/12/2013 6 9 12
07/02/2014 6 10 9
25/03/2014 6 10 9
In comparison with CST tests in determining OPD, using ZP or charge neutralization to
estimate the optimum of polymer dose may result in over – dosed conditioning. Results
showed that OPD indicated by ZP was about 1.5 times greater than that indicated by
CST (Table 4–7). This may be due to the fact that charge neutralization may not be the
only flocculation mechanism. Polymer bridge formation also plays a role to achieve
efficient flocculation. ZP indicates the PD necessary for charge neutralization only.

4 - 31
4.3.2.2. St. Marys WWTP – AEDS
OPD necessary for conditioning of AEDS was 4 – 6kg/t DS which again was lower than
the current PD being used at St. Marys WWTP (9 – 10kg/t DS) (Table 4–8). The trend
of CST reduction was similar to the case of Wollongong WWTP.
Table 4–8 Comparison of OPD determined by traditional indicators (CST and ZP) with
the polymer dose currently used at St. Marys WWTP
Sampling dates OPD determined by
CST
(kg/t DS)
OPD determined by
charge
neutralization
(kg/t DS)
Polymer dose at the
WWTP
(kg/t DS)
20/11/2013 4 12 9
03/03/2014 6 12 10
22/05/2014 6 - 10
24/06/2014 6 - 10
Unlike the other 2 plants, St. Marys WWTP utilizes belt filter press for sludge
dewatering. As a result, centrate quality was never their major problem thanks to the
operation of filter press. However, dewatered cake with high moisture content has been
a big issue in this plant. A highly compressible sludge floc was observed after polymer
conditioning, especially in the case of over – dosed conditioning. During dewatering by
pressure filtration, cake blinding may occur and reduce the cake porosity as well as
increases the cake specific resistance, which in turn deteriorates sludge filterability (Qi
et al. 2011). The present study also suggested 2 solutions that may help increase cake
solids content for St. Marys WWTP:
- Replacing belt filter presses with high–speed centrifuges.
- Using skeleton builder aids that can assist filtration of digested sludge (such as
lignite, fly ash, lime, iron chloride, etc.) for sludge conditioning.

4 - 32
4.3.2.3. Quakers Hill WWTP – WAS
Results from Table 4–9 illustrate that the range of OPD for WAS conditioning were
typically 3 – 4kg/t DS (except for the last sampling) which was the lowest among 3
sludge types studied. This support our prediction earlier that the polymer amount used
for WAS conditioning may be smaller than that used for ADS and AEDS conditioning.
This OPD range was also lower than the currently used polymer doses (6 – 8kg/t DS) at
the plant. The operators at Quakers Hill WWTP add more conditioning polymer to
improve centrate quality. However, lab–scale experiments show that over–dosed
conditioning could bring about adverse effect on sludge dewaterability.
Table 4–9 Comparison of OPD determined by traditional indicators (CST and ZP) with
the polymer dose currently used at Quakers Hill WWTP
Sampling dates
OPD determined by
CST
(kg/t DS)
OPD determined by
charge
neutralization
(kg/t DS)
Polymer dose at the
WWTP
(kg/t DS)
20/11/2013 3 7.5 8
17/12/2013 4 5 8
03/03/2013 4 7 6
24/06/2014 4 - 8.5
28/07/2014 6 - 7
Figure 4–12 presents results of CST tests for WAS conditioning. It can be noticed that
CST reduced with the increase in PD (up to a dose of 4kg/t DS). However, when PD
was increased to more than 4kg/t DS, the CST values started to rise again. This may be
due to the absorption of water molecules onto the excess polymer particles, which
prevented moisture coming out of sludge (Chu & Lee 1999). Besides, these excess

4 - 33
amounts of polymer also lead to charge reversal phenomenon, causing disaggregation
and redispersion of the sludge flocs (Sanin et al. 2011).
Figure 4–12 OPD determination by CST tests for WAS conditioning
However, the major difference in a full–scale centrifuge from CST tests is the applied
shear during dewatering, which creates more polymer demand. It is also understandable
that the plant operators tend to add extra polymer to ensure that the solids capture is
maximized. Hence, there would always be more than what “theoretically” is needed.
Therefore, these results do not guarantee that these lower doses could work in the field.
In this case, MCI tests, which can reproduce the centrifuge stresses exerting the sludge
flocs or cake, could tackle this problem.
4.4. Modified centrifugal index (MCI)
4.4.1. Effects of centrifugal intensity (gt) on solids cake content
The MCI measurement (more representatives to field condition) was used to measure
the dewatering efficiency and OPD. The original concept of MCI test is the application
0
20
40
60
80
100
120
0 2 4 6 8 10 12 14
CST
(s)
Polymer dose (kg/t DS)
20/11/201317/12/20133/03/2014
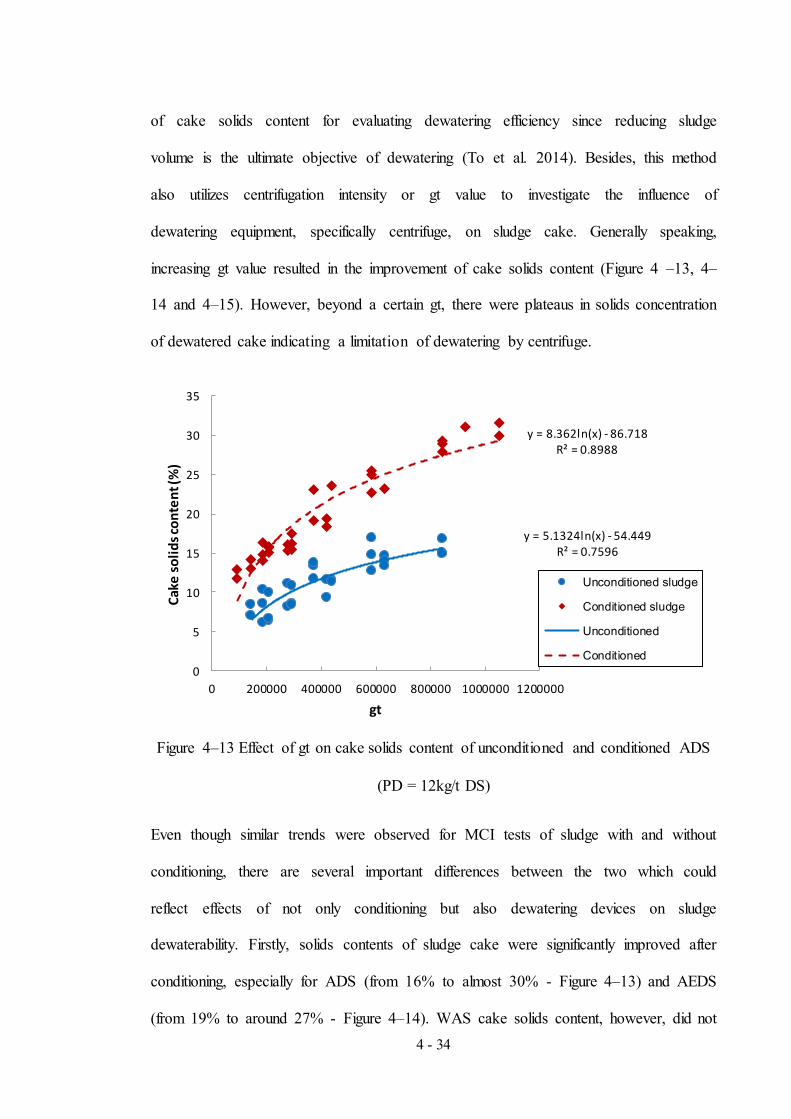
4 - 34
of cake solids content for evaluating dewatering efficiency since reducing sludge
volume is the ultimate objective of dewatering (To et al. 2014). Besides, this method
also utilizes centrifugation intensity or gt value to investigate the influence of
dewatering equipment, specifically centrifuge, on sludge cake. Generally speaking,
increasing gt value resulted in the improvement of cake solids content (Figure 4 –13, 4–
14 and 4–15). However, beyond a certain gt, there were plateaus in solids concentration
of dewatered cake indicating a limitation of dewatering by centrifuge.
Figure 4–13 Effect of gt on cake solids content of unconditioned and conditioned ADS
(PD = 12kg/t DS)
Even though similar trends were observed for MCI tests of sludge with and without
conditioning, there are several important differences between the two which could
reflect effects of not only conditioning but also dewatering devices on sludge
dewaterability. Firstly, solids contents of sludge cake were significantly improved after
conditioning, especially for ADS (from 16% to almost 30% - Figure 4–13) and AEDS
(from 19% to around 27% - Figure 4–14). WAS cake solids content, however, did not
y = 5.1324ln(x) - 54.449 R² = 0.7596
y = 8.362ln(x) - 86.718 R² = 0.8988
0
5
10
15
20
25
30
35
0 200000 400000 600000 800000 1000000 1200000
Cake
solid
s con
tent
(%)
gt
Unconditioned sludge
Conditioned sludge
Unconditioned
Conditioned

4 - 35
change that much with conditioning (only from 19% to 23% - Figure 4–15) despite of
that all characteristics of this sludge type favour its dewaterability.
Figure 4–14 Effect of gt on cake solids content of unconditioned and conditioned (PD =
10kg/t DS) AEDS
Secondly, same cake solids content of unconditioned sludge can be obtained at much
lower centrifugation intensity for conditioned one, which implies that dewatering rate
was considerably enhanced by conditioning treatment. For instance, 16% of ADS could
be achieved at 200000 of gt after conditioning instead of 800000 of gt (Figure 4–13)
before conditioning. This reduction in centrifugation intensity could suggest an energy–
saving solution for dewatering equipment. Thus, MCI test can be successfully used to
determine the optimum gt value of the centrifuge corresponding to the maximum cake
solids content.
y = 4.2786ln(x) - 39.84 R² = 0.7908
y = 5.9729ln(x) - 55.887 R² = 0.815
0
5
10
15
20
25
30
35
0 200000 400000 600000 800000 1000000
Cake
solid
s con
tent
(%)
gt
Unconditioned sludge
Conditioned sludge
Unconditioned
Conditioned
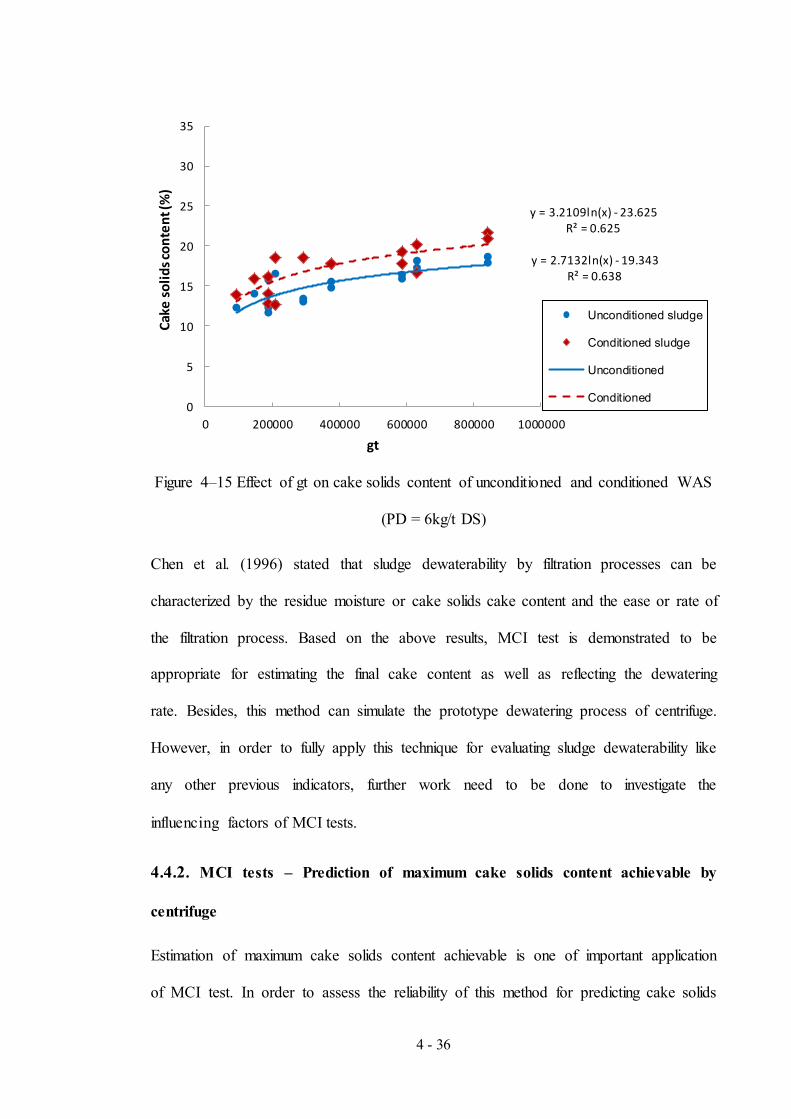
4 - 36
Figure 4–15 Effect of gt on cake solids content of unconditioned and conditioned WAS
(PD = 6kg/t DS)
Chen et al. (1996) stated that sludge dewaterability by filtration processes can be
characterized by the residue moisture or cake solids cake content and the ease or rate of
the filtration process. Based on the above results, MCI test is demonstrated to be
appropriate for estimating the final cake content as well as reflecting the dewatering
rate. Besides, this method can simulate the prototype dewatering process of centrifuge.
However, in order to fully apply this technique for evaluating sludge dewaterability like
any other previous indicators, further work need to be done to investigate the
influencing factors of MCI tests.
4.4.2. MCI tests – Prediction of maximum cake solids content achievable by
centrifuge
Estimation of maximum cake solids content achievable is one of important application
of MCI test. In order to assess the reliability of this method for predicting cake solids
y = 2.7132ln(x) - 19.343 R² = 0.638
y = 3.2109ln(x) - 23.625 R² = 0.625
0
5
10
15
20
25
30
35
0 200000 400000 600000 800000 1000000
Cake
solid
s con
tent
(%)
gt
Unconditioned sludge
Conditioned sludge
Unconditioned
Conditioned

4 - 37
content, this study compared results of MCI with full–scale tests. As observed from
Table 4–10, after conditioning with the same PD used at the WWTPs, maximum cake
solids content of ADS and WAS determined by MCI tests were quite similar to the
typical solids content of cake in those plants. However, the cake solis content of AEDS
was much higher than full–scale results.
Table 4–10 Maximum cake solids content determined by MCI tests and full–scale
processes for 3 sludge types
Sludge types
Maximum cake solids determined
by MCI tests (after conditioninga)
(%)
Typical cake solids at the
WWTPs
(%)
ADS 28.9 ± 0.9 27 – 29
AEDS 26.2b ± 1.1 15 – 19c
WAS 22.6 ± 0.6 19 – 22
a After conditioning at PD used at the WWTPs b Cake solids achievable by lab – scale centrifuge c Cake solids achievable by full – scale belt press
To explain this difference, it should be noted that Wollongong (ADS) and Quakers Hill
(WAS) WWTPs are applying high–solids bowl centrifuges for sludge dewatering while
St. Marys (AEDS) WWTP is using belt filter press (Table 3–1). This could be the
reason for the lower dewatering efficiency at St. Marys WWTP since belt press is
proved to be not effective in sludge dewatering as centrifuge. It also suggests that
centrifuge may be a preferred option for this plant compared to belt press. In case of
WAS, dewatering performance is not effective (only 15 – 19%) even though high–speed
centrifuges have been used to dewater sludge. It could be due to the sludge itself that
leads to poor dewaterability and, as stated in the last section, digestion is perhaps a
solution for this obstacle.
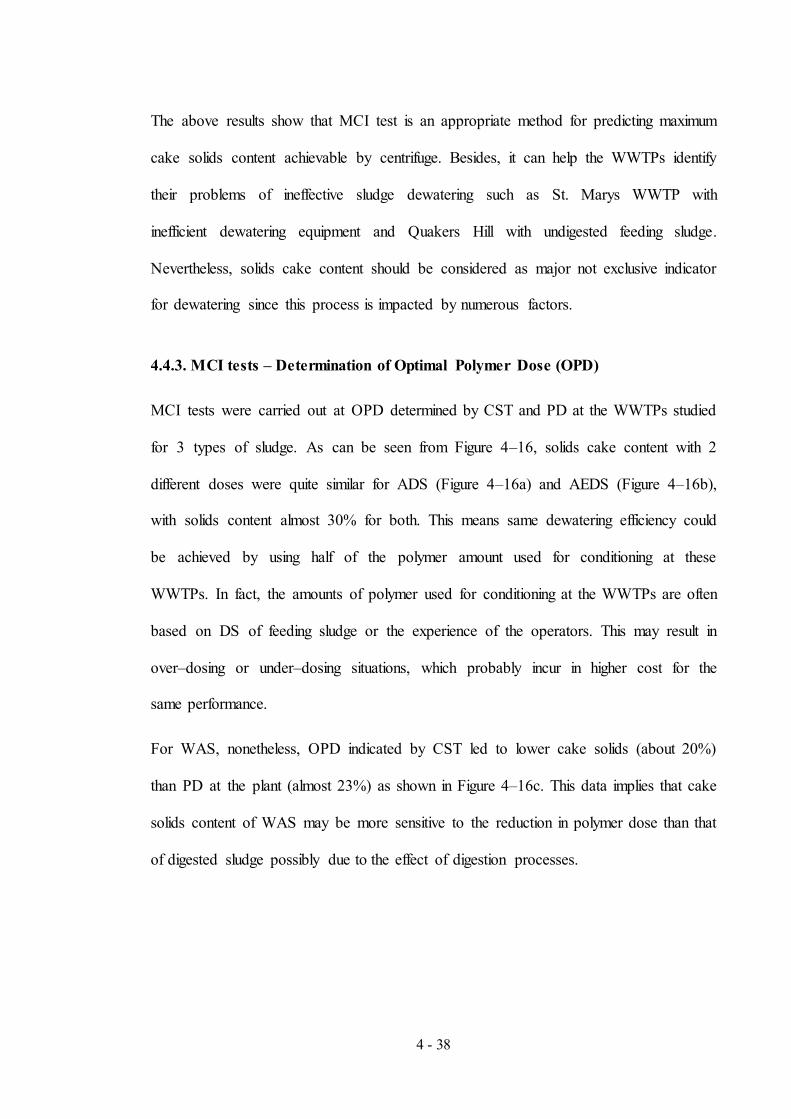
4 - 38
The above results show that MCI test is an appropriate method for predicting maximum
cake solids content achievable by centrifuge. Besides, it can help the WWTPs identify
their problems of ineffective sludge dewatering such as St. Marys WWTP with
inefficient dewatering equipment and Quakers Hill with undigested feeding sludge.
Nevertheless, solids cake content should be considered as major not exclusive indicator
for dewatering since this process is impacted by numerous factors.
4.4.3. MCI tests – Determination of Optimal Polymer Dose (OPD)
MCI tests were carried out at OPD determined by CST and PD at the WWTPs studied
for 3 types of sludge. As can be seen from Figure 4–16, solids cake content with 2
different doses were quite similar for ADS (Figure 4–16a) and AEDS (Figure 4–16b),
with solids content almost 30% for both. This means same dewatering efficiency could
be achieved by using half of the polymer amount used for conditioning at these
WWTPs. In fact, the amounts of polymer used for conditioning at the WWTPs are often
based on DS of feeding sludge or the experience of the operators. This may result in
over–dosing or under–dosing situations, which probably incur in higher cost for the
same performance.
For WAS, nonetheless, OPD indicated by CST led to lower cake solids (about 20%)
than PD at the plant (almost 23%) as shown in Figure 4–16c. This data implies that cake
solids content of WAS may be more sensitive to the reduction in polymer dose than that
of digested sludge possibly due to the effect of digestion processes.

4 - 39
(a)
(b)
(c)
Figure 4–16 Cake solids content of conditioned (a) ADS; (b) AEDS and (c) WAS at
different polymer dosages
5
10
15
20
25
30
35
0 200000 400000 600000 800000 1000000
Cake
solid
s con
tent
(%)
gt
12kg/tDS 6kg/tDS12kg/tDS 6kg/tDS
0
5
10
15
20
25
30
35
0 200000 400000 600000 800000 1000000
Cake
solid
s con
tent
(%)
gt
10kg/tDS 6kg/tDS
10kg/tDS 6kg/tDS
5
10
15
20
25
30
0 100000 200000 300000 400000 500000 600000
Cake
solid
s con
tent
(%)
gt
6kg/tDS 4kg/tDS
6kg/tDS 4kg/tDS
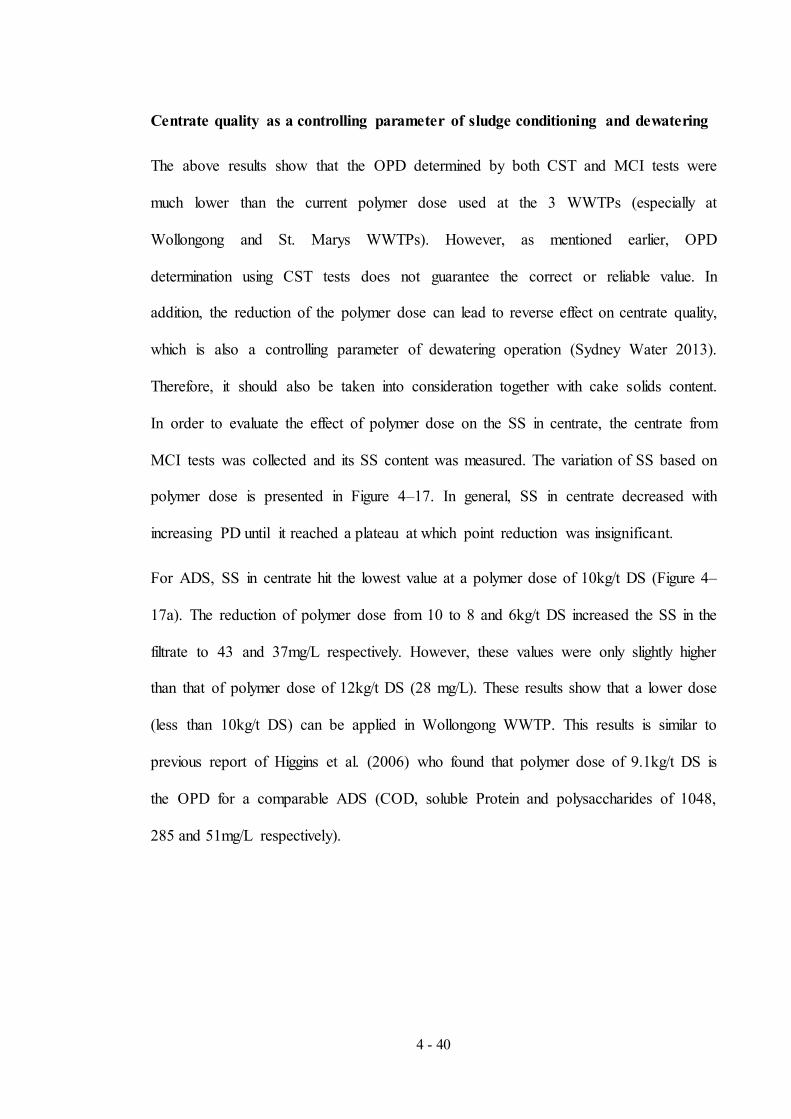
4 - 40
Centrate quality as a controlling parameter of sludge conditioning and dewatering
The above results show that the OPD determined by both CST and MCI tests were
much lower than the current polymer dose used at the 3 WWTPs (especially at
Wollongong and St. Marys WWTPs). However, as mentioned earlier, OPD
determination using CST tests does not guarantee the correct or reliable value. In
addition, the reduction of the polymer dose can lead to reverse effect on centrate quality,
which is also a controlling parameter of dewatering operation (Sydney Water 2013).
Therefore, it should also be taken into consideration together with cake solids content.
In order to evaluate the effect of polymer dose on the SS in centrate, the centrate from
MCI tests was collected and its SS content was measured. The variation of SS based on
polymer dose is presented in Figure 4–17. In general, SS in centrate decreased with
increasing PD until it reached a plateau at which point reduction was insignificant.
For ADS, SS in centrate hit the lowest value at a polymer dose of 10kg/t DS (Figure 4–
17a). The reduction of polymer dose from 10 to 8 and 6kg/t DS increased the SS in the
filtrate to 43 and 37mg/L respectively. However, these values were only slightly higher
than that of polymer dose of 12kg/t DS (28 mg/L). These results show that a lower dose
(less than 10kg/t DS) can be applied in Wollongong WWTP. This results is similar to
previous report of Higgins et al. (2006) who found that polymer dose of 9.1kg/t DS is
the OPD for a comparable ADS (COD, soluble Protein and polysaccharides of 1048,
285 and 51mg/L respectively).

4 - 41
(a)
(b)
(c)
Figure 4–17 Effect of polymer dose on SS in the centrate of the MCI tests for (a) ADS;
(b) AEDS and (c) WAS
0
50
100
150
200
250
0 2 4 6 8 10 12 14 16
SS(m
g/L)
Polymer dose (kg/t DS)
OPD
det
erm
ined
by C
ST
PD a
t the
WW
TP
0
50
100
150
200
0 2 4 6 8 10 12 14
SS (m
g/L)
Polymer dose (kg/t DS)
OPD
det
erm
ined
by C
ST
PD a
t the
WW
TP
0
50
100
150
200
250
0 2 4 6 8 10 12
SS (m
g/L)
Polymer dose (kg/t DS)
OPD
det
erm
ined
by C
ST
PD a
t the
WW
TP
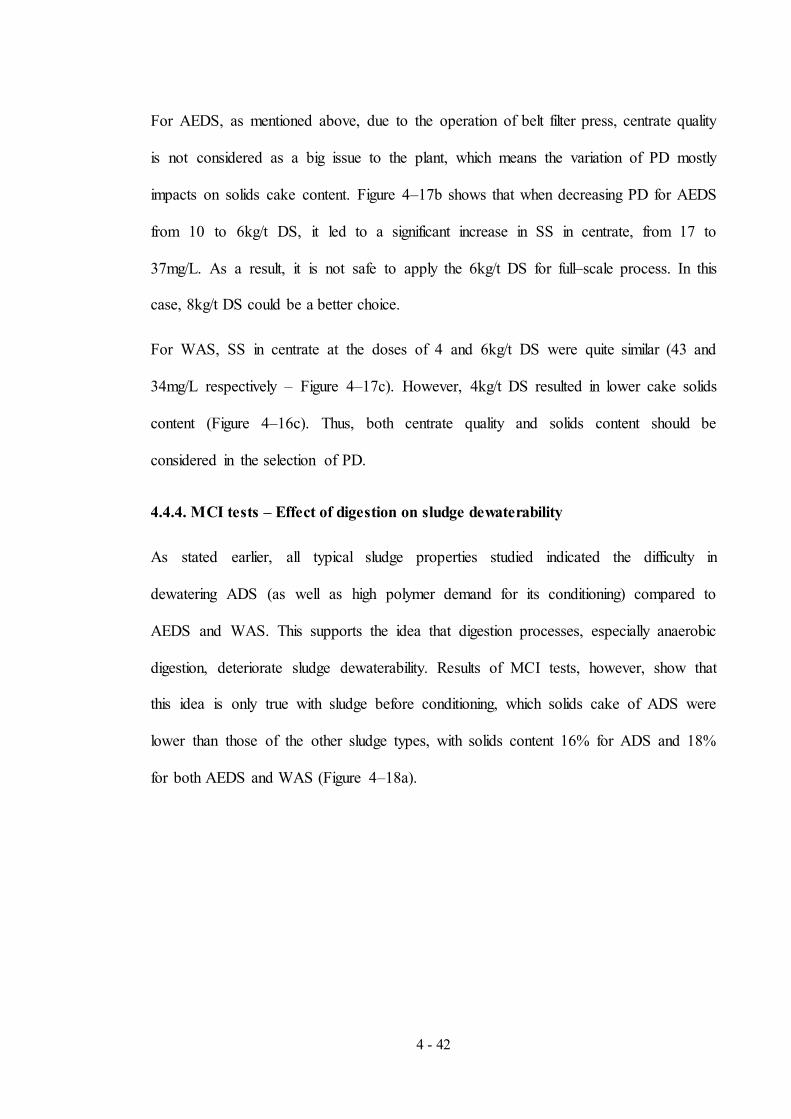
4 - 42
For AEDS, as mentioned above, due to the operation of belt filter press, centrate quality
is not considered as a big issue to the plant, which means the variation of PD mostly
impacts on solids cake content. Figure 4–17b shows that when decreasing PD for AEDS
from 10 to 6kg/t DS, it led to a significant increase in SS in centrate, from 17 to
37mg/L. As a result, it is not safe to apply the 6kg/t DS for full–scale process. In this
case, 8kg/t DS could be a better choice.
For WAS, SS in centrate at the doses of 4 and 6kg/t DS were quite similar (43 and
34mg/L respectively – Figure 4–17c). However, 4kg/t DS resulted in lower cake solids
content (Figure 4–16c). Thus, both centrate quality and solids content should be
considered in the selection of PD.
4.4.4. MCI tests – Effect of digestion on sludge dewaterability
As stated earlier, all typical sludge properties studied indicated the difficulty in
dewatering ADS (as well as high polymer demand for its conditioning) compared to
AEDS and WAS. This supports the idea that digestion processes, especially anaerobic
digestion, deteriorate sludge dewaterability. Results of MCI tests, however, show that
this idea is only true with sludge before conditioning, which solids cake of ADS were
lower than those of the other sludge types, with solids content 16% for ADS and 18%
for both AEDS and WAS (Figure 4–18a).

4 - 43
(a)
(b)
Figure 4–18 Effect digestion on dewaterability (cake solids content) of (a)
unconditioned and (b) conditioned ADS, AEDS and WAS
On the other hand, after conditioning, dewaterability of ADS was the best among all
sludges, with dewatered cake reaching almost 30%, followed by AEDS with 26% and
then WAS with 22% as shown in Figure 4–18b. Digestion may lead to poorer sludge
dewaterability and higher polymer demand, nevertheless, after conditioning, dewatering
0
2
4
6
8
10
12
14
16
18
20
0 200000 400000 600000 800000 1000000
Cake
sol
ids
cont
ent (
%)
gt
WAS ADS AEDS
WAS ADS AEDS
0
5
10
15
20
25
30
35
0 200000 400000 600000 800000 1000000 1200000
Cake
sol
ids
cont
ent (
%)
gt
WAS ADS AEDS
WAS ADS AEDS

4 - 44
of digested sludge was much better than the one without digestion. In other words, pre–
treatment by digestion possibly helps to improve subsequent dewaterability of
conditioned sludge. However, these are only external phenomena, additional studies
should be done to better understand how digestion affects sludge dewaterability. The
present study attributes this phenomenon in terms of soluble biopolymers or
extracellular polymeric substances (also known as bioflocculants). They are released
during digestion processes.
4.5. Other chemical conditioning methods
4.5.1. Dual conditioning
4.5.1.1. Dual polymer conditioning – Cationic/Anionic polymers conditioning
Two different types of anionic polymers were used after the addition of currently used
cationic polymer at the 3 WWTPs to study the effect of dual polymer addition during
conditioning. The selection of anionic polymers was based on their charge density and
molecular weight: one is low in charge, high molecular weight (zetag4110) and the
other is medium to high charge and high molecular weight (zetag4145). The effect of
using dual polymers for conditioning on CST of conditioned sludge is presented in
Table 4–11.
The experimental results demonstrate that, in comparison with the addition of only
cationic polymer, dual addition of anionic and cationic polymers were more effective in
reducing CST (Table 4–11). The anionic polymer Zetag4110 led to a slightly better
result than that with Zetag4145 for all 3 sludge types. This result can be explained by
considering the effect of polymer properties such as charge density and molecular
weight on the interactions between the polymers and particles.

4 - 45
Table 4–11 Effects of dual polymer conditioning on CST values of conditioned sludge
Sludge types Cationic polymer dose
(kg/t DS)
Anionic polymers
Zetag4110 Zetag4145
Dose (kg/t DS) CST (s) Dose (kg/t DS) CST (s)
ADS
0 0 1303 0 1303
12* 0 12 0 12
8 2 16 2 32
6 2 49 2 135
AEDS
0 0 283 0 283
10* 0 13 0 13
6 2 11 2 17
4 2 19 2 34
WAS
0 0 63 0 63
6* 0 31 0 31
4 2 14 2 18
2 2 26 2 35
* Currently used polymer doses at the WWTPs
4 - 46
Molecular weight of a polymer is one of the key parameters significantly impacting on
sludge conditioning. Both charge neutralization and polymer bridging contribute to
better dewatering. In this study, both anionic polymers used were high molecular
weight; hence, the flocculation is governed by polymer bridge formation (Vaxelaire &
Olivier 2006). Additionally, a previous report had shown that lower charge density
polymers use their charge density more efficiently than the ones with higher charge density
due to their better adsorption to the particle surface (Gregory 1993). This could be the
reason that Zetag4110 with lower charge resulted in lower CST values compared to
Zetag4145.
These results support the theory that the use of anionic polymer along with cationic
polymer improves sludge conditioning. Since anionic polymers are often less expensive
than other types (Sanin et al. 2011), reducing cationic polymer demand may help to
minimise the significant cost of the polymer. The polymer cost is almost half of the
sludge dewatering and disposal cost (Vaxelaire & Olivier 2006). Besides its economic
benefits, it is also believed that dual polymer conditioning creates stronger flocs to
better withstand the high shear during centrifuge (Lee & Liu 2001). However,
additional tests, especially full – scale or MCI test, are needed to prove this theory.
Screening tests are also necessary to determine the most suitable anionic polymer type
and dose for a given sludge.
4.5.1.2. Iron/Cationic polymer conditioning
The combinations of inorganic conditioner, which is ferric chloride in this study, and
cationic polymers may utilize the advantage of both flocculants for improving sludge
dewaterability. For instance, inorganic conditioners cannot produce the solid cakes that

4 - 47
are attainable with much lower dosages of polymers; however, they are less sensitive to
changes in dosage than polymers.
Effect of this dual conditioning measured in terms of CST is illustrated in Table 4–12.
Results showed considerable reduction in CST values for all sludge types after the
addition of two conditioners together. This led to decrease in cationic polymer demand
for conditioning compared to the currently used polymer dose at the WWTPs.
Especially for ADS, the dual conditioning helped to significantly reduce the PD from
12kg/t DS to 4kg/t DS (by three times), which may result in substantial saving of
chemical cost for the plant. Whilst, there was a decrease in PD for AEDS and WAS, it
was insignificant compared to ADS.
This dual conditioning should be tried in full – scale in the plants. However, due to the
difficulties in additional installation of chemicals feeding equipment at the plants
studied, it is not feasible to conduct full–scale trials. In this case, MCI tests may be a
good solution to investigate the actual benefit of applying iron along with cationic
polymer for enhancing sludge dewatering efficiency. Another problem with this
conditioning method is the limitation of iron content contained in dewatered cake which
is strictly controlled by local and governmental regulations.

4 - 48
Table 4–12 Effects of Iron/Cationic polymer conditioning on CST values of conditioned sludge
ADS AEDS WAS
FeCl3 (mg/L)
Cationic
polymer
(kg/t DS)
CST (s) FeCl3 (mg/L)
Cationic
polymer
(kg/t DS)
CST (s) FeCl3 (mg/L)
Cationic
polymer
(kg/t DS)
CST (s)
0 0 1246 0 0 283 0 0 63
0 12* 35 0 10* 13 0 6* 31
1 4 26 - - - - - -
3 4 28 - - - - - -
5 4 34 5 8 10 5 4 13
10 4 52 10 8 11 10 4 12
* Currently used polymer dose at the WWTPs

4 - 49
4.5.2. Advanced oxidation (Fenton) conditioning
The effect of Fenton’s reagent on dewaterability of sludge from 3 WWTPs was
evaluated for various Fe2+ and H2O2 dosages, as shown in Table 4–13, in order to
identify the optimal condition. The reduction in CST for all sludge types shows the
positive effect of advanced oxidation treatment of sludge.
In the case of ADS, CST value of oxidized sludge significantly decreased from 1513s to
lower than 100s, but, slightly went up when increasing Fenton’s reagent dosage was
increased. Similar trends were observed for AEDS and WAS. However, since CST
values of these feeding sludges were not high, especially for WAS (CSTfeed = 63s), the
improvement of conditioning method using Fenton oxidation in terms of CST were not
significant.
According to the screening tests, 0.5mmol/L Fe2+ and 50mmol/L H2O2 could be selected
as an optimal dosage for sludge conditioning. However, these doses were observed
based on CST tests. To confirm this finding, MCI test or full–scale trials are needed as
well to elucidate the actual effect of advanced oxidation conditioning method on sludge
dewaterability. Since oxidised sludge is quite toxic and harmful to both equipment and
human health, it is necessary to handle, store and transport this conditioned sludge with
great care.

4 - 50
Table 4–13 Effects of Fenton oxidation conditioning on CST values of conditioned sludge
Fe2+ dose (mmol/L) H2O2 dose (mmol/L) CST (s)
ADS AEDS WAS
0 0 1513 334 63
0.5 10 178 - -
0.5 20 41 - -
0.5 40 45 - -
0.5 50 34 26 34
0.5 150 35 30 29
0.5 250 36 47 31
0.5 400 33 38 43
0.5 600 58 37 44
0.1 50 49 - -
0.3 50 54 - -
0.7 50 53 - -
1 50 55 - -

5 - 1
UNIVERSITY OF TECHNOLOGY, SYDNEY
FACULTY OF ENGINEERING AND IT
CHAPTER 5
CONCLUSION
5 - 2
5.1. Conclusion
5.1.1. Sludge characteristics in relationships with sludge conditioning demand and
dewatering
Most of typical sludge properties such as feeding DS, ZP, CST and soluble substances
(soluble biopolymers and sCOD) indicated that ADS had the poorest dewaterability and
required the highest polymer demand for conditioning compared to the other sludges
studied. On the contrary, WAS requiring the least amount of polymer had the best
dewaterability. These results support the idea that digestions deteriorate sludge
dewatering.
There were good correlations between soluble biopolymers and OPD for both single
sludge type and all sludge types, which highlights the major role of soluble biopolymers
in deciding conditioning polymer demand. Whilst, insignificant relationships were
observed when sludge characteristics were related to CST.
Relationships between OPD and sludge characteristics, especially soluble polymers, and
shear intensity could provide helpful information on selection of suitable polymer types
and dosages for an effective sludge conditioning. Here, this study suggested the use of
high mole charge polymers for better ADS conditioning.
5.1.2. Comparisons of different indicators for sludge conditioning and dewatering
5.1.2.1. Traditionally used indicators
Zeta potential (ZP) could give useful indirect information on determining the polymer
demand based on charge neutralization, which is one of major mechanisms of
flocculation during polymer conditioning. However, the results from the present study
showed that using ZP as an OPD indicator may result in over – dosed conditioning since

5 - 3
effective flocculation could be achieved both by charge neutralization and polymer
bridging formation.
Based on CST test, lower polymer doses were found to be suitable for sludge
conditioning of all three WWTPs studied. This could lead to an implication of reducing
a significant amount of expensive cationic polymers for sludge conditioning at these
plants.
However, the full–scale shear that sludge floc experiences during dewatering may create
more polymer demand. Therefore, the lower dose that indicated by CST test was not
guaranteed to work in the field. In this case, besides full–scale trials, MCI test that can
reproduce the centrifuge stress exerted on sludge cake could tackle this problem.
5.1.2.2. Modified centrifugal index (MCI) – A new centrifuge based laboratory
scale sludge dewatering
Modified centrifugal index (MCI) test can be successfully used to evaluate the
dewaterability of different sludge types with and without conditioning by estimating the
maximum solids cake content achievable by the centrifuge dewatering. The similarity of
cake solids content obtained by centrifuge between MCI test and full–scale results has
strengthened the reliability of the new method. Besides, it is possible to use this
technique for OPD determination when taking both solids cake content and centrate
quality into consideration.
In addition, MCI test showed that the idea about deterioration of dewaterability due to
digestion was only correct in the case of unconditioned sludge. Reversible order of
dewatering efficiency in terms of cake solids content was observed for conditioned
5 - 4
sludge which are ADS > AEDS > WAS could be due to the positive effect of digestion
on sludge conditioning.
5.1.3. Other chemical conditioning methods as promising solutions for saving of
chemical cost
Other chemical conditioning methods, which are dual polymer conditioning, iron/
cationic polymer conditioning and advanced oxidation (Fenton) conditioning, can be
promising solutions to reduce the doses of expensive conditioners. Nevertheless, results
were based on CST test which is often not a reliable indicator for dewatering. As a
result, MCI test or full–scale trials are needed as well to elucidate the actual effect of
these conditioning methods on sludge dewaterability.
5.2. Recommendations
Besides sludge characteristics, polymer properties and dewatering equipment should
also be considered in relationships with sludge conditioning and dewatering in order to
develop comprehensive models of estimating optimal polymer demand as well as
selecting appropriate polymer types for the best conditioning and dewatering.
Although MCI was demonstrated to be a potential efficiency indicator for sludge
dewatering using centrifuge, further studies are necessary to fully understand MCI tests’
influencing factors such as centrifuge speed and time, filter paper pore size and volume
of modified centrifuge tubes.
Methods developed for selection of suitable polymers for effective sludge conditioning
should be tested on different sludge types as well as applied in full–scale trials.
R - 1
REFERENCES
Abu-Orf, M. & Dentel, S. 1999, ‘Rheology as Tool for Polymer Dose Assessment and
Control’, Journal of Environmental Engineering, vol. 125, no. 12, pp.1133-
1141.
Abu-Orf, M. M. & Dentel, S. K. 1997, ‘Effect of mixing on the rheological
characteristics of conditioned sludge: Full-scale studies’, Water Science and
Technology, vol. 36, no. 11, pp. 51-60.
Abu-Orf, M. M. & Dentel, S. K. 1997, ‘Polymer dose assessment using the streaming
current detector’. Water Environment Research, vol. 69, no. 6, pp. 1075-1085.
Agarwal, S., Abu-Orf, M. & Novak, J. T. 2005, ‘Sequential polymer dosing for
effective dewatering of ATAD sludges’, Water Research, vol. 39, no. 7, pp.
1301-1310.
APHA. 1995, Standard Methods for the examination of water and wastewater,
Washington DC.
Australian & New Zealand Biosolids Partnership 2013. Biosolids production in
Australia: the Australian and New Zealand Biosolids Partnership national
survey of biosolids production and end use, Australian Water Association,
Sydney.
Ayol, A., Dentel, S. K. & Filibeli, A. 2005, ‘Dual polymer conditioning of water
treatment residuals’, Journal of Environmental Engineering, vol. 131, no. 8, pp.
1132-1138.
Baskerville, R. & Gale, R. 1968, ‘A simple automatic instrument for determining the
filterability of sewage sludges’, Water Pollution Control, vol. 67, no. 3, pp. 233-
241.
Baskerville, R., Bruce, A. & Day, M. 1978, ‘Laboratory techniques for predicting and
evaluation the performance of a filterbelt press’, Filtration and Separation, pp.
1-5.
R - 2
Böhm, N. & Kulicke, W. M. 1997, ‘Optimization of the use of polyelectrolytes for
dewatering industrial sludges of various origins,’ Colloid and Polymer Science,
vol. 275, no. 1, pp. 73-81.
Bolto, B. & Gregory, J. 2007, ‘Organic polyelectrolytes in water treatment’, Water
Research, vol. 41, no. 11, pp. 2301-2324.
Brooks, R. 1970, ‘Heat treatment of sewage sludge’, Water Pollution Control, vol. 69,
pp. 92-99.
Bruss, J. H., Christensen, J. R. & Rasmussen, H. 1993, ‘Anaerobic storage of activated
sludge: effects on conditioning and dewatering performance’, Water Science and
Technology, vol. 28, no. 1, pp. 109-116.
Bürger, R., Concha, F. & H Karlsen, K. 2001, ‘Phenomenological model of filtration
processes: 1. Cake formation and expression’, Chemical Engineering Science,
vol. 56, no. 15, pp. 4537-4553.
Buyukkamaci, N. 2004, ‘Biological sludge conditioning by Fenton’s reagent’, Process
Biochemistry, vol. 39, no. 11, pp. 1503-1506.
Chen, G., Lin, W. & Lee, D. 1996, ‘Capillary suction time (CST) as a measure of
sludge dewaterability’, Water Science and Technology, vol. 34, no. 3, pp. 443-
448.
Chitikela, S. & Dentel, S. K. 1998, ‘Dual-chemical conditioning and dewatering of
anaerobically digested biosolids: laboratory evaluations’, Water Environment
Research, vol. 70, pp. 1062-1069.
Christensen, G. & Wavro, S. 1981, ‘Some aspects of iron and lime versus
polyelectrolyte sludge conditioning’, The Thirteenth Mid-Atlantic Industrial
Waste Conference, pp. 404-415.
Christensen, G. L. & Dick, R. I. 1987, ‘Closure to “Specific Resistance Measurements:
Nonparabolic Data” by G. Lee Christensen and Richard I. Dick (June, 1985,
Vol. 111, No. 3)’, Journal of Environmental Engineering, vol. 113, no. 3, pp.
661-663.
Chu, C. & Lee, D. 1999,’ Moisture distribution in sludge: Effects of polymer
conditioning’, Journal of Environmental Engineering, vol. 125, no. 4, pp. 340-
345.
R - 3
Chu, C. & Lee, D. 2001, ‘Experimental analysis of centrifugal dewatering process of
polyelectrolyte flocculated waste activated sludge’, Water Research, vol. 35, no.
10, pp. 2377-2384.
Coackley, P. & Jones, B. 1956, ‘Vacuum sludge filtration: I. Interpretation of results by
the concept of specific resistance’, Sewage and Industrial Wastes, pp. 963-976.
Colin, F., Leschber, R. & Mininni, G. 1988, ‘Physical and chemical characterisation of
sewage sludge’, Sewage Sludge Treatment and Use: New Developments,
Technological Aspects and Environmental Effects.
Davis, R. D. & Hall, J. E. 1997, ‘Production, treatment & disposal of wastewater sludge
in Europe from a UK perspective’, European Water Pollution Control, vol. 7,
no. 2, pp. 9-17.
Dentel, S. K. & Dursun, D. 2009, ‘Shear sensitivity of digested sludge: Comparison of
methods and application in conditioning and dewatering’, Water Research, vol.
43, no. 18, pp. 4617-4625.
Dewil, R., Baeyens, J. & Neyens, E. 2005, ‘Fenton peroxidation improves the drying
performance of waste activated sludge’, Journal of Hazardous materials, vol.
117, no. 2, pp. 161-170.
Dubois, M., Gilles, K. A., Hamilton, J. K., Rebers, P. & Smith, F. 1956, ‘Colorimetric
method for determination of sugars and related substances’, Analytical
chemistry, vol. 28, no. 3, pp. 350-356.
Emir, E. & Erdincler, A. 2006, ‘The role of compactibility in liquidsolid separation of
wastewater sludges’, Water Science and Technology, vol.53, no. 7, pp. 121-126.
Emir, E. Ü. 2002, ‘The Role of Dewaterability Measures on the Liquid-solid Separation
of Biological Sludges: Compactibility as a New Measure of Sludge
Dewaterability’,PhD thesis, Bogazici University, Istanbul, Turkey.
Erdincler, A. & Vesilind, P. 2000, ‘Effect of sludge cell disruption on compactibility
ofbiological sludges’, Water Science and Technology, vol. 42, no. 9, pp. 119-
126.
Fan, A., Turro, N. J. & Somasundaran, P. 2000, ‘A study of dual polymer flocculation’,
Colloids and Surfaces A: Physicochemical and Engineering Aspects, vol. 162,
no. 1, pp. 141-148.
R - 4
Feng, X., Deng, J., Lei, H., Bai, T., Fan, Q. & Li, Z. 2009, ‘Dewaterability of waste
activated sludge with ultrasound conditioning’, Bioresource Technology, vol.
100, no. 3, pp. 1074-1081.
Forster, C. & Lewin, D. 1972, ‘Polymer interactions at activated sludge surfaces’,
Effluent and Water treatment journal, vol. 12, no. 10, p. 520.
Glover, S. M., Yan, Y. D., Jameson, G. J. & Biggs, S. 2004, ‘Dewatering properties of
dual-polymer-flocculated systems’, International Journal of Mineral
Processing, vol. 73, no. 2, pp. 145-160.
Gregory, J. 1993, ‘The role of colloid interactions in solid-liquid separation’, Water
Science & Technology, vol. 27, no. 10, pp. 1-17.
Gurjar, B. 2001, Sludge treatment and disposal, AA Balkema.
Heide, B., Kampf, R. & Visser, M. 1982, ‘Manual for the selection and use of
polyelectrolytes in dewatering sludge with beltpresses’, TNO Report E, 124.
Herwijn, A. J., Heij, E. J. L., Ijzermans, J. J., Coumans, W. J. & Kerkhof, P. J. 1995,
‘Determination of specific cake resistance with a new capillary suction time
apparatus’, Industrial and engineering chemistry research, vol. 34, no. 4, pp.
1310-1319.
Heukelekian, H. & Weisberg, E. 1956, ‘Bound water and activated sludge bulking’,
Sewage and Industrial Wastes, pp. 558-574.
Higgins, M. J., Bott, C. & Schauer, P. 2014, ‘Does Bio-P Impact Dewatering after
Anaerobic Digestion?’, Water Environment Federation Annual Conference,
Austin, Texas.
Higgins, M. J., Chen, Y. C. & Murthy, S. N. 2006, Understanding factors affecting
polymer demand for conditioning and dewatering, Water Environment
Research Foundation.
Hou, C. H. & Li, K. C. 2003, ‘Assessment of sludge dewaterability using rheological
properties’, Journal of the Chinese Institute of Engineers, vol. 26, no. 2, pp. 221-
226.

R - 5
Jin, B., Wilén, B. M. & Lant, P. 2004, ‘Impacts of morphological, physical and
chemical properties of sludge flocs on dewaterability of activated sludge’,
Chemical Engineering Journal, vol. 98, no. 1, pp. 115-126.
Karr, P. R. & Keinath, T. M. 1978, ‘Influence of particle size on sludge dewaterability’,
Journal (Water Pollution Control Federation), pp. 1911-1930.
Katsiris, N. & Kouzeli-Katsiri, A. 1987, ‘Bound water content of biological sludges in
relation to filtration and dewatering’, Water Research, vol. 21, no. 11, pp. 1319-
1327.
Laera, G., Pollice, A., Saturno, D., Giordano, C. & Sandulli, R. 2009, ‘Influence of
sludge retention time on biomass characteristics and cleaning requirements in a
membrane bioreactor for municipal wastewater treatment’, Desalination, vol.
236, no. 1, pp. 104-110.
Lawler, D. F., Chung, Y. J., Hwang, S. J. & Hull, B. A. 1986, ‘Anaerobic digestion:
effects on particle size and dewaterability’, Journal (Water Pollution Control
Federation), pp. 1107-1117.
Lee, C. & Liu, J. 2001, ‘Sludge dewaterability and floc structure in dual polymer
conditioning’, Advances in Environmental Research, vol. 5, no. 2, pp. 129-136.
Lee, D. & Hsu, Y. 1994, ‘Use of capillary suction apparatus for estimating the averaged
specific resistance of filtration cake’, Journal of Chemical Technology and
Biotechnology, vol. 59, no. 1, pp. 45-51.
Lee, D. & Wang, C. 2000, ‘Theories of cake filtration and consolidation and
implications to sludge dewatering’, Water Research, vol. 34, no. 1, pp. 1-20.
Liu, H., Yang, J., Zhu, N., Zhang, H., Li, Y., He, S., Yang, C. & Yao, H. 2013, ‘A
comprehensive insight into the combined effects of Fenton's reagent and
skeleton builders on sludge deep dewatering performance’, Journal of
Hazardous materials, vol. 258, pp. 144-150.
Lowry, O. H., Rosebrough, N. J., Farr, A. L. & Randall, R. J. 1951, ‘Protein
measurement with the Folin phenol reagent’, Journal of Biological Chemistry,
vol. 193, no. 1, pp. 265-275.

R - 6
Lu, M. C., Lin, C. J., Liao, C. H., Huang, R. Y. & Ting, W. P. 2003, ‘Dewatering of
activated sludge by Fenton's reagent’, Advances in Environmental Research, vol.
7, no. 3, pp. 667-670.
Lynch, D. P. & Novak, J. T. 1991, ‘Mixing intensity and polymer dosing in filter press
dewatering’, Research Journal of the Water Pollution Control Federation, pp.
160-165.
Manzel, J. 1989, ‘Sevar-Trocknungsverfahren mit Dünnbett [Sevar drying process in a
thin bed]’, Klärschlammentsorgung. Düsseldorf: VDI-Bildungswerk, pp. 74-81.
Marinetti, M., Dentel, S., Malpei, F. & Bonomo, L. 2010, ‘Assessment of rheological
methods for a correlation to sludge filterability’, Water Research, vol. 44, no.
18, pp. 5398-5406.
Metcalf, Eddy, Tchobanoglou, G. & Burton, F. L. 1991, Wastewater Engineering:
Treatment, Disposal, and Reuse, McGraw-Hill.
Mininni, G., Spinosa, L. & Misiti, A. 1984, ‘Evaluation of filter press performance for
sludge dewatering’, Journal (Water Pollution Control Federation), pp. 331-336.
Mowla, D., Tran, H. N. & Allen, D. G. 2013, ‘A review of the properties of biosludge
and its relevance to enhanced dewatering processes’ Biomass and Bioenergy,
vol. 58, pp. 365-378.
Nellenschulte, T. & Kayser, R. 1997, ‘Change of particle structure of sewage sludges
during mechanical and biological processes with regard to the dewatering
result’, Water Science and Technology, vol. 36, no. 4, pp. 293-306.
Novak, J. T. & Haugan, B. E. 1979, ‘Chemical conditioning of activated sludge’,
Journal of the Environmental Engineering Division, vol. 105, no. 5, pp. 993-
1008.
Novak, J. T. & Lynch, D. P. 1990, ‘The effect of shear on conditioning: Chemical
requirements during mechanical sludge dewatering’, Water Science &
Technology, vol. 22, no. 12, pp. 117-124.
Novak, J. T. 2006, ‘Dewatering of sewage sludge’, Drying technology, vol. 24, no. 10,
pp. 1257-1262.

R - 7
Novak, J. T., Agerbæk, M. L., Sørensen, B. L., Hansen & Aa, J. 1999, ‘Conditioning,
filtering, and expressing waste activated sludge’, Journal of Environmental
Engineering, vol. 125, no. 9, pp. 816-824.
Novak, J. T., Sadler, M. E. & Murthy, S. N. 2003, ‘Mechanisms of floc destruction
during anaerobic and aerobic digestion and the effect on conditioning and
dewatering of biosolids’, Water Research, vol. 37, no. 13, pp. 3136-3144.
Novak, J. T., Zurow, A. & Becker, H. 1977, ‘Factors influencing activated sludge
properties’, Journal of the Environmental Engineering Division, vol. 103, no. 5,
pp. 815-828.
Novak, J., Knocke, W., Burgos, W. & Schuler, P. 1993, ‘Predicting the dewatering
performance of belt filter presses’, Water Science & Technology, vol. 28, no. 1,
pp. 11-19.
Novak, J., Prendeville, J. & Sherrard, J. 1988, ‘Mixing Intensity and Polymer
Performance in Sludge Dewatering’, Journal of Environmental Engineering,
vol. 114, no. 1, pp. 190-198.
Örmeci, B. 2007, ‘Optimization of a full-scale dewatering operation based on the
rheological characteristics of wastewater sludge’, Water Research, vol. 41, no.
6, pp. 1243-1252.
Pan, J. R., Huang, C., Cherng, M., Li, K. C. & Lin, C. F. 2003, ‘Correlation between
dewatering index and dewatering performance of three mechanical dewatering
devices’, Advances in Environmental Research, vol. 7, no. 3, pp. 599-602.
Paul, E. & Liu, Y. 2012, Biological sludge minimization and biomaterials/bioenergy
recovery technologies, John Wiley & Sons.
Peng, G., Ye, F. & Li, Y. 2011, ‘Comparative investigation of parameters for
determining the dewaterability of activated sludge’, Water Environment
Research, vol. 83, no. 7, pp. 667-671.
Qi, Y., Thapa, K. B. & Hoadley, A. F. 2011, ‘Benefit of lignite as a filter aid for
dewatering of digested sewage sludge demonstrated in pilot scale trials’,
Chemical Engineering Journal, vol. 166, no. 2, pp. 504-510.
Qi, Y., Thapa, K. B. & Hoadley, A. F. A. 2011, ‘Application of Filtration Aids for
Improving Sludge Dewatering Properties’, ChemInform, vol. 42, no. 41.

R - 8
Robinson, J. & Knocke, W. R. 1992, ‘Use of dilatometric and drying techniques for
assessing sludge dewatering characteristics’, Water Environment Research, pp.
60-68.
Rudolfs, W. & Heukelekian, H. 1934, ‘Relation between drainability of sludge and
degree of digestion’, Sewage Works Journal, pp. 1073-1081.
Sanin, F. D., Clarkson, W. W. & Vesilind, P. A. 2011, Sludge engineering: The
treatment and disposal of wastewater sludges, DEStech Publications, Inc.
Sawalha, O. & Scholz, M. 2010, ‘Modeling the relationship between capillary suction
time and specific resistance to filtration’, Journal of Environmental Engineering,
vol. 136, no. 9, pp. 983-991.
Scholz, M. 2005, ‘Review of recent trends in capillary suction time (CST)
dewaterability testing research’, Industrial and engineering chemistry research,
vol. 44, no. 22, pp. 8157-8163.
Senthilnathan, P. & Sigler, R. G. 1993, ‘Improved sludge dewatering by dual polymer
conditioning’, Water Science & Technology, vol. 28, no. 1, pp. 53-57.
Severin, B. F. & Collins, B. H. 1992, ‘Advances in Predicting Belt Press Performance
form Lab Data’, Water Environment Federation 65th Annual Conference, New
Orleans, Louisiana.
Shammas, N. K. & Wang, L. K. 2007. Handbook of Environmental Engineering,
Volume 6: Biosolids Treatment Process, Totowa, NJ, The Humana Press Inc.
Smollen, M. 1988, ‘Moisture retention characteristics and volume reduction of
municipal sludges’, Water S. A., vol. 14, no. 1, pp. 25-28.
Smollen, M. 1990, ‘Evaluation of municipal sludge drying and dewatering with respect
to sludge volume reduction’, Water Science and Technology, vol. 22, no. 12, pp.
153-161.
Sørensen, P. B., Moldrup, P. & Hansen, J. 1996, ‘Filtration and expression of
compressible cakes’, Chemical Engineering Science, vol. 51, no. 6, pp. 967-979.
Spellman, F. R. 1997, Wastewater biosolids to compost, Lancaster, PA, USA:
Technomic Publishing Company, pp. 223-235
R - 9
Spinosa, L. & Mininni, G. 1984, ‘Assessment of sludge centrifugability’, Methods of
Characterization of Sewage Sludges, Dublin, Eire. D. Reidel Publishing
Company, pp. 16-30.
Spinosa, L. & Vesilind, P. A. 2001, Sludge into biosolids: Processing, Disposal and
Utilization, IWA.
Spinosa, L. 1985, ‘Technological characterization of sewage sludge’, Waste
management and research, vol. 3, no. 4, pp. 389-398.
Stoll, S. 2013, ‘The Importance of Zeta Potential Measurements & Role of Ionic
Strength in Flocculation Processes’, Water and technology, vol. 4, no. 1, pp. 1-5.
Subramanian, S. 2005, ‘Digestion processes and their effect on dewatering and Bound
water content of sludge’, MS Thesis, Virginia Tech.
To, V. H. P., Nguyen, T. V., Vigneswaran, S., Nghiem, L., Murthy, S., Bustamante, H.
& Higgins, M. J. 2014, ‘Modified centrifugal index and sludge characteristics in
assessing sludge dewatering’, IWA 7th International Young Water Professional
Conference, Taipei, Taiwan.
Turovskiy, I. S. & Mathai, P. 2006, Wastewater sludge processing, John Wiley & Sons.
US EPA. 1984. Environmental Regulations and Technology, Use and Disposal
Municipal wastewater sludge. Cincinnati, OH.
Vaxelaire, J. & Cézac, P. 2004, ‘Moisture distribution in activated sludges: a review’,
Water Research, vol. 38, no. 9, pp. 2215-2230.
Vaxelaire, J. & Olivier, J. 2006, ‘Conditioning for municipal sludge dewatering. From
filtration compression cell tests to belt press’, Drying technology, vol. 24, no.
10, pp. 1225-1233.
Vesilind, P. 2000, ‘A modified capillary suction time apparatus for measuring the
filterability of super-flocculated sludges’, Water Science and Technology, vol.
42, no. 9, pp. 135-139.
Vesilind, P. A. 1974, Treatment and disposal of wastewater sludge, Ann Arbor Science,
Ann Arbor, USA.
Vesilind, P. A. 1988, ‘Capillary suction time as a fundamental measure of sludge
dewaterability’, Journal (Water Pollution Control Federation), pp. 215-220.

R - 10
Vigneswaran, S. & Aim, R. B. 1989, Water, wastewater, and sludge filtration, CRC
Press.
Wakeman, R. J. 2007, ‘Separation technologies for sludge dewatering’, Journal of
hazardous materials, vol. 144, no. 3, pp. 614-619.
Wang, L., Chang, S. Y., Hung, Y. T. & Chen, J. P. 2007, ‘Elutriation and Polymer
Conditioning’, Biosolids Treatment Processes, Humana Press.
Wang, W., Luo, Y. & Qiao, W. 2010, ‘Possible solutions for sludge dewatering in
China’, Frontiers of Environmental Science and Engineering in China, vol. 4,
no. 1, pp. 102-107.
Water Pollution Control Federation. 1980, ‘Sludge Thickening’, Manual of Practice
FD-1.
Water Pollution Control Federation. 1985, Wastewater Treatment, Sludge Conditioning,
Thickening and Dewatering, Washington, D.C.
Wei, Y., Van Houten, R. T., Borger, A. R., Eikelboom, D. H. & Fan, Y. 2003,
‘Minimization of excess sludge production for biological wastewater treatment’,
Water Research, vol. 37, no. 18, pp. 4453-4467.
Werle, C. P., Novak, J. T., Knocke, W. R. & Sherrard, J. H. 1984, ‘Mixing intensity and
polymer sludge conditioning’, Journal of Environmental Engineering, vol. 110,
no. 5, pp. 919-934.
Xie, W., Wang, Q., Ma, H., Ohsumi, Y. & Ogawa, H. I. 2005, ‘Study on phosphorus
removal using a coagulation system’, Process Biochemistry, vol. 40, no. 8, pp.
2623-2627.
Yen, P. S., Chen, L., Chien, C., Wu, R. M. & Lee, D. 2002, ‘Network strength and
dewaterability of flocculated activated sludge’, Water Research, vol. 36, no. 3,
pp. 539-550.
Yoon, S. H., Kim, H. S. & Yeom, I. T. 2004, ‘The optimum operational condition of
membrane bioreactor (MBR): cost estimation of aeration and sludge treatment’,
Water Research, vol. 38, no. 1, pp. 37-46.
Yukseler, H., Tosun, İ. & Yetis, U. 2007, ‘A new approach in assessing slurry
filterability’, Journal of Membrane Science, vol. 303, no. 1, pp. 72-79.

A - 1
UNIVERSITY OF TECHNOLOGY, SYDNEY
FACULTY OF ENGINEERING AND IT
APPENDIX

A - 2
List of Publications based on this research
Journal articles
- Vu Hien Phuong To, Tien Vinh Nguyen, Saravanamuthu Vigneswaran and Huu
Hao Ngo (2014). A review on indicators for efficiency evaluation of sludge
mechanical dewatering, will be submitted to Water Science and Technology
- Vu Hien Phuong To, Tien Vinh Nguyen, Saravanamuthu Vigneswaran, Long
Nghiem, Sudhir Murthy, Heri Bustamante and Matthew J. Higgins. (2014). The
modified centrifugal index as a parameter to determine polymer demand and
achievable dry solids content in the dewatering of anaerobically digested sludge:
under review of Sydney Water Corporation, will be submitted to International
Journal of Environmental Science and Technology.
Conferences
- Vu Hien Phuong To, Tien Vinh Nguyen, Saravanamuthu Vigneswaran, Long
Nghiem, Sudhir Murthy, Heri Bustamante and Matthew J. Higgins. (2014).
Modified centrifugal index and sludge characteristics in assessing sludge
dewatering. IWA 7th International Young Water Professional Conference.
December 7 – 11, Taipei, Taiwan.
- Vu Hien Phuong To, Tien Vinh Nguyen, Saravanamuthu Vigneswaran, Sudhir
Murthy, Heri Bustamante and Matthew J. Higgins. (2014). Sludge dewatering
improvement through understanding of interaction mechanisms of conditioning
polymers (accepted). WEF/IWA Residuals and Biosolids Conference 2015. June
7 – 10, Washington, D.C., USA.
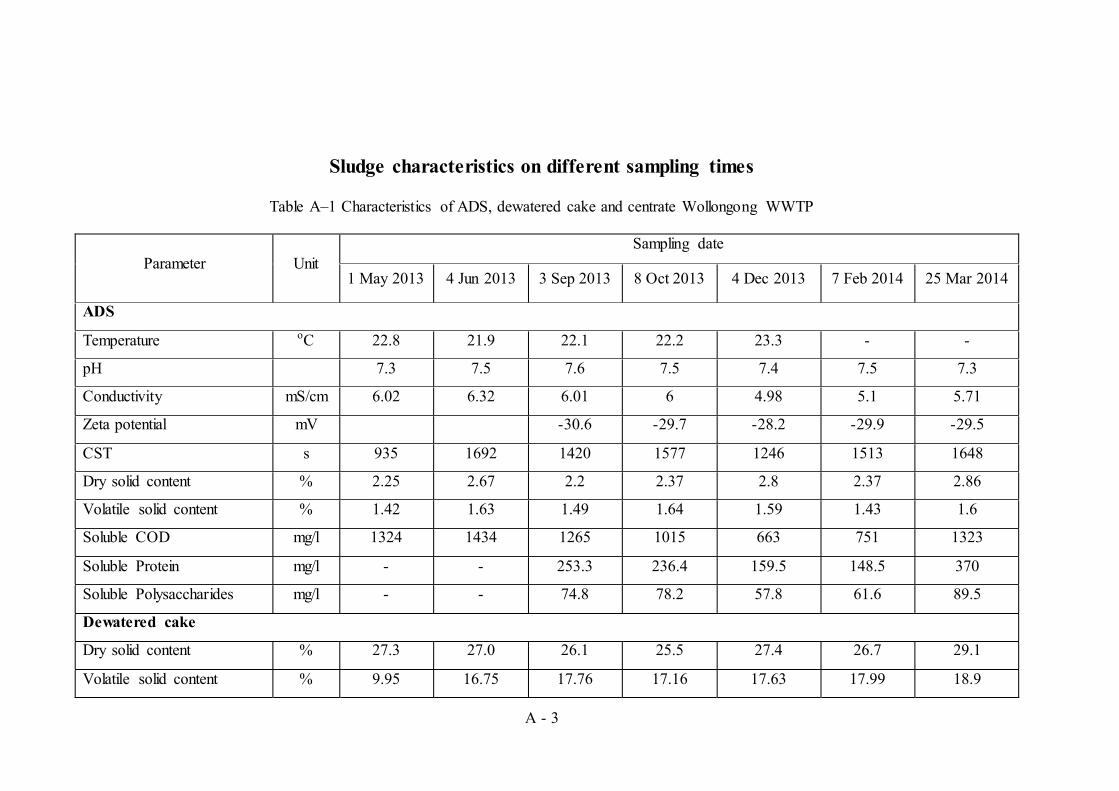
A - 3
Sludge characteristics on different sampling times
Table A–1 Characteristics of ADS, dewatered cake and centrate Wollongong WWTP
Parameter Unit Sampling date
1 May 2013 4 Jun 2013 3 Sep 2013 8 Oct 2013 4 Dec 2013 7 Feb 2014 25 Mar 2014
ADS
Temperature oC 22.8 21.9 22.1 22.2 23.3 - -
pH 7.3 7.5 7.6 7.5 7.4 7.5 7.3
Conductivity mS/cm 6.02 6.32 6.01 6 4.98 5.1 5.71
Zeta potential mV -30.6 -29.7 -28.2 -29.9 -29.5
CST s 935 1692 1420 1577 1246 1513 1648
Dry solid content % 2.25 2.67 2.2 2.37 2.8 2.37 2.86
Volatile solid content % 1.42 1.63 1.49 1.64 1.59 1.43 1.6
Soluble COD mg/l 1324 1434 1265 1015 663 751 1323
Soluble Protein mg/l - - 253.3 236.4 159.5 148.5 370
Soluble Polysaccharides mg/l - - 74.8 78.2 57.8 61.6 89.5
Dewatered cake
Dry solid content % 27.3 27.0 26.1 25.5 27.4 26.7 29.1
Volatile solid content % 9.95 16.75 17.76 17.16 17.63 17.99 18.9

A - 4
Parameter Unit Sampling date
1 May 2013 4 Jun 2013 3 Sep 2013 8 Oct 2013 4 Dec 2013 7 Feb 2014 25 Mar 2014
Centrate
Temperature oC
23.1 - -
pH 8.2 8.31 7.86
Zeta potential mV -7.8 -6.9 -5.3
Suspended solids mg/l 213 60 92

A - 5
Table A–2 Characteristics of AEDS, dewatered cake and centrate at St. Marys WWTP
Parameter Unit Sampling date
25 Oct 2013 20 Nov 2013 3 Mar 2014 14 Apr 2014 22 May 2014 24 June 2014
AEDS
Temperature oC 23.8 23.5 23 22.7 21.8 19.1
pH 7.0 6.9 7.0 7.5 6.9 7.0
Conductivity mS/cm 1.83 1.49 1.6 1.66 1.35 -
Zeta potential mV -26.3 -26 -26.6 -27.7 -26.5 -25.1
CST s 283 334 538 450 258 350
Dry solid content % 1.92 2.18 2.5 0.85 1.89 2.23
Volatile solid content % 1.32 1.42 1.48 0.52 1.22 1.42
Soluble COD mg/l 717 647 528 741 333 453
Soluble Protein mg/l 97.9 90.1 90.5 85.5 63.9 80.02
Soluble Polysaccharides mg/l 41.7 32.3 36 27.8 24.8 23.83
Dewatered cake
Dry solid content % 15.18 15.64 14.86 17.35 13.97 15.07
Volatile solid content % 10.96 11.27 10.24 11.64 9.27 9.67
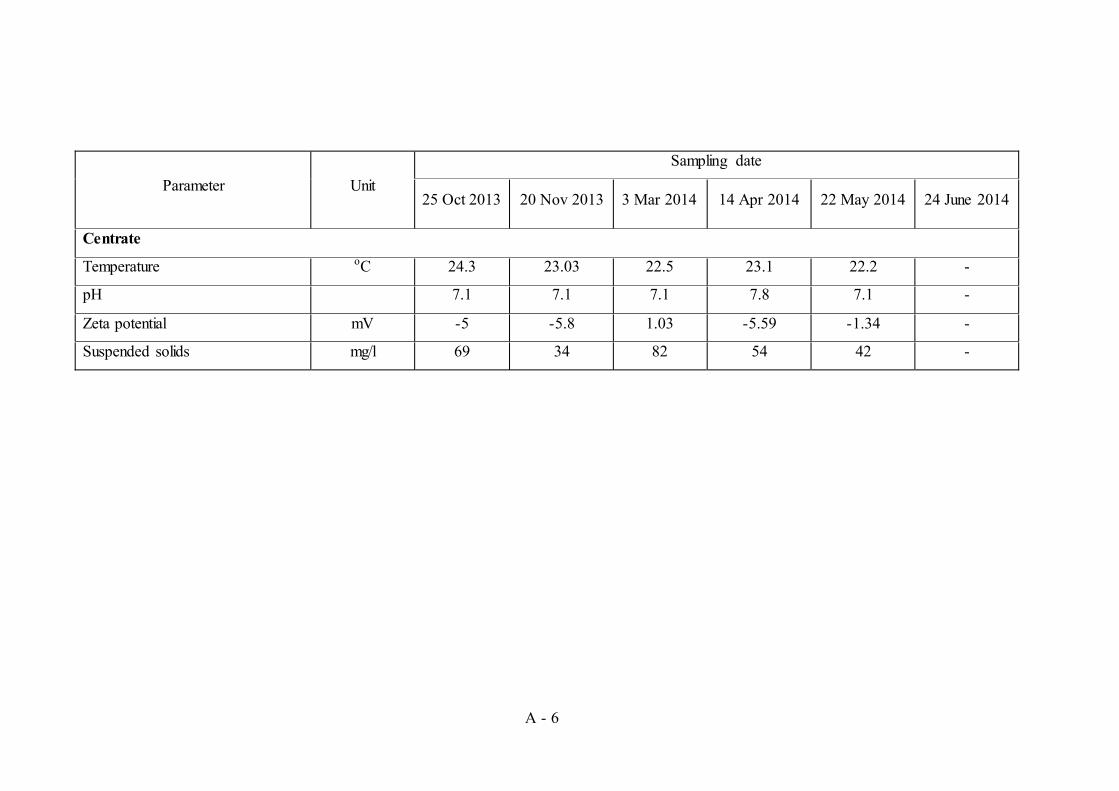
A - 6
Parameter Unit Sampling date
25 Oct 2013 20 Nov 2013 3 Mar 2014 14 Apr 2014 22 May 2014 24 June 2014
Centrate
Temperature oC 24.3 23.03 22.5 23.1 22.2 -
pH 7.1 7.1 7.1 7.8 7.1 -
Zeta potential mV -5 -5.8 1.03 -5.59 -1.34 -
Suspended solids mg/l 69 34 82 54 42 -

A - 7
Table A–3 Characteristics of WAS, dewatered cake and centrate at Quakers Hill WWTP
Parameter Unit Sampling date
25 Oct 2013 20 Nov 2013 17 Dec 2013 3 Mar 2014 14 Apr 2014 22 May 2014 24 Jun 2014
WAS
Temperature oC 23.8 23 22.2 22.6 22.6 21.7 19.4
pH 6.9 6.8 6.5 6.6 6.8 6.7 6.7
Conductivity mS/cm 1.21 1.17 1.56 1.75 1.54 1.48 -
Zeta potential mV -22 -20 -20.4 -18.2 -23.2 -22.6 -21.1
CST s 23 63 83 106 107 66 73
Dry solid content % 2.22 3.18 3.67 3.01 2.97 2.84 2.68
Volatile solid content % 1.46 2.13 2.45 2.15 2.14 2.12 2.02
Soluble COD mg/l 136 346 645 895 373 375 633
Soluble Protein mg/l 34.9 46.1 77.4 75.9 61 64.1 64.5
Soluble Polysaccharides mg/l 35.5 26.7 47.4 47.3 18.8 22.4 22.6
Dewatered cake
Dry solid content % 17.9 18.4 19 19.4 19 18.52 18.50
Volatile solid content % 13.2 13.4 13.9 14.3 13.7 13.96 14.35
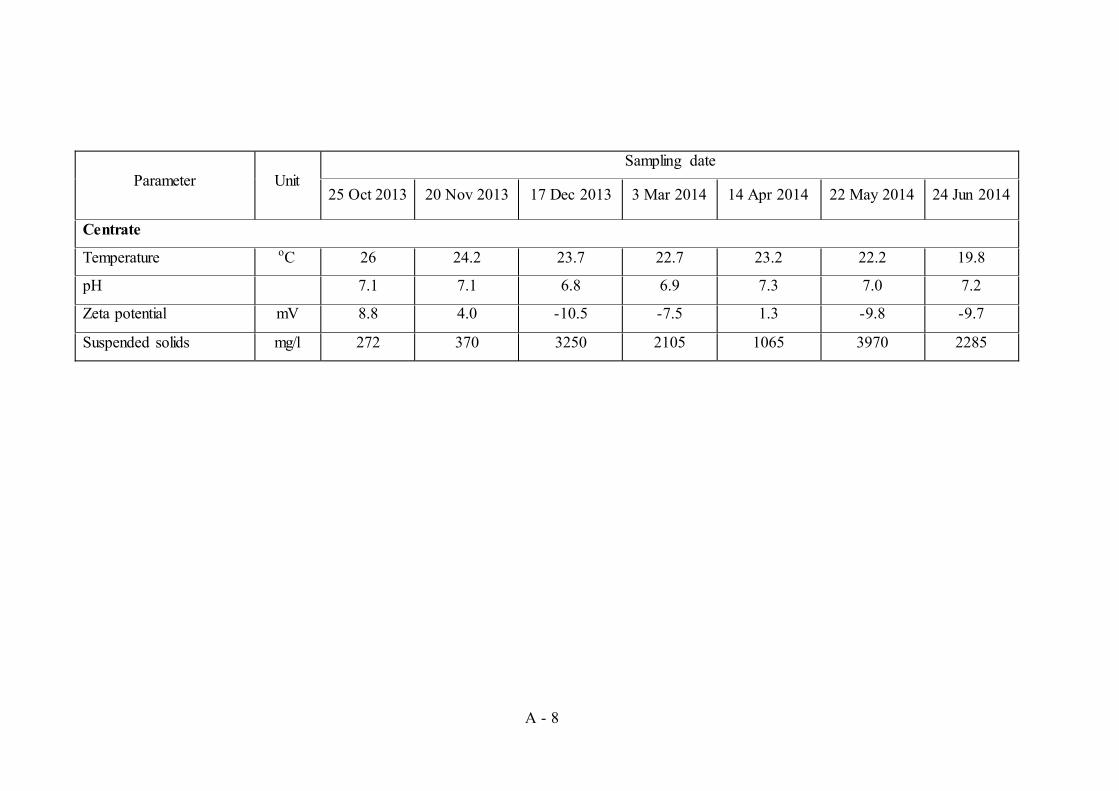
A - 8
Parameter Unit Sampling date
25 Oct 2013 20 Nov 2013 17 Dec 2013 3 Mar 2014 14 Apr 2014 22 May 2014 24 Jun 2014
Centrate
Temperature oC 26 24.2 23.7 22.7 23.2 22.2 19.8
pH 7.1 7.1 6.8 6.9 7.3 7.0 7.2
Zeta potential mV 8.8 4.0 -10.5 -7.5 1.3 -9.8 -9.7
Suspended solids mg/l 272 370 3250 2105 1065 3970 2285

A - 9
Dewatering equipment in 3 WWTPs studied
Figure A–1 Centrifuges at Wollongong WWTP
(a) (b)
Figure A–2 (a) Centrifuges and (b) polymer feeding point at Quakers Hill WWTP
Figure A–3 Belt filter presses at St. Marys WWTP

A - 10
Figure A–4 Waste treatment methods in Wollongong WWTP

A - 11
Figure A–4 Waste treatment processes in Quakers Hill WWTP
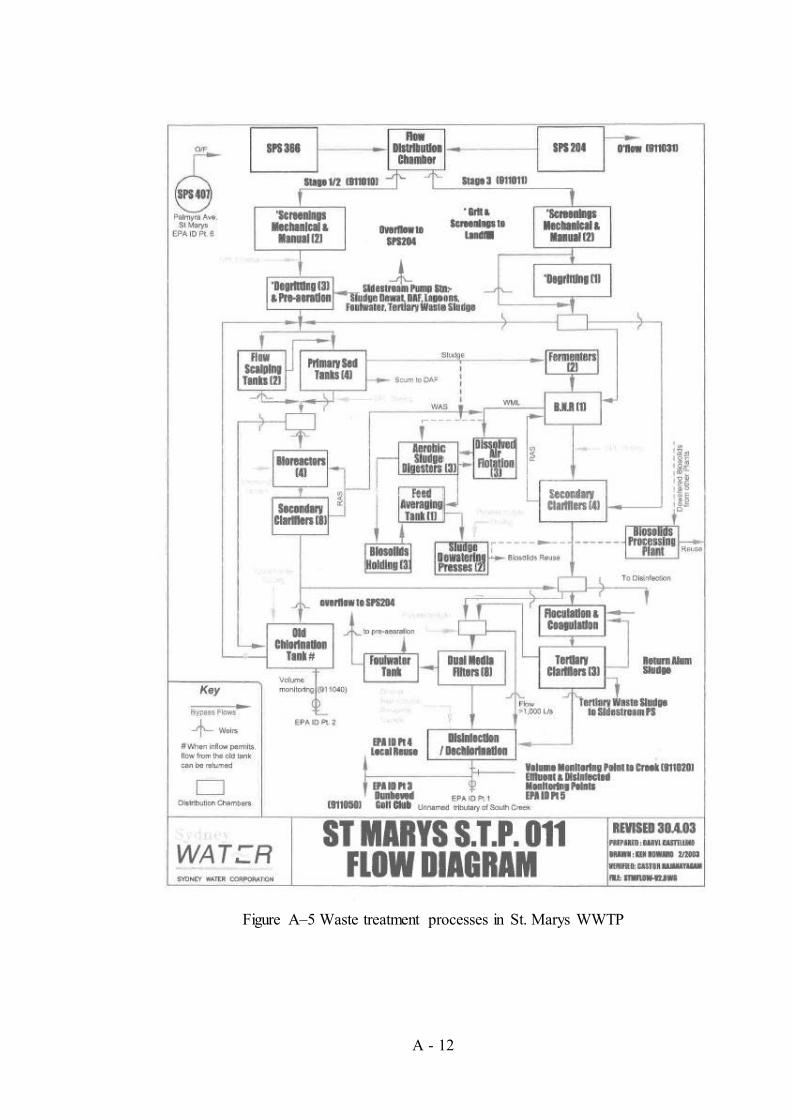
A - 12
Figure A–5 Waste treatment processes in St. Marys WWTP