improved economics of nuclear plant life management
TRANSCRIPT

Improved economics of nuclear plant life management
Improved economics of Improved economics of nuclear plant life managementnuclear plant life managementL.J. Bond, S.R. Doctor, D.B. Jarrell,
Pacific Northwest National Laboratory, Richland, Washington, USA
J.W.D. BondDepartment of Economics, University of Kent,
Canterbury, United Kingdom
2nd International Symposium on Nuclear Power Plant Life Management , 15-18 October 2007, Shanghai, China

2
OUTLINEOUTLINEOUTLINEGlobal Nuclear Energy:� Operations and maintenance� Digital revolution – health monitoring
NDT to diagnostics and prognostics� Condition based maintenance� Diagnostics & Prognostics – technology maturity� Impact on Probabilistic Risk Assessment
Economic impact analysis Advanced Diagnostics/Prognostics – Technical ChallengesConclusions

3
Global Nuclear EnergyGlobal Nuclear EnergyGlobal Nuclear EnergyThe world is hungry for energy
Approx. 440 nuclear power reactors (globally)� New plants being planned (100+)
104 nuclear power reactors in USA
Average age – nuclear plants more than 20 years� Design lives range from 30-40 yearsLife extension from 40 – 60 years� Consideration being given to “life-after-60”
0
130
260
390
520
650
1970 1980 1990 1999 2010 2020
Quadrillion Btu
207243
285
311346 366 382
439
547490
607
World Energy Consumption1970-2020

4
Operations and MaintenanceOperations and MaintenanceOperations and MaintenanceO&M costs 40-70% generating costs� USA O&M ~60-70%� Fuel costs 15-30%� Capacity factor 90%+� O&M 80% costs are labor� Aging workforce (USA)� Developing countries challenged to meet skilled workforce needs
� Limited supply of “replacements” –people and components!
� Opportunities � Move from periodic inspection to on-line
measurement – advanced diagnostics and prognostics� Enhanced functionality with digital
Instrumentation & Controls

5
Past ExperiencePast ExperiencePast ExperienceMajority of component failures� Active components – e.g. valve not operating� Passive components – service degradationActive components managed through maintenance programPassive components managed through periodic inspection
Surprises – result from new degradation mechanisms(New programs being considered for “life-after-60”)

6
Periodic NDE methods challenged by aging systems –frequency of inspection and inspection technology need to be reviewed in light of known degradation mechanisms
Condition-based maintenance philosophies, on-line monitoring and diagnostics can reduce O&M costsDigital systems give enhanced functionality
Motivation for structural health monitoringMotivation for structural health monitoringMotivation for structural health monitoring
Nuclear Power Plant Systems:ICHMI – Instrumentation Controls
– Human Machine Interface

7
Mitigation and Repair
Fix WhatBroke
Preventive Maintenance ZonePredictive Maintenance Zone
Prediction and Planning
Degradation ZoneTime =>
Stressor Applied
FAILURE
No Failure
Proactive Operations and Maintenance Zone
Condition Based MaintenanceCondition Based Maintenance

8
PrognosticsPrognosticsPrognosticsMove from diagnosis to prediction of remaining life and structural health monitoring/management
Prognostics (for machinery) is the prediction of a remaining safe or service life, based on an analysis of the system or material condition, stressors and degradation phenomena

9
Rule-Based Logic
Calculations
Modeling Neural NetsStressor
Measurement & Correlation
Diagnostics/prognostics ProcessesDiagnostics/prognostics Processes…………

10
NDE to PrognosticsNDE to PrognosticsNDE to Prognostics• Evaluation/analysis
• Health Sensors/NDE/NDI
• Aging/damage models
• Probabilistic analysis
• Cost of ownership
• Probabilistic risk assessment
•Developing in other industries

11
Benefits of Diagnostics & PrognosticsBenefits of Diagnostics & PrognosticsBenefits of Diagnostics & Prognostics

12
Prognostics for Systems and ComponentsPrognostics for Systems and ComponentsPrognostics for Systems and ComponentsHealth monitoring� “treat as a pump”!
Time to failure� Thermal cycling� Radiation damage� Fatigue
Unit and component analysis

13
Diagnostics and Prognostics:technology base maturity matrixDiagnostics and Prognostics:Diagnostics and Prognostics:technology base maturity matrixtechnology base maturity matrix
D – Diagnostics: P - Prognostics • AP – technology currently available and proven effective• A - technology currently available, but V&V not completed• I – technology in process, but not completely ready for V&V• NO – No significant technology development in place
[Howard (2005)]

14
Stressor Intensity Measurement Provides Stressor Intensity Measurement Provides Prognostic Information BEFORE Degradation Prognostic Information BEFORE Degradation
can be Detectedcan be Detected
Normal Operating BandALERT
ALARM
Failure Level
TIME
Figure
of M
erit
Primary or Virtual Parameter = PP
t1 t2
Cone of Uncertainty
Stressor Amplitude Approach
T

15
Operations
Decision Support for Operations & Maintenance - Information Tailored to User
HP Steam
LP Steam
CondensateFeedw aterGeneral Area Detail # 3
EngineeringMaintenance
DSOM - UCARNAVCOMPT 2127 (REV 3-92) UTILITIES COST ANALYSIS REPORT PWMA PC-FORM 2127 (VER 2.0)ACTIVITY NAME: PERIOD END: DBOF: N PREP BY: REV BY:
NON-DBOF: Y DSN: DSN:ACTIVITY UIC: QTR: 1 OTHER: N COMM: COMM:
FISCAL YEAR: DATE: DATE:L FUEL CONSUMED HEAT SOURCE ELECTRICITY OTHER FUEL TOTALSIN TYPE AMOUNT TYPE MBTU UNIT COST MBTUs DOLLARS MBTUs DOLLARS MBTUs DOLLARSE FUEL CONSUMED UNITS CONTENT PER MBTU A1 A2 C1 C2 J1 J2 MBTUs DOLLARS1 COAL 0 TONS 24.5800 #DIV/0! 0 0 0 0 0 0 0 0NATURAL GAS 0 THERM 0.0000 0.00 0 0 0 0 0 0 0 0LPG 0 GAL 0.0955 #DIV/0! 0 0 0 0 0 0 0 0WOOD 0 CORD 0.0000 0.00 0 0 0 0 0 0 0 0JP-5 0 GAL 0.0000 0.00 0 0 0 0 0 0 0 0#2 OIL (8210) 0 GAL 0.1387 #DIV/0! 0 0 0 0 0 0 0 0#2 OIL(OTHER) 0 GAL 0.1387 #DIV/0! 0 0 0 0 0 0 0 0#6 OIL 0 GAL 0.1497 #DIV/0! 0 0 0 0 0 0 0 0
2 a. TOTAL MBTU 0 0 0 0b. TOTAL DOLLARS 0 0 0 0HEATING NATURAL WATER WATER CHILLER PNEUMATIC OTHERSUPPLY GAS ELECTRICITYPOTABLENON-POTABLESEWAGE PLANT POWER MISC. FUELMBTU MBTU MWH KGAL KGAL KGAL MBTU KSCF UTILITIES MBTUA B C D E F G H I J
INTERUTILITY TRANSFERS3 STEAM a. QUANTITY (MBTUs) 0 0 0 0 0 0 0 0 0TO: b. COST PER MBTU 0.00 0.00 0.00 0.00 0.00 0.00 0.00 0.00 0.00 0.00
c. TOTAL COST 0 0 0 0 0 0 0 0 04NATURAL GASa. QUANTITY (MBTUs) 0 0 0 0 0 0 0 0 0TO: b. COST PER MBTU 0.00 0.00 0.00 0.00 0.00 0.00 0.00 0.00 0.00 0.00
c. TOTAL COST 0 0 0 0 0 0 0 0 05ELECTRICITYa. QUANTITY (MWHs) 0 0 0 0 0 0 0 0 0TO: b. COST PER MWHs 0.00 0.00 0.00 0.00 0.00 0.00 0.00 0.00 0.00 0.00
c. TOTAL COST 0 0 0 0 0 0 0 0 06 POTABLE a. QUANTITY (KGALs) 0 0 0 0 0 0 0 0 0WATER TO:b. COST PER KGAL 0.00 0.00 0.00 0.00 0.00 0.00 0.00 0.00 0.00 0.00
c. TOTAL COST 0 0 0 0 0 0 0 0 07NON-POTABLEa. QUANTITY (KGALs) 0 0 0 0 0 0 0 0 0WATER TO:b. COST PER KGAL 0.00 0.00 0.00 0.00 0.00 0.00 0.00 0.00 0.00 0.00
c. TOTAL COST 0 0 0 0 0 0 0 0 0HEATING NATURAL WATER WATER CHILLER PNEUMATIC OTHERSUPPLY GAS ELECTRICITYPOTABLENON-POTABLESEWAGE PLANT POWER MISC. FUELMBTU MBTU MWH KGAL KGAL KGAL MBTU KSCF UTILITIES MBTUA B C D E F G H I J
Administration

16
U.S. Department of EnergyPacific Northwest National Laboratory

17
Effect of First-Principles Prognostics on Reactor Operational Risk – PRA ImpactEffect of FirstEffect of First--Principles Prognostics on Principles Prognostics on Reactor Operational Risk Reactor Operational Risk –– PRA ImpactPRA Impact
Maintenance
Testing MOV1 MOV2 MOV3 MOV1
Repair/replacement due to failure ECS2 PMP SW1 Pmp
1.00E-03
1.00E-04
1.00E-05
PRESENT RISK MONITOR PRACTICE
Scheduled Maintenance and Testing
Unscheduled Events (failures)
ECS1 Diesel GenSW2 PMP
AprilJanuary February March
SW1 PMP
Risk (Core Damage Frequency)
January February March April

18
Effect of First-Principles Prognostics on Reactor Operational Risk – PRA impactEffect of FirstEffect of First--Principles Prognostics on Principles Prognostics on Reactor Operational Risk Reactor Operational Risk –– PRA impactPRA impact
Maintenance
Testing MOV1 MOV2 MOV3 MOV1Repair/replacement due to failure ECS2 PMP SW1 Pmp
1.00E-03
1.00E-04
1.00E-05
Risk (Core Damage Frequency)
RISK MONITORING WITH SDMS
SW1 Pmp SW2 PmpECS1 Pmp Diesel Gen
Scheduled Maintenance, Testing and Failures
January February March April

19
Costs associated with poor O&MCosts associated with poor O&MCosts associated with poor O&MLoss of revenueSevere damage to the equipment or surrounding equipment/personnel/environmentReduction of life of the equipmentHigh maintenance costs in labor and materialsIncreased costs of spare partsHigher electricity costs to operate the equipmentPotential for liability
Increases in insurance costsPublic and political perception of poor safety culture resulting in damage to corporate image.

20
Economic Impact AnalysisEconomic Impact AnalysisEconomic Impact AnalysisOn-line monitoring� Capacity factor 89.7%� Focus “useful life”� Constant failure rate
� Equipment� Rotating & filtration� Motors� Pumps� Heat exchangers
� Numbers in plant: based data on Energy Northwest, Richland, WA� Normalized by gen. capacity� Data used were from 2000-2002

21
Unit life cycleUnit life cycleUnit life cycleStart-up phase: faults related to installation and assembly
Useful life phase: machine will be reliable as long as it is maintained and used within its design parameters.
Wear-out phase: machinery reaches the end of its design life, and parts begin to fail more rapidly.

22
Analysis elementsAnalysis elementsAnalysis elementsFailure rates: Motors, pumps and heat exchangersLost Revenue Cost of fuel replacementCost of repair (materials & Labor)Cost of energyCost of life extension (nuclear & manufacturing)
Not included:Cost of research + V&V for prognostics (ROI)

23
Example: Failure rate pumpsExample: Failure rate pumpsExample: Failure rate pumps0.00422 failures/pump/year*66%*33%
= 0.0009 failures/pump/year.• PREP Study (Hale et al – 2001)• Centrifugal pump – failure rate 0.00422 failures/motor per year• Nuclear – Licensee Event Report 56% failures due to aging•Pump bearings, impellors, rotors and wear rings account for 71% of failures•NPRDS – 7538 records – 76% failures due to wear and vibration•33% of wear failures due to cavitation or misalignment

24
Example: Failure rate pumpsExample: Failure rate pumpsExample: Failure rate pumps
PREP Study (Hale et al – 2001)� Centrifugal pump – failure rate 0.00422 failures/motor per yearNuclear – Licensee Event Report � 56% failures due to aging� Pump bearings, impellors, rotors and wear rings account for 71% of failuresNPRDS – 7538 records� 76% failures due to wear and vibrationAVERAGE – (56 & 76%) = 66%33% of wear failures due to cavitationor misalignment
{0.00422 failures/pump/year}*66%*33% = 0.0009 failures/pump/year.
25
Example calculation:Motor, pump and heat exchanger
Example calculation:Example calculation:Motor, pump and heat exchangerMotor, pump and heat exchanger
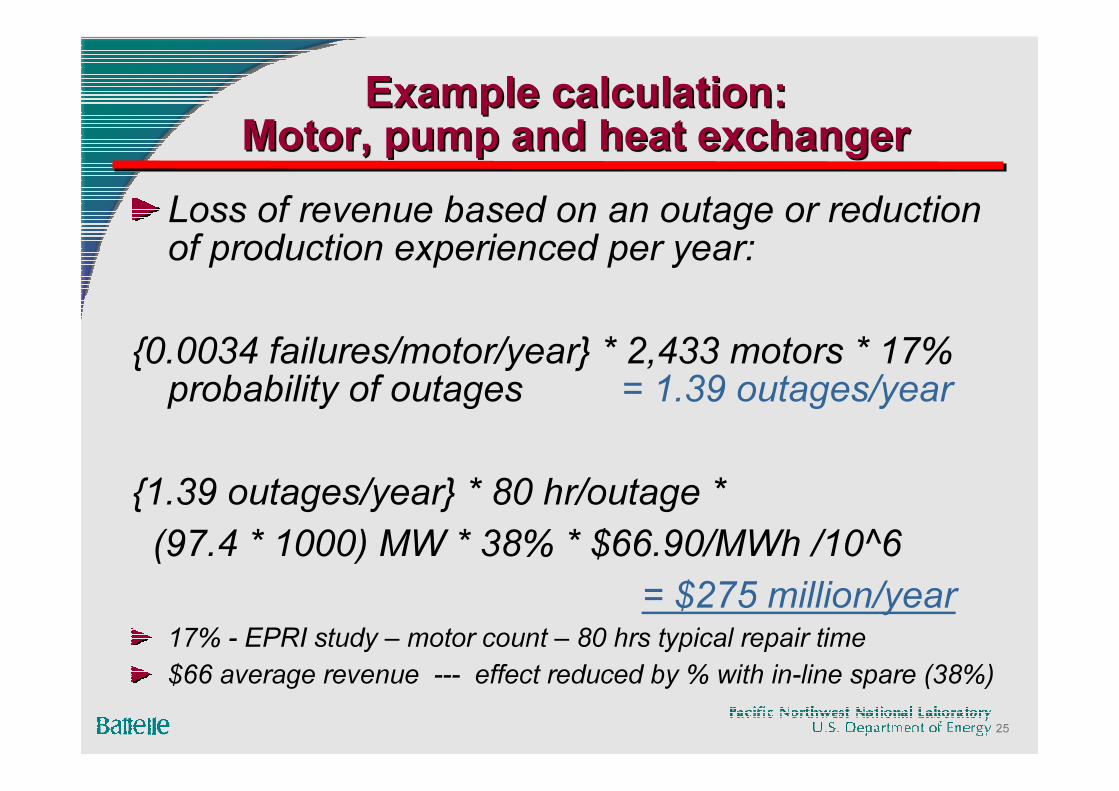
Loss of revenue based on an outage or reduction of production experienced per year:
{0.0034 failures/motor/year} * 2,433 motors * 17% probability of outages = 1.39 outages/year
{1.39 outages/year} * 80 hr/outage *(97.4 * 1000) MW * 38% * $66.90/MWh /10^6
= $275 million/year17% - EPRI study – motor count – 80 hrs typical repair time$66 average revenue --- effect reduced by % with in-line spare (38%)

26
Nuclear – 104 US legacy systems – Potential savings for the Industry estimated at over $1 B / year (applicable risk significant equipment). Increase in plant availability� Reduce radiation exposure to plant personnel� Reduction in plant O&M costs� Increase in plant shutdown safety marginsIn US (ALL INDUSTRIES) - “More than $1 Trillion is spent each year replacing perfectly good equipment …” [McLean et al (2002)]
New US nuclear plants: – significant POTENTIAL impact but cannot yet not quantified
Potential Economic ImpactPotential Economic ImpactPotential Economic Impact

27
Prognostics - Technical ChallengesPrognostics Prognostics -- Technical ChallengesTechnical Challenges
Smart components and structuresSelf-diagnostic systemsEmbedded Micro-Electromechanical Systems (MEMS) (and other) health monitoring sensorsWireless communicationDistributed data processing and control networksPrognostics implementationAdvanced NDE technologiesProactive operations and maintenance program
What everyonewants!
“Tricorder”
Need: Detect, monitor, and characterize degradation severity to drive a cost effective proactive O&M AND PREDICT REMAIN USEFUL/ECONOMIC PLAN LIFE/OPERATION.
Base prognostics technologies being used in other industries & ready to deploy

28
Advanced technical challenges…Advanced technical challengesAdvanced technical challenges……
Sensing: what to measure and how to measureData interrogation, communication and integrationPredictive models (e.g. damage evolution)System integration and deployment on real-world hardwareQuantification of uncertainty – (ill-posed problems)Integration of prognostics into plant operation and O&M approach

29
Condition-based maintenanceLife maximization/operational optimizationAsset management, economic and life safety advantageEnhanced situation awarenessOperational readiness & operators make more informed decisionsEnhanced system security
Prognostics can provide Prognostics can provide Prognostics can provide
Steam GeneratorFeedwater InletNozzle (1 of 8)
Upper Head
Reactor CoolantPump (1 of 8)
Steam GeneratorSteam Outlet Nozzle
(1 of 8)
Downcomer
Core
Core Outlet“Riser”
Helical CoilSteam Generators
(1 of 8)
Pressurizer
Guide TubeSupport Plate

30
Needs for Advanced Reactor Designsand Past Experience
Needs for Advanced Reactor DesignsNeeds for Advanced Reactor Designsand Past Experienceand Past Experience
New advanced gas reactors and Generation IV nuclear power plants (NPP)
Expected to operate with high capacity factor (90%+),Longer refueling cycles (4–6 years)Gen IV NPP will operate at higher temperatures (potentially 510°C to 1000°C).
Necessary inspections and maintenance performed during shorter outages. One challenge is limited knowledge of material performance for next-generation designs, including balance of plant and secondary units for process heat or hydrogen production.

31
Prognostics Work in the FieldPrognostics Work in the Field
� Evaluate equipment design & establish stressor measurement plan� Conduct on-site measurements � Analyze data leveraging design knowledge & prognostic technology� Estimate degradation rate and useful residual lifeResult: Saved the Army Corps of Engineers $1.2 M in pump maintenance that was not required
Problem: Evaluate ONE PUMP operational environment to determine potential failure & useful residual service life

32
Move to hybrid and digital I&C provides opportunities to add enhanced diagnostics/prognostics functionalityOn-line monitoring and advanced diagnostics has the potential:� reduction in mandated surveillances, � more accurate cost-benefit analysis, � “just-in-time” maintenance, � pre-staging of maintenance tasks, � moving towards true “operation without failures”
USA 104 U.S. legacy systems: deployment of on-line monitoring and diagnostics has potential for savings at over $1B per year when applied to all key equipment.Advanced Prognostics is a “Grand Challenge” for the engineering community to address in the 21st century – its deployment is VITAL for optimization of operation of legacy & next generation energy and process plant systems
ConclusionsConclusionsConclusions