improved utilization of waste resources from the pulp and...
TRANSCRIPT
Improved utilization of waste resources from the pulp and paper
mill Nordic Paper Bäckhammar and isolation of local freshwater
microalgae species
Master of Science Thesis in the Master Degree Program Biotechnology
Mikael Svensson
Department of Chemical and Biological Engineering
Industrial Biotechnology
CHALMERS UNIVERSITY OF TECHNOLOGY
Gothenburg, Sweden, 2014
II
Abstract
This master thesis was performed during a full academic year and aimed at investigating the possibilities
in utilizing otherwise discarded biosludge as a source of nutrients for algal cultures. This work was done
as a part of a project cofounded by Vinnova and ÅF in collaboration with the Swedish pulp and paper mill
Nordic Paper Bäckhammar (NPB) and SP, Technical Research Institute of Sweden (SP). Biosludge was
chosen as a possible source as it is produced in situ en masse and contained a large mass fraction of
nitrogen (2.8 % g/g). Biosludge was pre-treated with acids, bases and ultrasonication prior to experiments
to determine an effective method for nutrient leaching. Acid pre-treatment showed promising results and
was chosen as a suitable method for further development during this project. A screening was performed
to evaluate the effect of heat and time versus leached nutrient concentrations from biosludge in HCl-
solutions. The results indicated that a high temperature, 120 °C and a long reaction time, 24 h, reached the
highest concentrations of NH4+ (19 mg/l) and PO4
3- (60 mg/l). The highest concentration of NO3
- was 64
mg/l, reached after 170 h at 25 °C. The volume was kept constant during all leaching experiments.
Water samples were collected at NPB for isolation of microalgae, which were cultivated and stored in
minimal laboratory medium, 3N-BBM+V. Algae monocultures were isolated via serial dilution and plate
streaking. Based on a visual examination, 7 different morphologies were found among the isolated
cultures: Phormidium sp, Oscillatoria sp, Coenococcum sp, Scenedesmus dimorphus, Scenedesmus
quadricauda, Chlorella vulgaris and Monoraphidium contortum. S. quadricauda and C. vulgaris could
grow in treated biosludge-based medium. C. vulgaris, S. dimorphus and M. contortum showed fast growth
rates in 3N-BBM+V medium and 15 % CO2, with growth rates of 0.065, 0.064 and 0.054 h-1
respectively.
The total lipid content were determined for the algae strains in selected conditions and it was found that
M. contortum could contain as much as 45 % lipids with a fatty acid composition suitable for biofuel
production.

III
Acknowledgement
First and foremost I would like to express my gratitude to Mathias Bark, SP, for his outstanding
supervision, knowledge and support during the entirety of this project. I would like to thank Susanne
Ekendahl, SP, for all help she offered, and for her constructive advices on where to find necessary
information. Carl-Anton Karlsson and Tarjei Svensen, NPB, you have my thanks for all information about
paper processes in general and at NPB in particular. This has been of great importance during this project.
I would like to extend a thank you to Lena Brive and Mathias Berglund, SP, for their generous help during
this project. Thank you Eva Albers, Chalmers, for all help and constructive criticism regarding my paper.
I would finally like to thank all those at SP Chemistry, Materials and Surfaces for all their friendliness,
encouragement and overall supportiveness.
IV
Content 1. Introduction ................................................................................................................................. 1
1.1. Background ......................................................................................................................... 1
1.2. Aims .................................................................................................................................... 2
1.3. Limitations ........................................................................................................................... 2
2. Theory ......................................................................................................................................... 3
2.1. Microalgae and microalgae cultivations .............................................................................. 3
2.2. Isolation techniques for microalgae ..................................................................................... 7
2.3. Freshwater microalgae species ............................................................................................ 8
2.4. An overview of a typical waste water treatment process .................................................. 10
2.5. Pre-treatments of biosludge from the Bäckhammar mill ................................................... 11
2.6. Total lipid content and fatty acid profile assay .................................................................. 11
2.7. Analytical methods ............................................................................................................ 12
3. Materials and Methods .............................................................................................................. 14
3.1. Growth of S. dimorphus UTEX 417 on biosludge in 5l glass reactors .............................. 14
3.2. Nutrient leaching measurements from HCl-treated biosludge .......................................... 18
3.3. Sampling, isolation and growth rate screenings of isolated local species ......................... 19
3.4. Analytical methods ............................................................................................................ 23
4. Results ....................................................................................................................................... 24
4.1. Growth of S. dimorphus UTEX 417 on pre-treated biosludge media ................................ 24
4.2. Nutrient leaching measurements from HCl-treated biosludge .......................................... 29
4.3. Isolation of local algae species from NPB ......................................................................... 34
4.4. Growth rate screenings of isolated algae species .............................................................. 36
4.5. Total lipid content and lipid profile assay of isolated local algal species.......................... 44
4.6. CHN-analysis of activated biosludge ................................................................................ 45
5. Discussion ................................................................................................................................. 46
5.1. Potential use of local isolated algae species from NPB ..................................................... 46
5.2. Treated biosludge as a source for nutritious medium ........................................................ 47
5.3. Possible large scale setup at NPB ...................................................................................... 48
6. Conclusion ................................................................................................................................. 49
7. Recommendations for future work ............................................................................................ 50
7. References ..................................................................................................................................... 51
8. Appendices ................................................................................................................................ 55
V
I. Total lipid extraction based on a modified Folch method ..................................................... 55
II. Biosludge and NPK calculations based on nitrogen levels ................................................... 56
III. Recipe 3N-BBM+V (Bolds Basal Medium, 3-fold Nitrogen + Vitamins) ........................ 57
IV. NPK medium formulation method .................................................................................... 58
V. Nutrient measurements with Hach-Lange cuvette test kits. .................................................. 59
VI. Standard curves and calculations for NH4+, NO3- and PO43- ......................................... 60
VII. Growth rate and generation time calculations ................................................................... 62
VIII. Biosludge medium formulation method ............................................................................ 63
IX. Method for growth screenings 1 and 2 of S. dimorphus on treated biosludge .................. 64
X. Method of nutrient leaching screening .................................................................................. 65
XI. Method for growth rate screenings of isolated algae species ............................................ 66
1
1. Introduction
1.1. Background
One of society’s greatest challenges is to reduce the environmental effects caused mainly by industrial
activities, but also from our everyday life. Global warming has been extensively studied and a
multitude of future scenarios have been proposed [3]. Countermeasures of different kinds have been
implemented to reduce the atmospheric warming; some are economic, e.g. control of CO2 [4], and
some are scientific, e.g. CO2 sinks or increased process efficiency for reduced emissions by [5]. All
counteracting measures aim for one of two effects, either to reduce the amounts of greenhouse gases
already present in the atmosphere or to diminish the amounts continually released.
Photoautotrophic organisms, such as terrestrial green plants, microalgae and photosynthetic bacteria,
utilize CO2 as a carbon source and light as energy source via photosynthesis. Previous studies have
shown promising results regarding the possibility to grow microalgae in reactors using flue gas
exhausts and other waste streams as nutrient sources to obtain a valuable biomass for production of
different bio-based substances [6-8]. The produced biomass can then be processed and refined into a
multitude of products, such as ethanol, methanol, hydrogen gas, diesel, pigments, etc. These products
will grant a profit from the produced algae, thereby creating additional revenue [9-11]. Bio-based
products can replace the production of chemicals and substances that today are produced in a
petrochemical way and thereby add both economical and ecological value to the process. This project
is intended to continue down that path, focusing on the development of a cheap but still effective
process of recycling the carbon from exhaust gases into biomass while keeping it as inexpensive as
possible. SP Technical Research Institute of Sweden is a key player in the microalgae field, leading a
large three-year project (2013-2015) sponsored by Vinnova and ÅF at the Swedish pulp- and paper
mill Nordic Paper Bäckhammar AB (NPB) and this thesis is an important part of this project. This
thesis is a continuation of previous thesis work done by Appelberg [12] and Öberg [13].
To lower costs it is necessary to use whatever resources that are readily available within the specific
industry. Solar energy can be used as a light source, flue gas as a carbon source, process- and
wastewater for nutrients (mainly nitrogen and phosphorous), as well as waste heat [14, 15]. Nutrients
are present not only in the water, but are also concentrated in the sludge produced in the sewage
treatment process. The use of this produced sludge will be a central part of this project. Agricultural
regulations restrict the use of sludge due to its often high heavy metal content, meaning it can’t be
used as a fertilizer despite the high content of nutrients. At NPB, the produced biosludge is only used
as soil filler instead of effectively utilizing the nutrients [16]. This is one reason why this project is
highly interesting. It would enable a new effective step in the sewage treatment process, as well as
providing a free source of essential nutrients. For efficient algal cultivations the challenge is to
develop a suitable leaching technique to satisfy the nutrient demand and also couple together the
reactor with flue gas for CO2 provision. The addition of CO2 would enhance the algal growth and
thereby increase the demand for available nutrients in the medium [17]. The medium should be clear
for efficient light penetration and still provide sufficient levels of nutrients [18].
Another challenge when cultivating algae in an open system is the risk of contamination and thereby
loss of the inoculated species and the aimed monoculture [19]. The species with the most effective
growth will outgrow any other species present in the cultivation. Reasonably, these effective species
should already be present in the local surroundings. It is costly to keep a monoculture in a bioreactor,
and therefore it would be highly beneficial to use local species with interesting cell composition.
Contamination may still occur, but will be minimized. A mixture of algae species could, however, be
2
beneficial if the consortium of algae has the right properties. Isolation, identification, and evaluation of
local species that already thrive in the environment are therefore an important aspect of this project.
1.2. Aims
The central questions that will be investigated are:
1. Is it possible to use sludge as a nutrient source for freshwater microalgae?
2. How can nutrients be leached from sludge to the freshwater medium most effectively? What,
if any, pre-treatments such as weak acid treatment or digestion of sludge can be utilized to
improve the release of nutrients?
3. Which nutrient is the growth limiting factor? Is it possible to increase leaching of this
nutrient?
4. Are there any local microalgae species of interest at NPB that can be used to fixate CO2 while
being suitable for production of any high-value bio-products?
5. Is it possible to cultivate any local algae isolates in biosludge-based growth medium?
6. Do the isolated microalgae have interesting cell contents of total proteins, total carbohydrates
or total lipids?
1.3. Limitations
This study will use simulated flue gas instead of the actual flue gas produced at NPB due to logistical
difficulties. The alga used for evaluating different leaching models of nutrients from sludge will be
Scenedesmus dimorphus (UTEX 417) originally isolated in Lund, Sweden. This was the chosen
inoculum strain for the first-year cultivation in 2013for the Bäckhammar Algae Farm pilot plant
located at NPB. However, algal growth rate and biomass formation on biosludge should be compared
to measured growth rates on nutrient rich growth media, thereby indicating the availability of leached
nutrients and the effectiveness of the leaching process compared to commercially available
alternatives. All performed experiments were of lab-scale.

3
2. Theory
2.1. Microalgae and microalgae cultivations
Microalgae is a diverse group of very different organisms, of marine and freshwater species,
filamentous and solitary species, red, green and diatom species, motile and non-motile species etc.
One common property is that all species can utilize phototrophic energy to survive and proliferate.
2.1.1. Photosynthesis
Photosynthetic reactions occur in the chloroplasts
within the cell. Inside the chloroplast are
thylakoids, which contain all of the cells
chlorophyll. The chloroplast can be seen in
Figure 1. The photosynthetic energy reactions are
separated in two sections, light-reactions and
light independent reactions as described by
O’Connor [20], and in two texts by Barsanti [21,
22]. In the light reactions H2O is oxidized to O2,
releasing electrons in the process. These are then
used to fixate CO2 in the light independent
reactions, and produce the molecules needed for
cell survival, e.g. carbohydrates, proteins and
fatty acids. An overview of these processes is
shown in Figure 2 [20, 21].
Light reactions
Two major systems are involved in the light
reactions, photosystem I (PS I) and photosystem II
(PS II) shown in Figure 3 [22]. According to
Barsanti [22], PS II is responsible for the formation
of protons, electrons and O2 from water via a light
energy input. Light energy excites an electron in
complex P680, which is transferred via several
protein intermediaries to plastoquinone. The now
charged complex P680+ is reduced in another
reaction cascade that results in a charged (Mn)4
cluster, which then oxidizes water molecules into
oxygen and protons.
The total reaction of PS II is
→
Figure 2: An overview of the photosynthetic processes,
showing the two separate subsystems. Light and water is
utilized in the light dependent reactions, generating ATP
and NADH. These energetic molecules are consumed in
the light independent reactions to form G3P, a substrate
to form glucose.
Figure 1: An overview of an algal chloroplast. Image taken
from Encyclopædia Britannica Online 2014-04-28

4
Barsanti [22] also describes how the protons form
a pH-gradient across the thylakoid membrane.
This leads to the production of ATP via an
ATPase as protons flow to the stroma to equalize
the gradient. The electrons carried from PSII by
plastoquinone are used in PS I in a separate
cascade reaction to generate NADPH via
ferredoxin-NADP+ reductase. A new
photosensitive complex P700 is excited by light to
generate electrons that are transferred to the
stroma and ferredoxin via Fe4S2 clusters.
Ferredoxin then provides NADP+ reductase with
electrons which in turn generates NADPH [22].
Both formed ATP and NADPH is used in the
light independent reactions to bind CO2 [1].
The light reactions can be summarized with the formula:
→
Light independent reactions
The light independent reactions are responsible
for the biosynthesis of carbohydrates from CO2,
which is done via the Calvin cycle shown in
Figure 4 [23]. The Calvin cycle reactions can be
summarized into the following equation
Figure 3: The light reactions of the photosynthetic
process, here displayed in the "Z-scheme" layout. The
light reactions are performed in two sections with two
photosystems, PSI and PSII. PSII initiates the reaction
by splitting water into oxygen, protons and electrons, and
generating electrons to PSI, which utilizes a second light
excitation to generate electrons to NADP+ reductase and
form NADPH.
Figure 4: The 3 phases of the Calvin cycle; carboxylation of CO2, reduction
of 3-phosphoglyceric acid, 3-PG, to glyceraldehyde 3-phosphate, G3P, and
regeneration of ribulose 1,5-biphosphate, RuBP. The process has great
energy requirements in the form of ATP and NADPH, both of which are
provided from the light reactions shown prior.
5
This process has high energy requirements, as 3ATP and 2NADPH is needed for every fixated CO2-
molecule [24]. Barsanti [22] describes the process as follows. The first step of CO2 fixation is the
reaction between CO2 and ribulose 1,5-bisphosphate (RuBP) via the enzyme RuBisCO. The formed
molecule is a 6C-molecule that is split into two separate identical 3C-molecules, 3-phosphoglyceric
acid (3-PG). Each 3-PG is then reduced to glyceraldehyde 3-phosphate (G3P), a molecule usable in
gluconeogenesis. This process consumes both an ATP as well as a NADPH molecule for each 3-PG. 2
G3P molecules were formed from the CO2 fixation. One of which is used to form carbohydrates and
one is used to regenerate the original CO2 acceptor RuBP. The G3P molecule is converted to the
intermediary Ru5P, which is then phosphorylated to RuBP by another ATP.
The light reaction systems and light independent reaction system cooperate to produce the necessary
metabolites needed for CO2 fixation. All energy originates from the sun and generates carbohydrates
with the familiar equation for photosynthesis: [22]
2.1.2. Algae cultivation requirements
A functional cell requires many different elements to ensure cell survival [25, 26]. A list of all
elements and the relative abundance in algae can be found in Table 1. According to Grobbelaar [25]
carbon is utilized by either autotrophic (CO2) or heterotrophic (organic compounds) growth, or
possibly a mix of the two (mixotrophic growth) [27]. Different species are capable of different growth
modes, e.g. S. quadricauda can grow mixotrophically on both organic carbon as well as CO2 [28],
whereas P. tricornutum only can utilize autotrophic growth [29].
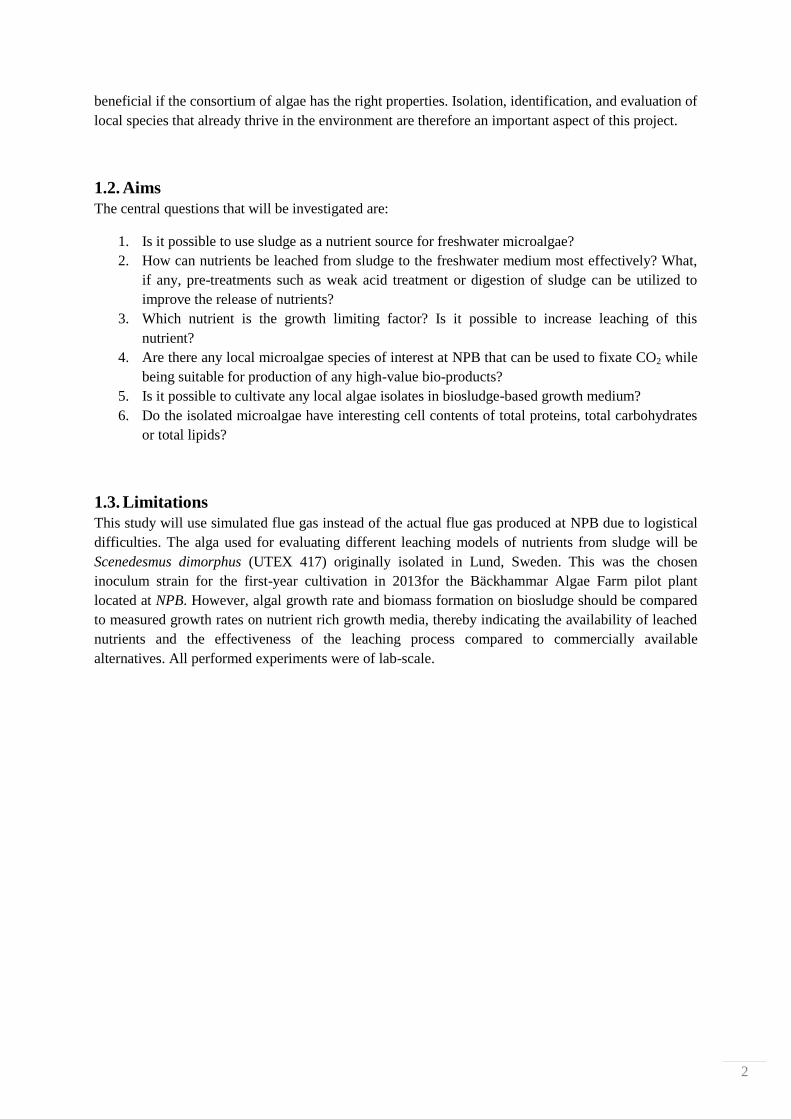
Table 1: A list of nutrients and the relative cell composition in algae. List taken from [25] 2014-04-28
A list of nutrients required by algal cells
Element Cell composition µg/mg dry weight
C 175-650
O 205-330
H 29-100
N 10-140
Na 0-4-47
K 1-75
Ca 0-80
P 0.5-33
S 1.5-1.6
Mg 0.5-75
Fe 0.2-34
Zn 0.005-1
Mn 0.02-0.24
Si 0-230
Nitrogen is often the growth limiting nutrient
in a culture and a great substantial nitrogen
supply is required for substantial growth [30].
Nitrogen can be supplied in both inorganic
forms such as NH4+, NO2
-, NO3
- etc. or organic
substances such as urea, amino acids, pyrines,
etc. It will be present as several of these
compounds when using natural sources, e.g.
waste water, as a source for cultivation media
[17, 25].
Fabricated media have the benefit of exactly
known compositions, but are expensive to
manufacture in greater quantities. A natural
nutrient source, e.g. waste water is often very
inexpensive but might be sub-optimal for use
as growth medium, due to a dark coloration,
toxic concentrations of various substances or
suboptimal levels of needed elements.
6
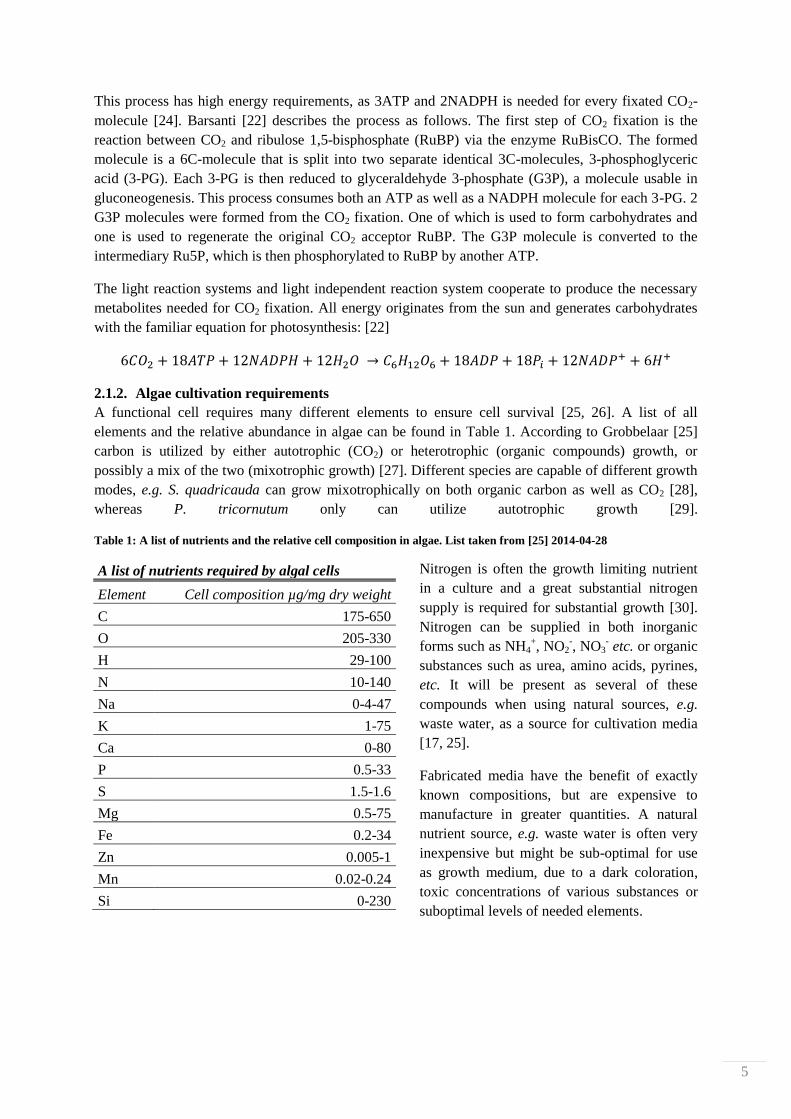
Algae are phototrophic organisms and are thus
able to utilize light as an energy source. The so
called Photosynthetic Active Radiation, or PAR
for short, are photons with wavelengths between
400-700 nm, which can be used in
photosynthetic processes [2]. A limited light
influx in the culture will limit algal growth [31].
However, heavy light stimulation might also be
harmful. This might cause a loss of
photoreceptors and degrade chlorophyll, while
also stimulating the production of photo-
protective carotenoids zeaxanthin and β-
carotene. It is therefore necessary to illuminate
algae cultures with enough light for
photosynthesis to function, but not enough to
cause photo inhibition [31, 32]. The effect of the
light influx on the specific growth rate can be
viewed in Figure 5.
pH in growth media
All organisms are more or less sensitive to environmental pH-changes. Freshwater microalgae are
known to thrive in somewhat neutral pH. [33, 34]. However, reports have also shown that some
freshwater alga, e.g. Scenedesmus dimorphus, have been successfully cultivated in acid media with
pH ~3 [28]. The pH can be controlled in several ways; as described by Richmond [35], it tends to rise
as an algal culture grows on carbon, but is lowered if CO2 is introduced to the medium by carbonic
acid formulation. This is because of the bicarbonate buffering system shown below that is formed
between CO2 and H2O.
This buffer shows a connection between the solubility of CO2 in water and the pH; at low pH the
equation is driven to the left due to an abundance of H+ ions, whereas at high pH the opposite happens.
This is described by Chen et al [36] where they evaluate the growth of different species in higher pH
(up to pH 9). They conclude that CO2 availability becomes the primary growth limiting factor at high
pH.
Figure 5: The correlation between light intensity and
specific growth rate in an otherwise uninhibited system.

7
2.2. Isolation techniques for microalgae
Suitable techniques for isolating cells vary with the cell type. Algae are commonly separated with one
or several of the following techniques; micromanipulation, serial dilution and streak plating. [37, 38]
Micromanipulation is a method where an operator manually chooses and transfers a single cell from a
sample to a new sterile medium with a micropipette in a microscope. It is then grown until a
monoculture can be confirmed via microscopy. It is an exact technique, but highly time-consuming.
The new growth is slow, due to the origin from a single cell, but at the same time it is possible to be
highly selective in which cells are transferred to form pure colonies.
Serial dilution is the use of multiple containers with sterile medium, where a small sample volume is
transferred to a container with sterile medium, which is stirred thoroughly. A small volume is drawn
and transferred to another container with sterile medium and stirred etc. By doing this enough the
original sample is diluted until only a single cell is transferred and results in a pure monoculture. This
technique is faster and easier to perform since only sterile containers and medium is needed.
Drawbacks include the risk of transferring two or more cells to a sterile medium and thereafter not
transferring any cells to the next container. This would not yield a single monoculture but a mixture of
several species. Another drawback with this technique is that only one colony can be purified from
each serial dilution when it might be necessary to isolate a multitude of different cells from the
original sample.
Streak plating can be and often is used in combination with a serial dilution. Plates are filled with a
sterile nutrition medium with an addition of a gelation agent, typically agar. This creates a semi solid
gel that contains all nutrients present in the original medium. However, introduced cells will be
stationary at the surface of the gel. A small volume of liquid containing cells is placed on the gel and
streaked out over the surface, hence the name streak plating. If this liquid contains a high cell number
the resulting colonies will possibly cover the entire plate and selection of individual colonies will be
all but impossible. It is therefore beneficial to combine the serial dilution with the streak plating, to
find an optimal dilution where there are several colonies to transfer but no trans-colonial growth is
observed. These cells will divide and grow by themselves, resulting in pure colonies which may be
transferred to new containers. This technique requires more preparations than only a serial dilution
since the agar gel has to be made. But, beneficially it is possible to choose exactly which colonies that
should be transferred. This will only work with cells capable of growing stationary on a surface.
8
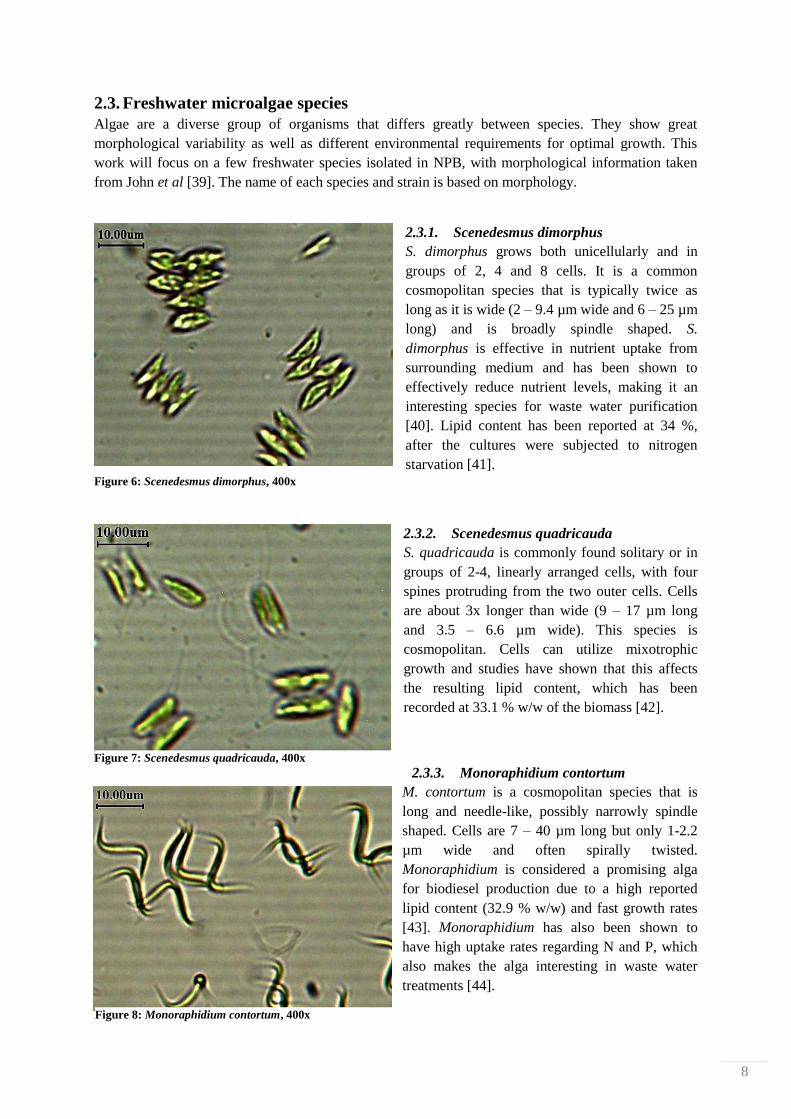
Figure 6: Scenedesmus dimorphus, 400x
2.3. Freshwater microalgae species
Algae are a diverse group of organisms that differs greatly between species. They show great
morphological variability as well as different environmental requirements for optimal growth. This
work will focus on a few freshwater species isolated in NPB, with morphological information taken
from John et al [39]. The name of each species and strain is based on morphology.
2.3.1. Scenedesmus dimorphus
S. dimorphus grows both unicellularly and in
groups of 2, 4 and 8 cells. It is a common
cosmopolitan species that is typically twice as
long as it is wide (2 – 9.4 µm wide and 6 – 25 µm
long) and is broadly spindle shaped. S.
dimorphus is effective in nutrient uptake from
surrounding medium and has been shown to
effectively reduce nutrient levels, making it an
interesting species for waste water purification
[40]. Lipid content has been reported at 34 %,
after the cultures were subjected to nitrogen
starvation [41].
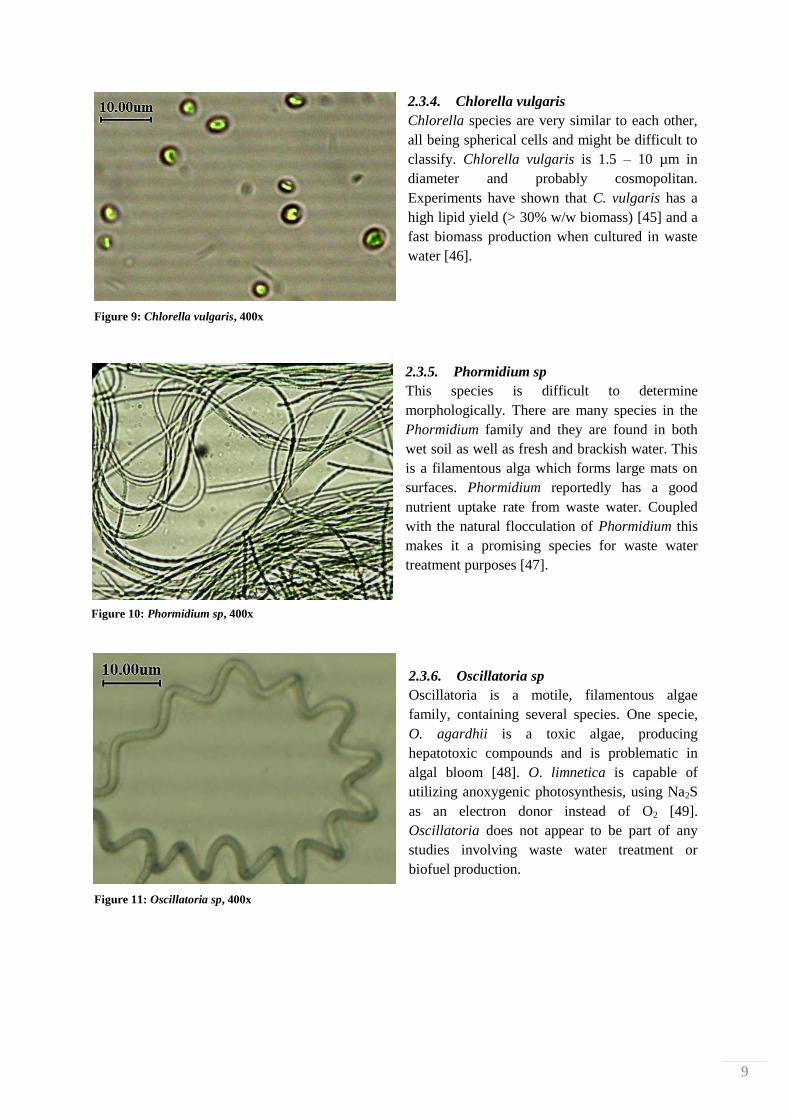
2.3.2. Scenedesmus quadricauda
S. quadricauda is commonly found solitary or in
groups of 2-4, linearly arranged cells, with four
spines protruding from the two outer cells. Cells
are about 3x longer than wide (9 – 17 µm long
and 3.5 – 6.6 µm wide). This species is
cosmopolitan. Cells can utilize mixotrophic
growth and studies have shown that this affects
the resulting lipid content, which has been
recorded at 33.1 % w/w of the biomass [42].
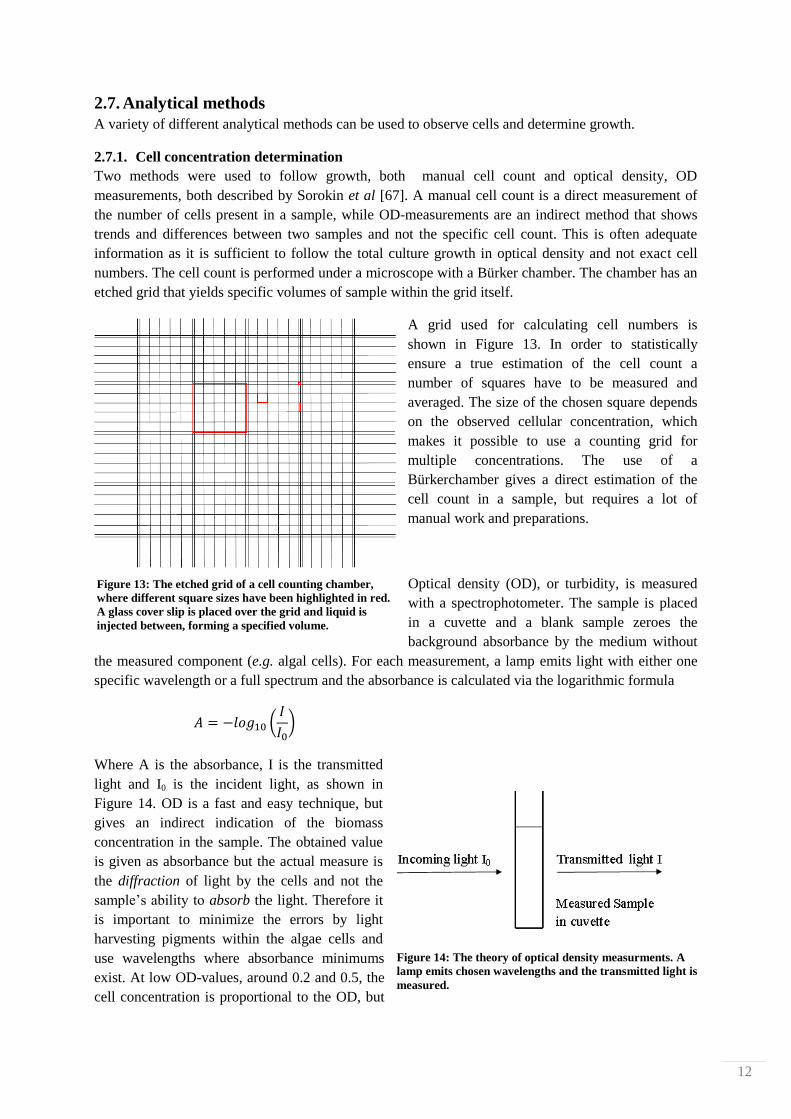
2.3.3. Monoraphidium contortum
M. contortum is a cosmopolitan species that is
long and needle-like, possibly narrowly spindle
shaped. Cells are 7 – 40 µm long but only 1-2.2
µm wide and often spirally twisted.
Monoraphidium is considered a promising alga
for biodiesel production due to a high reported
lipid content (32.9 % w/w) and fast growth rates
[43]. Monoraphidium has also been shown to
have high uptake rates regarding N and P, which
also makes the alga interesting in waste water
treatments [44].
Figure 7: Scenedesmus quadricauda, 400x
Figure 8: Monoraphidium contortum, 400x
9
Figure 11: Oscillatoria sp, 400x
2.3.4. Chlorella vulgaris
Chlorella species are very similar to each other,
all being spherical cells and might be difficult to
classify. Chlorella vulgaris is 1.5 – 10 µm in
diameter and probably cosmopolitan.
Experiments have shown that C. vulgaris has a
high lipid yield (> 30% w/w biomass) [45] and a
fast biomass production when cultured in waste
water [46].
2.3.5. Phormidium sp
This species is difficult to determine
morphologically. There are many species in the
Phormidium family and they are found in both
wet soil as well as fresh and brackish water. This
is a filamentous alga which forms large mats on
surfaces. Phormidium reportedly has a good
nutrient uptake rate from waste water. Coupled
with the natural flocculation of Phormidium this
makes it a promising species for waste water
treatment purposes [47].
2.3.6. Oscillatoria sp
Oscillatoria is a motile, filamentous algae
family, containing several species. One specie,
O. agardhii is a toxic algae, producing
hepatotoxic compounds and is problematic in
algal bloom [48]. O. limnetica is capable of
utilizing anoxygenic photosynthesis, using Na2S
as an electron donor instead of O2 [49].
Oscillatoria does not appear to be part of any
studies involving waste water treatment or
biofuel production.
Figure 9: Chlorella vulgaris, 400x
Figure 10: Phormidium sp, 400x

10
2.4. An overview of a typical waste water treatment process
Waste water treatment processes are similar whether the water has industrial or domestic origins. A
simplified overview can be found in Figure 12. The released quantity of organic matter and nutrients
must be controlled to avoid eutrophication of recipient waters [50, 51]. These processes are performed
in several phases that vary depending on the water type, but commonly included are mechanical
filtering, chemical and biological treatments and flocculation, sedimentation and removal of sludge
[52, 53].
First mechanical filters sort out fragments from
the water, often in several steps with gradually
finer meshes. This is to separate and remove
larger fragments as well as protect machinery
such as pumps from clogging [54].
Chemical treatments are based on aggregation of
nutrient salts and sediment formation which can
be easily separated from the water. One nutrient
that is commonly removed by chemical
treatments is phosphorous, which forms
aggregates in the presence of some metallic
cations, e.g. iron and aluminium [53].
Phosphorous and nitrogen are the two main
nutrients responsible for eutrophication and
should be fully removed [55, 56].
Removal of other nutrient salts, mainly nitrogen
compounds, requires other methods than
chemical treatments. This is often performed by
a biological treatment with bacteria during a two-
step process, nitrification and de-nitrification
[57]. Ammonia is first reduced to nitrite and
nitrate (nitrification), which is then further
reduced to nitrogen gas (de-nitrification) which
goes to the atmosphere. The organic matter
present in the liquid is simultaneously reduced
during this phase since the bacteria are using
available carbon together with dissolved nitrogen
compounds [57, 58].
It is important that the bacterial culture thrives fully to achieve optimal purification. If the content of
organic matter, nitrogen and phosphorous is unbalanced it might be necessary to add missing nutrients
to achieve a maximum growth rate. e.g. if the incoming water has a high amount of organic matter, but
is deprived of other nutrients it might be necessary to add those to achieve unlimited growth. The same
argument is valid if the water has a high content of nitrogen compounds, but is meager in organic
carbon or phosphorous [56, 58].
Small objects that passed the mechanical filtration together with aggregates from the chemical
treatment, bacteria, and degradation products from the biological treatment are bound together by an
added polymer. This helps the formation of a biosludge that is concentrated, collected, and removed
Figure 12: A step-by-step overview of the treatment
process of waste water. Black borders for refuse processes,
blue for water processes and brown for sludge processes.
For example: The second step in the process is a
mechanical filtration step. Water and larger objects are
separated by a mesh. The water goes through to the
sedimentation while the separated objects are dehydrated
and later collected for disposal. The dehydrated water goes
back into the process once again.

11
from the water [59]. The water can then be released to a recipient or undergo further treatments to
reduce nutrients and particles even more, such as microfiltration [60]. The sludge has limited uses as
of now since it often contains large amounts of heavy metals and other toxins, but this is highly
dependent on the water origin. However, it also contains many nutrients and is as such a potential
fertilizer. The use of biosludge is prohibited for most commercial areas of interest due to the often
high toxic content which for example prevents any agricultural uses. [56, 60].
2.5. Pre-treatments of biosludge from the Bäckhammar mill
According to Svensen [16] at NPB most of the nutrients in the biosludge are suspected to be
embedded in microorganisms. The sludge produced at NPB consists of mainly cellulosic fibers, lignin,
microorganisms and precipitation agents such as aluminium sulphate and polyacrylamide. NPB
produces approximately 20 metric tons of biosludge daily, which is a huge potential source for an
inexpensive production of algae growth medium. To access the nutrients, cellular membranes need to
be disrupted and lysed, or the fibers constituting the sludge to be disintegrated and thus free trapped
nutrients, which is possible via several methods. Three of these methods were chosen for this project;
acid-, base- and ultrasonic treatment. Ultrasonic treatments cause cavitations in the medium, which
propagates through the sample. These cavities can form extreme temperatures (>5000 K) and pressure
(>1000 atm) which cause permeable gaps in the cellular membranes and release the cytosolic
structures within [61, 62]. This might be effective in a small scale environment, but as volumes grow
larger this technique becomes more expensive and less efficient [62].
pH can be effectively manipulated at a low cost, especially if acid and/or base can be found in situ. A
strong acid or base will introduce highly reactive H+ and OH
- ions that react with organic matter.
Cellulose is difficult to hydrolyze due to incredibly large interactive forces within each fiber as well as
between different fibers [63]. These reactions will degrade and lysate cells and cellulose fibers, which
will enhance the nutrient availability. Cells that might otherwise be shielded by fibers will instead be
exposed to the treatments [64].
2.6. Total lipid content and fatty acid profile assay
To evaluate the total content of lipids in cell biomass an assay is performed by lysing the cells and
then phase separating polar cell structures e.g. proteins, from nonpolar structures, e.g. lipids. The
separated nonpolar phase then contains all fatty acids together with glycerol in the form of tri-
glycerides. It is possible to break the bonds between the fatty acids and the glycerol by methanolysis,
after which another phase separation can be performed to purify pure fatty acids in a non-polar solvent
[65, 66]. The method used in this project is a modified Folch method, which can be found in Appendix
I.
12
Figure 14: The theory of optical density measurments. A
lamp emits chosen wavelengths and the transmitted light is
measured.
2.7. Analytical methods
A variety of different analytical methods can be used to observe cells and determine growth.
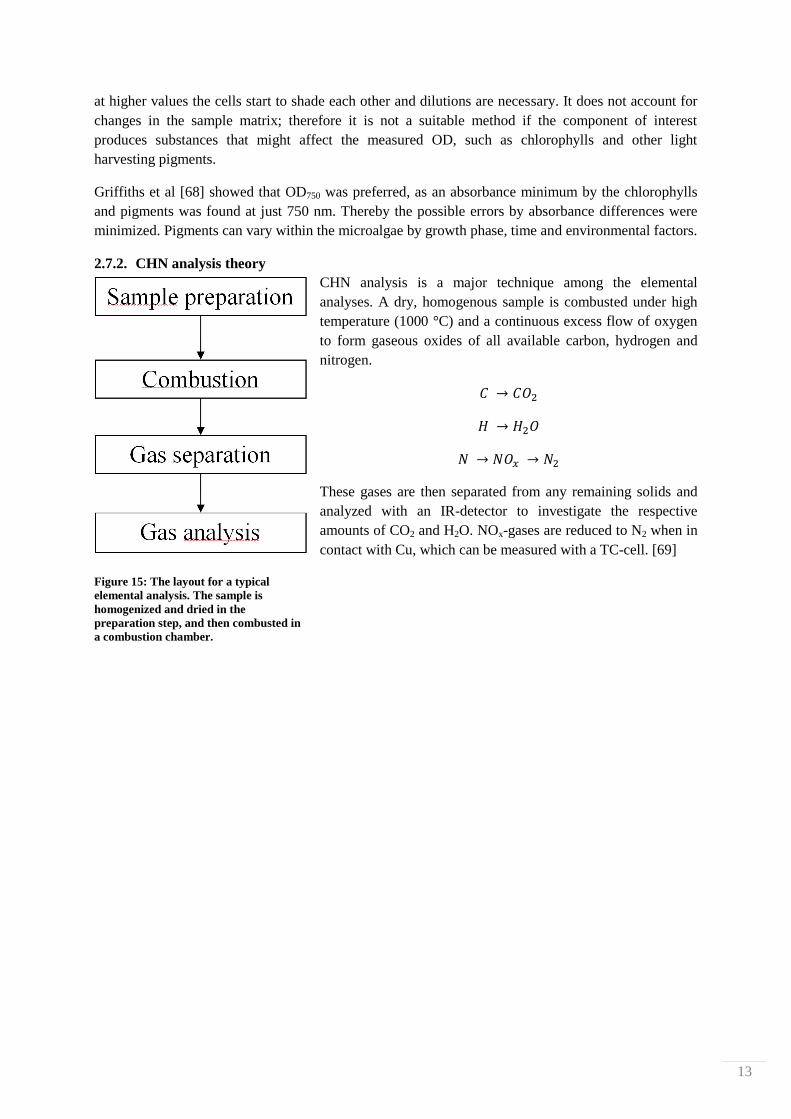
2.7.1. Cell concentration determination
Two methods were used to follow growth, both manual cell count and optical density, OD
measurements, both described by Sorokin et al [67]. A manual cell count is a direct measurement of
the number of cells present in a sample, while OD-measurements are an indirect method that shows
trends and differences between two samples and not the specific cell count. This is often adequate
information as it is sufficient to follow the total culture growth in optical density and not exact cell
numbers. The cell count is performed under a microscope with a Bürker chamber. The chamber has an
etched grid that yields specific volumes of sample within the grid itself.
A grid used for calculating cell numbers is
shown in Figure 13. In order to statistically
ensure a true estimation of the cell count a
number of squares have to be measured and
averaged. The size of the chosen square depends
on the observed cellular concentration, which
makes it possible to use a counting grid for
multiple concentrations. The use of a
Bürkerchamber gives a direct estimation of the
cell count in a sample, but requires a lot of
manual work and preparations.
Optical density (OD), or turbidity, is measured
with a spectrophotometer. The sample is placed
in a cuvette and a blank sample zeroes the
background absorbance by the medium without
the measured component (e.g. algal cells). For each measurement, a lamp emits light with either one
specific wavelength or a full spectrum and the absorbance is calculated via the logarithmic formula
(
)
Where A is the absorbance, I is the transmitted
light and I0 is the incident light, as shown in
Figure 14. OD is a fast and easy technique, but
gives an indirect indication of the biomass
concentration in the sample. The obtained value
is given as absorbance but the actual measure is
the diffraction of light by the cells and not the
sample’s ability to absorb the light. Therefore it
is important to minimize the errors by light
harvesting pigments within the algae cells and
use wavelengths where absorbance minimums
exist. At low OD-values, around 0.2 and 0.5, the
cell concentration is proportional to the OD, but
Figure 13: The etched grid of a cell counting chamber,
where different square sizes have been highlighted in red.
A glass cover slip is placed over the grid and liquid is
injected between, forming a specified volume.
13
at higher values the cells start to shade each other and dilutions are necessary. It does not account for
changes in the sample matrix; therefore it is not a suitable method if the component of interest
produces substances that might affect the measured OD, such as chlorophylls and other light
harvesting pigments.
Griffiths et al [68] showed that OD750 was preferred, as an absorbance minimum by the chlorophylls
and pigments was found at just 750 nm. Thereby the possible errors by absorbance differences were
minimized. Pigments can vary within the microalgae by growth phase, time and environmental factors.
2.7.2. CHN analysis theory
CHN analysis is a major technique among the elemental
analyses. A dry, homogenous sample is combusted under high
temperature (1000 °C) and a continuous excess flow of oxygen
to form gaseous oxides of all available carbon, hydrogen and
nitrogen.
These gases are then separated from any remaining solids and
analyzed with an IR-detector to investigate the respective
amounts of CO2 and H2O. NOx-gases are reduced to N2 when in
contact with Cu, which can be measured with a TC-cell. [69]
Figure 15: The layout for a typical
elemental analysis. The sample is
homogenized and dried in the
preparation step, and then combusted in
a combustion chamber.

14
3. Materials and Methods This work was based on 3 major experiments. First, the growth of the alga S. dimorphus directly on
biosludge dissolved in water was evaluated in 5l glass reactors. Secondly, the improved release of
nutrients from biosludge was evaluated by analysis of released nutrients and thirdly, several local
algae species found in situ at NPB were subjected to several growth screening cultivations with
varying growth media and high CO2 supply.
3.1. Growth of S. dimorphus UTEX 417 on biosludge in 5l glass reactors
Sludge was collected at NPB 2013-10-14 and stored at -40 oC. It was thawed and dried prior to each
experiment. Nitrogen content was used as a comparative baseline between the growth media. All
reactor tanks were to theoretically contain equal amounts of total nitrogen, as in 3N-BBM+V medium,
(124 mg N/l), thus, yield a total of 620 mg N in a reactor with 5 l working volume. Data from NPB
coupled with results from an elemental analysis at SP, Borås suggested that approximately 25 g
biosludge was sufficient to reach a level of 620 mg N. For detailed calculations, see Appendix II.
3.1.1. Experimental setup
Glass reactor tanks with 5 l growth medium were placed on magnetic stirrers under Growth
Technology T5HO 4x24 W lamps with a light/dark cycle of 16/8 hours. The photon flux was
measured at 90 µmol·m-2
·s-1
. Compressed air with no added CO2 was fed and divided to the 8 reactors
at a total feed rate of 1 l/min. The liquid temperature was 25-30 °C. The reactors were placed in room
temperature, but were also slightly heated by the magnetic stirrers. 50 ml blank sample was drawn and
stored before algal inoculation. pH and OD750 were measured daily.
The equipment used is shown in Figure 16 and shows the 8 reactors used. Tubing for inflow and
outflow of gas is visible over each reactor, together with a particle filter for the inflow. Syringes for
manual sampling were attached to a nozzle on each reactor.
15
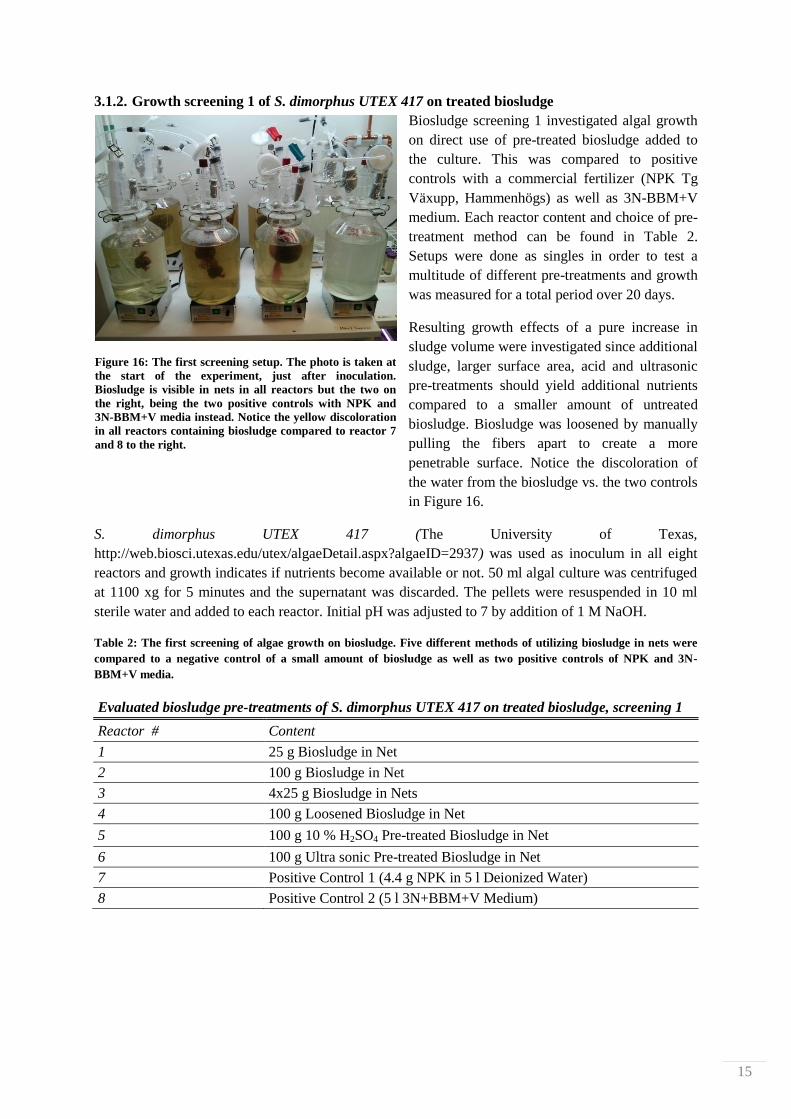
3.1.2. Growth screening 1 of S. dimorphus UTEX 417 on treated biosludge
Biosludge screening 1 investigated algal growth
on direct use of pre-treated biosludge added to
the culture. This was compared to positive
controls with a commercial fertilizer (NPK Tg
Växupp, Hammenhögs) as well as 3N-BBM+V
medium. Each reactor content and choice of pre-
treatment method can be found in Table 2.
Setups were done as singles in order to test a
multitude of different pre-treatments and growth
was measured for a total period over 20 days.
Resulting growth effects of a pure increase in
sludge volume were investigated since additional
sludge, larger surface area, acid and ultrasonic
pre-treatments should yield additional nutrients
compared to a smaller amount of untreated
biosludge. Biosludge was loosened by manually
pulling the fibers apart to create a more
penetrable surface. Notice the discoloration of
the water from the biosludge vs. the two controls
in Figure 16.
S. dimorphus UTEX 417 (The University of Texas,
http://web.biosci.utexas.edu/utex/algaeDetail.aspx?algaeID=2937) was used as inoculum in all eight
reactors and growth indicates if nutrients become available or not. 50 ml algal culture was centrifuged
at 1100 xg for 5 minutes and the supernatant was discarded. The pellets were resuspended in 10 ml
sterile water and added to each reactor. Initial pH was adjusted to 7 by addition of 1 M NaOH.
Table 2: The first screening of algae growth on biosludge. Five different methods of utilizing biosludge in nets were
compared to a negative control of a small amount of biosludge as well as two positive controls of NPK and 3N-
BBM+V media.
Evaluated biosludge pre-treatments of S. dimorphus UTEX 417 on treated biosludge, screening 1
Reactor # Content
1 25 g Biosludge in Net
2 100 g Biosludge in Net
3 4x25 g Biosludge in Nets
4 100 g Loosened Biosludge in Net
5 100 g 10 % H2SO4 Pre-treated Biosludge in Net
6 100 g Ultra sonic Pre-treated Biosludge in Net
7 Positive Control 1 (4.4 g NPK in 5 l Deionized Water)
8 Positive Control 2 (5 l 3N+BBM+V Medium)
Figure 16: The first screening setup. The photo is taken at
the start of the experiment, just after inoculation.
Biosludge is visible in nets in all reactors but the two on
the right, being the two positive controls with NPK and
3N-BBM+V media instead. Notice the yellow discoloration
in all reactors containing biosludge compared to reactor 7
and 8 to the right.
16
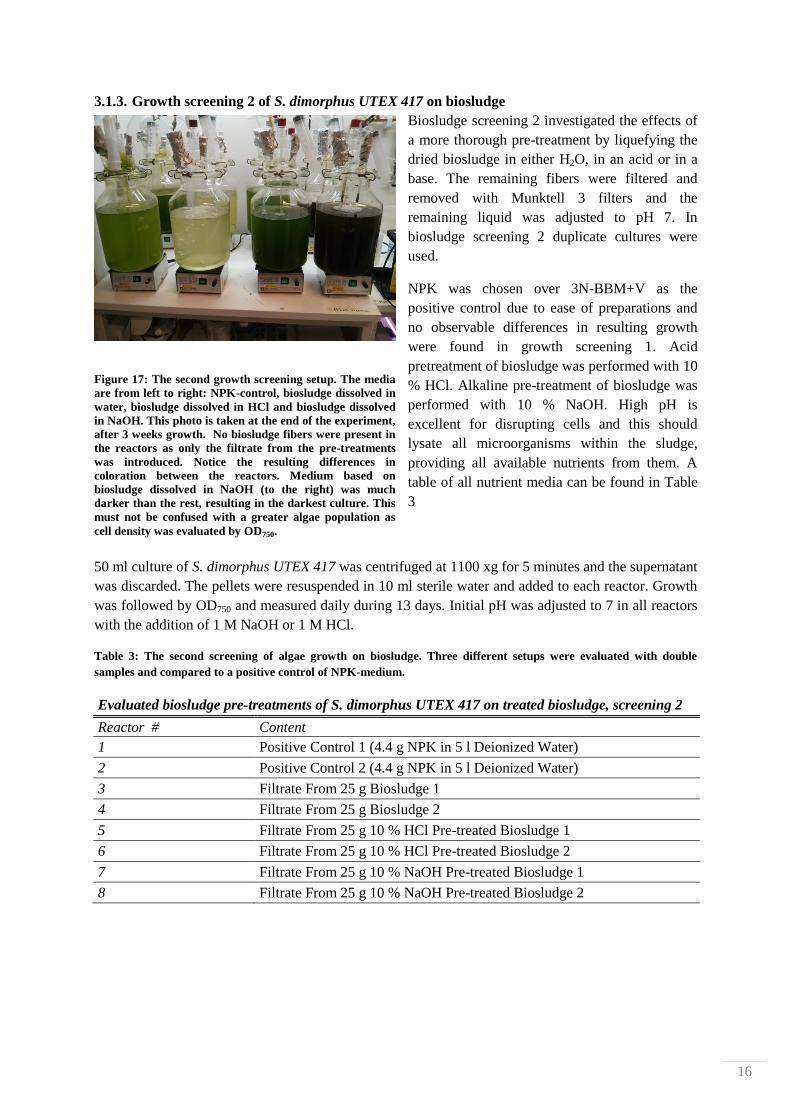
3.1.3. Growth screening 2 of S. dimorphus UTEX 417 on biosludge
Biosludge screening 2 investigated the effects of
a more thorough pre-treatment by liquefying the
dried biosludge in either H2O, in an acid or in a
base. The remaining fibers were filtered and
removed with Munktell 3 filters and the
remaining liquid was adjusted to pH 7. In
biosludge screening 2 duplicate cultures were
used.
NPK was chosen over 3N-BBM+V as the
positive control due to ease of preparations and
no observable differences in resulting growth
were found in growth screening 1. Acid
pretreatment of biosludge was performed with 10
% HCl. Alkaline pre-treatment of biosludge was
performed with 10 % NaOH. High pH is
excellent for disrupting cells and this should
lysate all microorganisms within the sludge,
providing all available nutrients from them. A
table of all nutrient media can be found in Table
3
50 ml culture of S. dimorphus UTEX 417 was centrifuged at 1100 xg for 5 minutes and the supernatant
was discarded. The pellets were resuspended in 10 ml sterile water and added to each reactor. Growth
was followed by OD750 and measured daily during 13 days. Initial pH was adjusted to 7 in all reactors
with the addition of 1 M NaOH or 1 M HCl.
Table 3: The second screening of algae growth on biosludge. Three different setups were evaluated with double
samples and compared to a positive control of NPK-medium.
Evaluated biosludge pre-treatments of S. dimorphus UTEX 417 on treated biosludge, screening 2
Reactor # Content
1 Positive Control 1 (4.4 g NPK in 5 l Deionized Water)
2 Positive Control 2 (4.4 g NPK in 5 l Deionized Water)
3 Filtrate From 25 g Biosludge 1
4 Filtrate From 25 g Biosludge 2
5 Filtrate From 25 g 10 % HCl Pre-treated Biosludge 1
6 Filtrate From 25 g 10 % HCl Pre-treated Biosludge 2
7 Filtrate From 25 g 10 % NaOH Pre-treated Biosludge 1
8 Filtrate From 25 g 10 % NaOH Pre-treated Biosludge 2
Figure 17: The second growth screening setup. The media
are from left to right: NPK-control, biosludge dissolved in
water, biosludge dissolved in HCl and biosludge dissolved
in NaOH. This photo is taken at the end of the experiment,
after 3 weeks growth. No biosludge fibers were present in
the reactors as only the filtrate from the pre-treatments
was introduced. Notice the resulting differences in
coloration between the reactors. Medium based on
biosludge dissolved in NaOH (to the right) was much
darker than the rest, resulting in the darkest culture. This
must not be confused with a greater algae population as
cell density was evaluated by OD750.
17
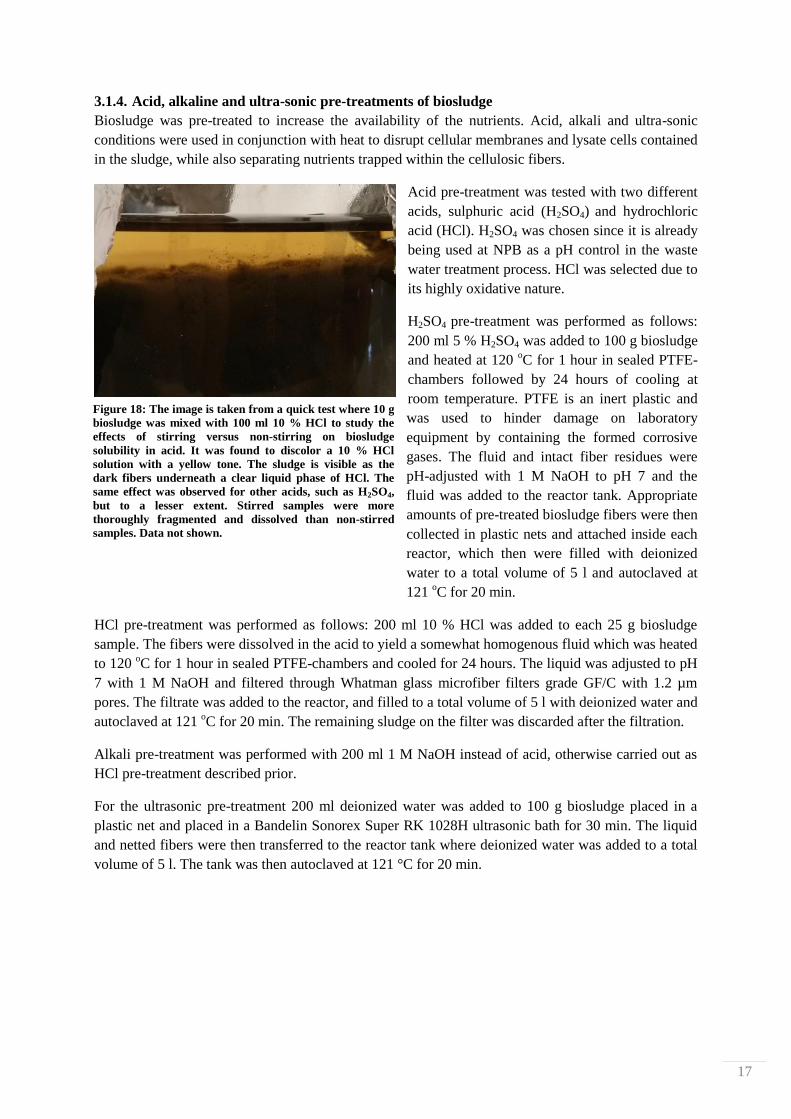
3.1.4. Acid, alkaline and ultra-sonic pre-treatments of biosludge
Biosludge was pre-treated to increase the availability of the nutrients. Acid, alkali and ultra-sonic
conditions were used in conjunction with heat to disrupt cellular membranes and lysate cells contained
in the sludge, while also separating nutrients trapped within the cellulosic fibers.
Acid pre-treatment was tested with two different
acids, sulphuric acid (H2SO4) and hydrochloric
acid (HCl). H2SO4 was chosen since it is already
being used at NPB as a pH control in the waste
water treatment process. HCl was selected due to
its highly oxidative nature.
H2SO4 pre-treatment was performed as follows:
200 ml 5 % H2SO4 was added to 100 g biosludge
and heated at 120 oC for 1 hour in sealed PTFE-
chambers followed by 24 hours of cooling at
room temperature. PTFE is an inert plastic and
was used to hinder damage on laboratory
equipment by containing the formed corrosive
gases. The fluid and intact fiber residues were
pH-adjusted with 1 M NaOH to pH 7 and the
fluid was added to the reactor tank. Appropriate
amounts of pre-treated biosludge fibers were then
collected in plastic nets and attached inside each
reactor, which then were filled with deionized
water to a total volume of 5 l and autoclaved at
121 oC for 20 min.
HCl pre-treatment was performed as follows: 200 ml 10 % HCl was added to each 25 g biosludge
sample. The fibers were dissolved in the acid to yield a somewhat homogenous fluid which was heated
to 120 oC for 1 hour in sealed PTFE-chambers and cooled for 24 hours. The liquid was adjusted to pH
7 with 1 M NaOH and filtered through Whatman glass microfiber filters grade GF/C with 1.2 µm
pores. The filtrate was added to the reactor, and filled to a total volume of 5 l with deionized water and
autoclaved at 121 oC for 20 min. The remaining sludge on the filter was discarded after the filtration.
Alkali pre-treatment was performed with 200 ml 1 M NaOH instead of acid, otherwise carried out as
HCl pre-treatment described prior.
For the ultrasonic pre-treatment 200 ml deionized water was added to 100 g biosludge placed in a
plastic net and placed in a Bandelin Sonorex Super RK 1028H ultrasonic bath for 30 min. The liquid
and netted fibers were then transferred to the reactor tank where deionized water was added to a total
volume of 5 l. The tank was then autoclaved at 121 °C for 20 min.
Figure 18: The image is taken from a quick test where 10 g
biosludge was mixed with 100 ml 10 % HCl to study the
effects of stirring versus non-stirring on biosludge
solubility in acid. It was found to discolor a 10 % HCl
solution with a yellow tone. The sludge is visible as the
dark fibers underneath a clear liquid phase of HCl. The
same effect was observed for other acids, such as H2SO4,
but to a lesser extent. Stirred samples were more
thoroughly fragmented and dissolved than non-stirred
samples. Data not shown.
18
3.1.5. Formulation of positive control media 3N-BBM+V and NPK
Three different growth media were used in the experiments performed in this project, Bolds basal
medium with added vitamins and 3x nitrogen, (henceforth called 3N-BBM+V or just Bolds), NPK-
medium (henceforth called NPK) and treated biosludge medium. Bolds medium is often used for algal
lab cultivation and is formulated to contain all necessary ingredients for viable growth. The nitrogen
source of Bold’s consists only of nitrate. NPK is a commercial fertilizer consisting of 14% nitrogen
(N), 3% phosphorus (P), 15% potassium (K) and 10% sulfur (S). The nitrogen in NPK is 7.8 % NH4+
and 6.2 % NO3-, i.e. mainly ammonium. 3N-BBM+V and NPK medium recipes are found in Appendix
III and IV.
3.2. Nutrient leaching measurements from HCl-treated biosludge
The second part of this work was to review nutrient leaching from pre-treated biosludge. A screening
was performed to evaluate the impact of time and temperature on nutrient leaching in acidified
biosludge. It was reasoned that a higher temperature and longer time would result in greater nutrient
concentrations. This experiment was performed to yield an indication of the possibilities to perform an
acid treatment at temperatures attained by waste heat produced at NPB,.
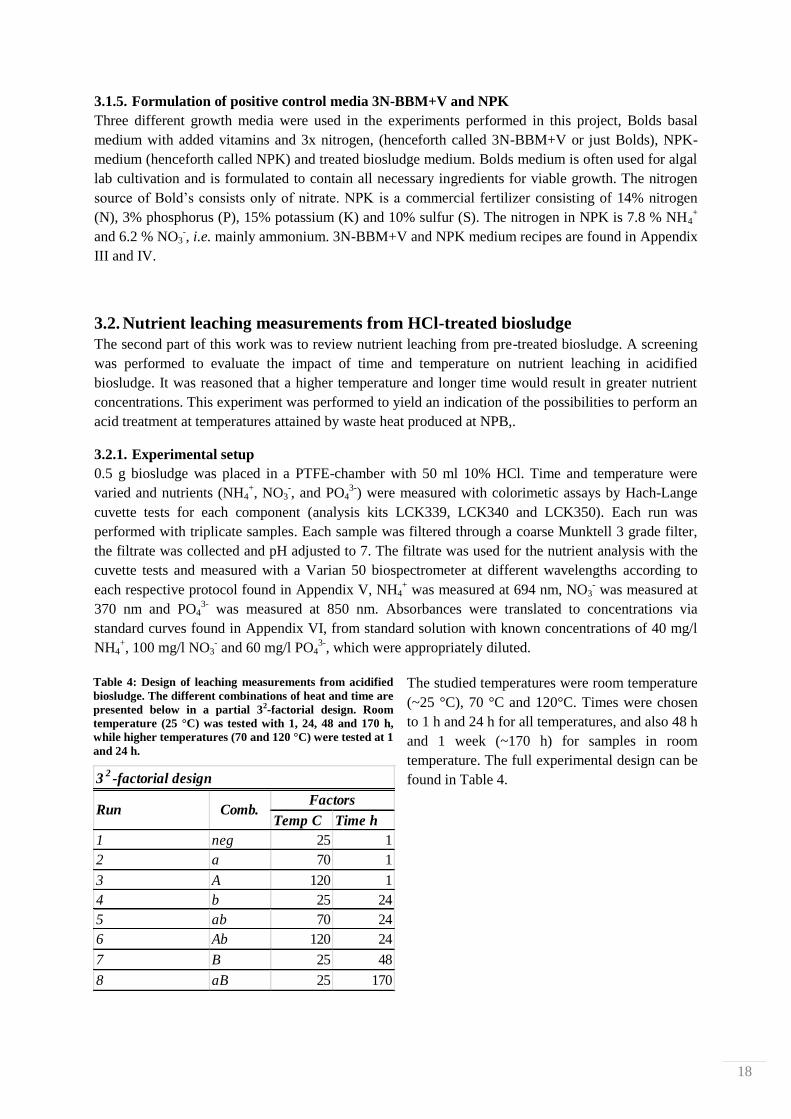
3.2.1. Experimental setup
0.5 g biosludge was placed in a PTFE-chamber with 50 ml 10% HCl. Time and temperature were
varied and nutrients (NH4+, NO3
-, and PO4
3-) were measured with colorimetic assays by Hach-Lange
cuvette tests for each component (analysis kits LCK339, LCK340 and LCK350). Each run was
performed with triplicate samples. Each sample was filtered through a coarse Munktell 3 grade filter,
the filtrate was collected and pH adjusted to 7. The filtrate was used for the nutrient analysis with the
cuvette tests and measured with a Varian 50 biospectrometer at different wavelengths according to
each respective protocol found in Appendix V, NH4+ was measured at 694 nm, NO3
- was measured at
370 nm and PO43-
was measured at 850 nm. Absorbances were translated to concentrations via
standard curves found in Appendix VI, from standard solution with known concentrations of 40 mg/l
NH4+, 100 mg/l NO3
- and 60 mg/l PO4
3-, which were appropriately diluted.
The studied temperatures were room temperature
(~25 °C), 70 °C and 120°C. Times were chosen
to 1 h and 24 h for all temperatures, and also 48 h
and 1 week (~170 h) for samples in room
temperature. The full experimental design can be
found in Table 4.
Temp C Time h
1 neg 25 1
2 a 70 1
3 A 120 1
4 b 25 24
5 ab 70 24
6 Ab 120 24
7 B 25 48
8 aB 25 170
32-factorial design
Run Comb.Factors
Table 4: Design of leaching measurements from acidified
biosludge. The different combinations of heat and time are
presented below in a partial 32-factorial design. Room
temperature (25 °C) was tested with 1, 24, 48 and 170 h,
while higher temperatures (70 and 120 °C) were tested at 1
and 24 h.
19
3.3. Sampling, isolation and growth rate screenings of isolated local species
The third part of this project was to isolate and evaluate growth rate differences and cell composition
between any local species found in situ at NPB. A small-scale batch screening setup was developed to
investigate the effects of high CO2 exposure levels up to 15 % v/v. Increased CO2 levels reduces
carbon limitations for cell growth, but organisms might be sensitive to higher CO2 levels, which would
deem them unsuitable for use in flue gas cultures.
3.3.1. Sampling and isolation of local microalgal strains
Water samples were collected in situ at NPB in and around the existing pilot plant, i.e. from a raceway
system, and Tethys reactor pools. Samples were also taken from the waste water treatment plant at
NPB, from sedimentation ponds and bioreactors 1 and 2, as well as from the air by exposing a flask of
3N-BBM+V medium to the open surroundings. The samples were transferred to tissue culture flasks
containing 20 ml 3N-BBM+V. The bottles were illuminated with 90 µmol photons/m2·s during a 16/8
h light cycle for 2 weeks until algal growth was observed. 1 % agar plates were made from 3N-
BBM+V medium and used for the isolation of individual cells to monocultures. The cultures were
serially diluted up to 1010
x and 200 µl of each dilution was spread on agar plates, which also were
placed under light with a 16/8 h light/dark cycle for 2 more weeks. Separate colonies were selected
from the plates and transferred to 5 ml sterile 3N-BBM+V medium in 50 ml tissue culture flasks. The
flasks were placed under light and later verified to be monocultures based on the algal morphology.
An additional 35 ml new medium was added after monocultures were verified. Confirmed
monocultures were inoculated in several back-ups for storage purposes. All flasks were examined
regularly for infections and kept sterile.
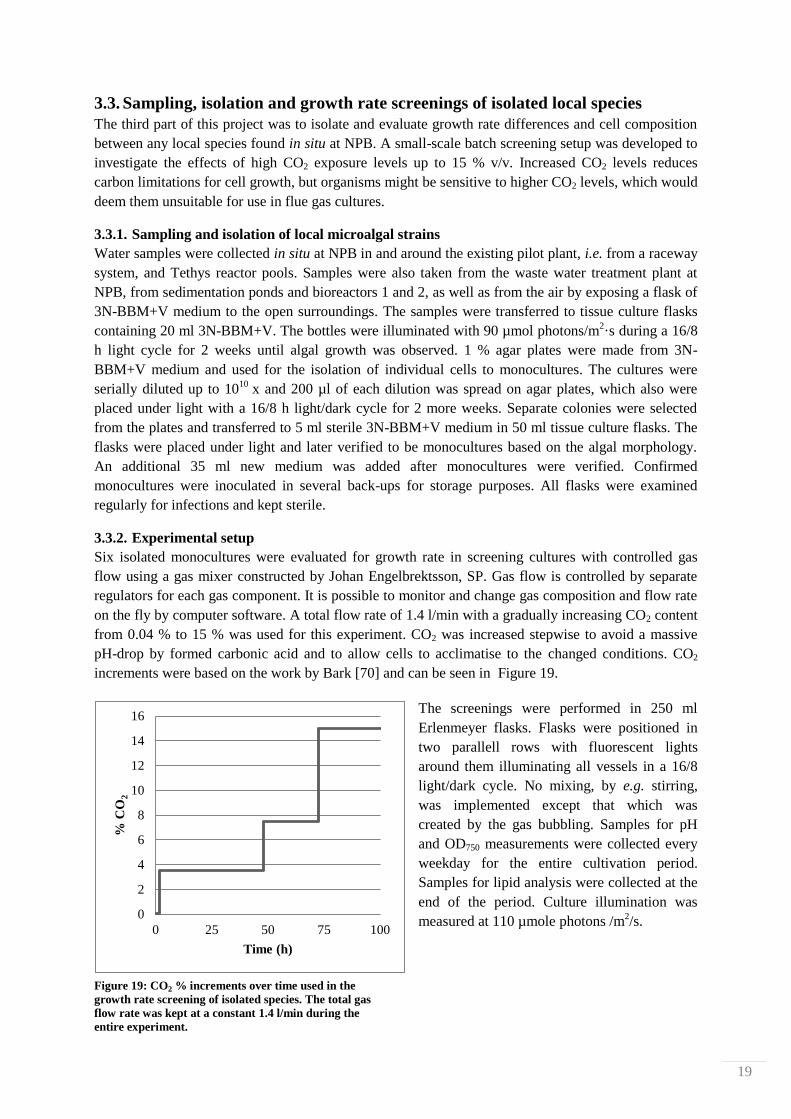
3.3.2. Experimental setup
Six isolated monocultures were evaluated for growth rate in screening cultures with controlled gas
flow using a gas mixer constructed by Johan Engelbrektsson, SP. Gas flow is controlled by separate
regulators for each gas component. It is possible to monitor and change gas composition and flow rate
on the fly by computer software. A total flow rate of 1.4 l/min with a gradually increasing CO2 content
from 0.04 % to 15 % was used for this experiment. CO2 was increased stepwise to avoid a massive
pH-drop by formed carbonic acid and to allow cells to acclimatise to the changed conditions. CO2
increments were based on the work by Bark [70] and can be seen in Figure 19.
The screenings were performed in 250 ml
Erlenmeyer flasks. Flasks were positioned in
two parallell rows with fluorescent lights
around them illuminating all vessels in a 16/8
light/dark cycle. No mixing, by e.g. stirring,
was implemented except that which was
created by the gas bubbling. Samples for pH
and OD750 measurements were collected every
weekday for the entire cultivation period.
Samples for lipid analysis were collected at the
end of the period. Culture illumination was
measured at 110 µmole photons /m2/s.
0
2
4
6
8
10
12
14
16
0 25 50 75 100
% C
O2
Time (h)
Figure 19: CO2 % increments over time used in the
growth rate screening of isolated species. The total gas
flow rate was kept at a constant 1.4 l/min during the
entire experiment.
20
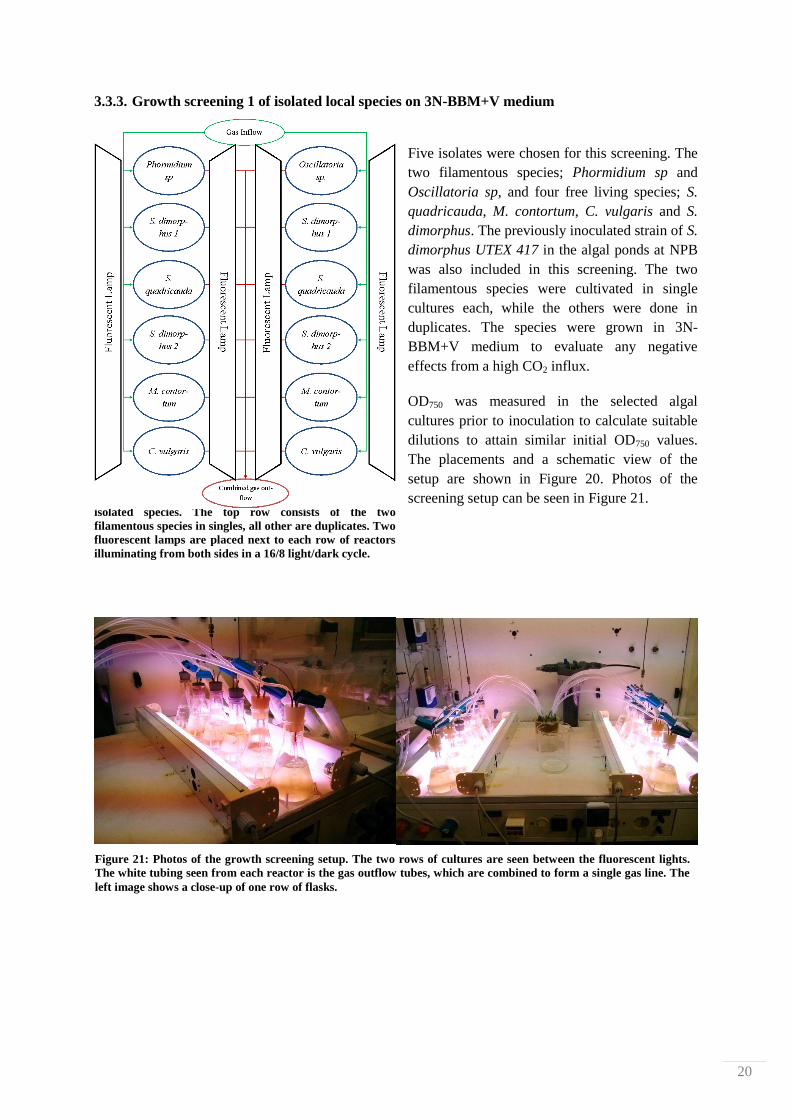
3.3.3. Growth screening 1 of isolated local species on 3N-BBM+V medium
Five isolates were chosen for this screening. The
two filamentous species; Phormidium sp and
Oscillatoria sp, and four free living species; S.
quadricauda, M. contortum, C. vulgaris and S.
dimorphus. The previously inoculated strain of S.
dimorphus UTEX 417 in the algal ponds at NPB
was also included in this screening. The two
filamentous species were cultivated in single
cultures each, while the others were done in
duplicates. The species were grown in 3N-
BBM+V medium to evaluate any negative
effects from a high CO2 influx.
OD750 was measured in the selected algal
cultures prior to inoculation to calculate suitable
dilutions to attain similar initial OD750 values.
The placements and a schematic view of the
setup are shown in Figure 20. Photos of the
screening setup can be seen in Figure 21.
Figure 20: The layout of the growth rate screening of
isolated species. The top row consists of the two
filamentous species in singles, all other are duplicates. Two
fluorescent lamps are placed next to each row of reactors
illuminating from both sides in a 16/8 light/dark cycle.
Figure 21: Photos of the growth screening setup. The two rows of cultures are seen between the fluorescent lights.
The white tubing seen from each reactor is the gas outflow tubes, which are combined to form a single gas line. The
left image shows a close-up of one row of flasks.
21
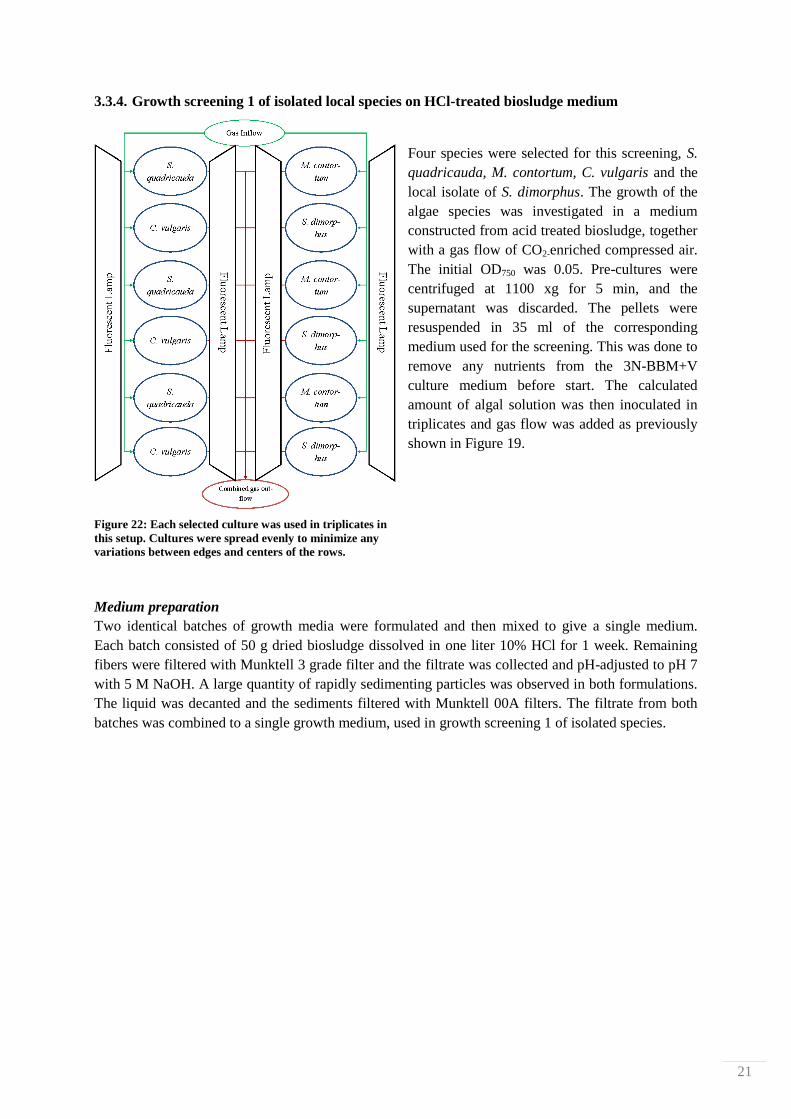
3.3.4. Growth screening 1 of isolated local species on HCl-treated biosludge medium
Four species were selected for this screening, S.
quadricauda, M. contortum, C. vulgaris and the
local isolate of S. dimorphus. The growth of the
algae species was investigated in a medium
constructed from acid treated biosludge, together
with a gas flow of CO2-enriched compressed air.
The initial OD750 was 0.05. Pre-cultures were
centrifuged at 1100 xg for 5 min, and the
supernatant was discarded. The pellets were
resuspended in 35 ml of the corresponding
medium used for the screening. This was done to
remove any nutrients from the 3N-BBM+V
culture medium before start. The calculated
amount of algal solution was then inoculated in
triplicates and gas flow was added as previously
shown in Figure 19.
Medium preparation
Two identical batches of growth media were formulated and then mixed to give a single medium.
Each batch consisted of 50 g dried biosludge dissolved in one liter 10% HCl for 1 week. Remaining
fibers were filtered with Munktell 3 grade filter and the filtrate was collected and pH-adjusted to pH 7
with 5 M NaOH. A large quantity of rapidly sedimenting particles was observed in both formulations.
The liquid was decanted and the sediments filtered with Munktell 00A filters. The filtrate from both
batches was combined to a single growth medium, used in growth screening 1 of isolated species.
Figure 22: Each selected culture was used in triplicates in
this setup. Cultures were spread evenly to minimize any
variations between edges and centers of the rows.
22
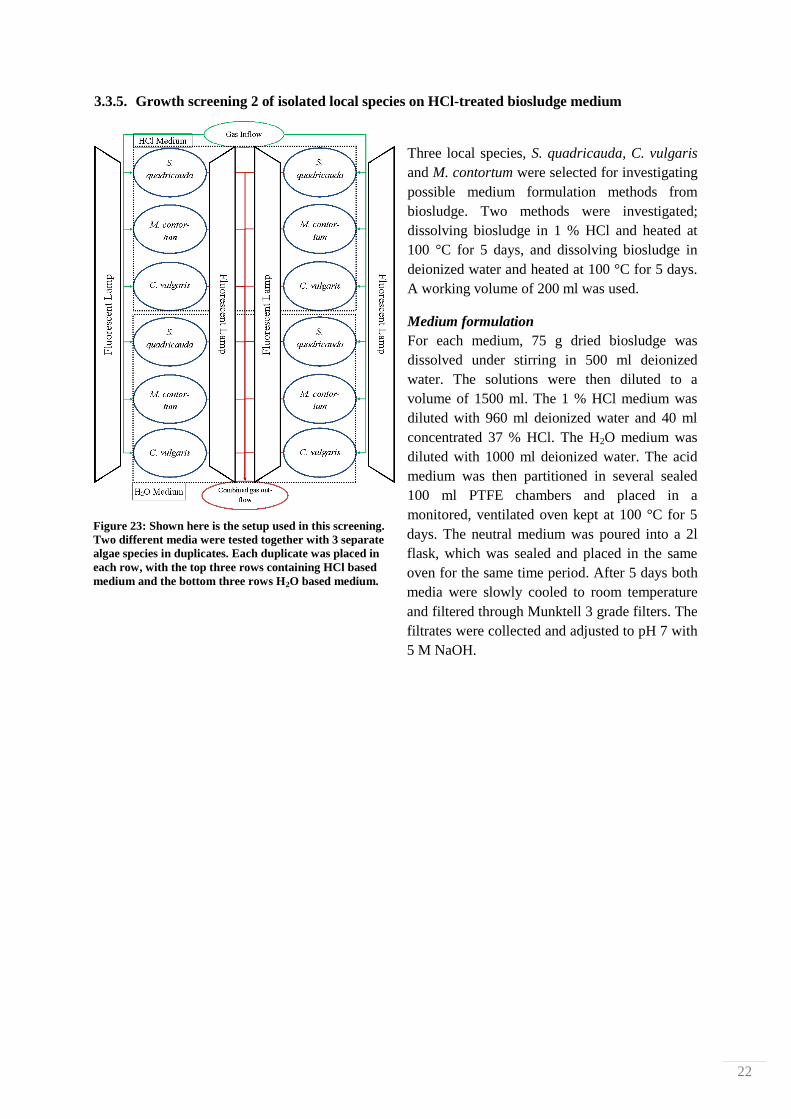
3.3.5. Growth screening 2 of isolated local species on HCl-treated biosludge medium
Three local species, S. quadricauda, C. vulgaris
and M. contortum were selected for investigating
possible medium formulation methods from
biosludge. Two methods were investigated;
dissolving biosludge in 1 % HCl and heated at
100 °C for 5 days, and dissolving biosludge in
deionized water and heated at 100 °C for 5 days.
A working volume of 200 ml was used.
Medium formulation
For each medium, 75 g dried biosludge was
dissolved under stirring in 500 ml deionized
water. The solutions were then diluted to a
volume of 1500 ml. The 1 % HCl medium was
diluted with 960 ml deionized water and 40 ml
concentrated 37 % HCl. The H2O medium was
diluted with 1000 ml deionized water. The acid
medium was then partitioned in several sealed
100 ml PTFE chambers and placed in a
monitored, ventilated oven kept at 100 °C for 5
days. The neutral medium was poured into a 2l
flask, which was sealed and placed in the same
oven for the same time period. After 5 days both
media were slowly cooled to room temperature
and filtered through Munktell 3 grade filters. The
filtrates were collected and adjusted to pH 7 with
5 M NaOH.
Figure 23: Shown here is the setup used in this screening.
Two different media were tested together with 3 separate
algae species in duplicates. Each duplicate was placed in
each row, with the top three rows containing HCl based
medium and the bottom three rows H2O based medium.
23
3.4. Analytical methods
Different tools have been used to evaluate and monitor the different cultures and to follow progress in
reactors and culture flasks.
3.4.1. Optical density and pH measurements
Optical density, or synonymously turbidity, (OD) has been used to follow growth. 1.5 ml samples
were transferred from reactors to Eppendorf tubes and analyzed in 1 ml cuvettes in a Varian 50
Biospectrophotometer. Blanks were drawn prior to algal inoculation and continually used when
measuring OD from all collected samples. The background probably changes during the cultivation,
but was assumed to be constant for simplicity. OD was measured at 750 nm with duplicate
measurements of each sample, where each measurement was the average of three readings. All reactor
vessels were manually shaken prior each sampling to ensure thorough mixing of all cultures.
pH was measured with a SympHony SP80PD pH-meter to assess pH-variations during algae growth. 2
ml samples were drafted from the reactor tanks and transferred to a cuvette for measurements.
3.4.2. Optical microscopy and cell counting
Algae culture samples were evaluated optically using a Dialux 20 microscope and a Visicam 5.0
camera. Images were taken with 400x and 1000x magnification. A Bürker chamber allowed for a
method to count cells in different samples. 200 µl cell suspension was added to the chamber and
placed in the microscope. For cell counting 15 E-squares were selected at random. All cells within the
squares together with those touching the top and left borders were counted, averaged and multiplied
with the factor 40 000 to obtain cells/ml. The factor is based on the volume of the E-square, which is
0.025 µl.
3.4.3. Dry weight measurements of produced final biomass concentrations
The dry weight of produced biomass was determined from duplicate 50 ml samples collected from
each reactor. The samples were dried in a ventilated 80 °C oven over night. Duplicate 50 ml
background samples were also drawn, to be subtracted from the background matrix in all reactors. It
was not possible to identify the exact volume of the original medium still present at the end of the
cultivation period. A theoretical maximum background weight was therefore subtracted from the
produced biomass instead.
3.4.4. CHN-analysis of biosludge
Approximately 3 g humid sludge was dried in an oven at 60 oC for 12 h. The heat was then increased
to 90 oC for 2 h and finally to 105
oC for 1 h until the sample was dry enough to analyze. The dry
sample was then weighed, covered in aluminum and pelleted for use in a Leco CHN628 analyzer.
3.4.5. Total lipid content and fatty acid profile assay of isolated local algal species
A lipid assay was performed based on the Folch method [65]. Wet biomass samples were collected at
the end of the screening of isolated species on 3N-BBM+V and from screening 2 of isolated species
on biosludge-based media. The solutions were centrifuged and the supernatant was discarded. Cells
were lysed with a 2:1 mixture of chloroform: methanol and phase separated by an addition of a 0.73 %
NaCl in H2O solution. The oil phase containing the lipids were collected and dried overnight. Lipids
were then resolved in hexane and the glycerol backbone was extracted by methanolysis. The
remaining hexane phase were collected in crimped GC-vials. For a detailed method, see Appendix I.
24
4. Results
4.1. Growth of S. dimorphus UTEX 417 on pre-treated biosludge media
The possibilities to use biosludge as the basis of an algal growth medium were assessed with two
screenings. Growth of the alga S. dimorphus was measured in several different media based on various
biosludge treatments, in order to identify any promising methods of increasing nutrient availability.
Both screenings contained positive and negative controls, consisting of nutrient rich medium and
untreated biosludge. Untreated biosludge was considered a negative control since effective pre-
treatments should yield imroved nutrient availability, and thereby better growth.
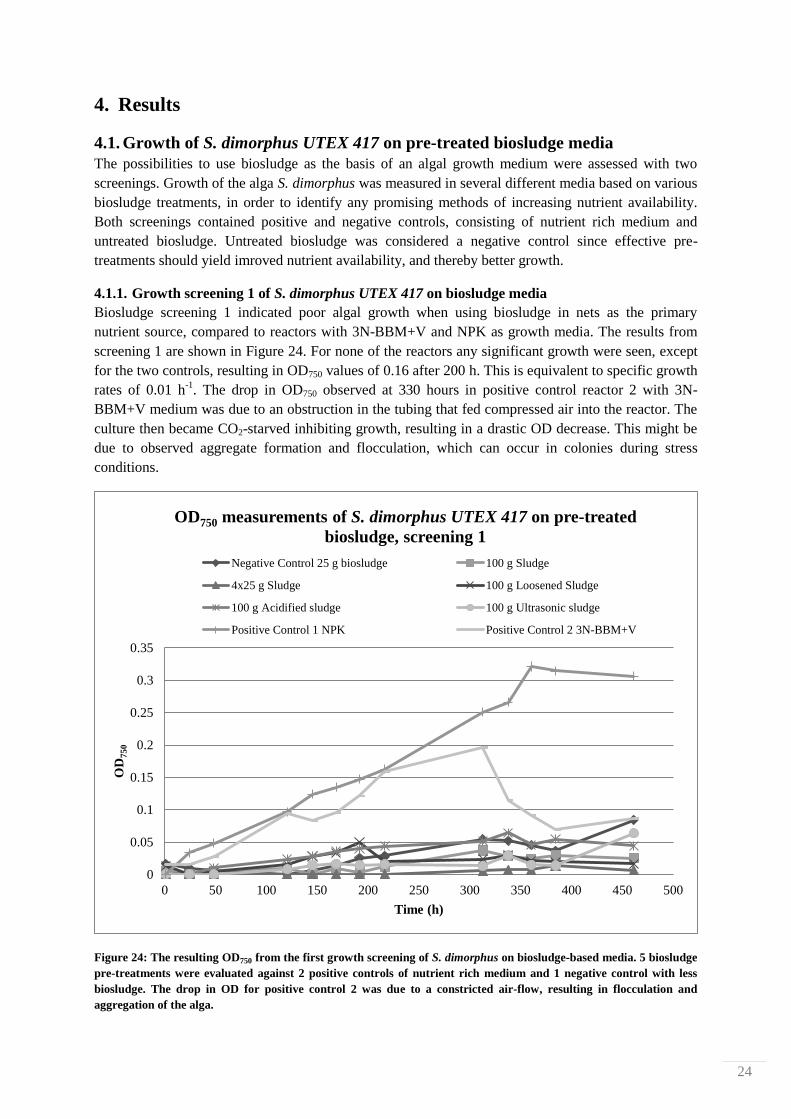
4.1.1. Growth screening 1 of S. dimorphus UTEX 417 on biosludge media
Biosludge screening 1 indicated poor algal growth when using biosludge in nets as the primary
nutrient source, compared to reactors with 3N-BBM+V and NPK as growth media. The results from
screening 1 are shown in Figure 24. For none of the reactors any significant growth were seen, except
for the two controls, resulting in OD750 values of 0.16 after 200 h. This is equivalent to specific growth
rates of 0.01 h-1
. The drop in OD750 observed at 330 hours in positive control reactor 2 with 3N-
BBM+V medium was due to an obstruction in the tubing that fed compressed air into the reactor. The
culture then became CO2-starved inhibiting growth, resulting in a drastic OD decrease. This might be
due to observed aggregate formation and flocculation, which can occur in colonies during stress
conditions.
Figure 24: The resulting OD750 from the first growth screening of S. dimorphus on biosludge-based media. 5 biosludge
pre-treatments were evaluated against 2 positive controls of nutrient rich medium and 1 negative control with less
biosludge. The drop in OD for positive control 2 was due to a constricted air-flow, resulting in flocculation and
aggregation of the alga.
0
0.05
0.1
0.15
0.2
0.25
0.3
0.35
0 50 100 150 200 250 300 350 400 450 500
OD
750
Time (h)
OD750 measurements of S. dimorphus UTEX 417 on pre-treated
biosludge, screening 1
Negative Control 25 g biosludge 100 g Sludge
4x25 g Sludge 100 g Loosened Sludge
100 g Acidified sludge 100 g Ultrasonic sludge
Positive Control 1 NPK Positive Control 2 3N-BBM+V
25
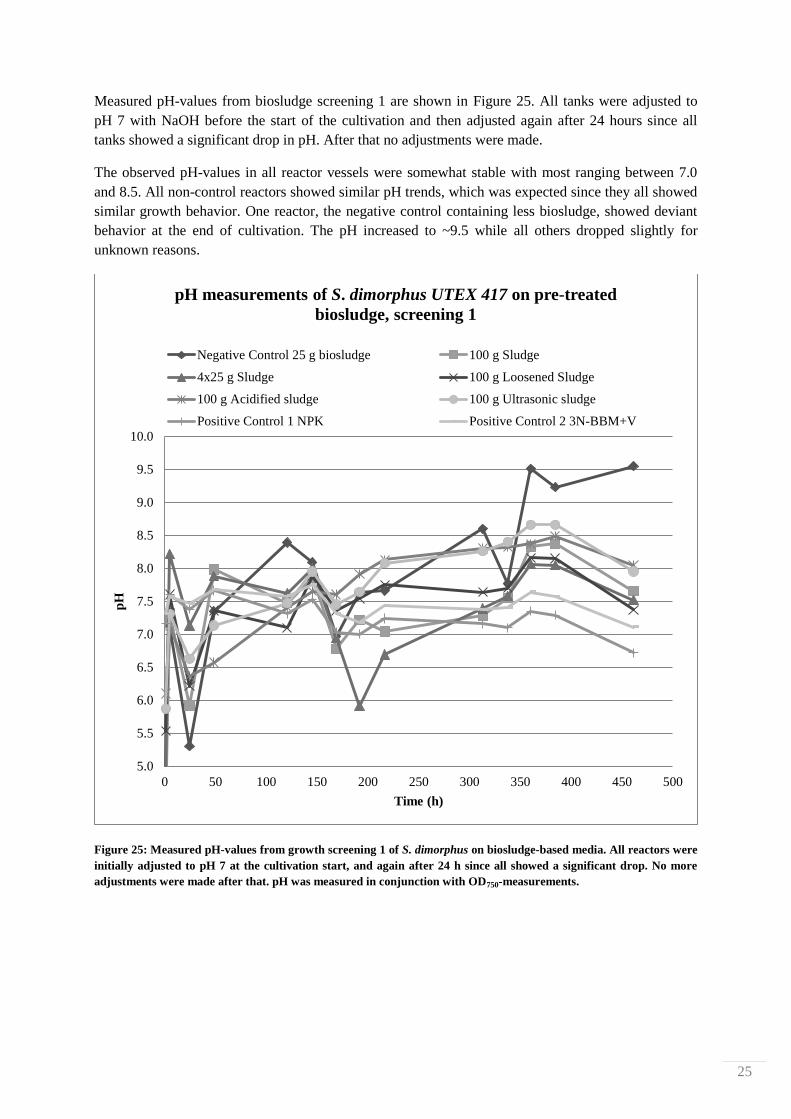
Measured pH-values from biosludge screening 1 are shown in Figure 25. All tanks were adjusted to
pH 7 with NaOH before the start of the cultivation and then adjusted again after 24 hours since all
tanks showed a significant drop in pH. After that no adjustments were made.
The observed pH-values in all reactor vessels were somewhat stable with most ranging between 7.0
and 8.5. All non-control reactors showed similar pH trends, which was expected since they all showed
similar growth behavior. One reactor, the negative control containing less biosludge, showed deviant
behavior at the end of cultivation. The pH increased to ~9.5 while all others dropped slightly for
unknown reasons.
Figure 25: Measured pH-values from growth screening 1 of S. dimorphus on biosludge-based media. All reactors were
initially adjusted to pH 7 at the cultivation start, and again after 24 h since all showed a significant drop. No more
adjustments were made after that. pH was measured in conjunction with OD750-measurements.
5.0
5.5
6.0
6.5
7.0
7.5
8.0
8.5
9.0
9.5
10.0
0 50 100 150 200 250 300 350 400 450 500
pH
Time (h)
pH measurements of S. dimorphus UTEX 417 on pre-treated
biosludge, screening 1
Negative Control 25 g biosludge 100 g Sludge
4x25 g Sludge 100 g Loosened Sludge
100 g Acidified sludge 100 g Ultrasonic sludge
Positive Control 1 NPK Positive Control 2 3N-BBM+V
26
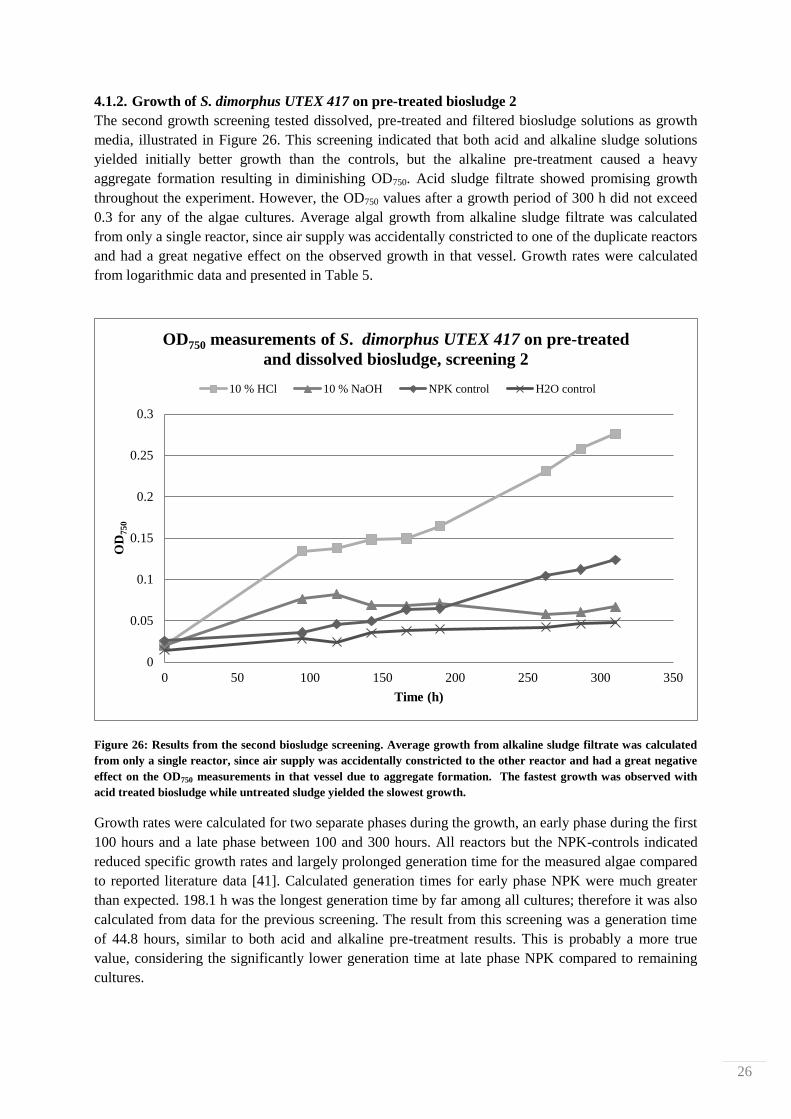
4.1.2. Growth of S. dimorphus UTEX 417 on pre-treated biosludge 2
The second growth screening tested dissolved, pre-treated and filtered biosludge solutions as growth
media, illustrated in Figure 26. This screening indicated that both acid and alkaline sludge solutions
yielded initially better growth than the controls, but the alkaline pre-treatment caused a heavy
aggregate formation resulting in diminishing OD750. Acid sludge filtrate showed promising growth
throughout the experiment. However, the OD750 values after a growth period of 300 h did not exceed
0.3 for any of the algae cultures. Average algal growth from alkaline sludge filtrate was calculated
from only a single reactor, since air supply was accidentally constricted to one of the duplicate reactors
and had a great negative effect on the observed growth in that vessel. Growth rates were calculated
from logarithmic data and presented in Table 5.
Figure 26: Results from the second biosludge screening. Average growth from alkaline sludge filtrate was calculated
from only a single reactor, since air supply was accidentally constricted to the other reactor and had a great negative
effect on the OD750 measurements in that vessel due to aggregate formation. The fastest growth was observed with
acid treated biosludge while untreated sludge yielded the slowest growth.
Growth rates were calculated for two separate phases during the growth, an early phase during the first
100 hours and a late phase between 100 and 300 hours. All reactors but the NPK-controls indicated
reduced specific growth rates and largely prolonged generation time for the measured algae compared
to reported literature data [41]. Calculated generation times for early phase NPK were much greater
than expected. 198.1 h was the longest generation time by far among all cultures; therefore it was also
calculated from data for the previous screening. The result from this screening was a generation time
of 44.8 hours, similar to both acid and alkaline pre-treatment results. This is probably a more true
value, considering the significantly lower generation time at late phase NPK compared to remaining
cultures.
0
0.05
0.1
0.15
0.2
0.25
0.3
0 50 100 150 200 250 300 350
OD
750
Time (h)
OD750 measurements of S. dimorphus UTEX 417 on pre-treated
and dissolved biosludge, screening 2
10 % HCl 10 % NaOH NPK control H2O control

27
Table 5: Specific growth rates and generation times during early and late phases of the second growth screening of S.
dimorphus on pre-treated biosludge. Acid treated sludge indicated the highest growth rate initially, and NPK resulted
in the best growth rate at a late phase. Alkali treatment proved good growth rates initially, but were shown to be very
low at a late phase. Biosludge dissolved in water resulted in the lowest growth rates at both phases.
Specific growth rates and generation times of S. dimorphus UTEX 417 cultivated in pre-treated
biosludge, screening 2
Phase and pre-treatment Specific growth rate (h-1
) Generation time (h)
Early phase NPK 0.0035 198
Early phase Water 0.0072 96.8
Early phase Acid 0.0203 34.1
Early phase Alkali 0.019 36.6
Late phase NPK 0.0058 120
Late phase Water 0.0018 390
Late phase Acid 0.0043 161
Late phase Alkali 0.0028 245
pH-values from the second screening are shown in Figure 27. A pattern emerged with two visible
groupings. NPK and acid treated sludge remained around pH 7 while water and base pre-treated
sludge increased to > pH 8.5. S. dimorphus are reported to be able to grow within a wide pH-range of
5-10, indicating that the values reported here are of no concern regarding any negative effects on the
cultures.
Figure 27: pH values from the second biosludge screening. The algae cultures growing in biosludge medium treated
with 10 % NaOH or H2O indicates rising pH values throughout the cultivation and reaches pH 9 and above at the
cultivation end.
5.0
5.5
6.0
6.5
7.0
7.5
8.0
8.5
9.0
9.5
10.0
0 50 100 150 200 250 300 350
pH
Time( h)
pH measurements of S. dimorphus UTEX 417 on pre-treated
biosludge, screening 2
NPK control 10 % HCl 10 % NaOH H2O control
28
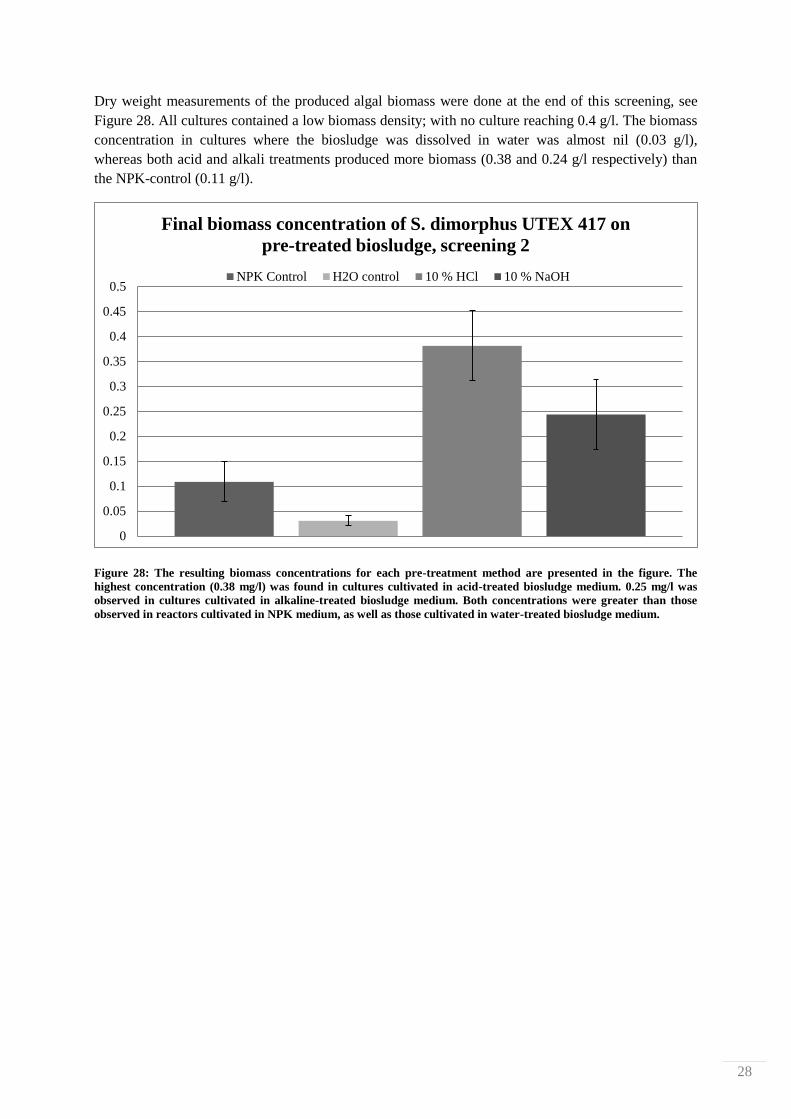
Dry weight measurements of the produced algal biomass were done at the end of this screening, see
Figure 28. All cultures contained a low biomass density; with no culture reaching 0.4 g/l. The biomass
concentration in cultures where the biosludge was dissolved in water was almost nil (0.03 g/l),
whereas both acid and alkali treatments produced more biomass (0.38 and 0.24 g/l respectively) than
the NPK-control (0.11 g/l).
Figure 28: The resulting biomass concentrations for each pre-treatment method are presented in the figure. The
highest concentration (0.38 mg/l) was found in cultures cultivated in acid-treated biosludge medium. 0.25 mg/l was
observed in cultures cultivated in alkaline-treated biosludge medium. Both concentrations were greater than those
observed in reactors cultivated in NPK medium, as well as those cultivated in water-treated biosludge medium.
0
0.05
0.1
0.15
0.2
0.25
0.3
0.35
0.4
0.45
0.5
Final biomass concentration of S. dimorphus UTEX 417 on
pre-treated biosludge, screening 2
NPK Control H2O control 10 % HCl 10 % NaOH
29
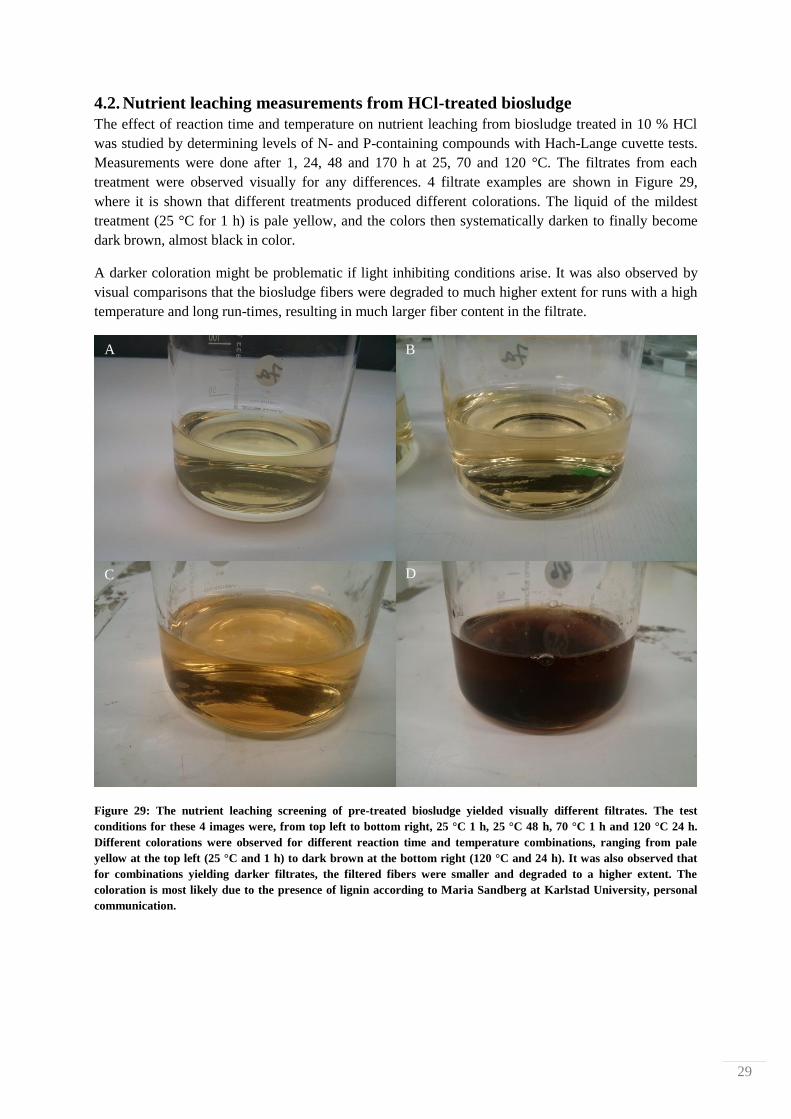
4.2. Nutrient leaching measurements from HCl-treated biosludge
The effect of reaction time and temperature on nutrient leaching from biosludge treated in 10 % HCl
was studied by determining levels of N- and P-containing compounds with Hach-Lange cuvette tests.
Measurements were done after 1, 24, 48 and 170 h at 25, 70 and 120 °C. The filtrates from each
treatment were observed visually for any differences. 4 filtrate examples are shown in Figure 29,
where it is shown that different treatments produced different colorations. The liquid of the mildest
treatment (25 °C for 1 h) is pale yellow, and the colors then systematically darken to finally become
dark brown, almost black in color.
A darker coloration might be problematic if light inhibiting conditions arise. It was also observed by
visual comparisons that the biosludge fibers were degraded to much higher extent for runs with a high
temperature and long run-times, resulting in much larger fiber content in the filtrate.
Figure 29: The nutrient leaching screening of pre-treated biosludge yielded visually different filtrates. The test
conditions for these 4 images were, from top left to bottom right, 25 °C 1 h, 25 °C 48 h, 70 °C 1 h and 120 °C 24 h.
Different colorations were observed for different reaction time and temperature combinations, ranging from pale
yellow at the top left (25 °C and 1 h) to dark brown at the bottom right (120 °C and 24 h). It was also observed that
for combinations yielding darker filtrates, the filtered fibers were smaller and degraded to a higher extent. The
coloration is most likely due to the presence of lignin according to Maria Sandberg at Karlstad University, personal
communication.
A
D C
B
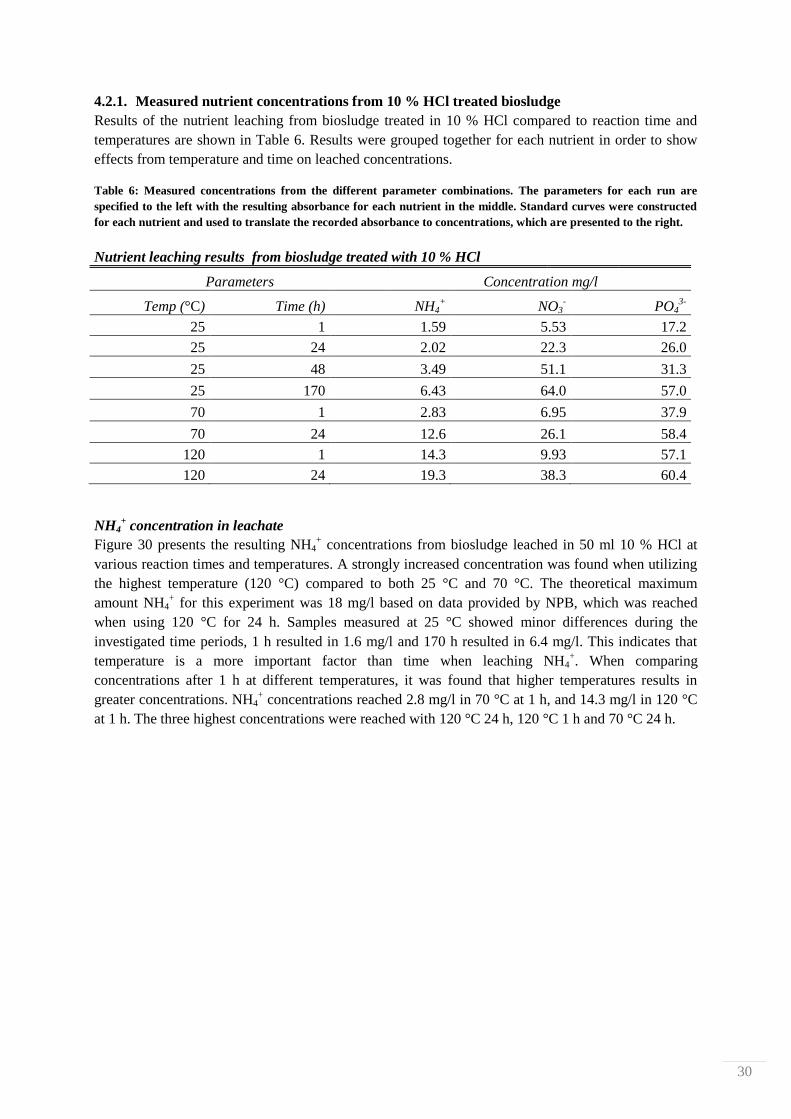
30
4.2.1. Measured nutrient concentrations from 10 % HCl treated biosludge
Results of the nutrient leaching from biosludge treated in 10 % HCl compared to reaction time and
temperatures are shown in Table 6. Results were grouped together for each nutrient in order to show
effects from temperature and time on leached concentrations.
Table 6: Measured concentrations from the different parameter combinations. The parameters for each run are
specified to the left with the resulting absorbance for each nutrient in the middle. Standard curves were constructed
for each nutrient and used to translate the recorded absorbance to concentrations, which are presented to the right.
Nutrient leaching results from biosludge treated with 10 % HCl
Parameters Concentration mg/l
Temp (°C) Time (h) NH4+ NO3
- PO4
3-
25 1 1.59 5.53 17.2
25 24 2.02 22.3 26.0
25 48 3.49 51.1 31.3
25 170 6.43 64.0 57.0
70 1 2.83 6.95 37.9
70 24 12.6 26.1 58.4
120 1 14.3 9.93 57.1
120 24 19.3 38.3 60.4
NH4+ concentration in leachate
Figure 30 presents the resulting NH4+ concentrations from biosludge leached in 50 ml 10 % HCl at
various reaction times and temperatures. A strongly increased concentration was found when utilizing
the highest temperature (120 °C) compared to both 25 °C and 70 °C. The theoretical maximum
amount NH4+ for this experiment was 18 mg/l based on data provided by NPB, which was reached
when using 120 °C for 24 h. Samples measured at 25 °C showed minor differences during the
investigated time periods, 1 h resulted in 1.6 mg/l and 170 h resulted in 6.4 mg/l. This indicates that
temperature is a more important factor than time when leaching NH4+. When comparing
concentrations after 1 h at different temperatures, it was found that higher temperatures results in
greater concentrations. NH4+ concentrations reached 2.8 mg/l in 70 °C at 1 h, and 14.3 mg/l in 120 °C
at 1 h. The three highest concentrations were reached with 120 °C 24 h, 120 °C 1 h and 70 °C 24 h.
31
Figure 30: Results of leached NH4+ for different times and temperatures. The x-axis shows the different times used ( 1,
24 and 48 h). Temperatures are at the z-axis (25, 70 and 120 °C) and resulting concentrations are represented by the
height of each column. The theoretical maximum concentration of NH4+ was reported as 18 mg/l and was reached in
three combinations, 70 °C 24 h, 120 °C 1 h and 120 °C 24 h.
NO3- concentrations in leachate
Leached NO3- concentrations are presented in Figure 31. Compared to NH4
+, NO3
- indicates different
correlations between time and temperature to yield greater concentrations. Reaction time appears to be
the more important factor of the two, as concentration yields were found to be approximately similar
at 1 h and 24 h for all temperatures. Concentrations at 1 h were 5.5 – 10 mg/l and at 24 h 22-38 mg/l.
The greatest yield was recorded in the combination of 25 °C 170 h with 64 mg/l and the next highest at
25 °C 48 h, which were the two longest reaction time periods in this experiment. It was still found that
higher temperatures yielded greater nutrient concentrations, indicating a positive correlation as
expected. Yields were found to increase 4-fold between 1 h and 24 h, and as much as 10-fold between
1 h and 48 h. No theoretical maximum could be specified for this experiment due to lack of data from
NPB.
25
70
120
0
5
10
15
20
124
48
Co
nce
ntr
ati
on
(m
g/l
)
NH4+
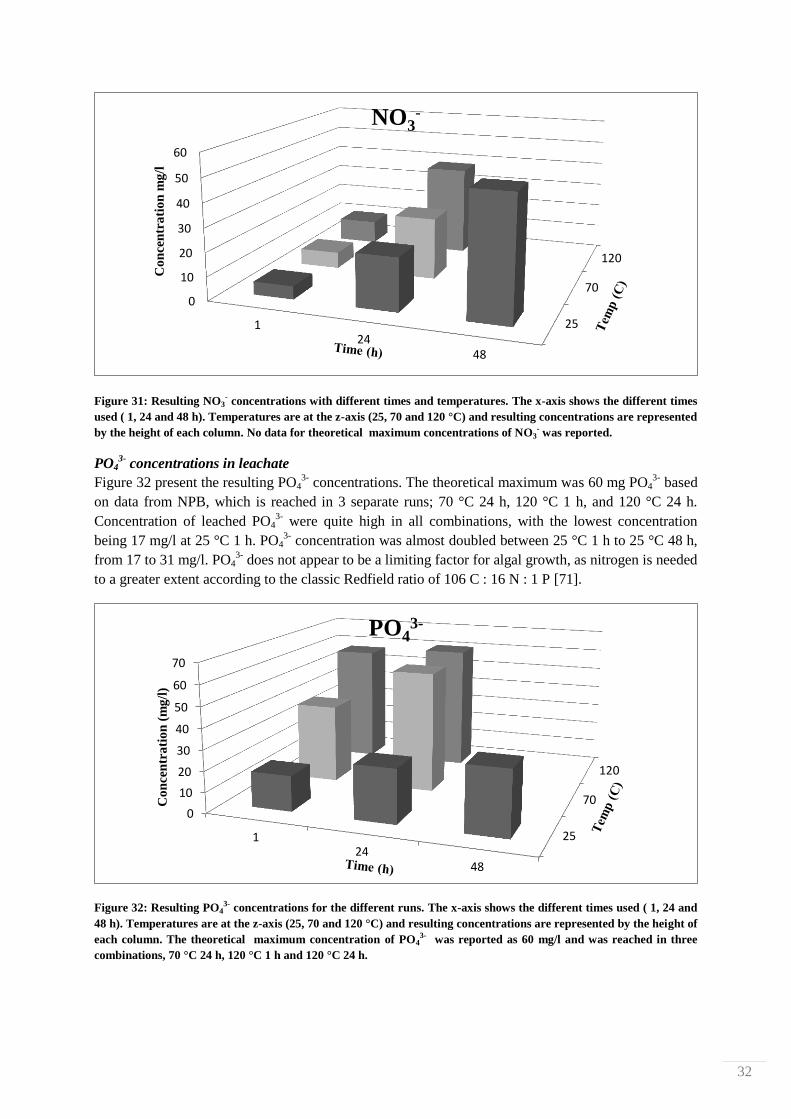
32
Figure 31: Resulting NO3- concentrations with different times and temperatures. The x-axis shows the different times
used ( 1, 24 and 48 h). Temperatures are at the z-axis (25, 70 and 120 °C) and resulting concentrations are represented
by the height of each column. No data for theoretical maximum concentrations of NO3- was reported.
PO43-
concentrations in leachate
Figure 32 present the resulting PO43-
concentrations. The theoretical maximum was 60 mg PO43-
based
on data from NPB, which is reached in 3 separate runs; 70 °C 24 h, 120 °C 1 h, and 120 °C 24 h.
Concentration of leached PO43-
were quite high in all combinations, with the lowest concentration
being 17 mg/l at 25 °C 1 h. PO43-
concentration was almost doubled between 25 °C 1 h to 25 °C 48 h,
from 17 to 31 mg/l. PO43-
does not appear to be a limiting factor for algal growth, as nitrogen is needed
to a greater extent according to the classic Redfield ratio of 106 C : 16 N : 1 P [71].
Figure 32: Resulting PO43- concentrations for the different runs. The x-axis shows the different times used ( 1, 24 and
48 h). Temperatures are at the z-axis (25, 70 and 120 °C) and resulting concentrations are represented by the height of
each column. The theoretical maximum concentration of PO43- was reported as 60 mg/l and was reached in three
combinations, 70 °C 24 h, 120 °C 1 h and 120 °C 24 h.
25
70
120
0
10
20
30
40
50
60
124
48
Co
nce
ntr
ati
on
mg
/l
NO3-
25
70
120
0
10
20
30
40
50
60
70
124
48
Co
nce
ntr
ati
on
(m
g/l
)
PO43-
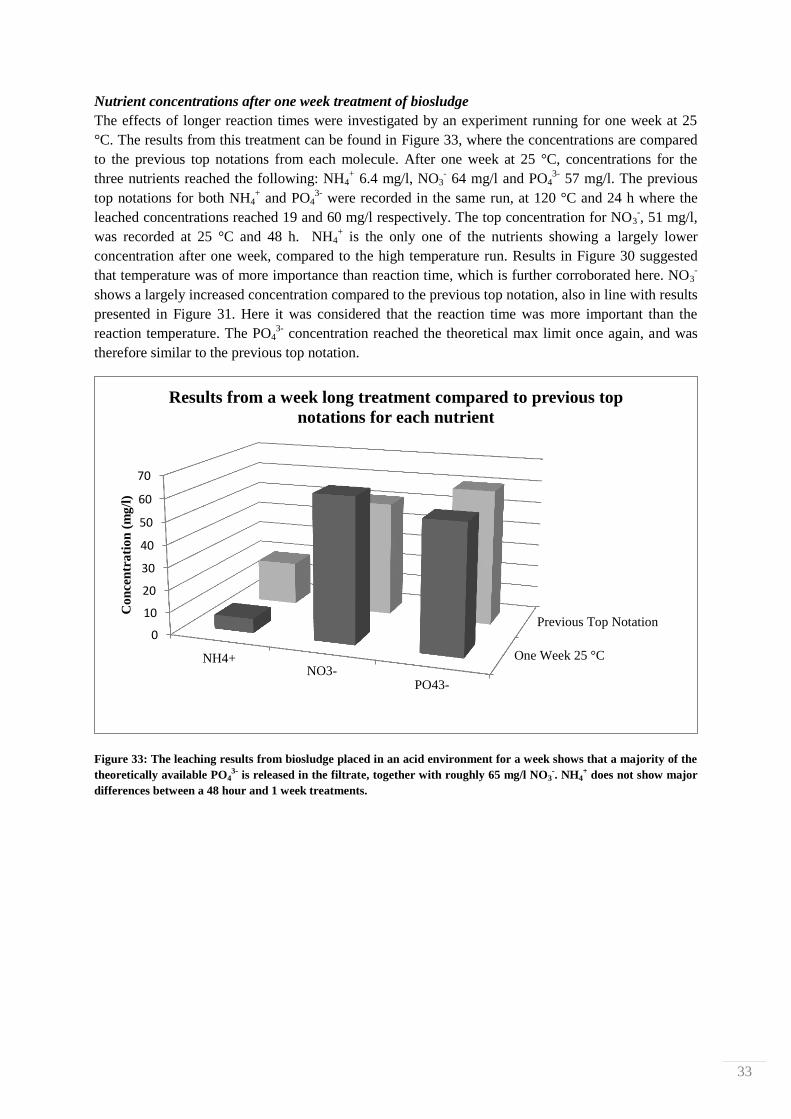
33
Nutrient concentrations after one week treatment of biosludge
The effects of longer reaction times were investigated by an experiment running for one week at 25
°C. The results from this treatment can be found in Figure 33, where the concentrations are compared
to the previous top notations from each molecule. After one week at 25 °C, concentrations for the
three nutrients reached the following: NH4+ 6.4 mg/l, NO3
- 64 mg/l and PO4
3- 57 mg/l. The previous
top notations for both NH4+ and PO4
3- were recorded in the same run, at 120 °C and 24 h where the
leached concentrations reached 19 and 60 mg/l respectively. The top concentration for NO3-, 51 mg/l,
was recorded at 25 °C and 48 h. NH4+ is the only one of the nutrients showing a largely lower
concentration after one week, compared to the high temperature run. Results in Figure 30 suggested
that temperature was of more importance than reaction time, which is further corroborated here. NO3-
shows a largely increased concentration compared to the previous top notation, also in line with results
presented in Figure 31. Here it was considered that the reaction time was more important than the
reaction temperature. The PO43-
concentration reached the theoretical max limit once again, and was
therefore similar to the previous top notation.
Figure 33: The leaching results from biosludge placed in an acid environment for a week shows that a majority of the
theoretically available PO43- is released in the filtrate, together with roughly 65 mg/l NO3
-. NH4+ does not show major
differences between a 48 hour and 1 week treatments.
One Week 25 °C
Previous Top Notation0
10
20
30
40
50
60
70
NH4+NO3-
PO43-
Co
nce
ntr
ati
on
(m
g/l
)
Results from a week long treatment compared to previous top
notations for each nutrient
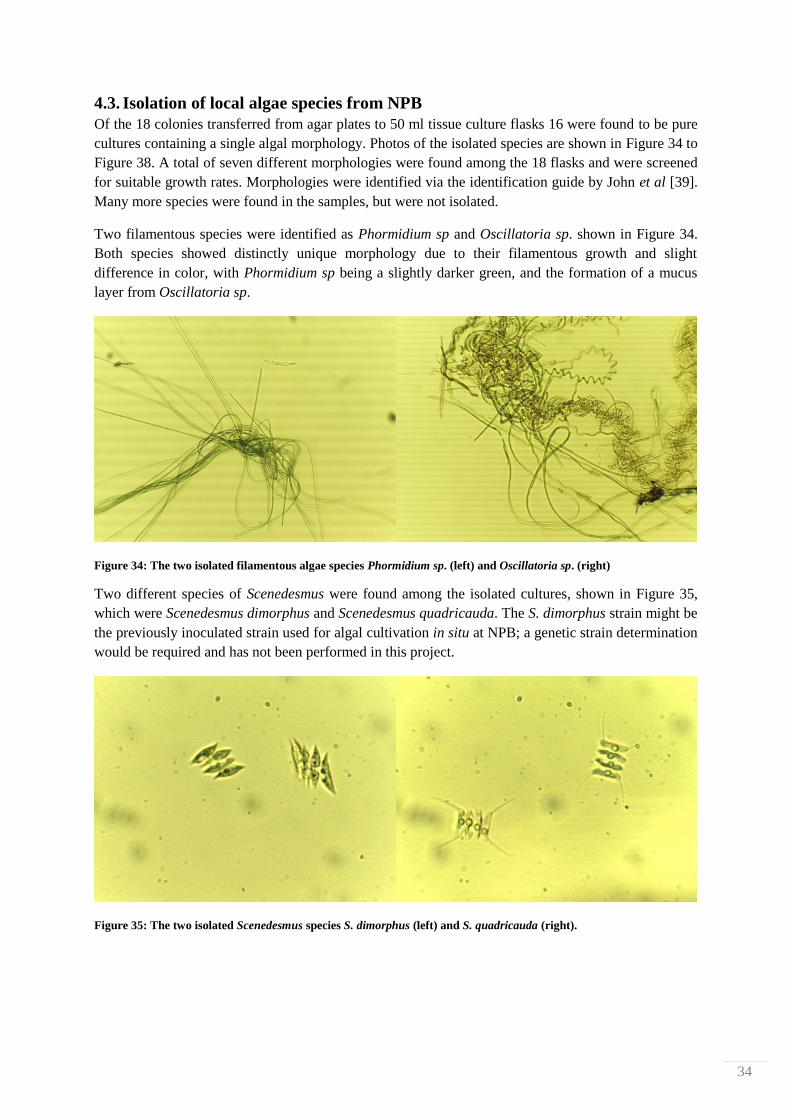
34
4.3. Isolation of local algae species from NPB
Of the 18 colonies transferred from agar plates to 50 ml tissue culture flasks 16 were found to be pure
cultures containing a single algal morphology. Photos of the isolated species are shown in Figure 34 to
Figure 38. A total of seven different morphologies were found among the 18 flasks and were screened
for suitable growth rates. Morphologies were identified via the identification guide by John et al [39].
Many more species were found in the samples, but were not isolated.
Two filamentous species were identified as Phormidium sp and Oscillatoria sp. shown in Figure 34.
Both species showed distinctly unique morphology due to their filamentous growth and slight
difference in color, with Phormidium sp being a slightly darker green, and the formation of a mucus
layer from Oscillatoria sp.
Figure 34: The two isolated filamentous algae species Phormidium sp. (left) and Oscillatoria sp. (right)
Two different species of Scenedesmus were found among the isolated cultures, shown in Figure 35,
which were Scenedesmus dimorphus and Scenedesmus quadricauda. The S. dimorphus strain might be
the previously inoculated strain used for algal cultivation in situ at NPB; a genetic strain determination
would be required and has not been performed in this project.
Figure 35: The two isolated Scenedesmus species S. dimorphus (left) and S. quadricauda (right).

35
A strain of Chlorella vulgaris was isolated and is
shown in Figure 36. This alga was found in
several growth flasks, indicating a great
abundance of this species at NPB.
Almost half of the isolated cultures consisted of
a Monoraphidium species, Monoraphidium
contortum shown in Figure 37. This alga was
observed in 7 of 18 flasks, mostly as pure
monocultures, but also as a part of a co-culture
with other algae species. It was not possible to
determine if it was one or several different
strains. M. contortum showed promising growth
in 3N-BBM+V medium but not in growth media
based on biosludge.
The alga shown in Figure 38 was a coenobia of
several cells, and was deemed as a species
Coenococcus. This was the only coenobia found
among the isolated cultures, but this alga did not
survive the initial cultivation in growth flasks.
No cells were found after 1 week of culturing.
Subsequently, this species was never part of any
of the following experiments.
Figure 36: An isolated strain of Chlorella vulgaris.
Figure 37: Monoraphidium contortum. These spindle like
cells were found in several culture flasks and were prone
to contaminate other cultures.
Figure 38: Coenococcus sp. This alga grows as a coenobia
of cells and was of great interest due to its unique features.
No data could be obtained on this species as it died after 1
week in the tissue culture flasks.
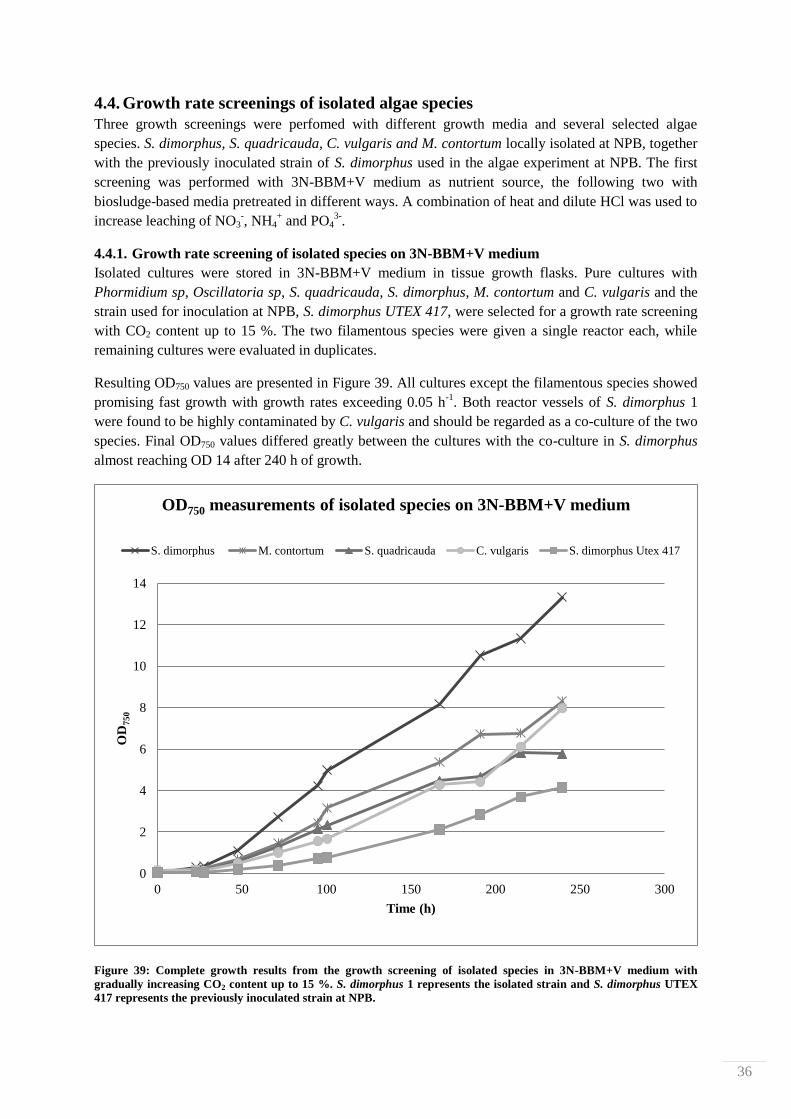
36
4.4. Growth rate screenings of isolated algae species
Three growth screenings were perfomed with different growth media and several selected algae
species. S. dimorphus, S. quadricauda, C. vulgaris and M. contortum locally isolated at NPB, together
with the previously inoculated strain of S. dimorphus used in the algae experiment at NPB. The first
screening was performed with 3N-BBM+V medium as nutrient source, the following two with
biosludge-based media pretreated in different ways. A combination of heat and dilute HCl was used to
increase leaching of NO3-, NH4
+ and PO4
3-.
4.4.1. Growth rate screening of isolated species on 3N-BBM+V medium
Isolated cultures were stored in 3N-BBM+V medium in tissue growth flasks. Pure cultures with
Phormidium sp, Oscillatoria sp, S. quadricauda, S. dimorphus, M. contortum and C. vulgaris and the
strain used for inoculation at NPB, S. dimorphus UTEX 417, were selected for a growth rate screening
with CO2 content up to 15 %. The two filamentous species were given a single reactor each, while
remaining cultures were evaluated in duplicates.
Resulting OD750 values are presented in Figure 39. All cultures except the filamentous species showed
promising fast growth with growth rates exceeding 0.05 h-1
. Both reactor vessels of S. dimorphus 1
were found to be highly contaminated by C. vulgaris and should be regarded as a co-culture of the two
species. Final OD750 values differed greatly between the cultures with the co-culture in S. dimorphus
almost reaching OD 14 after 240 h of growth.
Figure 39: Complete growth results from the growth screening of isolated species in 3N-BBM+V medium with
gradually increasing CO2 content up to 15 %. S. dimorphus 1 represents the isolated strain and S. dimorphus UTEX
417 represents the previously inoculated strain at NPB.
0
2
4
6
8
10
12
14
0 50 100 150 200 250 300
OD
750
Time (h)
OD750 measurements of isolated species on 3N-BBM+V medium
S. dimorphus M. contortum S. quadricauda C. vulgaris S. dimorphus Utex 417
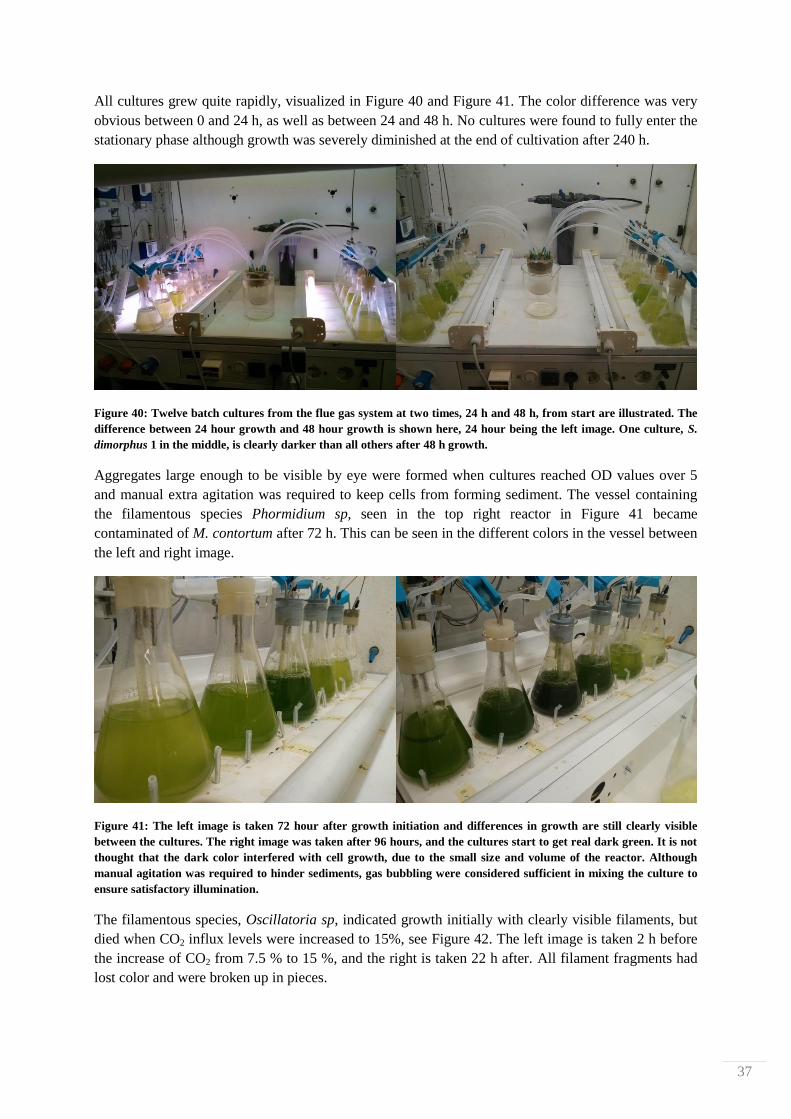
37
All cultures grew quite rapidly, visualized in Figure 40 and Figure 41. The color difference was very
obvious between 0 and 24 h, as well as between 24 and 48 h. No cultures were found to fully enter the
stationary phase although growth was severely diminished at the end of cultivation after 240 h.
Figure 40: Twelve batch cultures from the flue gas system at two times, 24 h and 48 h, from start are illustrated. The
difference between 24 hour growth and 48 hour growth is shown here, 24 hour being the left image. One culture, S.
dimorphus 1 in the middle, is clearly darker than all others after 48 h growth.
Aggregates large enough to be visible by eye were formed when cultures reached OD values over 5
and manual extra agitation was required to keep cells from forming sediment. The vessel containing
the filamentous species Phormidium sp, seen in the top right reactor in Figure 41 became
contaminated of M. contortum after 72 h. This can be seen in the different colors in the vessel between
the left and right image.
Figure 41: The left image is taken 72 hour after growth initiation and differences in growth are still clearly visible
between the cultures. The right image was taken after 96 hours, and the cultures start to get real dark green. It is not
thought that the dark color interfered with cell growth, due to the small size and volume of the reactor. Although
manual agitation was required to hinder sediments, gas bubbling were considered sufficient in mixing the culture to
ensure satisfactory illumination.
The filamentous species, Oscillatoria sp, indicated growth initially with clearly visible filaments, but
died when CO2 influx levels were increased to 15%, see Figure 42. The left image is taken 2 h before
the increase of CO2 from 7.5 % to 15 %, and the right is taken 22 h after. All filament fragments had
lost color and were broken up in pieces.
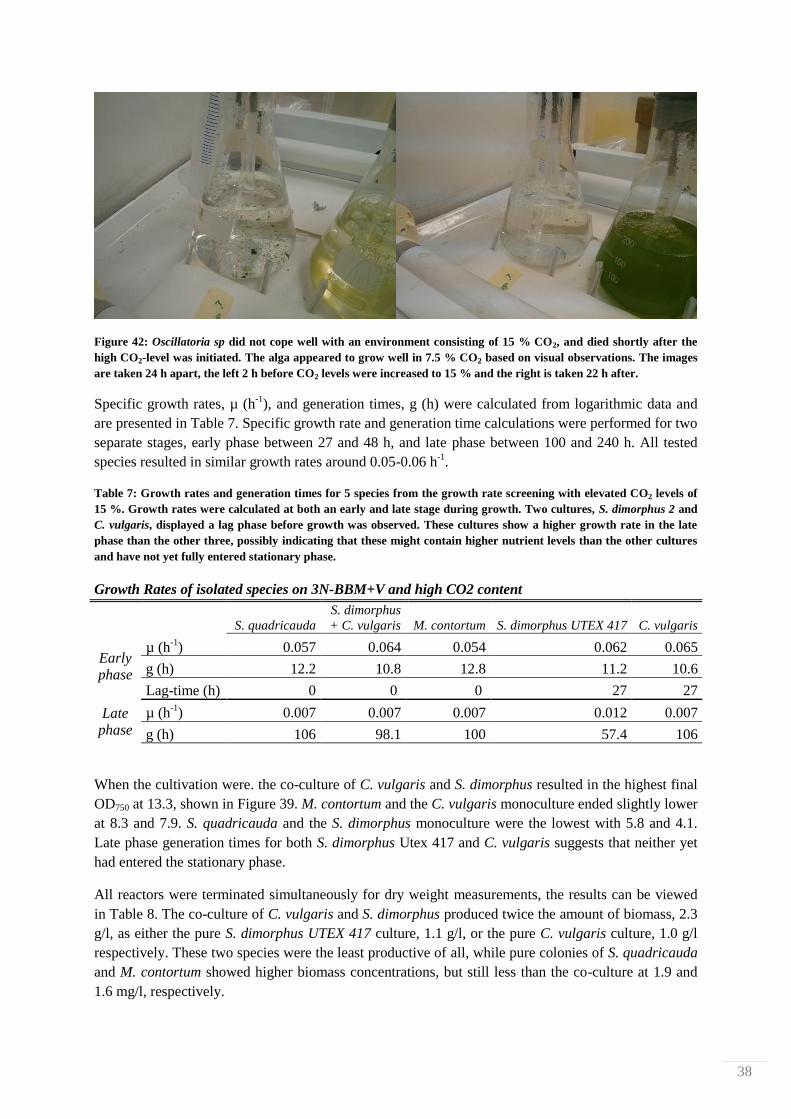
38
Figure 42: Oscillatoria sp did not cope well with an environment consisting of 15 % CO2, and died shortly after the
high CO2-level was initiated. The alga appeared to grow well in 7.5 % CO2 based on visual observations. The images
are taken 24 h apart, the left 2 h before CO2 levels were increased to 15 % and the right is taken 22 h after.
Specific growth rates, µ (h-1
), and generation times, g (h) were calculated from logarithmic data and
are presented in Table 7. Specific growth rate and generation time calculations were performed for two
separate stages, early phase between 27 and 48 h, and late phase between 100 and 240 h. All tested
species resulted in similar growth rates around 0.05-0.06 h-1
.
Table 7: Growth rates and generation times for 5 species from the growth rate screening with elevated CO2 levels of
15 %. Growth rates were calculated at both an early and late stage during growth. Two cultures, S. dimorphus 2 and
C. vulgaris, displayed a lag phase before growth was observed. These cultures show a higher growth rate in the late
phase than the other three, possibly indicating that these might contain higher nutrient levels than the other cultures
and have not yet fully entered stationary phase.
Growth Rates of isolated species on 3N-BBM+V and high CO2 content
S. quadricauda
S. dimorphus
+ C. vulgaris M. contortum S. dimorphus UTEX 417 C. vulgaris
Early
phase
µ (h-1
) 0.057 0.064 0.054 0.062 0.065
g (h) 12.2 10.8 12.8 11.2 10.6
Lag-time (h) 0 0 0 27 27
Late
phase
µ (h-1
) 0.007 0.007 0.007 0.012 0.007
g (h) 106 98.1 100 57.4 106
When the cultivation were. the co-culture of C. vulgaris and S. dimorphus resulted in the highest final
OD750 at 13.3, shown in Figure 39. M. contortum and the C. vulgaris monoculture ended slightly lower
at 8.3 and 7.9. S. quadricauda and the S. dimorphus monoculture were the lowest with 5.8 and 4.1.
Late phase generation times for both S. dimorphus Utex 417 and C. vulgaris suggests that neither yet
had entered the stationary phase.
All reactors were terminated simultaneously for dry weight measurements, the results can be viewed
in Table 8. The co-culture of C. vulgaris and S. dimorphus produced twice the amount of biomass, 2.3
g/l, as either the pure S. dimorphus UTEX 417 culture, 1.1 g/l, or the pure C. vulgaris culture, 1.0 g/l
respectively. These two species were the least productive of all, while pure colonies of S. quadricauda
and M. contortum showed higher biomass concentrations, but still less than the co-culture at 1.9 and
1.6 mg/l, respectively.
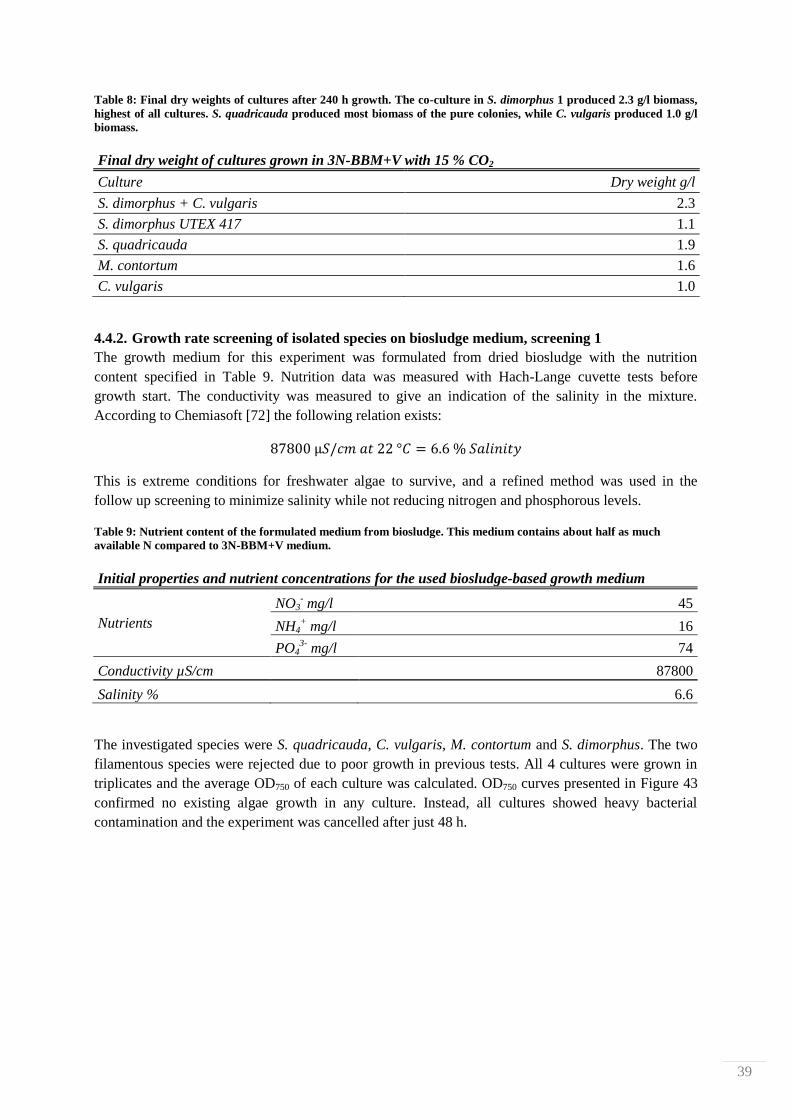
39
Table 8: Final dry weights of cultures after 240 h growth. The co-culture in S. dimorphus 1 produced 2.3 g/l biomass,
highest of all cultures. S. quadricauda produced most biomass of the pure colonies, while C. vulgaris produced 1.0 g/l
biomass.
Final dry weight of cultures grown in 3N-BBM+V with 15 % CO2
Culture Dry weight g/l
S. dimorphus + C. vulgaris 2.3
S. dimorphus UTEX 417 1.1
S. quadricauda 1.9
M. contortum 1.6
C. vulgaris 1.0
4.4.2. Growth rate screening of isolated species on biosludge medium, screening 1
The growth medium for this experiment was formulated from dried biosludge with the nutrition
content specified in Table 9. Nutrition data was measured with Hach-Lange cuvette tests before
growth start. The conductivity was measured to give an indication of the salinity in the mixture.
According to Chemiasoft [72] the following relation exists:
This is extreme conditions for freshwater algae to survive, and a refined method was used in the
follow up screening to minimize salinity while not reducing nitrogen and phosphorous levels.
Table 9: Nutrient content of the formulated medium from biosludge. This medium contains about half as much
available N compared to 3N-BBM+V medium.
Initial properties and nutrient concentrations for the used biosludge-based growth medium
Nutrients
NO3- mg/l 45
NH4+ mg/l 16
PO43-
mg/l 74
Conductivity µS/cm
87800
Salinity % 6.6
The investigated species were S. quadricauda, C. vulgaris, M. contortum and S. dimorphus. The two
filamentous species were rejected due to poor growth in previous tests. All 4 cultures were grown in
triplicates and the average OD750 of each culture was calculated. OD750 curves presented in Figure 43
confirmed no existing algae growth in any culture. Instead, all cultures showed heavy bacterial
contamination and the experiment was cancelled after just 48 h.
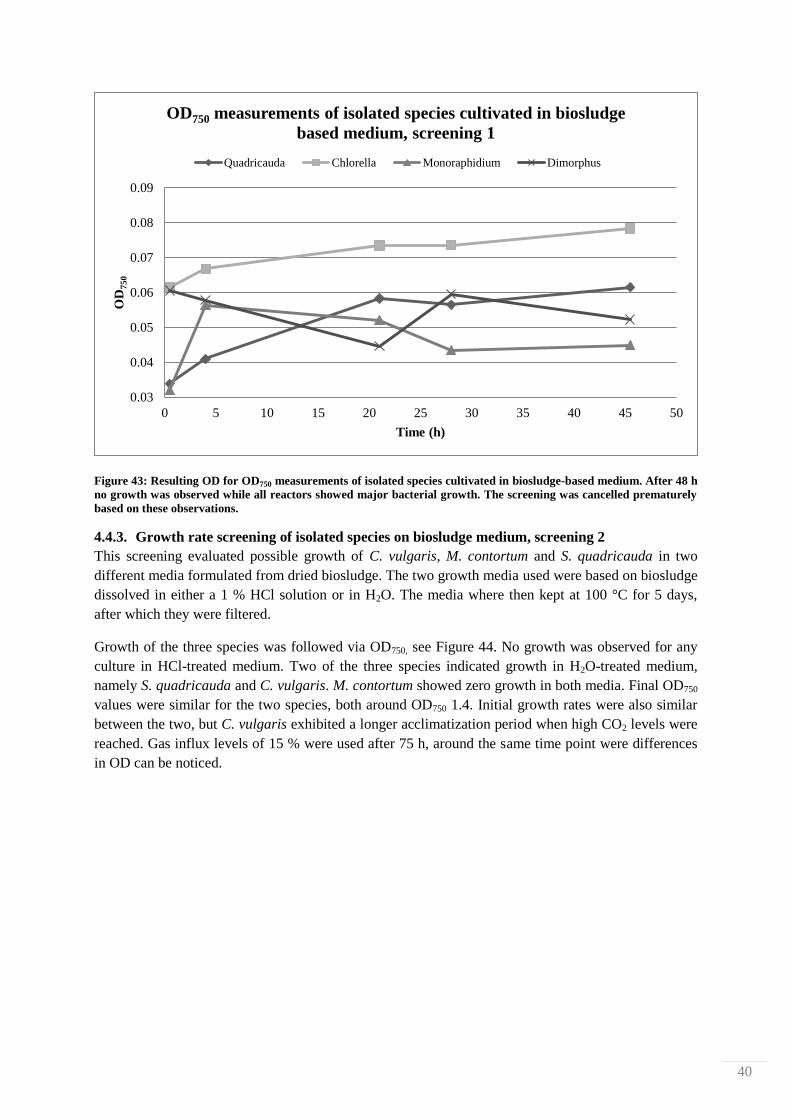
40
Figure 43: Resulting OD for OD750 measurements of isolated species cultivated in biosludge-based medium. After 48 h
no growth was observed while all reactors showed major bacterial growth. The screening was cancelled prematurely
based on these observations.
4.4.3. Growth rate screening of isolated species on biosludge medium, screening 2
This screening evaluated possible growth of C. vulgaris, M. contortum and S. quadricauda in two
different media formulated from dried biosludge. The two growth media used were based on biosludge
dissolved in either a 1 % HCl solution or in H2O. The media where then kept at 100 °C for 5 days,
after which they were filtered.
Growth of the three species was followed via OD750, see Figure 44. No growth was observed for any
culture in HCl-treated medium. Two of the three species indicated growth in H2O-treated medium,
namely S. quadricauda and C. vulgaris. M. contortum showed zero growth in both media. Final OD750
values were similar for the two species, both around OD750 1.4. Initial growth rates were also similar
between the two, but C. vulgaris exhibited a longer acclimatization period when high CO2 levels were
reached. Gas influx levels of 15 % were used after 75 h, around the same time point were differences
in OD can be noticed.
0.03
0.04
0.05
0.06
0.07
0.08
0.09
0 5 10 15 20 25 30 35 40 45 50
OD
750
Time (h)
OD750 measurements of isolated species cultivated in biosludge
based medium, screening 1
Quadricauda Chlorella Monoraphidium Dimorphus
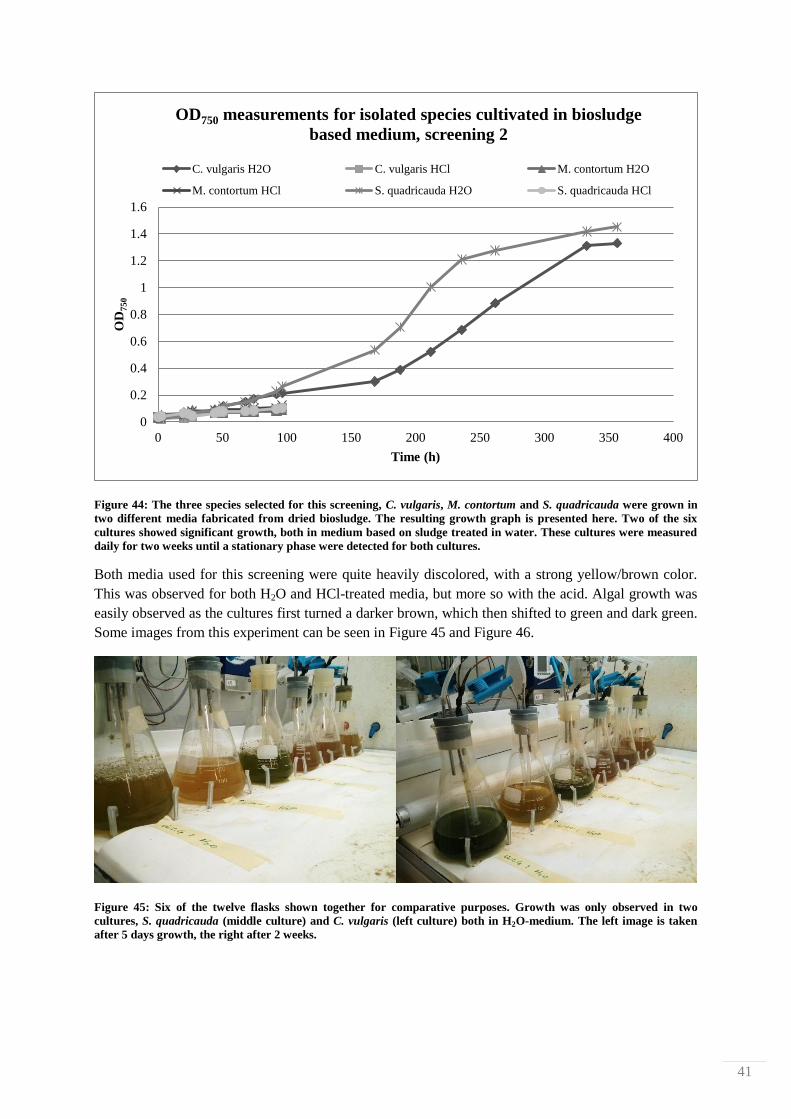
41
Figure 44: The three species selected for this screening, C. vulgaris, M. contortum and S. quadricauda were grown in
two different media fabricated from dried biosludge. The resulting growth graph is presented here. Two of the six
cultures showed significant growth, both in medium based on sludge treated in water. These cultures were measured
daily for two weeks until a stationary phase were detected for both cultures.
Both media used for this screening were quite heavily discolored, with a strong yellow/brown color.
This was observed for both H2O and HCl-treated media, but more so with the acid. Algal growth was
easily observed as the cultures first turned a darker brown, which then shifted to green and dark green.
Some images from this experiment can be seen in Figure 45 and Figure 46.
Figure 45: Six of the twelve flasks shown together for comparative purposes. Growth was only observed in two
cultures, S. quadricauda (middle culture) and C. vulgaris (left culture) both in H2O-medium. The left image is taken
after 5 days growth, the right after 2 weeks.
0
0.2
0.4
0.6
0.8
1
1.2
1.4
1.6
0 50 100 150 200 250 300 350 400
OD
750
Time (h)
OD750 measurements for isolated species cultivated in biosludge
based medium, screening 2
C. vulgaris H2O C. vulgaris HCl M. contortum H2O
M. contortum HCl S. quadricauda H2O S. quadricauda HCl
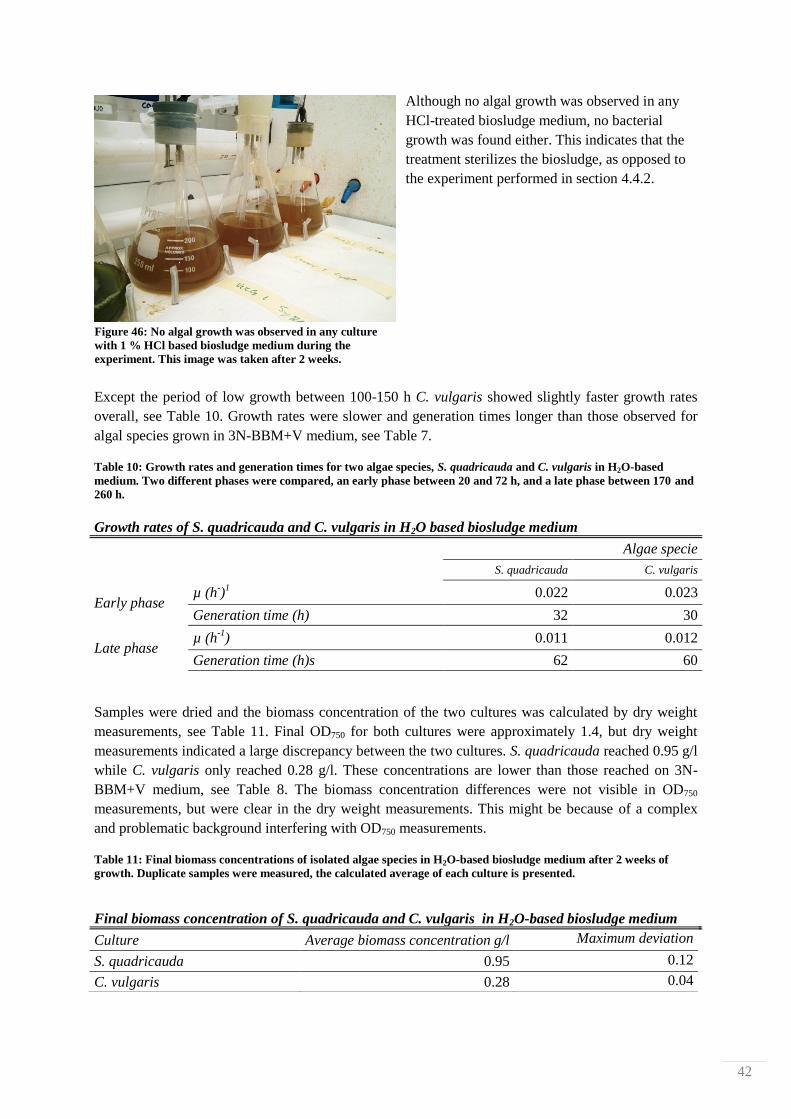
42
Although no algal growth was observed in any
HCl-treated biosludge medium, no bacterial
growth was found either. This indicates that the
treatment sterilizes the biosludge, as opposed to
the experiment performed in section 4.4.2.
Except the period of low growth between 100-150 h C. vulgaris showed slightly faster growth rates
overall, see Table 10. Growth rates were slower and generation times longer than those observed for
algal species grown in 3N-BBM+V medium, see Table 7.
Table 10: Growth rates and generation times for two algae species, S. quadricauda and C. vulgaris in H2O-based
medium. Two different phases were compared, an early phase between 20 and 72 h, and a late phase between 170 and
260 h.
Growth rates of S. quadricauda and C. vulgaris in H2O based biosludge medium
Algae specie
S. quadricauda C. vulgaris
Early phase µ (h
-)
1 0.022 0.023
Generation time (h) 32 30
Late phase µ (h
-1) 0.011 0.012
Generation time (h)s 62 60
Samples were dried and the biomass concentration of the two cultures was calculated by dry weight
measurements, see Table 11. Final OD750 for both cultures were approximately 1.4, but dry weight
measurements indicated a large discrepancy between the two cultures. S. quadricauda reached 0.95 g/l
while C. vulgaris only reached 0.28 g/l. These concentrations are lower than those reached on 3N-
BBM+V medium, see Table 8. The biomass concentration differences were not visible in OD750
measurements, but were clear in the dry weight measurements. This might be because of a complex
and problematic background interfering with OD750 measurements.
Table 11: Final biomass concentrations of isolated algae species in H2O-based biosludge medium after 2 weeks of
growth. Duplicate samples were measured, the calculated average of each culture is presented.
Final biomass concentration of S. quadricauda and C. vulgaris in H2O-based biosludge medium
Culture Average biomass concentration g/l Maximum deviation
S. quadricauda 0.95 0.12
C. vulgaris 0.28 0.04
Figure 46: No algal growth was observed in any culture
with 1 % HCl based biosludge medium during the
experiment. This image was taken after 2 weeks.
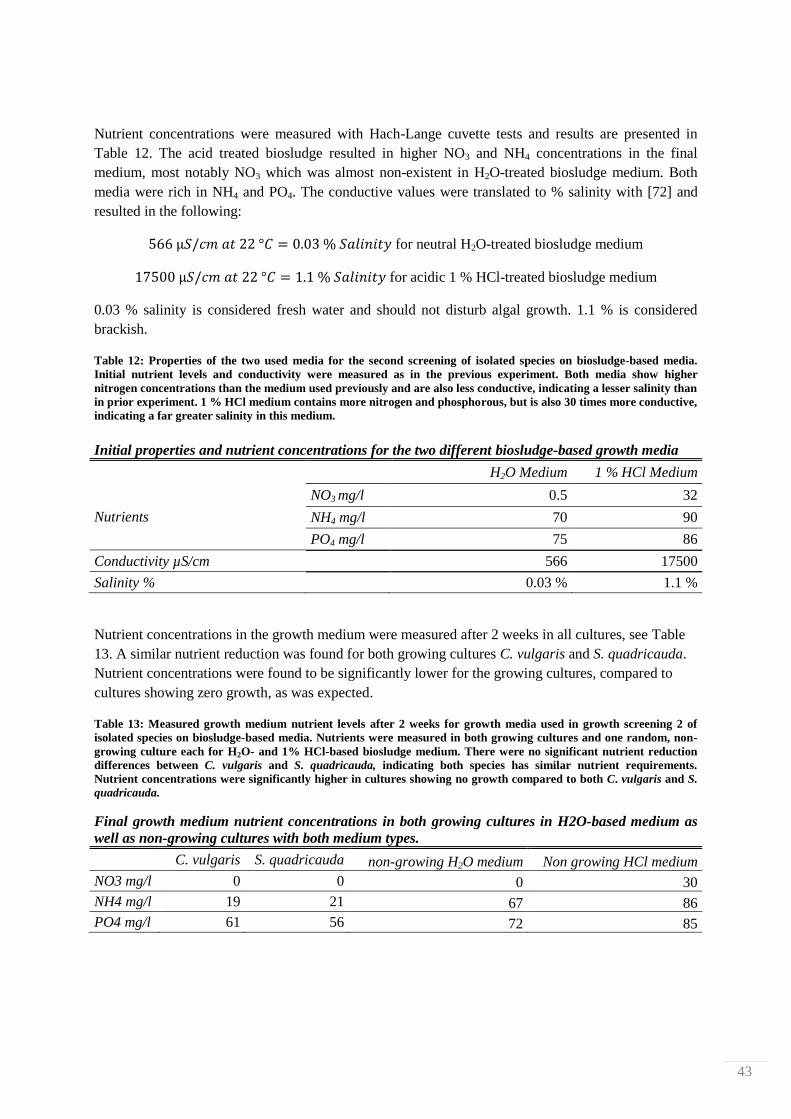
43
Nutrient concentrations were measured with Hach-Lange cuvette tests and results are presented in
Table 12. The acid treated biosludge resulted in higher NO3 and NH4 concentrations in the final
medium, most notably NO3 which was almost non-existent in H2O-treated biosludge medium. Both
media were rich in NH4 and PO4. The conductive values were translated to % salinity with [72] and
resulted in the following:
for neutral H2O-treated biosludge medium
for acidic 1 % HCl-treated biosludge medium
0.03 % salinity is considered fresh water and should not disturb algal growth. 1.1 % is considered
brackish.
Table 12: Properties of the two used media for the second screening of isolated species on biosludge-based media.
Initial nutrient levels and conductivity were measured as in the previous experiment. Both media show higher
nitrogen concentrations than the medium used previously and are also less conductive, indicating a lesser salinity than
in prior experiment. 1 % HCl medium contains more nitrogen and phosphorous, but is also 30 times more conductive,
indicating a far greater salinity in this medium.
Initial properties and nutrient concentrations for the two different biosludge-based growth media
H2O Medium 1 % HCl Medium
Nutrients
NO3 mg/l 0.5 32
NH4 mg/l 70 90
PO4 mg/l 75 86
Conductivity µS/cm 566 17500
Salinity % 0.03 % 1.1 %
Nutrient concentrations in the growth medium were measured after 2 weeks in all cultures, see Table
13. A similar nutrient reduction was found for both growing cultures C. vulgaris and S. quadricauda.
Nutrient concentrations were found to be significantly lower for the growing cultures, compared to
cultures showing zero growth, as was expected.
Table 13: Measured growth medium nutrient levels after 2 weeks for growth media used in growth screening 2 of
isolated species on biosludge-based media. Nutrients were measured in both growing cultures and one random, non-
growing culture each for H2O- and 1% HCl-based biosludge medium. There were no significant nutrient reduction
differences between C. vulgaris and S. quadricauda, indicating both species has similar nutrient requirements.
Nutrient concentrations were significantly higher in cultures showing no growth compared to both C. vulgaris and S.
quadricauda.
Final growth medium nutrient concentrations in both growing cultures in H2O-based medium as
well as non-growing cultures with both medium types.
C. vulgaris S. quadricauda non-growing H2O medium Non growing HCl medium
NO3 mg/l 0 0 0 30
NH4 mg/l 19 21 67 86
PO4 mg/l 61 56 72 85
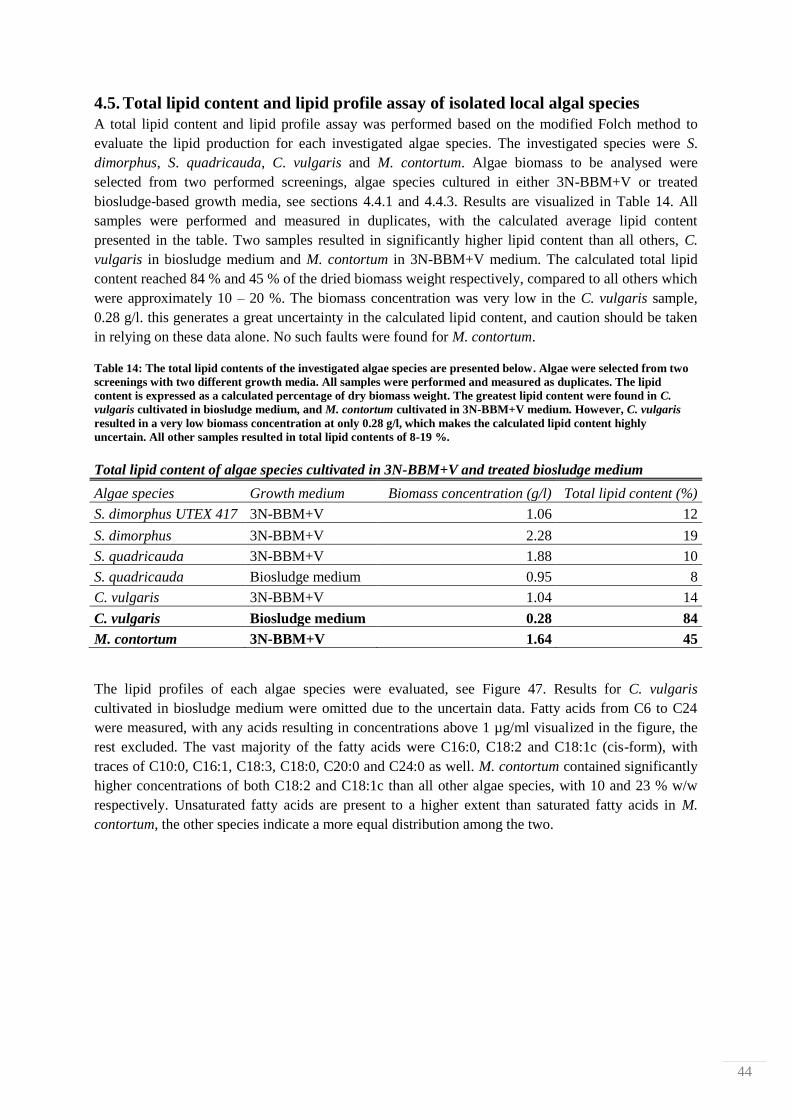
44
4.5. Total lipid content and lipid profile assay of isolated local algal species
A total lipid content and lipid profile assay was performed based on the modified Folch method to
evaluate the lipid production for each investigated algae species. The investigated species were S.
dimorphus, S. quadricauda, C. vulgaris and M. contortum. Algae biomass to be analysed were
selected from two performed screenings, algae species cultured in either 3N-BBM+V or treated
biosludge-based growth media, see sections 4.4.1 and 4.4.3. Results are visualized in Table 14. All
samples were performed and measured in duplicates, with the calculated average lipid content
presented in the table. Two samples resulted in significantly higher lipid content than all others, C.
vulgaris in biosludge medium and M. contortum in 3N-BBM+V medium. The calculated total lipid
content reached 84 % and 45 % of the dried biomass weight respectively, compared to all others which
were approximately 10 – 20 %. The biomass concentration was very low in the C. vulgaris sample,
0.28 g/l. this generates a great uncertainty in the calculated lipid content, and caution should be taken
in relying on these data alone. No such faults were found for M. contortum.
Table 14: The total lipid contents of the investigated algae species are presented below. Algae were selected from two
screenings with two different growth media. All samples were performed and measured as duplicates. The lipid
content is expressed as a calculated percentage of dry biomass weight. The greatest lipid content were found in C.
vulgaris cultivated in biosludge medium, and M. contortum cultivated in 3N-BBM+V medium. However, C. vulgaris
resulted in a very low biomass concentration at only 0.28 g/l, which makes the calculated lipid content highly
uncertain. All other samples resulted in total lipid contents of 8-19 %.
Total lipid content of algae species cultivated in 3N-BBM+V and treated biosludge medium
Algae species Growth medium Biomass concentration (g/l) Total lipid content (%)
S. dimorphus UTEX 417 3N-BBM+V 1.06 12
S. dimorphus 3N-BBM+V 2.28 19
S. quadricauda 3N-BBM+V 1.88 10
S. quadricauda Biosludge medium 0.95 8
C. vulgaris 3N-BBM+V 1.04 14
C. vulgaris Biosludge medium 0.28 84
M. contortum 3N-BBM+V 1.64 45
The lipid profiles of each algae species were evaluated, see Figure 47. Results for C. vulgaris
cultivated in biosludge medium were omitted due to the uncertain data. Fatty acids from C6 to C24
were measured, with any acids resulting in concentrations above 1 µg/ml visualized in the figure, the
rest excluded. The vast majority of the fatty acids were C16:0, C18:2 and C18:1c (cis-form), with
traces of C10:0, C16:1, C18:3, C18:0, C20:0 and C24:0 as well. M. contortum contained significantly
higher concentrations of both C18:2 and C18:1c than all other algae species, with 10 and 23 % w/w
respectively. Unsaturated fatty acids are present to a higher extent than saturated fatty acids in M.
contortum, the other species indicate a more equal distribution among the two.
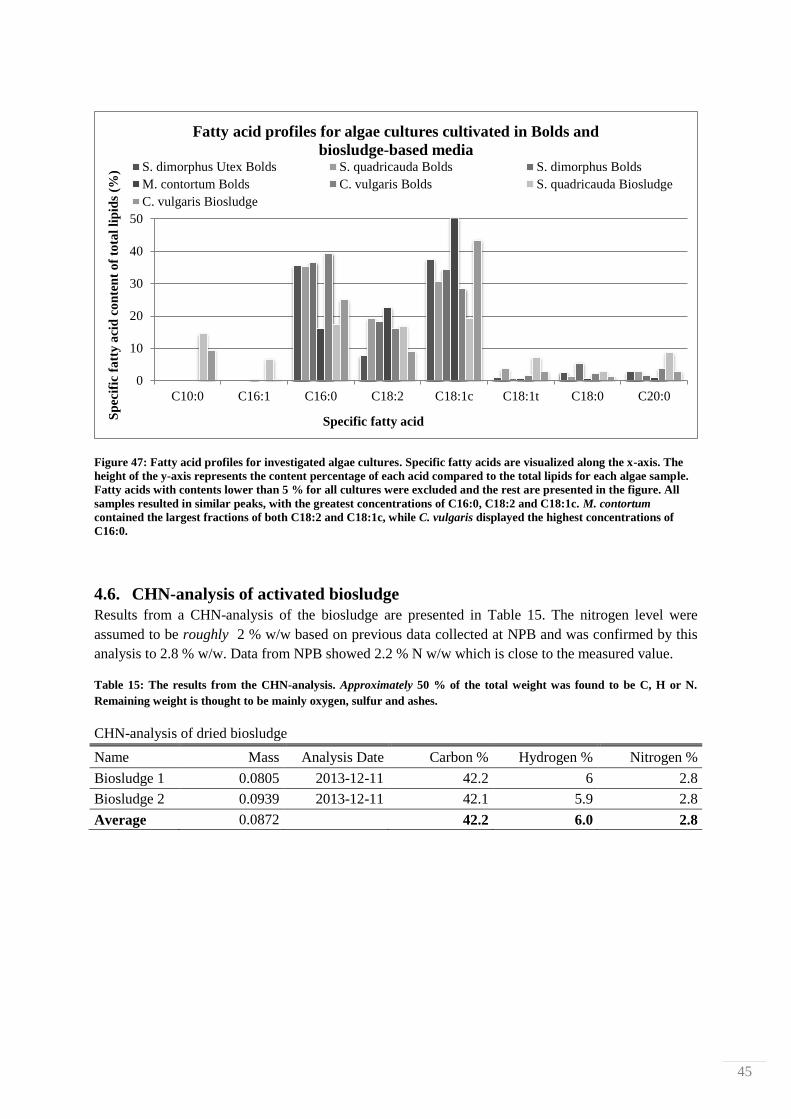
45
Figure 47: Fatty acid profiles for investigated algae cultures. Specific fatty acids are visualized along the x-axis. The
height of the y-axis represents the content percentage of each acid compared to the total lipids for each algae sample.
Fatty acids with contents lower than 5 % for all cultures were excluded and the rest are presented in the figure. All
samples resulted in similar peaks, with the greatest concentrations of C16:0, C18:2 and C18:1c. M. contortum
contained the largest fractions of both C18:2 and C18:1c, while C. vulgaris displayed the highest concentrations of
C16:0.
4.6. CHN-analysis of activated biosludge
Results from a CHN-analysis of the biosludge are presented in Table 15. The nitrogen level were
assumed to be roughly 2 % w/w based on previous data collected at NPB and was confirmed by this
analysis to 2.8 % w/w. Data from NPB showed 2.2 % N w/w which is close to the measured value.
Table 15: The results from the CHN-analysis. Approximately 50 % of the total weight was found to be C, H or N.
Remaining weight is thought to be mainly oxygen, sulfur and ashes.
CHN-analysis of dried biosludge
Name Mass Analysis Date Carbon % Hydrogen % Nitrogen %
Biosludge 1 0.0805 2013-12-11 42.2 6 2.8
Biosludge 2 0.0939 2013-12-11 42.1 5.9 2.8
Average 0.0872 42.2 6.0 2.8
0
10
20
30
40
50
C10:0 C16:1 C16:0 C18:2 C18:1c C18:1t C18:0 C20:0
Sp
ecif
ic f
att
y a
cid
co
nte
nt
of
tota
l li
pid
s (%
)
Specific fatty acid
Fatty acid profiles for algae cultures cultivated in Bolds and
biosludge-based media S. dimorphus Utex Bolds S. quadricauda Bolds S. dimorphus Bolds
M. contortum Bolds C. vulgaris Bolds S. quadricauda Biosludge
C. vulgaris Biosludge
46
5. Discussion
5.1. Potential use of local isolated algae species from NPB
One aim of this Vinnova and ÅF-funded project was to find suitable species for a slowly stirred
raceway-system and Tethys reactors located in Bäckhammar. Local algae species might outgrow any
other inoculated algae, thereby minimizing contaminating effects. Seven different algae strains were
isolated and stored in pure monocultures in this project. At least ten other species were observed
microscopically in the samples, but were never isolated. It is logical to assume the presence of a
multitude of algae species within and around the open, non-sterile environment of NPB. However,
mixtures of species were also found in the Tethys reactors and raceway system. This indicates
difficulties in maintaining sterile cultures throughout the cultivation period. Cultures containing a
single alga species are easily defined, but might not present the optimum growth preferences for algae,
which might benefit from the presence of bacteria or other algae species. This could result in faster
growth rates and thereby, greater productivity [73].
It was not possible to determine the exact species of the isolated algae without performing a genomic
investigation, but the observed morphology indicates species within the genera: Scenedesmus,
Monoraphidium, Phormidium, Oscillatoria, Chlorella and Coenococcum. Phormidium and
Oscillatoria are filament forming algae, while the others are free-living microalgae. Filamentous
species might be problematic for biomass production in bioreactors due to unwanted surface fouling
and aggregate formation. As light penetration into the bioreactor is crucial for an efficient algae
growth fouling is a bad characteristics. On the other hand, filamentous species are easier to separate
from the liquid with lower losses due to effective filtration possibilities.
Species of Scenedesmus, Monoraphidium and Chlorella have all been found interesting in articles
regarding growth rates and lipid contents. Bogen et al [74] showed an accumulation of 20 % lipids of
DW using Monoraphidium contortum in 3 l photobioreactors. The lipid assay in this work was
performed with cultures in stationary phases. These results indicated a total lipid content of 44 % of
the isolated species M. contortum, which was the highest lipid content of any evaluated species.
Mandal et al [75] used Scenedesmus obliquus (a homotypic synonym to S. dimorphus) cultured in
simulated waste water and was able to show a 9-fold increase in lipid content by nitrogen starvation.
Mallick et al [76] used C. vulgaris and showed it was possible to boost the lipid content to 55 % by
nitrogen starvation also. The effect of any nitrogen starvation for these samples is not clear although
samples were taken during stationary phases. This might be a beneficial procedure to include in future
work to increase lipid yields. Total lipid contents were 19 % for S. dimorphus and 14 % for C. vulgaris
in this project. The lipid profile obtained in this project indicated the necessary fatty acid composition
for all evaluated algae species to be suitable for high-quality biodiesel production [77]. The majority
of the fatty acids were C16:0, C18:1 and C18:2, which are desirable in biodiesel production.
Macroalgae and filamentous microalgae species are typically rich in carbohydrates and less so in lipid
content [78]. Chang et al [79] investigated the possibility to use Phormidium autumnale for biodiesel
production, resulting in 14 % lipid content and the ability to synthesize heptadecane which can be
directly used as a biodiesel component without any further transesterification. These filamentous
species might be better used as substrates in microbial anaerobic digestion processes instead of direct
lipid extraction due to their large fractions of carbohydrates.
47
5.2. Treated biosludge as a source for nutritious medium
The pilot plant prototype in Bäckhammar aims for using waste materials from the mill to obtain algal
biomass. The fertilizer NPK is presently used for supplying nitrogen and phosphorous, but this is not
sustainable and an alternative source of N and P must be found. Biosludge was suggested as it contains
large amounts of nitrogen (2.8 %). The availability of this nitrogen was investigated by different
leaching techniques such as heating, ultrasonification and acid treatment.
Several methods of cultivating algae in media based on biosludge were evaluated. The very first
experiment concluded that there was no growth difference for all evaluated treatments in undissolved
biosludge. All results were inferior to the two control reactors with NPK and 3N-BBM+V
respectively. The following experiment was performed with biosludge dissolved in water, and treated
with acid and alkaline methods. Acid sludge treatment resulted in better algal growth than the NPK
control reactors after two weeks of growth. Alkaline treatment was also proven to suit algal growth,
but might not be feasible in larger scale due to the dark color of the culture medium. Based on these
results, acid treatment was chosen as a possible method to optimize nutrient extraction from biosludge.
Screening experiments investigated by algal growth (S. dimorphus) were performed to evaluate and
optimize the biosludge treatment procedure. Reaction time, temperature and acid strength were tested
in various combinations, with results suggesting that nutrient concentrations increased in the culture
medium with longer reaction times, higher temperatures and stronger acids. The most effective
treatment to release nutrients was using 1 % HCl. However, this medium was problematic in
supporting growth of the algae. This may be caused by the addition of acid/base for pH adjustment
which increases salt content and hence salinity. Another possibility is the release of metals present in
the biosludge at low pH. However, no algal inoculates showed any growth in this medium, nor in the
HCl-based medium used in section 4.4.3. Both media contains a high salinity, stemming from the
addition of salts with both acid and the base for pH-adjustment, which is problematic when working
with freshwater species. One could either perform a high salinity screening to select any local
halotolerant algae species, else it is needed to further investigate enhanced nutrient leaching from
biosludge with diluted acids or other pre-treatments.
Further, it was hypothesized that metals present in the sludge also were leached into the medium.
These metals could interfere with the algal cells and affect their growth negatively [80]. An elemental
analysis should be performed to evaluate the metallic composition of the biosludge to investigate
which, if any, elements could be leached at toxic concentrations. NPB uses Al2(SO4)3 as a precipitate
in their waste water treatment process, but this is a substance toxic to algae due to its aluminum-
content [81]. The leaching process should be refined to ensure satisfactory nutrient concentrations,
while maintaining insignificant concentrations of toxic elements.
48
5.3. Possible large scale setup at NPB
This project tried to investigate any suitable method of scaling up the results and perform any
following experiments in situ at NPB. This is one reason why focus has been devoted to developing a
simple and inexpensive biosludge treatment method. It is possible to scale up both H2O- and HCl-
based biosludge medium used in screening 2 of isolated species on biosludge-based media for use in
cultivation systems at NPB. The medium formulation protocol was constructed for a final volume of
1.5 l, and would be scaled up 1500 x for use in Tethys reactors to reach a working volume 2250 l. This
would require 110 kg dried biosludge to be dissolved in 750 l water, and heated by a suitable heat
source to 120 °C for 24 h, or lower temperatures for a longer time. The fibers can then be separated
from the liquid by sedimentation, in order to replace the filtration step.
Nutrient leaching experiments showed that it was possible to use lower temperatures if one would
compensate with longer treatment times. One possible setup would therefore be to prepare the next
growth medium alongside an ongoing batch cultivation of algae. The leaching process could
commence during the normal 8 month culture season, to be ready at the start of the next year season.
Alternatively, if higher temperatures were used a few days would be enough. It would be possible to
choose whichever is more suitable since a multitude of possible heat sources can be found at NPB.
Several algae species were found at NPB, but none could survive any of the acid-based biosludge
media used in any screening of isolated species on biosludge-based growth media, see sections 4.4.2
and 4.4.3. As discussed earlier one reason could be the high salinity of the medium made by the most
effective pre-treatment procedure. However, this could be beneficial at large scale if inoculating a
halo-tolerant strain and such cultivation is less prone for contamination since surrounding species are
used to fresh water conditions. A suitable inoculate could be Dunaliella salina. D. salina is already
used in several industrial outdoor cultivations in open ponds for β-carotene production. These open
pond systems maintain a high salinity in order to avoid other contaminants [82]. Three of the algae
species used in this project, C. vulgaris, M. contortum and S. quadricauda, have been selected for
present scaled-up experiments at NPB in 2.3 m3 Tethys-reactors. These species were selected due to
the shown growth rates, which were high in nutritious 3N-BBM+V medium. C. vulgaris and S.
quadricauda also grew in the H2O-based biosludge medium used in section 4.4.3, indicating
promising results if the media fabrication process could be further developed.
49
6. Conclusion Many domestic algae species were isolated from NPB and were able to grow in 3N-BBM+V growth
medium in the lab. Several cultures were successfully isolated from agar plates and serial dilution as
monocultures, indicating robustness to the chosen isolation method.
Biosludge is rich in nitrogen, concluded by an elementary analysis (CHN), but the availability of
nitrogen in its pure form is not enough for growing algae. A possible pre-treatment for biosludge has
been found, but should be further developed. Nutrient concentrations in the culture medium increased
with longer reaction times, higher temperatures and stronger acids. A dilute acid (1 % HCl) together
with heat (100 °C) for 5 days proved a great combination pre-treating biosludge, resulting in nutritious
medium. The best algal growth was shown in a growth medium based on water instead of HCl, a
medium with less nutrients, but also less salts. All tested algae were freshwater species and it is
possible that different results would have been observed if marine algae were also investigated.
Calculated growth rates were 0.02 h-1
for both C. vulgaris and S. quadricauda, compared to 0.05-0.06
h-1
when using 3N-BBM+V medium instead. An elemental analysis focused on metal content should
be performed on the biosludge to investigate whether it might cause negative growth effects or not.
Many biosludge pre-treatments were found to yield promising nutrient concentrations in the final
growth media. It was found that N-concentrations were limiting compared to the leached P-content,
and focus should be to increase the N-concentration. A longer pre-treatment, 4 weeks or more, might
be viable in leaching great NO3- concentrations and should be conducted since results indicated higher
concentrations in longer leaching experiments.
Finally, it could be concluded that it was possible to use waste sources from NPB as a growth medium
source for algae growth.

50
7. Recommendations for future work
The fastest growth amongst all cultures was observed in a co-culture of C. vulgaris and S.
dimorphus in 3N-BBM+V medium. Future work should evaluate the potential gain in
selective co-cultures versus monocultures or open, freely contaminated systems.
Algae growth on biosludge-based media was observed in experiments with S. dimorphus
UTEX 417 in acid-treated biosludge medium and for S. quadricauda and C. vulgaris in heat-
treated biosludge-based medium. Continued efforts should be made in developing and
optimizing a pre-treatment for nutrient leaching in biosludge-based systems. Weaker acid than
1 % HCl should be evaluated, as well as the possibilities to use other acid sources, e.g. the flue
gas produced in situ at NPB.
Further work should be made at isolating local algae species from NPB. 7 were isolated in this
project, but it was obvious that the true amount of available algae species were far greater.
Genetic algae strain confirmations should also be performed for any species resulting in
promising growth and fatty acid composition.
51
7. References 1. Fromm, H.J. and M. Hargrove, Photosynthesis, in Essentials of Biochemistry. 2012, Springer
Berlin Heidelberg.
2. Yen, H.-W., et al., Chapter 2 - Design of Photobioreactors for Algal Cultivation, in Biofuels
from Algae, A. Pandey, et al., Editors. 2014, Elsevier: Amsterdam. p. 23-45.
3. Houghton, J., Global Warming. Reports on Progress in Physics, 2005. 68(6): p. 1343-1403.
4. David G, D., Tax Policy and Global Warming. 2003, Canadian Tax Journal. 51(6).
5. Dave S, R.e.a., Global nitrogen deposition and carbon sinks. 2008, Nature Geoscience. 1(7).
6. Bhatnagar, A., et al., Chlorella minutissima--A Promising Fuel Alga for Cultivation in
Municipal Wastewaters. Applied Biochemistry and Biotechnology, 2010. 161(1-8): p. 523-36.
7. Hammouda, O., A. Gaber, and N. Abdelraouf, Microalgae and Wastewater Treatment.
Ecotoxicology and Environmental Safety, 1995. 31(3): p. 205-210.
8. Min, M., et al., Cultivating Chlorella sp. in a Pilot-Scale Photobioreactor Using Centrate
Wastewater for Microalgae Biomass Production and Wastewater Nutrient Removal. Applied
Biochemistry and Biotechnology, 2011. 165(1): p. 123-37.
9. Sydney, E.B., et al., Screening of microalgae with potential for biodiesel production and
nutrient removal from treated domestic sewage. Applied Energy, 2010. 88: p. 3291-3294.
10. An, J.-Y., et al., Hydrocarbon production from secondarily treated piggery wastewater by the
green alga Botryococcus braunii. Journal of Applied Phycology, 2003. 15: p. 185-191.
11. Mostafa, S.S.M., E.A. Shalaby, and G.I. Mahmoud, Cultivating Microalgae in Domestic
Wastewater for Biodiesel Production. Notulae Scientia Biologicae, 2012. IV: p. 56-65.
12. Appelberg, I., Microalgae cultivation with wastewater from a Swedish pulp and paper mill,
Master Thesis 2013, Chalmers Unversity of Technology: Gothenburg, Sweden.
13. Öberg, M., The Influence of Energy Efficient Cultivation on the Chemical Composition of
Algae Biomass for Biodiesel Production, Master Thesis. 2013, Chalmers University of
Technology: Gothenburg, Sweden. p. 55.
14. Mata, T.M., A.A. Martins, and N.S. Caetano, Microalgae for biodiesel production and other
applications: A review. Renewable and Sustainable Energy Reviews, 2010. 14(1): p. 217-232.
15. Wang, B., et al., CO2 bio-mitigation using microalgae. Applied Microbiology and
Biotechnology, 2008. 79(5): p. 707-718.
16. Svendsen, T., Waste water treatment and biosludge production at Nordic Paper Bäckhammar,
M. Svensson, Editor. 2013.
17. Sydney, E.B., et al., Chapter 4 - Respirometric Balance and Carbon Fixation of Industrially
Important Algae, in Biofuels from Algae, A. Pandey, et al., Editors. 2014, Elsevier:
Amsterdam. p. 67-84.
18. Lee, Y.-K. and H. Shen, Basic Culturing Techniques, in Handbook of Microalgal Culture.
2007, Blackwell Publishing Ltd. p. 40-56.
19. Ugwu, C.U., H. Aoyagi, and H. Uchiyama, Photobioreactors for mass cultivation of algae.
Bioresource Technology, 2008. 99(10): p. 4021-4028.
20. O'Connor, C.M.A., J. U. , Essentials of Cell Biology. NPG Education, 2010.
21. Barsanti, L. and P. Gualtieri, Photosynthesis, in Algae. 2005, CRC Press. p. 135-158.
22. Laura Barsanti, P.G., Photosynthesis, in Algae. 2005, CRC Press. p. 135-158.
23. Wilson, A and Melvin C, The photosynthetic cycle. CO2 dependent transients. 1955, Journal
of the American Chemical Society 77.22 (1955): 5948-5957. 24. Leegood, R.C., et al., Photosynthesis: Physiology and Metabolism. Vol. 9. 2004, Dordrecht:
Kluwer Academic Publishers.
25. Grobbelaar, J.U., Algal Nutrition ‒ Mineral Nutrition, in Handbook of Microalgal Culture.
2007, Blackwell Publishing Ltd. p. 95-115.
26. Tomaselli, L., The Microalgal Cell, in Handbook of Microalgal Culture. 2007, Blackwell
Publishing Ltd. p. 1-19.
27. Lee, Y.-K., Algal Nutrition ‒ Heterotrophic Carbon Nutrition, in Handbook of Microalgal
Culture. 2007, Blackwell Publishing Ltd. p. 116-124.
28. Jiang, Y., et al., Enhancement of acid resistance of Scenedesmus dimorphus by acid
adaptation. Journal of Applied Phycology, 2012. 24(6): p. 1637-1641.
52
29. Cerón García, M., et al., Mixotrophic production of marine microalga Phaeodactylum
tricornutum on various carbon sources. Journal of microbiology and biotechnology, 2006.
16(5): p. 689.
30. Bajpai, R., A. Prokop, and M. Zappi, Algal Biorefineries : Volume 1: Cultivation of Cells and
Products. 2014, Dordrecht: Springer Netherlands.
31. Ogbonna, J.C. and H. Tanaka, Light requirement and photosynthetic cell cultivation -
Development of processes for efficient light utilization in photobioreactors. Journal of Applied
Phycology, 2000. 12(3-5): p. 207-218.
32. Hu, Q., Environmental Effects on Cell Composition, in Handbook of Microalgal Culture.
2007, Blackwell Publishing Ltd. p. 83-94.
33. Borkenstein, C.G., et al., Cultivation of Chlorella emersonii with flue gas derived from a
cement plant. Journal of Applied Phycology, 2011. 23(1): p. 131-135.
34. Kong, Q.X., et al., Culture of Microalgae Chlamydomonas reinhardtii in Wastewater for
Biomass Feedstock Production. Applied Biochemistry and Biotechnology, 2010. 160(1): p. 9-
18.
35. Richmond, A., Handbook of Microalgal Culture: Biotechnology and Applied Phycology.
2008: Wiley.
36. Chen, C.Y. and E.G. Durbin, Effects of ph on the Growth and Carbon Uptake of Marine-
Phytoplankton. Marine Ecology Progress Series, 1994. 109(1): p. 83-94.
37. CSIRO. Microalgal Isolation Techniques. [cited 2013 2013-12-28]; Available from:
http://www.marine.csiro.au/microalgae/methods/microalgal%20isolation%20techniques.htmb.
38. Andersson, R.A., Algal Culturing Techniques. 2005: Academic Press.
39. John, D.M., et al., The Freshwater Algal Flora of the British Isles: An Identification Guide to
Freshwater and Terrestrial Algae. 2002: Cambridge University Press.
40. Devi, M.P., G.V. Subhash, and S.V. Mohan, Heterotrophic cultivation of mixed microalgae
for lipid accumulation and wastewater treatment during sequential growth and starvation
phases: Effect of nutrient supplementation. Renewable Energy, 2012. 43: p. 276-283.
41. Goswami, R.C.D. and M. Kalita, Scenedesmus dimorphus and Scenedesmus quadricauda: two
potent indigenous microalgae strains for biomass production and CO2 mitigation—A study on
their growth behavior and lipid productivity under different concentration of urea as nitrogen
source. J Algal Biomass Utln, 2011. 2(4): p. 42-49.
42. Zhao, G.L., et al., The effect of different trophic modes on lipid accumulation of Scenedesmus
quadricauda. Bioresource Technology, 2012. 114: p. 466-471.
43. Wu, L.F., P.C. Chen, and C.M. Lee, The effects of nitrogen sources and temperature on cell
growth and lipid accumulation of microalgae. International Biodeterioration &
Biodegradation, 2013. 85: p. 506-510.
44. Dhup, S. and V. Dhawan, Effect of nitrogen concentration on lipid productivity and fatty acid
composition of Monoraphidium sp. Bioresource Technology, 2014. 152(0): p. 572-575.
45. Pribyl, P., V. Cepák, and V. Zachleder, Production of lipids in 10 strains of Chlorella and
Parachlorella, and enhanced lipid productivity in Chlorella vulgaris. Applied Microbiology
and Biotechnology, 2012. 94(2): p. 549-61.
46. Feng, Y., C. Li, and D. Zhang, Lipid production of Chlorella vulgaris cultured in artificial
wastewater medium. Bioresource Technology, 2011. 102(1): p. 101-105.
47. Cañizares-Villanueva, R.O., et al., Phormidium treatment of anaerobically treated swine
wastewater. Water Research, 1994. 28(9): p. 1891-1895.
48. Himberg, K., et al., The effect of water treatment processes on the removal of hepatotoxins
fromMicrocystis andOscillatoria cyanobacteria: A laboratory study. Water Research, 1989.
23(8): p. 979-984.
49. Cohen, Y., E. Padan, and M. Shilo, Facultative anoxygenic photosynthesis in the
cyanobacterium Oscillatoria limnetica. Journal of Bacteriology, 1975. 123(3): p. 855-861.
50. de-Bashan, L.E. and Y. Bashan, Recent advances in removing phosphorus from wastewater
and its future use as fertilizer (1997-2003). Water Research, 2004. 38(19): p. 4222-4246.
51. Negulescu, M., 1 Municipal Waste Water Treatment. General Considerations, in
Developments in Water Science, N. Mircea, Editor. 1985, Elsevier. p. 13-18.
53
52. Berggren, B., Driftinstruktion Bioreaktorer Bäckhammars Bruk, in ANOX AB, A. AB, Editor.
1996: Lund, Sweden.
53. Tchobanoglous, G. and F.L. Burton, Wastewater engineering. Management, 1991. 7: p. 1-4.
54. Negulescu, M., 7 Mechanical Treatment, in Developments in Water Science, N. Mircea,
Editor. 1985, Elsevier. p. 92-184.
55. Negulescu, M., 8 Chemical Treatment, in Developments in Water Science, N. Mircea, Editor.
1985, Elsevier. p. 185-210.
56. Crittenden, J.C., et al., MWH’s Water Treatment - Principles and Design (3rd Edition). John
Wiley & Sons.
57. Lin, Y.-M., et al., Biological Nitrification and Denitrification Processes, in Biological
Treatment Processes, L. Wang, N. Pereira, and Y.-T. Hung, Editors. 2009, Humana Press. p.
539-588.
58. Negulescu, M., 9 Biological Treatment, in Developments in Water Science, N. Mircea, Editor.
1985, Elsevier. p. 211-342.
59. Wang, L., Z. Wu, and N. Shammas, Activated Sludge Processes, in Biological Treatment
Processes, L. Wang, N. Pereira, and Y.-T. Hung, Editors. 2009, Humana Press. p. 207-281.
60. Negulescu, M., 10 Sludge Treatment and Disposal, in Developments in Water Science, N.
Mircea, Editor. 1985, Elsevier. p. 343-437.
61. Suslick, K.S., The chemical effects of ultrasound. Scientific American, 1989. 260(2): p. 80-86.
62. Suslick, K.S., Ultrasound: its chemical, physical, and biological effects. 1988: VCH
Publishers.
63. Li, C. and Z.K. Zhao, Efficient Acid-Catalyzed Hydrolysis of Cellulose in Ionic Liquid.
Advanced Synthesis & Catalysis, 2007. 349(11-12): p. 1847-1850.
64. Daruwalla, E.H. and G.M. Nabar, Acid hydrolysis of cellulose. Journal of Polymer Science,
1956. 20(94): p. 205-208.
65. Folch, J., M. Lees, and G. Sloane-Stanley, A simple method for the isolation and purification
of total lipids from animal tissues. J. biol. Chem, 1957. 226(1): p. 497-509.
66. Christie, W.W. and X. Han, Lipid analysis: isolation, separation, identification and lipidomic
analysis. Vol. 24. 2010, Bridgwater, England: Oily Press, an imprint of PJ Barnes &
Associates.
67. Sorokin, C., Dry weight, packed cell volume and optical density, in Handbook of Phycological
Methods, J.R. Stein, Editor. 1980. p. 322-343.
68. Griffiths, M.J., et al., Interference by pigment in the estimation of microalgal biomass
concentration by optical density. Journal of Microbiological Methods, 2011. 85(2): p. 119-
123.
69. Kirsten, W.J., Introduction, in Organic Elemental Analysis, W.J. Kirsten, Editor. 1983,
Academic Press. p. 1-6.
70. Bark, M., Cultivation of eleven different species of freshwater microalgae using simulated flue
gas mimicking effluents from paper mills as carbon source, Master Thesis 2012, Chalmers
University of Technology: Göteborg. p. 108.
71. Redfield, A.C., On the proportions of organic derivatives in sea water and their relation to
the composition of plankton. 1934: University Press of Liverpool.
72. Chemiasoft. Chemiasoft Salinity Calculator. 2014 [cited 2014 22 april]; Available from:
http://www.chemiasoft.com/chemd/salinity_calculator.
73. Tate, J.J., et al., The Effects of Plant Growth Substances and Mixed Cultures on Growth and
Metabolite Production of Green Algae Chlorella sp.: A Review. Journal of plant growth
regulation, 2013. 32(2): p. 417-428.
74. Bogen, C., et al., Identification of Monoraphidium contortum as a promising species for liquid
biofuel production. Bioresource Technology, 2013. 133: p. 622-626.
75. Mandal, S. and N. Mallick, Waste Utilization and Biodiesel Production by the Green
Microalga Scenedesmus obliquus. Applied and Environmental Microbiology, 2011. 77(1): p.
374-377.
76. Mallick, N., et al., Green microalga Chlorella vulgaris as a potential feedstock for biodiesel.
Journal of Chemical Technology and Biotechnology, 2012. 87(1): p. 137-145.

54
77. Halim, R., M.K. Danquah, and P.A. Webley, Extraction of oil from microalgae for biodiesel
production: A review. Biotechnology Advances, 2012. 30(3): p. 709-732.
78. Vargas, M.A., et al., Biochemical Composition And Fatty Acid Content Of Filamentous
Nitrogen-Fixing Cyanobacteria. Journal of Phycology, 1998. 34(5): p. 812-817.
79. Chang, J., et al., Natural production of alkane by an easily harvested freshwater
cyanobacterium, Phormidium autumnale KNUA026. Algae, 2013. 28(1): p. 93-99.
80. Hughes, M.N. and R.K. Poole, Metal speciation and microbial growth—the hard (and soft)
facts. Journal of General Microbiology, 1991. 137(4): p. 725-734.
81. Lindemann, J., E. Holtkamp, and R. Herrmann, The impact of aluminium on green algae
isolated from two hydrochemically different headwater streams, Bavaria, Germany. Environ
Pollut, 1990. 67(1): p. 61-77.
82. Mousavi, P., et al., Biodiesel production from Dunaliella salina. Current Opinion in
Biotechnology, 2011. 22, Supplement 1(0): p. S149.
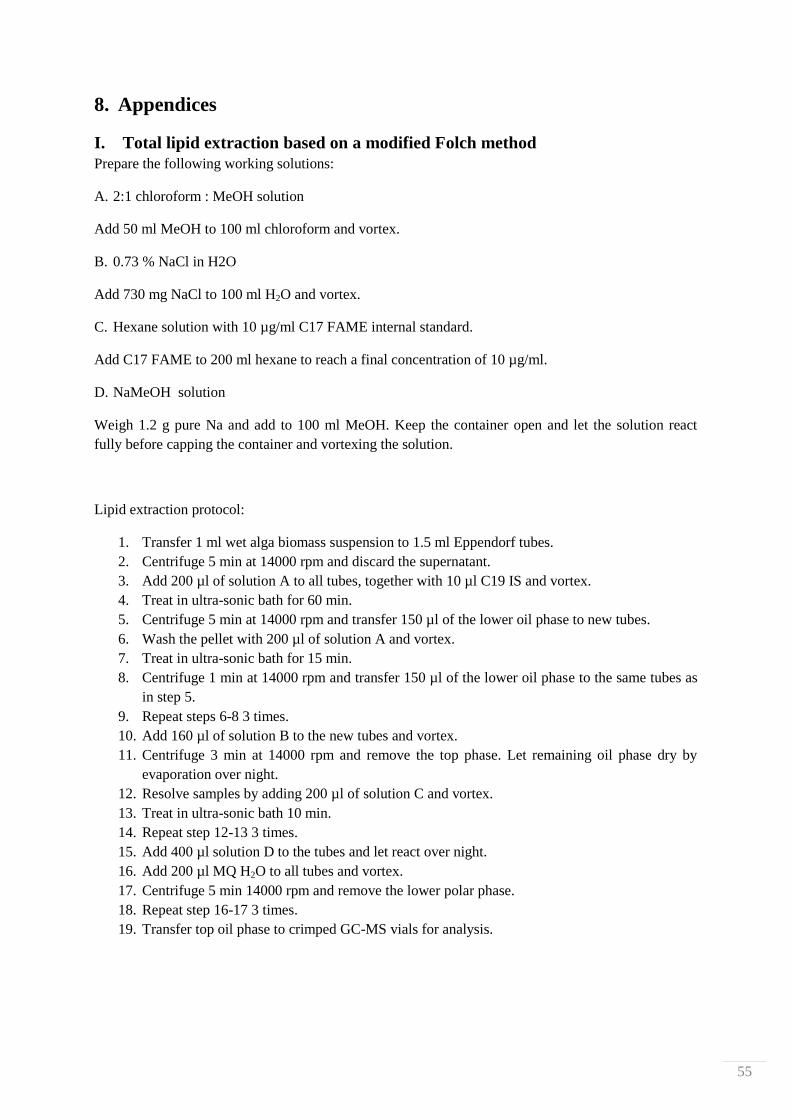
55
8. Appendices
I. Total lipid extraction based on a modified Folch method
Prepare the following working solutions:
A. 2:1 chloroform : MeOH solution
Add 50 ml MeOH to 100 ml chloroform and vortex.
B. 0.73 % NaCl in H2O
Add 730 mg NaCl to 100 ml H2O and vortex.
C. Hexane solution with 10 µg/ml C17 FAME internal standard.
Add C17 FAME to 200 ml hexane to reach a final concentration of 10 µg/ml.
D. NaMeOH solution
Weigh 1.2 g pure Na and add to 100 ml MeOH. Keep the container open and let the solution react
fully before capping the container and vortexing the solution.
Lipid extraction protocol:
1. Transfer 1 ml wet alga biomass suspension to 1.5 ml Eppendorf tubes.
2. Centrifuge 5 min at 14000 rpm and discard the supernatant.
3. Add 200 µl of solution A to all tubes, together with 10 µl C19 IS and vortex.
4. Treat in ultra-sonic bath for 60 min.
5. Centrifuge 5 min at 14000 rpm and transfer 150 µl of the lower oil phase to new tubes.
6. Wash the pellet with 200 µl of solution A and vortex.
7. Treat in ultra-sonic bath for 15 min.
8. Centrifuge 1 min at 14000 rpm and transfer 150 µl of the lower oil phase to the same tubes as
in step 5.
9. Repeat steps 6-8 3 times.
10. Add 160 µl of solution B to the new tubes and vortex.
11. Centrifuge 3 min at 14000 rpm and remove the top phase. Let remaining oil phase dry by
evaporation over night.
12. Resolve samples by adding 200 µl of solution C and vortex.
13. Treat in ultra-sonic bath 10 min.
14. Repeat step 12-13 3 times.
15. Add 400 µl solution D to the tubes and let react over night.
16. Add 200 µl MQ H2O to all tubes and vortex.
17. Centrifuge 5 min 14000 rpm and remove the lower polar phase.
18. Repeat step 16-17 3 times.
19. Transfer top oil phase to crimped GC-MS vials for analysis.
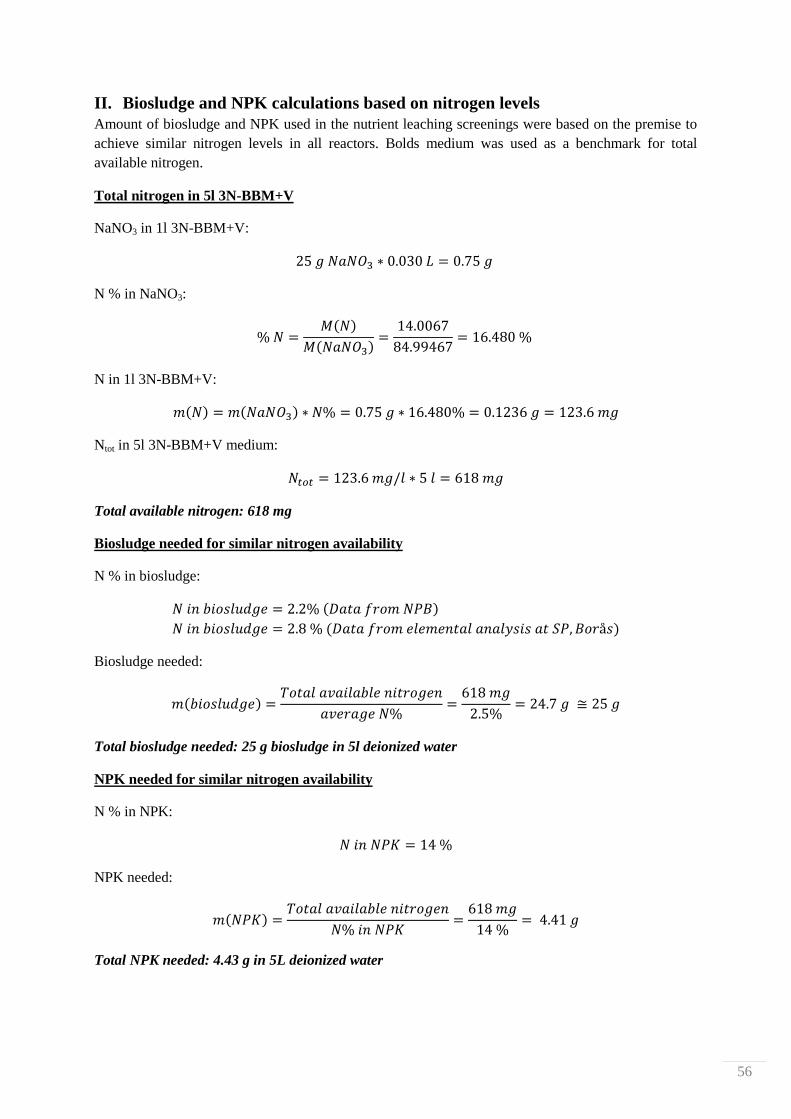
56
II. Biosludge and NPK calculations based on nitrogen levels
Amount of biosludge and NPK used in the nutrient leaching screenings were based on the premise to
achieve similar nitrogen levels in all reactors. Bolds medium was used as a benchmark for total
available nitrogen.
Total nitrogen in 5l 3N-BBM+V
NaNO3 in 1l 3N-BBM+V:
N % in NaNO3:
( )
( )
N in 1l 3N-BBM+V:
( ) ( )
Ntot in 5l 3N-BBM+V medium:
Total available nitrogen: 618 mg
Biosludge needed for similar nitrogen availability
N % in biosludge:
( )
( )
Biosludge needed:
( )
Total biosludge needed: 25 g biosludge in 5l deionized water
NPK needed for similar nitrogen availability
N % in NPK:
NPK needed:
( )
Total NPK needed: 4.43 g in 5L deionized water
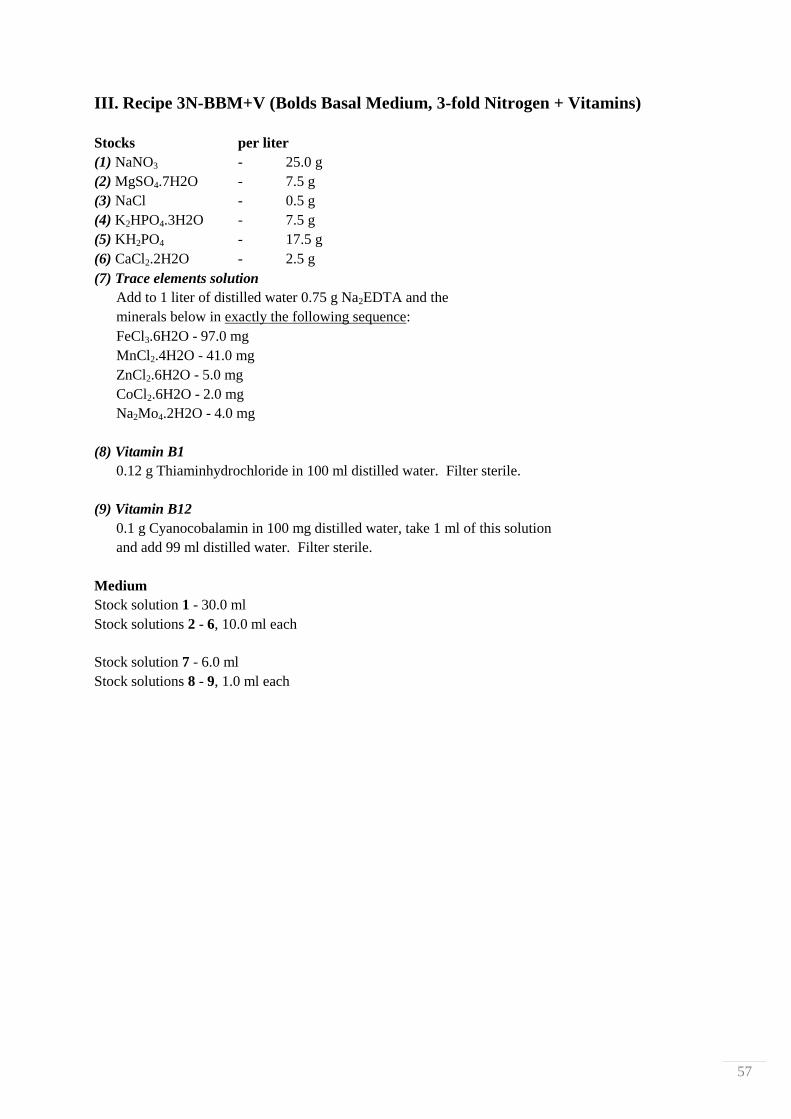
57
III. Recipe 3N-BBM+V (Bolds Basal Medium, 3-fold Nitrogen + Vitamins)
Stocks per liter
(1) NaNO3 - 25.0 g
(2) MgSO4.7H2O - 7.5 g
(3) NaCl - 0.5 g
(4) K2HPO4.3H2O - 7.5 g
(5) KH2PO4 - 17.5 g
(6) CaCl2.2H2O - 2.5 g
(7) Trace elements solution
Add to 1 liter of distilled water 0.75 g Na2EDTA and the
minerals below in exactly the following sequence:
FeCl3.6H2O - 97.0 mg
MnCl2.4H2O - 41.0 mg
ZnCl2.6H2O - 5.0 mg
CoCl2.6H2O - 2.0 mg
Na2Mo4.2H2O - 4.0 mg
(8) Vitamin B1
0.12 g Thiaminhydrochloride in 100 ml distilled water. Filter sterile.
(9) Vitamin B12
0.1 g Cyanocobalamin in 100 mg distilled water, take 1 ml of this solution
and add 99 ml distilled water. Filter sterile.
Medium
Stock solution 1 - 30.0 ml
Stock solutions 2 - 6, 10.0 ml each
Stock solution 7 - 6.0 ml
Stock solutions 8 - 9, 1.0 ml each

58
IV. NPK medium formulation method
1. Calculate desired final concentration of NPK. For example calculations of desired
concentrations used in this work, see Appendix II.
2. Weigh correct amount of NPK fertilizer.
3. Dissolve in deionized water.
4. Sterilize by autoclaving at 120 °C for 15 min.
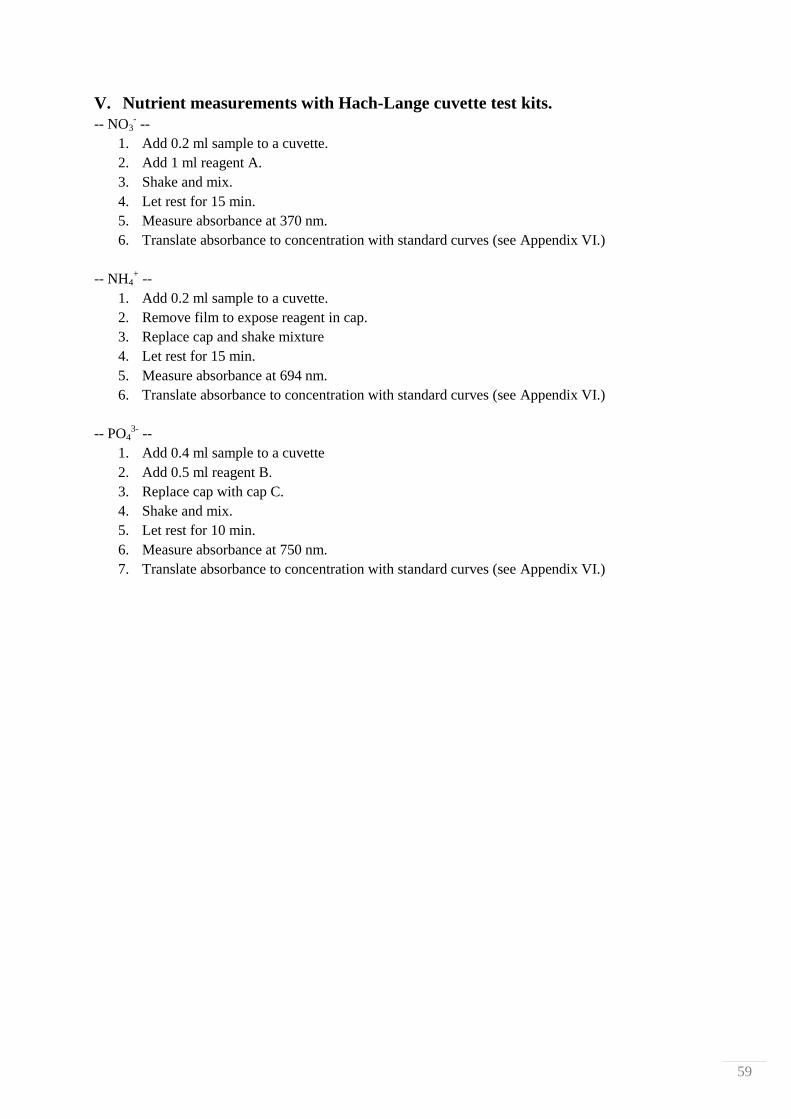
59
V. Nutrient measurements with Hach-Lange cuvette test kits.
-- NO3- --
1. Add 0.2 ml sample to a cuvette.
2. Add 1 ml reagent A.
3. Shake and mix.
4. Let rest for 15 min.
5. Measure absorbance at 370 nm.
6. Translate absorbance to concentration with standard curves (see Appendix VI.)
-- NH4+ --
1. Add 0.2 ml sample to a cuvette.
2. Remove film to expose reagent in cap.
3. Replace cap and shake mixture
4. Let rest for 15 min.
5. Measure absorbance at 694 nm.
6. Translate absorbance to concentration with standard curves (see Appendix VI.)
-- PO43-
--
1. Add 0.4 ml sample to a cuvette
2. Add 0.5 ml reagent B.
3. Replace cap with cap C.
4. Shake and mix.
5. Let rest for 10 min.
6. Measure absorbance at 750 nm.
7. Translate absorbance to concentration with standard curves (see Appendix VI.)
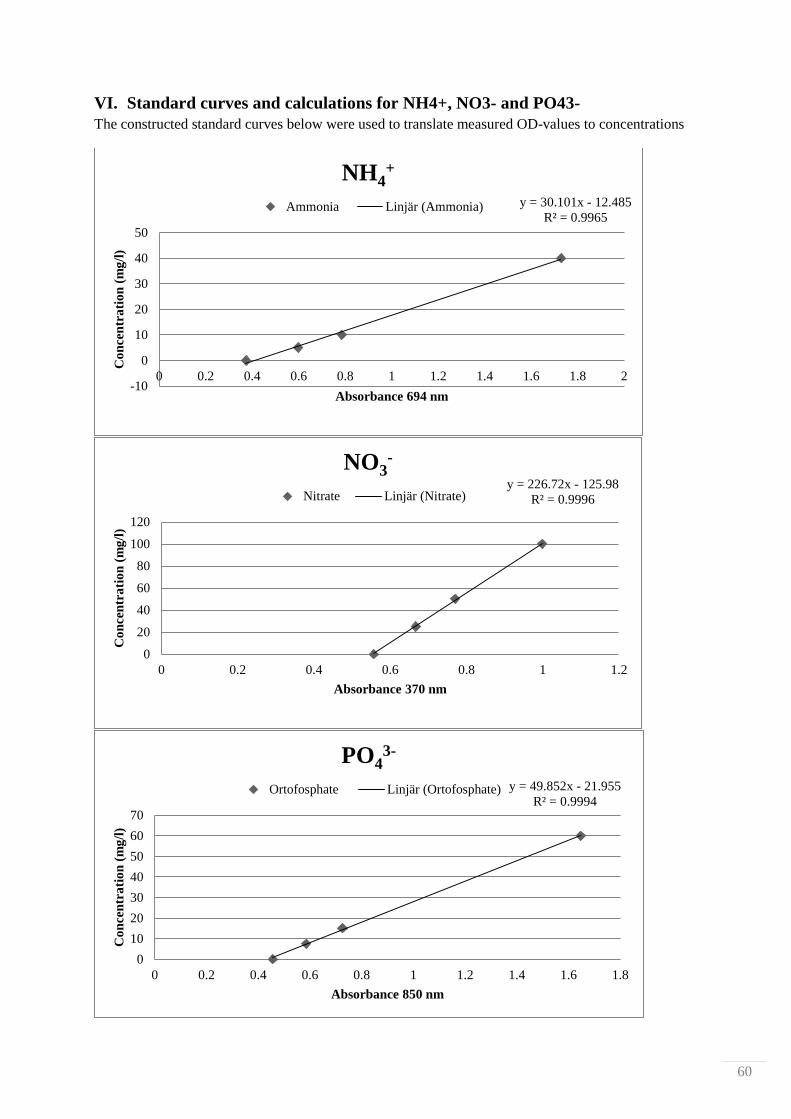
60
VI. Standard curves and calculations for NH4+, NO3- and PO43-
The constructed standard curves below were used to translate measured OD-values to concentrations
y = 30.101x - 12.485
R² = 0.9965
-10
0
10
20
30
40
50
0 0.2 0.4 0.6 0.8 1 1.2 1.4 1.6 1.8 2
Co
nce
ntr
ati
on
(m
g/l
)
Absorbance 694 nm
NH4+
Ammonia Linjär (Ammonia)
y = 226.72x - 125.98
R² = 0.9996
0
20
40
60
80
100
120
0 0.2 0.4 0.6 0.8 1 1.2
Co
nce
ntr
ati
on
(m
g/l
)
Absorbance 370 nm
NO3-
Nitrate Linjär (Nitrate)
y = 49.852x - 21.955
R² = 0.9994
0
10
20
30
40
50
60
70
0 0.2 0.4 0.6 0.8 1 1.2 1.4 1.6 1.8
Co
nce
ntr
ati
on
(m
g/l
)
Absorbance 850 nm
PO43-
Ortofosphate Linjär (Ortofosphate)
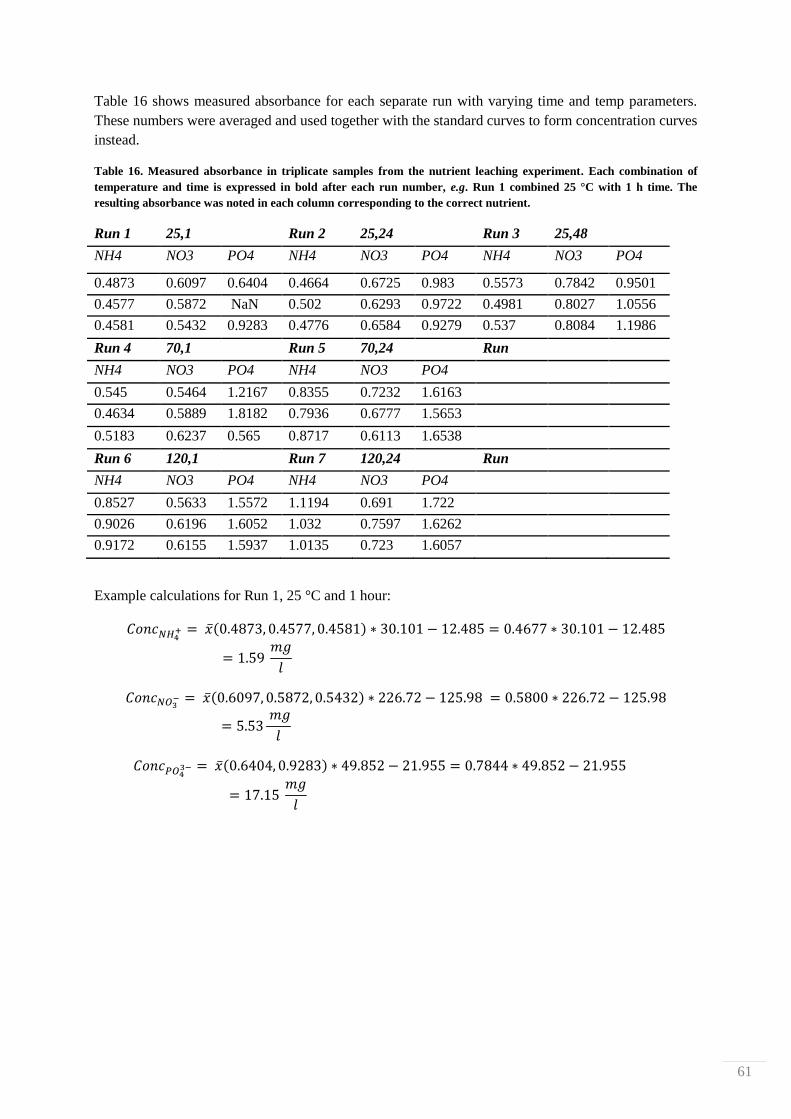
61
Table 16 shows measured absorbance for each separate run with varying time and temp parameters.
These numbers were averaged and used together with the standard curves to form concentration curves
instead.
Table 16. Measured absorbance in triplicate samples from the nutrient leaching experiment. Each combination of
temperature and time is expressed in bold after each run number, e.g. Run 1 combined 25 °C with 1 h time. The
resulting absorbance was noted in each column corresponding to the correct nutrient.
Run 1 25,1 Run 2 25,24 Run 3 25,48
NH4 NO3 PO4 NH4 NO3 PO4 NH4 NO3 PO4
0.4873 0.6097 0.6404 0.4664 0.6725 0.983 0.5573 0.7842 0.9501
0.4577 0.5872 NaN 0.502 0.6293 0.9722 0.4981 0.8027 1.0556
0.4581 0.5432 0.9283 0.4776 0.6584 0.9279 0.537 0.8084 1.1986
Run 4 70,1 Run 5 70,24 Run
NH4 NO3 PO4 NH4 NO3 PO4
0.545 0.5464 1.2167 0.8355 0.7232 1.6163
0.4634 0.5889 1.8182 0.7936 0.6777 1.5653
0.5183 0.6237 0.565 0.8717 0.6113 1.6538
Run 6 120,1 Run 7 120,24 Run
NH4 NO3 PO4 NH4 NO3 PO4
0.8527 0.5633 1.5572 1.1194 0.691 1.722
0.9026 0.6196 1.6052 1.032 0.7597 1.6262
0.9172 0.6155 1.5937 1.0135 0.723 1.6057
Example calculations for Run 1, 25 °C and 1 hour:
( )
( )
( )
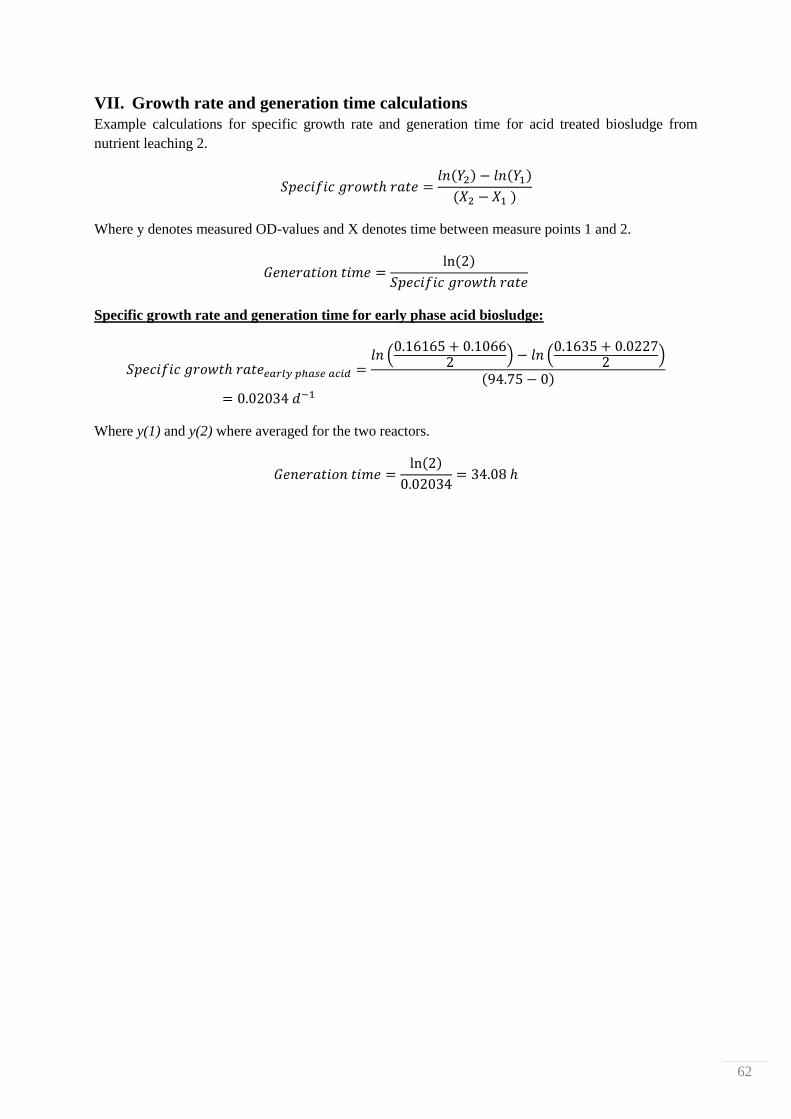
62
VII. Growth rate and generation time calculations
Example calculations for specific growth rate and generation time for acid treated biosludge from
nutrient leaching 2.
( ) ( )
( )
Where y denotes measured OD-values and X denotes time between measure points 1 and 2.
( )
Specific growth rate and generation time for early phase acid biosludge:
(
) (
)
( )
Where y(1) and y(2) where averaged for the two reactors.
( )
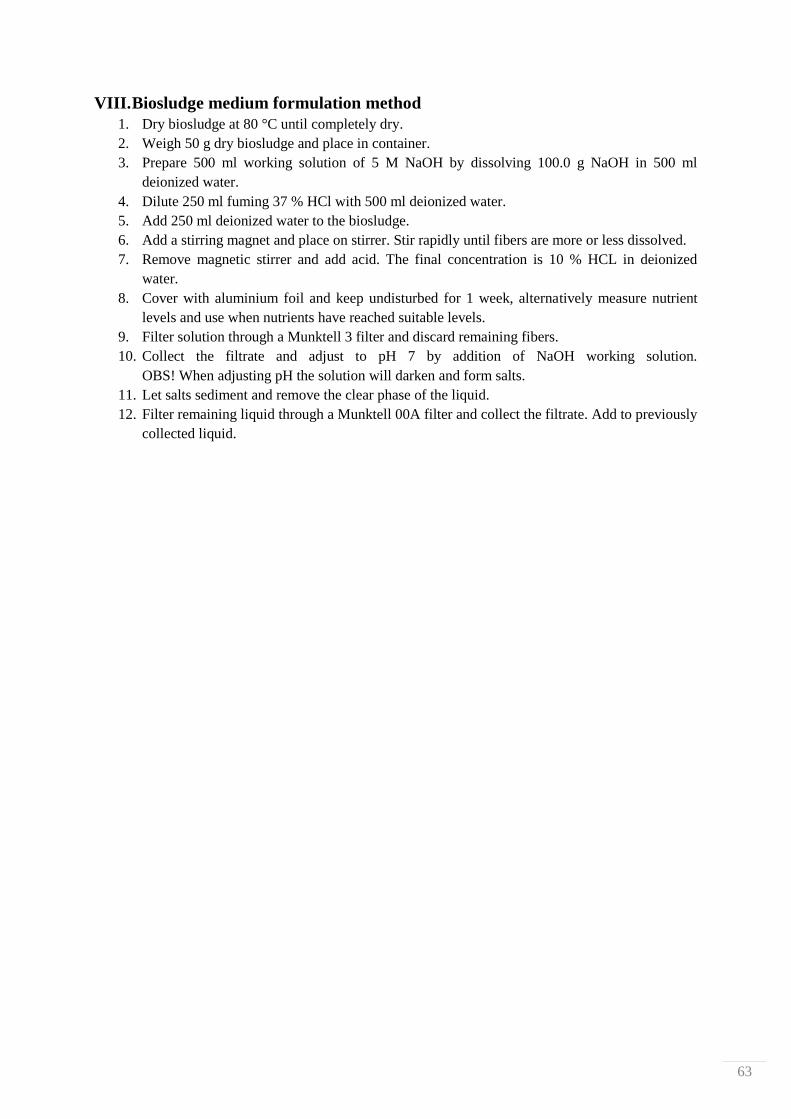
63
VIII. Biosludge medium formulation method
1. Dry biosludge at 80 °C until completely dry.
2. Weigh 50 g dry biosludge and place in container.
3. Prepare 500 ml working solution of 5 M NaOH by dissolving 100.0 g NaOH in 500 ml
deionized water.
4. Dilute 250 ml fuming 37 % HCl with 500 ml deionized water.
5. Add 250 ml deionized water to the biosludge.
6. Add a stirring magnet and place on stirrer. Stir rapidly until fibers are more or less dissolved.
7. Remove magnetic stirrer and add acid. The final concentration is 10 % HCL in deionized
water.
8. Cover with aluminium foil and keep undisturbed for 1 week, alternatively measure nutrient
levels and use when nutrients have reached suitable levels.
9. Filter solution through a Munktell 3 filter and discard remaining fibers.
10. Collect the filtrate and adjust to pH 7 by addition of NaOH working solution.
OBS! When adjusting pH the solution will darken and form salts.
11. Let salts sediment and remove the clear phase of the liquid.
12. Filter remaining liquid through a Munktell 00A filter and collect the filtrate. Add to previously
collected liquid.

64
IX. Method for growth screenings 1 and 2 of S. dimorphus on treated biosludge
1. Autoclave all equipment used in the screening at 120 °C for 15 min.
2. Dry biosludge in 80 °C until completely dry
3. Weigh, net and pre-treat biosludge for each experiment.
4. Prepare nutritious control media of NPK and 3N-BBM+V.
5. Calculate appropriate dilutions of algal pre cultures to the final volume used in screening.
6. Centrifuge calculated volumes of algal pre culture at 1100 xg for 5 min
7. Gently discard the supernatant. Try not to disturb the pellet as it is soft.
8. Resuspend pellet in sterile water. Add the same volume that was discarded.
9. Add biosludge and control media to reactors.
10. Add algal pre cultures to reactors.
11. Initiate stirring and gas flow. Inspect and if necessary, manually adjust for an even flow across
all reactors. Set the gas flow to 1 l/min

65
X. Method of nutrient leaching screening
1. Wash and dry PTFE-chambers
2. Dry biosludge in 80 °C until completely dry.
3. Add 0.5 g biosludge to PTFE-chamber.
4. Prepare 10% working solution of HCl. Dilute concentrated HCl with sterile water.
5. Add 50,0 ml 10% HCl to PTFE-chambers and seal them tight. Mix the contents by gently
shaking the chamber.
6. Place PTFE-chambers in appropriate temperature and leave them until time to measure.
7. When it is time for measurements, let chambers cool to room temperature.
8. Filter acid and sludge through a Munktell 3 filter to remove fibers. Discard filter and
remaingin fibers and collect filtrate.
9. Adjust pH by addition of 2 M NaOH to pH 7.
10. Measure nutrient levels with correct measure kit.
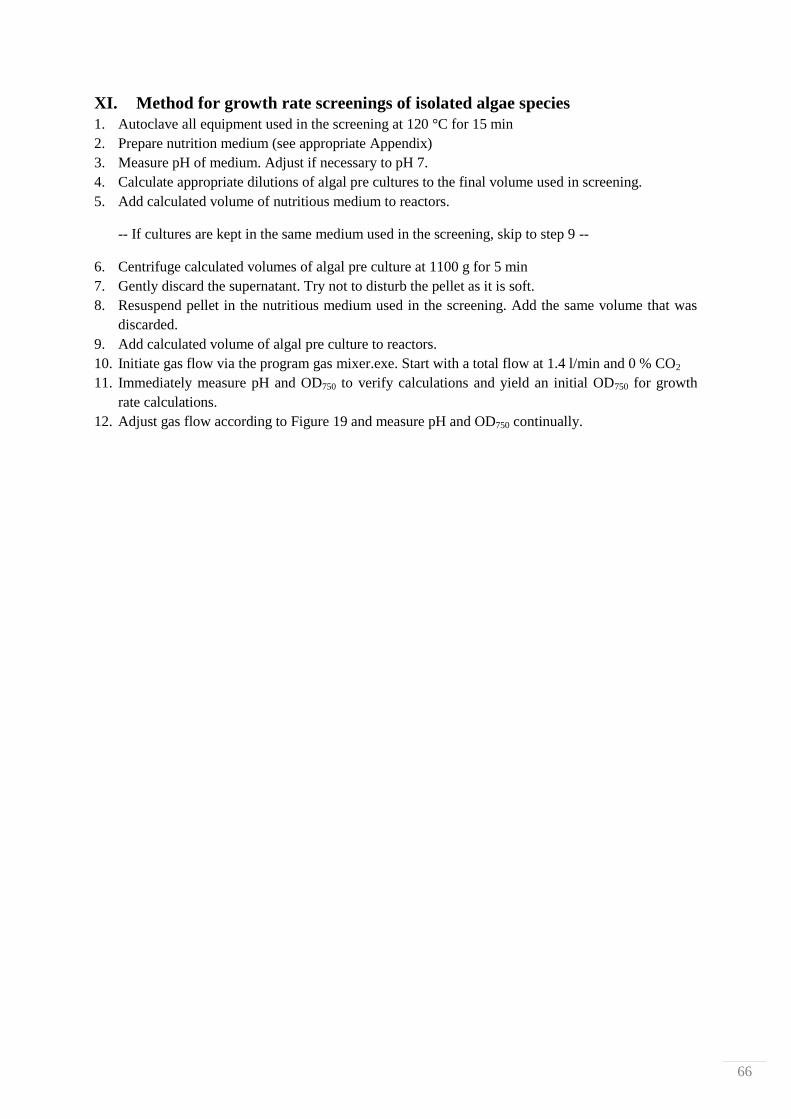
66
XI. Method for growth rate screenings of isolated algae species
1. Autoclave all equipment used in the screening at 120 °C for 15 min
2. Prepare nutrition medium (see appropriate Appendix)
3. Measure pH of medium. Adjust if necessary to pH 7.
4. Calculate appropriate dilutions of algal pre cultures to the final volume used in screening.
5. Add calculated volume of nutritious medium to reactors.
-- If cultures are kept in the same medium used in the screening, skip to step 9 --
6. Centrifuge calculated volumes of algal pre culture at 1100 g for 5 min
7. Gently discard the supernatant. Try not to disturb the pellet as it is soft.
8. Resuspend pellet in the nutritious medium used in the screening. Add the same volume that was
discarded.
9. Add calculated volume of algal pre culture to reactors.
10. Initiate gas flow via the program gas mixer.exe. Start with a total flow at 1.4 l/min and 0 % CO2
11. Immediately measure pH and OD750 to verify calculations and yield an initial OD750 for growth
rate calculations.
12. Adjust gas flow according to Figure 19 and measure pH and OD750 continually.