improving access to geodetic imaging crustal deformation
TRANSCRIPT

RESEARCH ARTICLE
Improving access to geodetic imaging crustal deformation datausing GeoGateway
Andrea Donnellan1& Jay Parker1 & Michael Heflin1
& Margaret Glasscoe1 & Gregory Lyzenga1 & Marlon Pierce2&
Jun Wang2& John Rundle3 & Lisa Grant Ludwig4
& Robert Granat5 & Megan Mirkhanian4& Nathan Pulver1
Received: 5 June 2020 /Accepted: 15 December 2020# The Author(s) 2021
AbstractGeoGateway (http://geo-gateway.org) is a web-based interface for analysis and modeling of geodetic imaging data and to supportresponse to related disasters. Geodetic imaging data product currently supported by GeoGateway include Global NavigationSatellite System (GNSS) daily position time series and derived velocities and displacements and airborne InterferometricSynthetic Aperture Radar (InSAR) from NASA’s UAVSAR platform. GeoGateway allows users to layer data products in aweb map interface and extract information from various tools. Extracted products can be downloaded for further analysis.GeoGateway includes overlays of California fault traces, seismicity from user selected search parameters, and user suppliedmap files. GeoGateway also provides earthquake nowcasts and hazard maps as well as products created for related response tonatural disasters. A user guide is present in the GeoGateway interface. The GeoGateway development team is also growing theuser base through workshops, webinars, and video tutorials. GeoGateway is used in the classroom and for research by experts andnon-experts including by students.
Keywords Science gateway .Web services . Geodesy . InSAR . UAVSAR . Earthquake . GeoGateway
Introduction
Earthquakes can cause tremendous damage and loss of life yeta complete understanding of the processes that control themhas been elusive. Traditionally geology and seismology havebeen used to study earthquakes, but over the last three decadesgeodetic methods have improved understanding of how strainaccumulates in the crust and on fault systems, is released in
earthquakes, and is transferred to other faults. Geodetic imag-ing uses various remote and in-situ observations to measurethe detailed shape and deformation of the Earth, particularly atthe surface, which can be analyzed and modeled to betterunderstand the underlying processes. GeoGateway (https://geo-gateway.org) is a science gateway that provides toolsfor analysis, modeling, and response using geodetic imagingproducts in a web map-based interface. Users can rapidly andsimultaneously visualize multiple types of data and downloadproducts or extractions of them for further offline analysis.
Geophysical background and relevant data
Earthquakes happen nearly instantaneously, causing shaking;large events near populated areas can cause damage and lossof life. The stress accumulation that leads to earthquakes is along-term process, driven bymotion of Earth’s tectonic plates.Understanding crustal properties and how strain accumulatesand is released is key to better understanding earthquakes andthe hazards they pose. Seismometers measure earthquakes andtheir aftershocks, and geologic observations can documentlong-term fault motions, crack patterns, and offsets from
For special issue: Earth Science Informatics: Technical Innovations toIncrease Scientific Access to Earth Observation Data. https://www.springer.com/journal/12145/updates/17189488
Communicated by: H. Babaie
* Andrea [email protected]
1 Jet Propulsion Laboratory, California Institute of Technology,Pasadena, CA, USA
2 Indiana University, Bloomington, IN, USA3 University of California, Davis, CA, USA4 University of California, Irvine, CA, USA5 City College of New York, New York, NY, USA
Earth Science Informaticshttps://doi.org/10.1007/s12145-020-00561-7
surface rupturing earthquakes. Geodetic methods measure de-formation from tectonic strain accumulation, earthquake faultslip, and postseismic response following earthquakes.Geodetic observations fill in a large data gap on temporaland spatial scales that are otherwise difficult to observe. Themethods can also be applied to the study of landslides or otherprocesses that deform or disrupt the land surface.GeoGateway focuses on measurement of crustal deformationfrom ground-based and remotely sensed geodetic imaging ob-servations. The different types of measurements are sensitiveto different temporal and spatial scales and can be fused toimprove the overall measurement of surface deformation.Processes occurring at depth can then be inferred from thesurface deformation.
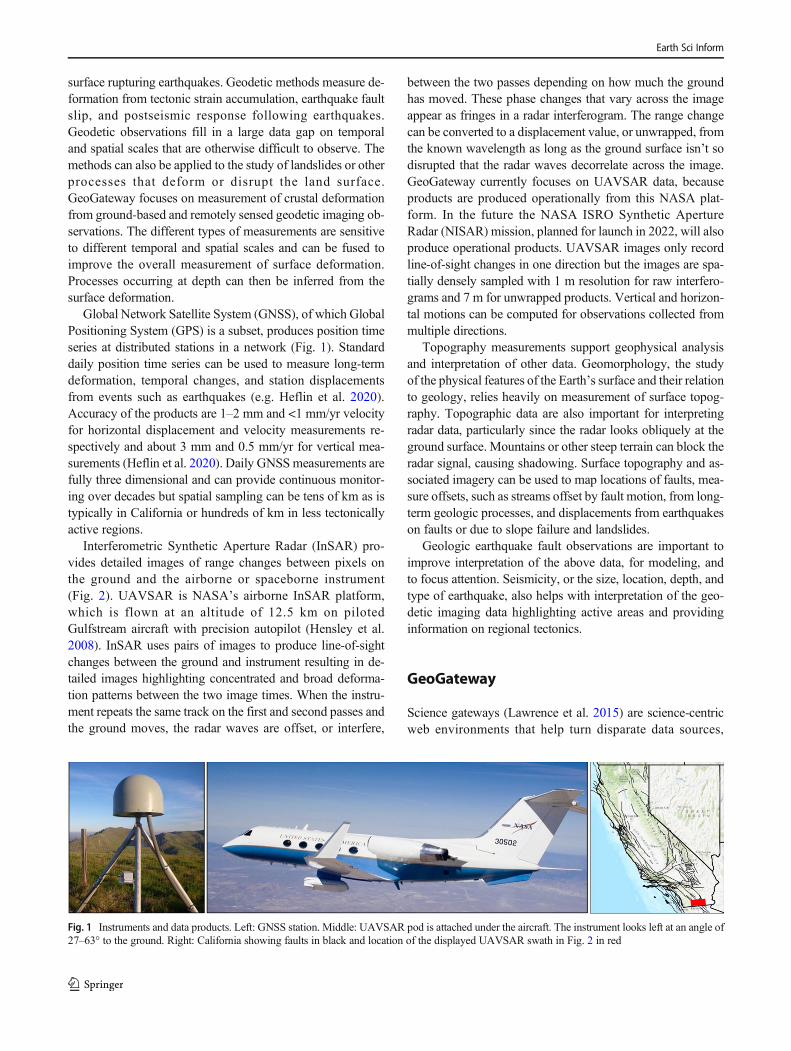
Global Network Satellite System (GNSS), of which GlobalPositioning System (GPS) is a subset, produces position timeseries at distributed stations in a network (Fig. 1). Standarddaily position time series can be used to measure long-termdeformation, temporal changes, and station displacementsfrom events such as earthquakes (e.g. Heflin et al. 2020).Accuracy of the products are 1–2 mm and <1 mm/yr velocityfor horizontal displacement and velocity measurements re-spectively and about 3 mm and 0.5 mm/yr for vertical mea-surements (Heflin et al. 2020). Daily GNSSmeasurements arefully three dimensional and can provide continuous monitor-ing over decades but spatial sampling can be tens of km as istypically in California or hundreds of km in less tectonicallyactive regions.
Interferometric Synthetic Aperture Radar (InSAR) pro-vides detailed images of range changes between pixels onthe ground and the airborne or spaceborne instrument(Fig. 2). UAVSAR is NASA’s airborne InSAR platform,which is flown at an altitude of 12.5 km on pilotedGulfstream aircraft with precision autopilot (Hensley et al.2008). InSAR uses pairs of images to produce line-of-sightchanges between the ground and instrument resulting in de-tailed images highlighting concentrated and broad deforma-tion patterns between the two image times. When the instru-ment repeats the same track on the first and second passes andthe ground moves, the radar waves are offset, or interfere,
between the two passes depending on how much the groundhas moved. These phase changes that vary across the imageappear as fringes in a radar interferogram. The range changecan be converted to a displacement value, or unwrapped, fromthe known wavelength as long as the ground surface isn’t sodisrupted that the radar waves decorrelate across the image.GeoGateway currently focuses on UAVSAR data, becauseproducts are produced operationally from this NASA plat-form. In the future the NASA ISRO Synthetic ApertureRadar (NISAR) mission, planned for launch in 2022, will alsoproduce operational products. UAVSAR images only recordline-of-sight changes in one direction but the images are spa-tially densely sampled with 1 m resolution for raw interfero-grams and 7 m for unwrapped products. Vertical and horizon-tal motions can be computed for observations collected frommultiple directions.
Topography measurements support geophysical analysisand interpretation of other data. Geomorphology, the studyof the physical features of the Earth’s surface and their relationto geology, relies heavily on measurement of surface topog-raphy. Topographic data are also important for interpretingradar data, particularly since the radar looks obliquely at theground surface. Mountains or other steep terrain can block theradar signal, causing shadowing. Surface topography and as-sociated imagery can be used to map locations of faults, mea-sure offsets, such as streams offset by fault motion, from long-term geologic processes, and displacements from earthquakeson faults or due to slope failure and landslides.
Geologic earthquake fault observations are important toimprove interpretation of the above data, for modeling, andto focus attention. Seismicity, or the size, location, depth, andtype of earthquake, also helps with interpretation of the geo-detic imaging data highlighting active areas and providinginformation on regional tectonics.
GeoGateway
Science gateways (Lawrence et al. 2015) are science-centricweb environments that help turn disparate data sources,
Fig. 1 Instruments and data products. Left: GNSS station. Middle: UAVSAR pod is attached under the aircraft. The instrument looks left at an angle of27–63° to the ground. Right: California showing faults in black and location of the displayed UAVSAR swath in Fig. 2 in red
Earth Sci Inform
analysis tools, computing resources, and scientific softwareinto comprehensive end user environments that enable onlineresearch and support scientific collaboration. GeoGateway isan example of a science gateway that currently focuses on dataaccess and interactive analysis of geophysical data sets. Themain idea of science gateways is that they aggregate scientificsoftware and data into online platforms through services withwell-defined Application Programming Interfaces (APIs).These services may be operated by the gateway provider, orthey may be operated by third party providers. Science gatewaysare responsible for organizing these general-purpose services intospecific scientific usage scenarios through a combination ofmiddleware and user interface components. GeoGateway(https://geo-gateway.org) provides tools for analysis, modeling,and response using geodetic imaging products, particularly thoseproduced by NASA, in a web map-based interface. Users canrapidly visualize data and download products or extractions ofthem for further offline analysis.
GeoGateway architecture and services
GeoGateway uses a service-oriented architecture with Web-based user interfaces (Fig. 3). GeoGateway provides core ser-vices for accessing UAVSAR, GNSS, and related data(Table 1). UAVSAR repeat pass interferometry (RPI) prod-ucts (Hensley et al. 2005) and UCERF3 (Field et al. 2014)fault traces are provided by GIS services operated by the
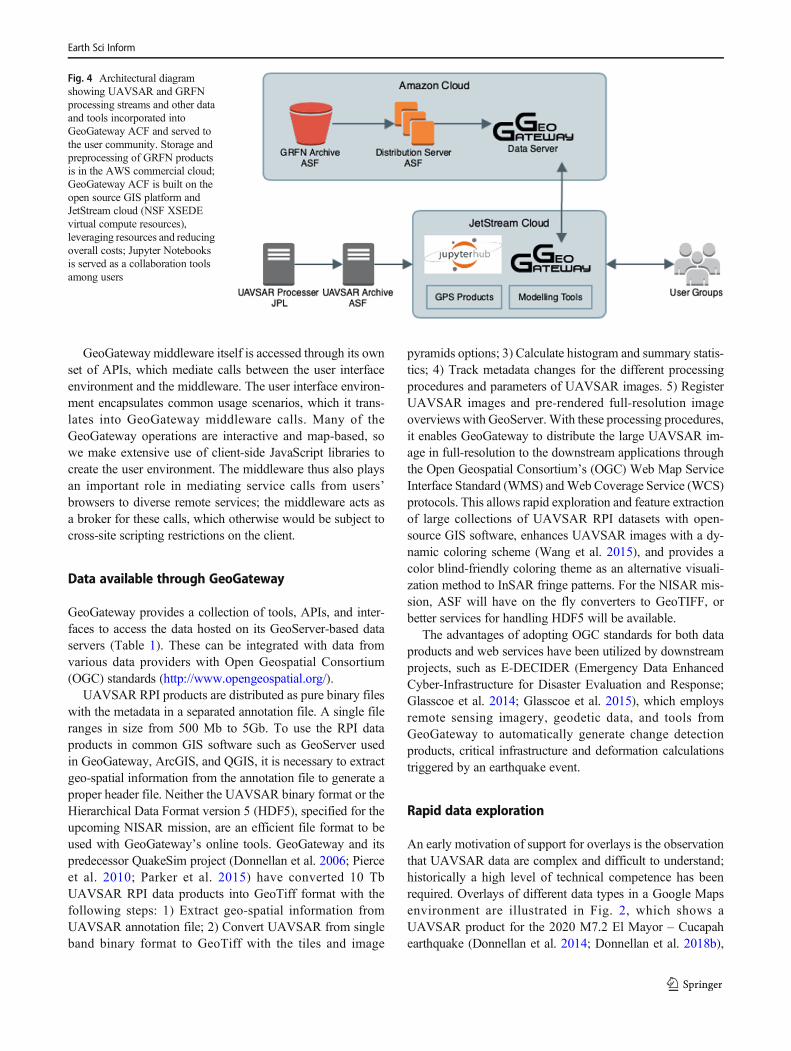
GeoGateway project and use the open source GeoServer soft-ware (http://geoserver.org/). GNSS data services (Heflin et al.2020) are operated by NASA JPL (https://sideshow.jpl.nasa.gov/post/series.html), and seismicity data are obtained fromUSGS earthquake catalog. In addition, users can upload theirown data sets in KML format (Fig. 4).
GeoGateway has undergone a significant upgrade, involvinga complete rewrite of its user interface, which we have main-tained since 2014.The upgraded site was deployed at the end of2020. We deprecated older Web framework approaches(AngularJS, Node.js, Google Maps) in favor of better supported,non-proprietary technologies (Vue.js, Django, Leaflet). We arealso reviewing all software in order to provide better organizationso that it will be easier to maintain and to modify by new devel-opers. The new technology stack aligns with other projects in theIndiana University Cyberinfrastructure Integration ResearchCenter, which develops and operates GeoGateway, increasingGeoGateway’s maintainability. The new technology stack is alsoaligned more closely with Apache Airavata middleware, whichenables us to provide better support for executing scientific soft-ware asynchronously on managed, shared clusters and super-computers. It also enables us to build on Apache Airavata’ssecurity components, which can be used to provide improvedgroup management and the ability to share results with collabo-rators in GeoGateway.
The collection of semi-autonomous services iscomplemented by execution services that can remotely
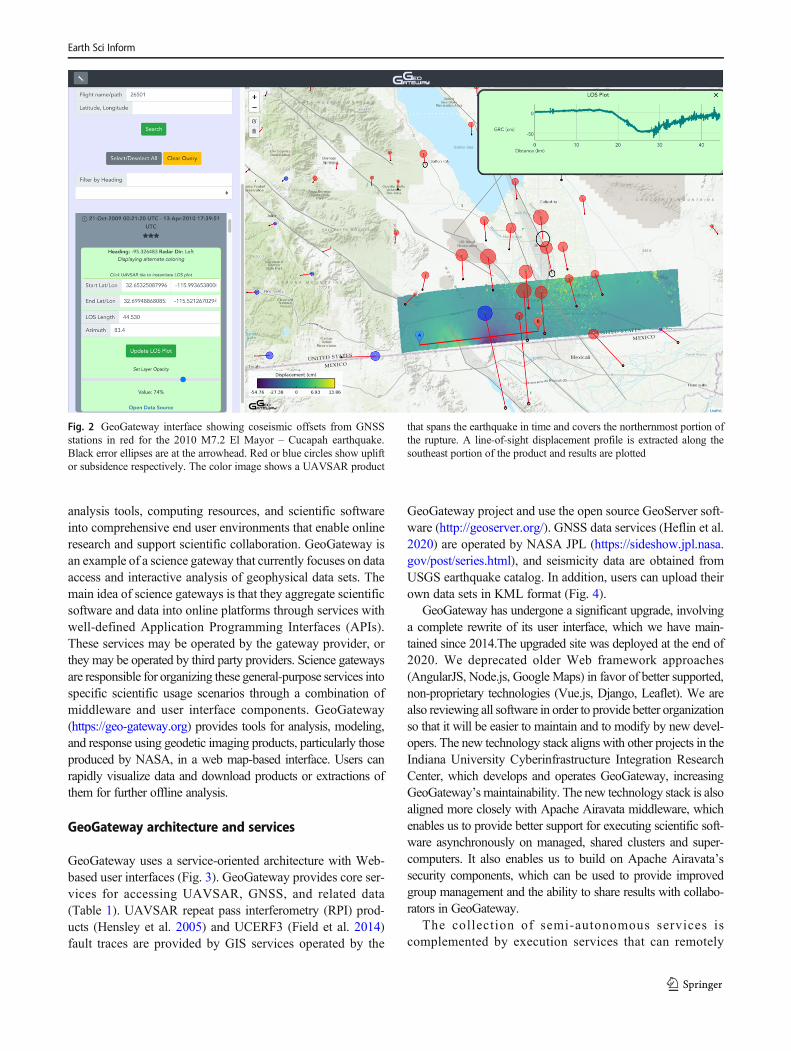
Fig. 2 GeoGateway interface showing coseismic offsets from GNSSstations in red for the 2010 M7.2 El Mayor – Cucapah earthquake.Black error ellipses are at the arrowhead. Red or blue circles show upliftor subsidence respectively. The color image shows a UAVSAR product
that spans the earthquake in time and covers the northernmost portion ofthe rupture. A line-of-sight displacement profile is extracted along thesoutheast portion of the product and results are plotted
Earth Sci Inform
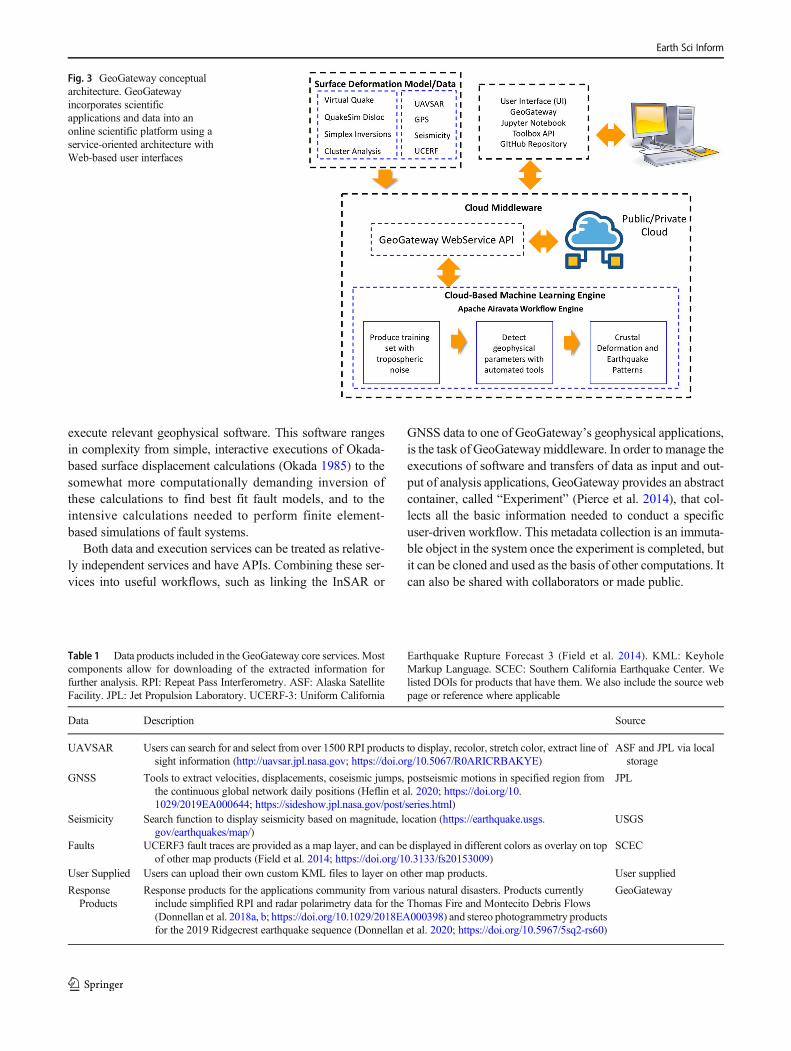
execute relevant geophysical software. This software rangesin complexity from simple, interactive executions of Okada-based surface displacement calculations (Okada 1985) to thesomewhat more computationally demanding inversion ofthese calculations to find best fit fault models, and to theintensive calculations needed to perform finite element-based simulations of fault systems.
Both data and execution services can be treated as relative-ly independent services and have APIs. Combining these ser-vices into useful workflows, such as linking the InSAR or
GNSS data to one of GeoGateway’s geophysical applications,is the task of GeoGatewaymiddleware. In order to manage theexecutions of software and transfers of data as input and out-put of analysis applications, GeoGateway provides an abstractcontainer, called “Experiment” (Pierce et al. 2014), that col-lects all the basic information needed to conduct a specificuser-driven workflow. This metadata collection is an immuta-ble object in the system once the experiment is completed, butit can be cloned and used as the basis of other computations. Itcan also be shared with collaborators or made public.
Table 1 Data products included in the GeoGateway core services. Mostcomponents allow for downloading of the extracted information forfurther analysis. RPI: Repeat Pass Interferometry. ASF: Alaska SatelliteFacility. JPL: Jet Propulsion Laboratory. UCERF-3: Uniform California
Earthquake Rupture Forecast 3 (Field et al. 2014). KML: KeyholeMarkup Language. SCEC: Southern California Earthquake Center. Welisted DOIs for products that have them. We also include the source webpage or reference where applicable
Data Description Source
UAVSAR Users can search for and select from over 1500 RPI products to display, recolor, stretch color, extract line ofsight information (http://uavsar.jpl.nasa.gov; https://doi.org/10.5067/R0ARICRBAKYE)
ASF and JPL via localstorage
GNSS Tools to extract velocities, displacements, coseismic jumps, postseismic motions in specified region fromthe continuous global network daily positions (Heflin et al. 2020; https://doi.org/10.1029/2019EA000644; https://sideshow.jpl.nasa.gov/post/series.html)
JPL
Seismicity Search function to display seismicity based on magnitude, location (https://earthquake.usgs.gov/earthquakes/map/)
USGS
Faults UCERF3 fault traces are provided as a map layer, and can be displayed in different colors as overlay on topof other map products (Field et al. 2014; https://doi.org/10.3133/fs20153009)
SCEC
User Supplied Users can upload their own custom KML files to layer on other map products. User supplied
ResponseProducts
Response products for the applications community from various natural disasters. Products currentlyinclude simplified RPI and radar polarimetry data for the Thomas Fire and Montecito Debris Flows(Donnellan et al. 2018a, b; https://doi.org/10.1029/2018EA000398) and stereo photogrammetry productsfor the 2019 Ridgecrest earthquake sequence (Donnellan et al. 2020; https://doi.org/10.5967/5sq2-rs60)
GeoGateway
Fig. 3 GeoGateway conceptualarchitecture. GeoGatewayincorporates scientificapplications and data into anonline scientific platform using aservice-oriented architecture withWeb-based user interfaces
Earth Sci Inform
GeoGateway middleware itself is accessed through its ownset of APIs, which mediate calls between the user interfaceenvironment and the middleware. The user interface environ-ment encapsulates common usage scenarios, which it trans-lates into GeoGateway middleware calls. Many of theGeoGateway operations are interactive and map-based, sowe make extensive use of client-side JavaScript libraries tocreate the user environment. The middleware thus also playsan important role in mediating service calls from users’browsers to diverse remote services; the middleware acts asa broker for these calls, which otherwise would be subject tocross-site scripting restrictions on the client.
Data available through GeoGateway
GeoGateway provides a collection of tools, APIs, and inter-faces to access the data hosted on its GeoServer-based dataservers (Table 1). These can be integrated with data fromvarious data providers with Open Geospatial Consortium(OGC) standards (http://www.opengeospatial.org/).
UAVSAR RPI products are distributed as pure binary fileswith the metadata in a separated annotation file. A single fileranges in size from 500 Mb to 5Gb. To use the RPI dataproducts in common GIS software such as GeoServer usedin GeoGateway, ArcGIS, and QGIS, it is necessary to extractgeo-spatial information from the annotation file to generate aproper header file. Neither the UAVSAR binary format or theHierarchical Data Format version 5 (HDF5), specified for theupcoming NISAR mission, are an efficient file format to beused with GeoGateway’s online tools. GeoGateway and itspredecessor QuakeSim project (Donnellan et al. 2006; Pierceet al. 2010; Parker et al. 2015) have converted 10 TbUAVSAR RPI data products into GeoTiff format with thefollowing steps: 1) Extract geo-spatial information fromUAVSAR annotation file; 2) Convert UAVSAR from singleband binary format to GeoTiff with the tiles and image
pyramids options; 3) Calculate histogram and summary statis-tics; 4) Track metadata changes for the different processingprocedures and parameters of UAVSAR images. 5) RegisterUAVSAR images and pre-rendered full-resolution imageoverviews with GeoServer.With these processing procedures,it enables GeoGateway to distribute the large UAVSAR im-age in full-resolution to the downstream applications throughthe Open Geospatial Consortium’s (OGC) Web Map ServiceInterface Standard (WMS) andWeb Coverage Service (WCS)protocols. This allows rapid exploration and feature extractionof large collections of UAVSAR RPI datasets with open-source GIS software, enhances UAVSAR images with a dy-namic coloring scheme (Wang et al. 2015), and provides acolor blind-friendly coloring theme as an alternative visuali-zation method to InSAR fringe patterns. For the NISAR mis-sion, ASF will have on the fly converters to GeoTIFF, orbetter services for handling HDF5 will be available.
The advantages of adopting OGC standards for both dataproducts and web services have been utilized by downstreamprojects, such as E-DECIDER (Emergency Data EnhancedCyber-Infrastructure for Disaster Evaluation and Response;Glasscoe et al. 2014; Glasscoe et al. 2015), which employsremote sensing imagery, geodetic data, and tools fromGeoGateway to automatically generate change detectionproducts, critical infrastructure and deformation calculationstriggered by an earthquake event.
Rapid data exploration
An early motivation of support for overlays is the observationthat UAVSAR data are complex and difficult to understand;historically a high level of technical competence has beenrequired. Overlays of different data types in a Google Mapsenvironment are illustrated in Fig. 2, which shows aUAVSAR product for the 2020 M7.2 El Mayor – Cucapahearthquake (Donnellan et al. 2014; Donnellan et al. 2018b),
Fig. 4 Architectural diagramshowing UAVSAR and GRFNprocessing streams and other dataand tools incorporated intoGeoGateway ACF and served tothe user community. Storage andpreprocessing of GRFN productsis in the AWS commercial cloud;GeoGateway ACF is built on theopen source GIS platform andJetStream cloud (NSF XSEDEvirtual compute resources),leveraging resources and reducingoverall costs; Jupyter Notebooksis served as a collaboration toolsamong users
Earth Sci Inform
with line-of-sight displacement profile tool, and GNSS over-lay. Note that while the tools are accessed by the tabs at the topleft of the GeoGateway interface, any imaged item will beretained as the user moves to a new tab and tool to enablecomposite images. Users may toggle of any of the productoverlays. Depending on the investigation, the user may visu-alize the following products in the map environment individ-ually or in composite:
& Map Tools, including a capability to plot any KML/KMZfile onto the map, the simple UCERF3 fault traces, stateand coastal boundaries, and the user’s current location,which is helpful in field work.
& UAVSAR, the interface for a global set of interferogramsincluding the rapid line-of-sight profile tool, the dynamiccoloring tool and the user rating tool.
& GNSS, for plotting a variety of displacement and velocityproducts.
& Seismicity, displaying recent earthquakes or else a user-specified subset of the USGS Advanced National SeismicSystem (ANSS) catalog.
& Forecasts, displaying experimental earthquake forecastingproducts.
We continue to add tools, including for modeling, but theseare most often used for overlays. All are described in the UserGuide. Using all would usually result in excessive clutter, butcombinations can be highly helpful in initial exploration ofphysical processes behind the data sets.
In addition to the combination of UAVSAR and GNSS,overlays of fault traces, forecasts, and seismicity can provideinsights about regional hazard. Overlaying fault traces, inter-ferograms, and seismicity may enable discovery of fault slipon minor faults or segments of major faults.
Finally, combining the KML mapper with composite tool-based images allows overlay of GeoGateway scenes withuser-supplied mapped items, such as location of strainmeters,field-surveyed locations, polygons marking areas of study, orthird-party kmz files, subject to mapping limitations. Often auseful technique is to create markers, polygons, image over-lays and so forth in Google Earth, collect them in a folder, andsave the folder to KMZ for import into GeoGateway with theKML mapper.
Modeling and simulations
GeoGateway currently supports forward modeling for anarbitrary number of faults using software called Disloc.Users can specify location, geometry and slip for eachfault. In the current GeoGateway interface users uploadan input file, which is then run on the backend.GeoGateway displays vectors and a simulated interfero-gram of the output. Users can specify the azimuth and
elevation between the pixel on the map and the simu-lated instrument. A graphical user interface (GUI) thatincluded map selection and parameter input was avail-able in the earlier version thatran under QuakeSim. Inthe future we plan to implement Disloc using JupyterNotebooks so that users will have similar GUIcapability.
Machine learning
GeoGateway hosts applications that apply machine learningalgorithms to GNSS and seismicity data. GeoGateway’s ma-chine learning tools are in transition. The GeoGateway team isdeveloping numerous new machine learning and related ap-plications, which we expect to integrate into the gateway asthey mature. The interim integration that we will pursue in thenext several months is to deploy JupyterHub and use it tomake team-developed Jupyter notebooks available online.This will be integrated with GeoGateway to provide singlesign-on, and team-developed notebooks will be developed touse GeoGateway’s underlying services via API calls.
One such approach uses a variant of hidden Markovmodeling to search for anomalies in GNSS position time se-ries data (Granat and Donnellan 2002; Granat 2004). We havesupported RDAHMMclassification of permanent GPS/GNSSstations since 2014 in the current GeoGateway; this applica-tion was also included in earlier versions of the gateway.Thegoal is to focus attention on subtle features in the data.
We are in the process of developing machine learning toolsto further analyze the geodetic imaging products. We havedeveloped unsupervised learning methods, which do not re-quire labeled features, to identify GNSS vector clusters as wellas to perform time series segmentation. Clustering GPS sta-tions (Granat et al. submitted) not only has the potential foridentifying useful scientific information, such as separatingregions of post-seismic motion or ranking active fault sys-tems, but also is a necessary initial step in other GPS analysismethods, such as those used to detect aseismic transient sig-nals (Granat et al. 2013). Using this approach, desired featuresof interest can be selected, including some subset of the threedisplacement or velocity components, uncertainty estimates,the station location, and any other relevant information presentin the data set. Based on those selections, the clustering pro-cedure autonomously groups theGNSS stations according to aselected clustering method; some methods require that thenumber of groups be specified in advance, while others esti-mate the number of groups from the data. We have imple-mented this approach as a Python application, allowing us todraw upon the full range of open source clustering methodsavailable in Python’s scikit-learn package (Pedregosa et al.2011). The application returns theGNSS stations labeled bygroup in both tabular form and as a color coded KML file foroverlay in Google Earth or GeoGateway.
Earth Sci Inform
The GeoGateway Earthquake Hazard Viewer under thenowcast tab provides several useful tools for the evaluationof earthquake hazard and risk. The forecast method is basedon the Natural Time Weibull model developed by Hollidayet al. (2016) and Rundle et al. (2016a, b). The ForecastExceedance Probability Table on the web site shows the prob-ability that an earthquake with magnitude exceeding M5, M6,M7, or M8 will occur within the selected region within thenext one month, one year, or three years.
The Forecast Timeseries Chart shows the probability, as afunction of time, that any point within a 50 km radius of anypoint in a selected region suffers an earthquake exceeding agiven magnitude in the next year. The Global Forecast Mapshows for any point on the map the probability that an earth-quake of magnitude exceedingM6.5 occurs in the next year ina circle of radius 50 km of that point. The Ground ShakingEstimate is the Peak Ground Acceleration (PGA) that wouldbe expected from an earthquake of given magnitude, location,and other earthquake variables.
An Open Hazards earthquake forecast is a real-time,seismicity-based forecast that computes probabilities indefined spatial areas using the Open Hazards ForecastModel. Open Hazards can compute a forecast at anytime using real-time seismic catalogs to obtain the mostcurrent probabilities. The model is based on theGutenberg-Richter magnitude-frequency distribution andon one of the most fundamental ideas in earthquakemechanics, the cycle of stress accumulation and releaseon major faults. Peak Ground Acceleration (PGA) is ameasure of ground shaking. Open Hazards estimatesPGA using a slightly modified form of the Cua-Heaton model (Cua and Heaton 2007).
Nowcasting is the prediction of the present, the verynear future and the very recent past (Rundle et al.2016a, b, 2018; Rundle et al. 2019). The term is acontraction of “now” and “forecasting” and has beenused for many years in meteorology. Nowcasting usesproxy data to estimate the current dynamical state of adriven complex system such as earthquakes, neural net-works, or the financial markets. Seismic nowcastinguses counts of small earthquakes as proxy data to esti-mate the current dynamical state of an earthquake faultsystem, or collection of interacting earthquake faults.The result is an earthquake potential score that charac-terizes the current state of progress of a defined geo-graphic region through its nominal earthquake “cycle.”
The count of small earthquakes since the last largeearthquake is the natural time that has elapsed since thelast large earthquake. To use the nowcast calculator inGeoGateway , enter the latitude and longitude of a pointon the map, as well as a name for the location. The systemcomputes the nowcast within a 100 km radius circle forearthquakes of magnitude larger than 6.0.
Developing a user community
Science gateways allow research communities to accessshared data, software and services. The purpose ofGeoGateway is to increase the value of existing geodetic im-aging products to researchers, and allow users to efficientlyfind and use NASA geodetic imaging data products.GeoGateway bridges the gap between production and end-use of data products by simplifying the discovery of geodeticimaging products, enabling users to explore and integrate dataproducts, and allowing researchers to easily share, publish andcollaborate. Development efforts have focused primarily onimplementation of technologies for facilitating data access andanalysis by end users. Initial users and testers were membersof the development team and their close associates.Publication of scientific papers (Donnellan et al. 2014,2015,Donnellan et al. 2018a, b) showing GeoGateway appli-cations and results led to interest by potential outside users.This has led to publications with other organizations such asthe US Geological Survey (USGS; DeLong et al. 2016; Pontiet al. 2020), California Geological Survey (CGS; Dawsonet al. submitted), and Geotechnical Extreme EventsReconnaissance Association (GEER; Brandenberg et al.2020) and to work with various student research products.Informal surveys revealed technical challenges encounteredby new users. To overcome this entry barrier, we developedtools and tutorials geared toward novice users. The target usercommunities include science users, hazard and resiliencecommunities, and response organizations.
Geoscientists are the largest expected user group and theprimary group targeted for early adoption. The target geosci-ence community includes geophysicists and geologists inter-ested in active tectonics, crustal deformation, earthquakes,fault slip, and seismic hazard. Geoscientists start their careersas students; thus, initial efforts focus on cultivating new stu-dent users, and novice professional users. Science users, con-sidered early adopters, have been introduced to GeoGatewayvia classroom instruction, online tutorials, a User Guide, pre-sentations at scientific meetings, and workshops for hands-ontraining. From this training they can use GeoGateway tools forresearch projects or professional applications.
We have developed and implemented several strategies forincreasing the GeoGateway user community. Initial effortsfocused on scientific talks, posters and papers presenting re-search conducted in part with GeoGateway tools (Donnellanet al. 2014, 2015; Donnellan et al. 2018a, b; DeLong et al.2016). Discussions with novice users and potential new usersrevealed technical challenges which created barriers to entry.To overcome this challenge, we developed tutorial exercisesfor use in undergraduate classes, and a GeoGateway UserGuide for the website. The user guide is displayed by selectingthe “Help” tab in GeoGateway. The tutorial exercises weretested in a class at California State Polytechnic University,
Earth Sci Inform
Pomona in fall 2018, and the GeoGateway User Guide wasrolled out during a half day workshop at the SeismologicalSociety of America (SSA) Annual Meeting in April 2019(Grant Ludwig et al. 2019). The classroom exercises andSSA workshop generated the largest single day user counts(41–42) to that date. Subsequently the Ridgecrest CA earth-quake sequence generated the largest daily user count (55),suggesting that user training and development of a guide wereeffective in making GeoGateway more accessible to usersfollowing an earthquake. Future work will involve develop-ment of video tutorials to enhance the GeoGateway website,and offering of webinars for remote training.
In the 5-year period following April 1, 2015 GeoGatewayhas had more than 11,000 sessions and more than 600 repeatusers. During the period4/1/19–4/1/20 over 340 repeat usersvisited the site and there were more than 2700 total sessions.Usage increased at times of significant events such as the 2019Ridgecrest earthquake sequence or the 2018 Montecito debrisflows. With documentation posted on the GeoGateway site,and team members giving tutorials at various scientific meet-ings (e.g. Grant Ludwig et al. 2019) and in upper level class-rooms, we expect usage to continue to grow over time, partic-ularly with the addition of these new tools.
Science case studies
The ability of GeoGateway to present requested backgroundinformation, geodetic information, earthquake catalog selec-tions, and analysis products provides strong discovery andexplanatory methods for a wide variety of cases of interest.Multiple tools produce products that through map-based over-lay yield substantial insights into deformation processes. Herewe focus on characterizing fault creep as identified inUAVSAR unwrapped interferograms, with comparison toseismicity in the time span corresponding to the interferogrampair of passes. Many other types of cases are supported, in-cluding GPS and UAVSAR indicators of regional deforma-tion (Fig. 2), discovery and measurement of surface fracturestriggered by an earthquake (Rymer et al. 2010; Parker et al.2015), characterization of post-seismic processes, determiningassociation of experimental earthquake forecasts with historicseismicity and deformation, estimation of fault frictional prop-erties from UAVSAR interferogram sequences showing pro-gressive triggered slip, to name a few (Donnellan et al.2018b).
Fault creep: San Andreas and superstition hills
Creeping faults are faults that have evident slip apart from theoccurrence of local earthquakes, even small earthquakes.Examples well-covered by UAVSAR observations in the timespan 2009-present include the roughly constant slip found on
the central San Andreas Fault (SAF; Liu et al. 2011), theintermittent slip on the Superstition Hills Fault (SHF) and alsoparts of the SAF in the Salton Trough, and parts of theHayward Fault and Rodgers Creek Fault east of the SanFrancisco Bay. We demonstrate the utility of GeoGatewaytools for two case studies, focusing on the central SAF andthe SHF.
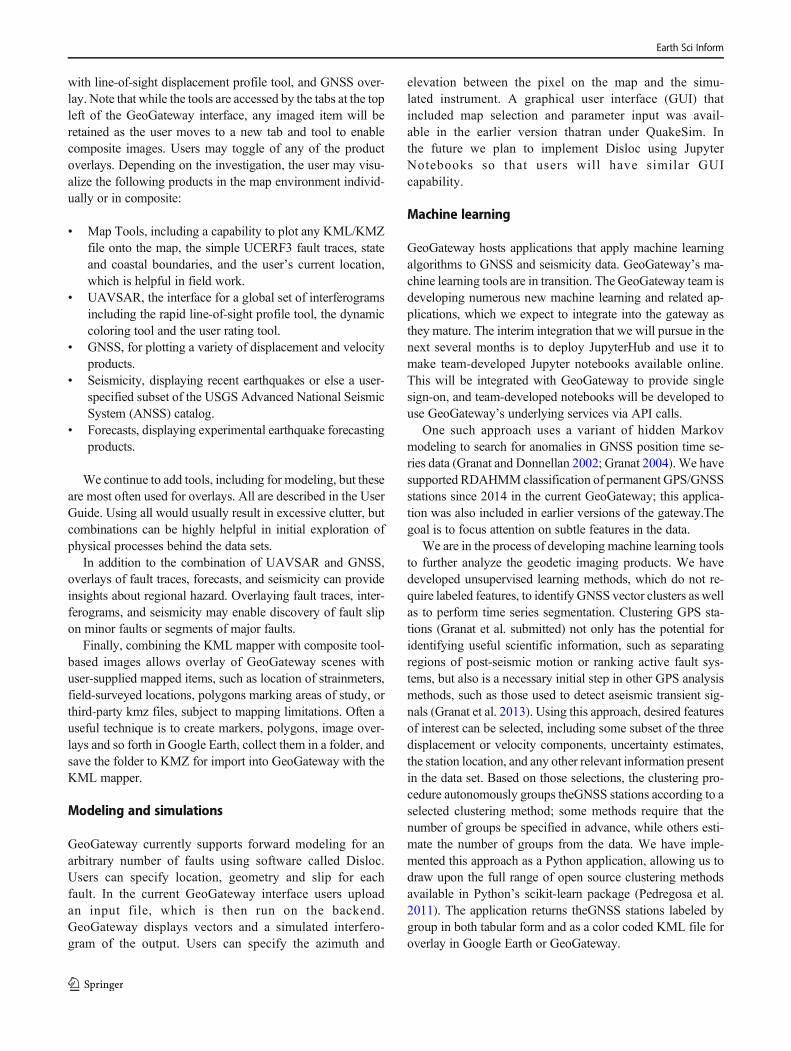
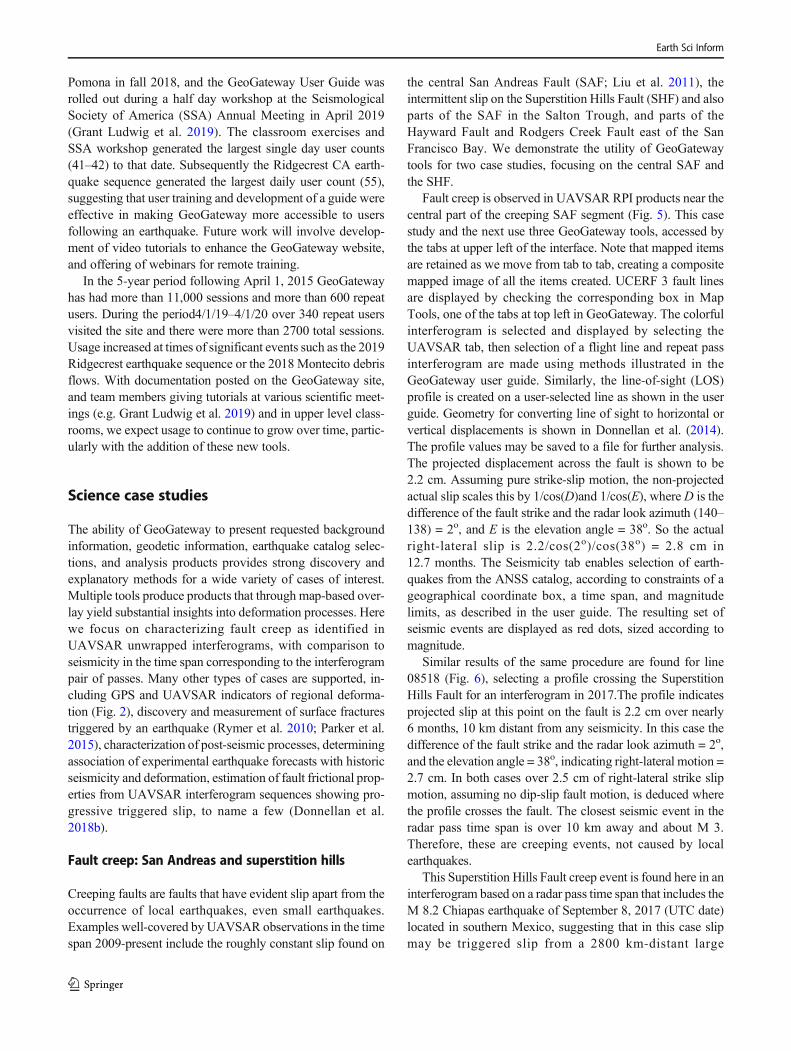
Fault creep is observed in UAVSAR RPI products near thecentral part of the creeping SAF segment (Fig. 5). This casestudy and the next use three GeoGateway tools, accessed bythe tabs at upper left of the interface. Note that mapped itemsare retained as we move from tab to tab, creating a compositemapped image of all the items created. UCERF 3 fault linesare displayed by checking the corresponding box in MapTools, one of the tabs at top left in GeoGateway. The colorfulinterferogram is selected and displayed by selecting theUAVSAR tab, then selection of a flight line and repeat passinterferogram are made using methods illustrated in theGeoGateway user guide. Similarly, the line-of-sight (LOS)profile is created on a user-selected line as shown in the userguide. Geometry for converting line of sight to horizontal orvertical displacements is shown in Donnellan et al. (2014).The profile values may be saved to a file for further analysis.The projected displacement across the fault is shown to be2.2 cm. Assuming pure strike-slip motion, the non-projectedactual slip scales this by 1/cos(D)and 1/cos(E), whereD is thedifference of the fault strike and the radar look azimuth (140–138) = 2o, and E is the elevation angle = 38o. So the actualright-lateral slip is 2.2/cos(2o)/cos(38o) = 2.8 cm in12.7 months. The Seismicity tab enables selection of earth-quakes from the ANSS catalog, according to constraints of ageographical coordinate box, a time span, and magnitudelimits, as described in the user guide. The resulting set ofseismic events are displayed as red dots, sized according tomagnitude.
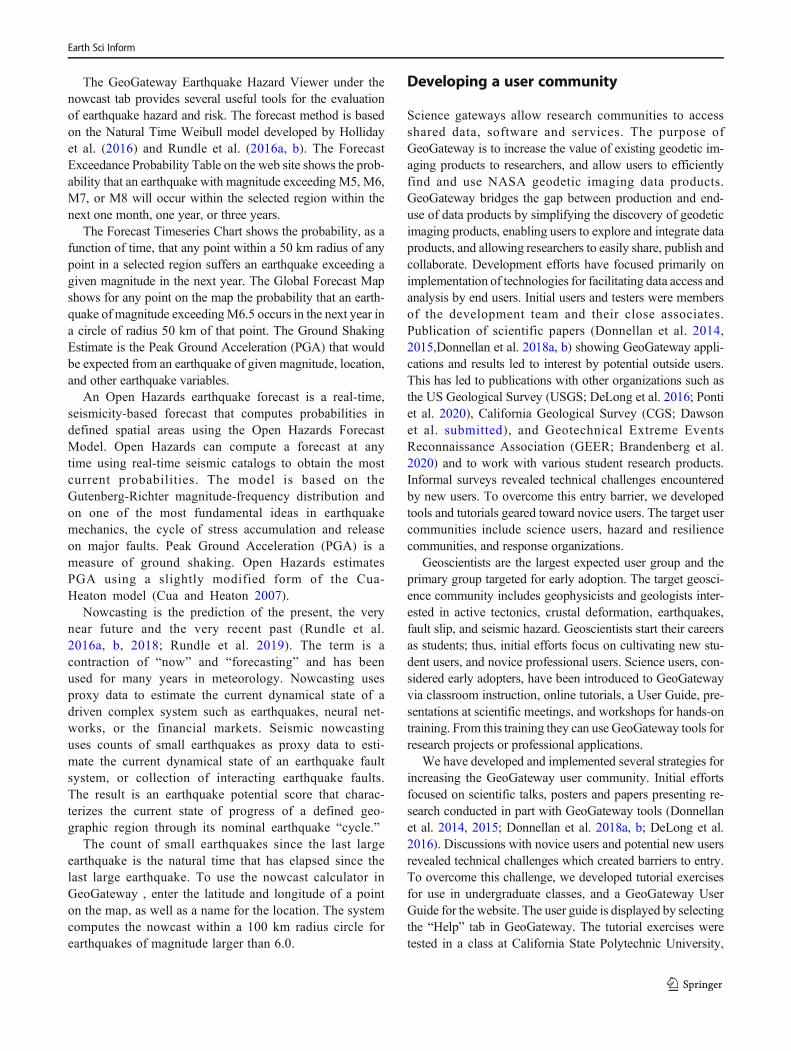
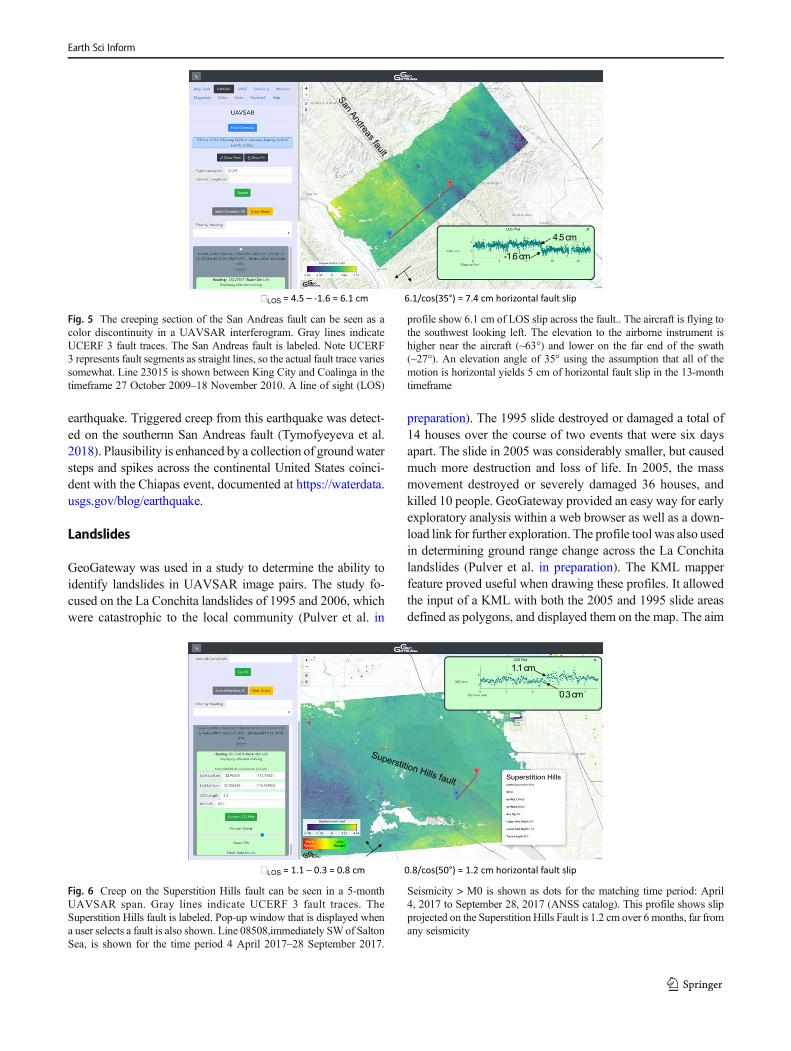
Similar results of the same procedure are found for line08518 (Fig. 6), selecting a profile crossing the SuperstitionHills Fault for an interferogram in 2017.The profile indicatesprojected slip at this point on the fault is 2.2 cm over nearly6 months, 10 km distant from any seismicity. In this case thedifference of the fault strike and the radar look azimuth = 2o,and the elevation angle = 38o, indicating right-lateral motion =2.7 cm. In both cases over 2.5 cm of right-lateral strike slipmotion, assuming no dip-slip fault motion, is deduced wherethe profile crosses the fault. The closest seismic event in theradar pass time span is over 10 km away and about M 3.Therefore, these are creeping events, not caused by localearthquakes.
This Superstition Hills Fault creep event is found here in aninterferogram based on a radar pass time span that includes theM 8.2 Chiapas earthquake of September 8, 2017 (UTC date)located in southern Mexico, suggesting that in this case slipmay be triggered slip from a 2800 km-distant large
Earth Sci Inform
earthquake. Triggered creep from this earthquake was detect-ed on the southernn San Andreas fault (Tymofyeyeva et al.2018). Plausibility is enhanced by a collection of groundwatersteps and spikes across the continental United States coinci-dent with the Chiapas event, documented at https://waterdata.usgs.gov/blog/earthquake.
Landslides
GeoGateway was used in a study to determine the ability toidentify landslides in UAVSAR image pairs. The study fo-cused on the La Conchita landslides of 1995 and 2006, whichwere catastrophic to the local community (Pulver et al. in
preparation). The 1995 slide destroyed or damaged a total of14 houses over the course of two events that were six daysapart. The slide in 2005 was considerably smaller, but causedmuch more destruction and loss of life. In 2005, the massmovement destroyed or severely damaged 36 houses, andkilled 10 people. GeoGateway provided an easy way for earlyexploratory analysis within a web browser as well as a down-load link for further exploration. The profile tool was also usedin determining ground range change across the La Conchitalandslides (Pulver et al. in preparation). The KML mapperfeature proved useful when drawing these profiles. It allowedthe input of a KML with both the 2005 and 1995 slide areasdefined as polygons, and displayed them on the map. The aim
San Andreas fault
4.5 cm
-1.6 cm
LOS = 4.5 – -1.6 = 6.1 cm 6.1/cos(35°) = 7.4 cm horizontal fault slip
Fig. 5 The creeping section of the San Andreas fault can be seen as acolor discontinuity in a UAVSAR interferogram. Gray lines indicateUCERF 3 fault traces. The San Andreas fault is labeled. Note UCERF3 represents fault segments as straight lines, so the actual fault trace variessomewhat. Line 23015 is shown between King City and Coalinga in thetimeframe 27 October 2009–18 November 2010. A line of sight (LOS)
profile show 6.1 cm of LOS slip across the fault.. The aircraft is flying tothe southwest looking left. The elevation to the airborne instrument ishigher near the aircraft (~63°) and lower on the far end of the swath(~27°). An elevation angle of 35° using the assumption that all of themotion is horizontal yields 5 cm of horizontal fault slip in the 13-monthtimeframe
Superstition Hills fault
0.3 cm
1.1 cm
LOS = 1.1 – 0.3 = 0.8 cm 0.8/cos(50°) = 1.2 cm horizontal fault slip
Fig. 6 Creep on the Superstition Hills fault can be seen in a 5-monthUAVSAR span. Gray lines indicate UCERF 3 fault traces. TheSuperstition Hills fault is labeled. Pop-up window that is displayed whena user selects a fault is also shown. Line 08508,immediately SWof SaltonSea, is shown for the time period 4 April 2017–28 September 2017.
Seismicity > M0 is shown as dots for the matching time period: April4, 2017 to September 28, 2017 (ANSS catalog). This profile shows slipprojected on the Superstition Hills Fault is 1.2 cm over 6 months, far fromany seismicity
Earth Sci Inform
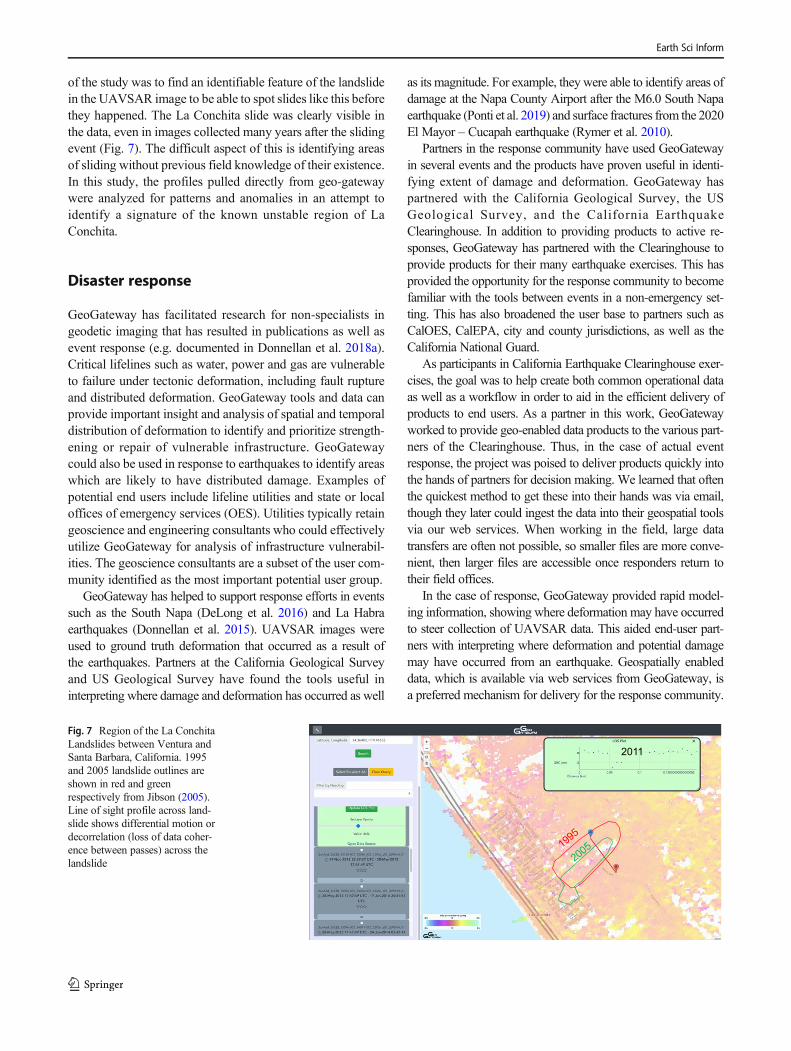
of the study was to find an identifiable feature of the landslidein the UAVSAR image to be able to spot slides like this beforethey happened. The La Conchita slide was clearly visible inthe data, even in images collected many years after the slidingevent (Fig. 7). The difficult aspect of this is identifying areasof sliding without previous field knowledge of their existence.In this study, the profiles pulled directly from geo-gatewaywere analyzed for patterns and anomalies in an attempt toidentify a signature of the known unstable region of LaConchita.
Disaster response
GeoGateway has facilitated research for non-specialists ingeodetic imaging that has resulted in publications as well asevent response (e.g. documented in Donnellan et al. 2018a).Critical lifelines such as water, power and gas are vulnerableto failure under tectonic deformation, including fault ruptureand distributed deformation. GeoGateway tools and data canprovide important insight and analysis of spatial and temporaldistribution of deformation to identify and prioritize strength-ening or repair of vulnerable infrastructure. GeoGatewaycould also be used in response to earthquakes to identify areaswhich are likely to have distributed damage. Examples ofpotential end users include lifeline utilities and state or localoffices of emergency services (OES). Utilities typically retaingeoscience and engineering consultants who could effectivelyutilize GeoGateway for analysis of infrastructure vulnerabil-ities. The geoscience consultants are a subset of the user com-munity identified as the most important potential user group.
GeoGateway has helped to support response efforts in eventssuch as the South Napa (DeLong et al. 2016) and La Habraearthquakes (Donnellan et al. 2015). UAVSAR images wereused to ground truth deformation that occurred as a result ofthe earthquakes. Partners at the California Geological Surveyand US Geological Survey have found the tools useful ininterpreting where damage and deformation has occurred as well
as its magnitude. For example, they were able to identify areas ofdamage at the Napa County Airport after the M6.0 South Napaearthquake (Ponti et al. 2019) and surface fractures from the 2020El Mayor – Cucapah earthquake (Rymer et al. 2010).
Partners in the response community have used GeoGatewayin several events and the products have proven useful in identi-fying extent of damage and deformation. GeoGateway haspartnered with the California Geological Survey, the USGeological Survey, and the California EarthquakeClearinghouse. In addition to providing products to active re-sponses, GeoGateway has partnered with the Clearinghouse toprovide products for their many earthquake exercises. This hasprovided the opportunity for the response community to becomefamiliar with the tools between events in a non-emergency set-ting. This has also broadened the user base to partners such asCalOES, CalEPA, city and county jurisdictions, as well as theCalifornia National Guard.
As participants in California Earthquake Clearinghouse exer-cises, the goal was to help create both common operational dataas well as a workflow in order to aid in the efficient delivery ofproducts to end users. As a partner in this work, GeoGatewayworked to provide geo-enabled data products to the various part-ners of the Clearinghouse. Thus, in the case of actual eventresponse, the project was poised to deliver products quickly intothe hands of partners for decision making. We learned that oftenthe quickest method to get these into their hands was via email,though they later could ingest the data into their geospatial toolsvia our web services. When working in the field, large datatransfers are often not possible, so smaller files are more conve-nient, then larger files are accessible once responders return totheir field offices.
In the case of response, GeoGateway provided rapid model-ing information, showing where deformation may have occurredto steer collection of UAVSAR data. This aided end-user part-ners with interpreting where deformation and potential damagemay have occurred from an earthquake. Geospatially enableddata, which is available via web services from GeoGateway, isa preferred mechanism for delivery for the response community.
1995
2005
2011
Fig. 7 Region of the La ConchitaLandslides between Ventura andSanta Barbara, California. 1995and 2005 landslide outlines areshown in red and greenrespectively from Jibson (2005).Line of sight profile across land-slide shows differential motion ordecorrelation (loss of data coher-ence between passes) across thelandslide
Earth Sci Inform
GeoGateway will continue to evolve to accommodate the enduser community, as new tools become available. The projectstrives to best serve the community by responding to their needsthrough technical interchanges and continued involvement inexercises and event responses.
GeoGateway future directions
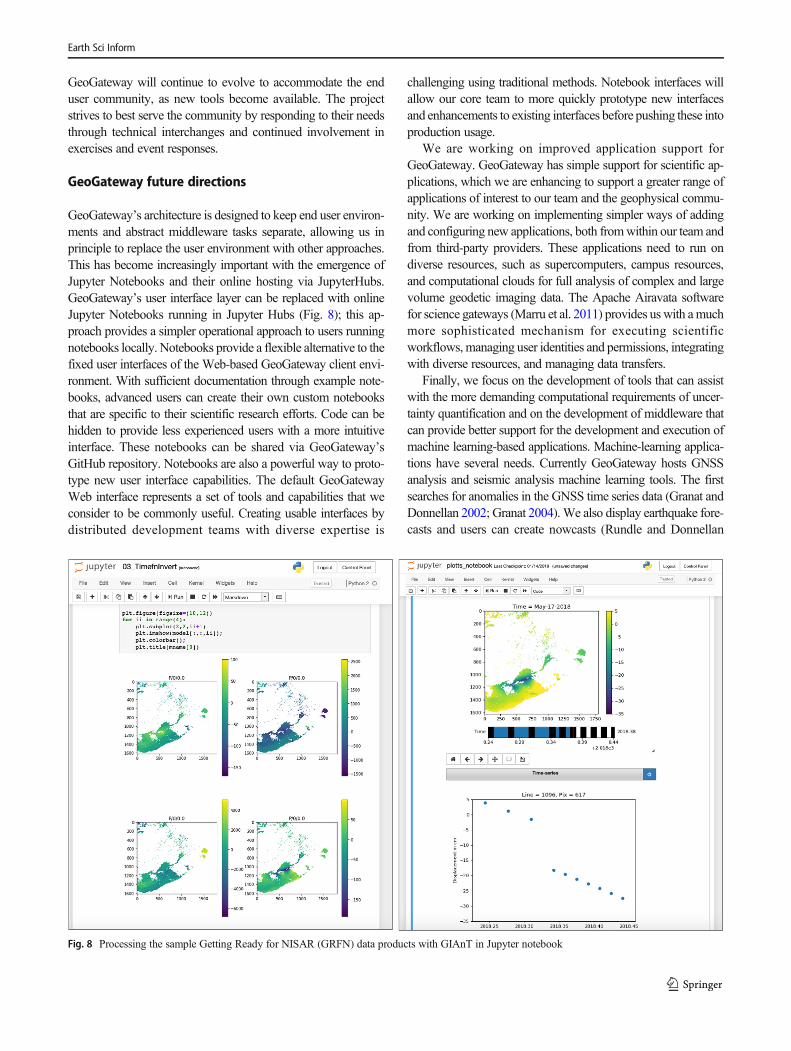
GeoGateway’s architecture is designed to keep end user environ-ments and abstract middleware tasks separate, allowing us inprinciple to replace the user environment with other approaches.This has become increasingly important with the emergence ofJupyter Notebooks and their online hosting via JupyterHubs.GeoGateway’s user interface layer can be replaced with onlineJupyter Notebooks running in Jupyter Hubs (Fig. 8); this ap-proach provides a simpler operational approach to users runningnotebooks locally. Notebooks provide a flexible alternative to thefixed user interfaces of the Web-based GeoGateway client envi-ronment. With sufficient documentation through example note-books, advanced users can create their own custom notebooksthat are specific to their scientific research efforts. Code can behidden to provide less experienced users with a more intuitiveinterface. These notebooks can be shared via GeoGateway’sGitHub repository. Notebooks are also a powerful way to proto-type new user interface capabilities. The default GeoGatewayWeb interface represents a set of tools and capabilities that weconsider to be commonly useful. Creating usable interfaces bydistributed development teams with diverse expertise is
challenging using traditional methods. Notebook interfaces willallow our core team to more quickly prototype new interfacesand enhancements to existing interfaces before pushing these intoproduction usage.
We are working on improved application support forGeoGateway. GeoGateway has simple support for scientific ap-plications, which we are enhancing to support a greater range ofapplications of interest to our team and the geophysical commu-nity. We are working on implementing simpler ways of addingand configuring new applications, both fromwithin our team andfrom third-party providers. These applications need to run ondiverse resources, such as supercomputers, campus resources,and computational clouds for full analysis of complex and largevolume geodetic imaging data. The Apache Airavata softwarefor science gateways (Marru et al. 2011) provides us with amuchmore sophisticated mechanism for executing scientificworkflows, managing user identities and permissions, integratingwith diverse resources, and managing data transfers.
Finally, we focus on the development of tools that can assistwith the more demanding computational requirements of uncer-tainty quantification and on the development of middleware thatcan provide better support for the development and execution ofmachine learning-based applications. Machine-learning applica-tions have several needs. Currently GeoGateway hosts GNSSanalysis and seismic analysis machine learning tools. The firstsearches for anomalies in the GNSS time series data (Granat andDonnellan 2002; Granat 2004).We also display earthquake fore-casts and users can create nowcasts (Rundle and Donnellan
Fig. 8 Processing the sample Getting Ready for NISAR (GRFN) data products with GIAnT in Jupyter notebook
Earth Sci Inform

2020). We are creating new machine learning applications,which we must verify and validate. GeoGateway then needs toexecute mature validated applications as software as a service.This builds on services already part of the Apache Airavatamiddleware, although there are opportunities to improve supportfor containerization of codes.
As part of future GeoGateway developments we are develop-ing clustering algorithms to divide GNSS velocity and displace-ment fields across discontinuities, generally associated with faultboundaries (Granat et al. submitted). We are improving the seis-mic nowcasting methods. We also plan to display modeling andsimulation products related to earthquake and tsunami simula-tions and improve the automated machine learning tools.Tsunami simulations will involve a new developmental codecalled Tsunami Squares. This code is a cellular automaton codeto propagate ocean bottom disturbances across basin-wide dis-tances. An advantage of this method is that dry-land tsunami run-ups can be easily calculated. The tsunami software must runoffline due to the complexity, but we plan to display productsfrom these codes on the GeoGateway website. Future develop-ments also include the deployment of tools to explore geodeticimage and cluster velocities or displacements. This helps identifyboundaries of deformation and provides a means to rank faultactivity. Because geodetic products are non-uniform both inspace and time, we are developing approaches to interpolatethe data, based on the machine learning algorithms to provideuniform pixel by pixel time dependent displacements that can beused for interpretation and ingestion into geophysical deforma-tion process models. Ultimately our goal is to increase the userbase by providing tools to simplify and promote rapid analysis ofgeodetic data products and move toward expansion ofGeoGateway to include user contributed applications.
Acknowledgements The research was carried out at the Jet PropulsionLaboratory, California Institute of Technology, under a contract with theNational Aeronautics and Space Administration (80NM0018D0004).
Open Access This article is licensed under a Creative CommonsAttribution 4.0 International License, which permits use, sharing, adap-tation, distribution and reproduction in any medium or format, as long asyou give appropriate credit to the original author(s) and the source, pro-vide a link to the Creative Commons licence, and indicate if changes weremade. The images or other third party material in this article are includedin the article's Creative Commons licence, unless indicated otherwise in acredit line to the material. If material is not included in the article'sCreative Commons licence and your intended use is not permitted bystatutory regulation or exceeds the permitted use, you will need to obtainpermission directly from the copyright holder. To view a copy of thislicence, visit http://creativecommons.org/licenses/by/4.0/.
References
Brandenberg SJ, Stewart JP, Wang P, Nweke CC, HudsonK, Goulet CA,Meng X, Davis CA, Ahdi SK, Hudson MB, Donnellan A, LyzengaG, Pierce M, Wang J, Winters MA, Delisle M-P, Lucey J, Kim Y,
Gallien TW, Lyda A, Yeung JS, Issa O, Buckreis T, Yi Z (2020)Ground deformation data from GEER investigations of Ridgecrestearthquake sequence. Seismol Res Lett. https://doi.org/10.1785/0220190291
Cua G, Heaton T (2007) The Virtual Seismologist (VS) method: ABayesian approach to earthquake early warning. In: Gasparini P,Manfredi G, Zschau J (eds) Earthquake Early Warning Systems.Springer, Berlin, pp 97–132
Dawson T, DuRoss CB, Gold R, Scharer K, Ponti D, Ladinsky T,Langenheim VE, McPhillips D, Morelan A, Milliner C, KendrickK, Hernandez J, Hudnut K, Akciz S, Angster S, Avouac J-P, BaconS, Bachhuber J, Barth N, Bennett S, Blair L, Blake K, Bork S,Brooks B, Bullard T, Burgess WP, Chupik C, DeFrisco M,Delano J, Dolan J, Donnellan A, Ericksen T, Frost E, Funning G,Graehl N, Guttierez C, Haddon E, Holland P, Hatem A, Helms J,Hitchcock C, Jobe JT, Koehler R, Kozaci O, Madugo C, Leeper R,Mareschal M, McPhillips D, O’Neil M, Nevitt J, Olson B, Padilla S,Patton J, Philibosian B, Pickering AJ, Pierce I, Pridmore C, Roth N,Sandwell D, Seitz G, Singleton D, Smith-Konter B, Spangler E,Swanson B, Thomas K, Treiman J, Valencia F, Williams A, XuX, Zachariasen J, Zimmerman J, Zinke R (submitted) Field-basedobservations of surface ruptures associated with the 2019 Ridgecrestearthquake sequence, Bull. Seism Soc Am
DeLong SB, Donnellan A, Ponti DJ, Rubin RS, Seitz G, Schwartz DP,Prentice CS, Dawson TE, Lienkaemper JJ, Hudnut KW, Rosa C,Pickering A, Parker JW (2016) Tearing the terroir: details and im-plications of surface rupture and deformation from the 24 august2014M6.0 South Napa earthquake, California. Earth Space Sci 3:416–430. https://doi.org/10.1002/2016EA000176
Donnellan A, Rundle J, Fox G, McLeod D, Grant L, Tullis T, Pierce M,Parker J, Lyzenga G, Granat R, Glasscoe M (2006) Quakesim andthe solid earth research virtual observatory. In: Computational earth-quake physics: simulations, analysis and infrastructure, part II (pp.2263-2279). Birkhäuser Basel. https://doi.org/10.1007/978-3-7643-8131-8_2
Donnellan A, Parker J, Hensley S, Pierce M, Wang J, Rundle J (2014)UAVSAR observations of triggered slip on the Imperial,Superstition Hills, and East Elmore ranch faults associated withthe 2010 M 7.2 El Mayor - Cucapah earthquake, geochemistry,geophysics. Geosystems 15:815–829. https://doi.org/10.1002/2013GC005120
Donnellan A, Grant Ludwig L, Parker JW, Rundle JB,Wang J, PierceM,Blewitt G, Hensley S (2015) Potential for a large earthquake nearLos Angeles inferred from the 2014 La Habra earthquake. EarthSpace Sci 2:378–385. https://doi.org/10.1002/2015EA000113
Donnellan A, Parker J,Milliner C, Farr TG, GlasscoeM, LouY,HawkinsB (2018a) UAVSAR and optical analysis of the Thomas fire scarand Montecito debris flows: case study of methods for disaster re-sponse using remote sensing products. Earth Space Sci. https://doi.org/10.1029/2018EA000398
Donnellan A, Parker J, Heflin M, Lyzenga G, Moore A, Ludwig LG,Rundle J, Wang J, Pierce M (2018b) Fracture advancing step tec-tonics observed in the Yuha Desert and ocotillo, CA, following the2010 Mw7. 2 El Mayor-Cucapah earthquake. Earth Space Sci 5(9):456–472
Donnellan A, Lyzenga G, Ansar A, Goulet C, Wang J Pierce M (2020)Targeted high-resolution structure from motion observations overtheMw 6.4 and 7.1 ruptures of the Ridgecrest earthquake sequence.Seismol Res Lett
Field EH,Arrowsmith RJ, Biasi GP, Bird P, Dawson TE, Felzer KR, JacksonDD, Johnson KM, Jordan TH,Madden C,Michael AJ (2014) UniformCalifornia earthquake rupture forecast, version 3 (UCERF3) the time-independent model. B Seismol Soc Am 104:1122–1180
Glasscoe MT, Parker JW, Wang J, Pierce ME, Yoder MR, Eguchi RT,Huyck CK et al (2014) Applications of E-DECIDER decision
Earth Sci Inform

support tools for disaster response and recovery. In: AppliedGeology in California. Star Publishing Company, Singapore, pp631–650
Glasscoe MT, Wang J, Pierce ME, Yoder MR, Parker JW, Burl MC,Stough TM, Granat RA, Donnellan A, Rundle JB, Ma Y (2015)E-decider: using earth science data and modeling tools to developdecision support for earthquake disaster response. Pure ApplGeophys 172(8):2305–2324
Granat RA (2004) Regularized Deterministic Annealing EM for HiddenMarkov Models. University of California, Los Angeles
Granat R, Donnellan A (2002) A hidden Markov model based tool forgeophysical data exploration. In: Earthquake processes: physicalModelling, numerical simulation and data analysis part II.Birkhäuser, Basel, pp 2271–2283
Granat R, Parker J, Kedar S, Dong D, Tang B, Bock Y (2013) Statisticalapproaches to detecting transient signals in GPS: results from the 2009-2011 transient detection exercise. Seismol Res Lett 84(3):444–454
Grant Ludwig L, Mirkhanian M, Donnellan A (2019) Developing aGeoGateway User Community. Seismol Res Lett 90(2B):934
Granat, R, Donnellan A, Heflin M, Lyzenga G, Glasscoe M, Parker J,PierceM,Wang J, Rundle J, Grant Ludwig L (submitted) Clusteringanalysis methods for gnss observations: a data-driven approach toidentifying California’s major faults, Earth and Space Science
Heflin M, Donnellan A, Parker J, Lyzenga G, Moore A, Grant Ludwig L,Rundle J, Wang J, Pierce M (2020) Automated estimation and toolsto extract positions, velocities, breaks, and seasonal terms from dailyGNSSmeasurements: illuminating nonlinear salton trough deforma-tion. Earth Space Sci e2019EA000644. https://doi.org/10.1029/2019EA000644
Hensley S, Wheeler K, Sadowy G, Miller T, Shaffer S, Muellerschoen R,Jones C, Zebker H,Madsen S, Rosen P (2005) Status of a UAVSARdesigned for repeat pass interferometry for deformation measure-ments. In IEEE MTT-S International Microwave SymposiumDigest, 2005. (pp. 4-pp). IEEE
Hensley S, Wheeler K, Sadowy G, Jones C, Shaffer S, Zebker H, MillerT, Heavey B, Chuang E, Chao R, Vines K (2008). The UAVSARinstrument: description and first results. In 2008 IEEE RadarConference (pp. 1-6). IEEE
Holliday JR, Graves WR, Rundle JB, Turcotte DL (2016) Computingearthquake probabilities on global scales. Pure Appl Geophys 173:739–748. https://doi.org/10.1007/s00024-014-0951-3
Jibson RW (2005) Landslide hazards at La Conchita, California (p. 12).US Department of the Interior, US Geological Survey
Lawrence KA, Zentner M, Wilkins-Diehr N, Wernert JA, Pierce M,Marru S, Michael S (2015) Science gateways today and tomorrow:positive perspectives of nearly 5000 members of the research com-munity. Concurren Comput: Pract Exp 27(16):4252–4268
Liu Z, Lundgren P, Fielding EJ, Hensley S (2011) Imaging fault slipvariation along the Central San Andreas fault from satellite, airborneInSAR and GPS. AGUFM 2011: T43I-06
Marru S, Gunathilake L, Herath C, Tangchaisin P, Pierce M, MattmannC, Singh R, Gunarathne T, Chinthaka E, Gardler R, Slominski A(2011) Apache airavata: a framework for distributed applicationsand computational workflows. In Proceedings of the 2011 ACMworkshop on gateway computing environments (pp 21–28).https://doi.org/10.1145/2110486.2110490
Okada Y (1985) Surface deformation due to shear and tensile faults in ahalf-space. Bull Seismol Soc Am 75(4):1135–1154
Parker J, Donnellan A, Glasscoe M, Fox G, Wang J, Pierce M, Ma Y(2015) Advantages to geoscience and disaster response fromQuakeSim implementation of interferometric radar maps in a GISdatabase system. Pure Appl Geophys 172(8):2295–2304
Pedregosa F, Varoquaux G, Gramfort A, Michel V, Thirion B, Grisel O,Blondel M, Prettenhofer P, Weiss R, Dubourg V, Vanderplas J(2011) Scikit-learn: machine learning in Python. J Mach LearnRes 12:2825–2830
Pierce ME, Gao X, Pallickara SL, Guo Z, Fox GC (2010) The Quakesimportal and services: new approaches to science gateway develop-ment techniques. Concurren Comput: Pract Exp 22(12):1732–1749
Pierce M, Marru S, Demeler B, Singh R, Gorbet G (2014) The apacheairavata application programming interface: overview and evalua-tion with the UltraScan science gateway. In 2014 9th GatewayComputing Environments Workshop (pp. 25-29). IEEE
Ponti DJ, Rosa CM, Blair JL (2019) TheMw 6.0 South Napa earthquakeof August 24, 2014—observations of surface faulting and grounddeformation, with recommendations for improving post-earthquakeField investigations, USGS Open File Report 2019-1018. https://doi.org/10.3133/ofr20191018
Ponti DJ, Blair JL, Rosa CM, Thomas K, Pickering AJ, Akciz S, AngsterS, Avouac J-P, Bachhuber J, Bacon S, Bennett S, Blake K, Bork S,Brooks B, Bullard T, Burgess P, Chupik C, Dawson T, DeFriscoM,Delano J, DeLong S, Dolan J, Donnellan A, DuRoss C, Ericksen T,Frost E, Funning G, Gold R, Graehl N, Gutierrez C, Haddon E,Hatem A, Helms J, Hernandez J, Hitchcock C, Holland P, HudnutK, Kendrick K, Koehler R, Kozaci O, Ladinsky T, Leeper R,Madugo C, Mareschal M, McDonald J, McPhillips D, Milliner C,Mongovin D, Morelan A, Nevitt J, O'Neal M, Olson B, Oskin M,Padilla S, Patton J, Philibosian B, Pierce I, Pridmore C, Roth N,Sandwell D, Scharer K, Seitz G, Singleton D, Smith-Konter B,Spangler E, Swanson B, Jobe JT, Treiman J, Turner F, WilliamsA, Xu X, Zachariasen J, Zimmerman J, Zinke R (2020)Documentation of surface fault rupture and ground deformation fea-tures produced by the Ridgecrest M6.4 and M7.1 earthquake se-quence of July 4 and 5, 2019. Seismol Res Lett. https://doi.org/10.1785/0220190322
Pulver N, Donnellan A, Parker J, LaBrecque L (in preparation) ObservingSouthern California Landslides Using UAVSAR: La Conchita as aCase Study, Earth and Space Science
Rundle JB, Donnellan A, Ludwig LG, Gong G, Turcotte DL, LuginbuhlM (2016a) Nowcasting earthquakes. Earth Space Sci 3:480–486.https://doi.org/10.1002/2016EA000185
Rundle JB, Donnellan A (2020) Nowcasting earthquakes in SouthernCalifornia with machine learning: bursts, swarms, and aftershocksmay be related to levels of regional tectonic stress. Earth Space Sci7(9):e2020EA001097
Rundle JB, Giguere A, Turcotte DL, Crutchfield JP, Donnellan A (2019)Global seismic nowcasting with Shannon information entropy.Earth Space Sci 6:456–472
Rundle JB, Holliday JR, Graves WR, Rundle PB, Jeremic B, Kunnath S,Feltstykket R, Mayeda K, Turcotte DL, Donnellan A (2016b) APractioner’s guide to operational real time earthquake forecasting.In: Anderson R, Ferriz H (eds) Applied geology in California(book). Star Publishing, Belmont, pp 983–1003
Rundle JB, Luginbuhl M, Giguere A, Turcotte DL (2018) Natural time,nowcasting and the physics of earthquakes: estimation of risk toglobal megacities. Pure Appl Geophys 175:647–660
Rymer MJ, Treiman JA, Kendrick KJ, Lienkaemper JJ, Weldon RJ,Bilham R, Wei M, Fielding EJ, Hernandez JL, Olson BP, IrvinePJ (2010) Triggered surface slips in southern California associatedwith the 2010 El Mayor-Cucapah, Baja California, Mexico, earth-quake (no. 2010–1333). US Geological Survey
Tymofyeyeva E, Fialko YA, Jiang J, Bilham RG, Sandwell DT,Rockwell TK, Gontz A, Blanton C (2018) Shallow slow slip eventon the southern san AndreasFault triggered by the 2017 Chiapas(Mexico) earthquake. In AGU Fall Meeting Abstracts
Wang J, Pierce M, Donnellan A, Parker J (2015) Web Services forDynamic Coloring of UAVSAR images. Pure Appl Geophys172(8):2325–2332
Publisher’s note Springer Nature remains neutral with regard to jurisdic-tional claims in published maps and institutional affiliations.
Earth Sci Inform