in good company - coca-cola hbc ag · in good company 2018 integrated annual report coca‑cola...
TRANSCRIPT

IN GOOD COMPANY2018
Integrated Annual Report
Co
ca‑Co
la Hellenic B
ottling C
om
pany 2018 Integrated Annual R
eport

2018 HIGHLIGHTS
VOLUME (m unit cases)
2,1922017: 2,104
NET SALES REVENUE (€m)
6,6572017: 6,522
COMPARABLE EBIT 1 (€m)
6812017: 621
COMPARABLE EBIT MARGIN1 (%)
10.22017: 9.5
COMPARABLE NET PROFIT1, 2 (€m)
4802017: 450
COMPARABLE EPS1 (€)
1.312017: 1.23
ROIC (%)
13.72017: 12.4
CARBON EMISSIONS REDUCED ACROSS THE VALUE CHAIN
25%COMPARED WITH 2010 BASELINE
1. For details on APMs, refer to the Alternative performance measures section.
2. Net Profit and comparable net profit refer to net profit and comparable net profit respectively after tax attributable to owners of the parent.
EBIT (€m)
6392017: 590
EBIT MARGIN (%)
9.62017: 9.0
NET PROFIT2 (€m)
4472017: 426
BASIC EPS (€)
1.222017: 1.17
PACKAGING RECOVERED FOR RECYCLING
45%

SR
CG
FS
SSR
SI
Strategic Report
Corporate Governance
Financial Statements
Swiss Statutory Reporting
Supplementary Information
CONTENTSAbout our reportThe 2018 Integrated Annual Report (‘Annual Report’) consolidates Coca‑Cola HBC AG’s UK and Swiss disclosure requirements while meeting the disclosure requirements for its secondary listing on the Athens Exchange and the sustainability reporting standards. For more information about our Integrated Annual Report, see page 256.
More online
www.coca‑colahellenic.com
Navigating this reportWe are In Good Company with all our stakeholders.
We have identified issues that we believe are relevant to each of our stakeholders throughout the report, and have indicated these through the following icons.
Strategic Report3 Our business4 Chairman’s letter6 Chief Executive Officer’s Q&A10 Our stakeholders12 Market review14 Our business model16 Our growth model17 Our strategy and KPIs24 Our 2025 sustainability commitments26 Our people34 Our communities40 Our consumers48 Our customers54 Partners in efficiency63 Managing risk and materiality79 Viability Statement80 Financial review84 Segment highlights
Corporate Governance88 Chairman’s introduction to corporate governance90 Board of Directors96 Corporate Governance Report122 Directors’ Remuneration Report145 Statement of Directors’ Responsibilities
Financial Statements148 Independent Auditor’s Report153 Financial Statements159 Notes to the Financial Statements
Swiss Statutory Reporting221 Report of the statutory auditor on Coca‑Cola HBC
AG’s consolidated financial statements227 Report of the statutory auditor on Coca‑Cola HBC
AG’s financial statements230 Coca‑Cola HBC AG’s financial statements241 Report of the statutory auditor on the Statutory
Remuneration Report242 Statutory Remuneration Report
Supplementary Information246 Alternative performance measures250 Assurance statement253 Shareholder information
Glossary
Our consumers
Our customers
Partners in efficiency
Our communities
Our people
Governments
NGOs
The Coca‑Cola Company
Shareholders
CREATING VALUE FOR ALL STAKEHOLDERS IS CORE TO OUR STRATEGY AND LONG‑TERM SUCCESS. WE THEREFORE ENGAGE CONTINUOUSLY WITH OUR PEOPLE, CUSTOMERS, PARTNERS, SHAREHOLDERS, AND COMMUNITIES TO ENSURE THAT WE ARE FOCUSED ON FULFILLING THEIR NEEDS NOW AND IN THE FUTURE – THAT’S WHAT WE MEAN BY BEING ‘IN GOOD COMPANY’.

PRO
DUCTS
CH
AN
NELS
OC
CASIO
NS
ENER
GY
DR
INK
S
RTD
TEAJUICE
WATER
SPARKLING BEVERAGES
SPO
RTS
DRI
NK
S
COFFEE
PLANT‑BASED BEVERAGES
PREMIUM SPIRITS
SUPE
R &
HY
PERM
ARK
ETS
DISCOUNTERS
FRAGMENTED TRADE HORECA
DIGITAL COMM
ERCE
AT W
ORK
OU
T
HABITS AT
HOME
AT HOME ACTIVITY AWAY
FROM HOME
HO
ME
AT HOME
AWAY
FROM
AT H
OM
E
AT WORK
AT SCHOOLMEALS EATING OUT
PHYSICAL
ON THE GO
MY MOMENTSSCREEN
TIME
HA
NG
ING
OU
TSO
CIA
LISING
BRE
AK
FAST
ROUTINE
DR
INK
ING
SNACKTIM
E
We remain focused on efficiency in all we do, allowing our strong revenue growth to drive improving profitability.
We are generating strong revenue growth and sustainable margin expansion
And we are cultivating the potential of our people and building trust with our communities
Sustainable growth is core to our long-term success and to support that we launched new 2025 sustainability commitments this year.
Since we laid out our 2020 targets in 2016, we have delivered consistently at or above those objectives.
We have the right teams in place who are empowered to take intelligent risks and seize opportunities.
Emerging markets
Currency‑neutral revenue growth 2018 + 6.8%
Comparable EBIT margin 2018 10.5%
Developing markets
Currency‑neutral revenue growth 2018 + 11.9%
Comparable EBIT margin 2018 10.5%
Established markets
Currency‑neutral revenue growth 2018 + 2.1%
Comparable EBIT margin 2018 9.7%
OURBUSINESS
BRINGING BEVERAGES TO LIFE
Evolution of our portfolioThe faster pace of innovation and launches helps us provide our customers with the right packs, variants, categories and brands to achieve sustainable growth.
See pages 40‑47 for more information
UNDERSTANDING OUR MARKETSWe continue to invest in our 28 markets to grow volumes and create value.
Route to market
Our collaborative relationships with customers and broader, deeper route-to-market approach
helps us capture value from our total beverage portfolio.
% of volume from new launches
See pages 48-53 for more information
See more on pages 54‑62
COMPARABLE EBIT MARGIN
+270bpsFROM 7.5% IN 2015
%
New package formatsNew categories and brandsVariants of Coca-ColaFlavours of other sparkling brandsFlavours for adultsOther flavours
64 9 17 2 26
See progress against our strategy on pages 18-23
CURRENCY-NEUTRAL REVENUE GROWTH
+5% on averageIN THE LAST THREE YEARS
See more on pages 26‑33
28,884DIRECT EMPLOYEES
See more on pages 24‑25
17NEW COMMITMENTS

We are nurturing our people, building trust in our communities, growing partnerships with our customers, evolving our portfolio for our consumers, and driving efficiencies with our suppliers.
Dear stakeholder,Our strong performance during 2018 was the result of the successful execution of Coca-Cola HBC’s growth strategy, increasingly efficient operations and the efforts of our talented and resourceful people. I am pleased to report that even as we transformed many aspects of our business, our approach of creating value for all of our stakeholders continued.
In Good CompanyThe theme of this year’s report, In Good Company, reflects the importance of our network of partners, including customers, shareholders, suppliers, our people and communities. The Board of Directors has striven to ensure that the Company has a comprehensive approach to stakeholder engagement, including building robust stakeholder engagement practices which allow us to listen to stakeholder concerns and feedback, and taking steps to engage further when deemed appropriate.
As part of our commitment to ongoing dialogue and engagement, we, along with The Coca‑Cola Company, invited policy makers, investors, customers, non‑governmental organisations and industry associations from across our markets to our Annual Stakeholder Forum. Anastasios Leventis and Charlotte Boyle represented the Board at our 2018 forum in Vienna, where we listened to stakeholders’ views on sustainability and the key issue of how we continue to tackle packaging waste.
How and why we work with our stakeholders forms a key thread throughout this report.
SustainabilityWe have made great progress in managing the environmental and social aspects of our business and have already delivered on a number of our 2020 sustainability targets, ahead of schedule. New, ambitious 2025 sustainability commitments were approved by the Board of Directors during the year to ensure that sustainability remains integral to our future strategy.
CHAIRMAN’S LETTER4 COCA-COLA HBC
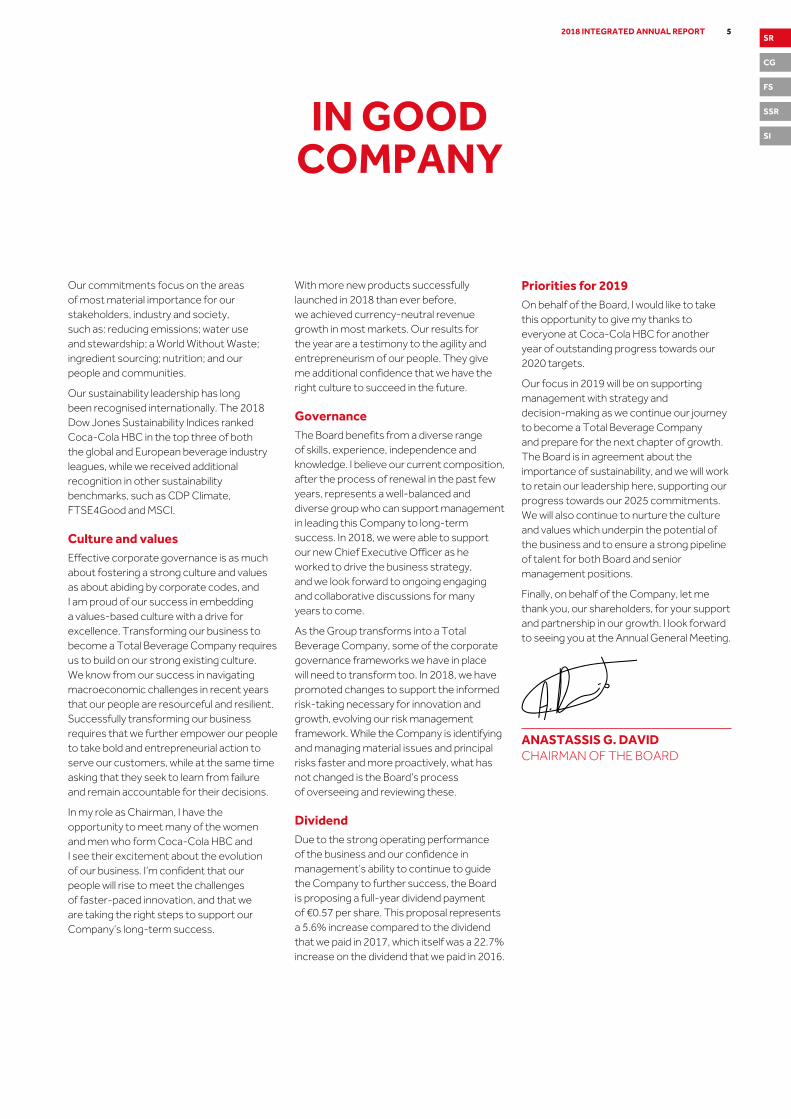
Our commitments focus on the areas of most material importance for our stakeholders, industry and society, such as: reducing emissions; water use and stewardship; a World Without Waste; ingredient sourcing; nutrition; and our people and communities.
Our sustainability leadership has long been recognised internationally. The 2018 Dow Jones Sustainability Indices ranked Coca‑Cola HBC in the top three of both the global and European beverage industry leagues, while we received additional recognition in other sustainability benchmarks, such as CDP Climate, FTSE4Good and MSCI.
Culture and valuesEffective corporate governance is as much about fostering a strong culture and values as about abiding by corporate codes, and I am proud of our success in embedding a values‑based culture with a drive for excellence. Transforming our business to become a Total Beverage Company requires us to build on our strong existing culture. We know from our success in navigating macroeconomic challenges in recent years that our people are resourceful and resilient. Successfully transforming our business requires that we further empower our people to take bold and entrepreneurial action to serve our customers, while at the same time asking that they seek to learn from failure and remain accountable for their decisions.
In my role as Chairman, I have the opportunity to meet many of the women and men who form Coca‑Cola HBC and I see their excitement about the evolution of our business. I’m confident that our people will rise to meet the challenges of faster‑paced innovation, and that we are taking the right steps to support our Company’s long‑term success.
With more new products successfully launched in 2018 than ever before, we achieved currency‑neutral revenue growth in most markets. Our results for the year are a testimony to the agility and entrepreneurism of our people. They give me additional confidence that we have the right culture to succeed in the future.
GovernanceThe Board benefits from a diverse range of skills, experience, independence and knowledge. I believe our current composition, after the process of renewal in the past few years, represents a well‑balanced and diverse group who can support management in leading this Company to long‑term success. In 2018, we were able to support our new Chief Executive Officer as he worked to drive the business strategy, and we look forward to ongoing engaging and collaborative discussions for many years to come.
As the Group transforms into a Total Beverage Company, some of the corporate governance frameworks we have in place will need to transform too. In 2018, we have promoted changes to support the informed risk‑taking necessary for innovation and growth, evolving our risk management framework. While the Company is identifying and managing material issues and principal risks faster and more proactively, what has not changed is the Board’s process of overseeing and reviewing these.
DividendDue to the strong operating performance of the business and our confidence in management’s ability to continue to guide the Company to further success, the Board is proposing a full‑year dividend payment of €0.57 per share. This proposal represents a 5.6% increase compared to the dividend that we paid in 2017, which itself was a 22.7% increase on the dividend that we paid in 2016.
ANASTASSIS G. DAVIDCHAIRMAN OF THE BOARD
IN GOOD COMPANY
Priorities for 2019On behalf of the Board, I would like to take this opportunity to give my thanks to everyone at Coca‑Cola HBC for another year of outstanding progress towards our 2020 targets.
Our focus in 2019 will be on supporting management with strategy and decision‑making as we continue our journey to become a Total Beverage Company and prepare for the next chapter of growth. The Board is in agreement about the importance of sustainability, and we will work to retain our leadership here, supporting our progress towards our 2025 commitments. We will also continue to nurture the culture and values which underpin the potential of the business and to ensure a strong pipeline of talent for both Board and senior management positions.
Finally, on behalf of the Company, let me thank you, our shareholders, for your support and partnership in our growth. I look forward to seeing you at the Annual General Meeting.
52018 INTEGRATED ANNUAL REPORTSR
CG
FS
SSR
SI

ZORAN BOGDANOVICCHIEF EXECUTIVE OFFICER
“I am very pleased by the successful introduction of our expanded product and package portfolio, and am confident that these changes position our Company for sustained profitable growth.”
CHIEF EXECUTIVE OFFICER’S Q&A6 COCA-COLA HBC6

How was 2018 for CCH?We achieved another year of strong revenue growth with margin expansion and introduced more launches of new packages, brands and even categories than ever before. These launches accomplish two key things. First, they ensure that we are bringing our customers a beverage portfolio which meets emerging consumer trends. Second, they allow for profitable revenue growth by providing the right package and price combinations across our channels and consumption occasions.
I am very pleased by the successful introduction of our expanded package and product portfolio, and am confident that these changes position our Company for sustained profitable growth. You will find many examples of our successful launches in the Consumers and Customers sections on pages 40‑53.
More launches of more products requires adjustment throughout the business: an enhanced route‑to‑market approach; a more agile supply chain; and ongoing focus on cost control. This would not be possible without close partnerships with our customers and the dedication and hard work of our people.
Our people’s adaptability and agility made it possible to implement these changes. We are investing in our people to nurture their potential. I want our Company to have an empowered, accountable workforce, fully engaged and motivated by our unlimited opportunities. It is an honour to work with our people and serve them in my capacity as CEO. I applaud their efforts in 2018.
2018 was also a year where we saw progress on our key sustainability goals and in fact we have set new, bold commitments for our business for 2025. Operating sustainably and creating value for all stakeholders is core to our long‑term success.
ANOTHER YEAROF GROWTH
All of this work is the foundation of our transformation to a Total Beverage Company, and it is producing results. In 2018, we achieved revenues of €6,657 million, up 6.0% in currency‑neutral terms. Our comparable EBIT margin was 10.2%, up 70 basis points compared with 2017. Reported net profit was €447 million1. With these results, we are on track to deliver on our 2020 financial commitments.
What were your personal highlights in 2018?It was a great year on many fronts, but one of our key achievements was the launch of FUZETEA simultaneously in 27 of our markets at the start of the year. This launch was meticulously planned and the results have been impressive. With FUZETEA, we have seen volume growth of 1.5% in the ready‑to‑drink tea category in 2018 after several years of decline. I believe this shows the tremendous power of the Coca‑Cola System, operating with both speed and scale to achieve a great result.
Another highlight was the work that went into the FIFA World Cup in Russia. The biggest sporting event in the world in our biggest market was always going to be a focal point for the year, and our team on the ground did a phenomenal job. Their excellent customer engagement and market activation around the event supported the 4.4% volume growth we achieved in Russia in 2018.
As a business driver, events such as the World Cup are not just a short‑term boost to sales, they also support our long‑term reputation and growth, and these benefits extend beyond the host nation. From an operational perspective, we delivered by getting the right drinks to meet the demand of fans in the 12 cities and FIFA Festivals, but also by ensuring that we collected and recycled our packaging. Working with The Coca‑Cola Company and other partners, we supported the recycling of the equivalent of all the PET packaging distributed to FIFA stadiums by the Coca‑Cola System during the tournament.
Of course, it was a great personal highlight to enjoy a Coke Zero while watching my team, Croatia, in the World Cup Final – even if the result didn’t go the way I would have wanted.
Can you tell us a little more about the operational changes the shift to becoming a Total Beverage Company necessitates?This change requires a faster pace of decision‑making within the whole Coca‑Cola System, which is being supported by even greater alignment between The Coca‑Cola Company and the bottlers. We are creating a more agile, responsive system which allows us to roll out our successes with speed and to ensure we focus our efforts on the highest return opportunities, while eliminating unsuccessful products faster.
Many launches of new packs and flavours use our existing assets, by which I mean the manufacturing plants, the distribution centres and warehouses, through to our sales force and customer relationships. However, there are examples of new products that require specific investment. We have invested in a new line for GLACÉAU smartwater in Hungary for example, and another for AdeZ in the Czech Republic.
1. Net Profit and comparable net profit refer to net profit and comparable net profit respectively after tax attributable to owners of the parent.
72018 INTEGRATED ANNUAL REPORTSR
CG
FS
SSR
SI

This transition to being a Total Beverage Company allows us to offer an even more compelling proposition in more sales channels and more consumption occasions throughout the day. This requires additional sales capabilities and updates to our route to market. We are particularly excited by the opportunities that our evolving portfolio, including sophisticated, premium products, is giving us to improve our opportunities in premium hotels, restaurants, bars and cafés, and we have hired dedicated teams to address this channel directly.
What are the key projects you are undertaking in the Company to improve performance?The full benefit of our expanded, innovative product portfolio will only be realised through targeted, effective marketing initiatives and ongoing revenue growth management initiatives.
We undertook a significant reboot of our route to market in 17 of our markets during the year. This work expanded our depth and breadth of coverage with a particular focus on high‑potential channels. We are also working to make our customer relationships increasingly collaborative, focusing more of our actions on customer needs and prioritising outlets with the highest potential for collaboration and growth. Driving more value from every case we sell benefits our customers and us. To achieve this, we introduced new revenue growth management initiatives to improve category and package mix, as well as pricing and promotional management strategies.
Technological innovations also provide us with new opportunities to add value. For example by analysing patterns in cooler door openings alongside sales data, we can ensure our coolers are well placed to maximise growth. Coolers with internet connections can also automate inventory assessments. This frees up time for our sales people to do what they do best; sell our beverages to the customer with the best possible level of service.
Of course, you can see at once that the common factor for success in each of these areas is the crucial role of our people. We are passionate about creating an inclusive, growth culture that ensures that our people are not only engaged but empowered.
What are you doing to ensure that your people are engaged?In the Company’s 2018 employee engagement results, we saw a 1pp decline in engagement level to 88%. Our results for 2018 remain high compared to the FTSE 100 companies in the Willis Towers Watson benchmarking pool and the norm for FMCG companies. As our business evolves, our talented people are being asked to be even more agile and more entrepreneurial. We need to have a culture to support our growth ambitions. Feedback from our people tells us they are passionate about their work and our products and brands. They also see the potential to operate faster and are engaged by the opportunities to remove unnecessary bureaucracy and focus on results.
We have begun to simplify processes and address structural barriers, and we are asking our people to take intelligent risk where necessary. We are encouraging empowerment and personal accountability and to support this, we are focusing on providing faster feedback to our people so that we can all iterate and improve on a more continual basis. Supporting a shift in our culture is going to take time. This will be an ongoing priority for our leadership team and me.
You talk a lot about growth mindset, what does this mean to you?As an organisation we have to focus on constantly improving, individually and collectively, to ensure that we keep growing, and our customers, partners and communities grow with us. This focus requires a mindset that understands the power of learning by giving and receiving honest feedback and then acting on it. We cherish the curiosity of our people which keeps them aware of ideas outside of our organisation and encourages them to bring the most inspiring ideas back into the Company. A growth mindset requires us to continue to embrace collaboration and innovation as ways of working and emphasises empowerment, personal accountability and an optimism in the potential of our people. It’s been a big focus over the past year because we can only continue to drive forward with this growth mindset.
What have been the key challenges in 2018?Although we have enjoyed strong growth in the majority of the Developing and Emerging markets in which we operate, the environment in Nigeria, with sluggish growth and an intense competitive dynamic, has been more challenging than we expected.
Nigeria remains a market with huge potential. We have worked hard in recent years to improve our flexibility to manage challenges, and we prepare meticulously, both for the most likely outcome and also for potential risks. The results we produced in Nigeria, achieving an increase in currency‑neutral revenues of 5.0% compared with 2017, are testimony to our people’s ability to adapt and take challenges in their stride. We have a lot of tools for addressing economic and competitive challenges – in particular using the full range of our brands and package sizes to expand our offer in the market. We were able to use these tools to help us stay on course.
The issue of plastic pollution seemed to shoot up the media and political agenda in 2018. How are you addressing this?While plastic waste has received more high‑profile attention recently in the media, it is an issue we have been working hard to tackle for years. We have continually redesigned packages to make them lighter and easier to recycle and we have made investments in technology that lets us use more recycled content in packages. In 2019, we will launch PET bottles for four water brands in 100% recycled PET, and use 50% recycled PET for both Coke and Coke Zero in Austria and Switzerland. This is an important trial which we will expand in the future.
We believe that a litter‑free world is possible and that our industry has a key role and a responsibility to help achieve this. As part of our 2025 sustainability commitments, we set ambitions to ensure all our consumer packaging is 100% recyclable, that we use even more recycled PET in our bottles and that we help collect more after use. These commitments support the Coca‑Cola System’s World Without Waste goal of helping to collect and recycle a bottle or can for each one we sell by 2030.
Youth unemployment remains high in many markets. What are you doing to support young people?Another of our 2025 sustainability commitments is designed to step up our efforts in this area.
Since 2015, we have been supporting young people in our markets who are not in education, employment or training by providing skills, networks and access to mentors to give them a leg‑up to the employment ladder. While we are very proud of what we have accomplished through our Youth Empowered programme, we think we can do even more. We have therefore set ourselves a big goal of training one million young people by 2025 through the scheme.
8 COCA-COLA HBC CHIEF EXECUTIVE OFFICER’S Q&A CONTINUED
What about the other commitments and sustainability more generally?Beyond what we are trying to achieve with packaging and youth empowerment, we have set new ambitious 2025 sustainability commitments for emissions, water use and stewardship, World Without Waste, ingredients sourcing, nutrition and our people. These commitments are aligned to the UN Sustainable Development Goals (SDGs) which call on businesses, governments and individuals to work to end poverty, fight inequality and tackle climate change.
We have a strong track record of managing our business responsibly and sustainably, and we are proud of our continued leadership positions in the most recognised sustainability benchmarks, such as the Dow Jones Sustainability Index, CDP Climate, FTSE4Good and MSCI. We know that, ultimately, our success is linked to our ability to create sustainable value for all of our stakeholders, from customers and investors to the communities in which we work.
There is more about our approach to creating value for stakeholders in our stakeholder and business model sections on pages 10‑11 and 14‑16.
Now you’ve been CEO for over a year, what have you found most rewarding?One of the many great things about being CEO is seeing and supporting the individual and team growth stories that contribute to the overall success of the business. I believe that we should never stop learning, personally and professionally; it’s one of our key values and 2018 has certainly been another year of rich learning for our business. Our people are continuously building their capabilities through our Excel leadership training programme or the accelerator courses that our business developers and key account managers attend.
I find it particularly rewarding to see how our people drive solutions for our customers.
This is true of new ideas that make life easier for them, such as connected coolers and on‑shelf technology to how we implement big scale challenges like introducing a new category in the form of AdeZ plant‑based beverages or launching FUZETEA across 27 markets simultaneously. Again and again across the business, I see individuals and teams putting the customer front and centre of each thing we do by focusing their efforts on selling or helping us to sell.
What are the investment priorities for Coca-Cola HBC? You currently have a lot of cash. What will you do with it?Our priority remains investment in the business, with a disciplined approach to capital expenditure and managing shareholders’ capital. We have seen increased opportunity for investment in 2018 and our capex to sales ratio stood at 6.4%, an increase on the 5.8% ratio in 2017. We will continue to look at opportunities to make complementary bolt‑on acquisitions, particularly in strong local water and juice brands.
We also operate a progressive dividend policy and in 2018 our dividend payout ratio was 43.6%. Finally, in the absence of the right investment opportunities we will seek to optimise the balance sheet, returning to our targeted net debt to comparable adjusted EBITDA target of 1.5–2.0 times.
What are the opportunities and challenges for 2019 and beyond?In 2018, we delivered another very good performance with revenue growth above our target range and another step up in margins. Overall, we expect volume to continue to grow in all three segments and that we can continue to deliver currency‑neutral net sales revenue per case improvement, accompanied by margin expansion.
The economic environment is expected to be less of a tailwind in 2019 in our territory. We believe, however, that we are well placed to withstand less favourable conditions. I am confident that 2019 will be another year of growth, both for the Company and our people, as we continue strengthening our capabilities, carry on improving the way we serve our customers and work collaboratively with all of our partners to create shared value.
ZORAN BOGDANOVICCHIEF EXECUTIVE OFFICER
SR
CG
FS
SSR
SI
9

IN GOOD COMPANY WITH OUR
STAKEHOLDERS
Our consumers
Our communities
Our people
The
Coca‑Cola Company
Governments
Sha
reholders
NGOs
Partners in efficiency
Our customer
s
See more on our stakeholdersInterview with some of our stakeholders
Employees: Page 29
Consumers: Page 44
Customers: Page 53
Suppliers: Page 57
How our Board is informed on stakeholder issues
Page 107
A selection of decisions where stakeholders were considered
Page 107
When introducing new packages or products, developing strategy or setting targets to manage the social and environmental impacts of our operations,
we consider what is meaningful and valuable to our stakeholders. This requires understanding our stakeholders’ priorities and expectations.
COCA-COLA HBC10 OUR STAKEHOLDERS

Description Key issues Why we engage How we engage
Read more on page 26
Employees of the Company. · Ensuring that all key positions are filled with the best person for the job
· Maintaining high employee engagement
· Nurturing skills and talents · Championing inclusion and
diversity
Our people are our most important asset and engine of growth. They are both the creators and caretakers of our culture and values.
Through our annual review process and employee surveys, by offering relevant training both on and off line and by making a vast wealth of material available on our HR web portal.
Read more on page 34
The people who we live and work alongside.
· Water conservation · Waste · Empowering youth and women
To build trust by operating responsibly and sustainably, and addressing issues that are material for our communities.
To provide training opportunities and support to young people currently not in education, training or employment.
We engage directly with people in the markets in which we operate, particularly those living in the areas around our bottling operations, and through third‑party partnerships.
Read more on page 40
People who consume our products in the 28 countries where we operate.
· Continuously evolving our products to meet consumers’ needs for healthy hydration, quality, taste, innovation and convenience
By understanding the consumer and evolving our portfolio accordingly, we grow our business sustainably in the long term.
Understanding consumers’ needs and preferences through collecting consumer insights. While this is also part of the Coca‑Cola Company’s role, we gain access to these insights.
Read more on page 48
A wide range of retail outlets, including supermarkets, hypermarkets, discounters, convenience stores, wholesalers, hotels, restaurants, cafés, quick service restaurants (QSRs), cinemas and e‑commerce retailers that sell our products to consumers.
· Identifying channels and customers that offer growth and value creation for us and our customers
· Offering a total beverage portfolio that meets the changing preferences of the consumers
· Achieving high service levels at optimum cost
To build business plans with specific in‑store execution and promotional activities to suit our customers’ needs and create joint value.
To avoid unnecessary costs.
A system of key account managers, in whom we are constantly investing, engage at a strategic level.
Our business developers make regular visits to outlets.
Read more on page 54
Our suppliers, consultants and counterparts in related industries.
· Rising costs of ingredients, labour, packaging material, energy and water
· Minimising the environmental impact of water and energy resources, and air emissions
· Recycling and waste management
· Sustainable sourcing
To share knowledge and expertise and find ways of using all our resources as efficiently as possible, reducing costs to our Company.
To ensure a healthy, sustainable supply chain.
We receive feedback at our Annual Stakeholder Forum.
We align and co‑ordinate with the Coca‑Cola System’s Central Procurement Group and our technology and commodity suppliers through regular interactions.
Read more on page 65
Non‑governmental organisations (NGOs) with a focus on environmental, economic and social issues.
· Wide‑ranging issues facing our business, from energy and water use, reductions in packaging waste to corporate governance, human rights and diversity
NGOs have a key contributing role to our annual materiality process and we engage with them, both in our markets as well as at Group level, on an ongoing basis to develop and support community and environmental initiatives.
Via our Annual Stakeholder Forum and our annual materiality assessment, as well as through ad hoc meetings.
Read more on page 104
Equity and debt investors who provide capital to the business.
· Quality and effectiveness of governance
· Profitability and growth potential of the business
· Capital gain through share price appreciation
· Capital return via dividends or the payment of interest
To achieve fair value and appropriate ownership of our shares by enabling the full understanding of the strategy, as well as the operational and financial performance of the Company.
To benefit from the views of the investment community in decision‑making and strategy‑setting.
Through open, honest communication during our Annual General Meetings, investor roadshows and results briefings, and ongoing dialogue with analysts and investors.
Read more on page 64
Governments, their ministries and regulators.
· Industry and/or product‑specific policies, such as taxes, restrictions or regulations
· Environmental policies · Consumer health and public
health policies
We consider it our duty and our responsibility to make our views clear to those who have the potential to impact the laws, regulations and policies that can influence our business.
Our advocacy efforts are mainly conducted through trade associations, which represent companies, organisations, causes and industries. We also partner with local governments to tackle waste collection challenges.
Read more on page 14
Our partner who develops the beverage brands which we bottle and sell. They are our largest supplier and a significant shareholder.
· Profitable growth opportunities · Value share in our markets · Sustainable sourcing
To maintain consumer trust and generate sustainable growth for The Coca‑Cola System, objectives central to both of our business models.
Day‑to‑day interaction as business partners, joint projects, joint business planning, functional groups on strategic issues and ‘top‑to‑top’ senior management forums.
Our consumers
Our customers
Partners in efficiency
NGOs
Shareholders
Governments
The Coca-Cola Company
Our communities
Our people
112018 INTEGRATED ANNUAL REPORTSR
CG
FS
SSR
SI

Dynamic retail environmentChanging lifestyles and shopping habits have a direct impact on the retail landscape. Households are gradually becoming smaller, either due to lower birth rates or new family patterns, and everyday lives are busier as more flexible work situations blur the boundaries between work and personal time. As a result, convenience stores and e-commerce will continue to be among the fastest-growing channels in the next few years. Consumers are also increasingly price-sensitive, supporting the growth of discounters. At the same time, growth in away-from-home socialising occasions is creating a big opportunity to capture sales through hotels, restaurants and cafés.
Digital evolutionTechnology is changing the way consumers interact with the world and with brands, with smartphones now central to all kinds of daily activities. Easy access to information empowers consumers, allowing them to screen product information and compare prices or product availability. Online shopping is expanding as consumers have greater comfort with e-commerce technology and delivery processes. This channel opens up many new purchasing opportunities, allowing consumers to be active 24/7. Social media is shaping category and brand perceptions, and micro-influencers are gaining credibility in promoting products and services.
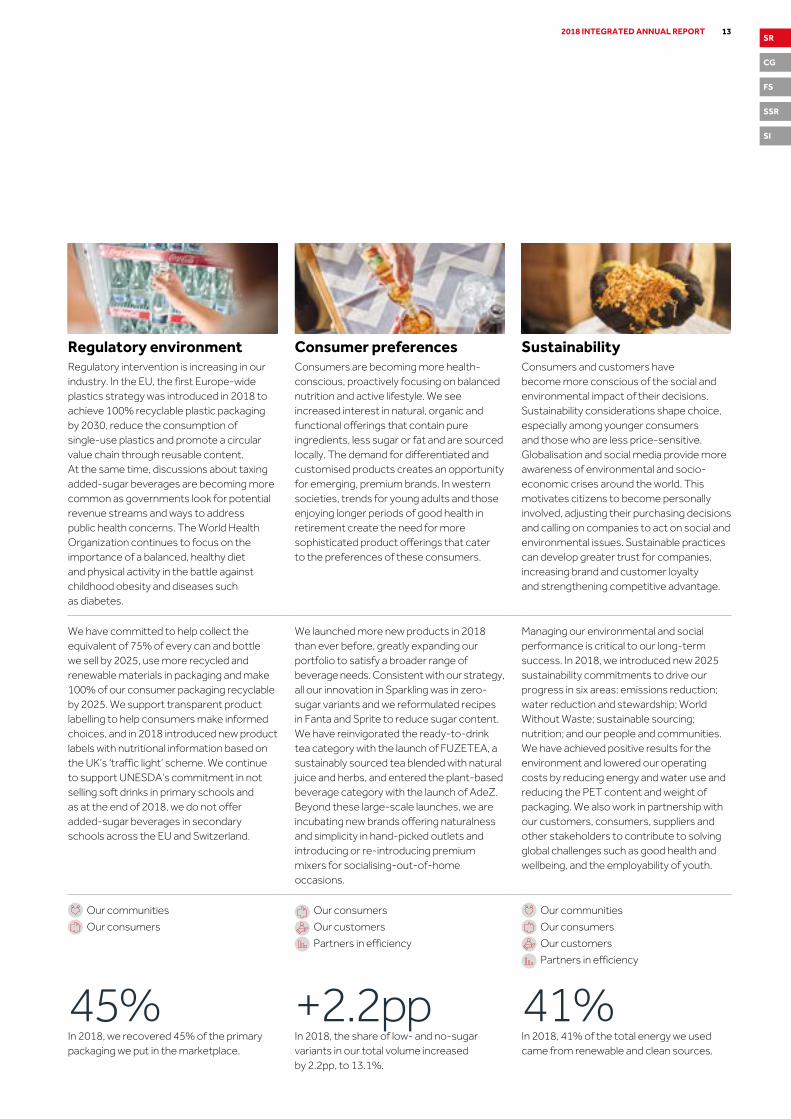
Regulatory environmentRegulatory intervention is increasing in our industry. In the EU, the first Europe-wide plastics strategy was introduced in 2018 to achieve 100% recyclable plastic packaging by 2030, reduce the consumption of single-use plastics and promote a circular value chain through reusable content. At the same time, discussions about taxing added-sugar beverages are becoming more common as governments look for potential revenue streams and ways to address public health concerns. The World Health Organization continues to focus on the importance of a balanced, healthy diet and physical activity in the battle against childhood obesity and diseases such as diabetes.
Consumer preferencesConsumers are becoming more health-conscious, proactively focusing on balanced nutrition and active lifestyle. We see increased interest in natural, organic and functional offerings that contain pure ingredients, less sugar or fat and are sourced locally. The demand for differentiated and customised products creates an opportunity for emerging, premium brands. In western societies, trends for young adults and those enjoying longer periods of good health in retirement create the need for more sophisticated product offerings that cater to the preferences of these consumers.
SustainabilityConsumers and customers have become more conscious of the social and environmental impact of their decisions. Sustainability considerations shape choice, especially among younger consumers and those who are less price-sensitive. Globalisation and social media provide more awareness of environmental and socio-economic crises around the world. This motivates citizens to become personally involved, adjusting their purchasing decisions and calling on companies to act on social and environmental issues. Sustainable practices can develop greater trust for companies, increasing brand and customer loyalty and strengthening competitive advantage.
Partnering with our customers is a strategic priority and we work hard to build strong customer relationships through joint value-creation processes. We have built a customer-centric sales force and developed sophisticated tools, such as route-to-market approaches to drive revenue growth while providing excellent customer service at optimal cost. With more sophisticated, premium products, and the implementation of targeted initiatives, we are extracting higher value from consumption during socialising occasions. A major component of our in-store execution involves our cooler acceleration programme, which expands availability of chilled beverages and drives single-serving growth.
We are successfully activating e-commerce across various channels, using a co-operative approach with our customers and investing in new training for our people. In 2018, we accelerated our investment in connected coolers with three major objectives: increase sales force productivity through automation; optimise cooler placement and collect data about traffic patterns to customise activations; and drive sales through proximity marketing using applications. We have also evolved our web-based customer portal, providing an online, 24/7 platform for ordering. We are pursuing these opportunities responsibly, with increased focus on cyber-security and data protection.
We have committed to help collect the equivalent of 75% of every can and bottle we sell by 2025, use more recycled and renewable materials in packaging and make 100% of our consumer packaging recyclable by 2025. We support transparent product labelling to help consumers make informed choices, and in 2018 introduced new product labels with nutritional information based on the UK’s ‘traffic light’ scheme. We continue to support UNESDA’s commitment in not selling soft drinks in primary schools and as at the end of 2018, we do not offer added-sugar beverages in secondary schools across the EU and Switzerland.
We launched more new products in 2018 than ever before, greatly expanding our portfolio to satisfy a broader range of beverage needs. Consistent with our strategy, all our innovation in Sparkling was in zero-sugar variants and we reformulated recipes in Fanta and Sprite to reduce sugar content. We have reinvigorated the ready-to-drink tea category with the launch of FUZETEA, a sustainably sourced tea blended with natural juice and herbs, and entered the plant-based beverage category with the launch of AdeZ. Beyond these large-scale launches, we are incubating new brands offering naturalness and simplicity in hand-picked outlets and introducing or re-introducing premium mixers for socialising-out-of-home occasions.
Managing our environmental and social performance is critical to our long-term success. In 2018, we introduced new 2025 sustainability commitments to drive our progress in six areas: emissions reduction; water reduction and stewardship; World Without Waste; sustainable sourcing; nutrition; and our people and communities. We have achieved positive results for the environment and lowered our operating costs by reducing energy and water use and reducing the PET content and weight of packaging. We also work in partnership with our customers, consumers, suppliers and other stakeholders to contribute to solving global challenges such as good health and wellbeing, and the employability of youth.
Our consumers
Our customers
Our consumers
Our customers
Partners in efficiency
Our communities
Our consumers
Our consumers
Our customers
Partners in efficiency
Our communities
Our consumers
Our customers
Partners in efficiency
Market trends
RESPONDING TO EVOLVING TRENDS
+1.1%An estimated 1.1% of our annual revenue growth in 2018 is attributable to new route-to-market approaches.
+26%In e-commerce, we achieved a growth of 26% versus 2017, ahead of the market trend.
How we are responding
Delivered through
12 COCA-COLA HBC MARKET REVIEW
Dynamic retail environmentChanging lifestyles and shopping habits have a direct impact on the retail landscape. Households are gradually becoming smaller, either due to lower birth rates or new family patterns, and everyday lives are busier as more flexible work situations blur the boundaries between work and personal time. As a result, convenience stores and e-commerce will continue to be among the fastest-growing channels in the next few years. Consumers are also increasingly price-sensitive, supporting the growth of discounters. At the same time, growth in away-from-home socialising occasions is creating a big opportunity to capture sales through hotels, restaurants and cafés.
Digital evolutionTechnology is changing the way consumers interact with the world and with brands, with smartphones now central to all kinds of daily activities. Easy access to information empowers consumers, allowing them to screen product information and compare prices or product availability. Online shopping is expanding as consumers have greater comfort with e-commerce technology and delivery processes. This channel opens up many new purchasing opportunities, allowing consumers to be active 24/7. Social media is shaping category and brand perceptions, and micro-influencers are gaining credibility in promoting products and services.
Regulatory environmentRegulatory intervention is increasing in our industry. In the EU, the first Europe-wide plastics strategy was introduced in 2018 to achieve 100% recyclable plastic packaging by 2030, reduce the consumption of single-use plastics and promote a circular value chain through reusable content. At the same time, discussions about taxing added-sugar beverages are becoming more common as governments look for potential revenue streams and ways to address public health concerns. The World Health Organization continues to focus on the importance of a balanced, healthy diet and physical activity in the battle against childhood obesity and diseases such as diabetes.
Consumer preferencesConsumers are becoming more health-conscious, proactively focusing on balanced nutrition and active lifestyle. We see increased interest in natural, organic and functional offerings that contain pure ingredients, less sugar or fat and are sourced locally. The demand for differentiated and customised products creates an opportunity for emerging, premium brands. In western societies, trends for young adults and those enjoying longer periods of good health in retirement create the need for more sophisticated product offerings that cater to the preferences of these consumers.
SustainabilityConsumers and customers have become more conscious of the social and environmental impact of their decisions. Sustainability considerations shape choice, especially among younger consumers and those who are less price-sensitive. Globalisation and social media provide more awareness of environmental and socio-economic crises around the world. This motivates citizens to become personally involved, adjusting their purchasing decisions and calling on companies to act on social and environmental issues. Sustainable practices can develop greater trust for companies, increasing brand and customer loyalty and strengthening competitive advantage.
Partnering with our customers is a strategic priority and we work hard to build strong customer relationships through joint value-creation processes. We have built a customer-centric sales force and developed sophisticated tools, such as route-to-market approaches to drive revenue growth while providing excellent customer service at optimal cost. With more sophisticated, premium products, and the implementation of targeted initiatives, we are extracting higher value from consumption during socialising occasions. A major component of our in-store execution involves our cooler acceleration programme, which expands availability of chilled beverages and drives single-serving growth.
We are successfully activating e-commerce across various channels, using a co-operative approach with our customers and investing in new training for our people. In 2018, we accelerated our investment in connected coolers with three major objectives: increase sales force productivity through automation; optimise cooler placement and collect data about traffic patterns to customise activations; and drive sales through proximity marketing using applications. We have also evolved our web-based customer portal, providing an online, 24/7 platform for ordering. We are pursuing these opportunities responsibly, with increased focus on cyber-security and data protection.
We have committed to help collect the equivalent of 75% of every can and bottle we sell by 2025, use more recycled and renewable materials in packaging and make 100% of our consumer packaging recyclable by 2025. We support transparent product labelling to help consumers make informed choices, and in 2018 introduced new product labels with nutritional information based on the UK’s ‘traffic light’ scheme. We continue to support UNESDA’s commitment in not selling soft drinks in primary schools and as at the end of 2018, we do not offer added-sugar beverages in secondary schools across the EU and Switzerland.
We launched more new products in 2018 than ever before, greatly expanding our portfolio to satisfy a broader range of beverage needs. Consistent with our strategy, all our innovation in Sparkling was in zero-sugar variants and we reformulated recipes in Fanta and Sprite to reduce sugar content. We have reinvigorated the ready-to-drink tea category with the launch of FUZETEA, a sustainably sourced tea blended with natural juice and herbs, and entered the plant-based beverage category with the launch of AdeZ. Beyond these large-scale launches, we are incubating new brands offering naturalness and simplicity in hand-picked outlets and introducing or re-introducing premium mixers for socialising-out-of-home occasions.
Managing our environmental and social performance is critical to our long-term success. In 2018, we introduced new 2025 sustainability commitments to drive our progress in six areas: emissions reduction; water reduction and stewardship; World Without Waste; sustainable sourcing; nutrition; and our people and communities. We have achieved positive results for the environment and lowered our operating costs by reducing energy and water use and reducing the PET content and weight of packaging. We also work in partnership with our customers, consumers, suppliers and other stakeholders to contribute to solving global challenges such as good health and wellbeing, and the employability of youth.
Our consumers
Our customers
Our consumers
Our customers
Partners in efficiency
Our communities
Our consumers
Our consumers
Our customers
Partners in efficiency
Our communities
Our consumers
Our customers
Partners in efficiency
45%In 2018, we recovered 45% of the primary packaging we put in the marketplace.
+2.2ppIn 2018, the share of low- and no-sugar variants in our total volume increased by 2.2pp, to 13.1%.
41%In 2018, 41% of the total energy we used came from renewable and clean sources.
132018 INTEGRATED ANNUAL REPORTSR
CG
FS
SSR
SI

OUR BUSINESS MODEL
Our business model is at the heart of everything we do. It supports our growth and defines the activities we engage in, the relationships we depend on and the outputs and outcomes we aim to achieve in order to create value
for all of our stakeholders in the short, medium and long term.
HumanOur 28,884 people bring talent and strong capabilities relevant to all aspects of our business, from community and customer relations to the innovative thinking necessary to drive value growth and efficiency.
NaturalWater is the most important ingredient for nearly all of our products. Energy, sugar, aluminium and PET resin are also critical inputs which we seek to source responsibly and use efficiently.
Social and relationshipOur social ‘licence to operate’ is due to our reputation and the trust of key stakeholders. Our most valuable stakeholder relationships are with The Coca-Cola Company, and our people, customers, suppliers and partners as well as governments and regulators.
FinancialOur business activities require financial capital, which includes shareholders’ equity, debt and reinvested cash. Coca-Cola HBC has only one class of shares; ordinary shares.
IntellectualOur intellectual property includes our packaging, product and cooler innovations, and our operational excellence systems. As we evolve our beverage portfolio, the importance of these types of innovation is increasing.
ManufacturingAs a bottler, we require production and logistics assets that allow us to manufacture, package and deliver our products to meet the demands of customers and consumers.
Sourcing sustainable materialsWe work with 32,000 suppliers to procure the finest ingredients, raw materials, equipment and services.
Manufacturing & packagingUsing concentrate from The Coca-Cola Company, and other ingredients, we produce, package and distribute products.
Serving consumers & communitiesWe continue to innovate our product portfolio to meet the changing consumer preferences in the market.
Delivering to our customersWe manage customer relationships as well as promotions and displays at the point of sale.
Our resources and relationships What we do
How we do it
We are a bottling partner of The Coca-Cola CompanyThis means that we use the concentrates, or beverage bases from The Coca-Cola Company, to manufacture, package, merchandise, distribute, activate and sell the final branded products to our trade partners and consumers.
The Coca-Col
a C
ompa
ny creates demandCoca-Cola H
BC
delivers demandBottling
Sales and distribution
Customer management
In-outlet execution
Investment in production facilities, equipment,
vehicles
Trademark ownership
Concentrate supply
Brand development
Consumer marketing
Our values underpin how we work.
Read more in our People section on pages 26-33
1 2
3
14 COCA-COLA HBC OUR BUSINESS MODEL

Value created
28Countries in Europe and Africa
Contribution to local economiesOperating in 28 countries, we are an important contributor to local economies and society. Our business has an impact either directly through our core operating activities or indirectly through the broader value chain. We also contribute by investing in community programmes to address environmental and social issues.
€328mTotal taxes
Value for wider stakeholdersOur business activities generate income for our employees, and revenue for suppliers and contractors, improve our customers’ profitability, and support public wellbeing and infrastructure. In 2018, our percentage of satisfied key account customers was 81.3%, an improvement of 2.5pp. Total taxes were €328m, which makes a contribution to local communities.
18Number of countries where we conducted SEIS
Socio-economic impactWe measure our impact through the regular conduct of socio-economic impact studies (SEIS) across our markets. Over the last three years we have conducted SEIS in 18 of our countries.
Direct and indirect employmentAccording to a survey conducted within the European Union, the Coca-Cola System supports more than 500,000 direct and indirect jobs across our value chain through the sourcing of ingredients, raw materials, equipment and services. In 2018, our total supplier spend was €3,237m, with 98% spent with local suppliers.
500,000Direct and indirect jobs supported
€3,237mSupplier spend
Dividend and share valueThrough careful management of all inputs to our business, we also create profits which benefit shareholders through dividend payments and the value of our shares.
€447mNet profit achieved in 2018*
4Direct and indirect economic impacts
* Net Profit and comparable net profit refer to net profit and comparable net profit respectively after tax attributable to owners of the parent.
SR
CG
FS
SSR
SI
15

OUR GROWTH MODEL
We have the exclusive rights to manufacture, sell and distribute The Coca-Cola Company’s brands throughout our territory. We create demand for those brands by investing jointly with The Coca-Cola Company, with co-ordinated marketing to consumers and customers. We focus on growing the non-alcoholic ready-to-drink category while gaining share.
We collaborate with our customers to grow both their businesses and ours, improving value with price and mix improvements. At the same time, we continuously seek efficiency improvements in our cost base and work to optimise our production and logistics infrastructure. The growth in revenue, combined with an efficient cost base, improves our profitability through operating leverage.
Disciplined management of working capital and maintenance capital expenditure enhances the cash we generate, and in combination with improving profitability also leads to an improvement in return on invested capital. Our strong cash generation allows us to reinvest in the business, either organically or through selective acquisitions, and to return cash to shareholders through dividends. This, in turn, fuels sustained growth and a return for shareholders.
Execution
In-market execution
Growth in category volume
Share gainsPrice and mix improvements
Top-line growth+ + =
Cost efficiencies
Investment in production optimisation
Operating expense reduction
Leverage from top-line growth
Margin expansion and earnings growth
++ =
Cash management
Working capital management
Disciplined maintenance CapEx
Enhanced by EBITDA growth
Strong cash generation+ + =
Use of cash =+Reinvest in the business to drive growth
Investment in selective bolt-on opportunities and cash return through dividends
Sustained growth and shareholder return
MarketingIncrease quality and quantity of marketing
Creates and delivers demand=
Brand investmentThe Coca-Cola Company
In-store activationCoca-Cola HBC
Our strategy alongside our operational and financial model allows for strong cash generation and profitable growth opportunities.
16 COCA-COLA HBC OUR GROWTH MODEL

Our strategy is designed to achieve responsible, sustainable and profitable growth. We set clear objectives for the business in 2016, which we continue to track
against a 2020 scorecard to measure our progress.
FOCUSED ON DELIVERY
A sustainable businessWe create a sustainable business by growing profitably, responsibly and by driving positive change in our communities.
What we do to achieve our objectivesAll of our operations in 28 countries work towards the same objectives – drive volume growth, focus on value, improve efficiency and invest in the business – by implementing initiatives that are designed centrally. These initiatives are adjusted to respond to local demographics, economies and market characteristics in order to manage risk while driving growth.
How we measure our performanceWe have five key performance indicators (KPIs) that are chosen to measure our progress. We report on these every year.
Objectives
Drive volume growth
Focus on value
Improve efficiency
Invest in the business
Initiatives
Expand and deepen route to market
Execute in-store with excellence
Create joint value with customers
Drive the water category, focusing on value
Capitalise on meals and socialising occasions for sparkling drinks
Increase share of single-serve packs, driving transactions
Improve performance in hotels, restaurants and cafés (HoReCa)
Grow in the energy category
Drive pricing strategies
Continue production infrastructure and logistics optimisation
Capitalise on contiguous territory and Emerging markets opportunities
Utilise shared services to gain process efficiency
Drive packaging harmonisation and innovation (light-weighting and recyclability)
Continue reducing water, energy and carbon emissions
Invest in revenue- generating assets and innovative technology
Acquire water and juice brands in existing territory
Maintain negative working capital balance sheet position
Enablers and values
Our peopleOur most important enablers of growth are our people. We encourage our people to feel empowered and expect them to be accountable. Our people make our Company what it is and create value by growing our business responsibly and sustainably.
Nurturing the potential of our people as well as engaging them and rewarding them appropriately are priorities at every level of our Company, enabling us to continue to attract and retain the best talent in every key position.
Comparable EBIT margin
11%by 2020
Scorecard
Working capital less than
-€100m
Please see pages 22-23 for our performance against our 2018 KPIs
Comparable OpEx as % of revenue
26-27%by 2020
Capital expenditure
5.5-6.5%of revenue
Average currency-neutral revenue growth
4-5% p.a.
172018 INTEGRATED ANNUAL REPORTSR
CG
FS
SSR
SI
OUR STRATEGY AND KPIs

AVERAGE ANNUAL CURRENCY-NEUTRAL
REVENUE GROWTH
COMPARABLE OPEX AS % OF REVENUE
COMPARABLE EBIT MARGIN
CAPITALEXPENDITURE
OPEX AS A PERCENTAGE OF REVENUE AT 27.7%, NEARING OUR TARGET OF 26-27%
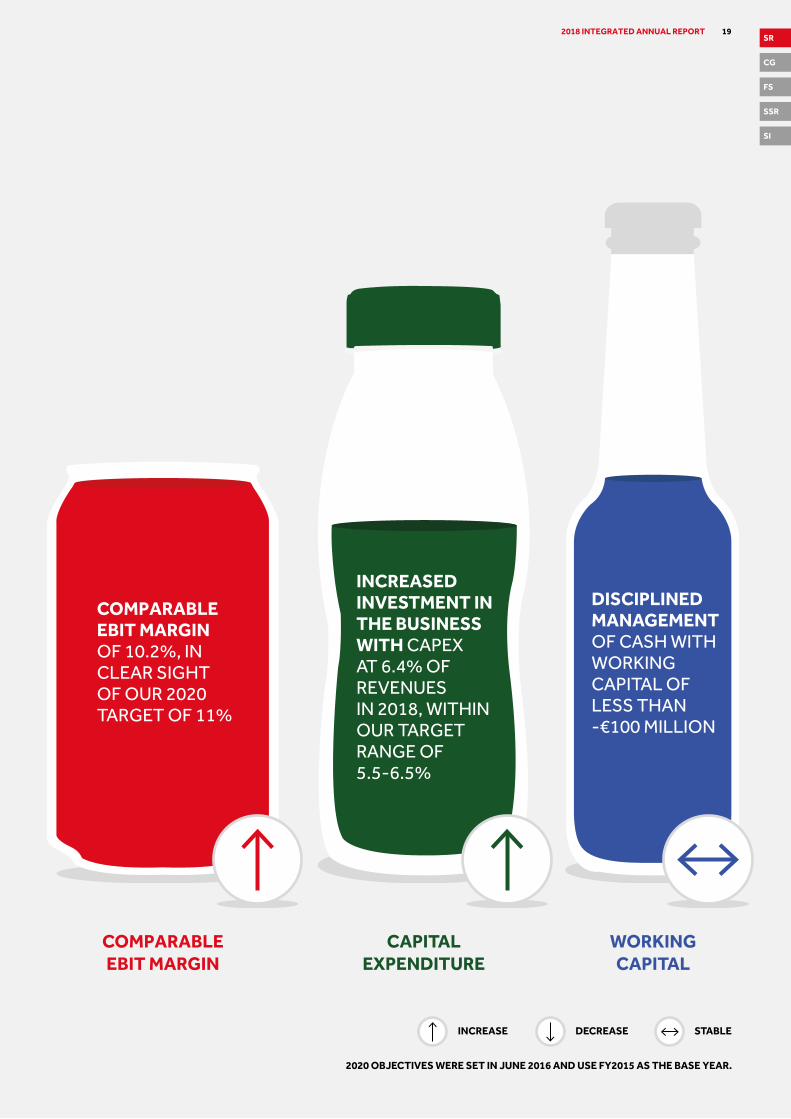
COMPARABLE EBIT MARGIN OF 10.2%, IN CLEAR SIGHT OF OUR 2020 TARGET OF 11%
INCREASED INVESTMENT IN THE BUSINESS WITH CAPEXAT 6.4% OF REVENUESIN 2018, WITHINOUR TARGET RANGE OF 5.5-6.5%
CURRENCY-NEUTRAL REVENUE GROWTH AT AN AVERAGE OF 5.0% COMPARED TO A TARGET OF 4-5%
WORKING CAPITAL
DISCIPLINED MANAGEMENT OF CASH WITH WORKING CAPITAL OF LESS THAN -€100 MILLION
INCREASE DECREASE STABLE
2020 OBJECTIVES WERE SET IN JUNE 2016 AND USE FY2015 AS THE BASE YEAR.
STRONG PROGRESS AGAINST OUR 2020
OBJECTIVES
18 COCA-COLA HBC OUR STRATEGY AND KPIs CONTINUED
AVERAGE ANNUAL CURRENCY-NEUTRAL
REVENUE GROWTH
COMPARABLE OPEX AS % OF REVENUE
COMPARABLE EBIT MARGIN
CAPITALEXPENDITURE
OPEX AS A PERCENTAGE OF REVENUE AT 27.7%, NEARING OUR TARGET OF 26-27%
COMPARABLE EBIT MARGIN OF 10.2%, IN CLEAR SIGHT OF OUR 2020 TARGET OF 11%
INCREASED INVESTMENT IN THE BUSINESS WITH CAPEXAT 6.4% OF REVENUESIN 2018, WITHINOUR TARGET RANGE OF 5.5-6.5%
CURRENCY-NEUTRAL REVENUE GROWTH AT AN AVERAGE OF 5.0% COMPARED TO A TARGET OF 4-5%
WORKING CAPITAL
DISCIPLINED MANAGEMENT OF CASH WITH WORKING CAPITAL OF LESS THAN -€100 MILLION
INCREASE DECREASE STABLE
2020 OBJECTIVES WERE SET IN JUNE 2016 AND USE FY2015 AS THE BASE YEAR.
192018 INTEGRATED ANNUAL REPORTSR
CG
FS
SSR
SI
What we said we would do · Expand price/mix in all our segments
Challenges in 2018 · Significant price increases taken in 2017
in Nigeria meant we entered the year with a high base
· The discontinuation of our distribution of the Brown-Forman products in Russia
What we did in 2018 · Took pricing where possible
· Improved package mix by 170bp
· Improved category mix with faster growth from sparkling and energy, and a focus on value in juices and water
Priorities for 2019 · Continued improvement in package and
category mix along with price increases
· More effective management of promotions
Risk management approachAddressed under principal risks
· Channel mix and Declining consumer demand
See more on pages 74-76
Delivered throughOur customers
Our consumers
Our communities
See more on pages 34-53
What we said we would do · Grow volumes in all our segments with
an acceleration in the Emerging segment
Challenges in 2018 · Weak economic expansion in Nigeria
· Sugar tax implementation in Ireland
· Declines in the non-alcoholic ready-to-drink market in Italy
What we did in 2018 · Accelerated the pace of launches
of new products and brands
· Re-booted our route to market
· Returned sparkling to 4.3% growth, the fastest expansion in a decade
· Returned ready-to-drink tea to growth with the launch of FUZETEA
Priorities for 2019 · Maintain the momentum
· Continue to roll out and embed our new launches
· Ongoing focus on low- and no-calorie beverages, as well as adults which are renewing growth in the sparkling category
Risk management approachAddressed under principal risks
· Consumer health and Channel mix
See more on pages 74-76
Delivered throughOur consumers
Our customers
See more on pages 40-53
2016
Key performance indicators we track · Volume growth
See more on page 22
Key performance indicators we track · Currency-neutral net sales revenue
per case growth
· Currency-neutral net sales revenue growth
See more on page 22
Focus on value
Drive volume growth
PROGRESS AGAINST OUR STRATEGYWe are proud of our achievements in 2018 against our strategy,
and look to 2019 with determination to deliver another strong year.
20 COCA-COLA HBC OUR STRATEGY AND KPIs CONTINUED

What we said we would do · Continue to invest in revenue-generating
assets and innovative technology
· Acquire complementary non-sparkling brands in our existing territory
· Maintain discipline to ensure return on the capital invested
Challenges in 2018 · Potential acquisition targets were either
not available or did not meet our strategic and financial criteria
What we did in 2018 · Increased our investment in coolers,
including smart coolers by €120 million
· Invested in new PET lines in Nigeria
· Invested in a line for AdeZ and one for GLACÉAU smartwater
Priorities for 2019 · Invest to support the growth we are
seeing in our markets
· Invest in our people and digital capabilities
· Continue to look for value-enhancing M&A
Risk management approachManaged as an operational risk by the business units and functions in line with our risk management processes
Delivered throughPartners in efficiency
Our consumers
See more on pages 54-62, 40-47
What we said we would do · Control our costs, allowing operating
leverage to drive an improvement in margins
· Gain further efficiencies in our operating cost base
· Procure and use all resources efficiently with consideration of our environmental impact
Challenges in 2018 · Higher aluminium and PET resin prices
· Rising transport costs in certain Central and Eastern European countries
· The depreciation of the Russian rouble
What we did in 2018 · Followed our hedging policies which
insulated our cost base from fluctuations in sugar and aluminum pricing, and the Russian rouble
· Maintained cost discipline which allowed operating costs as a percentage of revenues to decline 20bp in 2018, even as marketing investments increasing 30bp as a percentage of revenues
· Launched new sustainability commitments for 2025
· Optimised our production and logistics in Nigeria
Priorities for 2019 · Continued cost discipline
· Ongoing optimisation of production, logistics and distribution
Risk management approachManaged as an operational risk by the business units and functions in line with our risk management processes
Delivered throughPartners in efficiency
Our communities
See more on pages 54-62, 34-39
2020
Key performance indicators we track · OpEx as percentage of net sales revenue
· Comparable EBIT margin
See more on page 23
Key performance indicators we track · CapEx as percentage of net sales revenue
· ROIC
See more on page 23
Invest in the business
Improve efficiency
Progress to date
2018
212018 INTEGRATED ANNUAL REPORTSR
CG
FS
SSR
SI

A STRONG TRACK RECORD
Underpinned by our focus on sustainability and our peopleOperating sustainably is not just the right thing to do, it is a direct benefit to the Company’s profitability and the potential of our people.
The quality and diversity of our people, and their engagement, is a key enabler of our business performance.
How we measure our performanceWe measure savings made through careful use of water and energy.
We track the percentage of our employees responding positively to a Group-wide engagement survey and the percentage of women in management.
How we measure our progressVolume is measured in million unit cases sold, where one unit case represents 5.678 litres.
How we measure our progressNet sales revenue (NSR) comprises revenues from Coca-Cola HBC’s primary activities. We track this on a currency-neutral basis.
What happened in the yearIn 2018, we made €2.6 million of savings in energy use and a further €0.5 million savings in water use.
Based on survey results, the employee engagement score was 88% in 2018. Women make up 37% of our managers, 35% of our senior leaders and 23% of our Board of Directors.
What happened in the yearVolume grew 4.2%, with growth in all segments and acceleration in the pace of growth from the Developed and Emerging segments. All key categories grew volume.
What happened in the yearCurrency-neutral net sales revenue per case grew 1.7% with growth in all segments, supported by better price, package and category mix.
Link to remunerationVolume is a measure for MIP awards.
Page 138
Link to remunerationNet sales revenue is a financial measure for MIP awards
Page 138
Drive volume growth
Focus on value
KPIs
Volume (m unit cases) Volume growth (%)
0
500
1,000
1,500
2,000
2,500
2,19
2
2,10
4
2,05
8
2016 2017 2018 0
2
4
6
4.2
2.2
0.1
2016 2017 2018
KPIs
Currency-neutral revenue per case growth (%)
Currency-neutral revenue growth (%)
0
2
4
6
1.7
3.6
2.9
2016 2017 2018 0
2
4
6
6.0
5.9
3.0
2016 2017 2018
In June 2016, we set out strategic objectives for the business accompanied by financial targets and specific KPIs with which to measure our progress.
22 COCA-COLA HBC OUR STRATEGY AND KPIs CONTINUED

How we measure our progressOpEx (operating expenses) as a percentage of net sales revenue is calculated by dividing comparable operating expenses by total net sales revenue.
Comparable EBIT margin refers to comparable profit before tax excluding finance income or cost and share of results of equity method investments divided by net sales revenue.
How we measure our progressWorking capital is operating current assets minus operating current liabilities, excluding financing and investment activities.
CapEx (capital expenditure) is calculated as a percentage of NSR.
Return on invested capital (ROIC) is comparable net profit excluding net finance costs divided by capital employed (net debt + shareholders’ equity averaged through the year)
What happened in the yearOperating leverage resulted in a 20 basis-point reduction in OpEx as a percentage of revenue. This, combined with the improvement in gross margin, gave us a 70 basis-point expansion in comparable EBIT margin.
What happened in the yearWe kept the year-end working capital balance sheet position under negative €100 million. We increased capital expenditure to 6.4% of revenue to support the growth opportunities in our business.
Link to remunerationOpEx as a percentage of NSR and comparable EBIT are financial measures for MIP awards.
Page 138
Link to remunerationWorking capital acts as a qualifier for the volume MIP payout. ROIC is a financial measure for PSP awards.
Page 138
KPIs
Improve efficiency
Invest in the business
KPIs
OpEx as percentage of NSR (%) Comparable EBIT margin (%)
0
10
20
30
27.7
27.9
28.2
2016 2017 2018 0
2
4
6
8
10
12
10.2
9.5
8.3
2016 2017 2018
KPIs
CapEx as percentage of NSR (%) ROIC (%)
0
2
4
6
8
6.4
5.8
5.3
2016 2017 2018 0
5
10
15
13.7
12.4
10.3
2016 2017 2018
Employee engagement score (%)
0
20
40
60
80
100
888988
2016 2017 2018
Women in management (%)Energy savings (€ millions)
0
1
2
3
2.60
1.56
2.44
2016 2017 2018 0
10
20
30
40
373533
2016 2017 2018
232018 INTEGRATED ANNUAL REPORTSR
CG
FS
SSR
SI

Climate and renewable energy
50% carbon ratio reduction in direct operations
45% carbon ratio reduction in direct operations achieved
30% reduce carbon ratio in direct operations
25% carbon ratio reduction in value chain
25% carbon ratio reduction in value chain achieved
50% increase in energy-efficient refrigerators to half of our coolers in the market
40% of total energy from renewable and clean sources**
41% of total energy from renewable and clean sources achieved
50% of our total energy from renewable and clean sources
100% total electricity used in EU&CH from renewable and clean energy
Water use and stewardship
30% water ratio reduction in operations
22% water ratio reduction in operations achieved
20% water reduction in plants located in water-risk areas
100% certification of all plants in water stewardship
60% of 53 plants certified 100% help secure water availability for all our communities in water-risk areas
World Without Waste
40% of packaging to be recovered for recycling
45% of packaging recovered for recycling
75% help collect the equivalent of 75% of our primary packaging
20% of PET used in the Group to be recycled PET and/or PET from renewable materials
9% PET used is recycled PET and/or PET from renewable materials
35% of total PET used from recycled PET and/or PET from renewable material
25% reduction in the amount of material used for main primary packaging***
19% reduction in the amount of material used for main primary packaging
100% of consumer packaging to be recyclable**
Ingredient sourcing >95%
of key agricultural ingredients will be certified against the Sustainable Agriculture Guiding Principles
64%are now certified against the Sustainable Agriculture Guiding Principles
100%of our key agricultural ingredients sourced in line with sustainable agricultural principles
Nutrition 10% reduction in added sugar per 100 ml of sparkling beverage in EU&CH vs. 2015
8%reduction achieved in added sugar per 100 ml of sparkling beverage in EU&CH vs. 2015
25% reduce calories per 100ml of sparkling soft drinks (all CCH countries)***
Our people and communities
2% investment of our annual pre-tax profit in communities
1.3% investment in communities 10% community participants in first-time managers’ development programmes
1 MIL train 1 million young people through #Youth Empowered
20 engage in 20 Zero Waste partnerships (city and/or coast)
10% of employees will be participating in volunteering initiatives during work time
21% of employees participated in volunteering
10% of employees take part in volunteering initiatives
ZER0 target zero fatalities and reduce (lost time) accident rate by 50%
50% of managers are women
OUR 2025 SUSTAINABILITY COMMITMENTS
2020 targets* 2018 achievements
******
Baseline 2010
Clean source means CHP
Packaging mix evolution neutral vs. 2010
Achieved
Well on track
New target introduced
24 COCA-COLA HBC OUR 2025 SUSTAINABILITY COMMITMENTS

Climate and renewable energy
50% carbon ratio reduction in direct operations
45% carbon ratio reduction in direct operations achieved
30% reduce carbon ratio in direct operations
25% carbon ratio reduction in value chain
25% carbon ratio reduction in value chain achieved
50% increase in energy-efficient refrigerators to half of our coolers in the market
40% of total energy from renewable and clean sources**
41% of total energy from renewable and clean sources achieved
50% of our total energy from renewable and clean sources
100% total electricity used in EU&CH from renewable and clean energy
Water use and stewardship
30% water ratio reduction in operations
22% water ratio reduction in operations achieved
20% water reduction in plants located in water-risk areas
100% certification of all plants in water stewardship
60% of 53 plants certified 100% help secure water availability for all our communities in water-risk areas
World Without Waste
40% of packaging to be recovered for recycling
45% of packaging recovered for recycling
75% help collect the equivalent of 75% of our primary packaging
20% of PET used in the Group to be recycled PET and/or PET from renewable materials
9% PET used is recycled PET and/or PET from renewable materials
35% of total PET used from recycled PET and/or PET from renewable material
25% reduction in the amount of material used for main primary packaging***
19% reduction in the amount of material used for main primary packaging
100% of consumer packaging to be recyclable**
Ingredient sourcing >95%
of key agricultural ingredients will be certified against the Sustainable Agriculture Guiding Principles
64%are now certified against the Sustainable Agriculture Guiding Principles
100%of our key agricultural ingredients sourced in line with sustainable agricultural principles
Nutrition 10% reduction in added sugar per 100 ml of sparkling beverage in EU&CH vs. 2015
8%reduction achieved in added sugar per 100 ml of sparkling beverage in EU&CH vs. 2015
25% reduce calories per 100ml of sparkling soft drinks (all CCH countries)***
Our people and communities
2% investment of our annual pre-tax profit in communities
1.3% investment in communities 10% community participants in first-time managers’ development programmes
1 MIL train 1 million young people through #Youth Empowered
20 engage in 20 Zero Waste partnerships (city and/or coast)
10% of employees will be participating in volunteering initiatives during work time
21% of employees participated in volunteering
10% of employees take part in volunteering initiatives
ZER0 target zero fatalities and reduce (lost time) accident rate by 50%
50% of managers are women
New 2025 commitments* How we got here
Our 2025 sustainability commitments confirm that sustainability is embedded in our business strategy, driven by the expertise of our employees and partners and their commitment to sustainable practices and performance.
See pages 68-71 for how these align to our material issues and SDGs
Laying the groundwork for greater impactCoca-Cola HBC is a sustainability leader in the beverage industry. Our Company ranked in the top three of both the global and European beverage industry leagues in the 2018 Dow Jones Sustainability Indices, a global benchmark of sustainability, after having been the industry leader for the past four years. We received additional recognition in other sustainability benchmarks, such as CDP, FTSE4Good and MSCI ESG.
For our current sustainability targets, we are approaching our 2020 timeline. Therefore, this year we introduced 17 new 2025 sustainability commitments, addressing six key areas along our value chain, by following our materiality approach: reducing emissions; water use and stewardship; World Without Waste; ingredient sourcing; nutrition; and our people and communities.
These commitments set stretching targets for our Company and our people. As an example, we have almost doubled our 2025 target for collecting the equivalent of our primary product packaging compared to 2020 target.
With this higher level of ambition, we are stepping up efforts to contribute to the Coca-Cola System goal of collecting and recycling the equivalent of every bottle or can sold globally by 2030. Our 2025 commitments also represent a shift in our focus, more emphasising outputs and impacts rather than inputs. In this context, we have discontinued our practice of setting a target for investing a specific percentage annual pre-tax profit in community programmes, as this commitment in itself doesn’t ensure that we are creating a positive impact on our communities. Therefore, we have introduced new community commitments to train one million young people, to help secure water availability in water-risk areas as well as engage in zero waste partnerships.
We are very proud that we have achieved our 2020 carbon emissions reduction goal in the value chain (approved science-based target), reaching 25% reduction in 2018, and our renewable and clean energy commitment. In addition, we achieved our target of 40% of our packaging being collected and recycled by 2017.
We are making good progress on our commitments related to water reduction in our direct operations and water stewardship certifications. By means of our 2025 commitments, we will focus more in water risk communities.
On track with the UNESDA pledge on sugar reduction per 100ml of our carbonated beverages, for 2025 we have a new goal for calorie reduction in sparkling drinks portfolio.
* Baseline 2017** Technical recyclability by design*** Baseline 2015
252018 INTEGRATED ANNUAL REPORTSR
CG
FS
SSR
SI

IN GOOD COMPANY WITH
26 COCA-COLA HBC

CREATING AN INSPIRING WORKPLACE FOR OUR PEOPLEOur people are among our closest and most important stakeholders. To support sustained business success, we offer an inspiring workplace with opportunities to learn, develop and achieve great results.
2018 progress · Further improved the talent pool and
succession bench for our key positions
· Invested in building the Company employer brand and sourcing and recruitment capabilities to attract and hire the best people into the key positions
· Further improved our revenue growth management and route-to-market capabilities, invested in building Big Data and Advanced Analytics capabilities
· Continued digitalising learning and development and simplifying our processes for speed and employee experience as a source of engagement and customer service
2019 priorities · Continue making our business more
agile and innovative
· Further develop skills and capabilities to take advantage of growth opportunities
· Make talent development our lighthouse capability which each leader should rank highly
· Maintain employee engagement and commitment to Company values, and achieve more through learning, inclusion and a superior employee experience
272018 INTEGRATED ANNUAL REPORTSR
CG
FS
SSR
SI
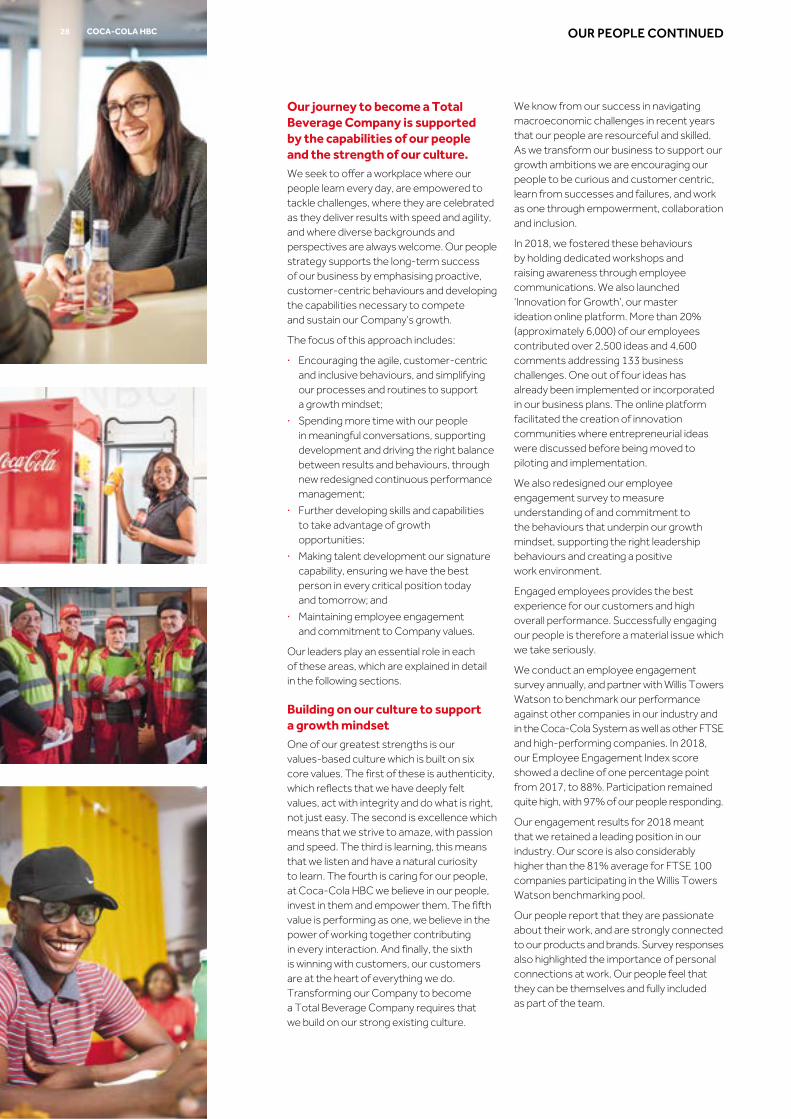
We know from our success in navigating macroeconomic challenges in recent years that our people are resourceful and skilled. As we transform our business to support our growth ambitions we are encouraging our people to be curious and customer centric, learn from successes and failures, and work as one through empowerment, collaboration and inclusion.
In 2018, we fostered these behaviours by holding dedicated workshops and raising awareness through employee communications. We also launched ‘Innovation for Growth’, our master ideation online platform. More than 20% (approximately 6,000) of our employees contributed over 2,500 ideas and 4,600 comments addressing 133 business challenges. One out of four ideas has already been implemented or incorporated in our business plans. The online platform facilitated the creation of innovation communities where entrepreneurial ideas were discussed before being moved to piloting and implementation.
We also redesigned our employee engagement survey to measure understanding of and commitment to the behaviours that underpin our growth mindset, supporting the right leadership behaviours and creating a positive work environment.
Engaged employees provides the best experience for our customers and high overall performance. Successfully engaging our people is therefore a material issue which we take seriously.
We conduct an employee engagement survey annually, and partner with Willis Towers Watson to benchmark our performance against other companies in our industry and in the Coca-Cola System as well as other FTSE and high-performing companies. In 2018, our Employee Engagement Index score showed a decline of one percentage point from 2017, to 88%. Participation remained quite high, with 97% of our people responding.
Our engagement results for 2018 meant that we retained a leading position in our industry. Our score is also considerably higher than the 81% average for FTSE 100 companies participating in the Willis Towers Watson benchmarking pool.
Our people report that they are passionate about their work, and are strongly connected to our products and brands. Survey responses also highlighted the importance of personal connections at work. Our people feel that they can be themselves and fully included as part of the team.
Our journey to become a Total Beverage Company is supported by the capabilities of our people and the strength of our culture.We seek to offer a workplace where our people learn every day, are empowered to tackle challenges, where they are celebrated as they deliver results with speed and agility, and where diverse backgrounds and perspectives are always welcome. Our people strategy supports the long-term success of our business by emphasising proactive, customer-centric behaviours and developing the capabilities necessary to compete and sustain our Company’s growth.
The focus of this approach includes:
· Encouraging the agile, customer-centric and inclusive behaviours, and simplifying our processes and routines to support a growth mindset;
· Spending more time with our people in meaningful conversations, supporting development and driving the right balance between results and behaviours, through new redesigned continuous performance management;
· Further developing skills and capabilities to take advantage of growth opportunities;
· Making talent development our signature capability, ensuring we have the best person in every critical position today and tomorrow; and
· Maintaining employee engagement and commitment to Company values.
Our leaders play an essential role in each of these areas, which are explained in detail in the following sections.
Building on our culture to support a growth mindsetOne of our greatest strengths is our values-based culture which is built on six core values. The first of these is authenticity, which reflects that we have deeply felt values, act with integrity and do what is right, not just easy. The second is excellence which means that we strive to amaze, with passion and speed. The third is learning, this means that we listen and have a natural curiosity to learn. The fourth is caring for our people, at Coca-Cola HBC we believe in our people, invest in them and empower them. The fifth value is performing as one, we believe in the power of working together contributing in every interaction. And finally, the sixth is winning with customers, our customers are at the heart of everything we do. Transforming our Company to become a Total Beverage Company requires that we build on our strong existing culture.
OUR PEOPLE CONTINUEDCOCA-COLA HBC28

Our people asked for further simplification of processes and they see opportunities to be more empowered to find better ways of performing their work.
Going forward, especially in light of the 2018 survey results, we will also ask our people to suggest ways to address the concerns that surfaced in the survey, ensuring we remain an organisation with high engagement and strong growth.
Our performance framework also aligns with our core values. In managing team and individual performance, we apply an iterative ‘plan, act and review’ cycle to continuously improve. This allows us to bridge our strategy and its execution by aligning priorities across functions and teams.
To ensure that our people balance short- and long-term objectives, in addition to planning and assessing performance against financial objectives, we also plan and measure achievement for fostering partnerships, innovation, people leadership, managing resources and compliance with policies and procedures.
We aim to further simplify elements of our performance framework and improve our ability to support growth by fostering ongoing conversations between managers and team members about priorities, goals, progress and lessons learned. Because continuous learning supports development and improves performance, we also facilitate real-time feedback from employees’ networks.
Employee engagement: outperforming peer companies (%)
60
66
72
78
84
90
16 17 18 18 18 18 18 18
CC
HB
C 8
8
CC
HB
C 8
9
CC
HB
C 8
8
Hig
h-pe
rfo
rmin
g no
rm 8
9
Co
ca-C
ola
bo
ttle
rs 8
6
Co
ca-C
ola
Sys
tem
85
FTS
E 10
0 8
0
FMC
G n
orm
81SANDA
PAREZANOVICGROUP HUMAN RESOURCES DIRECTOR
PETROS PAPAGEORGIOUCHANNEL SALES MANAGER
Petros Papageorgiou is one of the Company’s employees who benefited from our Fast Forward programme.Petros is a Channel Sales Manager in Italy. He has recently completed our Fast Forward programme, an experiential learning programme for people with leadership potential and an aim to progress to a function head role.
What has helped you to become a candidate for a promotion?My job is to help the 400 business developers on my team serve our 9,000 customers successfully through activating our full portfolio. What has made the difference was communicating the strategy so that our people understand our priorities, involving customers in developing our plans, and removing internal barriers which keep business developers from serving our customers. This way, I achieved both revenue and profit targets, as well as increases in customer satisfaction and employee engagement numbers.
On a personal level, the skills learned going through the Fast Forward programme are very relevant for what I would need for my next role. I knew that the majority of employees who go through this programme earn promotions within a year of graduating, so I was very interested in participating.
How does the Fast Forward programme help you to accelerate your development?The Fast Forward programme has taught me to reflect and ask for feedback. This helps me avoid making the same mistakes twice, so I’ve been able to achieve more and become more effective. It has helped me develop future business scenarios and anticipate the implications. By participating in Fast Forward, I also got to work on a cross-country project assignment on evolving our field sales as we transform into a Total Beverage Company and got exposure to the work of the country senior leadership team. This has made me more comfortable with new business situations, helped me to make better decisions in complex situations, and to become better at serving our customers.
Response from Sanda Parezanovic In addition to nurturing the full potential of our people, we consider building a pipeline of future leaders critical for our growth. The Fast Forward programme is designed to provide exposure to professional experiences that are not available at an employee’s current job. These are complemented with mentoring from senior leaders, coaching from experienced professionals and extensive skill building modules. This experiential learning programme has a strong track record of accelerating development of our talent towards senior leadership roles.
In 2018, our talent management practices were recognized by the Chief Learning Officer Learning in Practice awards with a Silver Talent Management Award.
292018 INTEGRATED ANNUAL REPORTSR
CG
FS
SSR
SI
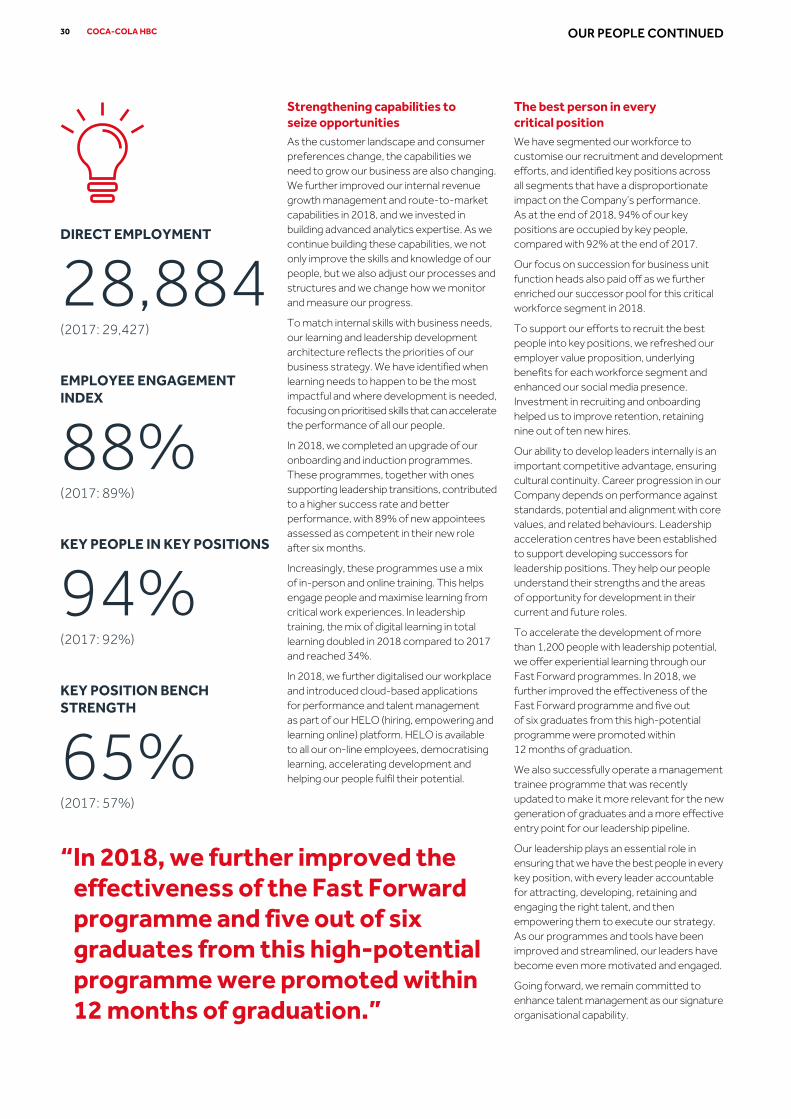
Strengthening capabilities to seize opportunitiesAs the customer landscape and consumer preferences change, the capabilities we need to grow our business are also changing. We further improved our internal revenue growth management and route-to-market capabilities in 2018, and we invested in building advanced analytics expertise. As we continue building these capabilities, we not only improve the skills and knowledge of our people, but we also adjust our processes and structures and we change how we monitor and measure our progress.
To match internal skills with business needs, our learning and leadership development architecture reflects the priorities of our business strategy. We have identified when learning needs to happen to be the most impactful and where development is needed, focusing on prioritised skills that can accelerate the performance of all our people.
In 2018, we completed an upgrade of our onboarding and induction programmes. These programmes, together with ones supporting leadership transitions, contributed to a higher success rate and better performance, with 89% of new appointees assessed as competent in their new role after six months.
Increasingly, these programmes use a mix of in-person and online training. This helps engage people and maximise learning from critical work experiences. In leadership training, the mix of digital learning in total learning doubled in 2018 compared to 2017 and reached 34%.
In 2018, we further digitalised our workplace and introduced cloud-based applications for performance and talent management as part of our HELO (hiring, empowering and learning online) platform. HELO is available to all our on-line employees, democratising learning, accelerating development and helping our people fulfil their potential.
The best person in every critical positionWe have segmented our workforce to customise our recruitment and development efforts, and identified key positions across all segments that have a disproportionate impact on the Company’s performance. As at the end of 2018, 94% of our key positions are occupied by key people, compared with 92% at the end of 2017.
Our focus on succession for business unit function heads also paid off as we further enriched our successor pool for this critical workforce segment in 2018.
To support our efforts to recruit the best people into key positions, we refreshed our employer value proposition, underlying benefits for each workforce segment and enhanced our social media presence. Investment in recruiting and onboarding helped us to improve retention, retaining nine out of ten new hires.
Our ability to develop leaders internally is an important competitive advantage, ensuring cultural continuity. Career progression in our Company depends on performance against standards, potential and alignment with core values, and related behaviours. Leadership acceleration centres have been established to support developing successors for leadership positions. They help our people understand their strengths and the areas of opportunity for development in their current and future roles.
To accelerate the development of more than 1,200 people with leadership potential, we offer experiential learning through our Fast Forward programmes. In 2018, we further improved the effectiveness of the Fast Forward programme and five out of six graduates from this high-potential programme were promoted within 12 months of graduation.
We also successfully operate a management trainee programme that was recently updated to make it more relevant for the new generation of graduates and a more effective entry point for our leadership pipeline.
Our leadership plays an essential role in ensuring that we have the best people in every key position, with every leader accountable for attracting, developing, retaining and engaging the right talent, and then empowering them to execute our strategy. As our programmes and tools have been improved and streamlined, our leaders have become even more motivated and engaged.
Going forward, we remain committed to enhance talent management as our signature organisational capability.
“In 2018, we further improved the effectiveness of the Fast Forward programme and five out of six graduates from this high-potential programme were promoted within 12 months of graduation.”
DIRECT EMPLOYMENT
28,884(2017: 29,427)
EMPLOYEE ENGAGEMENT INDEX
88%(2017: 89%)
KEY PEOPLE IN KEY POSITIONS
94%(2017: 92%)
KEY POSITION BENCH STRENGTH
65%(2017: 57%)
30 COCA-COLA HBC OUR PEOPLE CONTINUED

Leveraging our diverse strengths, and championing human rightsDiverse teams mirroring our consumer and customer base bring different perspectives to decision-making, leading to innovative new ideas that make us an irreplaceable partner. We believe that it is vital for us to attract and retain the best, diverse workforce.
Respect for individuals is at the core of our values and we foster behaviours that create an inclusive culture. These behaviours can be found in our formal Inclusion and Diversity Policy, our Code of Business Conduct and our Human Rights Policy which can be found here: https://coca-colahellenic.com/en/about-us/policies.
One of our 2025 sustainability commitments is to achieve full gender balance in managerial positions. Achieving full gender balance requires a strong pipeline of female leaders and a support network to help women in our business to share their experiences and to find solutions to common challenges. We have already been making progress, increasing the percentage of management roles held by women by 2%, to 37% in 2018 compared to 35% in 2017.
We foster diversity in our talent pipeline by recruiting a balanced number of male and female management trainees. In keeping with this approach, 55% of the management trainees we hired in 2018 were women.
In 2018, we launched a women’s network toolkit to promote the establishment of such groups within our countries, building on the success of our women’s networks in Ireland and Nigeria. We have found network events to connect and empower participants, and give women a sense of belonging, as well as foster their professional development.
Talent pipeline improved2018 2017
Key people in key positions (KPo) 94% 92% Key position succession rate 0.86 0.69 Key position bench strength (% of key positions with successors ready now or within the year) 65% 57% Turnover of key people 5% 6% Total turnover rate 13% 13% Management trainees 123 181 Participants in Fast Forward programme 653 612 Promotion rate for Fast Forward programme participants 84% 75% Total number of employees in leadership acceleration centres 5,027 5,596 % of workforce covered during annual people review 53% 53%
To create a culture where everyone can be themselves, speak freely, have their views heard, reach their full potential and be equally valued, we are about to launch a new programme to support our leaders to become ambassadors of inclusion. Ambassadors develop an enhanced awareness and understanding of cultural dynamics which affect individuals, workplaces, and whole societies. Better understanding supports better decisions, smarter innovation and more productive teams.
Our Human Rights Policy is guided by international human rights principles, such as the International Labour Organization’s international labour standards and the UN Guiding Principles on Business and Human Rights (also known as the Ruggie Framework), and covers diversity, collective bargaining and workplace security. Our Supplier Guiding Principles are also aligned with our Human Rights Policy and we expect our partners to respect the same workplace values as we do.
Regular reviews ensure that we adhere to all applicable laws and regulations, our Code of Business Conduct and internal standards. Certification on a regular basis confirms that we are in legal compliance, processes are well implemented, targets are set and reached, and reporting is timely and accurate. In 2018, we introduced a training on our human rights policy and we have a full compliance approach in this area. In addition, we have a well-publicised whistleblower system, with all contacts investigated. We are pleased that Coca-Cola HBC received no fines for non-compliance with human rights-related laws and regulations in 2018.
SR
CG
FS
SSR
SI
31
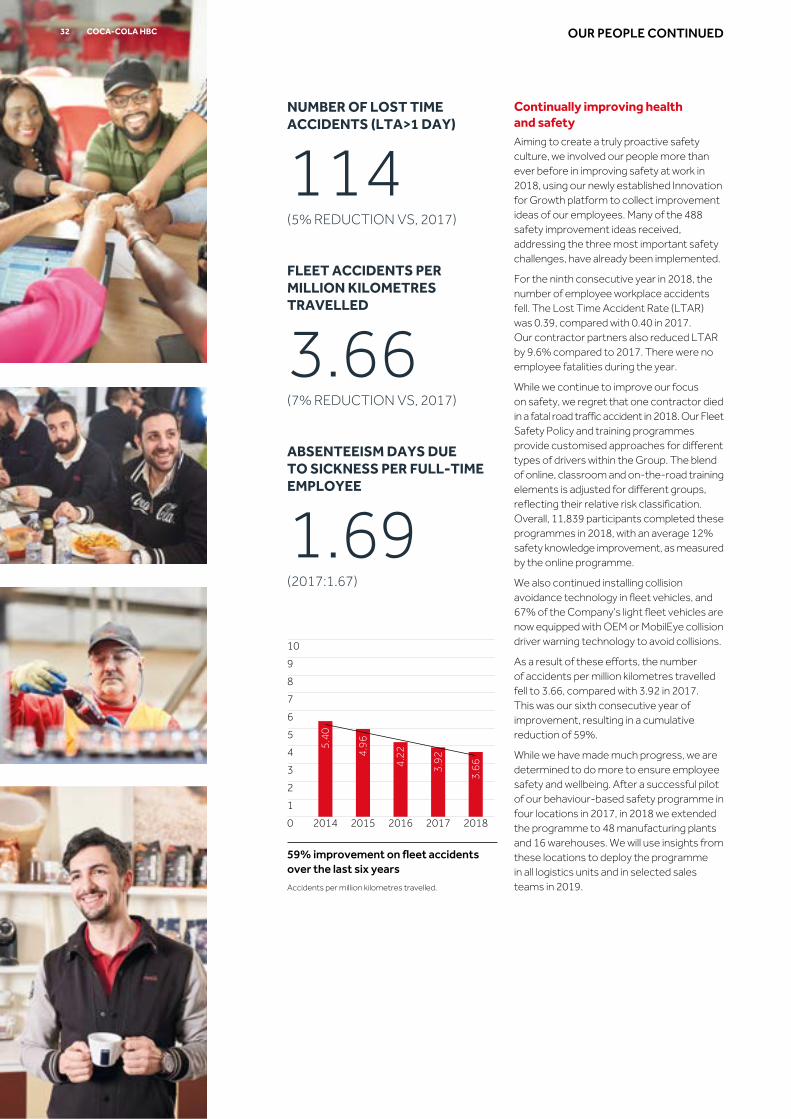
NUMBER OF LOST TIME ACCIDENTS (LTA>1 DAY)
114(5% REDUCTION VS, 2017)
FLEET ACCIDENTS PER MILLION KILOMETRES TRAVELLED
3.66(7% REDUCTION VS, 2017)
ABSENTEEISM DAYS DUE TO SICKNESS PER FULL-TIME EMPLOYEE
1.69(2017:1.67)
59% improvement on fleet accidents over the last six years
Accidents per million kilometres travelled.
0
1
2
3
4
5
6
7
8
9
10
2014 2015 2016 2017 2018
5.40
4.96
4.22
3.92
3.66
Continually improving health and safetyAiming to create a truly proactive safety culture, we involved our people more than ever before in improving safety at work in 2018, using our newly established Innovation for Growth platform to collect improvement ideas of our employees. Many of the 488 safety improvement ideas received, addressing the three most important safety challenges, have already been implemented.
For the ninth consecutive year in 2018, the number of employee workplace accidents fell. The Lost Time Accident Rate (LTAR) was 0.39, compared with 0.40 in 2017. Our contractor partners also reduced LTAR by 9.6% compared to 2017. There were no employee fatalities during the year.
While we continue to improve our focus on safety, we regret that one contractor died in a fatal road traffic accident in 2018. Our Fleet Safety Policy and training programmes provide customised approaches for different types of drivers within the Group. The blend of online, classroom and on-the-road training elements is adjusted for different groups, reflecting their relative risk classification. Overall, 11,839 participants completed these programmes in 2018, with an average 12% safety knowledge improvement, as measured by the online programme.
We also continued installing collision avoidance technology in fleet vehicles, and 67% of the Company’s light fleet vehicles are now equipped with OEM or MobilEye collision driver warning technology to avoid collisions.
As a result of these efforts, the number of accidents per million kilometres travelled fell to 3.66, compared with 3.92 in 2017. This was our sixth consecutive year of improvement, resulting in a cumulative reduction of 59%.
While we have made much progress, we are determined to do more to ensure employee safety and wellbeing. After a successful pilot of our behaviour-based safety programme in four locations in 2017, in 2018 we extended the programme to 48 manufacturing plants and 16 warehouses. We will use insights from these locations to deploy the programme in all logistics units and in selected sales teams in 2019.
OUR PEOPLE CONTINUEDCOCA-COLA HBC32

UN Sustainable Development GoalsEfforts to foster an engaging workplace, nurture and develop the capabilities of our people, increase gender balance in our management ranks and reduce stress and support employee wellbeing all contribute toward global goals for development. The specific Sustainable Development Goals supported are those for: good health and wellbeing; gender equality; decent work and economic growth; reducing inequalities; and peace, justice and strong institutions.
This behaviour-based programme complements safety reviews, our safety recognition programmes and our annual safety week. In 2018, we extended our full-scope safety assessments to sales and conducted baseline assessments in 11 locations. We also continued raising awareness of successful practices. Our 2018 safety week provided helpful information on driving safety, manual handling, falls and slips, as well as fire safety.
Support for wellbeingAt Coca-Cola HBC, all of our employees have access to a range of health and wellbeing programmes. Our approach to employee wellbeing exemplifies our values, and enhances engagement and productivity.
Different programmes and benefits are offered to employees in different countries. Initiatives supporting physical wellbeing include: employee medical and health insurance benefits; preventative health measures such as vaccination programmes and cancer screening; on-site gym facilities and subsidised gym memberships; and nutrition information.
To help employees financially, we offer benefits such as pensions, a savings scheme and life insurance, and assistance with financial planning and literacy. Emotional wellbeing is addressed through on-site counselling, relaxation techniques, and energy balance programmes, while social wellbeing is supported with events for families and employee bonding and team building.
We have developed a Health and Dependent Care Framework, and, in each of our countries, employees are offered at least one programme option for both health and dependent care. Healthcare initiatives include: medical and health insurance benefits; preventative measures such as vaccination programmes and cancer screening; gym facilities or subsidised gym memberships; and nutrition information. We also offer our people a range of dependent care initiatives, including dependent care leave, subsidies for school activities and supplies, internships and career days.
At the Group level, we have a wellbeing toolkit for countries with best practice approaches for developing holistic employee wellbeing programmes. We have also introduced a guide to help managers recognise, prevent and manage work and personal stress in themselves and their teams. Training is also provided for this, using a ‘train the trainer’ approach.
“Our approach to employee wellbeing exemplifies our values, and enhances engagement and productivity.”
332018 INTEGRATED ANNUAL REPORTSR
CG
FS
SSR
SI

IN GOOD COMPANY WITH
COCA-COLA HBC34

BUILDING TRUSTWe are an active part of the communities we live and operate in. Several of our new 2025 sustainability commitments describe how we are engaging with them. In order to amplify our impact as a System, we have aligned a joint community investment approach with The Coca-Cola Company.
2018 progress · €7.9 million invested in community
programmes, 7% more than in 2017
· More than 64,000 young people participants in #Youth Empowered
· More than 34,000 hours volunteered by employees in both free time and work time
· More than 1,400 tonnes of waste collected by our employee volunteers and partners on river and sea shores, and in packaging collection schemes
· More than 5,000 trees planted
2019 priorities · Co-operate with companies with flexible
e-learning solutions in order to transition #Youth Empowered to an open-source educational platform
· Launch first wave of Zero Waste Partnerships, supported by country guidance
352018 INTEGRATED ANNUAL REPORTSR
CG
FS
SSR
SI

#Youth Empowered is designed to address both challenges.
Overall in 2018, more than 64,000 young people participated in #Youth Empowered programmes. More than 750 of our people became mentors through the initiative, and we partnered with more than 380 local non-governmental organisations.
The #Youth Empowered programme offers in-person and online training to help young people develop business acumen and personal life skills. In addition to this comprehensive training, we offer mentoring sessions with Coca-Cola HBC senior managers. As a result, programme participants are able to build professional and personal networks.
We tailor our approach to address specific needs and leverage collaboration with local partners, further strengthening the impact of the programme. In Poland, our new digital profiling test was completed by many young people, helping them understand their strengths and the skills needed for the local job market. In Nigeria, where the youth unemployment rate was approximately 25% in 2018, we held a three-day #Youth Empowered workshop for more than 1,000 participants from various parts of the country, all seizing the opportunity to work with seasoned professionals. In Greece and Cyprus, we joined forces with our retail partner Metro S.A. and other local and multinational companies to hold a three-day seminar for 250 young people. In Italy, we offered training in soft skills and business skills to more than 200 young people.
As part of our process of aligning initiatives, we also began linking #Youth Empowered with 5by20, The Coca-Cola Company’s global commitment to enable the economic empowerment of five million women entrepreneurs across the Company’s value chain by 2020. In 2018, we undertook efforts to support the economic empowerment of women entrepreneurs in countries in Central and Eastern Europe.
Global alignmentOver the years, our community investments have evolved from standalone philanthropic initiatives to long-term, Group-wide programmes closely linked to business priorities and material issues. We took steps in 2018 to align our community agenda with The Coca-Cola Company’s global priorities and initiatives. The size and reach of the Coca-Cola System has unique advantages in helping to address global challenges, including those in scope for the Sustainable Development Goals (SDGs).
While we continue to work on issues of local relevance in specific markets, we have prioritised three programme areas that are of critical importance across all of our 28 countries of operation: empowering youth and women; achieving a World Without Waste; and water stewardship initiatives.
We introduced country-level guidelines for community spending in 2018. Going forward, our markets will allocate their community budgets to reflect our programme priorities, with 40% directed to youth empowerment programmes, 30% to waste, 20% to water stewardship and 10% allocated for local initiatives. Our overall spending – €7,9 million in 2018 – shows we allocated 36% on youth, 10% on waste, 8% on water, and 46% on local programmes out of the total community investment. Five of our 17 new commitments for 2025 help to drive progress in the three prioritised programme areas of our updated community strategy:
· train one million young people through #Youth Empowered;
· engage in 20 Zero Waste partnerships (city and/or coast);
· help secure water availability for all our communities in water-risk areas;
· 10% community participants in first-time managers’ development programmes; and
· 10% of employees take part in volunteering initiatives.
Empowering youth and womenThrough our flagship programme #Youth Empowered, we have been tackling one of the most relevant societal issues in many of our markets, i.e. the employability of young people. Since introducing #Youth Empowered in 2017, we have rolled out this programme to nearly all of our markets. Markets with specific employment challenges, such as Greece, Italy and Bosnia-Herzegovina, create particular challenges for young people who are not in employment, education or training. In other countries with labour shortages, young people may enter the labour market without necessary business or soft skills.
OUR COMMUNITIES CONTINUEDCOCA-COLA HBC36

Strategic priorities for community investmentOver the years, our community investments have evolved from standalone philanthropic initiatives to long-term programmes aligned to three key strategic priorities:
· Youth and women
· World Without Waste
· Water stewardship
In addition, we are active in local wellbeing and emergency relief efforts, providing help in times of disaster, either directly or via our stakeholder partnerships.
To maximise the impact of our work with young people, we partner with key customers and suppliers, including Aristotelis Panteliadis from Metro S.A. in Greece.
What are the challenges facing the younger generation today?We Greeks have been seriously challenged in recent years, having faced one of the worst financial crises in the western world. Young people have been especially hard hit, with youth unemployment rates reaching 50% at some points. It is clear that this fact has challenged young people a lot.
What is the biggest benefit for young people participating in this programme?#Youth Empowered offers young people something unique that they could not gain from any other programme; an excellent opportunity to meet with CEOs and high-level executives from various companies, who can speak to them on a practical basis about the fundamentals of employment. This includes the essential skills for the job market, ways to pursue meaningful opportunities and how to prepare for a successful job interview. In fact, some of the participants from the programme have already begun working with us. We are pleased to have found new employees and we hope to find even more young people for our vacancies.
Why have you engaged in the #Youth Empowered initiative?Participating in #Youth Empowered gives us an opportunity to contribute something important to Greek society and, at the same time, co-operate further with Coca-Cola HBC. Our partnership in #Youth Empowered is the culmination of an excellent trade partnership. Companies that are true partners can join forces together and create a much more important legacy for the community.
We plan to expand our involvement, visiting more cities and meeting with more young people. I believe that with #Youth Empowered we are contributing to a positive change for the younger generation. We are still early in this journey and we have a lot more planned for the future.
Response from Nikos KalaitzidakisSince 2015, we have been supporting young people in our markets who are not in education, employment or training by providing skills, networks and access to mentors to help them gain a foothold on the employment ladder. While we are very proud of what we have accomplished through our #Youth Empowered programme, we think we can help even more young people. We have set ourselves a big goal of training one million young people by 2025 through the programme.
We will continue to work to place programme participants in positions either in our business or with our partners. For this purpose, we are seeking more employment opportunities throughout our value chain with key customers and suppliers, like Metro S.A.
ARISTOTELIS PANTELIADISCEO METRO S.A.
NIKOS KALAITZIDAKISREGION DIRECTOR
Total community investment 2018
Youth/Women: 36%Waste: 10%Water: 8%Local/Wellbeing: 46%
€7.9m
372018 INTEGRATED ANNUAL REPORTSR
CG
FS
SSR
SI

We also contributed to reforestation by planting more than 5,000 trees. In 2018, the equivalent of 45% of the total primary packaging we placed in the market was recovered for recycling through legally required and voluntary industry initiatives and our directly funded projects. This represents an improvement from 2017, when this number was 41%.
Water stewardshipMaintaining the long-term sustainability of the watersheds around our bottling plants is important to our business and to our relationships with local communities.
Our approach to water stewardship begins with a focus on our own water use. We protect the water resources supplying our facilities, reduce the amount of water we use to produce our soft drinks, and treat waste water to levels that support aquatic life. We also partner with suppliers to minimise our water footprint across the value chain.
To replenish the water we use and help water access through innovative sustainable technologies, we have a 2025 sustainability commitment to help secure water availability for all our communities in water-risk areas.
Using indicators from the World Wildlife Fund for Nature’s Water Risk Filter and Global Water Tool, we have identified 17 of our plants as operating in water-risk areas. This includes facilities in Nigeria, Russia, Greece, Cyprus and Armenia. Moving forward, we will focus on either water access initiatives or on replenishment activities. For all these, we will seek partnerships with the Coca-Cola System, other companies operating in the relevant watershed area and international organisations.
Local initiativesAlong with our three key programme areas, we address local issues, which have strategic relevance for our business. One example is community wellbeing, which we have supported by offering a rapidly expanding portfolio of low- and no-calorie beverage options.
We continue to support initiatives across our 28 countries to improve community wellbeing and health. We promote active, healthy lifestyles by installing active zones, walking trails and paths, and supporting sports events and social gatherings. As our business and product portfolio evolves, we expect that more of our impact on well-being will come directly from new products that support healthy lifestyles.
World Without WasteWhile modern packaging offers safety and convenience, the challenges of using plastics in packaging are clear. As part of the Coca-Cola System’s global World Without Waste framework, we partner with relevant stakeholders and local communities to help achieve a litter-free world by improving waste collection rates and helping change related consumer mindsets. Partnerships are vital because waste collection and recycling infrastructure varies considerably, and we cannot solve this challenge alone.
While we are committed to collecting and recycling 75% of the equivalent of every can or bottle we sell, we also invest in package design and innovation to reduce packaging content and are exploring packaging-free alternatives for product delivery. Our efforts to design better packaging are outlined in the Partners in efficiency section on pages 54-62.
Progress in collecting waste
As part of our approach to waste, we have committed to engage in 20 Zero Waste partnerships either with cities or along coastlines. We piloted this approach under the brand Zero Waste City with the City of Thessaloniki, Greece, and other partners during the year. Based on the first results, we will introduce guidelines in 2019 to facilitate more Zero Waste City partnerships in our markets.
We support 19 packaging waste management schemes across our markets and we have a Group-wide policy on packaging waste and recycling, which provides the framework within which our countries operate. In Russia, the ‘Separate with Us’ project has helped us recover more than 28% of our primary packaging placed in the market.
We also spearheaded initiatives to clean up coastlines. Nearly 100 of our people participated in an Adriatic Coast clean-up activity, collecting a total of 260kg of waste from the islands of Krk in Croatia and Strunjan in Slovenia.
Through a partnership project with International Ocean Conservancy, more than 400 Coca-Cola HBC people collected more than 500 bags of litter, or three tonnes of waste, on Ireland’s coast. We also partnered with Centra stores in the heart of coastal communities to encourage consumers to join the Big Beach Clean.
Overall during 2018, through projects supported by dedicated employee volunteers, we – together with our partners – collected more than 1,400 tonnes of waste on river and sea shores across our territories.
PRIMARY PACKAGING RECOVERED
45%(2017: 41%)
WASTE COLLECTED
1,400(TONNES)
Top 5 contributing countries to the #YouthEmpowered programmes*
* Based on number of #YE participants in 2018.
Nigeria: 24%Italy: 17%Ukraine: 10%Greece: 6%Hungary: 6%Other: 37%
more than64,000
participants
38 COCA-COLA HBC OUR COMMUNITIES CONTINUED

UN Sustainable Development GoalsOur community initiatives contribute to the Sustainable Development Goals (SDGs). Our initiatives to empower youth and women contribute to the goals for quality education, decent work and economic growth, sustainable cities and communities, and partnerships. Our initiatives regarding water stewardship and waste reduction aid global progress toward the SDGs for clean water and sanitation, and climate action. Wellbeing activities, such as the installation of walking trails, help advance the global objectives of good health and wellbeing, and sustainable cities and communities.
In natural disasters or crisis situations, we are often among the first companies supporting emergency services and communities with in-kind or cash contributions. When a series of wildfires erupted in Greece in July 2018, nearly 100 people were killed. We supported the survivors in the region by offering our products and refrigerators, blood, medicines and other essential items, and by contributing to rebuilding efforts. We supported a range of initiatives sponsored by local municipalities and non-governmental organisations, and more than 150 colleagues volunteered their time to help residents of the affected areas.
Key partnerships and stakeholder engagementWe strive for long-term partnerships with non-governmental organisations, customers, suppliers and other stakeholders to maximise the impact of community programmes. In 2018, we co-operated with nearly 400 non-governmental organisations and non-trade partners, including the International Federation of the Red Cross, the World Wide Fund for Nature, Junior Achievement, Teach for All and the Global Water Partnership.
Please see pages 10-11 for more about our ongoing stakeholder dialogues and partnerships.
VolunteeringBeyond our financial investments to address the pressing challenges described above, we enable our people to volunteer a portion of their work hours to support community programmes. This not only positively impacts our communities, but provides learning and development opportunities, and supports employee engagement and wellbeing. In 2018, our employees volunteered more than 34,000 hours in both free time (10,000 hours) and work time (24,000 hours) in support of strategic community programmes, with 21% taking part in volunteer initiatives.
Our 2019 prioritiesFollowing the announcement of our 2025 sustainability commitments and the joint community strategy, we will focus on building capacities and improving our measurement methodology. For community investments, we expect to see higher funding for waste initiatives relative to the overall spend.
As part of the business rationale for #Youth Empowered, our aim is to offer a number of job positions for programme participants either in our business or with our partners.
For this purpose, we will seek more employment opportunities throughout our value chain with key customers and suppliers.
We will also offer additional mentorship guidance for our senior managers.
We aim to expand the scope of participation in the programme in 2019 through strategic #Youth Empowered partnerships. We will particularly strive for co-operation with companies which will support us with flexible e-learning solutions in order to transition #Youth Empowered to an open-source educational platform. Besides this, we will further adapt the measurement methodology to better reflect actual achievements, i.e. from counting e-learning registrations to counting active users only.
For Zero Waste City partnerships, we will develop support material for our markets and launch the first wave of local initiatives next year. In water stewardship, we will focus on water access initiatives and replenishment activities. We will work closely with the Coca-Cola System, and we will start engaging with relevant local as well as international stakeholders.
Regarding community investments, we expect to see increased proportionate spendings behind the waste and the water areas next year.
SR
CG
FS
SSR
SI
39

IN GOOD COMPANY WITH
40 COCA-COLA HBC

INNOVATING OUR PORTFOLIO FOR OUR CONSUMERSAs we become a Total Beverage Company, we are unlocking growth potential in segments outside our core sparkling portfolio, offering consumers a wider choice of drinks to meet their needs and desires at any time of day and for different drinking moments. This supports our strategy to innovate in the sparkling category with The Coca‑Cola Company through reformulation of the recipes as health‑conscious consumers look for low‑ and no‑sugar options, and to introduce new flavours, innovative products with functional benefits as well as smaller, more convenient packages.
2018 progress · Achieved the highest pace of growth
in sparkling beverages in a decade, with further progress towards low- and no-calorie variants
· A return to growth in ready-to-drink tea with the introduction of FUZETEA
· Another year of double-digit volume growth in energy drinks
2019 priorities · Continue to evolve into 24/7 Total
Beverage Company, for shared value with our consumers and customers
· Consolidate the performance of product innovations by increasing distribution and repeat sales
412018 INTEGRATED ANNUAL REPORTSR
CG
FS
SSR
SI

This exciting progress has been achieved by overhauling our recipes to remove sugar while maintaining or improving taste.
Sophisticated options for adultsWith the rising adult population in our territory, a new generation of consumers with an eye for quality and superior taste, and a sense of adventure, are keen to experiment. We tapped into this growing value opportunity in the adults sparkling drinks segment, introducing or re-introducing tonics and other mixers which were once special occasion drinks but are increasingly popular with consumers.
As a step forward in the transformation of our portfolio, these products allow us to cover a wider range of occasions in the day, expand our presence in the premium hotels, restaurants and cafés channel, and leverage revenue synergies with our premium spirits portfolio.
We introduced Royal Bliss mixers in Austria, Hungary, Italy and Switzerland as a premium proposition in high-end cafés, bars and clubs during the year. In these four markets, we do not own our flagship ‘adults’ brand, Schweppes. The launch of this premium proposition, with revenue per case nearly five times higher than the average for sparkling beverages, met with considerable success. In just one year, Royal Bliss category share reached second place in Italy and Austria within the immediate consumption premium tonic mixers segment, performing well against established competition.
With an expanded portfolio of innovative new flavours, our Schweppes mixers and sparkling beverages give consumers new premium options for socialising-out-of-home and aperitif occasions. In Romania, we focused on premiumisation, launched new flavours in 200ml bottles for hotels, restaurants and cafés, introduced the very successful mandarin flavour and stepped up in-store activations, achieving 28% volume growth in the year. In Greece, we leveraged Schweppes as a premium proposition for adults moving from soda to a leading master brand, and promoted the availability of new Schweppes Drops (Lemon and Mastic Mint) and infused tonics. We also updated our iconic glass Schweppes pack with the introduction of a premium glass shape.
With a strategy including consistent support and dedicated activation of new packaging, we relaunched Kinley, a distinctive tonic with a slight bitterness. In the key market of Poland, the successful re-introduction of the Kinley brand grew volume by 40% and net sales revenue by 43% in 2018.
The busiest year of portfolio evolutionNew brands, categories and premium segments help us ensure that our products can be part of a balanced diet and that we cater to the evolving preferences of busy, health-conscious consumers. We introduced more new products in 2018 than ever before, with significant product launches in ready- to-drink tea and premium water. With AdeZ plant-based beverages, we added an entirely new category to our portfolio. We also continue to explore high-growth, high-value sub-segments in our core categories, such as sparkling beverages for adults with tailored innovations accretive to our growth.
Wider choice in sparkling drinks Our flagship sparkling beverages continue to bring happiness to consumers across our markets, with our overall sales volume for sparkling beverages up 4.3% in 2018 compared to the prior year. We are pleased to have achieved the highest volume growth of our sparkling portfolio in the last decade, with improving price/mix, enabled by powerful country-specific revenue growth strategies, edgy marketing campaigns and disciplined in-store execution.
Sales volume of Trademark Coca-Cola and Fanta both grew more than 5%. As health-conscious consumers look for low- and no-sugar options, Coca-Cola Zero, which is strongly visible in our advertising and promotions such as combo meal activations, continued its robust growth with sales volume for the year up 29.1%. We introduced Coca-Cola Zero Vanilla, Cherry and seasonal flavours such as Cinnamon and Ginger in many of our markets. We also continue to drive packaging innovation with smaller, more convenient packages.
In 2018, we rolled out our new recipe for the core Fanta Orange variant with 30% less sugar in several markets, including Hungary, Greece, Cyprus and Ireland, and have made preparations for roll-out in other markets.
As a result of our work throughout the year, the share of low- and no-sugar variants in our total volume grew by 2.2 percentage points to 13.1%. This was driven by all of our markets, with the biggest contributions coming from Russia, Romania, Italy, Poland, Nigeria and Ireland.
In line with our commitment, made in partnership with the Union of European Soft Drinks Associations (UNESDA), to reduce sugar in sparkling beverages by 10% by 2020 across EU countries and Switzerland, we reduced sugar per 100 ml by 3% in 2018, reaching a cumulative reduction of 8.2%.
OUR CONSUMERS CONTINUED42 COCA-COLA HBC

Profitable growth in energyEnergy drinks remain one of the fastest-growing segments of the beverage industry. Our energy drinks portfolio, led by Monster, had another impressive year of growth, with volumes up 30.6% compared to 2017 and significant share gains in 18 out of 23 markets. Growth in the energy category was strongest in Russia and Poland, with each market adding an incremental two million unit cases to sales in the year. This accelerated performance was driven by increased distribution, chilled product availability and in-store execution.
Following seven years of 30% average compounded growth in Monster sales volume, we introduced Monster Hydro in several markets and achieved a notable repositioning of other category products, enabled by innovation, marketing, dedicated promotions and in-store execution.
“We introduced more new products in 2018 than ever before, with significant product launches in ready-to-drink tea and premium water.”
We entered the premium water segment this year with GLACÉAU smartwater in two package formats in 10 of our markets: Austria, Italy, Czech Republic, Slovakia, Hungary, Serbia, Croatia, Russia, Switzerland and the Republic of Ireland. An evaporated and condensed natural mineral water, GLACÉAU smartwater is processed to replicate nature’s water cycle, with the right amount of mineral salts to create a clean and crisp taste. Its sleek, modern and iconic design reflects the quality inside the bottle.
Enhanced/functional waters are gaining traction, and with this addition to our product line we address consumer demand for affordable, premium physical replenishment.
We expect GLACÉAU smartwater, which is designed for ‘premium yet affordable’ physical replenishment targeting the urban, tech-savvy, ambitious and motivated consumer to be fully complementary to our existing mainstream propositions. Our aim, therefore, is to invigorate local water markets through the launch of a brand which has the consumer at its heart.
Innovative premium juicesTo meet consumer demand and grow value, our focus in the juice category in 2018 was on introducing innovative propositions. This strategy brought positive results, with value for our Cappy brand growing faster than volume across the business, as well as in key markets such as Bulgaria, Romania and Hungary.
Two innovative premium products were brought to market: Cappy Plus, with a range of different variants combining taste and enhanced functional attributes, and Cappy Smoothies, with a range of flavour combinations featuring smooth textures and good nutritional value. These product offerings are positioned to meet the consumer needs for breakfast and snacking occasions.
During the year, we were also able to successfully combine brand value with premiumisation focus to increase the share of our Next juice product line in Serbia, both in volume and value, with the latter growing faster.
Premium water offeringsAs hydration is becoming a complex category ranging from basic thirst quenching to indulgent refreshment with flavoured waters, we have developed our product portfolio to meet the full spectrum of hydration needs. The hydration category accounts for more than half of non-alcoholic ready-to-drink volume, and almost 30% of retail value. According to industry estimates, it will also comprise the biggest incremental growth in our sector through 2025, contributing 45% of the incremental volume and 20% of the incremental value.
As less than 20% of our volume is in hydration, we see significant room for growth, and are working to meet consumers’ varied hydration needs and grow our business. While we continue to build local relevance with our mainstream waters across our regions, we are expanding our product offerings beyond pure water to seize additional hydration opportunities.
432018 INTEGRATED ANNUAL REPORTSR
CG
FS
SSR
SI

Reinvigorating the ready-to-drink tea categoryIn a year packed with new product launches, the introduction of FUZETEA was our biggest system-wide effort. FUZETEA offers consumers a fresh, innovative, ready-to-drink tea with a fusion of sustainably sourced tea extract, fruit juice and herbs. Blending these ingredients creates a multi-layered, contemporary tea taste, and a premium alternative within the category.
Already established in 52 markets globally, FUZETEA reached 27 of our markets simultaneously with blends such as Black Tea Peach Hibiscus, Green Tea Mango Chamomile and Black Tea Lemon Lemongrass. The launch was supported by strong operational plans, close collaboration with our customers, and Coca-Cola System alignment and commitment.
FUZETEA is a success story so far, delivering constant volume and value growth since launch and performing well on all relevant brand parameters. We are excited to have transformed the ready-to-drink tea category from a declining segment to one that has achieved volume growth in the first year of launch.
Plant-based beveragesIn 2018, we broke new ground with AdeZ, our first plant-based beverage blending seeds and fruits. We introduced AdeZ in May 2018, with flavours and packs appropriate for at-home consumption during breakfast, as well as unique offers for on-the-go or at-work snacking.
Plant-based beverages – typically made from almond, rice, soy or oats – are increasingly popular with consumers. AdeZ is our first foray into this fast-growing category and offers a nourishing, accessible and appealing choice.
We know that AdeZ has strong potential as it is already a successful brand for The Coca-Cola Company in Latin America, where it is a market leader in the category. The decision to introduce AdeZ to Europe led us to a fast-track development of recipes to suit European tastes, an all-new brand proposition.
For this entirely new category for our Company, we built manufacturing capabilities as well as the market knowledge. Less than a year later, we launched AdeZ in 12 of our markets, demonstrating our determination to explore and establish ourselves in this fast-growing segment, while bringing incremental value for our customers.
Like many consumers, Bruce is interested in health, wellness and hydration.
What is your approach to hydration?I’m interested in staying healthy, and I keep reading that water is an essential nutrient for the human body. I guess I take the doctors’ advice to drink about two litres of water per day quite seriously.
I usually drink plain bottled water at home. When I’m out and about, I often treat myself to a premium or flavoured water. It feels like a refreshing treat and it’s low in calories.
Are you interested in the mineral content of water?I know that the right fluid and electrolyte balance supports good health, so I try to choose waters that have a good mineral balance. I like GLACÉAU smartwater, which takes pure vapour-distilled water and adds just the right amount of electrolytes.
Do you have a favourite brand of flavoured water?Deep RiverRock is my favourite. It’s an Irish water, a healthy, natural spring water from County Antrim. While it’s rich in minerals like calcium and magnesium, it’s also tasty with flavours like mint, strawberry or even forest fruits. It comes in big bottles which I buy for drinking at home, but you can also get smaller bottles in restaurants or shops.
Do you care about the packaging?I do indeed. I take care to recycle my water bottles. I feel the packaging should be as pure as the water inside, and recyclable too.
BRUCE HAYESNENAGH, CO TIPPERARY
Response from Sotiris Yannopoulos We are working very hard to offer our consumers a wider choice of drinks as we recognise that their needs and desires are changing. And hydration is becoming a complex category, ranging from basic thirst quenching to indulgent refreshment.
Over the last two decades, we have developed our water portfolio to meet the full spectrum of hydration needs. We have acquired many well-established local water brands in our markets. In some cases, we have also introduced these in adjacent markets.
The water category now accounts for 19% of our sales volume. The latest addition to our portfolio was GLACÉAU smartwater, launched in 10 markets in 2018.
With The Coca-Cola Company, we continuously innovate in this category to offer function and serve local tastes. We are continuing to develop and introduce additional options for health-conscious consumers who are looking for low- and no-sugar flavoured options, as well as more convenient and sustainable packages.
And we have a piece of good news for Bruce. Later this year, he will be able to buy Deep RiverRock in 100% recycled PET packaging.
SOTIRIS YANNOPOULOSREGION DIRECTOR
44 COCA-COLA HBC OUR CONSUMERS CONTINUED

Incubating new brandsIn response to evolving consumer desires, we established a specialised Incubate & Grow Unit during the year to serve emerging and high-potential consumer trends with entrepreneurship and agility. This ‘connected, but not integrated’ unit, with Coca-Cola HBC and The Coca-Cola Company as equal partners, supports our efforts to try out our affordable premium brands. The unit’s focus is on products that feature or support naturalness, simplicity, organic ingredients, holistic wellbeing and sustainable functionality.
The selected ‘incubate – grow – scale’ portfolio has been introduced in hand-picked outlets in targeted cities, supported by experiential and opinion-leader marketing to attract early adopters. Once a certain consumer and customer base is achieved, the brands will expand selectively across regions and channels, in a broader but still very segmented selection of outlets. We plan to continue incubating new brands, while the brands that reach scale will be integrated in our well-established, effective system. Through this process we seek to maintain an attractive, contemporary and high-value product portfolio.
The unit began its work in Vienna, Milan, Rome and Zurich in late 2017. The products in scope were GLACÉAU smartwater, ZICO Coconut Water, Appletiser and Coke in an aluminium bottle pack. We began with the goal of reaching an average of 200 hand-picked outlets per city in the first 12 months. In 2018, the unit’s incubation efforts expanded into six additional European cities with more products, including Honest Tea, special Coke Zero flavours and Tumult, a fermented non-alcoholic drink.
These incubation efforts have boosted the energy of the local organisations, bringing enthusiasm to our people, our consumers and our customers, and driving our competitiveness. As part of the unit’s efforts, an additional 8,000 new cooler doors were placed in the market during 2018, increasing the availability of our still drinks portfolio.
Options for every drinking momentTo meet our consumers’ preferences, we need to understand what drives their desire for beverages throughout the day. To satisfy these desires, we need to provide the right brand, in the right package, through the right channel, and at the right price. This process is called Occasion, Brand, Pack, Price, Channel (OBPPC) and it is an integral part of our revenue growth management work, which helps us prioritise opportunities.
Meals at home is an important consumption occasion that is prioritised across all of our markets with a localised approach. Socialising-away-from-home consumption represents an appealing growth opportunity and is strategically important for attracting teen consumers. Enjoyed as single servings, primarily served in cafés, restaurants and leisure outlets, the socialising-away-from-home occasion also offers superior revenue per case. In 2018, we also started tapping into the at-work occasion in some of our markets.
To grow consumption on these key occasions, we leverage a full product portfolio, including complementary categories such as coffee and premium spirits. These efforts are helping us to materialise our ambition of becoming a Total Beverage Company.
Capturing valueWhile pursuing our 24/7 vision, we also identify and prioritise the right strategies to capture value. We used a phased approach to roll out a revenue growth management framework, starting in the third quarter of 2016 with Nigeria and Russia and reaching all of our markets by September 2018.
While there are distinct initiatives in each market, common themes of our revenue growth management initiatives include premiumisation, brand stratification and price and pack size interventions. Expanding availability and visibility of Schweppes 1783 in the hotels, restaurants and cafés channel is a good example of our efforts to seize the adult premiumisation opportunity. We also entered the promising organic segment with Bio Limo in Switzerland and Austria.
We have had success with several approaches to brand stratification, such as establishing a fighter brand like Limca in Nigeria or establishing different pricing for Trademark Coca-Cola and flavours in the Ukraine. In Greece, where low- and no-sugar options have lower price elasticity, we adapted our pricing for these variants.
Using smaller and more affordable propositions such as the 900 ml future consumption entry pack in Russia, we improved our strategy for recruiting new consumers. In Italy, we resized the entry pack to 660 ml to attract consumers in smaller households and launched a 450 ml PET package for consumers on the go. In all of our markets, we leveraged differing price elasticities, not just by package and brand, but also by channel.
We estimate that our revenue growth management initiatives contributed 1.8% of our total revenue growth in 2018, and project that they will contribute 3.1% to growth in 2019.
SR
CG
FS
SSR
SI
45
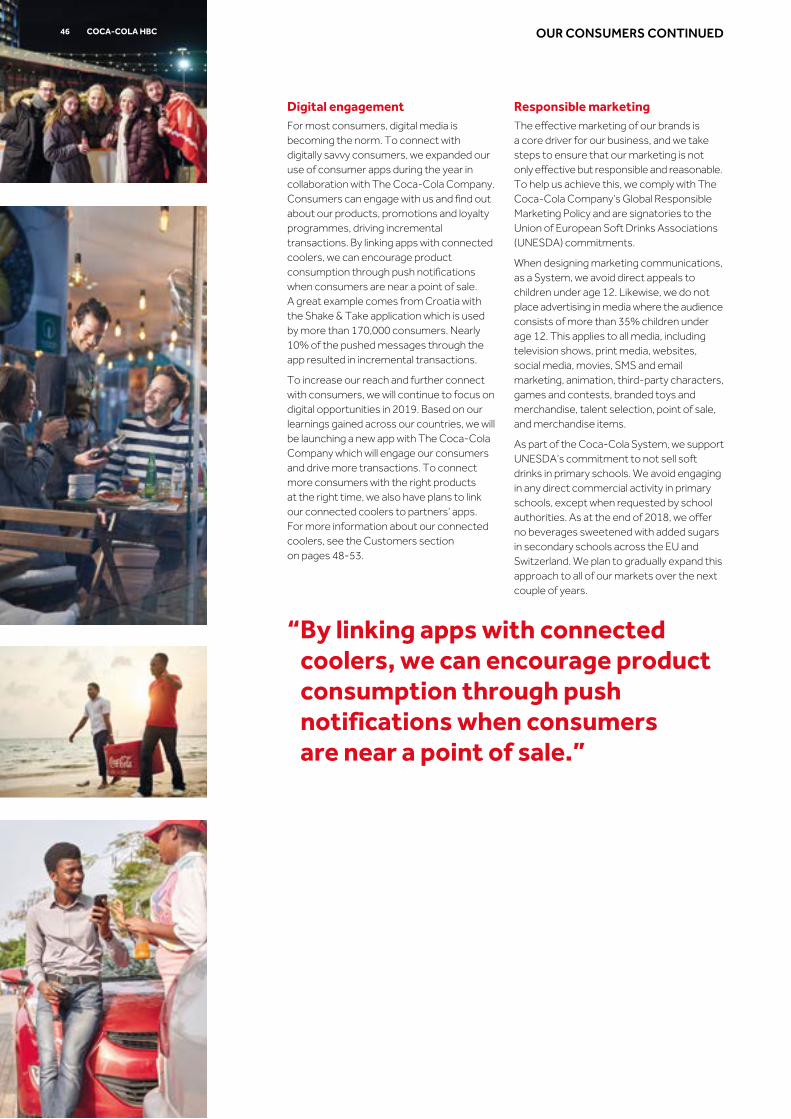
Responsible marketingThe effective marketing of our brands is a core driver for our business, and we take steps to ensure that our marketing is not only effective but responsible and reasonable. To help us achieve this, we comply with The Coca-Cola Company’s Global Responsible Marketing Policy and are signatories to the Union of European Soft Drinks Associations (UNESDA) commitments.
When designing marketing communications, as a System, we avoid direct appeals to children under age 12. Likewise, we do not place advertising in media where the audience consists of more than 35% children under age 12. This applies to all media, including television shows, print media, websites, social media, movies, SMS and email marketing, animation, third-party characters, games and contests, branded toys and merchandise, talent selection, point of sale, and merchandise items.
As part of the Coca-Cola System, we support UNESDA’s commitment to not sell soft drinks in primary schools. We avoid engaging in any direct commercial activity in primary schools, except when requested by school authorities. As at the end of 2018, we offer no beverages sweetened with added sugars in secondary schools across the EU and Switzerland. We plan to gradually expand this approach to all of our markets over the next couple of years.
Digital engagementFor most consumers, digital media is becoming the norm. To connect with digitally savvy consumers, we expanded our use of consumer apps during the year in collaboration with The Coca-Cola Company. Consumers can engage with us and find out about our products, promotions and loyalty programmes, driving incremental transactions. By linking apps with connected coolers, we can encourage product consumption through push notifications when consumers are near a point of sale. A great example comes from Croatia with the Shake & Take application which is used by more than 170,000 consumers. Nearly 10% of the pushed messages through the app resulted in incremental transactions.
To increase our reach and further connect with consumers, we will continue to focus on digital opportunities in 2019. Based on our learnings gained across our countries, we will be launching a new app with The Coca-Cola Company which will engage our consumers and drive more transactions. To connect more consumers with the right products at the right time, we also have plans to link our connected coolers to partners’ apps. For more information about our connected coolers, see the Customers section on pages 48-53.
“By linking apps with connected coolers, we can encourage product consumption through push notifications when consumers are near a point of sale.”
OUR CONSUMERS CONTINUED46 COCA-COLA HBC

Health and nutritionTo meet evolving consumer needs and preferences, we are focusing on offering consumers more of the products they want, including low- and no-sugar options, across categories and in more packages. Providing clear and transparent information helps consumers make informed choices. At the end of 2018, we introduced a new front-of-pack labelling, on a trial basis, in several markets. This builds on the current Europe-wide Reference Intake (RI) monochrome model with a system that reflects the nutrient content per 100ml of our drinks for sugars, salt, fat and saturated fat through a simple ‘traffic-light’ colour scheme of red, amber, green. The approach we will follow is identical to the scheme that we have voluntarily supported in the UK and Ireland since 2014.
We support the current recommendation by several leading health authorities, including the World Health Organization, that people should limit their intake of added sugar to no more than 10% of their total energy/calorie consumption. To address this issue, we have committed, in partnership with UNESDA, to reduce sugar in sparkling soft drinks by 10% between 2015 and 2020 across the EU and Switzerland.
The reduction achieved in 2018 was 3% per 100ml. We set a new, broader commitment during 2018; to reduce the calories per 100ml of sparkling soft drinks by 25% by 2025 vs. 2015, across all of our countries.
Product quality, safety and integrity Our business is built on consumer trust. A low rate of consumer complaints shows that our beverages are of high quality and people trust our products and brands, maintaining and growing the value of these intangible assets. The freshness of our sparkling drinks in the market improved by 19% and the number of complaints declined by 2% during the year, to 19 complaints per 100 million bottles sold, falling slightly short of our target of 18. For 2019, we have set a target of 18 complaints per 100 million bottles sold to maintain this high performance level.
To maintain consumer trust, we have robust product quality processes and zero tolerance for quality and food safety non-compliance. Collaboration with key suppliers of our ingredients and primary packaging materials helps us minimise quality issues in our supply chain. We were able to maintain the low level of business losses from quality issues we achieved in 2018, when we reduced losses by more than 80% compared to 2017.
“We will support growth in our core sparkling portfolio, as well as in faster-growing segments such as energy drinks, water and plant-based beverages.”
Through our internal awareness and certification programme, we train and certify our Plant Managers, Plant Engineering Managers and Supply Chain Services Managers in key food quality and safety issues. This capability development is provided to all newly appointed and hired Plant Managers; existing Plant Managers receive training updates.
We piloted a Quality and Food Safety Cultural Survey in Italy during 2018 to benchmark best-in-class step changes. The same programme will be rolled out to all of our countries in early 2019, to continue nurturing a culture supporting food safety and quality.
Looking aheadWe will continue to build on our efforts to delight consumers in the coming year with a broader product range for all occasions, further evolving our 24/7 total beverage portfolio. This means mastering an increasingly complex operating environment, with more small and fast-moving competitors.
We will support growth in our core sparkling portfolio, as well as in faster-growing segments such as energy drinks, water and plant-based beverages. To meet all hydration needs, we will continue our two-pronged strategy, offering mainstream and premium water. We will also build on our very successful launch of FUZETEA and will continue tailoring our juice products to local tastes and preferences.
UN Sustainable Development GoalsWe serve our consumers with a broad range of high-quality products. In doing so, we create value by contributing to global goals for good health and wellbeing, innovation, responsible production and consumption and partnerships.
SHARE OF LOW- AND NO-SUGAR VARIANTS VS. 2017
+2.2pp(2018: 13.1%)
GROWTH IN SPARKLING DRINKS FOR ADULTS VS. 2017
+6%
472018 INTEGRATED ANNUAL REPORTSR
CG
FS
SSR
SI
IN GOOD COMPANY WITH
COCA-COLA HBC48
EVOLVING WITH THE CHANGING NEEDS OF OUR CUSTOMERSWith our expanding innovative product portfolio and excellent service, we engage customers to excite shoppers, creating joint value for long‑term success.
2018 progress · Rolled out our new route-to-market
approach across our biggest markets, resulting in increased outlet coverage and customer-facing time
· Further improvement in customer satisfaction
· Focus on e-commerce, leading to growth ahead of the market
2019 priorities · Introduce an organisational end-to-end
customer management approach
· Further develop customer-centricity mindset for joint value creation
· Accelerate our capabilities in e-commerce
492018 INTEGRATED ANNUAL REPORTSR
CG
FS
SSR
SI

Creating value for customers through our expanding portfolioOur many product innovations in 2018, supported by other initiatives in marketing, revenue growth management and route to market, drove results with our customers and in outlets across our 28 countries. By offering a broader portfolio with a wider choice of natural, healthy options and premium products, we helped our customers excite shoppers and grow their businesses. In established categories, new recipes and new variants had immediate impact while initiatives supporting the introduction of new categories laid the groundwork for long-term success.
With every initiative, we are focused on growing the value of the category. In more than half of our markets we grew value in sparkling beverages faster than the overall category, thus supporting value creation for our customers.
The water category is growing rapidly and is expected to continue to do so. Our introduction of affordable, premium brand GLACÉAU smartwater helped our customers attract upscale and affluent shoppers who seek trendy, lifestyle solutions for hydration. Smartwater also drives profitable category growth with higher margins, upgrading current mainstream water drinkers to more premium propositions.
We know from consumer insights that shoppers are looking for natural, healthy options, and the ready-to-drink tea category has the potential to meet these needs. Due to unclear positioning of existing products, the category had been stagnating, with many consumers having never tried it.
A differentiated proposition with strong brand promise, FUZETEA has the potential to re-invent the entire category and subsequently increase customers’ revenue opportunities. Ready-to-drink tea is a powerful revenue driver, as it has c.20% higher revenue per case compared to the average for non-alcoholic ready-to-drink beverages.
Combining tea extract, fresh juice and herbs, FUZETEA offers something new for consumers who want to experiment. It may also help our customers increase margins by encouraging switching from lower-value categories.
With the introduction of AdeZ plant-based beverages, our customers have an opportunity to attract more shoppers and gain incremental revenue and margin. Limited awareness, availability and modest taste from existing propositions in the category have not lifted consumption to maturity levels.
Yet, the category is projected to grow faster than other categories due to health and wellness trends, new eating habits, increases in allergies and intolerances, and the rise of environmental and ethical consciousness. To accelerate category growth in our markets, we launched AdeZ, the leading brand in Latin America, in 12 of our European markets in 2018.
Consumption per capita of plant-based beverages in Central and Eastern Europe markets is still modest. By removing the category barriers, and supporting per capita consumption levels in line with Western Europe, there is an opportunity for the category to reach €1 billion in retail value within five years. Plant-based beverages’ value per transaction is nearly double that of cow’s milk.
Serving customers efficientlyAs our product portfolio has grown and evolved to support our total beverage portfolio strategy, we have become even better at bringing our products to market efficiently and effectively. We revamped our route-to-market approach in all of our major markets in 2018, which added an estimated 1.1% to our annual revenue growth. In 2019, we expect the contribution to be 1.4%.
“A differentiated proposition with strong brand promise, FUZETEA has the potential to re-invent the entire category and subsequently increase customers’ revenue opportunities.”
OUR CUSTOMERS CONTINUED50 COCA-COLA HBC

We made improvements to our processes to identify and recruit new outlets, increased the time we spent with customers, improved our co-ordination with wholesalers, and refined processes for online sales. These efforts ensure that we capture opportunities and optimise market coverage for new and established products.
Improved prospecting processes helped us increase our overall market coverage across our countries, with a particular focus on execution in the hotels, restaurants and cafés channel. In Nigeria, we added 20,000 new outlets in Lagos alone during 2018. In the vast territory of Russia, we optimised our sales force and introduced central route planning, which significantly improved our ability to spend time with customers. We also improved our partnerships with wholesalers by adjusting our approach to market segmentation and account management.
As consumer buying habits change, we are adjusting our processes to support growth in digital commerce and the at-work channel. We established dedicated structures and teams, and segmented the digital retail space and e-food customers, as well as the at-work universe. To help our customers embrace the digital way of working, we made improvements to our web portal. Partnerships with vending operators and caterers help us create joint value in the at-work channel.
We also continued to provide the best service quality for our customers while reducing our service costs. In Poland, for example, we worked with our customers to increase full-truck, full-pallet deliveries by establishing minimum order quantities and a charge for non-standard orders.
Serving hotels, restaurants and cafes effectivelyThe hotels, restaurants and cafés channel is becoming increasingly critical for our business as it offers revenue growth and supports the penetration of our brands. To seize these opportunities we were both agile and focused during 2018, particularly with large-scale initiatives in Italy, Greece, Cyprus and Croatia.
We introduced a new structure in Italy in the summer of 2018, with people dedicated to serving premium hotels, restaurants and cafés. This approach addresses the increasing needs of high-demand customers. A new merchandising model was also introduced for coolers, improving our presence in these outlets and freeing up business developers’ time to focus on customers’ specialised needs, while also incentivising customers with clear guidance on positioning our products.
In Greece and Cyprus, we leveraged the strong summer tourist business with limited-edition bottles inspired by Greek mythology. The bottles were launched in cafés, restaurants, and souvenir shops, and supported by targeted advertising at airports, on tourist maps, in the Aegean Airlines magazine and digital channels. In Croatia, we increased contracts with hotels, restaurants and cafés in Split and Dubrovnik, and sales of our premium spirits went up owing to the efforts of our local centres of excellence for the channel. Our activation programmes prompted consumers to switch from beer to cocktails, growing our sales volume in targeted outlets by 17%.
Joint value creationWe continually seek to improve shopper satisfaction while generating higher margins for our customers and for our business. Our success, and the success of our customers, requires us to collaborate effectively. Joint business plan workshops are an essential part of this collaboration, resulting in clearly defined shared responsibilities and joint tracking scorecards to evaluate progress and results.
A tailor-made marketing plan created with a key retail customer in Poland, for example, improved execution of promotional activities for the FIFA World Cup and Christmas. Along with innovations in online sales, the success of these promotional activities resulted in increased revenue.
Joint business plan workshops have also helped us capture growth in immediate consumption with single-serve packages. Our partnership journey with one of the leading global travel retail customers started with a workshop at the beginning of 2018, where we established a common vision and strategy, set joint priorities and defined detailed action plans to capture all growth opportunities. This collaboration, along with strong activation plans, led to strong sales for FUZETEA in the customer’s Czech Republic outlets.
Another way we strengthen relationships is by sharing our insights into shopping habits. In Switzerland, the local team shared the results of research on shoppers’ needs and attitudes with several key accounts in a series of cross-functional workshops. Based on an analysis of 31,000 shopping trips and interviews with 6,000 shoppers, the research provided customers with unique insights. As a result, one of the fastest-growing Swiss customers has agreed to undertake a category management project with us in 2019 to optimise product assortment and layout.
HIGHLY ENERGY-EFFICIENT COOLERS IN THE MARKET
19%SHARE OF SATISFIED CUSTOMERS
+2.5pp(2018: 81.3%)
512018 INTEGRATED ANNUAL REPORTSR
CG
FS
SSR
SI

Building excitement with promotions – FIFA World CupWe engaged customers and supported powerful in-store promotions linked to the FIFA World Cup hosted in Russia, our largest market. Strong customer engagement plans and in-store activations took place across our markets, while in host country Russia we implemented 41,000 displays in our retail key account partners. In branded ‘Red Zones’ in all 2018 FIFA World Cup host cities in Russia, we attracted football fans with almost 5,000 pieces of summer equipment, including large screens in areas dedicated for public viewing of matches, and more than 17,000 cooler doors.
This focused execution, along with favourable summer weather, boosted volume growth in targeted areas by 156%.
With the Russian and Croatian national football teams advancing to the quarter‑finals and finals, respectively, we had a great opportunity to celebrate and cheer for winning teams with real-time social media feeds. We also produced limited-edition bottles featuring winning scores in fewer than two days. This real‑time marketing approach achieved significant engagement, generating more than 81 million impressions online and organic social media posts from top influencers.
Exceeding customer expectationsWe monitor customer satisfaction by commissioning an annual survey of more than 15,000 customers, comparing ourselves with other beverage suppliers, including suppliers of beer and dairy products. We listened to our customers’ feedback from 2017, their key satisfaction and dissatisfaction drivers and developed a strong action plan for 2018 to improve customer service quality. This resulted in the number of customers recognising us as Supplier no. 1 in three additional countries at key account headquarters level, and in five additional countries at wholesaler level compared with the previous year.
Following our collaboration with our key accounts, we increased our share of satisfied customers by 2.5pp to 81.3% in 2018. Our improved partnerships with wholesalers led to a 10.8pp increase in our share of satisfied customers to 75.9% in 2018. The feedback we receive helps direct priorities for training and development, indicating where we need to improve skills and capabilities.
To ensure that the right product is present in the right location and properly activated, we track real-time execution in our customers’ stores and use that data to evaluate and improve in-store operations.
We use an approach called Right Execution Daily (RED) which measures aspects required for strong execution, such as product availability, secondary placements and merchandising, and awards a score to each customer, channel and, ultimately, country.
These scores reflect our execution level relative to our internal targets, and we use all this data to continually improve. The score that measures our success in the market (RED Benchmark) grew in 2018 by 10pp compared to the start of the year, which reflects the fact that we are activating the market with increased speed and stronger impact.
Customer-centricity is a key objective for the entire organisation and this means that we seek to always deliver in full, on time and accurately invoiced, an internal metric we monitor and call by the acronym DIFOTAI. We track our success in achieving this each day, for each customer, and constantly work to improve our performance. Our overall DIFOTAI score for 2018 was 96,5% – a 1.4pp shortfall compared to 2017 due to challenges with product availability in a unique year, when we added 1,000 new SKUs to our portfolio.
Supporting growth in immediate consumptionWe helped our customers serve consumers by placing more coolers and new options for single‑serve packs across our product portfolio. As a result of these initiatives, sales of profitable single-serve packs increased during the year by 170 bps, now accounting for 43.7% of our total volume sold.
During 2018, we introduced smaller juice packages, launched multi-packs of single-serves, and focused on glass packages to increase penetration in hotels, restaurants, bars and cafés. These efforts supported an overall improvement in our package mix.
As cold drink equipment is one of our strongest tools for creating joint growth of profitable single‑serve packages, we invest in finding the right chilled solutions for our customers. This may involve our own branded coolers, which increasingly are highly energy-efficient and internet connected for greater effectiveness, or optimising the product offering in customer-owned coolers.
We launched a cooler acceleration plan during the year to boost cold drink availability, and invested nearly €120 million in coolers in our markets. To maximise our return on these investments, we use data from our annual Every Dealer Survey to assess the sales potential of retail outlets.
By 2022, all outlets deemed to have the highest potential will have 100% cooler coverage, and outlets with strong potential will have at least 90% coverage with at least one cooler.
We don’t just want to have more coolers, we want coolers to be more energy‑efficient and more effective. By the end of 2018, 270,000 or 19% of all of our coolers were highly energy-efficient, with HC (hydrocarbon) refrigerant gas. At present, all of our 28 markets have connected coolers.
Connected coolers increase business developer productivity by scanning and communicating inventory automatically. The time saved adds up to four days every year per business developer and can be re-invested in time spent with customers. In addition, the technology helps us drive sales. We are able to analyse and improve the placement of coolers by monitoring how consumers use them. The technology also supports proximity marketing with beacons, allowing marketing teams to push impulsive messages to consumers for the right occasion and at the right location – when consumers are near coolers.
e-commerceAs shoppers are increasingly looking for convenience, e-commerce continues to grow in our countries, increasing in value for our categories by 20% in 2018 compared to 2017. Our investments and focus allowed us to achieve volume growth of 26% versus 2017, ahead of the market trend.
We activate e-commerce across different channels, supporting traditional retail customers as well as emerging channels such as online delivery or e-food. In the e-food channel in Ireland, we partnered with the Boojum chain to create a combo meal for delivery. By leveraging a strong communication plan across social media channels, the activation increased the number of new shoppers by 27% and drove the number of beverages sold by 58%, creating value for all parties.
To provide our customers with services that simplify their operations, we continued to evolve our web-based customer portal, allowing customers in the fragmented trade to order our products at any time.
Our e‑commerce capabilities have been enhanced by investing in our people. We have appointed dedicated resources in countries and have trained our key account teams on strategies and steps to succeed with customers online. We also continued the roll-out of e-commerce tools including eRED, our online performance tracking system. These capability-building efforts will continue in 2019 to capture the maximum value of online channels.
52 COCA-COLA HBC OUR CUSTOMERS CONTINUED

UN Sustainable Development GoalsAs we build our business by helping our customers to grow and thrive, we make substantial contributions to the achievement of the Sustainable Development Goals related to ending poverty, decent work, sustainable communities, responsible production, justice and strong institutions, and partnerships.
Data securityWe understand the need to take a responsible approach to e-commerce initiatives. As part of our efforts to educate our employees about data privacy and cyber-security, the focus of our annual Ethics and Compliance Week was the new EU General Data Protection Regulation (GDPR) which became effective in May 2018. We established a comprehensive compliance programme related to GDPR and launched a broad awareness campaign.
Looking aheadWe will continue to refine our collaborations with customers in 2019, introducing an organisational end‑to‑end customer management approach. The importance of key account management is increasing with higher customer concentration, growing requirements, including retailers’ focus on sustainability, new competition and greater complexity. We know that we must continually improve service delivery.
To maximise service and value, advancing our capabilities in data and analytics is also a priority. We aim to further our growth mindset by improving the productivity of business developers and making even better use of technology to capture more and better data.
MARINA RATNIKOVADIXY GROUP COMMERCIAL AND MARKETING DIRECTOR
We worked with customers across Russia in 2018, including Dixy Group, to link the excitement about the FIFA World Cup with our products.
Russia hosted the FIFA World Cup in 2018. How important was that for your business?Dixy Group is a large Russian retailer with a high level of engagement and partnership with Coca‑Cola HBC. Once we started working together on the planning for FIFA World Cup initiatives, we believed strongly not only in the success of this project, but its benefits for our joint business.
How did the preparations work?Preparations began at least 18 months in advance of the games, with working sessions in a FIFA Lab organised by Coca‑Cola HBC. As one indicator of our confidence in our strategic partnership, we allocated a tremendous amount of time and resources to the project. We worked together with Coca‑Cola HBC colleagues to identify the best locations in Red Zones in FIFA World Cup host cities. To maximise our impact in these areas, we worked to link fan enthusiasm with branding and products through special promotions in stores located next to transportation hubs and stadiums.
What did the execution in your stores look like?What was unusual for us was promotions for international visitors. We were targeting an estimated six million football fans, and many were non‑Russian speakers. Coca‑Cola HBC helped us adapt promotions, supporting ‘on‑the‑go’ consumption for this important audience.
Did you personally enjoy the in-store activity?With the limited‑edition Coke bottles with game scores, and the excitement generated by the successes of the Russian football team, there was a lot of energy and enthusiasm, which helped engage and motivate our staff. You could also see this excitement reflected on social networks.
Did your business benefit from the increased activity?The marketing innovations, placement of approximately 2,500 of additional displays and coolers and activations during the games helped us build category growth. In 2018, our sales increased by 8.1% compared with 2017, and Coca‑Cola HBC products contributed 1.2% of that growth.
Response from Naya Kalogeraki Having the FIFA World Cup in Russia, our largest market, was a great opportunity. Our planning started early and customer engagement was critical. Our partners at The Coca‑Cola Company invested in bespoke advertising for the event, and we invested in coolers and displays at the point of sale and in Red Zones across the country.
We launched a cooler acceleration plan in 2018 for Central and Eastern Europe, which is a fundamental pillar for our immediate consumption and single‑serve growth. This programme added 10,500 cooler doors in Russia, boosting cold drink availability and consumption during the FIFA World Cup event.
The bottom line is that our Russia sales volume grew by 4.4% in 2018, helped by the combination of the games and good weather in the summer months. Importantly, the investments we made in Russia during the games will benefit our business for many years to come.
NAYA KALOGERAKIGROUP CHIEF CUSTOMER AND COMMERCIAL OFFICER
532018 INTEGRATED ANNUAL REPORTSR
CG
FS
SSR
SI

IN GOOD COMPANY WITH
COCA-COLA HBC54

PARTNERSHIPS TO IMPROVE EFFICIENCYWe partner with our suppliers and communities, and we leverage the ingenuity of our people to help us improve our operational efficiency, reducing our costs and environmental impact.
2018 progress · Aligned production capabilities
with product innovation pipeline
· Leveraged technology in our shared services centre with robotic process automation
· Saved 708,210m3 of water and 79,820 tonnes of PET plastic packaging
· Reached our internal target for use of renewable and clean energy ahead of 2020
2019 priorities · Continue to invest in the business
to support the 24/7 Total Beverage Company strategy
· Focus on initiatives to make progress in the delivery of the 2025 sustainability commitments
552018 INTEGRATED ANNUAL REPORTSR
CG
FS
SSR
SI

PARTNERS IN EFFICIENCY CONTINUED
Infrastructure optimisationAs we adapt and reshape our product portfolio to meet changing consumer preferences, we are also ensuring that our production capabilities can support these changing needs. Aligning production capabilities with product innovation is integral to our strategy and presents opportunities to streamline our existing infrastructure.
Capturing market demand with speed and agility is crucial. We are reducing complexity in our portfolio, which frees production capacity for new launches. We are also streamlining demand fulfilment from various markets, facilitating faster and more standardised launches. Our centralised production planning system for the whole Group, set up a few years ago, enables us to do this effectively. This, combined with a structured commercialisation process, significantly reduces our time to market.
In 2018, we invested in new production capabilities for plant-based beverages in Prague to support the launch of AdeZ in 12 countries. We also expanded our production capabilities at our Zalaszentgrót plant in Hungary to support our premium water portfolio and the introduction of GLACÉAU smartwater in 10 countries.
While the restructuring of our production footprint is largely complete, we see further opportunity in highly dynamic markets. Given the positive trends in Nigeria, we installed the fastest PET production line in our Ikeja mega plant, increasing our PET capacity. We also increased capacity in the north of the country, installing a high-speed PET line in Abuja. Both lines can produce sparkling soft drinks as well as water. By further consolidating returnable glass bottle production facilities, we were able to cease our production activities in the Jos, Kaduna and Enugu plants. All three locations are now converted to distribution depots. We also expanded our warehousing capacity in Abuja, Ikeja and Benin, while respective expansion works are still in progress in Owerri and Port Harcourt.
Across the business since 2008, we have successfully consolidated our production footprint by 35%, consolidating 28 of the 80 plants we had 10 years ago. We increased the average lines per plant from 3.6 to 4.9, creating more mega plants, which has improved our efficiency and flexibility. Our capacity utilisation level of 66% at peak limits the requirement for additional investment, even as our business continues to grow.
Our logistics network has also changed as our service model has evolved. Responding to customer requirements, we are improving our service offering and creating value for our customers while reducing our costs. During the year, we optimised our logistics network further as part of this process, reducing the number of our warehouses and distribution centres by 59%.
Leveraging technologyFollowing the successful consolidation of back-office finance and human resources activities from country offices to our Shared Business Services Organisation (BSO) in Sofia, Bulgaria, the focus in 2018 was to bring further efficiencies to the way back-office operations are run. The biggest innovation in this area is our Robotic Process Automation programme (RPA), which uses programmable software to autonomously execute basic tasks, achieving cost efficiencies, improved business processes and an increased level of compliance.
The RPA pilot project went live in June 2018 with five process automations, following a successful proof‑of‑concept stage in 2017. We also established an RPA centre of excellence based on external best practices. By the end of 2018, an additional 15 successful automations were delivered, using only internal resources for the development and deployment. The ambitious plan for 2019 is to have more than 100 live automations, expanding the RPA scope beyond the back-office processes supported by the BSO. Some examples of the processes to be automated include intercompany recharging of expenses, reconciliation of customer balances, updating exchange rates of currencies and delivery of various operational reports.
Another area of enhanced efficiency is the digital transformation of accounts payable. We began implementing touchless posting of vendor invoices in 2017. Roll‑out to all of our countries was finalised in two stages during 2018, resulting in a 20% increase in touchless posting of vendor invoices.
COCA-COLA HBC56

Water use ratio in plants (litre/litre of produced beverage)
0.0
0.5
1.0
1.5
2.0
2.5
3.0 -30%vs. 2010
2010 2016 2017 2018 Target2019
2020goal
1.611.
711.79
1.821.
93
2.30
CHRISTOPH GEBALDCO‑FOUNDER AND CEO OF CLIMEWORKS
Our work with supplier Climeworks provides insight into how we create value through collaboration.
Can you tell us about your technological collaboration with Coca-Cola HBC?We provide technology to remove CO2 from air and supply it in high purity. Working with Coca‑Cola HBC has helped us to enter the beverage industry.
What are the distinct advantages of producing CO2 as opposed to buying it?Climeworks plants offer supply security independent of location. Our modular design allows plants to be built easily to any size, depending on needs. Plants are also fully automated and can run autonomously at any location.
How did the collaboration come about?During the last few years, Coca‑Cola HBC has been an exceptionally supportive partner in enabling the application of Climeworks’ direct air capture technique in the beverage industry. The world’s first beverage containing air‑captured CO2 from Climeworks is its Valser branded water in Switzerland.
What is the environmental impact?The beverage industry is one of the world’s largest users of CO2 feedstocks and could provide the commercial platform needed to deploy our technology on an industrial scale, bridging the gap between today’s first commercial installations and the scale of production required for removing billions of tonnes of CO2 from the air to help stop climate change.
MARCEL MARTINGROUP SUPPLY CHAIN DIRECTOR
Response from Marcel Martin We are continuously looking for projects that can minimise the environmental impact of the beverage industry. Having made great strides in sustainability in recent years, we have set ourselves more stretching sustainability targets by 2025 and technology can help us make significant changes.
We partnered with Climeworks to integrate its technology into a beverage bottling plant for the first time. This technology is creating an economically viable solution to reduce CO2 presence in the atmosphere. Making projects like this a reality is helped by our fixed‑asset investment evaluation and appraisal model, which takes the price of carbon and true cost of water into account as well as a number of intangible social and economic criteria that measure benefit or cost to the communities in which we operate.
The project also helps us meet the expectations of our Swiss consumers, who care deeply about the environmental impact of beverages they consume. We plan to work with Climeworks and scale up the use of this solution as the technology matures.
572018 INTEGRATED ANNUAL REPORTSR
CG
FS
SSR
SI

Cash generationThe business continues to generate strong cash flow, with the 2018 free cash flow amounting to €370 million. This is slightly lower than our recent track record, but in line with our plans to step up our investment in revenue‑generating assets.
Net cash from operating activities decreased by €7 million in 2018 compared to the prior year, as increased operating profitability was more than offset by higher inventory levels to support the record number of new product launches.
Capital expenditure, net of receipts from the disposal of assets, increased by €49 million in the year and represented 6.4% (2017: 5.8%) of our net sales revenue. This level of spending is at the top end of our target range and reflects the accelerated investment in revenue‑generating assets as planned.
In 2018, capital expenditure amounted to €427 million, of which 51% was related to investment in production equipment and facilities, and 33% to the acquisition of marketing equipment such as coolers that we place in retail outlets.
Free cash flow is 13.1% or €56 million lower compared to the prior year, mainly driven by increased capital expenditure, followed by an increase in working capital.
For a number of years, our annual capital expenditure was set to be in a range between 5.5% and 6.5% of net sales revenue. Taking into account the impact of IFRS 16, which we will adopt from 2019 onwards, the restated annual capital expenditure target range becomes 6.5% to 7.5% of net sales revenue.
Smarter procurement and joint initiativesWe are focused on digitalising our procurement processes, with a goal to complete by 2021. This reduces transactional costs and speed to market, and simplifies and streamlines processes for our people. In 2018, we introduced a new online platform to manage variances in commodity rates as part of this effort.
In our continuous effort to achieve greater value through innovation, we held a Supplier Innovation event, sponsored by our Group Supply Chain Director, in June 2018. With 11 of our most critical suppliers, we explored potential opportunities and collaborations in sustainability, automation, augmented reality, digital printing and innovative packaging, kicking off a number of innovative ventures.
Our journey to optimise packaging to reduce our plastics usage continued during the year. As a result, we increased the amount of recycled PET we used overall. We also reduced our overall use of materials through package redesign in specific markets. In Ireland for instance, new closures for water resulted in a 30% reduction in packaging weight, saving 220 tonnes of polypropylene per year.
Our suppliers are required to uphold our high sourcing standards. We have guidelines and tools for supplier selection and governance, including Supplier Guiding Principles, and a pre-assessment process which includes sustainability criteria for supplier selection.
On an ongoing basis, we monitor the activities of our critical suppliers through our internal supply base assessments, using information from audits of compliance with our Supplier Guiding Principles and EcoVadis, a third-party CSR assessment platform to manage supply chain sustainability performance. The EcoVadis platform helps us to monitor a range of risks using 21 criteria from international standard setters including UN Global Compact, ISO 26000, The Global Reporting Initiative and International Labor Organization. In 2018, more than 280 of our critical suppliers were assessed by EcoVadis and our plans are to extend the third-party CSR assessments in order to ensure more objectivity and equity against our suppliers.
To increase awareness of sustainability in our supply chain, in the last two years we performed sustainability days with strategic suppliers in Switzerland, Serbia and Montenegro, Russia, Poland and Greece. These events created opportunities to share our corporate social responsibility policy, sustainability commitments, achievements and best practices, and to begin working together on joint targets and initiatives.
Sustainable sourcingThe sourcing of our raw materials accounts for a large portion of our economic, operational and environmental footprint, and the behaviour of our suppliers directly impacts the sustainability performance and commitments of our Company. Consequently, we consider our suppliers as critical partners, contributing to the ongoing and sustainable success of our business.
PET PLASTIC ELIMINATED (TONNES)
79,820(VS. BASELINE)
WATER SAVED IN 2018
708(’000 M3)
PARTNERS IN EFFICIENCY CONTINUED58 COCA-COLA HBC

Water stewardship in the supply chainWater is the primary ingredient of our products, central to our manufacturing processes and necessary to grow the agricultural ingredients for our products. Because safe, good quality and adequate water is essential to the health of people and ecosystems, more efficient water use and innovative waste water treatment not only reduces costs but sustains communities and supports economic growth.
Water stewardship is therefore a high priority throughout the Coca‑Cola System. In addition to reducing our use of water, we treat 100% of the waste water from our operations, replenish the water used and help communities with their water challenges. We have had success reducing our water intensity, achieving a cumulative reduction of 22% vs. 2010 by the end of 2018. This puts us on track to achieve our target of reducing water usage per litre of beverage by 30% by 2020 compared to our 2010 baseline. After having achieved significant progress in implementation of our Top 10 water optimisation initiatives across our operations, we have shifted the approach to customised initiatives relevant for specific manufacturing sites and equipment. In 2018, we implemented 25 new water‑saving projects, investing €2.5 million and saving 708,210m3 of water.
To ensure sustainability of water sources and ecosystems, we require comprehensive water risk assessments and source water protection plans for each of our manufacturing sites. In addition, our goal is to certify all of our manufacturing sites in European Water Stewardship (EWS) or Alliance for Water Stewardship (AWS) standards.
As part of the Coca-Cola System, we have a uniform approach to sustainable agriculture, which is rooted in the principles of protecting the environment, upholding human and workplace rights, and helping to build more sustainable communities. These principles are showcased in The Coca-Cola Company’s Sustainable Agriculture Guiding Principles, which provide guidance to our suppliers of agricultural ingredients. We began this journey in 2013, with a roadmap for supplying sustainable agriculture ingredients.
The scale and uniform approach of the Coca-Cola System helps us source our raw materials sustainably, while helping us mitigate business risks. This helps us balance the costs of sustainability by leveraging relationships and initiating new opportunities, ensuring that our agricultural suppliers and their suppliers have a sustainable business. All suppliers are required to meet our Supplier Guiding Principles. These principles communicate our values and expectations of compliance with all applicable laws, and emphasise the importance of responsible workplace practices that respect human rights. This framework for sustainable sourcing is integrated into internal governance and procurement processes.
We expect to meet our target to certify at least 95% of key agricultural ingredients against our Sustainable Agriculture Guiding Principles by 2020. Our 2025 commitment is to achieve 100% certification of our main ingredients using sustainable agricultural standards.
In 2018, 64% of the key commodities we purchased for use as ingredients were certified, up from 33% in 2017. In 2019, we will continue to work with our suppliers who are still moving towards certification.
0.0
0.1
0.2
0.3
0.4
0.5
0.6
2010 2016 2017 2018 Target2019
2020goal*
0.370.
390.410.420.43
0.57
-35%vs. 2010
0
10
20
30
40
50
60 -75%vs. 2004
2004 2016 2017 2018*Target2019
2020goal
12.9
14.8
16.6
17.7
18.1
51.2
Energy use ratio in plants (MJ/litre of produced beverage)
* The internal 2020 target was reset in 2018 to reflect new product categories and production runs; in 2018 all CHP activities considered as externally owned.
Operational water footprint (billion litres)
* In 2018, we used a verified structured process for the calculation of the total COD reaching the environment which is used for the calculation of grey water.
SR
CG
FS
SSR
SI
59

These certifications recognise excellence at every stage of water management, including protection of water sources, the quality of waste water released into the environment and engagement with all water users and stakeholders in the water catchment area. At the end of 2018, 32 of our production sites in 18 countries, accounting for 60% of the total number of sites, had received water stewardship certifications (European Water Stewardship Certification or Alliance for Water Stewardship Certification). We have now, as part of our 2025 sustainability commitments, taken on the challenge of securing water availability in all our communities in water-risk areas. We use tools such as the World Wide Fund for Nature’s Water Risk Filter and Global Water Tool to identify the main future risks in water catchments. At our 17 manufacturing sites located in water-risk areas, we aim to reduce our water intensity by 20% by 2020, compared to our consumption in 2017.
To address water use issues across our value chain, we consider water use in our supplier evaluation assessments. Using the World Wide Fund for Nature’s Water Risk Filter, we identify the suppliers with high water risk per river basin and investigate with them their specific water targets and programmes. For our approach in our communities, please see the Communities section on pages 34‑39.
Packaging, recycling and waste managementAt the beginning of 2018, The Coca‑Cola Company announced the World Without Waste vision to help make a litter-free world possible. The objective is to collect and recycle the equivalent of 100% of the primary packaging the Coca-Cola System puts in the market by 2030.
We believe that every package has value beyond its initial use and should be collected and recycled.
As a leading bottler in the Coca-Cola System, we play a key role in delivering on the ambitious World Without Waste objective. Managing progress in collecting packaging waste is part of our 2025 sustainability commitments, and we partner with local communities, non-governmental organisations, industry, suppliers and consumers to tackle the challenge. Please see Communities section, pages 34‑39.
Our approach to packaging is holistic, minimising our impact on every stage of the lifecycle. We do this by reducing weight, increasing the use of recyclable materials and the overall recyclability of packaging, and developing renewable (plant‑based) materials. We are also investing in design innovations to build better packages and explore packaging-free alternatives for delivering our products.
In 2018, we reduced packaging materials by 19%* vs. 2010, eliminating 79,820 tonnes of PET plastic, 21,700 tonnes of glass and 4,200 tonnes of alumunium material, which would otherwise have been put into the market. The recycled and renewable (plant-based) content in our PET packaging was 9% or 25,722 tonnes, an increase of 1,570 tonnes compared to 2017. This helped to reduce our annual CO2 emissions by 38,330 tonnes.
CO2 ratio (scopes 1 and 2) (gCO2/litre of produced beverage)
* 2017 figure restated to include emissions from combined heat and power plants owned by the Company.
CO2 ratio (scopes 1, 2 and 3) (gCO2/litre of produced beverage)
* Restated 2010, 2016, 2017 and 2020 figures to include emissions from juice concentrates and verified CO2 factors for sugar.
0
15
30
45
60
75
90
2010 2016 2017* 2018 Target2019
2020goal
39.1
41.3
43.447
.050.3
78.3
-50%vs. 2010
0
100
200
300
400
500
600
2010*2016*2017* 2018 Target2019
2020*goal
370
360
369
387
402
493
-25%vs. 2010
* Considering neutral package mix evolution vs. 2010; packaging intensity reduction per litre of beverage produced is 4% in 2018 vs. 2010
COCA-COLA HBC60 PARTNERS IN EFFICIENCY CONTINUED

For the fifth consecutive year, four of our plants sent no waste to landfill in 2018, and we reduced the total amount of waste from plants to landfill to 0.36 grams per litre of beverages produced. This was an 8.5% reduction from 0.39 grams per litre of beverage produced in 2017.
Please see the Communities section for examples of our progress with waste on pages 34‑39.
Carbon and energyClimate change is increasing our energy and tax expenses, disrupting supplies of raw materials and causing disruptions in operations due to severe weather conditions. At the same time, this material issue presents opportunities to make our value chain more efficient and sustainable.
We have made notable progress addressing climate-related risks, taking an aggressively proactive approach. In 2016, we set science-based targets to reduce carbon emissions per litre of produced beverage by 50% in our operations and by 25% across our value chain by 2020 vs. our 2010 baseline. We were proud to be one of the first companies to introduce science-based targets, and are even prouder to have achieved, by the end of 2018, our 25% 2020 target for reduction of emissions in our value chain.
In 2018, we reached our internal target for use of renewable and clean energy – 40% of our total energy consumption. We are also on track to achieve our science-based target of 50% reduction in carbon emissions from direct operations, with a 42g/lpb reduction in 2018 and an overall reduction of 45% vs. 2010 emissions levels.
Furthermore, we reduced energy consumption in manufacturing by 2.5% in 2018 compared with 2017, and by 28% compared to 2010.
We realise we can and must do even more, and have therefore further raised our ambition level with our 2025 sustainability commitments. These commitments include:
· reducing further the carbon intensity of our operations by 30% vs. 2017;
· increasing energy-efficient refrigerators to 50% of our coolers in the market;
· sourcing 50% of total energy used from renewable and clean energy; and
· sourcing 100% of total electricity used in the EU and Switzerland from renewable and clean energy.
To ensure we meet our targets, we use an internal carbon price of €25 per metric tonne of CO2. We use this as part of our financial evaluation and in decision-making for further investments in carbon reduction and renewable energy. We hold regular reviews to confirm that we adhere to all applicable environmental laws and regulations, and internal standards. In addition, our environmental management systems and data at all bottling plants are audited annually by third parties.
To tackle the biggest part of our value chain carbon emissions, we are investing in a new generation of coolers which cut electricity use by more than half and use safe refrigerants which cause no harm to the atmosphere. In 2018, we invested in new coolers that helped our customers to save 1,001.5 million kWh electricity in absolute numbers and 6% in relative numbers, thus eliminating 401,263 tonnes of CO2 emissions annually.
To further strengthen our actions regarding climate change, and further improve our disclosure about our approach, we have committed to meeting the recommendations of the Task Force on Climate-related Financial Disclosure (TCFD). See the Managing risk and materiality section of this report on pages 63‑78 for this information.
Landfill waste ratio in manufacturing (g/litre of produced beverage)
0
1
2
3
4
5
6
2004 2016 2017 2018 Target2019
0.35
0.36
0.390.51
5.0
-93%vs. 2004
UN Sustainable Development GoalsOur sustained efforts to reduce our costs and improve our impact have generated significant results for our business, our communities, society and the environment. These results correspond to contributions to the Sustainable Development Goals for clean water and sanitation, clean energy, economic growth, industry innovation, sustainable communities, responsible production, climate action, life below water and life on land.
612018 INTEGRATED ANNUAL REPORTSR
CG
FS
SSR
SI

During the year, we found innovative ways to save water, energy and materials across our territory. Here are a few examples.
1. New cleaning technology introduced in RomaniaIn our plant in Ploiești, Romania, we invested €900,000 to introduce a new technology for better and faster cleaning of our production equipment, which will be in full operation in 2019. Using electro‑chemical activation cleaning will result in annual reductions of 100 tonnes of chemicals, 18,000m3 water, 2,730MWh in energy used and a drop in carbon emissions of 870 tonnes.
2. Heat pumps for energy and CO2 savings in Bosnia and HerzegovinaIn our Sarajevo plant, we installed heat pumps as a renewable alternative to fossil fuels. Heat generated from cooling processes in production will be reused for heating our administrative building. With an investment of €60,000, we are able to save 160,000kWh of energy and 110 tonnes of carbon emissions annually.
3. Decreased water consumption in RussiaIn our juice plant in Moscow, we increased the efficiency of the water treatment equipment by investing €200,000. The net impact is savings of 50,000m3 of water annually.
4. Vigilance pays off in NigeriaIn the last two years, our Port Harcourt plant in Nigeria reduced its water consumption by double digits. The 19% drop in water consumption compared with 2016, is due to a massive behavioural change, including a bottom‑up approach to investigating each water, air and steam leak, and immediate repair. The project captured the imagination of the whole production floor.
5. Reduced packaging for water brands in Hungary and AustriaFor our water brands in Hungary and Austria, we introduced new closures and bottle designs which are up to 2.17g lighter. The impact of this change is a reduction of more than 630 tonnes of plastic and 570 tonnes of carbon emissions annually.
3. RUSSIA
50,000m3
WATER SAVED
2. BOSNIA AND HERZEGOVINA
110 tonneFEWER CARBON EMISSIONS
4. NIGERIA
19%DECREASE IN WATER CONSUMPTION
5. HUNGARY AND AUSTRIA
up to 2.17gLIGHTER DESIGNS FOR BOTTLES
1. ROMANIA
€900,000INVESTMENT IN NEW TECHNOLOGY
62 COCA-COLA HBC PARTNERS IN EFFICIENCY CONTINUED

MANAGING RISK AND MATERIALITY
63
Through our annual materiality assessment, we consider the importance of all environmental, social, economic and financial topics that could either positively or negatively affect our ability to create value over the short, medium and long term. We also assess material issues based on their relevance to our strategic plans and objectives. Assessing their importance and impact provides a guide to strategically managing the risks and opportunities they represent.
Our annual materiality assessment, carried out by our cross-functional Mission Sustainability Team, consists of four phases.
· identify material issues;
· assess impact on or importance to stakeholders;
· assess impact on society and environment; and
· review and validate findings.
The work to ensure that management of material issues is successfully embedded in our strategy and operations is carried out by three groups within the Company. The Mission Sustainability Team assesses the list of material issues and ensures that our sustainability approach is fully aligned with our business priorities. The Social Responsibility Committee of the Board of Directors subsequently endorses the prioritised list of issues and the resulting materiality matrix. Finally, it is the responsibility of the Operating Committee to integrate our sustainability priorities into our business strategy.
To support our annual materiality assessment, we conduct ongoing dialogue with our stakeholders, including employees, consumers, customers, suppliers, communities, governments, non-governmental organisations, investors, trade associations and academics.
OUR APPROACH TO MATERIALITY
Our material issues are those that matter most to our stakeholders and subsequently impact on the Company’s value drivers, competitive position
and long-term value creation. We assess our material issues annually to fully understand how to manage the risks and opportunities they present.
INTRODUCTION TO RISK AND MATERIALITYAs we transform our business and expand our product portfolio, the process of understanding and managing our material issues and principal risks is more important than ever. To support success, we use a well-established, collaborative approach. Due to their criticality, our material issues and principal risks are monitored closely by the Operating Committee and our Board.
Engaging stakeholdersWe engage with our stakeholders to listen to and understand their insights into the issues that matter most to our communities and our business. This engagement allows our leadership to understand emerging trends and different perspectives, strengthens our relationships and helps us to evolve our strategy, make better business decisions to deliver on our commitments, as well as to focus our reporting on the issues that they care about.
Our key internal and external stakeholders include investors, employees, customers, suppliers, local communities, non-governmental organisations, governments and regulators, among others.
Environmental, social, economic and financial issues touch on every aspect of our business. Therefore, we are engaging with stakeholders by means of all relevant functions and across all our markets. This is done through co-operation with trade associations, governments, civil organisations and alliances, in various meetings, forums and events.
COCA-COLA HBC64 MANAGING RISK AND MATERIALITY CONTINUED
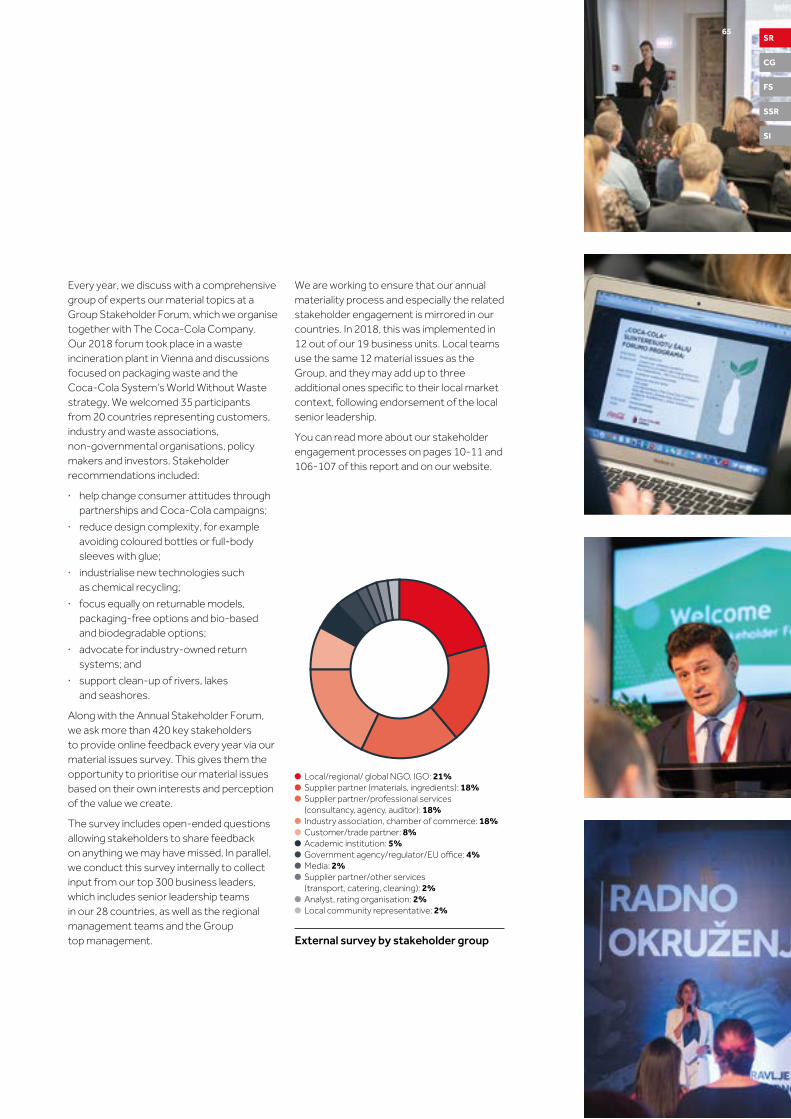
Every year, we discuss with a comprehensive group of experts our material topics at a Group Stakeholder Forum, which we organise together with The Coca-Cola Company. Our 2018 forum took place in a waste incineration plant in Vienna and discussions focused on packaging waste and the Coca-Cola System’s World Without Waste strategy. We welcomed 35 participants from 20 countries representing customers, industry and waste associations, non-governmental organisations, policy makers and investors. Stakeholder recommendations included:
· help change consumer attitudes through partnerships and Coca-Cola campaigns;
· reduce design complexity, for example avoiding coloured bottles or full-body sleeves with glue;
· industrialise new technologies such as chemical recycling;
· focus equally on returnable models, packaging-free options and bio-based and biodegradable options;
· advocate for industry-owned return systems; and
· support clean-up of rivers, lakes and seashores.
Along with the Annual Stakeholder Forum, we ask more than 420 key stakeholders to provide online feedback every year via our material issues survey. This gives them the opportunity to prioritise our material issues based on their own interests and perception of the value we create.
The survey includes open-ended questions allowing stakeholders to share feedback on anything we may have missed. In parallel, we conduct this survey internally to collect input from our top 300 business leaders, which includes senior leadership teams in our 28 countries, as well as the regional management teams and the Group top management.
We are working to ensure that our annual materiality process and especially the related stakeholder engagement is mirrored in our countries. In 2018, this was implemented in 12 out of our 19 business units. Local teams use the same 12 material issues as the Group, and they may add up to three additional ones specific to their local market context, following endorsement of the local senior leadership.
You can read more about our stakeholder engagement processes on pages 10-11 and 106-107 of this report and on our website.
Local/regional/ global NGO, IGO: 21% Supplier partner (materials, ingredients): 18%Supplier partner/professional services(consultancy, agency, auditor): 18%Industry association, chamber of commerce: 18%Customer/trade partner: 8%Academic institution: 5%Government agency/regulator/EU office: 4%Media: 2%Supplier partner/other services(transport, catering, cleaning): 2%Analyst, rating organisation: 2%Local community representative: 2%
External survey by stakeholder group
SR
CG
FS
SSR
SI
65SR
CG
FS
SSR
SI

MANAGING OUR MATERIAL ISSUES
Ver
y hi
ghH
igh
Mod
erat
e
2018 Materiality matrix
Very highHighModerate
Impo
rtan
ce to
sta
keho
lder
s
Impact of the issue on environment and society
The outcome of our material issues survey is a ranking of material issues. By assessing the importance of these issues to our stakeholders, combined with an assessment of their impact on society and environment, we derive the relative materiality of each issue and prioritise them accordingly.
Following the process of prioritising our material issues, the Operating Committee ensures their proper implementation in our overall strategic framework.
This includes setting and disclosing targets and metrics to measure progress.
We understand that companies such as Coca-Cola HBC play a critical role in addressing challenges the world faces. In the past, we have linked our material issues to the Sustainable Development Goals (SDGs), established by the UN to achieve long-term growth and development by 2030. In 2018, when introducing our new 2025 sustainability commitments, we went a step further, aligning our materiality topics not only with the applicable 15 goals, but with all relevant underlying targets for each SDG.
You can find more about how our sustainability commitments align with the targets underpinning the SDGs in the GRI Content Index: https://coca-colahellenic.com/Campaigns/AnnualReport2018/assets/pdf/Coca-Cola-HBC-2018-GRI-Content-Index.pdf
Our work to manage the potential risks, opportunities and impacts of our material issues takes place across the Company, and on the front lines of each of our markets. The list on page 67 outlines where our approach to managing each material issue is reported.
While the prioritisation of our 12 material issues has evolved, the same issues continue to be the most relevant and important to our stakeholders and our business.
Marketing
Sourcing
Economic impact
Corporate citizenship
Nutrition
Employee wellbeing & engagement
Human rights & diversity
Water stewardship
Carbon & energy
Product quality & integrityCorporate governance,
business ethics & anti-corruption
Packaging, recycling & waste management
Economic dimension Social dimensionEnvironmental dimension
66 COCA-COLA HBC MANAGING RISK AND MATERIALITY CONTINUED

Compliance with the Non-financial Reporting Directive requirements
Reporting requirement Some of our relevant policies Where to read more in this report Page
Environmental matters
· Environmental policy · Climate change policy · Packaging waste and recycling policy · Sustainable Agricultural Guiding Principles · Water stewardship policy
· Our approach to sustainability · Sustainability commitments related to
environment · Climate, energy, water · World Without Waste · Sourcing
2-3, 4-5, 9, 13, 22, 2524-25
24, 25, 57, 59-6024, 25, 38, 39, 6058-61
Employees · Code of Business Conduct · Inclusion & Diversity policy · Occupational Health & Safety policy · Quality & Food safety policy
· People engagement · Diversity and inclusion · Learning and development · Health, safety and wellbeing
26-33
Human rights · Human rights policy · Supplier Guiding Principles · Slavery and Human Trafficking Statement
· Human rights · Working with suppliers
11, 31, 70-71, 81, 12158-59
Social matters · Health & Wellness policy · HIV/AIDS policy · Code of Business Conduct · Supplier Guiding Principles · GMO position statement · Community contributions policy · Premium spirits responsible marketing policy · Public policy engagement · Quality & Food safety policy
· Communities section · Sourcing
34-3958-61
Anti-bribery and corruption
· Code of Business Conduct · Anti-bribery policy and compliance
handbook · Supplier Guiding Principles · Community contributions policy
· Governance and compliance 68-69, 76, 117, 88-121
Business model · Our business model 11, 14-15
Principal Risk and Materiality
· Risk policy · Description of risk process, Risk management, Risk governance, Our approach to materiality, Materiality matrix
64-78
Non-financial KPIs
· Sustainability commitments 2020 and 2025 · GRI content list and GRI indicators
24-25https://coca-colahellenic.com/en/investors/2018-integrated-annual-report/
672018 INTEGRATED ANNUAL REPORTSR
CG
FS
SSR
SI
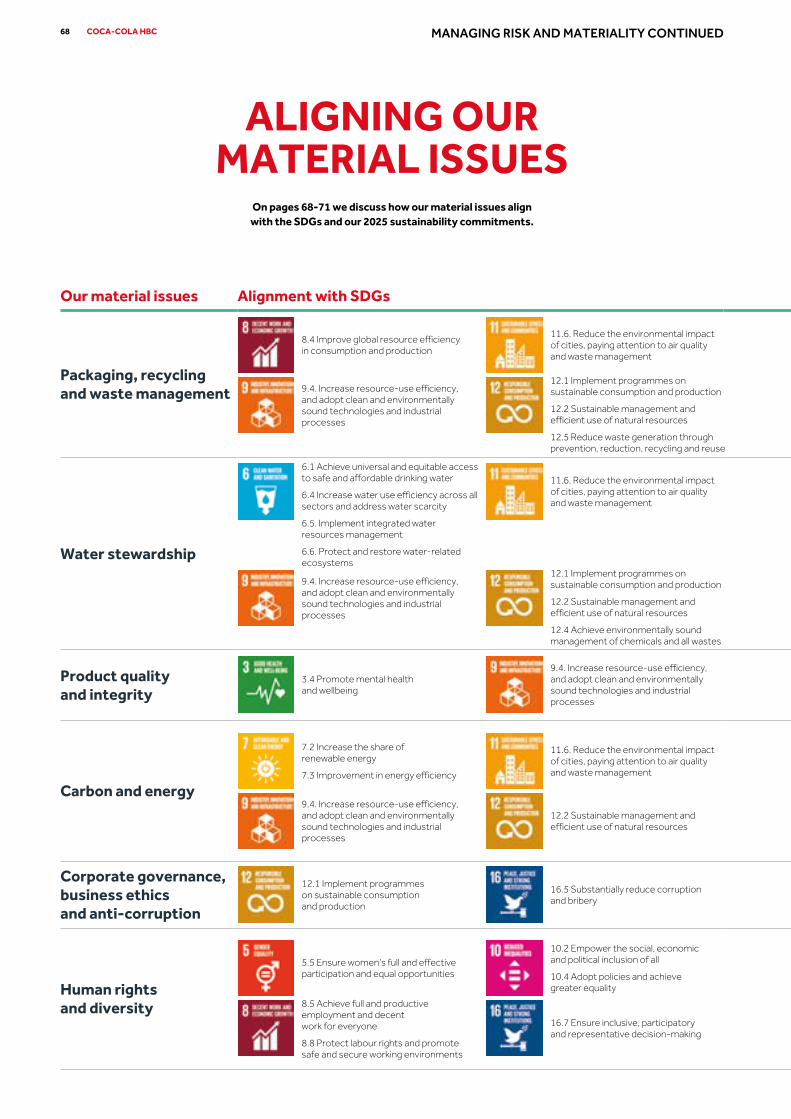
ALIGNING OUR MATERIAL ISSUES
On pages 68-71 we discuss how our material issues align with the SDGs and our 2025 sustainability commitments.
Our material issues Alignment with SDGs 2025 sustainability commitments*
Packaging, recycling and waste management
100% of consumer packaging to be recyclable**
35% of total PET used from recycled PET and/or PET from renewable material
20 engage in 20 Zero Waste partnerships (city and/or coast)
75% help collect the equivalent of 75% of our primary packaging
Water stewardship
20% water reduction in plants located in water-risk areas
100% help secure water availability for all our communities in water-risk areas
Product quality and integrity
100% of our key agricultural ingredients sourced
in line with sustainable agricultural principles
25% reduce calories per 100ml of sparkling soft drinks (all CCH countries)***
Carbon and energy
30% reduction in carbon ratio in direct operations
50% increase in energy-efficient refrigerators to half of our coolers in the market
50% of our total energy from renewable and clean sources
100% total electricity used in EU&CH from renewable and clean energy
Corporate governance, business ethics and anti-corruption
Human rights and diversity
100% of our key agricultural ingredients sourced in line with sustainable agricultural principles
ZER0 target zero fatalities and reduce (lost time) accident rate by 50%
1 MIL train 1 million young people through #Youth Empowered
50% of managers are women
12.1 Implement programmes on sustainable consumption and production
16.5 Substantially reduce corruption and bribery
12.2 Sustainable management and efficient use of natural resources
9.4. Increase resource-use efficiency, and adopt clean and environmentally sound technologies and industrial processes
7.2 Increase the share of renewable energy
7.3 Improvement in energy efficiency
11.6. Reduce the environmental impact of cities, paying attention to air quality and waste management
12.1 Implement programmes on sustainable consumption and production
12.2 Sustainable management and efficient use of natural resources
12.5 Reduce waste generation through prevention, reduction, recycling and reuse
11.6. Reduce the environmental impact of cities, paying attention to air quality and waste management
9.4. Increase resource-use efficiency, and adopt clean and environmentally sound technologies and industrial processes
8.4 Improve global resource efficiency in consumption and production
6.1 Achieve universal and equitable access to safe and affordable drinking water
6.4 Increase water use efficiency across all sectors and address water scarcity
6.5. Implement integrated water resources management
6.6. Protect and restore water-related ecosystems
12.1 Implement programmes on sustainable consumption and production
12.2 Sustainable management and efficient use of natural resources
12.4 Achieve environmentally sound management of chemicals and all wastes
9.4. Increase resource-use efficiency, and adopt clean and environmentally sound technologies and industrial processes
11.6. Reduce the environmental impact of cities, paying attention to air quality and waste management
3.4 Promote mental health and wellbeing
9.4. Increase resource-use efficiency, and adopt clean and environmentally sound technologies and industrial processes
5.5 Ensure women’s full and effective participation and equal opportunities
8.5 Achieve full and productive employment and decent work for everyone
8.8 Protect labour rights and promote safe and secure working environments
10.2 Empower the social, economic and political inclusion of all
10.4 Adopt policies and achieve greater equality
16.7 Ensure inclusive, participatory and representative decision-making
68 COCA-COLA HBC MANAGING RISK AND MATERIALITY CONTINUED

For more on our material issues
See pages 64-66
For more on our SDGs
See pages 33, 47, 53, 61, 68-71
For more on our 2025 commitments
See pages 24-25
Our material issues Alignment with SDGs 2025 sustainability commitments*
Packaging, recycling and waste management
100% of consumer packaging to be recyclable**
35% of total PET used from recycled PET and/or PET from renewable material
20 engage in 20 Zero Waste partnerships (city and/or coast)
75% help collect the equivalent of 75% of our primary packaging
Water stewardship
20% water reduction in plants located in water-risk areas
100% help secure water availability for all our communities in water-risk areas
Product quality and integrity
100% of our key agricultural ingredients sourced
in line with sustainable agricultural principles
25% reduce calories per 100ml of sparkling soft drinks (all CCH countries)***
Carbon and energy
30% reduction in carbon ratio in direct operations
50% increase in energy-efficient refrigerators to half of our coolers in the market
50% of our total energy from renewable and clean sources
100% total electricity used in EU&CH from renewable and clean energy
Corporate governance, business ethics and anti-corruption
Human rights and diversity
100% of our key agricultural ingredients sourced in line with sustainable agricultural principles
ZER0 target zero fatalities and reduce (lost time) accident rate by 50%
1 MIL train 1 million young people through #Youth Empowered
50% of managers are women
17.14 Enhance policy coherence for sustainable development
17.17 Encourage and promote effective cross-sector partnerships
13.1 Strengthen resilience and adaptive capacity to climate-related hazards
17.17 Encourage and promote effective cross-sector partnerships
14.1 Prevent and reduce marine pollution
17.17 Encourage and promote effective cross-sector partnerships
15.1 Ensure the conservation, restoration and sustainable use of terrestrial and inland freshwater ecosystems
12.7. Promote sustainable, public procurement practices
12.8. Ensure information and awareness for sustainable development and lifestyles in harmony with nature
SR
CG
FS
SSR
SI
2018 INTEGRATED ANNUAL REPORT 69

Our material issues Alignment with SDGs 2025 sustainability commitments*
Nutrition 25% reduce calories per 100ml of sparkling soft drinks (all CCH countries) ***
Corporate citizenship
10% community participants in first-time managers’ development programmes
1 MIL train 1 million young people through #Youth Empowered
20 engage in 20 Zero Waste partnerships (city and/or coast)
10% of employees take part in volunteering initiatives
Economic impact
100% help secure water availability for all our communities in water-risk areas
100% of our key agricultural ingredients sourced in line with sustainable agricultural principles
10% community participants in first-time managers’ development programmes
1 MIL train 1 million young people through #Youth Empowered
20 engage in 20 Zero Waste partnerships (city and/or coast)
Employee wellbeing and engagement
ZER0 target zero fatalities and reduce (lost time) accident rate by 50%
50% of managers are women
10% community participants in first-time managers’ development programmes
10% of employees take part in volunteering initiatives
1 MIL train 1 million young people through #Youth Empowered
Sourcing 100% of our key agricultural ingredients sourced in line with sustainable agricultural principles
Marketing 25% reduce calories per 100ml of sparkling soft drinks (all CCH countries) ***
12.6. Encourage companies to adopt sustainable practices and to integrate sustainability information into reporting
12.8. Ensure information and awareness for sustainable development and lifestyles in harmony with nature
8.3. Encourage the growth of micro-, small- and medium-sized enterprises
12.1 Implement programmes on sustainable consumption and production
12.2 Sustainable management and efficient use of natural resources
12.4 Achieve environmentally sound management of chemicals and all wastes
12.6. Encourage companies to adopt sustainable practices and to integrate sustainability information into reporting
12.7. Promote sustainable, public procurement practices
9.4. Increase resource-use efficiency, and adopt clean and environmentally sound technologies and industrial processes
3.4 Promote mental health and wellbeing
12.8. Ensure information and awareness for sustainable development and lifestyles in harmony with nature
3.4. Promote mental health and wellbeing
3.6. Halve global deaths and injuries from road traffic accidents
8.5 Achieve full and productive employment and decent work for everyone
5.5 Ensure women’s full and effective participation and equal opportunities
10.2 Empower the social, economic and political inclusion of all
10.4 Adopt policies and achieve greater equality
4.3 Ensure equal access to affordable and quality education
4.4 Increase the number of youth and adults with relevant job skills
17.16 Enhance the Global Partnership for Sustainable Development
17.17 Encourage and promote effective cross-sector partnerships
8.6 Reduce the proportion of youth not in employment, education or training
11.6. Reduce the environmental impact of cities, paying attention to air quality and waste management
1.1 Eradicate extreme poverty
8.4 Improve global resource efficiency in consumption and production
8.5 Achieve full and productive employment and decent work for everyone
8.6 Reduce the proportion of youth not in employment, education or training11.6. Reduce the environmental impact
of cities, paying attention to air quality and waste management
70 COCA-COLA HBC MANAGING RISK AND MATERIALITY CONTINUED

Our material issues Alignment with SDGs 2025 sustainability commitments*
Nutrition 25% reduce calories per 100ml of sparkling soft drinks (all CCH countries) ***
Corporate citizenship
10% community participants in first-time managers’ development programmes
1 MIL train 1 million young people through #Youth Empowered
20 engage in 20 Zero Waste partnerships (city and/or coast)
10% of employees take part in volunteering initiatives
Economic impact
100% help secure water availability for all our communities in water-risk areas
100% of our key agricultural ingredients sourced in line with sustainable agricultural principles
10% community participants in first-time managers’ development programmes
1 MIL train 1 million young people through #Youth Empowered
20 engage in 20 Zero Waste partnerships (city and/or coast)
Employee wellbeing and engagement
ZER0 target zero fatalities and reduce (lost time) accident rate by 50%
50% of managers are women
10% community participants in first-time managers’ development programmes
10% of employees take part in volunteering initiatives
1 MIL train 1 million young people through #Youth Empowered
Sourcing 100% of our key agricultural ingredients sourced in line with sustainable agricultural principles
Marketing 25% reduce calories per 100ml of sparkling soft drinks (all CCH countries) ***
* Baseline 2017** Technical recyclability by design*** Baseline 2015
17.17 Encourage and promote effective cross-sector partnerships
13.1 Strengthen resilience and adaptive capacity to climate-related hazards
16.7 Ensure inclusive, participatory and representative decision-making
12.2 Sustainable management and efficient use of natural resources
12.7. Promote sustainable, public procurement practices
17.13 Enhance global macroeconomic stability
SR
CG
FS
SSR
SI
2018 INTEGRATED ANNUAL REPORT 71

EFFECTIVE MANAGEMENT OF RISK
Enterprise risk managementThe management of our business risks is intrinsically linked to materiality. During 2018, we have further embedded the Enterprise risk management (ERM) programme into our Company’s culture through the development of a Smart Risk programme. This programme is linked to our growth mindset and drives cultural change by encouraging us to take informed risks to leverage opportunities. The cultural component is supported by an enhanced ERM framework that boosts our speed in risk identification and management. The ERM programme is led by the Group Chief Risk Officer (CRO) who works in close collaboration with the risk owners across our business units and specialised functions, such as information technology, on specific business risks. The CRO also maintains a wide-angled view of all business streams and the linkages between risk and innovation.
Our Board retains overall accountability for the Group’s risk management and internal control systems.
Through quarterly reporting to the Audit and Risk Committee, the Board is provided with updates on critical issues and visibility of the effectiveness of the systems and processes. The Board has defined the Group’s risk appetite and reviews our risk exposure, ensuring that material matters and principal risks are managed and aligned to our strategic goals and objectives.
Our new Smart Risk programme enhances cross functional collaboration with the strong internal partnerships driving the successful application of the programme. New features and activities introduced in 2018 include:
· development of the Smart Risk model, which drives a culture of informed risk-taking, supporting innovation and growth; and
· an enhanced ERM framework that drives monthly leadership discussions on risk and opportunity, and supports the Smart Risk model and related culture shift. It clearly articulates the continuous process for the identification and evaluation of significant risks to the achievement of our business objectives.
These new features and activities build on our ongoing processes, which include:
· clear business strategies, objectives and principles;
· Group statements on strategic direction, ethics and values;
· programme integration into the business planning cycle;
· continual monitoring of our internal and external environment for factors that may change our risk profile and create opportunities;
· training and awareness programmes across all business units and functions which are focused on embedding the Smart Risk concept into our DNA, creating informed risk-taking leaders across all management levels; and
· the annual evaluation of the type and amount of Group insurance purchased from the market while leveraging our captive insurance entity. This is with reference to the availability of insurance cover and cost measured against the probability and magnitude of the relevant risks.
Review of the programmeAnnually, our internal audit department conducts an independent review of the risk management programme. The audit team evaluates, across business units and functions, the risk management and business resilience programmes, the specific processes and their application against business best practices and the International Accounting Standard. The Corporate Audit Director makes recommendations to improve the overall risk management programme, where required, with the findings submitted to the Audit and Risk Committee.
In addition to the review of our risk management programme, the Board and its Committees also conduct an annual review of the effectiveness of our internal controls and further details are set out in the Audit and Risk Committee Report on pages 112-117. The Board confirms that it has concluded that our risk management and internal control systems are effective.
Our principal risksWhile the overview of our most important risks involves an assessment of the likelihood of their occurrence and their potential consequences, it does not include all risks that can ultimately affect the Company. There are predictable levels that we can identify and manage. However, there are risks that are not yet known to us, and risks currently believed to be immaterial that could ultimately have an impact on our business or financial performance.
Leveraging our robust risk management programme, we are constantly vigilant to the uncertainty in our operating environments. In this way, we proactively identify new risks and opportunities, and strive to understand the threats to our business viability.
During 2018, we observed general trend stability across the majority of our principal risks. In some areas, we have seen changes to the operating environment that necessitated minor changes to risk articulation and prioritisation. For example, our sustainability risk (Climate, Carbon, Packaging and Water) increased in importance with the escalation of consumer concerns and public debate relating to plastics and packaging waste across our markets, and investor interest in risks and opportunities relating to climate adaptation. We are also cognisant of the continued threats all businesses face regarding cyber-incidents and this principal risk has therefore also increased in priority.
Furthermore, our regulatory challenges risk was renamed and modified to ‘Ethics and Compliance’ as this more accurately reflects the dynamics of this risk.
creating and protecting business value
72 COCA-COLA HBC MANAGING RISK AND MATERIALITY CONTINUED

Our enhanced framework to manage riskOur enterprise risk management process for the identification, review, management and escalation of both risks and opportunities was further enhanced in 2018, and integrates the best aspects of both ISO 31000 and the revised COSO frameworks. In 2018, this process incorporated the following activities:
· Monthly risk discussions were undertaken by the business units; and
· Quarterly risk reviews were undertaken by the business units and corporate functions.
· The CRO and his team facilitated 25 of these sessions with senior leaders; and
· An introduction to the Smart Risk programme was delivered to the business units.
· On a quarterly basis, the CRO briefed the Audit and Risk Committee on material risks, management actions, and process compliance with the risk management elements of the UK Corporate Governance Code.
Opportunities and risks
Feedback to this
process
<
<
· The CRO facilitated regional-level reviews with the Regional Directors and their teams evaluating the risks and management actions in May and November; and
· Stakeholder feedback was provided after these sessions, ensuring a cyclic bottom-up, top-down information loop.
· The Operating Committee reviewed the findings of the GRF in May and November. With the CRO they discussed, evaluated and aligned our strategic risks and exposures.
· Our internal think tank, the Group Risk Forum (GRF) which is chaired by the CRO, convened in May and November. The forum evaluated risk trends and the risk environment as part of the preparation of our strategic risk register and principal risks.
The Group Risk Forum
Monthly focus with quarterly reviews
Operating Committee
review
Board review
Management review
CRO leadership
sessions
Winner of the 2018 CIR Award for Risk Management Team of the YearThe Business Resilience team was announced ‘Risk Management Team of the Year’ at the 2018 CIR awards in London. The award recognises both our ERM programme and its activation across Coca-Cola HBC by the team.
732018 INTEGRATED ANNUAL REPORTSR
CG
FS
SSR
SI

Principal risks Description Potential impact Key mitigationsLink to material issues
1. Environmental: Climate, carbon, plastics, waste and water
Failure to reduce our environmental footprint and to meet stakeholders’ expectations, particularly relating to climate change, water availability, packaging waste and sustainable agriculture.
· Long-term damage to our licence to operate
· Losing our ‘seat at the table’ to contribute to legislation related to environmental and social sustainability
· Increased cost of doing business
· Loss of consumer base
· Energy management programmes and transition to renewable and clean energy
· Water reduction and waste water treatment programmes, as well as support for water stewardship initiatives in water-risk areas
· Packaging waste management and World Without Waste global programmes
· Partnering with local and international NGOs on common issues such as nature conservation, water stewardship and packaging recovery
· Partnering with local communities, start-ups and academia to minimise environmental impacts
· Focus on sustainable procurement · Commitment to the Task Force on
Climate-related Financial Disclosures (TCFD) recommendations
· Carbon and energy
· Packaging, recycling and waste management
· Sourcing · Water
stewardship
2. Consumer health and wellbeing
Failure to adapt to changing consumer health trends, public health policies addressing misconceptions about our formulations, sugar and the health impact of soft drinks.
· Failure to achieve our growth plans
· Damage to our brand and corporate reputation
· Loss of consumer base
· Focus on product innovation and expansion to a total beverage portfolio
· Expand our range of low- and no-calorie beverages
· Introduce smaller packs · Reduce the calorie content of products
in the portfolio · Clearer labelling on packaging · Promote active lifestyles through consumer
engagement programmes focused on health and wellness
· Marketing · Nutrition · Product
quality and integrity
3. Cyber incidents A cyber-attack or data centre failure resulting in business disruption, or breach of corporate or personal data confidentiality.
· Financial loss · Operational disruption · Damage to corporate
reputation · Non-compliance with
data protection legislation (e.g. GDPR)
· Implement a cyber-security and privacy control framework and monitor compliance
· Safeguard critical IT and operational assets · Detect, respond and recover from cyber
incidents and attacks · Foster a culture of cyber-security · Monitor threat landscape and remediate
associated vulnerabilities
· Economic impact
4. Foreign exchange and commodity prices
Foreign exchange and commodity exposure arises from changes in exchange rates and commodity prices. Currency devaluation, in combination with capital controls, restricts movement of funds and increases the risk of asset impairment.
· Financial loss · Increased cost base · Asset impairment · Limitations on cash
repatriation
· Treasury policy requires the hedging of 25% to 80% of rolling 12-month forecasted transactional foreign currency exposure
· Hedging beyond 12 months may occur in exceptional cases subject to approval of Group CFO
· Treasury policy requires the hedging of rolling three-year commodity exposures; different policy limits apply for each hedge-able commodity
· Derivative financial instruments are used, where available, to reduce net exposure to currency and commodity price fluctuations
· Economic impact
74 COCA-COLA HBC MANAGING RISK AND MATERIALITY CONTINUED

Principal risks Description Potential impact Key mitigationsLink to material issues
5. Channel mix A continued increase in the concentration of retailers and independent wholesalers on whom we depend to distribute our products. The immediate consumption channel remains under pressure as consumers alter consumption habits.
· Reduced availability of our portfolio and overall profitability
· Enhance our key account capabilities to partner and grow with top customers
· Work closely with our immediate consumption channel customers to drive incremental transactions
· Accelerate RED execution to support our commitment to operational excellence
· Develop our digital and e-commerce capabilities to capture opportunities associated with existing and new distribution channels
· Economic impact
6. People attraction
Inability to attract and retain sufficient numbers of qualified and experienced employees in highly competitive talent market.
· Failure to achieve our growth plans
· Upgrade our Employer Value Proposition and Employer Brand
· Develop leaders and people for key positions internally, improve leaders’ skills and commitment for talent development
· Create shared value with the communities in which we work to ensure we are seen and considered as an ethical business with an attractive purpose
· Expand talent pool by hiring more diverse workforce
· Employee wellbeing and engagement
· Corporate citizenship
· Human rights and diversity
7. People engagement
Inability to ensure ongoing engagement and commitment of our workforce.
· Failure to achieve our growth plans
· Promote operational excellence and remove barriers to performance
· Measure culture and engagement, and address findings through continuous listening to our people
· Improve wellbeing of employees · Improve leaders’ skills to enable, engage and
energise employees sustainably · Promote inclusive environment that allows all
employees to realise their full potential
· Employee well-being and engagement
· Human rights and diversity
8. Declining consumer demand
Volatile and challenging macroeconomic, security and political conditions can affect consumer demand and create security risks across our diverse mix of markets.
· Eroded consumer confidence affecting spending
· Inflationary pressures · Social unrest · Safety of people and
security of assets
· Seek to offer the right brand, at the right price, in the right package through the right channel
· Robust security practices and procedures to protect people and assets
· Crisis response and business continuity strategies
· Economic impact
· Corporate citizenship
Key for principal risks table
Increasing
Stable
Decreasing
752018 INTEGRATED ANNUAL REPORTSR
CG
FS
SSR
SI

Principal risks Description Potential impact Key mitigationsLink to material issues
9. Discriminatory taxes
Regulations on consumer health, government misconceptions relating to formulations and the risk of being a target for governments and interest groups to introduce discriminatory taxation (e.g. sugar) and packaging waste recovery taxation.
· Reduction in profitability
· Proactively working with governments and regulatory authorities to ensure that the facts relating to formulations are clearly understood and that our products are not singled out unfairly
· Retain our ‘seat at the table’ by demonstrating that we are a responsible and sustainable business
· Engaging with various stakeholder groups including NGOs and the communities in which we operate to deliver our 2025 sustainability commitments
· Economic impact
10. Quality The occurrence of quality/food safety issues, or the contamination of our products across our diverse total beverage portfolio.
· Damage to brand and corporate reputation
· Loss of consumer trust
· Reduction in volume and net sales revenue
· Stringent quality/food safety processes in place to minimise the likelihood of occurrence
· Early warning systems (Consumer Information Centres and social media monitoring) that enable issue identification
· Robust response processes and systems that enable us to quickly and efficiently deal with quality/food safety issues, ensuring customers and consumers retain confidence in our products
· Product quality and integrity
11. Ethics and compliance
We operate in some complex markets with high levels of perceived corruption. As a result, we are exposed to an increased risk of fraud against the Company as well as to the risk of Anti-bribery and Corruption (ABAC) fines or sanctions if our employees or the third parties we engage to deal with government fail to comply with ABAC requirements.
· Damage to our corporate reputation
· Significant financial penalties
· Management time diverted to resolving legal issues
· We may suffer economic loss because of fraud and reputational damages, fines and penalties, in the event of non-compliance with ABAC regulations by our employees or by third parties representing us with government
· Annual ‘Tone from the Top’ messaging · Code of Business Conduct (COBC), ABAC and
commercial compliance training and awareness campaigns for our entire workforce
· All third parties that we engage to deal with government on our behalf are subject to ABAC due diligence, and must agree and comply with our Supplier Guiding Principles
· Cross-functional Joint Task Force in Nigeria and Russia that pro-actively addresses risks in the most challenging of our operations
· Risk-based internal control framework and assurance programme with local management accountability
· Periodic risk-based internal audits of ABAC compliance programme
· Speak Up Hotline
· Corporate governance, business ethics and anti-corruption
12. Strategic stakeholder relationships
We rely on our strategic relationships and agreements with The Coca-Cola Company, Monster Energy and our Premium Spirits partners.
· Termination of agreements or unfavourable renewal terms could adversely affect profitability
· Management focus on effective day-to-day interaction with our strategic partners
· Working together as effective partners for growth
· Engagement in joint projects and business planning with a focus on strategic issues
· Participation in ‘Top to Top’ senior management forums
· Economic impact
13. Health and safety
The risk of health and safety issues being ineffectively managed. This incorporates the management of third-party providers, particularly fleet and logistics.
· Death or injury of employees, contractors or members of the public
· Employee engagement and motivation
· Attraction of talent/prospective employees
· Standardised programmes, policies and legislation applied locally
· Group oversight by the Health and Safety (H&S) Team
· H&S Board with the clear purpose to accelerate the H&S step-change plan implementation
· Implemented the Behavioural-Based Safety Programme
· Employee wellbeing and engagement
76 COCA-COLA HBC MANAGING RISK AND MATERIALITY CONTINUED

Hig
hIm
pact
Low
HighLow Likelihood
1 Environmental:
Climate, carbon, plastics, waste
and water
2 Consumer health and wellbeing
3 Cyber
incidents
4 Foreign
exchange and commodity
prices
5 Channel mix
6 People
attraction
7 People
engagement
8 Declining consumer
demand
9 Discriminatory
taxes
10 Quality
11 Ethics
and compliance
12 Strategic
stakeholder relationships
13 Health and
safety
210
12
7 31
9
4
611
5
138
PRINCIPAL RISK HEAT MAP
This heat map depicts the likelihood and impact of our principal risks. The timeframes for our principal risks are qualitatively assessed as part
of the preparation of our Viability Statement.
772018 INTEGRATED ANNUAL REPORTSR
CG
FS
SSR
SI

TASK FORCE ON CLIMATE-RELATED
FINANCIAL DISCLOSURES
Task Force on Climate-related Financial DisclosuresThe Financial Stability Board established the Task Force on Climate-related Financial Disclosures (TCFD) with the aim of improving disclosure of climate-related risks and opportunities. At Coca-Cola HBC, we set our first carbon reduction commitments in 2006 and were subsequently one of the first companies in the world to introduce science-based targets. We support efforts to improve quality and consistency of disclosures in this area and have therefore publicly committed to implementing the recommendations of the TCFD.
These recommendations form a voluntary framework for providing information on climate-related risks and their financial impacts for the use of investors, lenders, insurers and other stakeholders. Adopting the recommendations enables us to better understand and communicate the nature of the risks, the market forces and sensitivities, and the financial implications to our business.
To begin working and disclosing in alignment with this framework, in 2018 we created a working party to design and plan the implementation of core elements of its four pillars of governance, strategy, risk management and metrics and targets.
In respect to the area of governance, the Group Risk Forum brings together senior leaders from across the business to analyse risk and opportunity stemming from the provided data, to ensure visibility by the Operating Committee and our Board. Ultimately, the Board has oversight of climate-related risks and opportunities through the Social Responsibility Committee and the Audit and Risk Committee.
Our approach evaluates the external influences and internal contributors that impact risk and opportunity, thus influencing our risk modelling.
During 2018, discussions on climate-related risk were integrated into the overall risk management process across our Group.
This has seen the Group Risk Forum, business units, core functions and the TCFD working party actively discussing and evaluating risk and opportunity. From these initial deliberations, our initial modelling that addresses transition and physical risks, together with potential opportunities, was generated.
In the area of metrics and targets, we have performed a high-level assessment of a two-degree scenario, and in 2015 we set carbon reduction targets in both direct operations and in the value chain aligned with this scenario. Approved as science-based targets in early 2016, we committed to reduce the carbon emissions intensity in direct operations by 50% and in the value chain by 25% by 2020 vs. 2010.
In addition, we set targets for renewable energy, renewable electricity and carbon targets beyond 2020. Please see pages 24-25 for our 2025 sustainability commitments. The findings of our risks evaluation confirm the importance of understanding the critical dependencies of climate change on our business and ensuring that we have action plans in place to mitigate the risks and leverage opportunities.
Task Force on Climate-related Financial Disclosures
GovernanceDescribe the Board’s oversight of climate-related risks and opportunities Social Responsibility Committee:
Pages 64, 99, 120-121Describe management’s role in assessing and managing climate-related risks and opportunities
Audit and Risk Committee: Pages 99, 112-117 Risk and materiality: Pages 64-77
StrategyDescribe the climate-related risks and opportunities the business has identified Material issues: Page 66
Principal risks: Page 77
Risk managementDescribe the Company’s processes for identifying and managing climate-related risks Risk and materiality: Page 64-77Describe the targets used by the Company to manage climate-related risks and opportunities, and performance against targets
Principal risks: Page 77 Key performance indicators: Pages 24-25, 57-61
Metrics and targetsDisclose the metrics used by the Company to assess climate-related risks and opportunities in line with its strategy and risk management process
Reporting on our emissions: Pages 23, 60 Key performance indicators: Page 24-25, 57-61
Describe the targets used by the Company to manage climate-related risks and opportunities and performance against targets
Addressing climate change across our business: Page 24-25, 57-61
78 COCA-COLA HBC MANAGING RISK AND MATERIALITY CONTINUED
Business model and prospectsOur business model and strategy, as outlined on pages 14-17 of this report, document the key factors underpinning the understanding and evaluation of our prospects, which are our:
· attractive geographic diversity;
· strong sales and execution capabilities;
· market leadership;
· global brands; and
· diverse beverage portfolio.
Our strategy is being modified over time to sustainably create value for our shareholders, suppliers, employees, and the customers and communities we serve.
The Group’s business model has proven to be effective and resilient even during periods of challenging market conditions. Our Board has historically applied a prudent approach to the Group’s decisions relating to major projects and investments. From 2014 to 2018, we generated free cash flow of €394 million per year on average.
The Board considers that our diverse geographic footprint, including exposure to emerging markets with low per capita consumption, and a proven strategy in combination with our leading market position offer significant opportunities for future growth.
Key assumptions of the business plan and related viability periodThe Group continues to maintain a well-established strategic business planning process which has formed the basis of the Board’s quantitative assessment of the Group’s viability.
The business plan reflects our current strategy over a five-year rolling period. The financial projections included in the plan are based on the following key assumptions:
· key macroeconomic data that could impact our consumers’ disposable income and consequently our sales volume and revenues;
· key raw material costs;
· foreign currency rates;
· spending for production overheads and operating expenses;
· working capital levels; and
· capital expenditure.
The Board has assessed that a viability period of five years remains the most appropriate due to its alignment with the Group’s strategic business planning cycle. It is also consistent with the evaluated potential impacts of our principal risks which are disclosed on pages 74-76, the Group’s debt profile and our impairment review process, where goodwill and indefinite-lived intangible assets are tested based on our five-year forecasts.
Assessment of viabilityQualitatively, we analysed the output of our enhanced, robust enterprise risk management and internal business planning and liquidity management processes, to ensure that the risks to the Group’s viability are understood and are being effectively managed.
The Board has concluded that the Group’s comprehensive processes across multiple streams continue to provide a comprehensive framework that effectively supports the operational and strategic objectives of the Group. It also provides a robust basis for assessment and confirmation of the Company’s ability to continue in operation and meet its obligations as they fall due over the period of assessment. Supporting the qualitative assessment was a quantitative analysis performed as part of strategic business planning. This assessment included, but was not limited to, the Group’s ability to generate cash. We have continued to stress test the plan against several severe but plausible downside scenarios linked to certain principal risks as follows:
Scenario 1: The impact of changes to foreign exchange rates was considered, particularly the depreciation of foreign currencies including the Russian rouble, Nigerian naira and the Swiss franc. Principal risk: foreign exchange.
Scenario 2: Lower estimates for sales volumes were assessed. Principal risk: declining consumer demand.
Scenario 3: Lower estimates for sales revenue for reasons other than volume decline are considered. Principal risk: channel mix.
Scenario 4: The risk of discriminatory taxes in areas such as sugar and packaging. Principal risk: discriminatory taxes.
Scenario 5: The impact of higher raw material costs was also considered. Principal risk: commodity prices.
The above scenarios were tested both in isolation and in combination. The stress testing showed that due to the stable cash generation of our business, the Group would be able to withstand the impact of these scenarios occurring over the period of the financial forecasts. This could be conducted by making adjustments, if required, to our operating plans within the normal course of business.
Following a thorough and robust assessment of the Group’s risks that could threaten our business model, future performance, solvency or liquidity, the Board has concluded that the Group is well positioned to effectively manage its financial, operational and strategic risks.
Viability StatementBased on our assessment of the Company’s prospects, business model and viability as outlined above, the Directors can confirm that they have a reasonable expectation that the Group will be able to continue operating and meet its liabilities as they fall due over the five-year period ending 31 December 2023.
VIABILITY STATEMENT
792018 INTEGRATED ANNUAL REPORTSR
CG
FS
SSR
SI

I am pleased to report that 2018 was another year of impressive accomplishments, including significant progress towards our 2020 objectives. Our revenue growth management initiatives, strong in-market execution, and an unprecedented number of new product launches, supported by a favourable economic environment in most of our markets, resulted in the second consecutive year of currency- neutral revenue growth above our target range of 4-5%, combined with strong margin expansion.
Performance highlights for 2018 included:
· expansion in volume, and good price/mix, increased net sales revenue by 6.0% on a currency-neutral basis;
· reported net sales revenue increased by 2.1%;
· currency-neutral revenue per case improved in all segments, up 1.7% overall;
· volume increased by 4.2%, with growth in all segments and key categories;
· operating leverage drove a 20 basis-point reduction in comparable operating expenses as a percentage of net sales revenue, incorporating a 30 basis-point increase in marketing costs;
· comparable EBIT margin increased by 70 basis points to 10.2%; and
· comparable EPS increased by 5.9% to €1.306
In 2019, we expect to achieve another year of currency-neutral revenue growth above our target range of 4-5%. As we continue to manage our cost base carefully, we also expect another year of margin expansion, offset partly by currency depreciation and raw material cost inflation.
MICHALIS IMELLOSCHIEF FINANCIAL OFFICER
COCA-COLA HBC80 FINANCIAL REVIEW

STRONG REVENUE GROWTH DRIVES MARGIN EXPANSION
Income statementWe achieved a 4.2% increase in volume during 2018, an acceleration from the 2.2% growth rate in the prior year. We delivered strong performance in both sparkling drinks (including energy) and still beverages, which grew 4.7% and 3.0% respectively. Volume was up 1.0% in the Established segment, up 8.8% in the Developing segment and up 4.3% in the Emerging segment. The Established segment maintained the pace of volume expansion seen in the prior year, and the Developing and Emerging segments achieved a good improvement in the pace of growth, where our medium-sized markets continue to be an important component of overall volume growth. We are particularly pleased to see the strong result from Russia, which has returned to volume growth for the first time in three years.
Net sales revenue improved by 6.0% on a currency-neutral basis, and reported revenue grew by 2.1% compared with 2017. Currency-neutral revenue per case increased by 1.7%, with growth in all segments driven by price increases, as well as category and package mix.
Comparable cost of goods sold increased by 1.3% in 2018, compared to the prior year, as a result of volume growth. While we benefited from an overall favourable raw material cost impact mainly due to the lower price of sugar.
Ongoing tight cost management, combined with strong revenue growth, delivered a 20 basis-point reduction in comparable operating expenses as a percentage of revenue. We are pleased that we were able to achieve this improvement while growing marketing expenses by 30 basis points as a percentage of revenue mainly related to the FIFA World Cup and new product launches. Increased transport costs in certain Central and Eastern European countries also negatively impacted operating expenses during the year. On the other hand, we benefited from the partial recovery of the prior-year’s bad debt provision in Croatia.
Key financial information
2018 2017 %
change
Volume (million unit cases) 2,192 2,104 4,2Net sales revenue (€ million) 6,657 6,522 2.1Net sales revenue per unit case (€) 3.04 3.10 -2.0Currency-neutral net sales revenue (€ million) 6,657 6,283 6.0Currency-neutral net sales revenue per unit case (€) 3.04 2.99 1.7Operating profit (EBIT) (€ million) 639 590 8.4Comparable EBIT (€ million) 681 621 9.6EBIT margin (%) 9.6 9.0 60bpsComparable EBIT margin (%) 10.2 9.5 70bpsNet profit (€ million) 447 426 5.0Comparable net profit (€ million) 480 450 6.8Comparable basic earnings per share (€) 1.306 1.233 5.9
Percentage changes are calculated on precise numbers.
Balance sheet
2018 € million
2017 € million
Assets Total non-current assets 4,416 4,345Total current assets 2,438 2,286Total assets 6,854 6,631Liabilities Total current liabilities 2,019 1,896Total non-current liabilities 1,719 1,722Total liabilities 3,738 3,618Equity Owners of the parent 3,111 3,007Non-controlling interests 5 5 Total equity 3,116 3,012Total equity and liabilities 6,854 6,630
Figures are rounded.
812018 INTEGRATED ANNUAL REPORTSR
CG
FS
SSR
SI

CURRENCY-NEUTRAL REVENUE GROWTH
+6%COMPARABLE OPERATING PROFIT
€681mCOMPARABLE EBIT MARGIN IMPROVEMENT
+70bps
Net finance costs increased by €5 million during 2018, compared to the prior year, mainly due to lower interest income on our cash deposits in the current low yield environment.
On a comparable basis, the Group’s effective tax rate was 26.2% for 2018 and 24.5% for 2017. On a reported basis, the effective tax rate was 26.6% and 24.5% for 2018 and 2017 respectively. The Group’s effective tax rate varies depending on the mix of taxable profits by territory, the non-deductibility of certain expenses, non-taxable income and other one-off tax items across its territories.
Comparable net profit increased by 6.8% and net profit by 5.0% in 2018 compared to the prior year. The increase was primarily due to higher operating profitability, partially offset by higher net finance costs and increased taxes.
DividendIn view of the Group’s progressive dividend policy and the assessment of the progress against the Group’s strategy, the Board of Directors has proposed a dividend of €0.57 per share. This is a 5.6% increase from €0.54 per share for 2017. The dividend payment will be subject to, among other things, shareholders’ approval at our Annual General Meeting.
Balance sheetTotal non-current assets increased by €71 million in 2018, mainly driven by purchases of property, plant and equipment for the year. Net current assets increased by €30 million in 2018, as increased inventory and investments in financial assets were partially offset by payables relating to the purchase of own shares and increased taxes payable.
Cash flowNet cash from operating activities decreased by 0.9% in 2018 compared to the prior year, as increased operating profitability was offset by an increase in working capital.
Capital expenditure, net of receipts from the disposal of assets and including principal repayments of finance lease obligations, increased by 13.0% in 2018 compared to the prior year and represented 6.4% of net sales revenue compared to 5.8% in 2017.
We generated €370 million of free cash flow in 2018, compared to €426 million in 2017. This result reflects increased operating profitability offset by higher working capital and capital expenditure to support revenue growth.
Economic valueEfficient use of capital and higher profits resulted in an increase in return on invested capital (ROIC) from 12.4% in 2017 to 13.7% in 2018. At the same time, our weighted average cost of capital (WACC) decreased from 7.8% in 2017 to 7.4% in 2018. We continued to grow the positive economic value generated by our operations.
Financial risk managementWith volatility in foreign exchange rates and commodity prices related to our operations throughout 2018, our continuous and proactive financial risk management approach proved to be critical yet again. Financial market volatility in 2018 was evident in the second part of the year, mainly driven by geopolitical events like trade tariffs and sanctions.
In terms of managing foreign exchange risk, the Group is exposed to exchange rate fluctuation of the euro versus the US dollar and the local currency of each country of our operations. Our risk management strategy involves hedging transactional exposures, arising from currency fluctuations, with available financial instruments on a 12-month rolling basis.
Cash flow
2018
€ million2017
€ million
Cash flow from operating activities 797 804Payments for purchases of property, plant and equipment (437) (410)Proceeds from sales of property, plant and equipment 18 39
Principal repayments of finance lease obligations (8) (7)Free cash flow 370 426
Figures are rounded.
82 COCA-COLA HBC FINANCIAL REVIEW CONTINUED

Taxes we contribute to our communitiesWhen considering tax, Coca-Cola HBC ensures that due consideration is given to the Group’s corporate and social responsibilities, and the value it places on earning community trust. More specifically, Coca-Cola HBC commits to continue paying taxes in the countries where value is created and ensures that it is fully compliant with tax laws across all relevant jurisdictions. In addition, Coca-Cola HBC commits to being open and transparent with tax authorities about the Group’s tax affairs and to disclose relevant information to enable tax authorities to carry out their reviews.
We support the communities in the countries where we operate directly, by creating wealth, and also indirectly, by paying taxes. These taxes include corporate income tax calculated on each country’s taxable profit, employer taxes and social security contributions, net VAT cost and other taxes that are reflected as operating expenses. Excise taxes and taxes borne by employees are not included.
The Russian rouble was particularly affected in 2018, experiencing double-digit depreciation versus the euro and the US dollar, but the existence of an active foreign exchange market and a prudent hedging strategy allowed us to mitigate a large part of the negative impact. The Nigerian naira was also affected during the year, though to a lesser extent. We eased part of the adverse effect by using mechanisms available in the local futures market. The overall negative impact of foreign exchange fluctuations for 2018 was €51 million. This includes €22 million of transactional impact and €29 million of translational impact.
In terms of commodities, the Group’s high hedging coverage of aluminium exposure proved very successful in counterbalancing a large part of the price increase experienced in April 2018. Similarly, existing hedges in fuel oil performed very well against the price increase surges during the year. PET resin prices were particularly strong in the late summer of 2018, due to a combination of rising oil prices and market-specific factors. Careful inventory management and existing contracts in place provided a partial offset to these price spikes, as PET resin prices moderated in the last quarter of the year. We were also able to conclude a number of purchases of EU sugar in certain countries and take advantage of the lower prices during 2018.
Our general policy is to retain a minimum amount of liquidity reserves in the form of cash and cash equivalents on our balance sheet. During 2018, we invested our excess cash primarily in short-term time deposits and money market funds.
BorrowingsOur medium- to long-term aim is to maintain a ratio of net debt to comparable adjusted EBITDA in the range of 1.5 – 2.0 times. In 2018, we ended the year with a ratio of 0.61 times. Our funding strategy in the debt capital markets involves raising financing through our wholly owned Dutch financing subsidiary, Coca-Cola HBC Finance B.V. In cases of subsidiaries with joint control, or countries where certain legal, tax or market restrictions apply, financing at lower levels in the organisation is considered.
We use our €3 billion European Medium Term Note programme and our €1 billion Global Commercial Paper programme as the main basis for our financing. We endeavour to maintain our presence and profile in the international capital markets and, where possible, to broaden our investor base. We also seek to maintain a well-balanced redemption profile.
Total tax by category
In early 2016, we issued a €600 million bond, repayable in November 2024, at an effective interest rate of 2.99%. This was utilised mainly in the refinancing of the €600 million bond maturing in November 2016. Our €800 million bond, with June 2020 maturity, is still outstanding.
We also have a €500 million syndicated revolving credit facility, which was extended until 24 June 2021. We have never drawn down on this facility, which can be used for general corporate purposes and carries a floating interest rate over EURIBOR and LIBOR.
Looking aheadWe will have less of a tailwind from economic conditions in 2019, however, we believe we are well placed to manage this. Overall, we expect volume to continue to grow in all three segments. We expect the Established and Emerging market segment to grow at a similar pace to 2018, while the Developing markets moderate to a more normalised pace of growth after a very strong year.
Our revenue growth management initiatives, which are designed to grow revenue faster than volume, should continue to enhance the value we get from every case we sell. We will continue to take pricing where the market conditions allow it and to offset foreign currency depreciation where necessary. We expect our plans to continue to improve currency-neutral net sales revenue per case in the year.
On the cost side, we expect our input costs per case to increase by low single digits on a currency-neutral basis and comparable operating expenses to see a further reduction as a percentage of net sales revenue in the year.
Borrowing structure (€ million)
Bonds issued: 1,395Commercial paper: 95Finance leases: 66Other: 48
Corporate income tax: 49.0%Withholding tax: 1.1%Payroll taxes: 41.7%VAT (cost): 1.3%Environmental taxes: 0.1%Other taxes: 6.8%
832018 INTEGRATED ANNUAL REPORTSR
CG
FS
SSR
SI
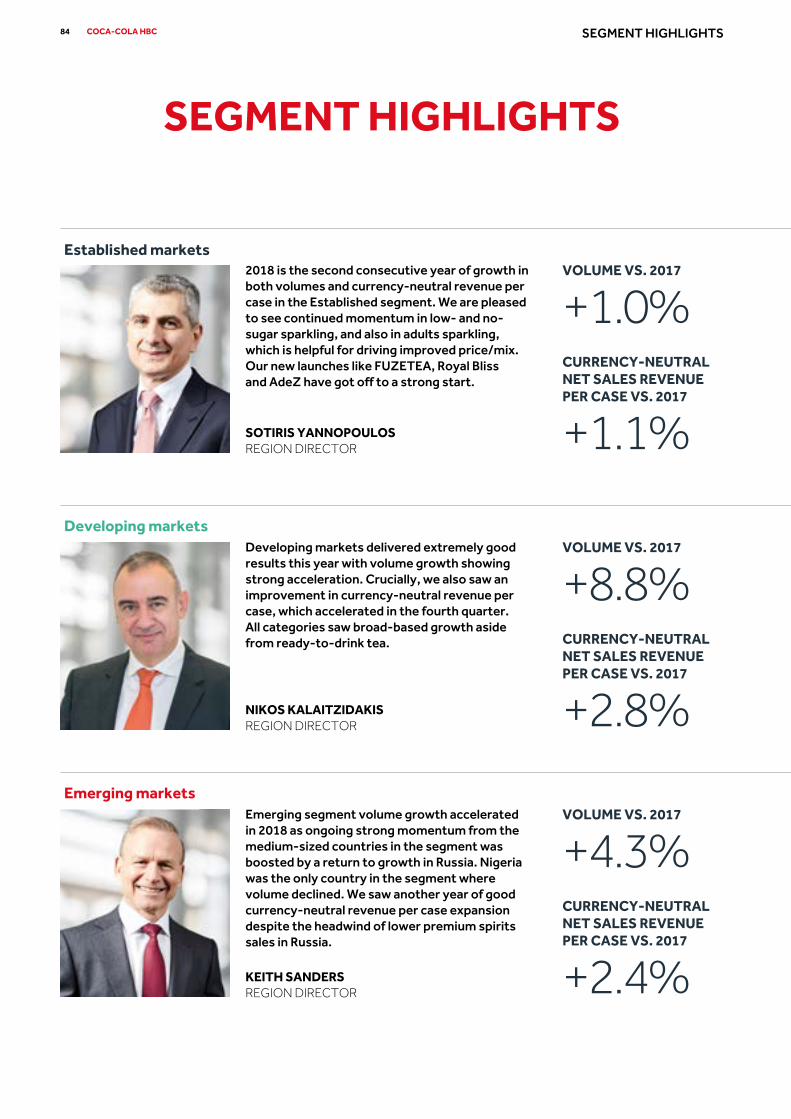
Developing markets
Established markets2018 is the second consecutive year of growth in both volumes and currency‑neutral revenue per case in the Established segment. We are pleased to see continued momentum in low‑ and no‑sugar sparkling, and also in adults sparkling, which is helpful for driving improved price/mix. Our new launches like FUZETEA, Royal Bliss and AdeZ have got off to a strong start.
SOTIRIS YANNOPOULOSREGION DIRECTOR
VOLUME VS. 2017
+1.0%CURRENCY-NEUTRAL NET SALES REVENUE PER CASE VS. 2017
+1.1%
Developing markets delivered extremely good results this year with volume growth showing strong acceleration. Crucially, we also saw an improvement in currency‑neutral revenue per case, which accelerated in the fourth quarter. All categories saw broad‑based growth aside from ready‑to‑drink tea.
NIKOS KALAITZIDAKISREGION DIRECTOR
VOLUME VS. 2017
+8.8%CURRENCY-NEUTRAL NET SALES REVENUE PER CASE VS. 2017
+2.8%
Emerging marketsEmerging segment volume growth accelerated in 2018 as ongoing strong momentum from the medium‑sized countries in the segment was boosted by a return to growth in Russia. Nigeria was the only country in the segment where volume declined. We saw another year of good currency‑neutral revenue per case expansion despite the headwind of lower premium spirits sales in Russia.
KEITH SANDERSREGION DIRECTOR
VOLUME VS. 2017
+4.3%CURRENCY-NEUTRAL NET SALES REVENUE PER CASE VS. 2017
+2.4%
SEGMENT HIGHLIGHTS
84 COCA-COLA HBC SEGMENT HIGHLIGHTS

We continue to make good progress towards our 2020 targets. Our revenue growth management initiatives, strong in-market execution with greater sales capability and a record number of new product launches, supported by favourable economic conditions in most of our markets, resulted in the second consecutive year
of currency-neutral revenue growth above the 4-5% target range combined with good margin expansion. The excellent execution across our markets is a testament to the dedication and hard work of all our people.
2018 2017 % change
Volume (million unit cases) 619 613 1.0%Net sales revenue (€ million) 2,470 2,436 1.4%Operating profit (EBIT) (€ million) 232 238 -2.6%Comparable EBIT (€ million) 241 250 -3.9%Total taxes1 (€ million) 123 130 -5.7%Population2 (million) 91 91.2 0.2%GDP per capita (US$) 40,221 37,854 6.3%Bottling plants (number) 13 13 –Employees (number) 6,642 6,530 1.7%Water footprint* (billion litres) 4.3 5.0 -14.0%Carbon emissions (tonnes) 86,468 99,616 -13.2%Safety rate (lost time accidents >1 day per 100 employees) 0.86 0.93 -8%
1. Total taxes include corporate income tax, withholding tax and deferred tax, as well as social security costs and other taxes that are reflected as operating expenses; as per IFRS accounts.
2. Population source: International Monetary Fund, World Economic Outlook Database, October 2018. Northern Ireland: NISRA (Northern Ireland Statistics and Research Agency), Office for National Statistics, UK, Northern Ireland Economic Outlook, 2018. Italian data: Sicilian population excluded based on data from ISTAT (Italian National Institute of Statistics).
Italy: 41%Greece: 18%Austria: 14%Switzerland: 12%Republic of Irelandand Northern Ireland: 12%Cyprus: 3%
Volume breakdown by country
2018 2017 % change
Volume (million unit cases) 429 394 8.8%Net sales revenue (€ million) 1,307 1,173 11.4%Operating profit (EBIT) (€ million) 131 92 42.7%Comparable EBIT (€ million) 137 92 48.4%Total taxes1 (€ million) 65 54 19.5% Population2 (million) 76 76.1 –GDP per capita (US$) 16,850 15,117 11.5%Bottling plants (number) 8 8 –Employees (number) 4,721 4,747 -0.5%Water footprint* (billion litres) 3.1 2.6 19.2%Carbon emissions (tonnes) 82.470 78,630 4.9%Safety rate (lost time accidents >1 day per 100 employees) 0.38 0.36 6%
Poland: 44%Hungary: 22%Czech Republic: 13%Baltics: 7%Croatia: 7%Slovakia: 5%Slovenia: 2%
Volume breakdown by country
Volume breakdown by country
1. Total taxes include corporate income tax, withholding tax and deferred tax, as well as social security costs and other taxes that are reflected as operating expenses; as per IFRS accounts.
2. Population source: International Monetary Fund, World Economic Outlook Database, October 2018.
2018 2017 % change
Volume (million unit cases) 1,144 1,097 4.3%Net sales revenue (€ million) 2,880 2,912 -1.1%Operating profit (EBIT) (€ million) 277 260 6.5%Comparable EBIT (€ million) 303 278 8.9%Total taxes1 (€ million) 141 129 9.4%Population2 (million) 438 433 1.1%GDP per capita (US$) 5,822 5,502 5.8%Bottling plants (number) 31 34 -8.8%Employees (number) 17,521 18,150 -3.5%Water footprint* (billion litres) 9.3 10.2 -8.8%Carbon emissions (tonnes) 369,267 384,362 -3.9%Safety rate (lost time accidents >1 day per 100 employees) 0.24 0.26 -5%
Russian Federation: 30%Nigeria: 22%Romania: 17%Serbia and Montenegro: 9%Ukraine: 9%Bulgaria: 6%Belarus: 3%Bosnia and Herzegovina: 2%Armenia: 1%Moldova: 1%
1. Total taxes include corporate income tax, withholding tax and deferred tax, as well as social security costs and other taxes that are reflected as operating expenses; as per IFRS accounts.
2. Population source: International Monetary Fund, World Economic Outlook Database, October 2018.
* In 2018, we used a verified structured process for the calculation of total Chemical Oxygen Demand reaching the environment which is used for the calculation of grey water.
Figures are rounded.Percentage changes are calculated on precise numbers.
852018 INTEGRATED ANNUAL REPORTSR
CG
FS
SSR
SI
SOUND GOVERNANCE REMAINS AT THE HEART OF OUR BUSINESS, MAKING SURE WE REMAIN IN GOOD COMPANY WITH ALL OUR STAKEHOLDERS.
Contents88 Chairman’s introduction to corporate governance90 Board of Directors96 Corporate Governance Report122 Directors’ Remuneration Report145 Statement of Directors’ Responsibilities

CORPORATE GOVERNANCE
87
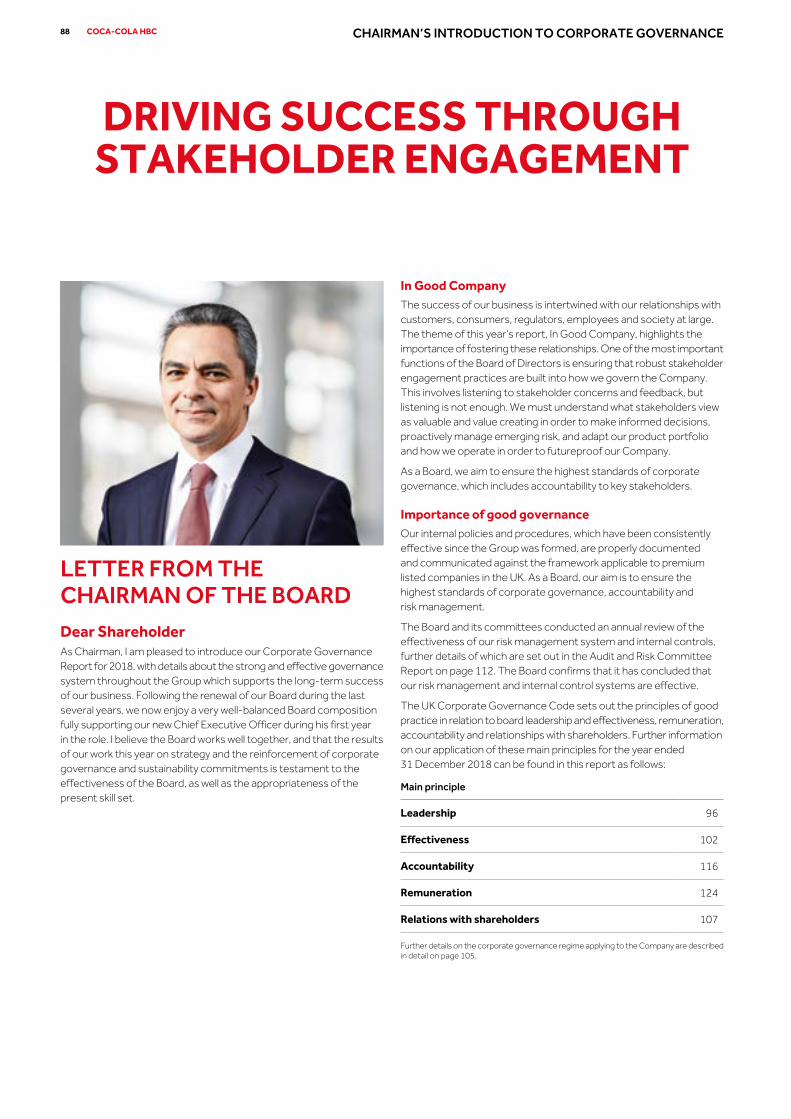
DRIVING SUCCESS THROUGH STAKEHOLDER ENGAGEMENT
LETTER FROM THE CHAIRMAN OF THE BOARDDear ShareholderAs Chairman, I am pleased to introduce our Corporate Governance Report for 2018, with details about the strong and effective governance system throughout the Group which supports the long-term success of our business. Following the renewal of our Board during the last several years, we now enjoy a very well-balanced Board composition fully supporting our new Chief Executive Officer during his first year in the role. I believe the Board works well together, and that the results of our work this year on strategy and the reinforcement of corporate governance and sustainability commitments is testament to the effectiveness of the Board, as well as the appropriateness of the present skill set.
In Good CompanyThe success of our business is intertwined with our relationships with customers, consumers, regulators, employees and society at large. The theme of this year’s report, In Good Company, highlights the importance of fostering these relationships. One of the most important functions of the Board of Directors is ensuring that robust stakeholder engagement practices are built into how we govern the Company. This involves listening to stakeholder concerns and feedback, but listening is not enough. We must understand what stakeholders view as valuable and value creating in order to make informed decisions, proactively manage emerging risk, and adapt our product portfolio and how we operate in order to futureproof our Company.
As a Board, we aim to ensure the highest standards of corporate governance, which includes accountability to key stakeholders.
Importance of good governanceOur internal policies and procedures, which have been consistently effective since the Group was formed, are properly documented and communicated against the framework applicable to premium listed companies in the UK. As a Board, our aim is to ensure the highest standards of corporate governance, accountability and risk management.
The Board and its committees conducted an annual review of the effectiveness of our risk management system and internal controls, further details of which are set out in the Audit and Risk Committee Report on page 112. The Board confirms that it has concluded that our risk management and internal control systems are effective.
The UK Corporate Governance Code sets out the principles of good practice in relation to board leadership and effectiveness, remuneration, accountability and relationships with shareholders. Further information on our application of these main principles for the year ended 31 December 2018 can be found in this report as follows:
Main principle
Leadership 96
Effectiveness 102
Accountability 116
Remuneration 124
Relations with shareholders 107
Further details on the corporate governance regime applying to the Company are described in detail on page 105.
88 COCA-COLA HBC CHAIRMAN’S INTRODUCTION TO CORPORATE GOVERNANCE

Strategy and oversightOur focus during the year continued to be on the execution of our growth strategy as described in detail in the Strategic Report. The Board was also particularly focused on aligning strategically with our network of partners and The Coca-Cola Company in all of our markets and managing the risks related to the external environment.
The Board’s meetings are split between guiding the longer-term vision and strategy of the Group, and assessing operational and financial updates on the markets where we operate. These updates provide links and context for the strategic discussions, as well as governance oversight. Meetings take place in Zug, Switzerland, but also in selected markets across our footprint, in order for the Board to interact with local management and learn more about their challenges and opportunities, and the way they are operating at a local level. In that context, our June 2018 meeting was held in Zurich, Switzerland, which represents one of our Established markets.
Culture and valuesOur strong corporate culture is fundamental to our business continuity and success. The Board plays a critical role in shaping the culture of the Company by promoting growth-focused and values-based conduct. The Company’s culture is defined by our six core values: winning with customers; nurturing our people; excellence; integrity; learning; performing as one. These values make for a culture where our people are clear on our purpose, our growth pillars, the elements of how we grow as well as on our targets.
We monitor our progress in integrating our values through various indicators, including our Employee Engagement Index, diversity indicators, and health and safety indicators. We understand the importance of the Board’s role in establishing the Company’s ‘tone from the top’ in terms of its culture and values, and our Directors lead by example as ambassadors of our values in order to cascade good behaviour through the organisation. By focusing on continuous improvement, we model the values of excellence and learning.
Board evaluationIn line with our commitment to adhere to best corporate governance practices, a Board effectiveness evaluation was conducted in the second half of 2018. In line with past practice, we will do this once again in 2019 to build upon the learnings of the 2018 evaluation. Further details are set out in the Nomination Committee Report on page 118.
Board composition and diversityThe composition and size of the Board will continue to be under review. We believe that our Board is well-balanced and diverse, with the right mix of international skills, experience, background, independence and knowledge in order to discharge its duties and responsibilities effectively.
Our Nomination Committee is devoted to developing strong succession plans for the Board and senior management. The Board is committed to recruiting Directors with diverse backgrounds, personalities, skills and experience. We continue to attach great importance to all aspects of diversity in our nomination processes at Board and senior management levels, while appointing candidates with the credentials that are necessary for the continuing growth of our operations within a highly competitive and specialised industry.
Governance in actionTo ensure that our journey to become a Total Beverage Company is successful, the Board has the important responsibility of ensuring that our Company culture and values are aligned with our business model and strategy. Our talented people are being asked to be even more agile and more entrepreneurial, focusing efforts on the highest-return opportunities. As a Board, we have to foster an environment that empowers our people and supports the informed risk-taking, collaboration and inclusion which is necessary for innovation.
To achieve alignment between the Company’s culture and values and our new growth mindset, in 2018 the Board oversaw changes to the Group’s Enterprise Risk Management system as well as evolution in employee development and remuneration programmes. For more information about our evolving culture, see the sections of this report on risk, people and remuneration, on pages 63, 26, and 124, respectively.
See page 101 for more information.
ANASTASSIS G. DAVIDCHAIRMAN OF THE BOARD
892018 INTEGRATED ANNUAL REPORTSR
CG
FS
SSR
SI
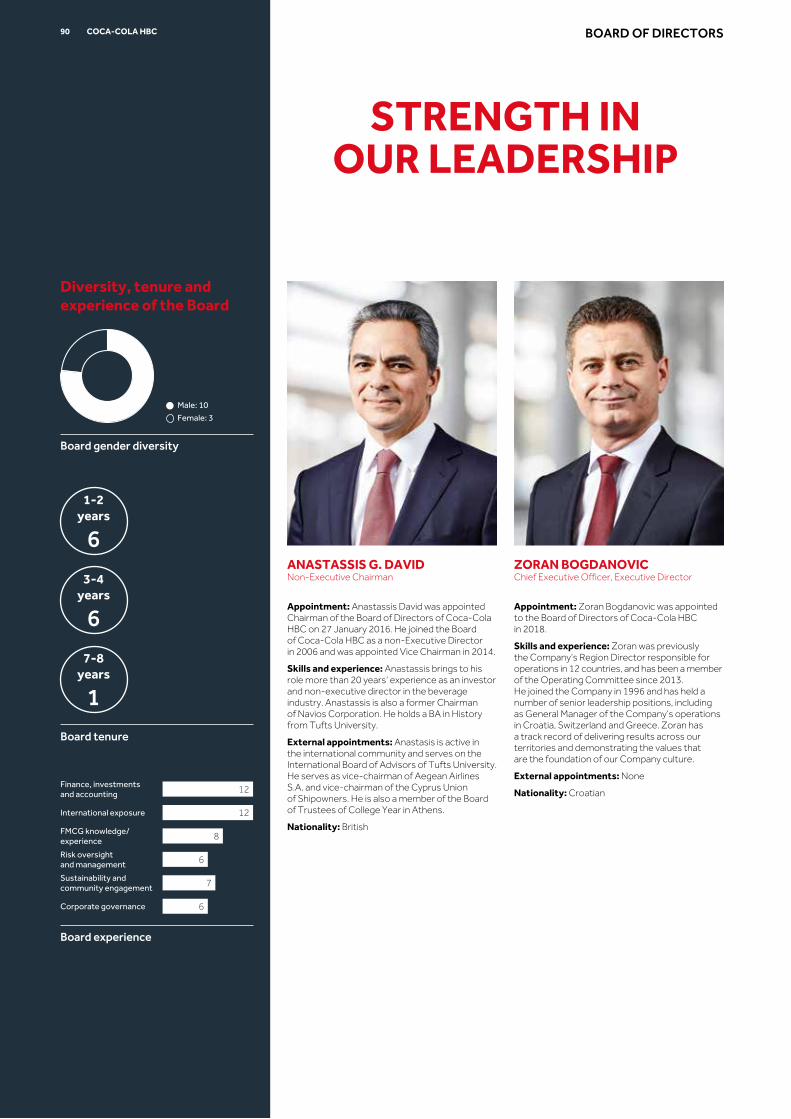
ANASTASSIS G. DAVIDNon-Executive Chairman
Appointment: Anastassis David was appointed Chairman of the Board of Directors of Coca-Cola HBC on 27 January 2016. He joined the Board of Coca-Cola HBC as a non-Executive Director in 2006 and was appointed Vice Chairman in 2014.
Skills and experience: Anastassis brings to his role more than 20 years’ experience as an investor and non-executive director in the beverage industry. Anastassis is also a former Chairman of Navios Corporation. He holds a BA in History from Tufts University.
External appointments: Anastasis is active in the international community and serves on the International Board of Advisors of Tufts University. He serves as vice-chairman of Aegean Airlines S.A. and vice-chairman of the Cyprus Union of Shipowners. He is also a member of the Board of Trustees of College Year in Athens.
Nationality: British
ZORAN BOGDANOVICChief Executive Officer, Executive Director
Appointment: Zoran Bogdanovic was appointed to the Board of Directors of Coca-Cola HBC in 2018.
Skills and experience: Zoran was previously the Company’s Region Director responsible for operations in 12 countries, and has been a member of the Operating Committee since 2013. He joined the Company in 1996 and has held a number of senior leadership positions, including as General Manager of the Company’s operations in Croatia, Switzerland and Greece. Zoran has a track record of delivering results across our territories and demonstrating the values that are the foundation of our Company culture.
External appointments: None
Nationality: Croatian
STRENGTH IN OUR LEADERSHIP
Board tenure
3-4 years
6
7-8 years
1
1-2 years
6
Board gender diversity
Male: 10
Female: 3
Diversity, tenure and experience of the Board
Board experience
Finance, investments and accounting
International exposure
FMCG knowledge/ experience
Risk oversight and management
Sustainability and community engagement
Corporate governance
12
8
6
7
6
12
90 COCA-COLA HBC BOARD OF DIRECTORS

Board Committees
Audit and Risk Committee page 112
Remuneration Committee page 122
Nomination Committee page 118
Committee Chair
Social Responsibility Committee page 120
CHARLOTTE J. BOYLEIndependent non-Executive Director
Appointment: Charlotte Boyle was appointed to the Board of Directors of Coca-Cola HBC on 20 June 2017.
Skills and experience: Charlotte joined The Zygos Partnership, an international executive search and board advisory firm, as a consultant in 2003 and was subsequently appointed associate partner in 2006 and partner in 2008. After 14 years with the firm, she retired from her position in July 2017. Prior to that, Charlotte worked at Goldman Sachs International between 2000 and 2003. Between 1996 and 1999 she was a consultant at Egon Zehnder International, an international executive search and management assessment firm. Charlotte obtained an MBA from the London Business School and an MA from Oxford University, and was a Bahrain British Foundation Scholar.
External appointments: Charlotte serves as a member of the board and as Chair of the finance committee of Alfanar, the first venture philanthropy organisation focused on the Arab world. She also serves as an independent non-executive director of Capital and Counties Properties plc.
Nationality: British
AHMET C. BOZERNon-Executive Director
Appointment: Ahmet Bozer was appointed to the Board of Directors of Coca-Cola HBC on 21 June 2016.
Skills and experience: Ahmet retired from the position of Executive Vice President of The Coca-Cola Company in March 2016. He started his professional career in 1985 at Coopers & Lybrand, based in Atlanta, serving in a variety of audit, consultancy and management roles and moved to The Coca-Cola Company in 1990 as Financial Controls Manager. Four years later, he assumed a leadership role at Coca-Cola Bottlers of Turkey (now Coca-Cola Içecek), becoming its Managing Director in 1998. He returned to The Coca-Cola Company in 2000 as Division President, Eurasia, and quickly progressed to the role of Division President, Eurasia and the Middle East. In 2007, he became Group President, Eurasia, assuming additional responsibility for the India and South West Asia Division, and was subsequently named Group President and Chief Operating Officer, Eurasia and Africa Group. As President of Coca-Cola International, he had responsibility for operations in more than 200 countries and territories. Ahmet earned a Bachelor’s degree in Management from the Middle East Technical University, Ankara, Turkey, and a Master’s degree in Business Information Systems from Georgia State University.
External appointments: Ahmet is an Advisory Board Member of Swire Beverages, Hong Kong and a Board Member of Hepsi Burada in Istanbul and the Turkish Philanthropy Foundation in New York. He is on the Board of Advisors for Robinson College of Business at Georgia State University, and serves as advisor to the Board of ESAS Holding in Turkey. Ahmet serves also on the Board of Directors of Tierra Nueva.
Nationality: USA
912018 INTEGRATED ANNUAL REPORTSR
CG
FS
SSR
SI

WILLIAM W. (BILL) DOUGLAS IIIIndependent non-Executive Director
Appointment: Bill Douglas was appointed to the Board of Directors of Coca-Cola HBC on 21 June 2016.
Skills and experience: Bill is a former Vice President of Coca-Cola Enterprises, a position in which he served from July 2004 until his retirement in June 2016. Bill has held various positions within the Coca-Cola System since 1985. In 1991, he was appointed Division Finance Manager for the Nordic & Northern Eurasia Division of The Coca-Cola Company. Bill moved to Atlanta in 1994 as Executive Assistant to the President of The Coca-Cola Company’s Greater Europe Group. In 1996, he became Nordic Region Manager. In 1998, he was appointed Controller of Coca-Cola Beverages plc. From 2000 until 2004, Bill served as Chief Financial Officer of Coca-Cola HBC. He joined Coca-Cola Enterprises in 2004 when he was appointed Vice President, Controller and Principal Accounting Officer. He was appointed Senior Vice President and Chief Financial Officer in 2005 and Executive Vice President and Chief Financial Officer of Coca-Cola Enterprises in 2008. From 2013 to 2015, Bill was the Executive Vice President, Supply Chain. Before joining the Coca-Cola System, Bill was associated with Ernst & Whinney, an international accounting firm. He received his undergraduate degree from the J.M. Tull School of Accounting at the University of Georgia.
External appointments: Bill is the Lead Director and Chairman of the Audit Committee of SiteOne Landscape Supply, Inc. He is also member of the Board of Directors and Chair of the Audit Committee for The North Highland company. Finally, he is the Chairman of the Board of the University of Georgia Trustees.
Nationality: USA
OLUSOLA (SOLA) DAVID-BORHAIndependent non-Executive Director
Appointment: Sola David-Borha was appointed to the Board of Directors of Coca-Cola HBC in 2015.
Skills and experience: Sola was Chief Executive Officer of Stanbic IBTC Holdings plc, a full service financial services group with subsidiaries in commercial banking, investment banking, pension and non-pension asset management and stockbroking. Stanbic IBTC Holdings is listed on the Nigerian Stock Exchange and is a member of Standard Bank group. Sola has more than 30 years’ experience in financial services and held several senior roles within the Stanbic Group, including the position of Chief Executive of Stanbic IBTC Bank from May 2011 to November 2012. She also served as Deputy Chief Executive Officer of Stanbic IBTC Bank and Head of Investment Banking Coverage Africa (excluding South Africa). Sola holds a first degree in Economics, and obtained an MBA degree from Manchester Business School. Her executive education experience includes the Advanced Management Programme of the Harvard Business School and the Global CEO Programme of CEIBS, Wharton and IESE.
External appointments: Since January 2017, Sola is the Chief Executive of the Africa Regions (excluding South Africa) for Standard Bank Group, Africa’s largest bank by assets with operations in 20 countries across the continent. Sola is an Honorary Fellow of the Chartered Institute of Bankers of Nigeria (CIBN) and a former Vice Chairman of the Nigerian Economic Summit Group.
Nationality: Nigerian
Board Committees
Audit and Risk Committee page 112
Remuneration Committee page 122
Nomination Committee page 118
Committee Chair
Social Responsibility Committee page 120
92 COCA-COLA HBC BOARD OF DIRECTORS CONTINUED

ANASTASIOS I. LEVENTISNon-Executive Director
Appointment: Anastasios Leventis was appointed to the Board of Directors of Coca-Cola HBC in 2014.
Skills and experience: Anastasios previously worked as a banking analyst at Credit Suisse and American Express Bank. He holds a BA in Classics from the University of Exeter and an MBA from New York University’s Leonard Stern School of Business.
External appointments: Anastasios currently works for Leventis Overseas Limited, a company that provides goods and services to companies in West Africa, and is a board member of A.G. Leventis (Nigeria) Plc. Anastasios is also a director of Alpheus Administration, a private company that administers assets for private clients and charitable foundations. In addition, he serves as a trustee of the A.G. Leventis Foundation, a member of the board of overseers of the Gennadius Library in Athens and a member of the Campaign board of the University of Exeter.
Nationality: British
RETO FRANCIONISenior Independent non-Executive Director
Appointment: Reto Francioni was appointed to the Board of Directors of Coca-Cola HBC on 21 June 2016.
Skills and experience: Reto has been Professor of Applied Capital Markets Theory at the University of Basel since 2006 and is the author of several highly respected books on capital market issues. From 2005 until 2015, Reto was Chief Executive Officer of Deutsche Börse AG and from 2002 until 2005, he served as Chairman of the Supervisory Board and President of the SWX Group, which owns the Swiss Stock Exchange and has holdings in other exchanges. Between 2000 and 2002, Reto was Co-Chief Executive Officer and Spokesman for the Board of Directors of Consors AG. Between 1993 and 2000, he held various management positions at Deutsche Börse AG, including that of Deputy Chief Executive Officer. From 2003 until 2005, Reto was an Adjunct Professor of Economics and Finance at Zicklin School of Business, part of the City University of New York. He earned his Doctorate of Law at the University of Zurich.
External appointments: Reto serves as a member of the Board of Directors of UBS Group and also as the Chairman of the Supervisory Board of Swiss International Airlines.
Nationality: Swiss
932018 INTEGRATED ANNUAL REPORTSR
CG
FS
SSR
SI

ALEXANDRA PAPALEXOPOULOUIndependent non-Executive Director
Appointment: Alexandra Papalexopoulou was appointed to the Board of Directors of Coca-Cola HBC in 2015.
Skills and experience: Alexandra worked previously for the OECD and the consultancy firm Booz, Allen & Hamilton, in Paris. From 2003 until February 2015, she served as a member of the board of directors of Frigoglass S.A.I.C. From 2010 to 2015, she served as a member of the board of directors of National Bank of Greece and from 2007 to 2009, she served as a member of the board of directors of Emporiki Bank. Alexandra holds a BA in Economics and Mathematics from Swarthmore College, USA, and an MBA from INSEAD, France.
External appointments: Alexandra is the Strategic Planning Director at Titan Cement Company S.A., where she has been employed since 1992 and has served as Executive Director since 1995. Alexandra is treasurer and a member of the board of directors of the Paul and Alexandra Canellopoulos Foundation, a member of the board of directors of the ALBA College of Business Administration Association and a member of the board of trustees of the American College of Greece.
Nationality: Greek
CHRISTO LEVENTISNon-Executive Director
Appointment: Christo Leventis was appointed to the Board of Directors of Coca-Cola HBC in 2014.
Skills and experience: Christo worked as an Investment Analyst with Credit Suisse Asset Management from 1994 to 1999. In 2001, he joined J.P. Morgan Securities as an Equity Research Analyst focusing on European beverage companies. From 2003 until March 2014, Christo was a member of the Board of Directors of Frigoglass S.A.I.C., a leading global manufacturer of commercial refrigeration products for the beverage industry. Christo holds a BA in Classics from University College London and an MBA from the Kellogg School of Management in Chicago.
External appointments: In 2003, Christo started the private equity investment arm of Alpheus, a private asset management company, and he continues to serve as a member of its investment advisory committee.
Nationality: British
Board Committees
Audit and Risk Committee page 112
Remuneration Committee page 122
Nomination Committee page 118
Committee Chair
Social Responsibility Committee page 120
94 COCA-COLA HBC BOARD OF DIRECTORS CONTINUED

JOHN P. SECHIIndependent non-Executive Director
Appointment: John Sechi was appointed to the Board of Directors of Coca-Cola HBC in 2014.
Skills and experience: John started his career as a financial analyst and audit manager. In 1985, he joined The Coca-Cola Company as an internal auditor. In 1987, John became the Finance Director for Coca-Cola Great Britain Limited based in London. The following year, he was appointed General Manager of the European Supply Point Group and in 1990 he moved to Madrid to join the Iberian Division as Chief Financial Officer. In 1993, John was promoted to President of the Central Mediterranean Division of The Coca-Cola Company, based in Milan, where he was responsible for operations in Greece, Cyprus, Malta, Bulgaria, Former Yugoslavia (Croatia, Serbia, Bosnia, Montenegro, Kosovo and North Macedonia), Albania and Italy. In 1998, he was promoted to President of the German Division, based in Düsseldorf. John was Chairman of Globalpraxis, a commercial consulting firm, from 2001 to 2008. From 2007 until 2013, he was President, Greater Europe of The Campbell Soup Company, and from 2006 to 2011, a non-executive Board member and Chairman of the Audit Committee of Coca-Cola Içecek. John has a BA in Business Management from Ryerson University in Toronto and is a Chartered Accountant (Canada) and a Chartered Professional Accountant.
External appointments: John is a non-executive director and advisor to various privately-held companies, and serves as Executive Chairman of Sechi & Sechi Properties Limited.
Nationality: Canadian
ROBERT RYAN RUDOLPHNon-Executive Director
Appointment: Robert Ryan Rudolph was appointed to the Board of Directors of Coca-Cola HBC on 21 June 2016.
Skills and experience: From 1993 until 2006, Ryan worked as an attorney at the business law firm Lenz & Staehelin in Zurich. Prior to that, he worked as a public relations consultant at the public relations agency Huber & Partner in Zurich, as marketing assistant and subsequently as manager at Winterthur Life Insurance as well as part-time with D&S, the Institute for Marketing and Communications Research in Zurich. Ryan obtained an LLM from the University of Zurich and is admitted to the Zurich bar. Ryan also studied at the Faculté des Lettres of the University of Geneva, as well as the Ecole Polytechnique in Lausanne.
External appointments: Ryan is an attorney and partner at the Zurich-based law firm Oesch & Rudolph. In addition, he serves as a member of the Foundation Board of the A.G. Leventis Foundation and as a member of the board of various privately-held companies.
Nationality: Swiss
JOSÉ OCTAVIO REYESNon-Executive Director
Appointment: José Octavio Reyes was appointed to the Board of Directors of Coca-Cola HBC in 2014.
Skills and experience: José Octavio Reyes is the former Vice Chairman of The Coca-Cola Export Corporation, a position in which he served from January 2013 until his retirement in March 2014. He was president of the Latin America Group of The Coca-Cola Company from December 2002 to December 2012. Following various managerial positions in Mexico, Brazil and in The Coca-Cola Company headquarters in Atlanta, José Octavio Reyes was named President of the North Latin America Division of Coca-Cola in 2002. Prior to joining Coca-Cola, José Octavio Reyes spent five years with Grupo IRSA, a Monsanto Company joint venture. José Octavio Reyes holds a BSc in Chemical Engineering from the Universidad Nacional Autónoma de México and an MBA from the Instituto Tecnológico de Estudios Superiores de Monterrey.
External appointments: José Octavio Reyes has been a member of the board of directors of MasterCard WorldWide since January 2008 and is a member of the board of directors of Papalote Children’s Museum in Mexico City and Fundación UNAM. He has been a Director of Coca-Cola FEMSA S.A.B. de C.V. since 2016.
Nationality: Mexican
952018 INTEGRATED ANNUAL REPORTSR
CG
FS
SSR
SI

Board composition
Membership of the BoardOn 31 December 2018, our Board comprised 13 Directors: the Chairman, one Senior Independent Director, 10 non-Executive Directors and one Executive Director. The biographies of each member of the Board are set out on pages 90 to 95.
At the Annual General Meeting on 11 June 2018, Zoran Bogdanovic was appointed as an Executive Director of the Board.
The Operating Committee, described on page 109, supports Zoran Bogdanovic in his role as Chief Executive Officer.
The non-Executive Directors, of whom six (representing half of the members excluding the Chairman) are determined by the Board to be independent, are experienced individuals from a range of backgrounds, countries and industries. The composition of the Board complies with the UK Corporate Governance Code’s recommendation that at least half of the Board, excluding the Chairman, comprise independent Directors. There were no other changes to the Board or committee membership during 2018.
Coca-Cola HBC’s Board Nomination Policy requires that each Director is recognised as a person of the highest integrity and standing, both personally and professionally. Each Director must be ready to devote the time necessary to fulfil his or her responsibilities to the Company according to the terms and conditions of his or her letter of appointment. Each Director should have demonstrable experience, skills, and knowledge which enhance Board effectiveness and will complement those of the other members of the Board to ensure an overall balance of experience, skills, and knowledge on the Board. In addition, each Director must demonstrate familiarity with and respect for good corporate governance practices, sustainability and responsible approaches to social issues.
Business characteristics Qualifications, skills and experience Directors
Our business is extensive and involves complex financial transactions in the various jurisdictions where we operate
Experience in finance, investments and accounting 12
Our business is truly international with operations in 28 countries, at different stages of development, on three continents
Broad international exposure, and emerging and developing markets experience
12
Our business involves the manufacturing, sale and distribution of the world’s leading non-alcoholic beverage brands
Extensive knowledge of our business and the fast-moving consumer goods industry, as well as experience with manufacturing, route to market and customer relationships
8
Our Board’s responsibilities include the understanding and oversight of the key risks we are facing, establishing our risk appetite and ensuring that appropriate policies and procedures are in place to effectively manage and mitigate risks
Risk oversight and management expertise 6
Building community trust through the responsible and sustainable management of our business is an indispensable part of our culture
Expertise in sustainability and experience in community engagement
7
Our business involves compliance with many different regulatory and corporate governance requirements across a number of countries, as well as relationships with national governments and local authorities
Expertise in corporate governance and/or government relations
6
General qualifications required of all Directors
96 COCA-COLA HBC CORPORATE GOVERNANCE REPORT

Outside appointmentsThe Articles of Association of the Company (article 36) set out limits on the maximum number of external appointments that members of our Board and executive management may hold. In addition, if a Board member wishes to take up an external appointment he or she must ask our Chairman’s permission to do so, and the Chairman must consult the Chairman of the Nomination Committee. The Chairman will assess all requests on a case-by-case basis, including whether the appointment in question could negatively impact the Company or the performance of the Director’s duties to the Group.
The nature of the appointment and the expected time commitment are also assessed to ensure that the effectiveness of the Board would not be compromised.
Details of the external appointments of our non-Executive Directors are contained in their respective biographies set out on pages 90 to 95.
Our Chairman serves on the International Board of Advisors of Tufts University. He serves as vice-chairman of Aegean Airlines S.A. and vice-chairman of the Cyprus Union of Shipowners. He is also a member of the Board of Trustees of College Year in Athens. In this context, the Board considers that fewer than four of the positions held by the Chairman are considered to be significant.
Having considered the scope of the external appointments of all Directors, including the Chairman, our Board is satisfied that they do not compromise the effectiveness of the Board as each Director has sufficient time to devote to his or her role on the Board as the Board requires.
IndependenceOur Board has concluded that Charlotte J. Boyle, Olusola (Sola) David-Borha, William W. (Bill) Douglas III, Reto Francioni, Alexandra Papalexopoulou and John P. Sechi are deemed to be independent in accordance with the criteria set out in the UK Corporate Governance Code, with such individuals being independent in both character and judgement.
The other non-Executive Directors, Anastassis G. David (Chairman), Anastasios I. Leventis, Christo Leventis, José Octavio Reyes, Ahmet C. Bozer and Ryan Rudolph, were appointed at the request of shareholders of the Company: Kar-Tess Holding and The Coca-Cola Company. They are therefore not considered, by the Board, to be independent as defined by the UK Corporate Governance Code.
Anastassis G. David was appointed as Chairman on 27 January 2016. The Board firmly believes that Anastassis David embodies the Company’s core values, heritage and culture and that these attributes, together with his strong identification with the Company and its shareholders’ interests, and his deep knowledge and experience of the Coca-Cola System, will ensure an effective and appropriately balanced leadership of the Board and the Company.
Shareholders’ nomineesAs described under the heading ‘Major shareholders’ on page 253, since the main listing of the Company on the Official List of the London Stock Exchange in 2013, Kar-Tess Holding, The Coca-Cola Company and their respective affiliates have no special rights in relation to the appointment or re-election of nominee Directors, and those Directors of the Company who were originally nominated at the request of The Coca-Cola Company or Kar-Tess Holding will be required to stand for re-election on an annual basis in the same way as the other Directors. The Nomination Committee is responsible for identifying and recommending persons for subsequent nomination by the Board for election as Directors by the shareholders on an annual basis.
As our Board currently comprises 13 Directors, neither Kar-Tess Holding nor The Coca-Cola Company is in a position to control (positively or negatively) decisions of the Board that are subject to simple majority approval. However, decisions of the Board that are subject to the special quorum provisions and supermajority requirements contained in the Articles of Association, in practice, require the support of Directors nominated at the request of at least one of either The Coca-Cola Company or Kar-Tess Holding in order to be approved. In addition, based on their current shareholdings, neither Kar-Tess Holding nor The Coca-Cola Company is in a position to control a decision of the shareholders (positively or negatively), except to block a resolution to wind up or dissolve the Company or to amend the supermajority voting requirements. The latter requires the approval of 80% of shareholders where all shareholders are represented and voting. Depending on the attendance levels at Annual General Meetings, Kar-Tess Holding or The Coca-Cola Company may also be in a position to control other matters requiring supermajority shareholder approval.
Anastassis G. David, Anastasios I. Leventis, Christo Leventis and Ryan Rudolph were all originally appointed at the request of Kar-Tess Holding. José Octavio Reyes and Ahmet C. Bozer have been appointed at the request of The Coca-Cola Company.
Separation of rolesThere is a clear separation of the roles of the Chairman and the Chief Executive Officer. The Chairman is responsible for the operation of the Board and for ensuring that all Directors are properly informed and consulted on all relevant matters. The Chairman is also actively involved in the work of the Nomination Committee concerning succession planning and the selection of key people. The Chief Executive Officer, Zoran Bogdanovic, is responsible for the day-to-day management and performance of the Company and for the implementation of the strategy approved by the Board.
972018 INTEGRATED ANNUAL REPORTSR
CG
FS
SSR
SI

Key roles and responsibilities
The Board is collectively responsible for the oversight and success of our business. The roles and responsibilities of our Chairman, Chief Executive Officer, Senior Independent Director, non-Executive Directors and Company Secretary are set out in detail in our Organisational Regulations, which can be found at http://coca-colahellenic.com/en/about-us/corporate-governance/corporate-governance-overview/. Their key responsibilities are as follows:
Board committeesOur Board has delegated specific tasks to its committees as set out in the Organisational Regulations and reports from these committees are set out in this Corporate Governance Report. Biographies of the Chairs of the Board committees and the other members of the Board, the Audit and Risk Committee, the Nomination Committee, the Remuneration Committee and the Social Responsibility Committee are set out on pages 112 to 123.
Chairman · leads the Board, sets the agenda and promotes a culture
of openness and debate;
· ensures the highest standards of corporate governance;
Company Secretary · ensures that correct Board procedures are followed and ensures
the Board has full and timely access to all relevant information;
· facilitates induction and training programmes, and assists with the Board’s professional development requirements; and
· advises the Board on governance matters.
· is the main point of contact between the Board and management; and
· ensures effective communication with shareholders and stakeholders.
Senior Independent Director · acts as a sounding board for the Chairman and appraises
his performance;
· leads the independent non-Executive Directors on matters that benefit from an independent review; and
· is available to shareholders if they have concerns which have not been resolved through the normal channels of communication.
Chief Executive Officer · leads the business, implements strategy and chairs the Operating
Committee; and
· communicates with shareholders, employees, government authorities, other stakeholders and the public.
Non-Executive Directors · contribute to developing Group strategy;
· scrutinise and constructively challenge the performance of management in the execution of the Groups’ strategy; and
· oversee succession planning, including the appointment of Executive Directors.
98 COCA-COLA HBC CORPORATE GOVERNANCE REPORT CONTINUED

Governance framework
Nomination Committee
Remuneration Committee
Social Responsibility Committee
Board of DirectorsOur Board has ultimate responsibility for our long-term success and for delivering sustainable shareholder value. This is achieved by approving the corporate strategy, monitoring performance toward strategic objectives and overseeing implementation of the strategy by the Operating Committee. Specific tasks are delegated by the Board to its committees for audit and risk, nomination, remuneration and social responsibility.
The governance process of the Board is set out in our Articles of Association and the Organisational Regulations. These regulations define the role and responsibilities of the Board and its committees, and can be found at https://coca-colahellenic.com/en/about-us/corporate-governance/corporate-governance-overview/. In addition, the Swiss Ordinance against Excessive Compensation in Listed Companies imposes certain obligations on the Board, including a requirement to prepare and make available a remuneration report pursuant to Swiss law.
Audit and Risk Committee
Operating CommitteeThe Operating Committee, led by the Chief Executive Officer, meets 12 times each year and provides the Group with executive leadership. The Committee has responsibility for: the development of long-term strategies and the implementation of strategies approved by the Board; providing adequate head-office support for each of the Group’s countries; working closely with the country General Managers, as set out in our operating framework; and the setting of annual targets and approval of annual business plans which form the basis of the Group’s performance management.
Responsibilities
· The Nomination Committee has responsibility for: identifying and nominating new Board members; ensuring adequate Board training; supporting the Board and each committee in conducting a self-assessment; and overseeing the establishment of a talent development framework for the Group. The Committee oversees effective succession planning for the Chief Executive Officer, in consultation with the Chairman, and for the Operating Committee, in consultation with the Chief Executive Officer.
Responsibilities
· The Remuneration Committee establishes the remuneration strategy for the Group and approves remuneration for the Chairman, non-Executive Directors and the Chief Executive Officer. The Committee makes recommendations to the Board regarding remuneration matters to be approved at the Annual General Meeting and the implementation or modification of any employee benefit plan resulting in an increased annual cost of €5 million or more.
Responsibilities
· The Social Responsibility Committee supports the Board in its responsibilities to safeguard the Group’s reputation for responsible and sustainable operations. To achieve this, the committee oversees the Group’s engagement with stakeholders to assess their expectations, and the possible consequences of these expectations for the Group. The Committee also establishes principles governing social and environmental management, and oversees development of performance management to achieve social and environmental goals.
Responsibilities
· The Audit and Risk Committee has responsibility for: overseeing accounting policies, financial reporting and disclosure controls; the Group’s approach to internal controls and risk management; and the quality, adequacy and scope of internal and external audit functions. The Committee also has oversight of the Company’s compliance with legal, regulatory and financial reporting requirements, and the work programme of the internal audit function. The external auditor’s report directly to the Committee.
992018 INTEGRATED ANNUAL REPORTSR
CG
FS
SSR
SI

Board and committee attendance in 2018The following table shows the membership of the Board committees and includes the Directors’ attendance at Board and committee meetings during the period between 1 January and 31 December 2018. Board Audit and Risk1 Remuneration Nomination Social Responsibility
Director Independent AttendedTotal
meetings AttendedTotal
meetings AttendedTotal
meetings AttendedTotal
meetings AttendedTotal
meetings
Anastassis G. David No 6 6 – – – –Zoran Bogdanovic No 6 6 – – – –Charlotte J. Boyle Yes 6 6 – – 4 4 4 4 – –Ahmet C. Bozer No 6 6 – – – – – – – –Olusola (Sola) David-Borha2 Yes 6 6 7 8 – – – – – –William W. (Bill) Douglas III Yes 6 6 8 8 – – – – – –Reto Francioni3 Yes 6 6 – – 3 4 3 4 – –Anastasios I. Leventis No 6 6 – – 4 4Christo Leventis No 6 6 – – – – – – – –Alexandra Papalexopoulou Yes 6 6 – – 4 4 4 4 4 4José Octavio Reyes4 No 6 6 – – 3 4Robert Ryan Rudolph No 6 6 – – – –John P. Sechi Yes 6 6 8 8 – – – – – –
1. Includes four conference calls.2. Sola David-Borha did not attend the June meeting of the Audit and Risk Committee due to a long-standing prior commitment.3. Reto Francioni did not attend the Remuneration and Nomination Committee meetings in September 2018 due to a long-standing prior commitment.4. José Octavio Reyes did not attend the December meeting of the Social Responsibility Committee due to a long-standing prior commitment.
Full day board meetings The Board met six times during 2018. Four Board meetings took place over two days (consisting of two half-day sessions) to allow the Board sufficient time for deep-dives, reflection and candid discussion, and to take stock of the business environment and geographies in which we operate. The structure and nature of these meetings also allows time for Directors to socialise, which facilitates cordial relations and supports forthright discussion during Board meetings. Two of the meetings were held by conference call.
The Directors are encouraged to have free and open contact with management at all levels, and full access to all relevant information. Board meetings are normally held in Zug, Switzerland, but one of the Board meetings every year is held in one of our countries so that the Board will have the opportunity to visit the facilities and the respective markets in one of the 28 countries that make up our geographic footprint.
This allows Directors to gain a better understanding of regional differences in our business and the specifics of various markets. At each Board meeting, the Board receives reports and in-depth presentations from line and functional executives. The chairperson of each committee also reports to the Board on matters considered or decided in meetings of the respective Board committees. The Board also frequently reviews the actual performance of the Group versus its long-term strategy.BOARD MEETINGS TAKE PLACE
Over 24 hours
100 COCA-COLA HBC CORPORATE GOVERNANCE REPORT CONTINUED

Summary of key Board activities for 2018 and priorities for 2019Topic 2018 activity 2019 priority
Strategy · Supported the acceleration of product and package innovation
· Continued Optimisation of costs and investments, driving process efficiency while improving customer satisfaction
· Continued playing an industry-leading role on sustainability
· Continued ensuring effective alignment with The Coca-Cola Company (TCCC)
· Continuous support of the new product and package launch
· Developing the Group’s strategy towards becoming a 24/7 Total Beverage Company
· Working towards the 2025 sustainability targets · Close collaboration and alignment with TCCC
Performance · Regular performance reviews with a focus on the Company’s key business indicators
· Deep-dive reviews of each of the Company’s regions and key functions
· Monitored external factors such as macroeconomic conditions, currency volatility and commodities markets
· Regular business overviews and monitoring progress towards the Group’s long-term growth targets
· Periodic reviews of specific countries, regions and functions
· Reviewing the macroeconomic, commodities hedging and currency trends
Risk management and internal control
· Continued review of the principal risks and mitigation programmes reported on pages 74 to 76
· Reviewed mitigation plans for currency volatility with an emphasis on the operations in Russia and Nigeria
· Ongoing overview of the principal risks and focus on cyber-security
· Ongoing reviews of mitigation plans for commodities and currency volatility
Operational · Continued review of the Company’s cost optimisation and investment programmes to ensure efficiency improvements and improved customer satisfaction
· Monitored the effectiveness of the Company’s acceleration plan for cold drink equipment
· Detailed review and approval of capex investments
· Review of the Company’s cost optimisation plans
Culture and values · Continued shaping the culture, values and employee engagement of the Company through the Board’s interaction with management and employees
· Reviewed engagement survey results and people plans
· Reviewing the results of the Company’s engagement actions
· Discussing talent and people capability plans
Succession planning and diversity
· Ongoing succession planning work for Board and senior management positions
· Discussed Board effectiveness review
· Preparing a succession planning and bench strength initiatives for senior management and Board vacancies
1012018 INTEGRATED ANNUAL REPORTSR
CG
FS
SSR
SI

Board effectiveness
Information and trainingThe practices and procedures adopted by our Board ensure that the Directors are supplied on a timely basis with comprehensive information on the business development and financial position of the Company, the form and content of which is expected to enable the Directors to discharge their duties and carry out their responsibilities. All Directors have access to our General Counsel, as well as independent professional advice at the expense of the Company. All Directors have full access to the Chief Executive Officer and senior management, as well as the external auditor and internal audit team.
The Board has in place an induction programme for new Directors. Generally, it involves meeting with the Chairman, members of the Operating Committee and other senior executives, as well as receiving orientation training in relation to the Group and its corporate governance practices. The induction programme also includes meetings with representatives of our sales force, customers and major shareholders, and visits to our production plants.
All Directors are given the opportunity to attend training to ensure that they are kept up to date on relevant legal, accounting and corporate governance developments. The Directors individually attend seminars, forums, conferences and working groups on relevant topics. The Nomination Committee reviews our Director training activities regularly. Finally, as part of the continuing development of the Directors, the Company Secretary ensures that our Board is kept up to date with key corporate governance developments. The Board appoints the Company Secretary, who acts as secretary to the Board.
Board, committee and Director performance evaluationAt least annually, on the basis of an assessment conducted by the Nomination Committee, the Board reviews its own performance as well as the performance of each of the Board committees. This review seeks to determine whether the Board and its committees function effectively and efficiently. During the year, the Chairman meets with the Directors to receive feedback on the functioning of the Board and its committees, the boardroom dynamics, and the Group’s strategy.
Particular focus is given to areas where a Director believes the performance of the Board and its committees could be improved. A report is prepared for the Board on its effectiveness and that of its committees.
For the past three years, the evaluation of the Board’s effectiveness has been facilitated by Lintstock, and details of the 2018 Lintstock Report are set out on page 103. A summary of the Board evaluation findings for 2017, the actions taken in response to improve Board effectiveness in 2018, the Board evaluation findings for 2018, and the resulting priorities for 2019 is as follows:2017 Board evaluation findings 2018 actions
· Focus on strategy · Risk oversight · Focus on CEO
transition
· Evolving our Total Beverage portfolio in close alignment with TCCC
· Ongoing monitoring of the Group’s principal risks
2018 Board evaluation findings 2019 priorities
· Focus on strategy · Continue to engage
with key stakeholders · Keep abreast of
relevant technological developments
· Continued development of our 24/7 Total Beverage Company strategy
· Maintaining relationships with key stakeholders
· Focusing on digital and technological developments that will support the business
The independent Directors meet separately at every regular Board meeting to discuss a variety of issues, including the effectiveness of the Board. An evaluation of each Director, other than the Chairman, is conducted by the Chairman and the Senior Independent Director. The Senior Independent Director leads the evaluation of the Chairman in conjunction with the non-Executive Directors, taking into account the views of the Chief Executive Officer, and, as a matter of practice, meets with the other independent non-Executive Directors when each Board meeting is held to discuss issues together, without the Chief Executive Officer or other non-Executive Directors present.
102 COCA-COLA HBC CORPORATE GOVERNANCE REPORT CONTINUED

Conflicts of interestIn accordance with the Organisational Regulations, Directors are required to arrange their personal and business affairs so as to avoid a conflict of interest with the Group.
Each Director must disclose to the Chairman the nature and extent of any conflict of interest arising generally or in relation to any matter to be discussed at a Board meeting, as soon as the Director becomes aware of its existence. In the event that the Chairman becomes aware of a Director’s conflict of interest, the Chairman is required to contact that Director promptly and discuss with him or her the nature and extent of such a conflict of interest. Subject to exceptional circumstances in which the best interests of the Company dictate otherwise, the Director affected by a conflict of interest is not permitted to participate in discussions and decision-making involving the interest at stake.
Board appointments and succession planningOur Board has in place plans to ensure the progressive renewal of the Board and appropriate succession planning for senior management.
Pursuant to our Articles of Association, the Board consists of a minimum of seven and a maximum of 15 members, and the Directors are elected annually for a term of one year by the Company’s shareholders. Accordingly, all Directors are subject to annual re-election by shareholders in accordance with the UK Corporate Governance Code. In case of resignation or death of any member of the Board, the Board may elect a permanent guest, whom the Board will propose for election by the shareholders at the next Annual General Meeting.
Lintstock ReportIn 2018, we once again engaged advisory firm Lintstock to undertake an evaluation of the performance of the Board. Lintstock specialises
in Board performance reviews and has no other connection with Coca-Cola HBC.
ProcessThe first stage of the review involved Lintstock engaging with the Company Secretary to set the context for the evaluation, and to tailor survey content to the specific circumstances of Coca-Cola HBC. The surveys were designed to follow up on, and further explore, the key themes that emerged from the 2017 exercise. All Board members were then requested to complete a survey on the performance of the Board, its committees, and the Chairman.
Lintstock subsequently analysed the results and produced a report addressing the following areas of Board performance:
· The appropriateness of the Board’s composition was reviewed, and respondents were asked to identify any changes that ought to be made to the Board’s profile.
· The Board’s understanding of the views of key stakeholders (including employees throughout the organisation) and the regulatory environment in which the Company operates was considered.
· The atmosphere in the boardroom and the Board’s engagement with management in providing effective support and constructive challenge were assessed.
· The management and focus of meetings was also reviewed, as was the quality of the Board packs and the presentations given by management.
· The Board’s effectiveness in reviewing past decisions was considered, and respondents were asked to identify the areas upon which they felt the Board ought to spend more or less time focusing over the next year.
· The Board’s oversight of strategy was evaluated, as was the capacity of the organisation to deliver the strategy, and the Directors’ opinions on the top strategic issues facing the Company over the next three to five years were sought.
· The Board’s understanding of digital and technological developments relevant to the Company was also reviewed, as was the Board’s oversight of risk management.
· The structure of the Company at senior levels, in terms of delivering the strategic plan, was considered, and the Company’s processes for attracting, developing and retaining talent were also assessed.
· The performance of the committees of the Board was evaluated, as was the performance of the Chairman.
Lintstock’s report highlighted that, it was broadly felt by the members that the Board’s performance had improved over the year. As a result of the review, among other things the Board agreed to focus on the Group’s 2025 strategy, relationship with stakeholders and succession planning.
1032018 INTEGRATED ANNUAL REPORTSR
CG
FS
SSR
SI

In accordance with the Organisational Regulations, the Board proposes for election at the shareholders’ meeting new Directors who have been recommended by the Nomination Committee after consultation with the Chairman. In making such recommendations, the Nomination Committee and the Board must consider criteria including the overall balance of skills, experience, independence and knowledge of the Board member, as well as diversity considerations including gender. See the Nomination Committee report on pages 118-119 for further information on the role and work of the Nomination Committee, including the Board Diversity Policy. Through this process, the Board is satisfied that the Board and its committees have the appropriate balance of experience, diversity, independence and knowledge of the Company to enable them to discharge their duties and responsibilities effectively.
At the Annual General Meeting on 11 June 2018, Zoran Bogdanovic, the Company’s Chief Executive Officer, was appointed as an Executive Director. There were no other changes to Board or committee membership during 2018.
Shareholder engagementThe Chairman, the Senior Independent Director, the Chair of the Remuneration Committee and the Chair of the Audit and Risk Committee will be available at the Annual General Meeting of the Company to answer questions from shareholders. The Board encourages shareholders to attend as it provides an opportunity to engage with the Board.
Pursuant to Swiss law and the Articles of Association, shareholders annually elect an independent proxy and we have adopted an electronic proxy voting system for our Annual General Meetings.
The Company has a dedicated investor relations function which reports to the Chief Financial Officer. Through the investor relations team, the Company and Board maintain a dialogue with institutional investors and financial analysts on operational financial performance and strategic direction items. We engaged with the investment community and our shareholders throughout the year, as outlined in the diagram below, demonstrating our commitment to being accessible and transparent. The feedback from shareholders has been regularly considered by the Board and, where necessary, appropriate action to further engage with shareholders was taken.
Key investor relations activities in 2018
Jan
Feb
Mar
Apr
May
JuneJuly
Aug
Sept
Oct
Nov
DecFebruary · Roadshows in Edinburgh and London
March · Credit Suisse Consumer/Retail
Conference, London
· IR roadshow in London
April · Roadshow in the USA
June · Annual General Meeting, Zug
· Deutsche Bank Access Global Consumer conference, Paris
· IR roadshow in London
September · Barclays Global Consumer Staples
conference, Boston
· Greek institutional breakfast in Athens
· IR roadshow in Frankfurt
· IR roadshow in Zurich
November · Roadshow in Edinburgh and London
· Roadshow in the USA
· Berenberg West Coast Consumer & E-Commerce Conference, San Francisco
· Jefferies West Coast Consumer Conference, San Francisco
December · Citi’s Global Consumer
conference, London
104 COCA-COLA HBC CORPORATE GOVERNANCE REPORT CONTINUED

UK Corporate Governance CodeAs a Swiss corporation listed on the London Stock Exchange (LSE) with a secondary listing on the Athens Exchange, we aim to ensure that our corporate governance systems remain in line with international best practices. Our corporate governance standards and procedures are continuously reviewed in light of current developments and rulemaking processes in the UK, Switzerland and also the EU. Further details are available on our website.
As a premium listed Company, we are required to comply with the provisions of the UK Corporate Governance Code or explain any instances of non-compliance to shareholders. Our Board believes that the Company applied the principles and complied with, except as set out in the paragraphs below, the provisions of the UK Corporate Governance Code throughout 2018. Pursuant to our obligations under the Listing Rules, we intend to apply the principles and continually comply with the provisions of the UK Corporate Governance Code or to explain any instances of non-compliance in our Annual Report. All references to the UK Corporate Governance Code are to the 2016 version of the code, unless otherwise stated.
The 2016 version of the UK Corporate Governance Code is available online at https://www.frc.org.uk/Our-Work/Publications/Corporate-Governance/UK-Corporate-Governance-Code-April-2016.pdf.
Effective from 1 January 2019, the 2018 version of the UK Corporate Governance Code applies to companies with accounting periods beginning on or after 1 January 2019. The Company will be reporting on how it has complied with the 2018 UK Corporate Governance Code in the 2019 annual report to be published in 2020.
Certain differences between the Company’s corporate governance practices and the UK Corporate Governance CodeThe Swiss Ordinance against Excessive Compensation in Listed Companies further limits the authority of the Remuneration Committee and the Board to determine compensation. The effective limitations include requiring that the Annual General Meeting approve the maximum total compensation of each of the Board and the Operating Committee, requiring that certain compensation elements be authorised in the Articles of Association and prohibiting certain forms of compensation, such as severance payments and financial or monetary incentives for the acquisition or disposal of firms. We are in compliance with the requirements of the Swiss Ordinance against Excessive Compensation in Listed Companies and have amended our Articles of Association to that effect.
Anastassis G. David was originally appointed at the request of Kar-Tess Holding and was not, at the time of his appointment as Chairman, independent as defined by the UK Corporate Governance Code. In view of Anastassis David’s strong identification with the Company and its shareholder interests, combined with his deep knowledge and experience of the Coca-Cola System, the Board deemed it to be in the best interests of the Group and its shareholders for him to be appointed as Chairman, to continue to promote an effective and appropriately balanced leadership of the Group. In accordance with the established policy of appointing all Directors for one year at a time, the Board intends to continue to keep all positions under regular review and subject to annual election by shareholders at the Annual General Meeting.
Application of governance codes
Other corporate governance codes
There is no mandatory corporate governance code under Swiss law applicable to us. The main source of law for Swiss governance rules is the company law contained in articles 620 ff. of the Swiss Code of Obligations, as well as the Ordinance against Excessive Compensation in Listed Companies.
In addition, the UK’s City Code on Takeovers and Mergers (the ‘City Code’) does not apply to the Company by operation of law, as the Company is not incorporated under English law. The Articles of Association include specific provisions designed to prevent any person acquiring shares carrying 30% or more of the voting rights (taken together with any interest in shares held or acquired by the acquirer or persons acting in concert with the acquirer) except if (subject to certain exceptions) such acquisition would not have been prohibited by the City Code or if such acquisition is made through an offer conducted in accordance with the City Code. For further details, please refer to the Company’s Articles of Association, which are available on our website.
Amending the articles of association
The Articles of Association (Articles) may only be amended by a resolution of the shareholders passed by a majority of at least two-thirds of the voting rights represented and an absolute majority of the nominal value of the shares represented.
Share capital structure
The Company has ordinary shares in issue with a nominal value of CHF 6.7 each. Rights attaching to each share are identical and each share carries one vote. The Company’s Articles also allow, subject to shareholder approval, for the conversion of registered shares into bearer shares and bearer shares into registered shares. Details in the movement in ordinary share capital during the year can be found on page 105. There are no persons holding shares that carry special rights with regard to the control of the Company.
Powers of directors to issue and buy back shares
Subject to the provisions of the relevant laws and the Articles, the Board acting collectively has the ultimate responsibility for running the Company and the supervision and control of its executive management. The Directors may take decisions on all matters which are not expressly reserved to the shareholders or by the Articles. Pursuant to the provisions of the Articles, the Directors require shareholder authority to issue shares. At the Annual General Meeting on 11 June 2018, the shareholders authorised the Directors to repurchase ordinary shares of CHF 6.70 each in the capital of the Company up to a maximum aggregate number of 7,500,000 representing approximately 2% of the Company’s issued share capital as at 30 April 2018. The authority will expire on 30 June 2019 or at the conclusion of the next Annual General Meeting in 2019. On 3 December 2018, the Company commenced a share buy-back programme for up to 7,500,000 of its ordinary shares of CHF 6.70 each. As at 31 December 2018, 1,033,068 shares had been purchased at an average price of 2,409.29 pence per share and are held in treasury. This programme continues and as at 13 March 2019 (the latest practicable date for inclusion in this report), since 31 December 2018, the Company purchased a further 3,545,264 shares at an average price of 2,559.69 pence per share and these shares are also held in treasury. Total shares held in treasury being 8,023,392.
1052018 INTEGRATED ANNUAL REPORTSR
CG
FS
SSR
SI

CORPORATE GOVERNANCE REPORT CONTINUED
BOARD ENGAGEMENT
WITH WIDER STAKEHOLDERS
Our consumers
Our communities
Our people
The
Coca-Cola Company
Gov
ern
ments
Sha
reholders
NGOs
Partners in efficiency
Our customer
s
COCA-COLA HBC106

We also work, among others, with our customers, consumers, suppliers, local community representatives and other business partners across the value chain every day. The infographic on the previous page sets out the different stakeholders with whom we engage, which in turn is reported on to the Board.
WIDER STAKEHOLDER ENGAGEMENTEngagement with key stakeholder groups strengthens our relationships and is an ongoing part of the operational management of the Group. This includes employee surveys, assessments of customer satisfaction and ongoing conversations with regulators and non-governmental organisations. The Board receives regular updates on insights and feedback from stakeholders, which allows the Board to understand and consider the perspectives of key stakeholders in decision-making.
Employees are one of our most important stakeholder groups and the Board therefore closely monitors and reviews the results of the Company’s annual Employee Engagement, Values and Ambassadorship surveys. The Board likewise closely monitors the Company’s annual customer survey, which we commission to assess the satisfaction of more than 15,000 customers. For more information about these surveys, see the People and Customer sections on pages 26 and 48, respectively.
Considering stakeholders in decision‑makingThe Board considers the impact on stakeholders when taking a number of key decisions. Examples of these include:
· Shaping choice – In developing our product portfolio and our marketing efforts, together with The Coca-Cola Company, we consider consumer health and nutrition, emphasising low- or no-sugar variants. We support transparent product labelling to help consumers make informed choices and, in 2018, introduced new product labels with nutritional information based on the UK’s ‘traffic light’ scheme.
· Digital evolution – We have overseen a number of changes to support the Company’s digital evolution in an environment where technology is changing the way consumers interact with the world and with brands. We are successfully activating e-commerce across various channels, using a co-operative approach with our customers and investing in new training for our people. In 2018, we also accelerated our investment in connected coolers to optimise cooler placement and increase sales force productivity through automation.
· Product packaging – To reduce the consumption of single-use plastics and promote a circular value chain through reusable content, the first Europe-wide plastics strategy was introduced by the EU in 2018. As part of the new 2025 sustainability commitments approved by the Board in 2018, we are proactively addressing stakeholder concerns about packaging by committing to help collect the equivalent of 75% of every can and bottle we sell by 2025, use more recycled and renewable materials in packaging, and make 100% of our consumer packaging recyclable by 2025.
See pages 12-13 for more information
How the Board is kept informed Read more
Reviewing and developing plans that promote an inclusive growth culture and investing in building the best teams in the industry.
Page 26
Plant visits, community meetings, partnerships on common issues, sponsorship activities, lectures at universities.
Page 34
Consumer hotlines, local websites, plant tours, research, surveys, focus groups.
Page 40
Regular visits, dedicated account teams, joint business planning, joint value-creation initiatives, customer care centres, customer satisfaction surveys.
Page 48
Engagement with our suppliers, consultants and counterparts in related industries.
Page 54
Dialogue, policy work, partnerships on common issues, membership of business and industry associations.
Page 65
Annual General Meetings, investor roadshows and results briefings, webcasts, ongoing dialogue with analysts and investors.
Page 104
Recycling and recovery initiatives, EU Platform for Action on Diet, Physical Activity and Health, foreign investment advisory councils, chambers of commerce.
Page 64
Day-to-day interaction as business partners, joint projects, joint business planning, functional groups on strategic issues, ‘top-to-top’ senior management meetings.
Page 14
Our consumers
Our customers
Partners in efficiency
NGOs
Shareholders
Governments
The Coca-Cola Company
Our communities
Our people
1072018 INTEGRATED ANNUAL REPORTSR
CG
FS
SSR
SI

THE OPERATING COMMITTEE REPRESENTS THE EXECUTIVE
LEADERSHIP OF THE COMPANY
From left to rightRow one
Michalis Imellos, Zoran Bogdanovic, Naya Kalogeraki
Row two
Marcel Martin, Sotiris Yannopoulos, Alain Brouhard
Row three
Jan Gustavsson, Sanda Parezanovic, Keith Sanders
Row four
Nikos Kalaitzidakis
108

The Operating Committee is chaired by Zoran Bogdanovic, Chief Executive Officer, and his biography is set out on page 90.Other members of the Operating Committee:
Michalis Imellos
(50) Chief Financial Officer
Senior management tenure: Appointed April 2012 (6 years)
Previous Group roles: Region Finance Director responsible for Nigeria, Romania, Moldova, Bulgaria, Greece, Cyprus, Serbia and Montenegro; General Manager, Romania and Moldova.
Previous relevant experience: Michalis Imellos held a number of finance positions in the UK-based European headquarters of Xerox, including those of European Mergers & Acquisitions Director and Finance Director of the Office Europe Division. He managed the financial, tax and legal aspects of Xerox’s sponsorship of the Athens 2004 Olympic Games, as well as the finance function of the company’s operations in Greece. He is a Fellow of the Institute of Chartered Accountants in England and Wales, and started his career at Ernst & Young.
Nationality: Greek
Naya Kalogeraki
(49) Group Chief Customer and Commercial Officer
Senior management tenure: Appointed July 2016 (2 years)
Previous Group roles: Director of Strategy, CEO office. From 1998, when Naya Kalogeraki joined the Company, she built her career assuming roles of increased scale and scope, including Marketing Director, Trade Marketing Director, Sales Director and Country Commercial Director, Greece. She has been heavily involved in Group strategic projects and task forces addressing mission-critical business imperatives. In September 2013, Naya Kalogeraki was appointed to the role of General Manager, Greece and Cyprus.
Previous relevant experience: Naya Kalogeraki joined the Company in 1998 from The Coca-Cola Company where she held a number of marketing positions up to Marketing Manager.
Nationality: Greek
Sotiris Yannopoulos
(51) Region Director: Austria, Czech Republic, Hungary, Slovakia, Italy and Switzerland
Senior management tenure: Appointed July 2014 (4 years)
Previous Group roles: Sotiris Yannopoulos was General Manager in Serbia and Montenegro from 2009 to 2012 and Country General Manager in Italy from 2012 to 2014.
Previous relevant experience: Prior to joining the Group, Sotiris Yannopoulos spent 12 years working at PepsiCo in various roles. He also spent five years with Star Foods, where he was the East Balkans Business Unit Manager, and seven years with Tasty Foods in Greece, where his roles included Business Development Director, Marketing and Trade Marketing Director, Marketing Manager and Group Brand Manager. He started his career as an Assistant Product Manager (USA/South Africa) with Colgate-Palmolive.
Nationality: Greek
Alain Brouhard
(56) Business Solutions and Systems Director
Senior management tenure: Appointed June 2010 (8 years)
Previous Group roles: Region Director responsible for Nigeria, Romania, Moldova, Bulgaria, Serbia and Montenegro (2010 to 2013), and Water and Juice Business Director.
Previous relevant experience: Alain Brouhard began his career with Procter & Gamble, where he worked in four different countries and in a variety of commercial and management roles leading up to Global Customer Team Leader in 2000, when he oversaw the global account management of Delhaize and the European management of new channels, including discounters (such as Aldi, Lidl and Dia) and convenience retailing (such as petrol stations). From 2002 to 2010, Alain Brouhard held positions at Adidas, including Managing Director, Italy and Southeast Europe, from 2007 until 2010. Prior to that, he was Vice-President for commercial operations, EMEA, from 2002 to 2005, and, from 2005, took the role of Managing Director, Iberia, based in Spain, with responsibility for Spain and Portugal.
Nationality: French
Keith Sanders
(58) Region Director: Armenia, Belarus, Estonia, Latvia, Lithuania, Poland, Russian Federation, Ukraine and Moldova
Senior management tenure: Appointed August 2009 (9 years)
Previous Group roles: General Manager of the Company’s operations in Russia (2004).
Previous relevant experience: Prior to joining the Group, Keith Sanders spent 11 years within the Coca-Cola System. He started his career with The Coca-Cola Company in a regional marketing role within the Gulf Region. In 1993, he was appointed Human Resources and Training Manager for the Gulf Region. In 1994, he assumed his first Bottling General Manager role in Bahrain, and then moved through a series of larger country general management roles until 2001, when he was appointed Director for Bottling Operations in the Eurasia & Middle East Division with responsibility for Saudi Arabia, Pakistan, UAE, Oman, Bahrain and Qatar. Prior to joining the Coca-Cola System, Keith Sanders spent six years with Procter & Gamble in the United States in a variety of sales and marketing roles.
Nationality: American
Marcel Martin
(60) Group Supply Chain Director
Senior management tenure: Appointed January 2015 (4 years)
Previous Group roles: Marcel Martin joined the Group in 1993, holding positions with increasing responsibility in the supply chain and commercial functions. Since 1995, Marcel Martin has held general management assignments in several of our markets, including as General Manager for Eastern Romania, Regional Manager Russia, Country General Manager Ukraine and General Manager Nigeria. Marcel Martin became General Manager of our Irish operations in 2010 and is now our Group Supply Chain Director.
Nationality: Romanian
1092018 INTEGRATED ANNUAL REPORTSR
CG
FS
SSR
SI

Jan Gustavsson
(53) General Counsel, Company Secretary and Director of Strategic Development
Senior management tenure: Appointed August 2001 (17 years)
Previous Group roles: Jan Gustavsson served as Deputy General Counsel for Coca-Cola Beverages plc from 1999-2001.
Previous relevant experience: Jan Gustavsson started his career in 1993 with the law firm White & Case in Stockholm, Sweden. In 1995, he joined The Coca-Cola Company as Assistant Division Counsel in the Nordic and Northern Eurasia Division. From 1997 to 1999, Jan Gustavsson was Senior Associate in White & Case’s New York office, practising securities law and M&A.
Nationality: Swedish
Sanda Parezanovic
(54) Group Human Resources Director
Senior management tenure: Appointed June 2015 (3 years)
Previous Group roles: Sanda Parezanovic’s previous roles in the Group include: Public Affairs & Communications Manager, Serbia and Montenegro from 2003 to 2006; Country Human Resources and Public Affairs & Communications Manager, Serbia and Montenegro from 2006 to 2010; and Region Human Resources Director Bosnia & Herzegovina, Bulgaria, Croatia, Cyprus, Greece, Northern Ireland, the Republic of Ireland, North Macedonia, Moldova, Montenegro, Nigeria, Romania, Serbia and Slovenia from 2010 to 2015.
Previous relevant experience: Sanda Parezanovic started in 1989 as Market Researcher and later Strategic Planner working for various local research and marketing agencies in SFR Yugoslavia. Sanda Parezanovic joined Saatchi & Saatchi Balkans in 1994, holding various senior management positions in several Balkan countries, including Managing Director of two start-up agencies, first in North Macedonia and later in Serbia. In 1999 she relocated to London, where she worked for Saatchi & Saatchi and Marketing Drive on a number of pan-European and business development projects, before she joined our Group in 2003.
Nationality: Serbian
Nikos Kalaitzidakis
(49) Region Director: Bosnia, Croatia, Slovenia, Bulgaria, North Macedonia, Greece, Cyprus, Island of Ireland, Romania and Serbia & Montenegro
Senior management tenure: Appointed May 2018
Previous Group roles: Nikos Kalaitzidakis joined the Group in 2006 as Regional Manager for Northwest Russia and then moved to general manager roles in Croatia (2008), Bulgaria (2010), Hungary (2013) and Poland (2014).
Previous relevant experience: Prior to joining the Group, Nikos Kalaitzidakis spent five years in High Tech and Telecom industry, and seven years with Phillip Morris International in various roles and geographies across Europe and Central Asia.
Nationality: Greek
110 COCA-COLA HBC CORPORATE GOVERNANCE REPORT CONTINUED

Business case reviews and approvals
· The strategic revenue‑generating initiatives and product/packaging innovation business cases
· The strategic evolution of supply chain, human resources, commercial, Finance and BSS functions
· The optimisation of our logistics and manufacturing infrastructure
· Further development of BSO, our shared services organisation
Policy formulation and reviews
· Sustainability commitments
Priority projects
· 2025 strategy development
· Revenue growth management
· Route‑to‑market Reboot
· Renewing category growth
· Right Execution Daily
· Innovation for Growth
· Digital and Big Data and Advanced Analytics (BDAA)
· Engagement
· Performance Management
· Employer Branding and talent recruitment
Risk, safety and business resilience
· Evaluating the Group’s business resilience strategies
· Reviewing the Group’s health and safety policies and material incidents
The key responsibilities and elements of the Operating Committee’s role are:
· the day‑to‑day executive management of the Group and its businesses, including all matters not reserved for the Board or other bodies;
· the development of the Group strategies and implementation of the strategies approved by the Board;
· providing adequate head‑office support for each of the Group’s countries;
· the setting of annual targets and approval of annual business plans which form the basis of the Group’s performance management, including a comprehensive programme of strategies and targets agreed between the Country General Managers and the Region Directors;
· working closely with the Country General Managers, as set out in the Group’s operating framework, in order to capture benefits of scale, ensuring appropriate governance and compliance, and managing the performance of the Group; and
· leading the Group’s talent and capability development programmes.
Key responsibilities of the Operating Committee
Key activities and decisions of the Operating Committee in 2018
Long-term direction setting
· Developing 2025 organisational strategy, targets and growth pillars
· Defining Group strategic priorities and performance parameters
· Reviewing our revenue growth management framework and aligning on local commercialisation plans
· Rebooting our route‑to‑market approach in all operations
· Aligning our sustainability priorities on the way to delivering 2020 commitments and preparing 2025 commitments, together with relevant initiatives
Business planning
· Evaluating and updating the Group’s long-range business plan
· Reviewing and approving annual business plans for 2018 for all operations and central functions
· Approving Group and country talent, capabilities development and succession plans
Jan
Feb
Mar
Apr
May
JuneJuly
Aug
Sept
Oct
Nov
Dec
SR
CG
FS
SSR
SI
2018 INTEGRATED ANNUAL REPORT 111

RAISING THE BAR FOR RISK MANAGEMENT
LETTER FROM THE CHAIR OF THE AUDIT AND RISK COMMITTEEHighlights in 2018 included the adoption of IFRS 9, IFRS 15 and the assessment of the impact of IFRS 16. We also monitored training on our Code of Business Conduct and Anti-bribery policies, which both exceeded our minimum target of training 95% of our workforce.
Dear ShareholderThe Audit and Risk Committee focused its work during 2018 on enhancing and strengthening the Group’s existing financial controls, risk management and compliance systems, including in relation to its financial reporting process and the process for preparing consolidated accounts, which the Board recognises as essential components of effective corporate governance.
During 2018, the Audit and Risk Committee worked closely with the internal audit and finance teams in implementing the Group’s internal control framework. The Committee also reviewed developments in accounting and regulatory matters, including changes to IFRS, initiatives around human rights and gender diversity, and the new EU Data Protection Regulation.
WILLIAM W. (BILL) DOUGLAS IIICOMMITTEE CHAIR
The Audit and Risk Committee Report describes in more detail the work of the Audit and Risk Committee during 2018. In performing its work, the Committee balances independent oversight with support and guidance to management. I am confident to report that the Committee supported by senior management and the external auditor consistently carried out its duties to a high standard during the reporting year.
Role and responsibilitiesThe Audit and Risk Committee monitors the effectiveness of our financial reporting, internal control and risk management systems, and processes. The role of the Audit and Risk Committee is set out in the charter for the committees of the Board of Directors in Annex C to the Company’s Organisational Regulations. This is available at http://coca-colahellenic.com/en/about-us/corporate-governance/corporate-governance-overview/.
The key responsibilities and elements of the Audit and Risk Committee’s role are:
· providing advice to the Board on whether the Annual Report including the consolidated Financial Statements, taken as a whole, is fair, balanced and understandable and provides the information necessary for shareholders to assess the Group’s position and performance, including whether there is a consistency between the narrative in the front half and the financial reporting, whether the report will form a good basis of information for the shareholders, and that important messages are highlighted appropriately throughout the report;
· monitoring the quality, fairness and integrity of the Financial Statements of the Group, and reviewing significant financial reporting issues and judgements contained in them;
· reviewing the Group’s internal financial control and anti-fraud systems as well as the Group’s broader enterprise risk management and legal and ethical compliance programmes (including computerised information system controls and security) with the input of the external auditor and the internal audit department;
· reviewing and evaluating the Group’s major areas of financial risk and the steps taken to monitor and control such risk, as well as guidelines and policies governing risk assessment; and
· monitoring and reviewing the external auditor’s independence, quality, adequacy and effectiveness, taking into consideration the requirements of all applicable laws in Switzerland and the UK, the listing requirements of the London Stock Exchange and Athens Stock Exchange, and applicable professional standards.
Members Membership status
William W. (Bill) Douglas III (Chair)Member since 2016, Chair since 2016
John P. Sechi Member since 2014
Olusola (Sola) David-Borha Member since 2015
112 COCA-COLA HBC CORPORATE GOVERNANCE REPORT CONTINUED

The Audit and Risk Committee comprises three independent non-Executive Directors; Bill Douglas (Chair), Olusola (Sola) David-Borha and John P. Sechi, who were each re-elected for a one-year term by the shareholders at the Annual General Meeting on 11 June 2018.
The Board remains satisfied that Bill Douglas, Sola David-Borha and John Sechi possess recent and relevant financial and sector experience in compliance with the UK Corporate Governance Code. Bill Douglas was formerly Executive Vice President and Chief Financial Officer of Coca-Cola Enterprises, and Sola David-Borha and John Sechi have held a number of senior financial positions.
Further details on their experience are set out in their respective biographies on pages 91 to 95.
The Chief Financial Officer, as well as the General Counsel, external auditor the Director of Internal Audit, and the Group Financial Controller, normally attend all meetings of the Audit and Risk Committee. Other officers and employees are invited to attend meetings when appropriate. The Director of Internal Audit, and, separately, the external auditor, meet regularly with the Audit and Risk Committee without the presence of management to discuss the adequacy of internal controls over financial reporting and any other matters deemed relevant to the Audit and Risk Committee.
Work and activitiesThe Audit and Risk Committee met eight times during 2018 and discharged the responsibilities defined under Annex C of the Organisational Regulations. The work of the Audit and Risk Committee during the accounting year included evaluation of:
· the Annual Report including the consolidated Financial Statements and the full year results announcement for the year ended 31 December 2017 prior to their submission to the Board for approval, including consideration of the Group on a going concern basis, and compliance with Group policies;
· the interim consolidated Financial Statements and interim results announcement for the six-month period ending 29 June 2018, prior to their submission to the Board for approval;
· the trading updates for the three-month period ended 30 March 2018 and the nine-month period ended 28 September 2018;
· areas of significance in the preparation of the Financial Statements;
· the internal control environment, principal risks and risk management systems, and the Group’s statement on the effectiveness of its internal controls prior to endorsement by the Board;
· review of new internal control centre structure;
· review of the Viability Statement scenarios and underlying assumptions and recommendations to the Board that the Viability Statement be approved;
· review and approval of the internal audit plan, quarterly reports on the results of internal audit work and an internal or external independent quality assessment of the internal audit function in accordance with the Institute of Internal Auditors Attribute Standards 1311 or 1312;
· assessment of the overall financial risk management of the Group’s operations and review of internal financial control procedures;
· review of regulatory changes and developments, including IFRS 9, 15 and 16, and impact on risk management processes;
· matters arising under the Group’s Code of Business Conduct and the actions taken to address any identified issues; and
· revisions to and compliance with treasury policies, including risk limits, hedging programmes and counterparty limits;
· discussion of the requirements of IFRS 16 (Leases), which the Group adopted on 1 January 2019;
· review of the developments in Greece, Russia, Ukraine and Nigeria, and their implications for the Group’s operations;
· the Group adopted IFRS 9 (Financial Instruments) and IFRS 15 (Revenue from contracts with customers) on 1 January 2018. The Committee agreed that the adoption of these standards did not require restatement of prior-year numbers (see Note 4 to the consolidated Financial Statements);
· regular reports on quality assurance, health and safety, environmental protection, asset protection, treasury and financial risks, fraud control, insurance, security and enterprise risk management processes;
· reports from the external auditor on the annual and interim Financial Statements, approval of the external audit plan and pre-approval of audit fees for 2019;
· review of the external auditor’s independence, quality, adequacy and effectiveness; and
· the results of the Audit and Risk Committee self-assessment process.
1132018 INTEGRATED ANNUAL REPORTSR
CG
FS
SSR
SI

Areas of key significance in the preparation of the Financial StatementsThe Audit and Risk Committee considered a number of areas of key significance in the preparation of the Financial Statements in 2018, including the following:
· critical accounting judgements and estimates that affect the reported amounts of assets, liabilities, revenues and expenses, and the disclosure of contingent assets and liabilities in the consolidated Financial Statements, including income taxes (detailed in Notes 5, 10 and 28 to the consolidated Financial Statements);
· contingencies, legal proceedings, competition law and regulatory procedures, including cases involving the national competition authorities of Greece and Switzerland and litigation matters in Nigeria, Russia, Italy and Greece, and the impact of these on the consolidated Financial Statements and accompanying notes;
· the impairment testing of goodwill and indefinite-lived intangible assets with a particular emphasis on reviewing and challenging the key assumptions used in the value-in-use calculation, and the sensitivity analysis performed for the material operations with reduced financial headroom. These assumptions, and a discussion of how they are established as well as the sensitivity analysis, are described in Note 13 to the consolidated Financial Statements;
· reviewed the management’s work in conducting a robust assessment of these risks that impact the Viability and Going Concern Statements; and
· recommended to the Board to approve the Viability Statement.
Priorities for 2019The key priorities for 2019 are the following:
· monitoring the developments in accounting and regulatory matters, including potential changes to IFRS accounting standards;
· compliance with the new EU Data Protection Regulation;
· ongoing monitoring of risks as well as impairment testing of goodwill and intangible assets;
· ongoing monitoring of internal financial contracts, anti-fraud systems and code of business conduct compliance, and
· ongoing monitoring of the Group’s Enterprise Risk Management and Quality assurance, and information system security processes.
External auditorPricewaterhouseCoopers AG, Birchstrasse 160, CH 8050 Zurich, Switzerland (‘PwC AG’) has been elected by the shareholders as the statutory auditor for the Group’s statutory consolidated and standalone Financial Statements. Signing partner for the statutory Financial Statements on behalf of PwC AG is Michael Foley, who has held this role since the year ended 31 December 2016.
The Board, at the recommendation of the Audit and Risk Committee, has retained PricewaterhouseCoopers S.A., 268 Kifissias Avenue – 15232 Halandri, Greece (‘PwC S.A.’), an affiliate of PwC AG, to act as the Group’s independent registered public accounting firm for the purposes of reporting under the UK rules for the year ended 31 December 2018. Signing partner for the Financial Statements on behalf of PwC S.A. is Konstantinos Michalatos, who has held this role for the first time as regards the year ended 31 December 2018.
The appointment of PwC has been approved by the shareholders until the next Annual General Meeting by way of advisory vote. ‘PwC’ refers to PwC AG or PwC S.A., as applicable, in this Annual Report.
During the accounting period, the members of the Audit and Risk Committee met separately with PwC on a regular basis, and the Audit and Risk Committee took an active role in reviewing the scope of the audit, the independence, objectivity and effectiveness of PwC, and the negotiations relating to audit fees. The Audit and Risk Committee also met with the management team, which led the discussions with PwC, including the Director of Internal Audit, to review the performance of PwC without PwC being present. Following this review process, the Audit and Risk Committee has recommended to the Board that a proposal to reappoint PwC be put to a shareholders’ vote at the next Annual General Meeting.
PwC has acted as the Group’s sole external auditor since 2003. The Company ran a competitive tender for the external auditor services in 2015 which was overseen by the Audit and Risk Committee. Following the evaluation of the proposals, the Audit and Risk Committee concluded in 2015 that the best interests of the Group and its shareholders would be served by retaining PwC as external auditor and made such recommendation to the Board. PwC was reappointed by the Board as the Group’s external auditor with effect from 11 December 2015. Currently, the Audit and Risk Committee anticipates that the audit contract will be put out to tender again in 2025. There are no contractual or other obligations restricting the Group’s choice of external auditor.
114 COCA-COLA HBC CORPORATE GOVERNANCE REPORT CONTINUED

Non-audit services provided by the external auditorThe Audit and Risk Committee considers the independence, in both fact and appearance, of the external auditor as critical and has long had an auditor independence policy providing definitions of the services that the external auditor may and may not provide. In line with the relevant FRC Guidance, the policy requires the Audit and Risk Committee’s pre-approval of all audit and permissible non-audit services provided by the external auditor. Such services include audit, work directly related to audit, and certain tax and other services as further explained below. In practice, the Audit and Risk Committee applies the policy restrictively, and approval for work other than audit and audit-related services is rarely granted.
Under the policy, pre-approval may be provided for work associated with: statutory or other financial audit work under IFRS or according to local statutory requirements; attestation services not required by statute or regulation; accounting and financial reporting consultation and research work necessary to comply with generally accepted accounting and auditing standards; internal control reviews and assistance with internal control reporting requirements; review of information systems security and controls; tax compliance and related tax services, excluding any tax services prohibited by regulatory or other oversight authorities; expatriates’ and other individual tax services; and assistance and consultation on questions raised by regulatory agencies.
For each proposed service, the external auditor is required to provide detailed back-up documentation at the time of approval to permit the Audit and Risk Committee to make a determination whether the provision of such services would impair the external auditor’s independence.
PwC has complied with the policy for the financial year ended on 31 December 2018, and there have been no changes to the policy during the year.
Audit fees and all other fees
Audit fees
The total fees for audit services paid to PwC and affiliates were approximately €4.3 million for the year ended 31 December 2018, compared to approximately €4.3 million for the year ended 31 December 2017. The total fees for 2018 include fees associated with the annual audit and reviews of the Group’s half-year reports, prepared in accordance with IFRS and local statutory audits.
Audit-related fees
Fees for audit-related services paid to PwC and affiliates for the year ended 31 December 2018 were €0.4 million compared to €0.4 million for the year ended 31 December 2017.
Tax-related fees
Fees for tax services to PwC and affiliates for the year ended 31 December 2018 were €nil million compared to €nil million for the year ended 31 December 2017.
All other fees
Fees for non-audit services paid to PwC or affiliates for the year ended 31 December 2018 were €0.1 million. There were €nil million in fees for non-audit services paid to PwC or affiliates during the year ended 31 December 2017.
Risk management
During 2018, the Company continued to revise and strengthen its approach to risk management as described in detail on pages 72-75. The primary aim of this framework is to minimise our exposure and ensure that the nature and significance of all risks we are facing are properly identified, reviewed, managed and, where necessary, escalated. A quarterly risk assessment is undertaken by the countries and corporate office support functions, and significant risks are then reported to the Region Directors and the Chief Risk Officer. The Company’s Group Risk Forum reviews the identified risks biannually and presents issues of critical exposure to the Operating Committee. The latter, after careful review, reports to the Audit and Risk Committee material risks and mitigating actions. This process is both top-down and bottom-up and is designed to ensure that risks arising from business activities are appropriately managed.
Finally, we have in place third-party insurance to cover residual insurable risk exposure such as property damage, business interruption and liability protection, including Directors’ and officers’ insurance for our Directors and officers, as well as for the officers and directors of certain subsidiaries.
1152018 INTEGRATED ANNUAL REPORTSR
CG
FS
SSR
SI

Internal control
The Board has ultimate responsibility for ensuring that the Company has adequate systems of financial reporting control. Systems of financial reporting control can provide only reasonable and not absolute assurance against material misstatements or loss. In certain of the countries in which we operate, our businesses are exposed to a heightened risk of loss due to fraud and criminal activity. We review our systems of financial control regularly in order to minimise such losses.
The Board has adopted a chart of authority-defining financial and other authorisation limits and setting procedures for approving capital and investment expenditure. The Board also approves detailed annual budgets. It subsequently reviews quarterly performance against targets set forth in these plans and budgets. A key focus of the financial management strategy is the protection of our earnings stream and management of our cash flow.
We have conducted an annual review of the effectiveness of our risk management system and internal control systems in accordance with the UK Corporate Governance Code. Part of this review involves regular review of our financial, operational and compliance controls, following which we report back to the Board on our work and findings as described above. This allowed us to provide positive assurance to the Board to assist it in making the statements that our risk management and internal control systems are effective, as required by the UK Corporate Governance Code. Further information is set out on page 72.
The key features of the Group’s internal control systems that ensure the accuracy and reliability of financial reporting include: clearly defined lines of accountability and delegation of authority; policies and procedures that cover financial planning and reporting; preparation of monthly management accounts, and review of the disclosures within the Annual Report, from function heads to ensure that the disclosures made appropriately reflect the developments within the Group in the year and meet the requirement of being fair, balanced and understandable.
Internal audit
Our internal audit function reports directly to the Audit and Risk Committee, which reviews and approves the internal audit plan for each year. The internal audit function consists of approximately 40 full-time professional audit staff based in Athens, Budapest, Sofia, Moscow and Lagos, covering a range of disciplines and business expertise. One of the responsibilities of the internal audit function is to confirm to the Board the effective operation of our internal control framework. For this purpose, the Director of Internal Audit makes quarterly presentations to the Audit and Risk Committee and meets regularly with the Audit and Risk Committee without the presence of our management.
In addition, the internal audit function reviews the internal financial, operational and compliance control systems across all the jurisdictions in which we operate and reports its findings to management and the Audit and Risk Committee on a regular basis. The internal audit function focuses its work on the areas of greatest risk to us, as determined by a risk-based approach to audit planning. As part of our commitment to maintaining and strengthening best practice in corporate governance matters, we also consistently seek to enhance our internal control environment and risk management capability.
The internal audit function carries out work across the Group, providing independent assurance, advice and insight to help the organisation accomplish its objectives by bringing a systematic, disciplined approach to evaluate and improve the effectiveness of risk management, control and governance processes. In December 2018, the Audit and Risk Committee agreed the FY19 audit plan to be undertaken by the internal audit team prior to the start of the year. The audit plan coverage is based on risk, strategic priorities and consideration of the strength of the control environment. The internal audit function prepares audit reports and recommendations following each audit, and appropriate measures are then taken to ensure that all recommendations are implemented. Significant issues, if any, are raised at once. There were no such issues in 2018. The Audit and Risk Committee reviews the results of the internal audit reports during each meeting, focusing on the key observations of any reports where processes and controls require improvement. The Audit and Risk Committee was also provided with updates on the remediation status of management actions of internal audit findings and on the internal audit quality assurance and improvement programme at each meeting. The Chief Financial Officer and the Regional Finance Directors, Country General Managers and Country Chief Financial Officers have access to the implementation status of the recommendations at all times.
Where internal or external circumstances give rise to an increased level of risk, the audit plan is modified accordingly. Nevertheless, no such cases occurred this year. Any changes to the agreed audit plan are presented to and agreed by the Audit and Risk Committee. Detailed updates on specific areas were provided at the request of the Audit and Risk Committee, such as, for example, the progress on audit issues relating to a Health and Safety audit.
116 COCA-COLA HBC CORPORATE GOVERNANCE REPORT CONTINUED

Whistleblowing measures
Business ethics and anti-corruption
We seek to grow our business by serving customers and consumers, and conduct all business activities with integrity and respect. We maintain zero-tolerance regarding breaches of our Code of Business Conduct and anti-bribery policies, as well as any attempts to retaliate against our people who report potential violations.
We have online and classroom training for all our people so that everyone understands our Code of Business Conduct, and we hold targeted anti-bribery training for employees working in areas we assess as high risk. During the year, 97.97% of our employees across the Group were trained on our Code of Business Conduct and 97.21% on our anti-bribery policies, in line with our target to train a minimum of 95% of our total workforce. We have also established an anti-bribery due diligence process for third parties who have contact with government authorities. We have established grievance mechanisms, including an independently operated whistleblower Speak Up Hotline, available in all Coca-Cola HBC countries in local languages. Through this hotline, we receive, retain, investigate and act on employee complaints or concerns.
In 2018, we received 267 allegations (2017: 292) of which 150 (2017: 98) were received through the whistleblower hotline. All allegations involving potential Code of Business Conduct violations were investigated in accordance with the Group Code of Business Conduct Handling Guidelines. Of those investigated, 113 (2017: 124) matters were substantiated as code violations of which 20 (2017: 35) involved an employee in a managerial position or involved a loss greater than €10,000. For details concerning the handling of allegations received in 2018, see our website.
All allegations involving potential Code of Business Conduct violations were investigated in accordance with the Group Code of Business Conduct Handling Guidelines. You can find more on allegations investigated and violations uncovered in our GRI index: https://coca-colahellenic.com/Campaigns/AnnualReport2018/assets/pdf/Coca-Cola-HBC-2018-GRI-Content-Index.pdf.
We operate a hotline to receive, retain, investigate and act on employee complaints or concerns regarding accounting, internal control or ethical matters. This includes any matters regarding the circumvention or attempted circumvention of internal controls, including matters that would constitute a violation of our Code of Business Conduct or matters involving fraudulent behaviour by officers or employees of the Group. All such allegations, complaints or concerns may be communicated in a variety of ways, in local languages and on an anonymous basis, to our Director of Internal Audit. Communications received by the Director of Internal Audit, or directly through the hotline, are kept confidential and, where requested, anonymous. The Director of Internal Audit liaises regularly with the General Counsel and communicates all significant allegations to the Chair of the Audit and Risk Committee.
Disclosure Committee
A Disclosure Committee has been established, and disclosure controls and procedures have been adopted to ensure the accuracy and completeness of our public disclosures. The Disclosure Committee is composed of the Chief Financial Officer, the General Counsel, the Director of Investor Relations and the Group Financial Controller.
Performance reporting
Reports on our annual performance and prospects are presented in the Annual Report following recommendation by the Audit and Risk Committee. In line with UK practice, we have adopted half-year and full-year reports, and Q1 and Q3 trading updates. Internally, our financial results and key performance indicators are reviewed by the Operating Committee on a monthly basis. This information includes comparisons against business plans, forecasts and prior-year performance. The Board of Directors receives updates on performance at each Board meeting, as well as a monthly report on our business and financial performance.
1172018 INTEGRATED ANNUAL REPORTSR
CG
FS
SSR
SI

ENSURING THE RIGHT TEAM FOR THE FUTURE
LETTER FROM THE CHAIR OF THE NOMINATION COMMITTEEHighlights this year included the successful onboarding of the new CEO Zoran Bogdanovic. In 2018, we also recorded a small increase in female managers which advances our agenda to have a diverse workforce.
Dear ShareholderThe work of the Nomination Committee has continued to focus on the composition of the Board and the important task of Board and senior management succession planning.
Following the appointment of Zoran Bogdanovic as the Company’s Chief Executive Officer in December 2017, he was appointed as an Executive Director on the Board at the Annual General Meeting on 11 June 2018.
In 2019, the Committee will continue to review the balance of skills, experience and diversity of the Board and will also focus on the talent development, employee engagement and gender diversity initiatives necessary to ensure that the Group has the people and skills to deliver on its strategy. The Committee will also oversee an externally facilitated self-assessment process.
A summary of the Group’s Nomination Policy for the recruitment of Board members is available online at: https://coca-colahellenic.com/media/1549/summary-of-nomination-policy-for-recruitment-of-board-members.pdf. The Board Diversity Policy is described on page 119.
Role and responsibilitiesThe function of the Nomination Committee is to establish and maintain a process for appointing new Board members, to manage, in consultation with the Chairman, the succession of the Chief Executive Officer and to support the Board in fulfilling its duty to conduct a Board self-assessment. The formal role of the Nomination Committee is set out in the charter for the committees of the Board of Directors in Annex C of the Company’s Organisational Regulations. This is available online at https://coca-colahellenic.com/en/about-us/corporate-governance/corporate-governance-overview/.
Key elements of the Nomination Committee’s role are:
· reviewing the size and composition of the Board;
· identifying candidates and nominating new members to the Board;
· planning and managing, in consultation with the Chairman, a Board membership succession plan;
· ensuring, together with the Chairman, the operation of a satisfactory induction programme for new members of the Board and a satisfactory ongoing training and education programme for existing members of the Board and its committees as necessary to deliver on our strategy;
· the Committee will also oversee an externally facilitated self-assessment process;
· setting the criteria for, and overseeing, the annual assessment of the performance and effectiveness of each member of the Board and each Board committee;
· conducting an annual assessment of the performance and effectiveness of the Board, and reporting conclusions and recommendations based on the assessment to the Board;
· ensuring that each committee of the Board is carrying out a self-assessment of its performance and reporting its conclusions and any recommendations for change to the Board; and
· overseeing the employee and management talent development and succession plans of the Group.
Members Membership status
Reto Francioni (Chair)Member since 2016 Chair since 2016
Charlotte J. Boyle Member since 2017
Alexandra Papalexopoulou Member since 2015
The members of the Nomination Committee are Reto Francioni, Charlotte Boyle and Alexandra Papalexopoulou. All members of the Nomination Committee are independent non-Executive Directors. At the Annual General Meeting on 11 June 2018, Reto Francioni, Charlotte Boyle and Alexandra Papalexopoulou were re-elected for a one-year term by the shareholders.
RETO FRANCIONICOMMITTEE CHAIR
118 COCA-COLA HBC CORPORATE GOVERNANCE REPORT CONTINUED

Committee at work
Succession planning
Board composition
Recruitment Shortlisting
InterviewBalance of skills assessment
Appointment Induction
Work and activitiesThe Nomination Committee met four times during 2018 and discharged the responsibilities defined under Annex C of the Company’s Organisational Regulations. The Chief Executive Officer and the Group Human Resources Director regularly attend meetings of the Nomination Committee. In addition, the Chairman is actively involved in the work of the Nomination Committee concerning succession planning and the selection of key people. In 2018, the General Counsel also met with the Nomination Committee on several occasions. During 2018, the work of the Nomination Committee included consideration of:
· succession planning and development of plans for the recruitment of new Board members;
· composition of the Board, including the appropriate balance of skills, knowledge, experience and diversity;
· review of the talent management framework;
· the performance evaluation and annual assessments of the committees and the Board;
· review of the Director induction process and training programmes; and
· review of the Group’s Inclusion and Diversity Policy.
Priorities for 2019The Nomination Committee’s priorities for 2019 include:
· continuous work on succession plans for Board and senior management positions; and
· externally facilitated Board and committee assessments.
Performance evaluation of the BoardThe Nomination Committee led the annual assessment of the performance of the Board and its committees during the year with the support of Lintstock, an external advisory firm. The key areas included in the assessment were Board structure and diversity, timeliness and quality of information, Board discussions, committees and their operation, succession planning, risk appetite and risk management, and remuneration and performance. The scores were high overall and the results of the evaluation were presented at the December 2018 Board meeting. Further details on the internal board evaluation are set out on page 102.
As with all employees, the Group offers training opportunities to the Board and senior management in order to improve their skills, and encourages all Board members and senior management to gain relevant experience and knowledge to fulfil their position’s duties.
DiversityThe Group continues to have a firm commitment to policies promoting diversity, equal opportunity and talent development at every level throughout the Group, including at Board and management level, and is constantly seeking to attract and recruit highly qualified candidates for all positions in its business. The Group’s Inclusion and Diversity Policy applies to all people who work for us. Further details on the Group’s Inclusion and Diversity Policy are set out on page 31 in the Strategic Report.
The Group believes that diversity at Board level acts as a key driver of Board effectiveness, helps to ensure that the Group can achieve its overall business goals, especially in light of our geographical footprint, and is critical in promoting a diverse and inclusive culture across the whole Group. The Board has adopted a formal Board Diversity Policy.
The Group’s Board Diversity Policy guides the Nomination Committee and the Board in relation to their approach to diversity in respect of succession planning and the selection process for the appointment of new Board members. The Nomination Committee is responsible for implementing this policy and for monitoring progress towards the achievement of its objectives.
Under the Board Diversity Policy, the Nomination Committee is required to take into account all aspects of diversity, including age, ethnicity, gender, educational and professional background when considering succession planning and new Board appointments. Board appointments are evaluated on merit against objective criteria with due regard for diversity to ensure that candidates contribute to the balance of skills, experience, knowledge and diversity of the Board.
The proportion of women on the Board stands at 23%. The percentage of managers who are women has also increased from 35% as at 31 December 2017 to 37% as at 31 December 2018, while the percentage of women among executive leaders remained 30%.
The Nomination Committee, in conjunction with the Operating Committee, will continue to monitor the proportion of women at all levels of the Group and ensure that all appointments are made with a view to having a high level of diversity within the workplace and in leadership positions.
1192018 INTEGRATED ANNUAL REPORTSR
CG
FS
SSR
SI

RAISING THE LEVEL OF AMBITION WITH 2025 SUSTAINABILITY
COMMITMENTS
LETTER FROM THE CHAIR OF THE SOCIAL RESPONSIBILITY COMMITTEEHighlights this year included the introduction of our 2025 sustainability commitments, following the successful implementation of our 2020 agenda. Circular economy, plastic packaging and waste were areas of significant focus in 2018.
Dear ShareholderIn 2018, the Social Responsibility Committee continued its focus on the implementation of our sustainability strategy, as well as on social and environmental external trends and their impact on the business.
Building on the success in implementing our 2020 sustainability agenda across the value chain, we introduced 2025 sustainability commitments in 2018. We focused on six pillars, covering: carbon emission and renewables; water reduction and stewardship; World Without Waste; sustainable sourcing; nutrition; and people and communities. For details, please have a look at page 35.
The Committee monitored sustainability-related regulatory developments, with an emphasis on circular economy, plastic packaging and waste, evolved nutrition labelling, an internal study about the impact of our business on natural capital (based on Natural Capital Protocol principles) as well as product tax developments.
We also made a new assessment of the CSR benchmark landscape. During 2018, we achieved top scores from CDP, MSCI ESG Rating, FTSE4Good, ISS-oekom and Vigeo Eiris. We are particularly proud of having been among the top three beverage companies in the Dow Jones Sustainability Index World for six years in a row.
Going forward in 2019, the Committee will ensure that sustainability objectives are fully integrated in the business strategy and that responsible, sustainable business practices continue to engender the trust of stakeholders while supporting the sustainable growth of our business.
ANASTASIOS I. LEVENTISCOMMITTEE CHAIR
120 COCA-COLA HBC CORPORATE GOVERNANCE REPORT CONTINUED

Role and responsibilitiesThe Social Responsibility Committee is responsible for the development and supervision of procedures and systems to ensure the pursuit of the Group’s social and environmental goals. The formal role of the Social Responsibility Committee is set out in the charter for the committees of the Board of Directors in Annex C of the Company’s Organisational Regulations. This is available online at https://coca-colahellenic.com/en/about-us/corporate-governance/corporate-governance-overview/.The key elements of the Social Responsibility Committee’s role and responsibilities are:
· establishing the principles governing the Group’s policies on social responsibility, and the environment to guide management’s decisions and actions;
· overseeing the development and supervision of procedures and systems to ensure the achievement of the Group’s social responsibility and environmental goals;
· establishing and operating a council responsible for developing and implementing policies and strategies to achieve the Company’s social responsibility and environmental goals, and ensuring Group-wide capabilities to execute such policies and strategies;
· ensuring the necessary and appropriate transparency and openness in the Group’s business conduct in pursuit of its social responsibility and environmental goals;
· ensuring and overseeing the Group’s interactions with stakeholders in relation to its social responsibility and environmental policies, goals and achievements, including the level of compliance with internationally accepted standards; and
· reviewing Group policies on environmental issues, human rights, and other topics as they relate to social responsibility.
Members Membership status
Anastasios I. Leventis (Chair)Member since 2016
Chair since 2016
Alexandra Papalexopoulou Member since 2016
José Octavio Reyes Member since 2014
Work and activitiesThe Social Responsibility Committee met four times during 2018 and discharged its responsibilities as defined under Annex C of the Company’s Organisational Regulations. In addition to the Committee members, meetings were attended by either the Group Director of Public Affairs and Communication or the Group Director of Sustainability and Community. The CEO, Zoran Bogdanovic, attended three of the meetings.
During 2018, the Social Responsibility Committee reviewed and provided guidance and insights to advance the Group’s sustainability approach in the following areas:
· rate of implementation and progress made against the 12 publicly communicated 2020 sustainability commitments;
· endorsement of 2025 sustainability commitments;
· assessment of the Group’s progress regarding the level of disclosure and reporting across all three dimensions of ESG investments (environmental, social and governance), with particular focus on the Dow Jones Sustainability Indices, GRI Standards and Task Force on Climate-related Financial Disclosures (TCFD) recommendations;
· the global Coca-Cola World Without Waste strategy and specific Coca-Cola HBC actions and goals on packaging and waste in three areas: package design, packaging waste collection and partnerships; and
· assessment of emerging trends in sustainability and potential implications for Coca-Cola HBC, particularly in the areas of relevant UN SDGs.
The Social Responsibility Committee maintained its review of the annual assessment of material issues, which combined input from both business leaders and external stakeholders, in accordance with the framework of the GRI Sustainability Reporting Standards, the International Integrated Reporting Council (IIRC), and the guidance of the Sustainability Accounting Standards Board for the beverage industry. The Committee also assessed the ongoing level of stakeholder engagement and advised on the 2018 Stakeholder Forum.
Priorities for 2019The Social Responsibility Committee’s priorities for 2019 include:
· overseeing progress towards the 2025 sustainability commitments;
· monitoring in particular progress of the World Without Waste strategy and related plans;
· reviewing and endorsing the Group’s sustainability reporting according to the GRI and IIRC frameworks;
· governing the implementation of recommendations from the TCFD; and
· addressing potential sparkling soft drinks and plastic packaging taxation.
1212018 INTEGRATED ANNUAL REPORTSR
CG
FS
SSR
SI

DRIVING LONG-TERM PERFORMANCE
LETTER FROM THE CHAIR OF THE REMUNERATION COMMITTEE2018 was another year of very good performance. We have made no changes to the remuneration policy but going forward we will seek to incentivise balance between growth and profitability as appropriate.
Dear ShareholderAs the Chair of the Remuneration Committee, I am pleased to present our Directors’ Remuneration Report for the year ended 31 December 2018. Our primary listing is on the London Stock Exchange, and our Company is domiciled in Switzerland. We therefore ensure that we comply fully with UK regulations, except where these conflict with Swiss law. The format of this year’s Remuneration Report is consistent with the format of last year’s as there were no significant changes in relevant regulations or internal policies. As always, I welcome your feedback and suggestions regarding anything we can do to make the report even clearer.
The Group’s remuneration philosophy and policies are designed to attract, motivate and retain the talented people we need to meet the Company’s strategic objectives, and to give them due recognition. To this end, the Remuneration Committee has worked to ensure that the remuneration policy of the Group remains fair, transparent and competitive in comparison with our peers, and that remuneration is linked to business strategy and drives sustainable performance.
2018 performance outcomesIn 2018, we delivered another year of very good performance, with revenue growth above our target and another step up in margins. With this in mind, we are delighted to announce strong results for the 2018 financial year, delivering net sales revenue growth of 6.0% on a currency neutral basis, volume growth of 4.2% with positive performance in most segments and our comparable EBIT margin improved this year to 10.2%. We have continued to improve our cost efficiency with operating expenditure (as a % of revenue) reaching 27.7%. We also saw an improvement in our overall ROIC performance, to 13.7% this year (up from 12.4% in 2017). This performance demonstrates significant progress towards our 2020 strategic plan.
The table below illustrates Company performance achieved against key performance indicators, and highlights those that are used in our Management Incentive Plan (MIP) and Performance Share Plan (PSP) variable pay schemes.
Included in MIP Other key performance indicatorsIncluded in PSP
Volume (m unit cases)
2,192(2017: 2,104)
Net sales revenue (€m)
6,657(2017: 6,522)
Comparable EPS (€)
1.306(2017: 1.233)
Free cash flow (€m)
370(2017: 426)
Comparable EBIT (€m)
681(2017: 621)
Operating expense as % of NSR (excl. DME)
25.0%(2017: 25.5%)
ROIC
13.7%(2017: 12.4%)
Currency-neutral NSR generated per case (€)
3.04(2017: 2.99)
122 COCA-COLA HBC DIRECTORS’ REMUNERATION REPORT

Applying the remuneration policy for Directors in 2018In accordance with our remuneration policy, the base salary of the Chief Executive Officer is reviewed annually after the financial results of the year are available. As Zoran Bogdanovic was appointed Chief Executive Officer on 7 December 2017 and his base salary was reviewed at that time, the Remuneration Committee did not consider a salary adjustment in 2018.
Our sustained business performance in 2018 has resulted in a payout of 62% of base salary under the Management Incentive Plan (MIP) for the CEO, equivalent to an award of 48% of maximum MIP opportunity. This reflects solid Company performance, with volume between target and maximum, and comparable EBIT, net sales revenue and operating expenses ratio between threshold and target levels.
We continue to be committed to disclosing MIP targets retrospectively and you will find the 2018 performance targets and outcomes reported on page 138.
Changes in 2018The Remuneration Committee performed the regular annual review of the Group’s remuneration policy in 2018. We continue to believe that it is fit for purpose and ensures the alignment of management with our business strategy and shareholders’ interests. No changes to the remuneration policy were therefore proposed.
The Committee reviewed the measures we use for the annual MIP and adjusted these for 2019 to better align with our strategic priorities for the coming year. As in 2018, MIP measures will include Net Sales Revenue (NSR), Comparable EBIT and Operating expenditures as a percentage of NSR. For 2019, we will use Gross Profit Margin in place of Volume, to ensure that we are incentivising an appropriate balance between growth and profitability.
You will find further details about how we have applied the remuneration policy this year on pages 135-140.
Looking aheadThe Remuneration Committee will continue to keep policies under review so as to ensure that plans and programmes relating to remuneration support the Company’s business strategy and are closely linked to shareholders’ interests. We value the dialogue with shareholders and welcome views on this Remuneration Report. We were pleased with the positive vote for the Company’s remuneration policy and the Annual Report on Remuneration at the 2018 Annual General Meeting, and trust we will have your support again in 2019.
The Committee is mindful of the updated UK Corporate Governance Code and continues to review the application of this as it relates to aspects of remuneration. We will report further on our response to this in next year’s Directors’ Remuneration Report.
The role of the Remuneration CommitteeThe main responsibilities of the Remuneration Committee are to establish the remuneration strategy for the Group and to approve compensation packages for Directors and senior management. The Remuneration Committee operates under the Charter for the Committees of the Board of the Company set forth in Annex C to the Organisational Regulations of the Company, available on the Group’s website at: https://coca-colahellenic.com/en/about-us/corporate-governance/corporate-governance-overview/
Members Membership status
Alexandra Papalexopoulou (Chair)Member since 2015
Chair since June 2016
Reto Francioni Appointed June 2016
Charlotte J. Boyle Appointed June 2017
In accordance with the UK Corporate Governance Code, the Remuneration Committee consists of three independent non-Executive Directors; Alexandra Papalexopoulou (Chair), Charlotte Boyle and Reto Francioni, who were each elected by the shareholders for a one-year term on 11 June 2018. The Remuneration Committee met four times in 2018; in March, June, September and December. Please refer to the ‘Board and committee attendance in 2018’ section of the Corporate Governance report on page 100 for details on the Remuneration Committee meetings.
ALEXANDRA PAPALEXOPOULOUCHAIR OF THE REMUNERATION COMMITTEE
1232018 INTEGRATED ANNUAL REPORTSR
CG
FS
SSR
SI

Reward strategy and objectiveThe objective of the Group’s remuneration philosophy is to attract, retain and motivate employees who are curious, agile and committed to perform. Our reward strategy seeks to promote a growth mindset and reinforce desirable behaviours, ensuring that employees are fairly rewarded and that their individual contributions are linked to the success of the Company.
Variable pay is an important element of our reward philosophy. A significant proportion of total remuneration for top managers (including the Chief Executive Officer and the members of the Operating Committee) is tied to the achievement of our business objectives. These objectives are defined by key business metrics that are consistent with our growth strategy and will deliver long-term shareholder value. The variable pay element increases or decreases, based on the achieved business performance. Through equity-related long-term compensation, we seek to ensure that the financial interests of the Chief Executive Officer, the members of the Operating Committee and top managers are aligned with those of shareholders.
All of our remuneration plans, both fixed and variable, are designed to be cost-effective, taking into account market practice, business performance, and individual performance and experience where relevant. We pay close attention to our shareholders’ views in reviewing our remuneration policy and programmes.
Remuneration throughout the organisation – a snapshot
AttractingFinding the people we want and need
RetainingContinuing to attract the best talent
MotivatingAchieving financial, business
and non-financial targets
RecognisingAdopting behaviours that
produce exceptional performance
How we implement our reward strategy
Note: Participants in the Performance Share Plan are not eligible to participate in the Long-Term Incentive Plan.
Chief Executive Officer and Operating Committee
Support the alignment with shareholder interests ensuring sustainable performance: · Chief Executive Officer – required to hold shares in the Company
equal in value to 200% of annual base salary within a five-year period. · Operating Committee – required to hold shares in the Company
equal in value to 100% of annual base salary within a five-year period.
Performance share awards vest over three years. PSP awards are cascaded down to top managers, promoting a focus on long-term performance and aligning them to shareholders’ interests.
Chief Executive Officer, Operating Committee and selected senior management
Cash long-term incentive awards vest over three years. LTIP awards are cascaded down to select middle and senior management to promote a high-performance culture.
Selected middle and senior management
Management employees may be eligible to receive an award under the annual bonus scheme. Performance conditions are bespoke to the role and business unit.
All management
The Employee Share Purchase Plan encourages share ownership and aligns the interests of our employees with those of shareholders.
All employees
Base salaries may reflect the market value of each role as well as the individual’s performance and potential. Retirement and other benefits are subject to local market practice.
Shareholding guidelines
Performance Share Plan
Management Incentive Plan
Employee Share Purchase Plan (dependent on
country practice)
Fixed pay and benefits
(base salary, retirement and other benefits
– dependent on country practice)
Long-Term Incentive Plan
The chart below illustrates how we put our reward strategy into practice, with the different remuneration arrangements that apply to different employee groups.
A competitive winning team
124 COCA-COLA HBC DIRECTORS’ REMUNERATION REPORT CONTINUED

+ =Base salaryRetirement
benefitsOther
benefitsESPP MIP PSP
Total compensation
Remuneration arrangements for the Chief Executive Officer – at a glance
The table below summarises the remuneration arrangements in place for our Chief Executive Officer. See page 137 for total compensation figures.
Fixed payVariable pay subject
to performance
Pay element Detail
Base salary The base salary of the Chief Executive Officer is €750,000.
The salary is reviewed annually and any increase is typically effective 1 May each year.
Retirement benefits The Chief Executive Officer participates in a defined benefit pension plan under Swiss law. Employer contributions are 15% of annual base salary.
Other benefits Other benefits include (but are not limited to) medical insurance, housing allowance, company car/allowance, cost of living adjustment, trip allowance, partner allowance, exchange rate protection, tax equalisation and tax filing support and advice. Benefit levels vary each year depending on need.
ESPP
(Employee Share Purchase Plan)
The Chief Executive Officer may participate in the Company’s Employee Share Purchase Plan. As a scheme participant, the Chief Executive Officer has the opportunity to invest a portion of his salary and/or MIP payments in shares. The Company matches employee contributions on a one-to-one basis up to 3% of salary and/or MIP payout.
Awards are subject to potential application of malus and clawback provisions.
MIP
(Management Incentive Plan)
The MIP consists of a maximum annual bonus opportunity of up to 130% of base salary.
Payout is based on business performance targets (up to 120% of base salary) and individual performance (up to 10% of base salary).
No bonus will be paid out if the Chief Executive Officer has achieved less than 50% of his individual objectives.
50% of any bonus will be deferred into shares for a further three-year period.
Payments are subject to potential application of malus and clawback provisions.
PSP
(Performance Share Plan)
The PSP is an annual share award which vests after three years and is subject to two equally weighted performance conditions:
(i) comparable earnings per share (EPS); and
(ii) return on invested capital (ROIC), each measured over a three-year period.
An additional two-year holding period will apply following vesting.
Awards are subject to potential application of malus and clawback provisions.
1252018 INTEGRATED ANNUAL REPORTSR
CG
FS
SSR
SI
Remuneration policy
IntroductionThe following section (pages 126 to 128) sets out our Directors’ remuneration policy which was approved at the 2018 Annual General Meeting. There have not been any proposed changes to the remuneration policy for 2019. Remuneration continues to be structured in a way that attracts, motivates and retains the talented people we need to achieve the Company’s strategic objectives and give them due recognition, whilst driving sustainable performance.
As a Swiss-incorporated Company, we are not required to put forward our remuneration policy for a shareholder vote, but we intend to do so voluntarily at least every three years (or when there are changes). We continue to endeavour to make sure that our disclosure complies fully with UK regulations, except when these conflict with Swiss law.
Policy table – Chief Executive OfficerThe Company currently has a single Executive Director, being the Chief Executive Officer. Therefore, for simplicity, this section refers only to the Chief Executive Officer. This remuneration policy would, however, apply for any new Executive Director role, in the event that one were created during the term of this remuneration policy. In that case, references in this section to the Chief Executive Officer should be read as being to each Executive Director.
Fixed
Base salary Retirement benefits
Purpose and link to strategyTo provide a fixed level of compensation appropriate to the requirements of the role of Chief Executive Officer and to support the attraction and retention of the talent able to deliver the Group’s strategy.
OperationSalary is reviewed annually, with salary changes normally effective on 1 May each year.
The following parameters are considered when reviewing base salary level:
· the Chief Executive Officer’s performance, skills and responsibilities;
· economic conditions and performance trends; · experience of the Chief Executive Officer; · pay increases for other employees; and · external comparisons based on factors such as: the industry
of the business, revenue, market capitalisation, headcount, geographical footprint, stock exchange listing (FTSE) and other European companies.
Malus and clawback provisions do not apply to base salary.
Maximum opportunityWhilst there is no maximum salary level, any increases awarded to the Chief Executive Officer will normally be broadly aligned with the broader employee population.
The salary increase made to the Chief Executive Officer may exceed the average salary increase under certain circumstances at the Remuneration Committee’s discretion. For example, this may include: business and individual performance; material changes to the business; internal promotions; accrual of experience; changes to the role; or other material factors.
Performance metricsIndividual and business performance are key factors when determining any base salary changes.
The annual base salary for the Chief Executive Officer is set out on page 125.
Purpose and link to strategyTo provide competitive, cost-effective post-retirement benefits.
OperationThe Chief Executive Officer participates in a defined benefit pension plan under Swiss law. There is no obligation for employee contributions.
Normal retirement age for the Chief Executive Officer’s plan is 65 years. In case of early retirement, which is possible from the age of 58, the Chief Executive Officer is entitled to receive the amount accrued under the plan as a lump sum.
Malus and clawback provisions do not apply to retirement benefits.
Maximum opportunityThe contributions to the pension plan are calculated as a percentage of annual base salary (excluding any incentive payments or other allowance/benefits provided) based on age brackets as defined by Federal Swiss legislation.
This percentage is currently 15% of base salary and increases to 18% for age above 55.
Performance metricsNone.
126 COCA-COLA HBC DIRECTORS’ REMUNERATION REPORT CONTINUED

Other benefits ESPP (Employee Share Purchase Plan)
Purpose and link to strategyTo provide benefits to the Chief Executive Officer which are consistent with market practice.
OperationBenefit provisions are reviewed by the Remuneration Committee which has the discretion to recommend the introduction of additional benefits where appropriate.
Typical provisions for the Chief Executive Officer include benefits related to relocation such as housing allowance, company car/allowance, cost of living adjustment, trip allowance, partner allowance, exchange rate protection, tax equalisation and tax filing support and advice. For all benefits, the Company will bear any income tax and social security contributions arising from such payments.
Malus and clawback provisions do not apply to benefits.
Maximum opportunityThere is no defined maximum as the cost to the Company of providing such benefits will vary from year to year.
Performance metricsNone.
Purpose and link to strategyThe ESPP is an Employee Share Purchase Plan, encouraging broader share ownership, and is intended to align the interests of employees and the Chief Executive Officer with those of the shareholders.
OperationThis is a voluntary share purchase scheme across many of the Group’s countries. The Chief Executive Officer as a scheme participant has the opportunity to invest from 1% to 15% of his salary and/or MIP payout to purchase the Company’s shares by contributing to the plan on a monthly basis.
The Company matches the Chief Executive Officer’s contributions on a one-to-one basis up to 3% of the employee’s salary and/or MIP payout. Matching contributions are used to purchase shares after one year from the matching. Matching shares are immediately vested.
Dividends received in respect of shares held under the ESPP are used to purchase additional shares and are immediately vested.
The Chief Executive Officer is eligible to participate in the ESPP operated by the Company on the same basis as other employees.
Malus and clawback provisions apply. Further details may be found in the Additional notes to the remuneration policy table section on page 130.
Maximum opportunityMaximum investment is 15% of gross base salary and MIP payout. The Company matches contributions up to 3% of gross base salary and MIP payout. Matching contributions are used to purchase shares after one year from the matching. Matching shares are immediately vested.
Performance metricsThe value is directly linked with the share price performance.
It is therefore not affected by other performance criteria.
Variable pay
MIP (Management Incentive Plan) PSP (Performance Share Plan)
Purpose and link to strategyTo support profitable growth and reward annually for contribution to business performance. The plan aims to promote a high-performance culture with stretching individual and business targets linked to our key strategies.
OperationAnnual cash bonus awarded under the MIP is subject to business and individual performance metrics and is non-pensionable.
The Chief Executive Officer’s individual objectives are regularly reviewed to ensure relevance to business strategy and are set and approved annually by the Chair of the Remuneration Committee and Chairman of the Board of Directors.
Stretching targets for business performance are set annually, based on the business plan of the Group as approved by the Board of Directors.
Performance against these targets and bonus outcomes are assessed by the Remuneration Committee, which may recommend an adjustment to the payout level where it considers the overall performance of the Company or the individual’s contribution warrants a higher or lower outcome.
Malus and clawback provisions apply. Further details may be found in the Additional notes to the remuneration policy table section on page 130.
Purpose and link to strategyTo align the Chief Executive Officer’s interests with the interests of shareholders, and increase the ability of the Group to attract and reward individuals with exceptional skills.
OperationThe Chief Executive Officer is granted conditional awards of shares which vest after three years, subject to the achievement of performance metrics and continued service. Grants take place annually, normally every March.
Performance metrics and the associated targets are reviewed and determined around the beginning of each performance period to ensure that they support the long-term strategies and objectives of the Group and are aligned with shareholders’ interests.
Dividends may be paid on vested shares where the performance metrics are achieved at the end of the three-year period.
Malus and clawback provisions apply. Further details may be found in the Additional notes to the remuneration policy table section on page 130.
1272018 INTEGRATED ANNUAL REPORTSR
CG
FS
SSR
SI

Variable pay continued
MIP (Management Incentive Plan) PSP (Performance Share Plan)
Maximum opportunityThe Chief Executive Officer’s maximum MIP opportunity is set at 130% of annual base salary.
Threshold, target and maximum bonus opportunity levels are as follows:
· Threshold: 5% of base salary · Target: 70% of base salary · Maximum: 130% of base salary · Maximum payout is based on business performance targets
(up to 120% of salary) and individual performance (up to 10% of salary)
Performance metricsThe MIP awards are based on business metrics linked to our business strategy. These may include but are not limited to measures of volume, revenue, profit, cash and operating efficiencies. The weighting of individual performance metrics shall be determined by the Remuneration Committee around the beginning of the MIP performance period.
Details related to the key performance indicators and individual objectives can be found in the Annual Report on Remuneration on page 140.
Deferral of MIP50% of any MIP award is to be deferred into shares which will be made available after a three-year deferral period which commences of the first day on the fiscal year in which the deferred share award is made.
Deferred shares may be subject to malus and clawback (for a period of two years following this incentive award) to the extent deemed appropriate by the Remuneration Committee, in line with best practice.
Maximum opportunityAwards (normally) have a face value up to 330% of base salary. In exceptional circumstances only, the Remuneration Committee has the discretion to grant awards up to 450% of base salary.
Performance metricsVesting of awards is subject to the three-year Group performance metrics based on two equally-weighted measures which have been selected as they are aligned to long-term growth and also measure the efficient use of capital, both of which are aligned to our strategic plan:
Comparable earnings per share (comparable EPS); and the percentage of comparable net profit excluding net finance costs divided by the capital employed (ROIC). Capital employed is calculated as the average of net debt and shareholders’ equity attributable to the owners of the parent through the year.
Following the end of the three-year period, the Remuneration Committee will determine the extent to which performance metrics have been met and, in turn, the level of vesting. Participants may receive vested awards in the form of shares or a cash equivalent.
For both performance metrics, achieving threshold performance results in vesting of 25% of the award and maximum performance results in vesting of 100% of the award.
Performance share awards will lapse if the Remuneration Committee determines that the performance metrics have not been met.
Holding periodAny vested award (net of shares sold to cover tax liability) is subject to a further two-year holding period following the end of the three-year performance period. During this two-year period, these beneficially owned shares are subject to a no sale commitment. Any shares subject to the holding period count towards the shareholding requirement.
AdjustmentsIn the event of an equity restructuring, the Remuneration Committee may make an equitable adjustment to the terms of the performance share award by adjusting the number and kind of shares which have been granted or may be granted and/or making provision for payment of cash in respect of any outstanding performance share award.
Change of controlIn the event of change of control, unvested performance share awards held by participants vest immediately on a pro-rated basis if the Remuneration Committee determines that the performance metrics have been satisfied or would have been likely to be satisfied at the end of the performance period, unless the Remuneration Committee determines that substitute performance share awards may be used in place of the previous awards. For vested shares subject to the additional holding period, the holding period will lapse and the participants are no longer subject to the no sale commitment.
128 COCA-COLA HBC DIRECTORS’ REMUNERATION REPORT CONTINUED

Maximum
Maximumperformance +50%
share price growth
Target
Minimum
16%
12%
23%
57%
10%
8%
14%
34% 1,305
2%
2%
4%
9%
20%
16%
16% 43% 3,207
52%
41% 21%
4,784
6,022
Base pay Cash and non-cash benefits Pension MIP PSP PSP – share price appreciation
Additional notes to the Executive Director’s remuneration policy table
Chief Executive Officer’s remuneration policy illustrationThe graph below provides estimates of the potential reward opportunity for the Chief Executive Officer and the split between the three different elements of remuneration under three different performance scenarios: ‘Minimum’, ‘Target’ and ‘Maximum’. In line with the reporting regulations, a scenario assuming 50% share price growth over the three-year PSP performance period is also shown below. The assumptions used for these charts are set out in the table below (€ 000s).
Minimum performance Fixed remuneration only, i.e. base salary, pension and other benefits (including ESPP participation).
No payout under the annual bonus or PSP.
Target performance Fixed remuneration.
MIP payout of 70% of base salary.
PSP vesting at 181.5% of base salary.
Maximum performance Fixed remuneration.
MIP payout of 130% of base salary.
PSP vesting at 330% of base salary.
Maximum performance + 50% share price growth Fixed remuneration.
MIP payout of 130% of base salary.
PSP vesting at 330% of base salary.
50% assumed share price growth over three-year PSP performance period.
Other than the ‘Maximum scenario + 50% share price growth’, no share price growth or dividend assumptions have been included in the charts above.
Component Minimum (€ 000s) Target (€ 000s) Maximum (€ 000s)
Maximum performance + 50% share price growth (€ 000’s)
Fixed Base salary1 €750 €750 €750 €750 Pension €113 €113 €113 €113 Cash and non-cash benefits2 €442 €458 €471 €471Variable MIP – €525 €975 €975 PSP – €1,361 €2,475 €2,475
PSP – 50% share price appreciation – – – €1,238
Total €1,305 €3,207 €4,784 €6,022
1. Represents the annual base salary as at 7 December 2017.2. ESPP employer contributions may vary depending on the MIP payout provided that the Chief Executive Officer decides to contribute a portion of the MIP towards the ESPP.
The figures provided have been calculated on the basis of the applicable MIP payout and the Chief Executive Officer deciding to contribute 3% to the ESPP.
1292018 INTEGRATED ANNUAL REPORTSR
CG
FS
SSR
SI

ESOP (Employee Stock Option Plan)The ESOP was replaced by the PSP in 2015 and the last grant under the ESOP took place in December 2014. Although the Remuneration Committee does not intend to award under the ESOP going forward, there are still outstanding stock option awards which may be exercised in future years. Awards vest in one-third increments each year for three years and can be exercised for up to 10 years from the date of the award.
Malus and clawback provision for variable pay plansThe MIP, PSP, ESOP and ESPP plans include malus provisions which give the Remuneration Committee and/or the Board discretion to judge that an award should lapse wholly or partly in event of material misstatement of financial results and/or misconduct.
The Remuneration Committee and/or Board also has the discretion to determine that clawback should be applied to awards under the MIP, PSP, ESOP and ESPP plans for the Chief Executive Officer and members of the Operating Committee. Clawback can potentially be applied to payments or vested awards for up to a two-year period following the payment or vesting.
Shareholding guidelinesIn order to strengthen the link with shareholders’ interests, the Chief Executive Officer is required to hold shares in the Company equal in value to 200% of annual base salary. Members of the Operating Committee are required to hold 100% of annual base salary. The required shareholdings are to be achieved within a five-year period starting from the date of the first PSP grant (10 December 2015) or later based on the date of the appointment.
Remuneration arrangements across the GroupThe remuneration approach for the Chief Executive Officer, the members of the Operating Committee and senior management is similar. The Chief Executive Officer’s total remuneration has a significantly higher proportion of variable pay in comparison with the rest of our employees. The Chief Executive Officer’s remuneration will increase or decrease in line with business performance, aligning it with shareholders’ interests.
The structure of the remuneration package for the wider employee population takes into account local market practice and is intended to attract and retain the right talent, be competitive, remunerate employees for promoting a growth mindset while contributing to the Group’s performance.
130 COCA-COLA HBC DIRECTORS’ REMUNERATION REPORT CONTINUED

Policy table – non-Executive DirectorsBase feesPurpose and link to strategy
To provide a fixed level of compensation appropriate to the requirements of the role of non-Executive Director and to attract and retain high-quality non-Executive Directors with the right talent, values and skills necessary to provide oversight and support to management to grow the business, support the Company’s strategic framework and maximise shareholder value.Operation
Non-Executive Directors’ pay is set at a level that will not call into question the objectivity of the Board. When considering market levels, comparable companies typically include those in the FTSE index with similar positioning as the Company, other Swiss companies with similar market caps and/or revenues, and other relevant European listed companies.Maximum opportunity
Fee levels for non-Executive Directors include an annual fixed fee plus additional fees for membership of Board committees when applicable, as summarised below:
· Base non-Executive Director’s fee: €73,500
· Senior Independent Director’s fee: €15,800
· Audit and Risk Committee Chair fee: €28,900
· Audit and Risk Committee member fee: €14,500
· Remuneration, Nomination and Social Responsibility Chair fees: €11,600
· Remuneration, Nomination and Social Responsibility member fees: €5,800
Fee levels are subject to periodic review and approval by the Chairman of the Board and the Chief Executive Officer. Other benefits
Non-Executive Directors do not receive any benefits in cash or in kind. They are not entitled to severance payments in the event of termination of their appointment. They are entitled to reimbursement of all reasonable expenses incurred in the interests of the Group.Variable remuneration
Non-Executive Directors do not receive any form of variable compensation.
1312018 INTEGRATED ANNUAL REPORTSR
CG
FS
SSR
SI

Legacy arrangementsFor the avoidance of doubt, it is noted that the Company will honour any commitments entered into that have previously been disclosed to shareholders.
Policy on recruitment/appointment
Executive Directors
Annual base salary arrangements for the appointment of an Executive Director will be set considering market relevance, skills, experience, internal comparisons and cost. The Remuneration Committee may recommend an appropriate initial annual base salary below relevant market levels. In such situations, the Remuneration Committee may make a recommendation to realign the level of base salary in the forthcoming years. As highlighted above, annual base salary ‘gaps’ may result in higher rates of salary increase in the short term, subject to an individual’s performance. The discretion is retained to offer an annual base salary necessary to meet the individual circumstances of the recruited Executive Director and to enable the hiring of an individual with the necessary skills and expertise.
The maximum level of variable pay that may be offered will follow the rules of the MIP and is capped at 130% of the relevant individual’s annual base salary. The maximum level of equity-related pay that may be offered will follow the PSP rules and is capped at 450% of the relevant individual’s annual base salary. The typical award is not expected to surpass 330% of base salary. Different performance measures may be set initially for the annual bonus taking into consideration the point in the financial year that a new Executive Director joins. The above limits do not include the value of any buyout arrangements.
Benefits will be provided in line with those offered according to the Group’s policy for other employees. If an Executive Director is required to relocate, benefits may be provided as per the Group’s international transfer policy which may include transfer allowance, tax equalisation, tax advice and support, housing, cost of living, schooling, travel and relocation costs.
The Remuneration Committee may consider recommending the buying out of incentive awards that an individual would forfeit by accepting the appointment up to an equivalent value in shares or in cash. In the case of a share award, the Remuneration Committee may approve a grant of shares under the PSP. When deciding on a potential incentive award buyout and in particular the level and value thereof, the Remuneration Committee will be informed of the time and performance pro-rated level of any forfeited award.
It is expected that Executive Directors appointed during the remuneration policy period will be appointed on similar notice provisions to the Chief Executive Officer, allowing for termination of office by either party on six months’ notice.
Non-Executive Directors
It is expected that non-Executive Directors appointed during the remuneration policy period will receive the same basic fee and, as appropriate, committee fee or fees as existing non-Executive Directors and will be entitled to reimbursement of all reasonable expenses incurred in the interests of the Group.
It is expected that non-Executive Directors appointed during the remuneration policy period will be appointed on a one-year term of appointment, in the same manner as existing non-Executive Directors.
The Company does not compensate new non-Executive Directors for any forfeited share awards in previous employment.
Termination payments
The Swiss Ordinance against Excessive Compensation in Listed Companies limits the authority of the Board to determine compensation. Limitations include the prohibition on certain types of severance compensation.
Our governance framework ensures that the Group uses the right channels to support reward decisions. In the case of early termination, the non-Executive Directors would be entitled to their fees accrued as of the date of termination, but are not entitled to any additional compensation. The Chief Executive Officer’s employment contract does not contain any provisions for payments on termination. Notice periods are set for up to six months and non-compete clauses are 12 months, effective in 2018. The notice period anticipates that up to six months’ paid garden leave may be provided. Similarly, up to 12 months of base salary may be paid out in relation to the non-compete period.
In case of future terminations, payments will be made in accordance with the termination policy on page 133.
132 COCA-COLA HBC DIRECTORS’ REMUNERATION REPORT CONTINUED

Pay element
Good leaver (retirement at 55 or later/at least 10 years’ continued service)
Good leaver (injury, disability)
Bad leaver (resignation, dismissal) Death in service
Base salary and other benefits / non-Executive Directors’ fees
Payment in lieu of notice is not permissible. The Company could ask the Chief Executive Officer to be on paid garden leave for up to six months.
ESPP Unvested shares held in the ESPP will vest upon termination.
Unvested shares under the ESPP are forfeited.
Available ESPP shares will be transferred to heirs.
MIP A pro-rated payout as of the date of retirement will be applied.
Deferred shares will continue to vest as normal.
A pro-rated payout as of the date of leaving will be applied.
Deferred shares will continue to vest as normal.
In the event of resignation or dismissal, as per Swiss Law, the Chief Executive Officer is entitled to a pro-rated MIP payout.
Any outstanding deferred shares will lapse.
A pro-rated payout will be applied and will be paid immediately to heirs, based on the latest rolling estimate.
Deferred shares will continue to vest as normal.
PSP/ESOP Unvested performance shares and options are retained and will continue to vest as normal subject to performance conditions as set out in the award agreement.
For vested shares that are subject to the additional holding period, they will continue to be subject to the no-sale commitment until the end of the relevant two-year period.
All unvested options and performance share awards immediately vest to the extent that the Remuneration Committee determines that the performance conditions have been met, or are likely to be met at the end of the three-year performance period.
Any options that vest are exercisable within 12 months from the date of termination.
For vested shares that are subject to the additional holding period, they will continue to be subject to the no-sale commitment until the end of the relevant two-year period.
All unvested options and performance share awards immediately lapse without any compensation.
In the event of resignation, all vested options must be exercised within six months from the date of termination.
Upon dismissal, all vested options must be exercised within 30 days from the date of termination.
For vested shares that are subject to the additional holding period, they will continue to be subject to the no-sale commitment until the end of the relevant two-year period.
All unvested options and performance share awards immediately vest subject to time and performance pro-ration.
Any options that vest are exercisable within 12 months from the date of termination.
For vested shares that are subject to the additional holding period, the no-sale commitment will cease immediately.
Under Swiss law, share awards are considered annual compensation and as such when time pro-rating is required, the year of grant (12 months) and not the vesting period (36 months) for time pro-rating calculations is considered.
Corporate eventsIn the event of an equity restructuring, the Remuneration Committee may make an equitable adjustment to the terms of the performance share award by adjusting the number and kind of shares that have been granted or may be granted and/or making provision for payment of cash in respect of any outstanding performance share award.
In the event of a change of control, unvested performance share awards held by participants vest immediately on a pro-rated basis if the Remuneration Committee determines that the performance condition(s) have been satisfied or would have been likely to be satisfied at the end of the performance period, unless the Remuneration Committee determines that substitute performance share awards may be used in place of the previous awards.
1332018 INTEGRATED ANNUAL REPORTSR
CG
FS
SSR
SI

Service contractsZoran Bogdanovic, the Chief Executive Officer, has a service contract with the Company with a six-month notice period. As noted in the termination payments, the Chief Executive Officer’s employment contract does not include any termination benefits, other than as mandated by Swiss law. The Swiss Code of Obligations requires employers to pay severance when an employment relationship ends with an employee of at least 50 years of age after 20 years or more of service.
The Chief Executive Officer is also entitled to reimbursement of all reasonable expenses incurred in the interests of the Company. In accordance with the Swiss Ordinance against Excessive Compensation in Listed Companies, there are no sign-on policies/provisions for the appointment of the Chief Executive Officer.
The table below provides details of the current service contracts and terms of appointment for the Chief Executive Officer and other Directors.
Name TitleDate originally appointed to the Board of the Company
Date appointed to the Board of the Company
Unexpired term of service contract or appointment as non-Executive Director
Anastassis G. David Chairman and non-Executive Director
27 July 2006 11 June 2018 One year
Zoran Bogdanovic Chief Executive Officer 11 June 2018 11 June 2018 Indefinite, terminable on six months’ notice
Ahmet C. Bozer Non-Executive Director 21 June 2016 11 June 2018 One yearCharlotte J. Boyle Non-Executive Director 20 June 2017 11 June 2018 One yearOlusola (Sola) David-Borha Non-Executive Director 24 June 2015 11 June 2018 One yearWilliam W. (Bill) Douglas III Non-Executive Director 21 June 2016 11 June 2018 One yearReto Francioni Senior Independent
non-Executive Director21 June 2016 11 June 2018 One year
Anastasios I. Leventis Non-Executive Director 25 June 2014 11 June 2018 One yearChristo Leventis Non-Executive Director 25 June 2014 11 June 2018 One yearAlexandra Papalexopoulou Non-Executive Director 24 June 2015 11 June 2018 One yearJosé Octavio Reyes Non-Executive Director 25 June 2014 11 June 2018 One yearRobert Ryan Rudolph Non-Executive Director 21 June 2016 11 June 2018 One yearJohn P. Sechi Non-Executive Director 25 June 2014 11 June 2018 One year
The Chief Executive Officer’s service contract and the terms and conditions of appointment of the non-Executive Directors are open for inspection by the public at the registered office of the Group.
Consideration of employee viewsThe Remuneration Committee does not currently consult specifically with employees on policy for the remuneration of the Chief Executive Officer. Pay movement for the wider employment group is considered when making pay decisions for the Chief Executive Officer.
Consideration of shareholder viewsShareholder views and the achievement of the Group’s overall business strategies have been taken into account in formulating the remuneration policy. Following shareholder feedback before and after the Annual General Meeting, the Remuneration Committee and the Board consult with shareholders and meet with the largest institutional investors to gather feedback on the Company’s remuneration strategy and corporate governance. The Company would be happy to engage with shareholders in the future to discuss the outcomes of the remuneration policy.
In reviewing and determining remuneration, the Remuneration Committee takes into account the following:
· the business strategies and needs of the Company;
· the views of shareholders on Group policies and programmes of remuneration;
· market comparisons and the positioning of the Group’s remuneration relative to other comparable companies;
· input from employees regarding our remuneration programmes;
· the need for similar, performance-related principles for the determination of executive remuneration and the remuneration of other employees; and
· the need for objectivity. Board members, the Chief Executive Officer and Operating Committee members play no part in determining their own remuneration. The Chair of the Remuneration Committee and the Chief Executive Officer are not present when the Remuneration Committee and the Board discuss matters that pertain to their remuneration.
This ensures that the same performance-setting principles are applied for executive remuneration and other employees in the organisation.
134 COCA-COLA HBC DIRECTORS’ REMUNERATION REPORT CONTINUED

Annual Report on Remuneration
IntroductionThis section of the report provides detail on how we have implemented our remuneration policy in 2018 which, in accordance with the UK remuneration reporting regulations, will be subject to an advisory shareholder vote at our 2019 Annual General Meeting.
Activities of the Remuneration Committee during 2018During 2018, the key Remuneration Committee activities were to:
· Review and sign off the 2017 Directors’ Remuneration Report;
· Review the base salary for the Chief Executive Officer;
· Review and approve the 2018 base salaries for the Operating Committee members and general managers;
· Review and approve the 2017 MIP payout for the Chief Executive Officer;
· Review and approve payout levels for the 2017 MIP in relation to Operating Committee members and general managers;
· Set and approve 2018 PSP targets;
· Review award levels for 2018 PSP awards;
· Review of the Company’s Irish pension plans; and
· Review and approve changes to the Executive Director remuneration policy.
Advisors to the Remuneration CommitteeThe Chairman of the Board, the Chief Executive Officer, the Group Human Resources Director, the Group Rewards Director and the General Counsel regularly attend meetings of the Remuneration Committee.
While the Remuneration Committee does not have external advisors, in 2018 it authorised management to work with external consultancy firm Willis Towers Watson, to provide independent advice on ad hoc remuneration issues during the year. These services are considered to have been independent, objective and relevant to the market. Other than employee engagement benchmarking services, Willis Towers Watson does not provide any other services to the Company. The total cost in connection with this work was €40,712. Willis Towers Watson is a member of the Remuneration Consultants Group and provides advice in line with its Code of Business Conduct.
1352018 INTEGRATED ANNUAL REPORTSR
CG
FS
SSR
SI

Non-Executive Directors’ remuneration for the year ended 31 December 2018 and 2017
Financial year Base fee1 (€)
Audit and Risk Committee
(€)
Remuneration Committee
(€)
Nomination Committee
(€)
Social Responsibility
Committee(€)
Senior Independent
Director(€)
Social security contributions2
(€)Total
(€)
Anastassis G. David FY2018 73,500 – – – – – – 73,500 FY2017 70,000 – – – – – – 70,000Ahmet C. Bozer FY2018 73,500 – – – – – – 73,500 FY2017 70,000 – – – – – – 70,000Charlotte J. Boyle FY2018 73,500 – 5,800 5,800 – – – 85,100 FY2017 35,000 – 2,750 2,750 – – – 40,500Antonio D’ Amato FY2018 – – – – – – – – FY2017 35,000 – 2,750 2,750 – – – 40,500Olusola (Sola) David-Borha FY2018 73,500 14,500 – – – – 7,001 95,001 FY2017 70,000 13,800 – – – – 6,584 90,384William W. (Bill) Douglas lll FY2018 73,500 28,900 – – – – – 102,400 FY2017 70,000 27,500 – – – – – 97,500Reto Francioni FY2018 73,500 – 5,800 11,600 – 15,800 8,489 115,189 FY2017 70,000 – 5,500 11,000 15,000 – 7,974 109,474Anastasios I. Leventis FY2018 73,500 – – – 11,600 – – 85,100 FY2017 70,000 – – – 11,000 – – 81,000Christo Leventis FY2018 73,500 – – – – – – 73,500 FY2017 70,000 – – – – – 2,179 72,179Alexandra Papalexopoulou FY2018 73,500 – 11,600 5,800 5,800 – – 96,700 FY2017 70,000 – 11,000 5,500 5,500 – – 92,000José Octavio Reyes FY2018 73,500 – – – 5,800 – 4,434 83,734 FY2017 70,000 – – – 5,500 – 4,560 80,060Robert Ryan Rudolph FY2018 73,500 – – – – – 5,848 79,348 FY2017 70,000 – – – – – 5,499 75,499John P. Sechi FY2018 73,500 14,500 – – – – – 88,000 FY2017 70,000 13,800 – – – – – 83,800
1. Non-Executive Director fees for 2018 are in line with the fees that were revised in 2018.2. Social security employer contributions as required by Swiss legislation.
Non-Executive Directors do not participate in any of the Group’s incentive plans, nor do they receive any retirement or other taxable benefits.
Fee levels were reviewed in 2018 to ensure that they remained competitive in relation to comparable companies and an adjustment of 5% was made. Before this, Non-Executive Director fees were last adjusted in 2016.
136 COCA-COLA HBC DIRECTORS’ REMUNERATION REPORT CONTINUED

Single figure tableSingle total figure of remuneration for the Chief Executive Officer for the years ended 31 December 2018 and 2017
Base pay1
€ 000s
Cash and non-cash benefits2
€ 000s Annual bonus3
€ 000s
Employee Share Purchase Plan
€ 000s Long-term incentives4
€ 000s
Retirement benefits € 000s
Total single figure € 000s
2018 2017 2018 2017 2018 2017 2018 2017 2018 2017 2018 2017 2018 2017
Zoran Bogdanovic 750 58 420 35 465 47 32 2 1,649 262 124 6 3,440 410Dimitris Lois5 – 852 – 498 – 643 – 40 – 13,227 – 118 – 15,378
1. ‘Base pay’ includes the monthly instalments linked with the base salary for 2018.2. ‘Cash and non-cash benefits’ include the value of all benefits paid during 2018. These are outlined in the ‘Cash and non-cash benefits’ section below and include any gross-ups
for the tax benefit.3. Annual bonus for 2018 includes the MIP payout, receivable early in 2019 for the 2018 performance year, including the amount deferred in shares.4. ‘Long-Term incentives’ (for Zoran Bogdanovic in 2018) reflect the 2015 and 2016 awards made under the Performance Share Plan and the dividend equivalent shares paid on PSP
shares that will vest in early 2019. The number of shares due to vest to the Chief Executive Officer for the 2015 and 2016 awards are 27,555 and 31,813, respectively. The Chief Executive Officer will also get 3,492 shares representing the dividend equivalents for the awarded shares for 2016, 2017 and 2018. The value reflects the number of shares multiplied by the average market price over the last three months of the financial year. The figure will be restated in next year’s report based on the share price at vesting. €146,216 of the €722,942 total vested value of the 2015 award was due to increase in share price since date of grant. €257,887 of the €834,656 total vested value of the 2016 award was due to increase in share price since date of grant.
5. Dimitris Lois, the Company’s Chief Executive Officer since 2011, sadly passed away in October 2017. The full details of remuneration arrangements, which were in line with our policy provisions for death in service, were disclosed in last year’s report.
Fixed pay for 2018
Base salary
Following the appointment of Zoran Bogdanovic to Chief Executive Officer, the Remuneration Committee recommended and the Board approved a base salary of €750,000, effective 7 December 2017. When determining the base salary level, the Remuneration Committee considered alignment and competitiveness versus peers in the FTSE, internal relativities and the experience of the individual. Given the timing of his appointment at the end of 2017, the Remuneration Committee did not make a salary adjustment in 2018.
Retirement benefits
Zoran Bogdanovic is to receive an annual retirement benefit of 15% of base salary, aligning to the retirement benefit provided under Swiss law and based on the age brackets defined by federal Swiss legislation. During the year, €124,451 of retirement benefit was received.
Cash and non-cash benefits
Zoran Bogdanovic received additional benefits during 2018. These included cost of living and foreign exchange rate adjustment (€221,347), private medical insurance (€7,406), partner allowance (€1,000), home trip allowance (€2,335), tax support (€4,497), company car allowance (€17,393), housing allowance (€105,952), Company matching contribution related to the ESPP (€32,075 – reflecting the maximum match of 3% under the plan), tax equalisation (€-45,739), and the value of social security contributions (€105,516).
Variable pay for 2018
MIP performance outcomes – 2018
As outlined above, the annual bonus award in respect of the 2018 financial year for the Chief Executive Officer was €465,000, 62% of base salary. In accordance with the terms of the MIP, 50% of this will be paid out in March 2019 and the remaining 50% will be deferred into shares for a period of three years. This bonus reflects the financial and individual performance achieved during the period 1 January 2018 to 31 December 2018. The financial metrics, the associated targets and level of achievement are set out on page 138.
1372018 INTEGRATED ANNUAL REPORTSR
CG
FS
SSR
SI

Employee Stock Option Plan (ESOP) outcomes – 2018The Remuneration Committee will no longer make awards under this plan. All stock options are fully vested.
Performance Share Plan (PSP) awards – 2018Since the discontinuation of the ESOP in late 2015, the PSP is now the primary long-term incentive vehicle. In March 2018, the Chief Executive Officer was granted a performance share award over 86,404 shares under the PSP, representing 330% of base salary at date of grant. The award is subject to a three-year performance period, aligned to the Company’s financial year, with performance measured to the end of financial year 2020, and vesting anticipated in March 2021.
Achievements against the Chief Executive Officer’s individual performance metrics and the respective payout is outlined below.
Objectives Assessment
Description Measure of successWeighting
% Actual results
Payout % of CEO’s annual base salary
(maximum 10%)
Revenue Grow revenue faster than volume and transactions faster than volume
20% Revenue growth (NARTD FX neutral) +6.6% > Transactions growth +4.9% > Volume growth +4.1%
2.0%
Volume Grow Volume in all three segments, Established, Developing and Emerging
20% We grew volume in all three segments: Established markets +1.0%, Developing markets +8.8%, Emerging markets +4.3%
2.0%
Engagement Maintain the High Performing Norm Status as per Willis Tower Watson
20% 2018 score: 88 (-1 vs. 2017 and – 1 vs. High Performing Norm)
1.5%
EBIT margin Further improve comparable EBIT margin compared to 2017 by 80 basis points or more
20% EBIT margin improved by 70 basis points 1.5%
Sustainability Maintain Beverage Industry Leadership on DJSI either World or Europe
20% Coca-Cola HBC ranked third on a World level. This makes it six consecutive years of being in the top three globally in our industry.
1.0%
Total 8.0%
Achievement against the Group’s business metrics and the respective payout is outlined below.
Total financial performance measures payout
Threshold Target Maximum Actual
Volume (m unit cases)
Comparable EBIT (€ m)
OpEx % of NSR
NSR (€ m)
Total Working Capital Days Qualifier to Volume performance measure
17.7%
9.5%
13.3%
13.5%
Achieved
54.0%
1,999
644
26.7
6,175
4.73
2,173
700
25.0 24.8
6,712
4.38
2,192
Payout (% of base salary)Threshold (0%) Maximum (30%)Target (15%)
2,281
681 756
24.1
6,657 7,048
1.77 3.50
138 COCA-COLA HBC DIRECTORS’ REMUNERATION REPORT CONTINUED
The following table sets out the details of the performance share award made to the Chief Executive Officer under the PSP for 2018.
Type of award made Performance share award over 86,404 shares, receivable for nil costShare price at date of grant €28,64 (£25.28)Date of grant 14 March 2018Performance period 1 January 2018 to 31 December 2020Face value of the award(The maximum number of shares that would vest if all performance measures and targets are met, multiplied by the share price at the date of grant)
€2,475,000
Face value of the award as a % of annual base salary 330%Percentage that would be distributed if threshold performance was achieved in both PSP key performance indicators
25% of maximum award
Percentage that would be distributed if threshold performance was achieved only in one PSP key performance indicator
12.5% of maximum award
Similar to the award made in March 2017, the 2018 award was subject to comparable earnings per share (EPS) and return on invested capital (ROIC), as outlined below.
Threshold Maximum
Measure Description Weighting TargetVesting
(% of max) TargetVesting (%
of max)
Comparable EPS Calculated by dividing the comparable net profit attributable to the owners of the parent by the weighted average number of outstanding shares during the period.
50% 1.51 25% 1.82 100%
Return on invested capital (ROIC)
ROIC is the percentage return that a company makes over its invested capital. More specifically, we define ROIC as the percentage of comparable net profit excluding net finance costs divided by the capital employed. Capital employed is calculated as the average of net debt and shareholders’ equity attributable to the owners of the parent through the year.
50% 13.7% 25% 16.4% 100%
The vesting schedule for PSP performance conditions is not a straight line between the threshold and maximum performance levels. The Remuneration Committee considers that it is appropriate to place greater emphasis on achieving the target performance level than the outperformance of this level.
1392018 INTEGRATED ANNUAL REPORTSR
CG
FS
SSR
SI

Performance Share Plan (PSP) outcomes – 2018The table below summarises performance against the applicable targets for PSP awards made in 2015 and 2016, which are due to vest in early 2019.
Threshold Maximum
Actual to the year ending 2018
Total (% of max) Measure Weighting Target
Vesting (% of max) Three-year target
Vesting (% of max) Achievement
Vesting (% of max)
2015 award* EPS 50% 1.08 25% 1.31 100% 1.31 100%100%
ROIC 50% 10.1% 25% 12.1% 100% 13.7% 100%2016 award EPS 50% 1.08 25% 1.31 100% 1.31 100%
100% ROIC 50% 10.1% 25% 12.1% 100% 13.7% 100%
* The 2015 award was made in December 2015 and as such the performance period commenced on 1 January 2016, and hence the performance targets are the same as the 2016 award.
Dilution limitUsage of shares under all share plans and executive share plans adhere to the dilution limits set by the Investment Association Principles of Remuneration (10% for all share plans and 5% for all executive share plans, in any 10-year period).
Implementation of policy in 2019For 2019, we will continue to apply our approved remuneration policy outlined on pages 126 to 128 as described above.
Base salary and feesThe Chief Executive Officer’s base salary will be reviewed in March 2019 at the same time as that of the Operating Committee members and the general managers. Any base salary increase will be effective 1 May 2019, and is anticipated to be broadly in line with the increase provided to other employees.
The fee levels for the Chairman and other non-Executive Directors were last reviewed in 2018, as outlined on page 136. Fee levels are not expected to be reviewed in 2019.
Management Incentive Plan (MIP)The annual bonus award levels for 2019 are expected to be in line with those for 2018. 50% of any 2018 award will be awarded as deferred bonus shares which will vest three years from their date of grant. The performance measures have been set by the Remuneration Committee to align to our KPIs and are summarised below.
Performance measure
Weighting at maximum opportunity levels (% of base salary)
Business measures 120%Gross profit margin. Incentivises profitability, measuring percentage remaining after excluding cost of goods from sales. 24%Net sales revenue (NSR). Incentivises the Group’s revenue growth objectives. 36%Comparable earnings before interest and tax (comparable EBIT). Defined as comparable operating profit. 36%Operating expenditures (OpEx) excluding DME as a percentage of NSR. This key performance indicator, which excludes direct marketing expenses (DME), incentivises effective cost management. 24%Individual measures 10%
The Remuneration Committee is unable to provide the 2019 bonus award performance targets on a forward-looking basis as they are deemed commercially sensitive. However, the targets will be disclosed in next year’s remuneration report once the actual performance against these targets has been realised.
140 COCA-COLA HBC DIRECTORS’ REMUNERATION REPORT CONTINUED

Performance Share Plan (PSP)The levels of PSP awards for 2019 are anticipated to be in line with those awarded in 2018. The performance measures will be consistent with those detailed for the 2018 award outlined in this report and these are summarised below. Threshold Maximum
Measure Description Weighting TargetVesting
(% of max) TargetVesting
(% of max)
Comparable EPS Calculated by dividing the comparable net profit attributable to the owners of the parent by the weighted average number of outstanding shares during the period.
50% 1.62 25% 1.80 100%
Return on invested capital (ROIC)
ROIC is the percentage return that a company makes over its invested capital. More specifically, we define ROIC as the percentage of comparable net profit excluding net finance costs divided by the capital employed. Capital employed is calculated as the average of net debt and shareholders’ equity attributable to the owners of the parent through the year.
50% 13.8% 25% 15.8% 100%
The Remuneration Committee expects to recommend an award of 330% of base salary to the Chief Executive Officer in March 2019, with performance running to the end of December 2021 and vesting occurring in March 2022. These vested shares will then be subject to a further two-year holding period, whereby the Chief Executive Officer agrees to a no sale commitment during this time.
Changes to Chief Executive Officer and employee payThe table below sets out the percentage change in base salary, taxable benefits and annual bonus for the Chief Executive Officer and the average pay for Swiss-based employees. We have chosen to make a comparison with employees in Switzerland as this is the market in which our Chief Executive Officer is based. MIP payouts for the Swiss workforce are primarily based on Swiss business unit results.
Annual base salary Benefits Annual bonus
Chief Executive Officer % change from 2017 to 2018 -17.6% -21.4% -32.6%Average employee % change for the Swiss workforce from 2017 to 2018 3.1% -0.3% 39.6%
The decrease in annual base salary, benefits and annual bonus for the Chief Executive Officer is primarily driven by the appointment of Zoran Bogdanovic who had a lower base salary than the former Chief Executive Officer and lower achievement of the 2018 MIP.
Chief Executive Officer pay and performance comparisonThe graph on page 142 shows the total shareholder return (TSR) of the Company compared with the FTSE 100 index over a 10-year period to 31 December 2018. The Remuneration Committee believes that the FTSE 100 Index is the most appropriate index to compare historic performance due to the size of the Company and our listing location.
1412018 INTEGRATED ANNUAL REPORTSR
CG
FS
SSR
SI

Total shareholder return versus FTSE 100
50
100
150
200
250
300
350
Dec 09Dec 08 Dec 10 Dec 11 Dec 12 Dec 13 Dec 14 Dec 15 Dec 16 Dec 17 Dec 18
FTSE 100 CCH 2009 2010 2011 2012 2013 2014 2015 2016 2017 2018
Doros
Constantinou Doros
Constantinou Doros
ConstantinouDimitris
Lois Dimitris
Lois Dimitris
Lois Dimitris
Lois Dimitris
Lois Dimitris
Lois Dimitris
LoisZoran
Bogdanovic Zoran
Bogdanovic
Total remuneration – single figure (€ 000s) 2,887 3,752 4,708 711 1,524 1,928 1,918 3,012 2,923 15,378 410 3,440MIP (% of maximum) – 65% 9% 24% 68% 49% 45% 75% 55% 53% 5% 48%PSP (% of maximum) – – – – – – – – – 90% – 100%
On 4 July 2011, Doros Constantinou retired from service, and Dimitris Lois succeeded him. The amounts for 2011 include the remuneration of Doros Constantinou up to the retirement date and the remuneration of Dimitris Lois for the remainder of the year. For 2011, the remuneration of Doros Constantinou includes termination benefits due to retirement.
Dimitris Lois sadly passed away on 2 October 2017. The 2017 base salary values above reflect the period 1 January 2017 to 2 October 2017. The total remuneration value for Zoran Bogdanovic reflects the period from his appointment as Chief Executive Officer to the end of the financial year, 7 December 2017 to 31 December 2017.
As the Company listed on the London Stock Exchange in April 2013, the amounts included in respect of the period before that date relate to the remuneration the previous Chief Executive Officers received in their capacity as Chief Executive Officer of Coca-Cola Hellenic Bottling Company S.A.
Relative importance of spend on pay (€m)The graphic below presents the year-on-year change in total expenditure for all employees across the Group and distributions made to shareholders in the form of dividend share buy-backs and/or capital returns.
993.2
992.3
200.6
162.0
Total staff costs Distribution to shareholders
2018
2017
Compared to the prior year, the total staff costs have remained broadly flat, while dividends distributed to shareholders have increased by 24%.
142 COCA-COLA HBC DIRECTORS’ REMUNERATION REPORT CONTINUED

Shareholder voting outcomesThe table below sets out the result of the vote on the remuneration-related resolutions at the Annual General Meeting held in June 2018.
Resolution Votes for Votes against Abstentions Total votes castVoting rights represented
Advisory vote on the UK Remuneration Report 265,082,348 2,685,004 130,651 267,898,003 72.77% 98.95% 1.00% 0.05% Advisory vote on the Swiss Remuneration Report 265,053,923 2,713,904 130,176 267,898,003 72.77% 98.94% 1.01% 0.05% Advisory vote on the remuneration policy 262,992,878 4,775,024 130,101 267,898,003 72.77% 98.17% 1.78% 0.05% Approval of the maximum aggregate amount of remuneration for the Board until the next Annual General Meeting
266,170,268 1,652,689 75,046 267,822,957 72.77%
99.38% 0.62% n.a. Approval of the maximum aggregate amount of remuneration for the Operating Committee for the next financial year
263,904,469 3,471,741 521,793 267,376,210 72.77%
98.70% 1.30% n.a.
The Remuneration Committee was pleased that shareholders supported our remuneration-related resolutions so strongly. We value our ongoing dialogue with shareholders and welcome any views on this report.
Payments to past Directors and payment for loss of officeThere were no payments made to past Directors of the Group or loss of office payments made during the year.
Payments to appointed DirectorsThere were no payments made to appointed Directors during the year.
Outside appointments for the Chief Executive OfficerZoran Bogdanovic does not hold any appointments outside the Company.
Total Directors’ and Operating Committee members’ remunerationThe table below outlines the aggregated total remuneration figures for Directors and Operating Committee members in the year.
2018
(€ million)2017
(€ million)
Total remuneration paid to or accrued for Directors, the Operating Committee and the Chief Executive Officer 18.8 27.1Salaries and other short-term benefits 11.7 13.8Amount accrued for stock option and performance share awards 6.3 12.6Pension and post-employment benefits for Directors, the Operating Committee and the Chief Executive Officer 0.8 0.7
Credits and loans granted to governing bodiesIn 2018, no credits or loans were granted to active or former members of the Company’s Board, members of the Operating Committee or to any related persons.
1432018 INTEGRATED ANNUAL REPORTSR
CG
FS
SSR
SI

Share ownershipThe table below summarises the total shareholding as at 31 December 2018, including any outstanding shares awarded through our incentive plans, for the Chief Executive Officer and other Directors. There have been no changes in the interests of any Directors in shares in the period to 14 March 2019.
With performance measures Without performance measures
PSP ESOP ESPP
NameShare
interests
Performance shares
granted in 2018
Unvested and subject to
performance conditions Vested
Number of stock options
outstandingFully
vested
Vesting at the end of 2019
Number of outstanding shares
held1 as at 31 December 2018
Current shareholding as % of base
salary1
Shareholding guideline
met1
Zoran Bogdanovic2 Yes 86,404 171,245 – 210,000 210,000 – 22,819 41% No Anastassis G. David3 – – – – – – – – –Ahmet C. Bozer – – – – – – – – –Charlotte J. Boyle4 – – – – – – – – –Olusola (Sola) David-Borha – – – – – – – – –William W. (Bill) Douglas III5 – – – – – – – – –Reto Francioni – – – – – – – – –Anastasios I. Leventis6 – – – – – – – – –Christo Leventis7 – – – – – – – – –Alexandra Papalexopoulou – – – – – – – – –José Octavio Reyes – – – – – – – – –Robert Ryan Rudolph – – – – – – – – –John P. Sechi – – – – – – – – –
1. The shareholding requirement was introduced from the date of the 2015 PSP award, 10 December 2015. The Chief Executive Officer has a period of five years from his appointment to December 2022 to build up a 200% of base salary shareholding.
2. During 2018, Zoran Bogdanovic exercised 26,750 options under the ESOP due to upcoming expiration.3. Anastassis David is a beneficiary of:
(a) a private discretionary trust for the primary benefit of present and future members of the family of the late Anastasios George Leventis, of which Truad Verwaltungs AG is the Trustee, whereby he has an indirect interest with respect to the 85,355,019 shares held by Kar-Tess Holding S.A.(b) a further private discretionary trust for the primary benefit of present and future members of the family of the late Anastasios George Leventis, of which Selene Treuhand AG is the Trustee, whereby he has an indirect interest with respect to 823,008 shares held by Selene Treuhand AG.
4. Charlotte J. Boyle owns 1,017 Company shares.5. William W. (Bill) Douglas III owns 10,000 Company shares.6. Anastasios I. Leventis is a beneficiary of:
(a) a private discretionary trust for the primary benefit of present and future members of the family of the late Anastasios George Leventis, of which Truad Verwaltungs AG is the Trustee, whereby he has an indirect interest with respect to the 85,355,019 shares held by Kar-Tess Holding S.A.(b) a further private discretionary trust for the primary benefit of present and future members of the family of the late Anastasios George Leventis, of which Selene Treuhand AG is the Trustee, whereby he has an indirect interest with respect to 286,879 shares held by Selene Treuhand AG.(c) a further private discretionary trust for the primary benefit of present and future members of the family of the late Christodoulos Papaneokleus Leventis, of which Mervail Company (PTC) Limited is the Trustee, whereby he has an indirect interest with respect to 623,664 shares held by Carlcan Holding Limited.
7. Christo Leventis is a beneficiary of:(a) a private discretionary trust for the primary benefit of present and future members of the family of the late Anastasios George Leventis, of which Truad Verwaltungs AG is the Trustee, whereby he has an indirect interest with respect to the 85,355,019 shares held by Kar-Tess Holding S.A.(b) a further private discretionary trust for the primary benefit of present and future members of the family of the late Anastasios George Leventis, of which Selene Treuhand AG is the Trustee, whereby he has an indirect interest with respect to 458,545 shares held by Selene Treuhand AG.(c) a further private discretionary trust for the primary benefit of present and future members of the family of the late Christodoulos Papaneokleus Leventis, of which Mervail Company (PTC) Limited is the trustee, whereby he has an indirect interest with respect to 757,307 shares held by Carlcan Holding Limited.
Approval of the Directors’ Remuneration ReportThe Directors’ Remuneration Report set out on pages 122 to 144 was approved by the Board of Directors on 14 March 2019 and signed on its behalf by Alexandra Papalexopoulou, Chair of the Remuneration Committee.
ALEXANDRA PAPALEXOPOULOUCHAIR OF THE REMUNERATION COMMITTEE
14 March 2019
144 COCA-COLA HBC DIRECTORS’ REMUNERATION REPORT CONTINUED

Statement of Directors’ ResponsibilitiesThe Directors are responsible for preparing the Annual Report, including the consolidated Financial Statements, and the Corporate Governance Report including the Remuneration Report and the Strategic Report, in accordance with applicable law and regulations.
The Directors, whose names and functions are set out on pages 90-95, confirm to the best of their knowledge that:
(a) The Annual Report, taken as a whole, is fair, balanced and understandable, and provides the information necessary for shareholders to assess the Group’s position and performance, business model and strategy.
(b) The consolidated Financial Statements, which have been prepared in accordance with International Financial Reporting Standards, as issued by the IASB, give a true and fair view of the assets, liabilities, financial position and profit or loss of the Company and the undertakings included in the consolidation of the Group taken as a whole.
(c) The Annual Report includes a fair review of the development and performance of the business and the position of the Company and the undertakings included in the consolidated Coca-Cola HBC Group taken as a whole, together with a description of the principal risks and uncertainties that they face.
The activities of the Group, together with the factors likely to affect its future development, performance, financial position, cash flows, liquidity position and borrowing facilities are described in the Strategic Report (pages 3 to 85). In addition, Notes 23 ‘Financial risk management and financial instruments’, 24 ‘Net debt’, 25 ‘Equity’ include: the Company’s objectives, policies and processes for managing its capital; its financial risk management objectives; details of its financial instruments and hedging activities; and its exposures to credit risk and liquidity risk. The Group has considerable financial resources, together with long-term contracts with a number of customers and suppliers across different countries. The Directors have also assessed the principal risks and the other matters discussed in connection with the Viability Statement on page 79. The Directors considered it appropriate to adopt the going concern basis of accounting in preparing the annual Financial Statements and have not identified any material uncertainties to the Group’s ability to continue to do so over a period of at least 12 months from the date of approval of these financial statements.
Disclosure of information required under Listing Rule 9.8.4RFor the purposes of Listing Rule 9.8.4C, the information required to be disclosed by premium listed companies in the United Kingdom is as follows:Listing Rule Information to be included Reference in report
9.8.4(1) Interest capitalised by the Group and an indication of the amount and treatment of any associated tax relief Not applicable9.8.4(2) Details of any unaudited financial information required by LR 9.2.18 Not applicable9.8.4(4) Details of any long-term incentive scheme described in LR 9.4.3 Not applicable9.8.4(5) Details of any arrangement under which a Director has waived any emoluments Not applicable9.8.4(6) Details of any arrangement under which a Director has agreed to waive future emoluments Not applicable9.8.4(7) Details of any allotments of shares by the Company for cash not previously authorised by shareholders Not applicable9.8.4(8) Details of any allotments of shares for cash by a major subsidiary of the Company Not applicable9.8.4(9) Details of the participation by the Company in any placing made by its parent company Not applicable9.8.4(10) Details of any contracts of significance involving a Director Not applicable9.8.4(11) Details of any contract for the provision of services to the Company by a controlling shareholder Not applicable9.8.4(12) Details of any arrangement under which a shareholder has waived or agreed to waive any dividends Not applicable9.8.4(13) Details of any arrangement under which a shareholder has agreed to waive future dividends Not applicable9.8.4(14) Agreements with a controlling shareholder Not applicable
By order of the Board
ANASTASSIS G. DAVIDCHAIRMAN OF THE BOARD
15 March 2019
1452018 INTEGRATED ANNUAL REPORTSR
CG
FS
SSR
SI
STATEMENT OF DIRECTORS’ RESPONSIBILITIES

Contents – Financial Statements148 Independent Auditor’s Report Consolidated Financial Statements153 Consolidated Income Statement154 Consolidated Statement of Comprehensive Income155 Consolidated Balance Sheet156 Consolidated Statement of Changes in Equity158 Consolidated Cash Flow Statement Notes to the Consolidated Financial Statements Basis of reporting159 1. Description of business159 2. Basis of preparation and consolidation160 3. Foreign currency and translation160 4. Accounting pronouncements163 5. Critical accounting estimates and judgements Results for the year163 6. Segmental analysis166 7. Net sales revenue167 8. Operating expenses168 9. Finance costs, net169 10. Taxation172 11. Earnings per share172 12. Components of other comprehensive income Operating assets and liabilities173 13. Intangible assets176 14. Property, plant and equipment179 15. Interests in other entities183 16. Inventories183 17. Trade, other receivables and assets186 18. Assets classified as held for sale186 19. Trade and other payables187 20. Provisions and employee benefits193 21. Offsetting financial assets and financial liabilities194 22. Business combinations Risk management and capital structure195 23. Financial risk management and financial instruments208 24. Net debt212 25. Equity Other financial information214 26. Related party transactions217 27. Share-based payments219 28. Contingencies220 29. Commitments220 30. Post balance sheet events
Contents – Swiss Statutory Reporting221 Report of the statutory auditor on Coca-Cola HBC AG’s
consolidated financial statements227 Report of the statutory auditor on Coca-Cola HBC AG’s
financial statements230 Coca-Cola HBC AG’s financial statements241 Report of the statutory auditor on the Statutory
Remuneration Report 242 Statutory Remuneration Report
COCA-COLA HBC146

FINANCIAL STATEMENTS
147

Independent auditor’s report to Coca-Cola HBC AG
Report on the audit of the consolidated financial statements
OpinionIn our opinion, Coca-Cola HBC AG’s (‘Coca-Cola HBC’ or the ‘Group’) consolidated financial statements (the ‘financial statements‘):
· give a true and fair view of the state of the Group’s affairs as at 31 December 2018 and of its profit and cash flows for the year then ended; and
· have been properly prepared in accordance with International Financial Reporting Standards (‘IFRSs’) as issued by the International Accounting Standards Board (‘IASB’).
We have audited the financial statements, included within the 2018 Integrated Annual Report (the ‘Annual Report’), which comprise: the consolidated balance sheet as at 31 December 2018; the consolidated income statement and statement of comprehensive income, the consolidated cash flow statement, and the consolidated statement of changes in equity for the year then ended; and the notes to the financial statements, which include a description of the significant accounting policies.
Our opinion is consistent with our reporting to the Audit & Risk Committee.
Basis for opinionWe conducted our audit in accordance with International Standards on Auditing (‘ISAs’). Our responsibilities under ISAs are further described in the Auditor’s responsibilities for the audit of the financial statements section of our report. We believe that the audit evidence we have obtained is sufficient and appropriate to provide a basis for our opinion.
Independence
We remained independent of the Group in accordance with the ethical requirements that are relevant to our audit of the financial statements, which include the International Ethics Standards Board for Accountants’ Code of Ethics for Professional Accountants (‘IESBA Code’). We have fulfilled our other ethical responsibilities in accordance with the IESBA Code and other applicable laws and regulations.
Our audit approach
Overview · Overall group materiality: €30.5 million (2017: €28.2 million), based on 5% of profit before tax.
· We audited the complete financial information of the Company and of subsidiary undertakings in 16 countries.
· Taken together, the undertakings of which an audit of their complete financial information was performed accounted for 87% of consolidated net sales revenue, 94% of consolidated profit before tax and 90% of consolidated total assets of the Group.
· We also conducted specified audit procedures and analytical review procedures for other Group undertakings and functions.
· Goodwill and indefinite-lived intangible assets impairment assessment.
· Uncertain tax positions.
· Provisions and contingent liabilities.
The scope of our audit
As part of designing our audit, we determined materiality and assessed the risks of material misstatement in the financial statements.
Capability of the audit in detecting irregularities, including fraud
Based on our understanding of the Group and industry in which it operates, we considered the extent to which non-compliance with applicable laws and regulations might have a material effect on the financial statements, including, but not limited to, the Listing Rules of the Financial Conduct Authority (‘FCA’), tax laws and regulations applicable to Coca-Cola HBC and its subsidiaries and regulations relating to unethical and prohibited business practices. We evaluated management’s incentives and opportunities for fraudulent manipulation of the financial statements (including the risk of override of controls), and where management made subjective judgements in respect of significant accounting estimates that involved making assumptions and considering future events that are inherently uncertain. The group engagement team shared this risk assessment with the component auditors so that they could include appropriate audit procedures in response to such risks in their work. Audit procedures performed by the group engagement team and/or component auditors included:
· Discussions with management, internal audit, internal legal counsel and the Group’s legal advisors, where relevant, including consideration of known or suspected instances of non-compliance with laws and regulation and fraud;
· Evaluation and testing of the operating effectiveness of management’s controls designed to prevent and detect irregularities;
Audit scope
Key audit matters
Materiality
148 COCA-COLA HBC INDEPENDENT AUDITOR’S REPORT

· Assessment of matters reported on the Group’s whistleblowing helpline and the results of management’s investigation of such matters;
· Challenging assumptions and judgements made by management in their significant accounting estimates, in particular in relation to impairment of goodwill and indefinite-lived intangible assets and uncertain tax positions (see related key audit matters below);
· Identifying and testing journal entries, in particular any journal entries posted with unusual account combinations or posted by senior management.
There are inherent limitations in the audit procedures described above and the further non-compliance with laws and regulations is removed from the events and transactions reflected in the financial statements, the less likely we would become aware of it. In addition, the risk of not detecting a material misstatement due to fraud is higher than the risk of not detecting one resulting from error, as fraud may involve deliberate concealment by, for example, forgery or intentional misrepresentations, or through collusion. Other than the key audit matters expressed below, we did not identify any key audit matters relating to irregularities, including fraud.
Key audit matters
Key audit matters are those matters that, in the auditor’s professional judgement, were of most significance in the audit of the financial statements of the current year and include the most significant assessed risks of material misstatement (whether or not due to fraud) identified by the auditors, including those which had the greatest effect on: the overall audit strategy; the allocation of resources in the audit; and directing the efforts of the engagement team. These matters, and any comments we make on the results of our procedures thereon, were addressed in the context of our audit of the financial statements as a whole, and in forming our opinion thereon, and we do not provide a separate opinion on these matters. This is not a complete list of all risks identified by our audit.
Key audit matter How our audit addressed the key audit matterGoodwill and indefinite-lived intangible assets impairment assessment
Refer to Note 13 for intangible assets including goodwill.
Goodwill and indefinite-lived intangible assets as at 31 December 2018 amount to €1,622.3 million and €193.8 million, respectively.
The above noted amounts have been allocated to individual cash-generating units (‘CGUs’), which require the performance of an impairment assessment at least annually. The impairment assessment involves the determination of the recoverable amount of the CGU, being the higher of the value-in-use and the fair value less costs to dispose.
This area was a key matter for our audit due to the size of goodwill and indefinite-lived intangible assets and because the determination of whether elements of goodwill and of indefinite-lived intangible assets are impaired involves complex and subjective estimates and judgements by management about the future results of the CGUs. These estimates and judgements include assumptions surrounding revenue growth rates, direct costs, foreign exchange rates and discount rates.
Furthermore, macroeconomic volatility, competitor activity and regulatory/fiscal developments can adversely affect each CGU and potentially the carrying amount of goodwill and indefinite-lived intangible assets.
No impairment charge was recorded in 2018. Goodwill and franchise agreements held by the Nigeria CGU have been determined by management to remain sensitive to changes in the key drivers of cash flow forecasts given the continuing macroeconomic volatility in Nigeria.
We evaluated the appropriateness of management’s identification of the Group’s CGUs and the process by which management prepared the CGUs’ value-in-use calculations which we found to be satisfactory for the purposes of our audit. We tested the mathematical accuracy of the CGUs’ value-in-use calculations and compared them to the latest budget approved by the Directors and assessed the quality of the budgeting process by comparing the prior year budget with actual data.
With the support of our valuation specialists, we challenged management’s analysis around the key drivers of cash flow forecasts including selling price increases, short-term and long-term volume growth and the level of direct costs by comparing them with either the Group’s historical information or market data, as appropriate. We also evaluated the appropriateness of other key assumptions including discount, perpetuity growth and foreign exchange rates and we found the assumptions to be consistent and in line with our expectations.
We also performed sensitivity analyses on the key drivers of cash flow forecasts for the CGUs with significant balances of goodwill and indefinite-lived intangible assets as well as for CGUs which remain sensitive to changes in the key drivers, including the goodwill and franchise agreements held by the Nigeria CGU.
We assessed the appropriateness and completeness of the related disclosures in Note 13, and consider them to be reasonable. As a result of our work, we found that the determination by management that no impairment was required for goodwill and indefinite-lived intangible assets was supported by assumptions within reasonable ranges.
Uncertain tax positions
Refer to Note 10 for taxation and Note 28 for contingencies.
The Group operates in a large number of different tax jurisdictions and is subject to periodic tax audits by local tax authorities, in the normal course of business, on a range of tax matters in relation to corporate tax, transfer pricing and indirect taxes. As at 31 December 2018, the Group has current tax liabilities of €135.6 million, which include €98.5 million of provisions for tax uncertainties.
Where the amount of tax payable is uncertain, the Group establishes provisions based on management’s judgements as regards the likelihood of material tax exposures and the probable amount of the liability. We consider this area as a key audit matter given the number of judgements involved in estimating the provisions relating to uncertain tax positions and the complexities of dealing with tax rules and regulations in numerous jurisdictions.
We evaluated the related accounting policy for provisioning for tax exposures and found it to be appropriate.
In conjunction with our tax specialists, we evaluated management’s judgements in respect of estimates of tax exposures and contingencies in order to assess the adequacy of the Group’s tax provisions. In order to understand and evaluate management’s judgements, we considered the status of current tax authority audits and enquiries, the outcome of previous tax authority audits, judgemental positions taken in tax returns and current year estimates and recent developments in the various tax jurisdictions in which the Group operates.
We challenged management’s key assumptions, in particular on cases where there had been significant developments with tax authorities, noting no significant deviation from our expectations.
From the evidence obtained and in the context of the financial statements, taken as a whole, we consider the provisions in relation to uncertain tax positions as at 31 December 2018 to be appropriate.
1492018 INTEGRATED ANNUAL REPORTSR
CG
FS
SSR
SI

Key audit matter How our audit addressed the key audit matterProvisions and contingent liabilities
Refer to Note 20 for provisions and Note 28 for contingencies.
The Group faces a number of threatened and actual legal and regulatory proceedings. The determination of the provision and/or the level of disclosure required involves a high degree of judgement resulting in provisions and contingent liabilities being considered as a key audit matter.
We evaluated the design of, and tested, key controls in respect of litigation and regulatory procedures, which we found to be satisfactory for the purposes of our audit.
Our procedures included the following:
· where relevant, reading external legal advice obtained by management;
· discussing open matters with the Group general counsel;
· meeting with local management and reading subsequent correspondence;
· assessing and challenging management’s conclusions through understanding precedents set in similar cases; and
· circularising relevant third-party legal representatives and follow up discussions, where appropriate, on certain material cases.
On the basis of the work performed, whilst noting the inherent uncertainty with such legal and regulatory matters, we determined the relevant provisions as at 31 December 2018 to be appropriate.
We assessed the appropriateness of the related disclosures in Note 28 and considered these to be reasonable.
How we tailored the audit scope
We tailored the scope of our audit to ensure that we performed sufficient work to be able to provide an opinion on the financial statements as a whole, taking into account the geographic structure of the Group, the accounting processes and controls, and the industry in which the Group operates.
The Group operates through its trading subsidiary undertakings in 28 countries, as set out on page 163 of the Annual Report. The processing of the accounting entries for these entities is largely centralised in a shared services centre in Bulgaria, except for the subsidiary undertakings in Russia, Ukraine, Belarus and Armenia, which process their accounting entries locally. The Group also operates a centralised treasury function in the Netherlands and in Greece and a centralised procurement function in Austria. We considered the nature of the work that needed to be performed on these entities and functions by us, as the group engagement team and by component auditors from other PwC network firms. Where work was performed by component auditors, we determined the level of involvement we needed to have in the audit work at those entities or functions to be able to conclude whether appropriate audit evidence had been obtained as a basis for our opinion on the financial statements as a whole.
Based on the significance to the financial statements and in light of the key audit matters as noted above, we identified subsidiary undertakings in 16 countries (including the trading subsidiary undertakings in Russia, Nigeria and Italy) which in our view, required an audit of their complete financial information. Furthermore, the Company’s complete financial information was subject to audit. Specified audit procedures on certain balances and transactions were also performed on one joint operation. In addition, audit procedures were performed with respect to the centralised treasury function by the group engagement team and with respect to the centralised procurement function by the component audit team in Austria. The group engagement team also performed analytical review and other procedures on balances and transactions of subsidiary undertakings not covered by the procedures described above.
Our group engagement team’s involvement with respect to audit work performed by component auditors included site visits and attendance at component audit clearance meetings with local management, in Russia, Italy, Switzerland, Romania, Poland, Austria, Bulgaria and Greece. Where physical attendance was not undertaken, the group engagement team held conference calls with component audit teams and with local management. Furthermore the group engagement team reviewed component auditor work papers and undertook other forms of interactions as considered necessary depending on the significance of the component and the extent of accounting and audit issues arising. The group engagement team was also responsible for planning, designing and overseeing the audit procedures performed at the shared services centre in Bulgaria. The Group consolidation, financial statement disclosures and a number of areas of significant judgement, including goodwill and intangible assets, material provisions and contingent liabilities, were audited by the group engagement team. We also performed work centrally on IT general controls. We also held a two-day audit planning workshop in Greece focusing on planning and risk assessment activities, auditor independence, centralised testing procedures and implementation of the new IFRSs, specifically IFRS 15 ‘Revenue from contracts with customers’, IFRS 9 ‘Financial instruments’ and IFRS 16 ‘Leases’. This audit planning workshop was attended by the component teams responsible for the subsidiaries requiring an audit of their complete financial information.
Based on the above, the undertakings of which an audit of their complete financial information was performed accounted for 87% of consolidated net sales revenue, 94% of consolidated profit before tax and 90% of consolidated total assets of the Group.
Materiality
The scope of our audit was influenced by our application of materiality. We set certain quantitative thresholds for materiality. These, together with qualitative considerations, helped us to determine the scope of our audit and the nature, timing and extent of our audit procedures on the individual financial statement line items and disclosures and in evaluating the effect of misstatements, both individually and in aggregate on the financial statements as a whole.
150 COCA-COLA HBC INDEPENDENT AUDITOR’S REPORT CONTINUED
Based on our professional judgement, we determined materiality for the financial statements as a whole as follows:
Overall group materiality €30.5 million (2017: €28.2 million).How we determined it 5% of profit before tax.Rationale for benchmark applied We chose profit before tax as the benchmark because, in our view, it is one of the principal
measures considered by users, and is a generally accepted benchmark. We chose 5% which is within the range of acceptable quantitative materiality thresholds in generally accepted auditing practice.
For each component in the scope of our group audit, we allocated a materiality that is less than our overall group materiality. The range of materiality allocated across components was from €2.0 million to €11.5 million.
We agreed with the Audit Committee that we would report to them misstatements identified during our audit above €1.0 million (2017: €1.0 million) as well as misstatements below that amount that, in our view, warranted reporting for qualitative reasons.
Going concern
With respect to the statement on going concern included in the Annual Report, we report as follows:Reporting obligation Outcome
We have reviewed the statement on going concern, included in the Statement of Directors’ Responsibilities, in the Annual Report on page 145, as if Coca-Cola HBC were a UK incorporated premium listed entity.
We have nothing to report having performed our review.
As noted in the Statement of Directors’ Responsibilities, the Directors have concluded that it is appropriate to prepare the financial statements using the going concern basis of accounting. The going concern basis presumes that the Group has adequate resources to remain in operation, and that the Directors intend it to do so, for at least one year from the date the financial statements were signed.
As part of our audit, we have concluded that the Directors’ use of the going concern basis is appropriate. However, because not all future events or conditions can be predicted, this statement is not a guarantee as to the Group’s ability to continue as a going concern.
Reporting on other information The other information comprises all of the information in the Annual Report other than the financial statements, our auditor’s report thereon and the Swiss statutory reporting, which we obtained prior to the date of this auditor’s report. The Directors are responsible for the other information. Our opinion on the financial statements does not cover the other information and, accordingly, we do not express an audit opinion or, except to the extent otherwise explicitly stated in this report, any form of assurance thereon.
In connection with our audit of the financial statements, our responsibility is to read the other information and, in doing so, consider whether the other information is materially inconsistent with the financial statements or our knowledge obtained in the audit, or otherwise appears to be materially misstated. If we identify an apparent material inconsistency or material misstatement, we are required to perform procedures to conclude whether there is a material misstatement of the financial statements or a material misstatement of the other information. If, based on the work we have performed, we conclude that there is a material misstatement of this other information, we are required to report that fact. We have nothing to report based on these responsibilities.
Based on the responsibilities described above and our work undertaken in the course of the audit, the Listing Rules of the FCA require us also to report on certain matters as described below.
UK Corporate Governance Code Provisions
We have nothing to report in respect of our responsibility to report when the Directors’ statement relating to the Company’s compliance with the UK Corporate Governance Code issued in April 2016 (the ‘Code’) does not properly disclose a departure from a relevant provision of the Code specified, under the Listing Rules of the FCA, for review by the auditors.
The Directors’ assessment of the prospects of the Group
We have also reviewed the Directors’ statement in relation to the longer-term viability of the Group, set out on page 79, of the Annual Report as if Coca-Cola HBC were a UK incorporated premium listed entity. Our review was substantially less in scope than an audit and only consisted of making inquiries and considering the Directors’ process supporting their statement; checking that the statement is in alignment with the relevant provisions of the Code; and considering whether the statement is consistent with the knowledge acquired by us in the course of performing our audit. We have nothing to report having performed our review.
Responsibilities for the financial statements and the audit
Responsibilities of the Directors for the financial statements
As explained more fully in the Statement of Directors’ Responsibilities set out on page 145 of the Annual Report, the Directors are responsible for the preparation of the financial statements in accordance with the applicable framework and for being satisfied that they give a true and fair view. The Directors are also responsible for such internal control as they determine is necessary to enable the preparation of financial statements that are free from material misstatement, whether due to fraud or error.
In preparing the financial statements, the Directors are responsible for assessing the Group’s ability to continue as a going concern, disclosing as applicable, matters related to going concern and using the going concern basis of accounting unless the Directors either intend to liquidate the Group or to cease operations, or have no realistic alternative but to do so.
1512018 INTEGRATED ANNUAL REPORTSR
CG
FS
SSR
SI

Auditor’s responsibilities for the audit of the financial statements
Our objectives are to obtain reasonable assurance about whether the financial statements as a whole are free from material misstatement, whether due to fraud or error, and to issue an auditors’ report that includes our opinion. Reasonable assurance is a high level of assurance, but is not a guarantee that an audit conducted in accordance with ISAs will always detect a material misstatement when it exists. Misstatements can arise from fraud or error and are considered material if, individually or in the aggregate, they could reasonably be expected to influence the economic decisions of users taken on the basis of these financial statements.
As part of an audit in accordance with ISAs, we exercise professional judgement and maintain professional scepticism throughout the audit. We also:
· Identify and assess the risks of material misstatement of the financial statements, whether due to fraud or error, design and perform audit procedures responsive to those risks, and obtain audit evidence that is sufficient and appropriate to provide a basis for our opinion. The risk of not detecting a material misstatement resulting from fraud is higher than for one resulting from error, as fraud may involve collusion, forgery, intentional omissions, misrepresentations, or the override of internal control.
· Obtain an understanding of internal control relevant to the audit in order to design audit procedures that are appropriate in the circumstances, but not for the purpose of expressing an opinion on the effectiveness of the Group’s internal control.
· Evaluate the appropriateness of accounting policies used and the reasonableness of accounting estimates and related disclosures made by the Directors.
· Conclude on the appropriateness of the Directors’ use of the going concern basis of accounting and, based on the audit evidence obtained, whether a material uncertainty exists related to events or conditions that may cast significant doubt on the Group’s ability to continue as a going concern. If we conclude that a material uncertainty exists, we are required to draw attention in our auditor’s report to the related disclosures in the consolidated financial statements or, if such disclosures are inadequate, to modify our opinion. Our conclusions are based on the audit evidence obtained up to the date of our auditor’s report. However, future events or conditions may cause the Group to cease to continue as a going concern.
· Evaluate the overall presentation, structure and content of the financial statements, including the disclosures, and whether the financial statements represent the underlying transactions and events in a manner that achieves fair presentation.
· Obtain sufficient appropriate audit evidence regarding the financial information of the entities or business activities within the Group to express an opinion on the financial statements. We are responsible for the direction, supervision and performance of the group audit. We remain solely responsible for our audit opinion.
We communicate with those charged with governance regarding, among other matters, the planned scope and timing of the audit and significant audit findings, including any significant deficiencies in internal control that we identify during our audit. Those charged with governance are responsible for overseeing the Group’s financial reporting process.
We also provide those charged with governance with a statement that we have complied with relevant ethical requirements regarding independence, and communicate with them all relationships and other matters that may reasonably be thought to bear on our independence, and where applicable, related safeguards.
From the matters communicated with those charged with governance, we determine those matters that were of most significance in the audit of the financial statements of the current year and are therefore the key audit matters. We describe these matters in our auditor’s report unless law or regulation precludes public disclosure about the matter or when, in extremely rare circumstances, we determine that a matter should not be communicated in our report because the adverse consequences of doing so would reasonably be expected to outweigh the public interest benefits of such communication.
Use of this report
This report, including the opinions, has been prepared for and only for Coca-Cola HBC AG for the purpose of the Disclosure Guidance and Transparency Rules sourcebook and the Listing Rules of the FCA and for no other purpose.
Notes:a. The maintenance and integrity of the Coca-Cola HBC AG website is the responsibility of the Directors; the work carried out by the auditors does not involve consideration of these
matters and, accordingly, the auditors accept no responsibility for any changes that may have occurred to the financial statements since they were initially presented on the website.b. Legislation in UK and Switzerland governing the preparation and dissemination of financial statements may differ from legislation in other jurisdictions.
Konstantinos Michalatosthe Certified Auditor, Reg. No. 17701 for and on behalf of PricewaterhouseCoopers S.A. Certified Auditors, Reg. No. 113 Athens, Greece
15 March 2019
152 COCA-COLA HBC INDEPENDENT AUDITOR’S REPORT CONTINUED

Consolidated income statementFor the year ended 31 December
Note2018
€ million2017
€ million
Net sales revenue 6,7 6,657.1 6,522.0Cost of goods sold (4,141.8) (4,083.0)Gross profit 2,515.3 2,439.0
Operating expenses 8 (1,875.9) (1,849.2)Operating profit 6 639.4 589.8
Finance income 6.1 10.6Finance costs (47.4) (47.3)Finance costs, net 9 (41.3) (36.7)Share of results of equity method investments 15 12.8 11.8Profit before tax 610.9 564.9
Tax 10 (162.8) (138.4)Profit after tax 448.1 426.5
Attributable to:Owners of the parent 447.4 426.0Non-controlling interests 0.7 0.5
448.1 426.5
Basic earnings per share (€) 11 1.22 1.17Diluted earnings per share (€) 11 1.21 1.16
The accompanying notes form an integral part of these consolidated financial statements.
1532018 INTEGRATED ANNUAL REPORTSR
CG
FS
SSR
SI
FINANCIAL STATEMENTS

Consolidated statement of comprehensive incomeFor the year ended 31 December
Note2018
€ million2017
€ million
Profit after tax 448.1 426.5Other comprehensive income:Items that may be subsequently reclassified to income statement:Valuation gain on available-for-sale assets – 0.1Cost of hedging 23 (5.3) –Net gain of cash flow hedges 23 6.3 8.6Foreign currency translation (63.1) (219.2)Share of other comprehensive income / (loss) of equity method investments 0.6 (5.3)Income tax relating to items that may be subsequently reclassified to income statement 12 1.0 (0.3)
(60.5) (216.1)Items that will not be subsequently reclassified to income statement:Valuation loss on equity investments at fair value through other comprehensive income (0.3) –Actuarial gains 20.8 6.9Income tax relating to items that will not be subsequently reclassified to income statement 12 (3.3) (2.2)
17.2 4.7Other comprehensive loss for the year, net of tax (refer to Note 12) (43.3) (211.4)Total comprehensive income for the year 404.8 215.1
Total comprehensive income attributable to:Owners of the parent 404.1 214.6Non-controlling interests 0.7 0.5
404.8 215.1
The accompanying notes form an integral part of these consolidated financial statements.
154 COCA-COLA HBC FINANCIAL STATEMENTS CONTINUED
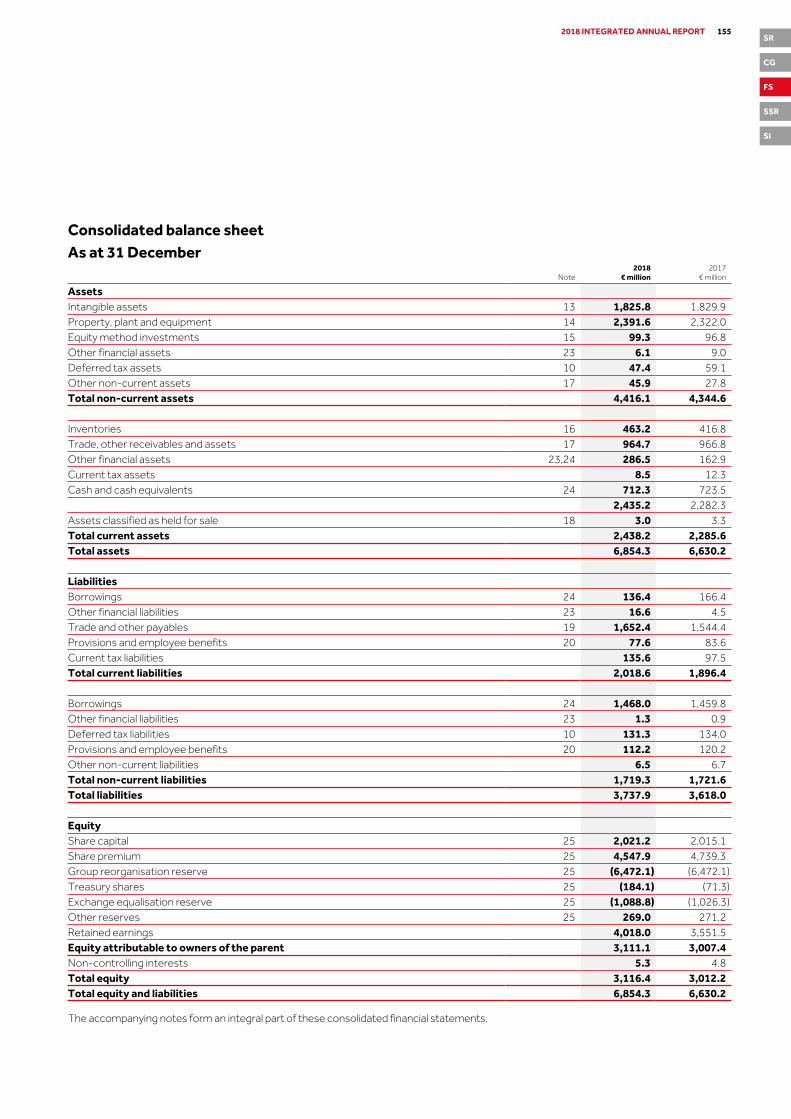
Consolidated balance sheetAs at 31 December
Note2018
€ million2017
€ million
AssetsIntangible assets 13 1,825.8 1,829.9Property, plant and equipment 14 2,391.6 2,322.0Equity method investments 15 99.3 96.8Other financial assets 23 6.1 9.0Deferred tax assets 10 47.4 59.1Other non-current assets 17 45.9 27.8Total non-current assets 4,416.1 4,344.6
Inventories 16 463.2 416.8Trade, other receivables and assets 17 964.7 966.8Other financial assets 23,24 286.5 162.9Current tax assets 8.5 12.3Cash and cash equivalents 24 712.3 723.5
2,435.2 2,282.3Assets classified as held for sale 18 3.0 3.3Total current assets 2,438.2 2,285.6Total assets 6,854.3 6,630.2
LiabilitiesBorrowings 24 136.4 166.4Other financial liabilities 23 16.6 4.5Trade and other payables 19 1,652.4 1,544.4Provisions and employee benefits 20 77.6 83.6Current tax liabilities 135.6 97.5Total current liabilities 2,018.6 1,896.4
Borrowings 24 1,468.0 1,459.8Other financial liabilities 23 1.3 0.9Deferred tax liabilities 10 131.3 134.0Provisions and employee benefits 20 112.2 120.2Other non-current liabilities 6.5 6.7Total non-current liabilities 1,719.3 1,721.6Total liabilities 3,737.9 3,618.0
EquityShare capital 25 2,021.2 2,015.1Share premium 25 4,547.9 4,739.3Group reorganisation reserve 25 (6,472.1) (6,472.1)Treasury shares 25 (184.1) (71.3)Exchange equalisation reserve 25 (1,088.8) (1,026.3)Other reserves 25 269.0 271.2Retained earnings 4,018.0 3,551.5Equity attributable to owners of the parent 3,111.1 3,007.4Non-controlling interests 5.3 4.8Total equity 3,116.4 3,012.2Total equity and liabilities 6,854.3 6,630.2
The accompanying notes form an integral part of these consolidated financial statements.
1552018 INTEGRATED ANNUAL REPORTSR
CG
FS
SSR
SI

Consolidated statement of changes in equityAttributable to owners of the parent
Sharecapital
€ million
Share premium
€ million
Group reorganisation
reserve€ million
Treasury shares
€ million
Exchange equalisation
reserve€ million
Other reserves€ million
Retained earnings€ million
Total€ million
Non-controlling
interests€ million
Totalequity
€ million
Balance as at 1 January 2017 1,990.8 4,854.6 (6,472.1) (70.7) (801.8) 245.1 3,119.7 2,865.6 4.5 2,870.1Shares issued to employees exercising stock options 24.3 46.7 – – – – – 71.0 – 71.0Share-based compensation:
Options and performance shares – – – – – 17.2 – 17.2 – 17.2Movement in shares held for equity compensation plan – – – (0.6) – 0.1 – (0.5) – (0.5)
Appropriation of reserves – – – – – 0.4 (0.4) – – –Dividends – (162.0) – – – – 1.5 (160.5) (0.2) (160.7)
2,015.1 4,739.3 (6,472.1) (71.3) (801.8) 262.8 3,120.8 2,792.8 4.3 2,797.1Profit for the year net of tax – – – – – – 426.0 426.0 0.5 426.5Other comprehensive loss for the year, net of tax – – – – (224.5) 8.4 4.7 (211.4) – (211.4)Total comprehensive income for the year, net of tax1 – – – – (224.5) 8.4 430.7 214.6 0.5 215.1Balance as at 31 December 2017 2,015.1 4,739.3 (6,472.1) (71.3) (1,026.3) 271.2 3,551.5 3,007.4 4.8 3,012.2
1. The amount included in the exchange equalisation reserve of €224.5m loss for 2017 represents the exchange loss attributed to the owners of the parent, including €5.3m loss relating to share of other comprehensive income of equity method investments.The amount included in other reserves of €8.4m gain for 2017 consists of gain on valuation of available-for-sale financial assets of €0.1m, cash flow hedges gains of €8.6m and the deferred tax expense thereof amounting to €0.3m.The amount of €430.7m gain attributable to owners of the parent comprises profit for the year of €426.0m, plus actuarial gains of €6.9m, minus deferred tax expense of €2.2m.The amount of €0.5m gain included in non-controlling interests for 2017 represents the share of non-controlling interests in profit for the year.
The accompanying notes form an integral part of these consolidated financial statements.
156 COCA-COLA HBC FINANCIAL STATEMENTS CONTINUED

Attributable to owners of the parent
Sharecapital
€ million
Share premium
€ million
Group reorganisation
reserve€ million
Treasury shares
€ million
Exchange equalisation
reserve€ million
Other reserves€ million
Retained earnings€ million
Total€ million
Non-controlling
interests€ million
Totalequity
€ million
Balance as at 1 January 2018 2,015.1 4,739.3 (6,472.1) (71.3) (1,026.3) 271.2 3,551.5 3,007.4 4.8 3,012.2Shares issued to employees exercising stock options 6.1 9.2 – – – – – 15.3 – 15.3Share-based compensation:
Options and performance shares – – – – – (1.5) – (1.5) – (1.5)Movement in shares held for equity compensation plan – – – (0.1) – 1.8 – 1.7 – 1.7
Sale of own shares – – 0.8 – – – 0.8 – 0.8Appropriation of reserves – – – (0.2) – 0.3 (0.1) – – –Movement of treasury shares – – – (113.3) – – – (113.3) – (113.3)Dividends – (200.6) – – – – 1.8 (198.8) (0.2) (199.0)Transfer of cash flow hedge reserve, including cost of hedging to inventories, net of deferred tax2 – – – – – (4.6) – (4.6) – (4.6) 2,021.2 4,547.9 (6,472.1) (184.1) (1,026.3) 267.2 3,553.2 2,707.0 4.6 2,711.6Profit for the year net of tax – – – – – – 447.4 447.4 0.7 448.1Other comprehensive loss for the year, net of tax – – – – (62.5) 1.8 17.4 (43.3) – (43.3)Total comprehensive income for the year, net of tax3 – – – – (62.5) 1.8 464.8 404.1 0.7 404.8Balance as at 31 December 2018 2,021.2 4,547.9 (6,472.1) (184.1) (1,088.8) 269.0 4,018.0 3,111.1 5.3 3,116.4
2. The amount included in other reserves of €4.6m loss for 2018 represents the cash flow hedge reserve, including cost of hedging, transferred to inventory of €5.9m loss, and the deferred tax income thereof amounting to €1.3m.
3. The amount included in the exchange equalisation reserve of €62.5m loss for 2018 represents the exchange loss attributed to the owners of the parent, including €0.6m gain relating to share of other comprehensive income of equity method investments.The amount of other comprehensive loss net of tax included in other reserves of €1.8m gain for 2018 consists of loss on valuation of equity investments at fair value through other comprehensive income of €0.3m, cash flow hedges gains of €1.0m and the deferred tax income thereof amounting to €1.1m.The amount of €464.8m gain attributable to owners of the parent comprises profit for the year of €447.4m, plus actuarial gains of €20.8m, minus deferred tax expense of €3.4m.The amount of €0.7m gain included in non-controlling interests for 2018 represents the share of non-controlling interests in profit for the year.
For further details, refer to: Note 23 Financial risk management and financial instruments, Note 25 Equity and Note 27 Share-based payments.
The accompanying notes form an integral part of these consolidated financial statements.
1572018 INTEGRATED ANNUAL REPORTSR
CG
FS
SSR
SI

Consolidated cash flow statementFor the year ended 31 December
Note2018
€ million2017
€ million
Operating activities Profit after tax 448.1 426.5Finance costs, net 9 41.3 36.7Share of results of equity method investments 15 (12.8) (11.8)Tax charged to the income statement 10 162.8 138.4Depreciation of property, plant and equipment 14 305.1 300.7Impairment of property, plant and equipment 14 13.6 16.1Employee stock options and performance shares 10.1 20.8Amortisation of intangible assets 13 0.5 0.4Other non-cash items – (0.3) 968.7 927.5Gain on disposals of non-current assets 8 (10.2) (4.3)Increase in inventories (62.4) (13.1)(Increase)/decrease in trade and other receivables (23.3) 11.7Increase in trade and other payables 40.2 10.1Tax paid (116.4) (128.4)Net cash inflow from operating activities 796.6 803.5 Investing activities Payments for purchases of property, plant and equipment (437.2) (409.9)Payments for purchases of intangible assets 13 (1.5) (1.8)Proceeds from sales of property, plant and equipment 18.3 39.5Net receipts from equity investments 12.0 24.4Net payments for investments in financial assets 24 – (151.0)Net payments for investments in financial assets at amortised cost (92.7) –Net payments for investments in financial assets at fair value through profit or loss (35.0) –Proceeds from loans to related parties 0.2 1.6Interest received 7.8 7.1Net cash outflow from investing activities (528.1) (490.1) Financing activities Proceeds from shares issued to employees exercising stock options 25 15.3 71.0Purchase of shares from non-controlling interests (0.2) (0.5)Purchase of own shares 25 (27.8) –Proceeds from sale of own shares 0.8 –Dividends paid to owners of the parent 25 (198.8) (160.5)Dividends paid to non-controlling interests (0.2) (0.2)Proceeds from borrowings 52.4 82.2Repayments of borrowings (69.6) (83.8)Principal repayments of finance lease obligations (7.7) (7.2)Proceeds from/(payments for) settlement of derivatives regarding financing activities 1.4 (3.1)Interest paid (40.4) (36.9)Net cash outflow from financing activities (274.8) (139.0)Net (decrease)/increase in cash and cash equivalents (6.3) 174.4 Movement in cash and cash equivalents Cash and cash equivalents at 1 January 723.5 573.2Net (decrease)/increase in cash and cash equivalents (6.3) 174.4Effect of changes in exchange rates (4.9) (24.1)Cash and cash equivalents at 31 December 24 712.3 723.5
The accompanying notes form an integral part of these consolidated financial statements.
158 COCA-COLA HBC FINANCIAL STATEMENTS CONTINUED

1. Description of businessCoca-Cola HBC AG and its subsidiaries (the ‘Group’ or ‘Coca-Cola HBC’ or ‘the Company’) are principally engaged in the production, sales and distribution of non-alcoholic, ready-to-drink beverages, under franchise from The Coca-Cola Company. The Company distributes its products in Nigeria and 27 countries in Europe. Information on the Company’s operations by segment is included in Note 6.
On 11 October 2012, Coca-Cola HBC, a Swiss stock corporation (Aktiengesellschaft/Société Anonyme) incorporated by Kar-Tess Holding (a related party of the Group, see Note 26), announced a voluntary share exchange offer to acquire all outstanding ordinary registered shares and all American depositary shares of Coca-Cola Hellenic Bottling Company S.A. As a result of the successful completion of this offer, on 25 April 2013 Coca-Cola HBC acquired 96.85% of the issued Coca-Cola Hellenic Bottling Company S.A. shares, including shares represented by American depositary shares, and became the new parent company of the Group. On 17 June 2013, Coca-Cola HBC completed its statutory buy-out of the remaining shares of Coca-Cola Hellenic Bottling Company S.A. that it did not acquire upon completion of its voluntary share exchange offer. Consequently, Coca-Cola HBC acquired 100% of Coca-Cola Hellenic Bottling Company S.A. which was eventually delisted from the Athens Exchange, from the London Stock Exchange where it had a secondary listing and from the New York Stock Exchange where American depositary shares were listed.
The shares of Coca-Cola HBC started trading in the premium segment of the London Stock Exchange (Ticker symbol: CCH), on the Athens Exchange (Ticker symbol: EEE) and regular way trading in Coca-Cola HBC ADS commenced on the New York Stock Exchange (Ticker symbol: CCH) on 29 April 2013. On 24 July 2014 the Group proceeded to the delisting of its American Depository Receipts from the New York Stock Exchange and terminated its reporting obligations under the US Securities Exchange Act of 1934. The deregistration of Coca-Cola HBC shares under the US Securities Exchange Act of 1934 and the termination of its reporting obligations became effective on 3 November 2014.
2. Basis of preparation and consolidation
Basis of preparation
The consolidated financial statements of the Group have been prepared in accordance with International Financial Reporting Standards (‘IFRS’) as issued by the International Accounting Standards Board (‘IASB’).
The consolidated financial statements are prepared on a going concern basis under the historical cost convention, as modified by the revaluation of money market funds, investments in equity instruments classified at fair value through other comprehensive income and derivative financial instruments.
These consolidated financial statements were approved for issue by the Board of Directors on 14 March 2019 and are expected to be verified at the Annual General Meeting to be held on 18 June 2019.
Comparative figures
Comparative figures have been adjusted and reclassified where necessary to conform with changes in presentation in the current year. More specifically, in the balance sheet, derivative financial instruments have been reported in line items ‘Other financial assets’ and ‘Other financial liabilities’ accordingly. In addition, non-current assets of €4.6m included in line ‘Other non-current assets’, regarding held-to-maturity investments and available-for-sale financial assets, were reclassified to line ‘Other financial assets’.
Basis of consolidation
Subsidiary undertakings are those companies over which the Group, directly or indirectly, has control. The Group controls an entity when the Group is exposed to, or has rights to, variable returns from its involvement with the entity and has the ability to affect those returns through power over the entity. Subsidiary undertakings are consolidated from the date on which control is transferred to the Group and cease to be consolidated from the date on which control is transferred out of the Group.
Transactions with non-controlling interests that do not result in loss of control are accounted for as equity transactions – that is, as transactions with the owners in their capacity as owners. The difference between fair value of any consideration paid and the relevant share acquired of the carrying value of net assets of the subsidiary is recorded in equity.
Inter-company transactions and balances between Group companies are eliminated. The subsidiaries’ accounting policies are consistent with policies adopted by the Group.
When the Group ceases to have control, any retained interest in the entity is remeasured to its fair value at the date when such control is lost, with the change in carrying amount recognised in profit or loss. The fair value is the initial carrying amount for the purposes of subsequently accounting for the retained interest as an associate, joint venture or financial asset. In addition, any amounts previously recognised in other comprehensive income in respect of that entity are accounted for as if the Group had directly disposed of the related assets or liabilities. This means that amounts previously recognised in other comprehensive income, if any, are reclassified to profit or loss.
1592018 INTEGRATED ANNUAL REPORTSR
CG
FS
SSR
SI
NOTES TO THE CONSOLIDATED FINANCIAL STATEMENTS

3. Foreign currency and translationThe individual financial statements of each Group entity are presented in the currency of the primary economic environment in which the entity operates (its functional currency). For the purpose of the consolidated financial statements, the results and financial position of each entity are expressed in Euro, which is the presentation currency for the consolidated financial statements.
The assets and liabilities of foreign subsidiaries are translated into Euro at the exchange rate ruling at the balance sheet date. The results of foreign subsidiaries are translated into Euro using the average monthly exchange rate (being a reasonable approximation of the rates prevailing on the transaction dates). The exchange differences arising on translation are recognised in other comprehensive income. On disposal of a foreign entity, accumulated exchange differences are recognised as a component of the gain or loss on disposal.
Transactions in foreign currencies are recorded at the rate ruling at the date of transaction. Monetary assets and liabilities denominated in foreign currencies are remeasured at the rate of exchange ruling at the balance sheet date. All gains and losses arising on remeasurement are included in the income statement, except for exchange differences arising on assets and liabilities classified as cash flow hedges which are deferred in equity until the occurrence of the hedged transaction, at which time they are recognised in the income statement. Share capital denominated in a currency other than the functional currency is initially stated at spot rate of the date of issue but is not retranslated.
The principal exchange rates used for translation purposes in respect of one Euro are:
Average
2018Average
2017Closing
2018Closing
2017
US dollar 1.18 1.13 1.14 1.19UK sterling 0.88 0.88 0.90 0.89Polish zloty 4.26 4.26 4.29 4.19Nigerian naira 427.39 378.60 416.55 428.75Hungarian forint 318.51 309.20 321.07 310.12Swiss franc 1.16 1.11 1.13 1.17Russian rouble 73.94 65.87 79.46 68.67Romanian leu 4.65 4.57 4.66 4.65Ukrainian hryvnia 32.14 29.97 31.11 33.12Czech koruna 25.65 26.34 25.83 25.93Serbian dinar 118.28 121.45 118.21 118.29
4. Accounting pronouncements
a) Accounting standards and pronouncements adopted in 2018
In the current period, the Group has adopted the following standards and amendments which were issued by the IASB, that are relevant to its operations and effective for accounting periods beginning on 1 January 2018:
· IFRS 9 Financial Instruments
The Group adopted IFRS 9, Financial Instruments in accordance with the standard’s transitional provisions. IFRS 9 introduces new requirements for the recognition, classification and measurement of financial assets and liabilities, impairment of financial assets and hedge accounting.
Classification and measurement of financial assets
Under IFRS 9, financial assets are initially measured at fair value plus, in the case of financial assets not at fair value through profit and loss (FVTPL), transaction costs. Subsequently debt instruments are measured at FVTPL, amortised cost or fair value through other comprehensive income (FVOCI). The classification depends on two criteria: a) the Group’s business model for managing assets and b) whether the instruments’ contractual cash flows represent solely payments for principal and interest on the principal amount outstanding (the ‘SPPI criterion’).
On 1 January 2018 the Group assessed which business models applied to its financial assets and classified them into the appropriate IFRS 9 categories. Its debt instruments are held at amortised cost; these include trade receivables, investments in time deposits and treasury bills. Other financial assets are classified and subsequently measured as follows:
The Group’s investments in equity instruments are classified at FVOCI, with no recycling of gains or losses to profit or loss on derecognition. The Group intends to hold these equity instruments for the foreseeable future and has irrevocably elected to so classify them upon initial recognition or transition. Equity instruments at FVOCI are not subject to an impairment assessment under IFRS 9. Under IAS 39, the Group’s investments in equity instruments were classified as available-for-sale financial assets.
160 COCA-COLA HBC NOTES TO THE CONSOLIDATED FINANCIAL STATEMENTS CONTINUED

Financial assets at FVTPL comprise derivative instruments and money market funds.
There were no differences in measurement during the transfer of financial assets from IAS 39 to IFRS 9 categories.
Impairments of financial assets
The adoption of IFRS 9 has changed the Group’s accounting for impairment losses for financial assets by replacing IAS 39’s incurred loss approach with a forward-looking expected credit loss (ECL) approach. IFRS 9 requires the Group to record an allowance for ECLs for all loans and other debt financial assets not held at FVTPL. ECLs are based on the difference between the contractual cash flows due in accordance with the contract and all the cash flows that the Group expects to receive. The shortfall is then discounted at an approximation to the asset’s original effective interest rate.
For trade and other receivables, the Group has applied the standard’s simplified approach and has calculated ECLs based on lifetime expected credit losses. The Group uses past experience for determining the risk of default as well as forward-looking information at the end of each reporting period specific to the debtors and the economic environment. On this basis, the Group has determined the loss allowance as at 1 January 2018 which didn’t result in material differences compared to the 31 December 2017 loss allowance.
All other financial assets at amortised cost are considered to have a low credit risk and the fair value approximates the carrying value.
Hedge accounting
The new hedge accounting requirements have aligned the accounting for hedging instruments more closely with the Group’s risk management practices and therefore more hedge relationships are eligible for hedge accounting. At the date of the initial application, all of the Group’s existing hedging relationships were eligible to be treated as continuing hedging relationships. Since adoption of IFRS 9 the Group recognises the changes in time value of option contracts as a deferred amount in a new ‘cost of hedging’ reserve within equity. The deferred amounts are recognised against the related hedged transaction when it occurs. However, as amounts were not material prior periods have not been restated.
· IFRS 15 Revenue from Contracts with Customers
The Group adopted IFRS 15, Revenue from Contracts with Customers using the modified retrospective approach. The Group produces, distributes and sells primarily non-alcoholic beverages. Under IFRS 15 the Group recognises revenue when control of the products is transferred, being when the products are delivered to the customer, therefore the adoption of IFRS 15 did not have an impact on the timing of revenue recognition.
Net sales revenue is measured at the fair value of the consideration received or receivable and is stated net of sales discounts and consideration paid to customers. These mainly take the form of promotional incentives and are amortised over the terms of the related contracts as a deduction in revenue. The Group examined these in terms of the variable consideration and classification. The adoption of IFRS 15 did not have any impact on either of these.
Net sales revenue includes excise and other duties where the Group acts as a principal but excludes amounts collected by third parties such as value added taxes as these are not included in the transaction price. The Group assesses these taxes and duties on a jurisdiction-by-jurisdiction basis to conclude on the appropriate accounting treatment.
· Other amendments and interpretations
The Group has adopted the following other amendments and interpretations which were issued by the IASB, that are relevant to its operations and effective for accounting periods beginning on 1 January 2018:
· Amendments to IFRS 2: Classification and Measurement of Share-based Payment Transactions
· Amendments to IFRS 10 and IAS 28: Sale or Contribution of Assets between an Investor and its Associate or Joint Venture
· Interpretation 22: Foreign Currency Transactions and Advance Consideration
· Annual improvements to IFRSs: 2014-2016 Cycle – IAS 28 Long-term Interests in Associates and Joint Ventures
These other amendments and interpretations that came into effect on 1 January 2018 did not have an impact on the consolidated financial statements of the Group.
1612018 INTEGRATED ANNUAL REPORTSR
CG
FS
SSR
SI

4. Accounting pronouncements continued
b) Accounting pronouncements not yet adopted
At the date of approval of these consolidated financial statements, the following standard and interpretations relevant to the Group’s operations were issued but not yet effective and not early adopted.
IFRS 16 Leases. The new standard supersedes IAS 17 and will result in almost all leases being recognised on the balance sheet by lessees as the distinction between operating and finance leases is removed. Under the new standard, an asset (the right to use the leased item) and a financial liability to pay rentals are recognised; the only exceptions are short-term leases that do not contain a purchase option and low-value leases. The right-of-use assets will be depreciated on a straight-line basis. The liability, recognised as part of borrowings, will be measured at a discounted value using the interest rate implicit in the lease (if that rate can be determined), or the incremental borrowing rate of the lease and any interest will be charged to finance costs in the income statement. Therefore, the charge to the income statement for the operating lease expense will be replaced with depreciation on the right-of-use asset and the interest charge inherent in the lease.
The Group intends to apply the modified retrospective transition approach and will not restate comparative amounts for the year prior to first adoption. On transition the Group has decided to:
i. measure all right-of-use assets at an amount equal to the lease liability on the date of initial application (adjusted for any prepaid or accrued lease expenses);
ii. exclude all leases that expire within 2019;
iii. exclude initial direct costs from the measurement of the right-of-use asset at the date of initial application; and
iv. apply the new guidance regarding definition of a lease only to contracts entered into or changed on or after 1 January 2019.
In determining the lease term, management considers all facts and circumstances that create an economic incentive to exercise an extension option, or not exercise a termination option. Extension options (or periods after termination options) are only included in the lease term if the lease is reasonably certain to be extended (or not terminated). The assessment is reviewed if a significant event or a significant change in circumstances occurs which affects this assessment and that is within the control of the Group. In determining the incremental borrowing rate to be used, the Group applies judgement to establish the suitable reference rate and credit spread.
The operating leases which will be recorded on the balance sheet following implementation of IFRS 16 are principally in respect of cars and buildings. The Group has decided to reduce the complexity of implementation by taking advantage of a number of practical expedients permitted by the standard namely:
i. apply the recognition exemption to short-term leases that do not contain a purchase option; and
ii. apply the recognition exemption to leases of underlying assets with a low value.
As at 31 December 2018, the Group had operating lease commitments of €183.3m (refer to Note 29). Short-term leases and low value leases did not comprise a significant component of these.
The Group expects to recognise right-of-use assets of approximately €150 million on 1 January 2019 and lease liabilities of approximately €150 million, while the impact to net assets will be immaterial.
In addition, the following amendments have been issued by the IASB but are not yet effective:
· IFRIC 23 – Uncertainty over Income Tax Treatments, effective 1 January 2019
· IAS 28 (Amendment) – Long-term Interests in Associates and Joint Ventures, effective 1 January 2019
· IAS 19 (Amendment) – Plan Amendment, Curtailment or Settlement, effective 1 January 2019
· 2015-2017 Annual Improvements cycle, effective 1 January 2019:
· IFRS 3 Business Combinations – Previously held interests in a joint operation
· IFRS 11 Joint Arrangements – Previously held interests in a joint operation
· IAS 12 Income Taxes – Income tax consequences of payments on financial instruments classified as equity
· IAS 23 Borrowing Costs – Borrowing costs eligible for capitalisation.
The above amendments and interpretations are not expected to have a material impact on the consolidated financial statements of the Group.
162 COCA-COLA HBC NOTES TO THE CONSOLIDATED FINANCIAL STATEMENTS CONTINUED

5. Critical accounting estimates and judgementsIn conformity with IFRS, the preparation of the consolidated financial statements for Coca-Cola HBC requires management to make estimates and judgements that affect the reported amounts of assets, liabilities, revenues and expenses, and the disclosure of contingent assets and liabilities in the consolidated financial statements and accompanying notes. Although these estimates and judgements are based on management’s knowledge of current events and actions that may be undertaken in the future, actual results may ultimately differ from estimates.
Estimates
The key items concerning the future and other key sources of estimation uncertainty at the reporting date, that have a significant risk of causing a material adjustment to the carrying amounts of assets and liabilities within the next financial year, are described below.
· Income taxes (refer to Note 10)
· Impairment of goodwill and indefinite lived intangible assets (refer to Note 13)
· Employee benefits – defined benefit pension plans (refer to Note 20)
Judgements
In the process of applying the Group’s accounting policies, management has made the following judgements, apart from those involving estimations as described above, which have the most significant effect on the amounts recognised in the consolidated financial statements:
· Joint arrangements (refer to Note 15)
6. Segmental analysisThe Group has one business, being the production, sale and distribution of ready-to-drink, primarily non-alcoholic, beverages. The Group operates in 28 countries which are aggregated in reportable segments as follows:
The Group’s operations in each of the three reportable segments have been aggregated on the basis of their similar economic characteristics, assessed by reference to their net sales revenue per unit case as well as disposable income per capita, exposure to political and economic volatility, regulatory environments, customers and distribution infrastructures. The accounting policies of the reportable segments are the same as those adopted by the Group. The Group’s chief operating decision maker is its Operating Committee, which evaluates performance and allocates resources based on volume, net sales revenue and operating profit.
a) Volume and net sales revenue
The Group sales volume in million unit cases1 for the years ended 31 December was as follows:2018 2017
Established 619.5 613.3Developing 429.0 394.2Emerging 1,143.8 1,096.6Total volume 2,192.3 2,104.1
1. One unit case corresponds to approximately 5.678 litres or 24 servings, being a typically used measure of volume. Volume data is derived from unaudited operational data.
Established markets: Austria, Cyprus, Greece, Italy, Northern Ireland, the Republic of Ireland and Switzerland.
Developing markets: Croatia, Czech Republic, Estonia, Hungary, Latvia, Lithuania, Poland, Slovakia and Slovenia.
Emerging markets: Armenia, Belarus, Bosnia and Herzegovina, Bulgaria, Moldova, Montenegro, Nigeria, North Macedonia, Romania, the Russian Federation, Serbia (including the Republic of Kosovo) and Ukraine.
1632018 INTEGRATED ANNUAL REPORTSR
CG
FS
SSR
SI
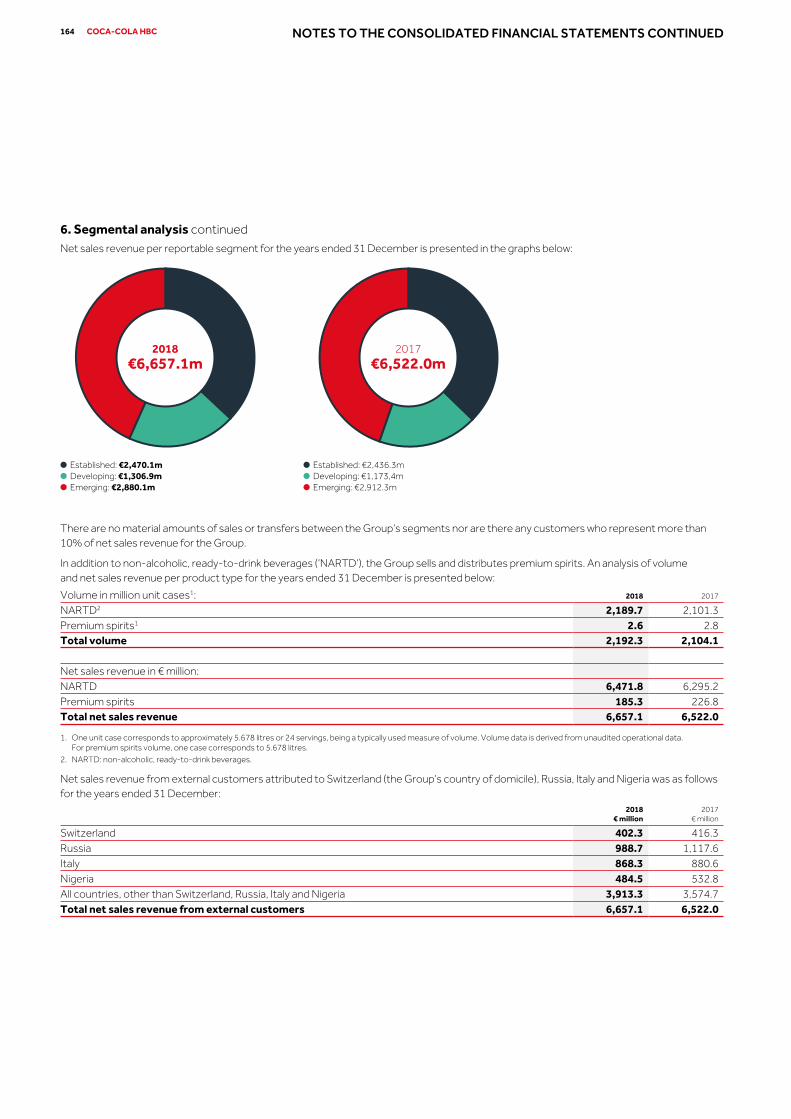
6. Segmental analysis continuedNet sales revenue per reportable segment for the years ended 31 December is presented in the graphs below:
There are no material amounts of sales or transfers between the Group’s segments nor are there any customers who represent more than 10% of net sales revenue for the Group.
In addition to non-alcoholic, ready-to-drink beverages (‘NARTD’), the Group sells and distributes premium spirits. An analysis of volume and net sales revenue per product type for the years ended 31 December is presented below:
Volume in million unit cases1: 2018 2017
NARTD2 2,189.7 2,101.3Premium spirits1 2.6 2.8Total volume 2,192.3 2,104.1 Net sales revenue in € million: NARTD 6,471.8 6,295.2Premium spirits 185.3 226.8Total net sales revenue 6,657.1 6,522.0
1. One unit case corresponds to approximately 5.678 litres or 24 servings, being a typically used measure of volume. Volume data is derived from unaudited operational data. For premium spirits volume, one case corresponds to 5.678 litres.
2. NARTD: non-alcoholic, ready-to-drink beverages.
Net sales revenue from external customers attributed to Switzerland (the Group’s country of domicile), Russia, Italy and Nigeria was as follows for the years ended 31 December:
2018
€ million2017
€ million
Switzerland 402.3 416.3Russia 988.7 1,117.6Italy 868.3 880.6Nigeria 484.5 532.8All countries, other than Switzerland, Russia, Italy and Nigeria 3,913.3 3,574.7Total net sales revenue from external customers 6,657.1 6,522.0
Established: €2,436.3mDeveloping: €1,173,4mEmerging: €2,912.3m
2017€6,522.0m
Established: €2,470.1mDeveloping: €1,306.9mEmerging: €2,880.1m
2018€6,657.1m
164 COCA-COLA HBC NOTES TO THE CONSOLIDATED FINANCIAL STATEMENTS CONTINUED

b) Other income statement items
Year ended 31 December Note2018
€ million2017
€ million
Operating profit: Established 232.0 238.3Developing 130.7 91.6Emerging 276.7 259.9Total operating profit 639.4 589.8 Finance costs: Established (25.8) (25.4)Developing (5.1) (4.3)Emerging (7.5) (12.9)Corporate³ (110.3) (99.4)Inter-segment interest expense 101.3 94.7Total finance costs 9 (47.4) (47.3) Finance income: Established 0.9 0.6Developing 1.7 1.3Emerging 22.3 23.9Corporate³ 82.5 79.5Inter-segment finance income (101.3) (94.7)Total finance income 9 6.1 10.6 Income tax expense: Established (52.5) (57.6)Developing (28.2) (17.2)Emerging (66.0) (45.4)Corporate3 (16.1) (18.2)Total income tax expense 10 (162.8) (138.4) Reconciling items: Share of results of equity method investments 15 12.8 11.8Profit after tax 448.1 426.5
Depreciation and impairment of property, plant and equipment and amortisation of intangible assets included in the measure of operating profit are as follows:
Note2018
€ million2017
€ million
Depreciation and impairment of property, plant and equipment: Established (89.6) (93.4)Developing (52.9) (52.2)Emerging (176.2) (171.2)Total depreciation and impairment of property, plant and equipment 14 (318.7) (316.8)Amortisation of intangible assets: Developing (0.1) –Emerging (0.4) (0.4)Total amortisation of intangible assets 13 (0.5) (0.4)
3. Corporate refers to holding, finance and other non-operating subsidiaries of the Group.
1652018 INTEGRATED ANNUAL REPORTSR
CG
FS
SSR
SI

6. Segmental analysis continued
c) Other items
The balance of non-current assets4 attributed to Switzerland (the Group’s country of domicile), Russia, Italy and Nigeria was as follows for the years ended 31 December:
2018
€ million2017
€ million
Switzerland 509.0 498.9Russia 467.4 542.2Italy 1,000.7 993.3Nigeria 489.8 405.5All countries, other than Switzerland, Russia, Italy and Nigeria 1,880.1 1,831.9Total non-current assets⁴ 4,347.0 4,271.8
4. Excluding other financial assets, deferred tax assets, pension plan assets, trade and loans receivable.
Expenditure of property, plant and equipment per reportable segment was as follows for the years ended 31 December:
2018
€ million2017
€ million
Established 95.7 89.7Developing 72.1 63.2Emerging 269.4 257.0Total expenditure of property, plant and equipment 437.2 409.9
During 2017 the Nigerian naira was significantly devalued against the Euro, resulting in foreign currency translation losses which were recognised within other comprehensive income of the consolidated statement of comprehensive income in 2017 (refer to Note 12). In 2018 the Nigerian naira was slightly appreciated against the Euro, however further pressures in the economy may result in further volatility in the local currency. The Group continues to monitor the situation in Nigeria in order to ensure that timely actions and initiatives are undertaken to minimise potential adverse impact on its performance, particularly in relation to potential currency volatility.
7. Net sales revenue
Accounting policy
The Group produces, distributes and sells primarily non-alcoholic beverages. Under IFRS 15, Revenue from Contracts with Customers the Group recognises revenue when control of the products is transferred, being when the products are delivered to the customer.
Net sales revenue is measured at the fair value of the consideration received or receivable and is stated net of sales discounts and consideration paid to customers. These mainly take the form of promotional incentives and are amortised over the terms of the related contracts as a deduction in revenue.
The Group provides volume rebates to customers once the quantity of goods purchased during the period exceeds a threshold specified in the contract. To estimate the variable consideration for the expected future rebates the Group uses the most likely amount method.
Net sales revenue includes excise and other duties where the Group acts as a principal but excludes amounts collected by third parties such as value added taxes as these are not included in the transaction price. The Group assesses these taxes and duties on a jurisdiction-by-jurisdiction basis to conclude on the appropriate accounting treatment.
Coca-Cola HBC receives contributions from The Coca-Cola Company in order to promote sales of their brands. Contributions for price support, marketing and promotional campaigns in respect of specific customers are recognised as an offset to promotional incentives provided to those customers to which the contributions contractually relate. These contributions are accrued and matched to the expenditure to which they relate (refer to Note 26).
Refer to Note 6 for an analysis of net sales revenue per reportable segment.
166 COCA-COLA HBC NOTES TO THE CONSOLIDATED FINANCIAL STATEMENTS CONTINUED

Listing fees and marketing and promotional incentives provided to customers recognised as a reduction to net sales revenue for the years ended 31 December are presented below:
2018
€ million2017
€ million
Listing fees 588.8 474.2Marketing and promotional incentives 220.0 210.2Total listing fees, marketing and promotional incentives 808.8 684.4
The amount of listing fees capitalised at 31 December 2018 was €7.1m (31 December 2017: € 7.9m). Of this balance, €3.9m (31 December 2017: € 6.0m) was classified as current prepayments and the remainder as non-current prepayments.
8. Operating expensesOperating expenses for the years ended 31 December comprised:
2018
€ million2017
€ million
Selling expenses 927.3 917.2Delivery expenses 522.1 495.7Administrative expenses 393.7 407.4Restructuring expenses 32.8 28.9Operating expenses 1,875.9 1,849.2
In 2018, operating expenses included gain on disposals of non-current assets of €10.2m (2017: €4.3m net gains).
a) Restructuring expenses
Accounting policy
Restructuring expenses are recorded in a separate line item within operating expenses and comprise costs arising from significant changes in the way the Group conducts its business such as significant supply chain infrastructure changes, outsourcing of activities and centralisation of processes. Redundancy provisions are recognised only when the Group has a present constructive obligation, which is when a detailed formal plan identifies the business or part of the business concerned, the location and number of employees affected, a detailed estimate of the associated costs, as well as an appropriate timeline and the employees affected have been notified of the plan’s main features.
As part of the effort to optimise its cost base and sustain competitiveness in the marketplace, the Company undertakes restructuring initiatives. The restructuring concerns mainly employees’ costs and impairment of property, plant and equipment (refer to Note 14). Restructuring expenses per reportable segment for the years ended 31 December are presented below:
Established: €13.1mDeveloping: €1.6mEmerging: €14.2m
2017€28.9m
Established: €4.9mDeveloping: €4.0mEmerging: €23.9m
2018€32.8m
1672018 INTEGRATED ANNUAL REPORTSR
CG
FS
SSR
SI

8. Operating expenses continued
b) Employee costs
Employee costs for the years ended 31 December comprised:
2018
€ million2017
€ million
Wages and salaries 705.5 697.2Social security costs 139.0 148.7Pension and other employee benefits 126.3 128.2Termination benefits 22.4 18.2Total employee costs 993.2 992.3
The average number of full-time equivalent employees in 2018 was 28,884 (2017: 29,427).
Employee costs for 2018 included in operating expenses and cost of goods sold amounted to €766.2m and €227.0m respectively (2017: €760.1m and €232.2m respectively).
c) Directors’ and senior management remuneration
The total remuneration paid or accrued for Directors and the senior management team for the years ended 31 December comprised:
2018
€ million2017
€ million
Salaries and other short-term benefits 11.7 13.8Stock option and performance share awards 6.3 12.6Pension and post-employment benefits 0.8 0.7Total remuneration 18.8 27.1
d) Fees and other services of the auditor
Audit and other fees charged in the income statement concerning the auditor of the consolidated financial statements, PricewaterhouseCoopers S.A. and affiliates, were as follows, for the years ended 31 December:
2018
€ million2017
€ million
Audit fees 4.3 4.3Audit-related fees 0.4 0.4Other fees 0.1 –Total audit and all other fees 4.8 4.7
9. Finance costs, net
Accounting policy
Interest income and interest expense are recognised using the effective interest rate method, and are recorded in the income statement within ‘Finance income’ and ‘Finance cost’ respectively. Interest expense also includes amortisation of the loss on the forward starting swaps recorded in other comprehensive income (refer to Note 23).
Finance costs, net for the years ended 31 December comprised:
2018
€ million2017
€ million
Interest income 6.1 10.6Interest expense (41.8) (39.9)Finance charges incurred with respect to finance leases (4.7) (6.0)Other finance costs (1.3) (1.4)Net foreign exchange remeasurement gain 0.4 –Finance costs (47.4) (47.3)Finance costs, net (41.3) (36.7)
Other finance costs include commitment fees on loan facilities (for the part not yet drawn down) and other similar fees.
168 COCA-COLA HBC NOTES TO THE CONSOLIDATED FINANCIAL STATEMENTS CONTINUED

10. Taxation
Accounting policy
Tax is recognised in the income statement, except to the extent that it relates to items recognised in other comprehensive income or in equity. In this case, the tax is recognised in other comprehensive income or directly in equity.
The current income tax expense is calculated on the basis of the tax laws enacted or substantively enacted at the balance sheet date in the countries where the Group operates and generates taxable income. Management periodically evaluates positions taken in tax returns with respect to situations in which applicable tax regulations are subject to interpretation and establishes provisions where appropriate, on the basis of amounts expected to be paid to the tax authorities.
Deferred tax is provided using the liability method for all temporary differences arising between the tax bases of assets and liabilities and their carrying values for financial reporting purposes. However, the deferred tax liabilities are not recognised if they arise from the initial recognition of goodwill; deferred tax is not accounted for if it arises from initial recognition of an asset or liability in a transaction other than a business combination that at the time of the transaction affects neither accounting nor taxable profit or loss. Tax rates enacted or substantively enacted at the balance sheet date are those that are expected to apply when the deferred tax asset is realised or deferred tax liability is settled.
Deferred tax assets are recognised to the extent that it is probable that future taxable profit will be available against which the temporary differences can be utilised. Deferred tax assets are recognised for tax losses carried forward to the extent that realisation of the related tax benefit through the reduction of the future taxes is probable.
Deferred tax is provided on temporary differences arising on investments in subsidiaries, associates and joint ventures, except where the timing of the reversal of the temporary difference can be controlled by the Group, and it is probable that the temporary difference will not reverse in the foreseeable future. This includes taxation in respect of the retained earnings of overseas subsidiaries only to the extent that, at the balance sheet date, dividends have been accrued as receivable or a binding agreement to distribute past earnings in future periods has been entered into by the subsidiary.
Deferred tax assets and deferred tax liabilities are offset if a legally enforceable right exists to offset current tax assets against current tax liabilities and the deferred taxes relate to the same taxation authority on either the same taxable entity or different taxable entities where there is an intention to settle the balances on a net basis.
Critical accounting estimates
The Group is subject to income taxes in numerous jurisdictions. There are many transactions and calculations for which the ultimate tax determination cannot be assessed with certainty in the ordinary course of business. The Group recognises a provision for potential cases that might arise in the foreseeable future based on assessment of the probabilities as to whether additional taxes will be due. Where the final tax outcome on these matters is different from the amounts that were initially recorded, such differences will impact the income tax provision in the period in which such determination is made. The income tax provision amounted to €98.5m as at 31 December 2018 (2017: €69.2m) and is included in the line ‘Current tax liabilities’ of the consolidated balance sheet.
The income tax charge for the years ended 31 December was as follows:
2018
€ million2017
€ million
Current tax charge 149.0 130.6Deferred tax 13.8 7.8Income tax expense 162.8 138.4
1692018 INTEGRATED ANNUAL REPORTSR
CG
FS
SSR
SI

10. Taxation continued
The tax on the Group’s profit before tax differs from the theoretical amount that would arise using the weighted average tax rate applicable to profits of the consolidated entities as follows:
2018
€ million2017
€ million
Profit before tax 610.9 564.9 Tax calculated at domestic tax rates applicable to profits in the respective countries 122.8 130.1Additional local taxes in foreign jurisdictions 9.0 8.8Tax holidays in foreign jurisdictions 9.0 (11.9)Expenses non-deductible for tax purposes 16.7 15.4Income not subject to tax (8.9) (8.9)Changes in tax laws and rates 1.4 –Movement in utilisation of accumulated tax losses 0.6 0.3Movement of deferred tax asset not recognised (0.5) 2.0Recognition of previously unrecognised post-acquisition tax losses (2.1) (0.3)Other 14.8 2.9Income tax expense 162.8 138.4
Non-deductible expenses for tax purposes include marketing and advertising expenses, service fees, bad debt provisions, entertainment expenses, certain employee benefits and stock option expenses and other items that, partially or in full, are not deductible for tax purposes in certain of our jurisdictions.
Deferred tax assets and liabilities presented in the consolidated balance sheet as at 31 December can be further analysed as follows:
Deferred tax assets:2018
€ million2017
€ million
To be recovered after 12 months 29.4 47.1To be recovered within 12 months 78.0 67.2Gross deferred tax assets 107.4 114.3Offset of deferred tax (60.0) (55.2)Net deferred tax assets 47.4 59.1 Deferred tax liabilities: To be recovered after 12 months (162.2) (167.1)To be recovered within 12 months (29.1) (22.1)Gross deferred tax liabilities (191.3) (189.2)Offset of deferred tax 60.0 55.2Net deferred tax liabilities (131.3) (134.0)
A reconciliation of net deferred tax is presented below:
2018
€ million2017
€ million
As at 1 January (74.9) (66.6)Taken to the income statement (13.8) (7.8)Taken to other comprehensive income (2.3) (2.5)Taken directly to equity 1.3 –Foreign currency translation 5.8 2.0As at 31 December (83.9) (74.9)
170 COCA-COLA HBC NOTES TO THE CONSOLIDATED FINANCIAL STATEMENTS CONTINUED

The movements in deferred tax assets and liabilities during the year, without taking into consideration the offsetting of balances within the same tax jurisdiction where applicable, are as follows:
Deferred tax assetsProvisions
€ million
Pensions andbenefit plans
€ million
Tax lossescarry-forward
€ million
Book inexcess of tax depreciation
€ millionLeasing€ million
Other deferred
tax assets€ million
Total€ million
As at 1 January 2017 63.5 22.1 16.7 8.3 8.6 14.8 134.0Taken to the income statement (12.1) (0.1) (6.1) 13.5 (0.9) 1.7 (4.0)Taken to other comprehensive income – (2.1) – – – (0.1) (2.2)Transfers between assets/liabilities (0.3) 0.3 – (0.1) – (10.5) (10.6)Foreign currency translation (1.3) (1.5) (0.2) (1.5) – 1.6 (2.9)As at 31 December 2017 49.8 18.7 10.4 20.2 7.7 7.5 114.3Taken to the income statement (7.0) 2.0 (6.8) (2.2) (0.7) 10.2 (4.5)Taken to other comprehensive income – (4.0) – – – 1.1 (2.9)Taken directly to equity – – – – – 1.3 1.3Transfers between assets/liabilities – – – 0.9 – – 0.9Foreign currency translation (1.4) 0.1 (0.4) 0.3 – (0.3) (1.7)As at 31 December 2018 41.4 16.8 3.2 19.2 7.0 19.8 107.4
Deferred tax liabilities
Tax in excess of book
depreciation€ million
Derivativeinstruments
€ million
Otherdeferred tax
liabilities€ million
Total€ million
As at 1 January 2017 (188.4) (1.9) (10.3) (200.6)Taken to the income statement 7.9 0.2 (11.9) (3.8)Taken to other comprehensive income – (0.2) (0.1) (0.3)Transfers between assets/liabilities (0.1) – 10.7 10.6Foreign currency translation 4.6 (0.1) 0.4 4.9As at 31 December 2017 (176.0) (2.0) (11.2) (189.2)Taken to the income statement (5.0) 0.1 (4.4) (9.3)Taken to other comprehensive income – (0.1) 0.7 0.6Transfers between assets/liabilities (0.9) – – (0.9)Foreign currency translation 8.3 – (0.8) 7.5As at 31 December 2018 (173.6) (2.0) (15.7) (191.3)
Deferred tax assets recognised for tax losses carry-forward in accordance with the relevant local rules applying in our jurisdictions can be analysed as follows:
2018
€ million2017
€ million
Attributable to tax losses that expire within five years 1.6 5.5Attributable to tax losses that expire after five years – 0.1Attributable to tax losses that can be carried forward indefinitely 1.6 4.8Recognised deferred tax assets attributable to tax losses 3.2 10.4
The Group has unrecognised deferred tax assets attributable to tax losses that are available to carry forward against future taxable income of €13.4m (2017: €12.6m). These are analysed as follows:
2018
€ million2017
€ million
Attributable to tax losses that expire within five years 12.1 12.6Attributable to tax losses that expire after five years 1.3 –Unrecognised deferred tax assets attributable to tax losses 13.4 12.6
The aggregate amount of distributable reserves arising from the realised earnings of the Group’s operations was €2,271.5m in 2018 (2017: €2,071.6m). No deferred tax liabilities have been recognised on such reserves given that their distribution is controlled by the Group, or in the event of plans to remit overseas earnings of subsidiaries, such distribution would not give rise to a tax liability.
1712018 INTEGRATED ANNUAL REPORTSR
CG
FS
SSR
SI

11. Earnings per share
Accounting policy
Basic earnings per share is calculated by dividing the net profit attributable to the owners of the parent by the weighted average number of ordinary shares outstanding during the year. The weighted average number of ordinary shares outstanding during the year is the number of ordinary shares outstanding at the beginning of the year, adjusted by the number of ordinary shares bought back or issued during the year multiplied by a time-weighting factor. Diluted earnings per share incorporates stock options for which the average share price for the year is in excess of the exercise price of the stock option and there is a dilutive effect.
The calculation of the basic and diluted earnings per share attributable to the owners of the parent entity is based on the following data:2018 2017
Net profit attributable to the owners of the parent (€ million) 447.4 426.0Weighted average number of ordinary shares for the purposes of basic earnings per share (million) 367.9 364.7Effect of dilutive stock options (million) 2.2 2.9Weighted average number of ordinary shares for the purposes of diluted earnings per share (million) 370.1 367.6Basic earnings per share (€) 1.22 1.17Diluted earnings per share (€) 1.21 1.16
Outstanding stock options that have an anti-dilutive effect and therefore were excluded from diluted earnings per share in 2018 were €nil (2017: €1.0m).
12. Components of other comprehensive incomeThe components of other comprehensive income for the years ended 31 December comprise:
2018 2017
Before-tax€ million
Tax expense€ million
Net-of-tax€ million
Before-tax€ million
Tax expense€ million
Net-of-tax€ million
Available-for-sale financial assets – – – 0.1 – 0.1Cost of hedging (refer to Note 23) (5.3) – (5.3) – – –Cash flow hedges (refer to Note 23) 6.3 1.0 7.3 8.6 (0.3) 8.3Foreign currency translation (63.1) – (63.1) (219.2) – (219.2)Equity investments at fair value through other comprehensive income (0.3) 0.1 (0.2) – – –Actuarial gains 20.8 (3.4) 17.4 6.9 (2.2) 4.7Share of other comprehensive income / (loss) of equity method investments 0.6 – 0.6 (5.3) – (5.3)Other comprehensive loss (41.0) (2.3) (43.3) (208.9) (2.5) (211.4)
The majority of foreign currency translation impact for 2018 is related to the Russian rouble, while the majority of the impact for 2017 related to the Nigerian naira as well as the Russian rouble and the Swiss franc.
172 COCA-COLA HBC NOTES TO THE CONSOLIDATED FINANCIAL STATEMENTS CONTINUED

13. Intangible assets
Accounting policy
Intangible assets consist of goodwill, franchise agreements, trademarks and water rights. Goodwill and other indefinite-lived intangible assets are carried at cost less accumulated impairment losses, while intangible assets with finite lives are amortised over their useful economic lives. The useful lives, both finite and indefinite, assigned to intangible assets are evaluated on an annual basis.
Intangible assets with indefinite lives (‘not subject to amortisation’)
Intangible assets not subject to amortisation consist of goodwill, franchise agreements and trademarks.
Goodwill is the excess of the consideration transferred over the fair value of the share of net assets acquired. Goodwill and fair value adjustments arising on the acquisition of subsidiaries are treated as the assets and liabilities of those subsidiaries. These balances are denominated in the functional currency of the subsidiary and are translated to Euro on a basis consistent with the other assets and liabilities of the subsidiary.
The useful life of franchise agreements is usually based on the term of the respective franchise agreements. The Coca-Cola Company does not grant perpetual franchise rights outside the United States. However, given the Group’s strategic relationship with The Coca-Cola Company and consistent with past experience, the Group believes that franchise agreements will continue to be renewed at each expiration date with no significant costs. The Group has concluded that the franchise agreements are perpetual in nature and they have therefore been assigned indefinite useful lives.
The Group’s trademarks are assigned an indefinite useful life when they have an established sales history in the applicable region. It is the intention of the Group to receive a benefit from them indefinitely and there is no indication that this will not be the case.
Goodwill and other indefinite-lived intangible assets are tested for impairment annually and whenever there is an indication of impairment.
For the purpose of impairment testing, goodwill is allocated to each of the Group’s cash-generating units expected to benefit from the business combination in which the goodwill arose. Other indefinite-lived intangible assets are also allocated to the Group’s cash-generating units expected to benefit from those intangibles. The cash-generating units (‘unit’) to which goodwill and other indefinite-lived intangible assets have been allocated are tested for impairment annually, or more frequently when there is an indication that the unit may be impaired. If the recoverable amount (i.e. the higher of the value-in-use and fair value less costs to sell) of the cash-generating unit is less than the carrying amount of the unit, the impairment loss is allocated first to reduce the carrying amount of any goodwill allocated to the unit and then pro-rata to the other assets of the unit on the basis of the carrying amount of each asset in the unit. Impairment losses recognised against goodwill are not reversed in subsequent periods.
Intangible assets with finite lives
Intangible assets with finite lives mainly consist of water rights and premium spirits brands, are amortised over their useful economic lives and are carried at cost less accumulated amortisation and impairment losses. Intangible assets with finite lives are reviewed for impairment whenever events or changes in circumstances indicate that the carrying amount may not be recoverable.
Critical accounting estimates
Determining whether goodwill or indefinite-lived intangible assets are impaired requires an estimation of the value-in-use of the cash-generating units to which they have been allocated in order to determine the recoverable amount of the cash-generating units. The value-in-use calculation requires the Group to estimate the future cash flows expected to arise from the cash-generating unit and a suitable discount rate in order to calculate present value.
1732018 INTEGRATED ANNUAL REPORTSR
CG
FS
SSR
SI

13. Intangible assets continuedThe movements in intangible assets by class of assets during the year are as follows:
Goodwill€ million
Franchise agreements
€ millionTrademarks
€ million
Other intangible assets
€ millionTotal
€ million
Cost As at 1 January 2017 1,854.3 149.4 65.9 26.3 2,095.9Additions – – 1.8 – 1.8Foreign currency translation (50.7) (3.5) (3.0) – (57.2)As at 31 December 2017 1,803.6 145.9 64.7 26.3 2,040.5Amortisation As at 1 January 2017 182.4 – 8.9 18.9 210.2Charge for the year – – – 0.4 0.4As at 31 December 2017 182.4 – 8.9 19.3 210.6Net book value as at 1 January 2017 1,671.9 149.4 57.0 7.4 1,885.7Net book value as at 31 December 2017 1,621.2 145.9 55.8 7.0 1,829.9Cost As at 1 January 2018 1,803.6 145.9 64.7 26.3 2,040.5Additions – – 1.5 – 1.5Foreign currency translation 1.1 0.3 (6.5) – (5.1)As at 31 December 2018 1,804.7 146.2 59.7 26.3 2,036.9Amortisation As at 1 January 2018 182.4 – 8.9 19.3 210.6Charge for the year – – 0.1 0.4 0.5As at 31 December 2018 182.4 – 9.0 19.7 211.1Net book value as at 1 January 2018 1,621.2 145.9 55.8 7.0 1,829.9Net book value as at 31 December 2018 1,622.3 146.2 50.7 6.6 1,825.8
Intangible assets not subject to amortisation amounted to €1,816.1m (2017: €1,821.1m), and are presented in the charts below:
Goodwill: €1,621.2mFranchise agreements: €145.9mTrademarks: €54.0m
2017€1,821.1m
Goodwill: €1,622.3mFranchise agreements: €146.2mTrademarks: €47.6m
2018€1,816.1m
The carrying value of intangible assets subject to amortisation amounted to €9.7m (2017: €8.8m) and comprised water rights of €6.6m and trademarks of €3.1m.
174 COCA-COLA HBC NOTES TO THE CONSOLIDATED FINANCIAL STATEMENTS CONTINUED

Impairment tests for goodwill and other indefinite-lived intangible assets
The recoverable amount of each cash-generating unit was determined through a value-in-use calculation. That calculation uses cash flow projections based on financial budgets approved by the Board of Directors covering a one-year period and cash projections for four additional years. Cash flows for years two to five were projected by management based on operation and market specific high-level assumptions including growth rates, discount rates and forecast selling prices and direct costs. Management determined gross margins based on past performance, expectations for the development of the market and expectations about raw material costs. The growth rates used in perpetuity reflect the forecasts in line with management beliefs. These forecasts exceeded, in certain cases, those expected for the industry in general, due to the strength of our brand portfolio. Management estimates discount rates using rates that reflect current market assessments of the time value of money and risks specific to the countries of operation.
No impairment of goodwill and other indefinite-lived assets was indicated from the impairment tests of 2018 and 2017.
The following table sets forth the carrying value of goodwill and other indefinite-lived intangible assets for those cash-generating units whose carrying value is greater than 10% of the total, as at 31 December 2018.
Goodwill€ million
Franchise agreements
€ millionTrademarks
€ millionTotal
€ million
Italy 625.2 126.9 – 752.1Switzerland 408.0 – – 408.0The Republic of Ireland and Northern Ireland 236.0 – – 236.0All other cash-generating units 353.1 19.3 47.6 420.0Total 1,622.3 146.2 47.6 1,816.1
For the above cash-generating units, cash flows beyond the five-year period (the period in perpetuity) have been extrapolated using the following estimated growth and discount rates:
Sensitivity analysis
In the cash-generating unit of Nigeria, which held €20.7m of goodwill and franchise agreements as at 31 December 2018, possible changes in certain key assumptions of the 2018 impairment test would remove the remaining headroom. As at 31 December 2018, the recoverable amount of the Nigerian CGU calculated based on value-in-use exceeded carrying value by €430.6m; changes per assumption that would eliminate remaining headroom are summarised in the table below:
Average gross
profit marginGrowth rate in
perpetuityDiscount
rate
Nigeria 530bps 490bps 370bps
Italy: 41%Switzerland: 23%The Republic of Ireland andNorthern Ireland: 13%Other: 23%
Intangible assets not subject to amortisation as at 31 December 2018 (%) Growth rate in perpetuity
(%)Discount rate
(%)
2018 2017 2018 2017
Italy 2.5 2.5 7.0 6.7Switzerland 1.2 1.1 6.0 6.7The Republic of Ireland and Northern Ireland 2.9 2.9 6.0 6.8
1752018 INTEGRATED ANNUAL REPORTSR
CG
FS
SSR
SI
14. Property, plant and equipment
Accounting policy
All property, plant and equipment is initially recorded at cost and subsequently measured at cost less accumulated depreciation and impairment losses. Subsequent expenditure is added to the carrying value of the asset when it is probable that future economic benefits, in excess of the original assessed standard of performance of the existing asset, will flow to the operation and the costs can be measured reliably. All other subsequent expenditure is expensed in the period in which it is incurred.
Assets under construction are recorded as part of property, plant and equipment and depreciation on these assets commences when the assets are available for use.
The Coca-Cola Company, at its sole discretion, provides the Group with contributions towards the purchase of cold drink equipment. Payments are made on placement of coolers and are based on franchise incentive arrangements. The terms and conditions of these arrangements require reimbursement if certain conditions stipulated in the agreements are not met, including minimum volume through-put requirements. Support payments received from The Coca-Cola Company for the placement of cold drink equipment are deducted from the cost of the related asset.
Depreciation is calculated on a straight-line basis to allocate the depreciable amount over the estimated useful life of the assets as follows:
Freehold buildings and improvements 40 yearsLeasehold buildings and improvements Over the lease term, up to 40 yearsProduction equipment 4 to 20 yearsVehicles 5 to 8 yearsComputer hardware and software 3 to 10 yearsMarketing equipment 3 to 10 yearsFixtures and fittings 8 yearsReturnable containers 3 to 12 years
Freehold land is not depreciated as it is considered to have an indefinite life.
Deposits received for returnable containers by customers are accounted for as deposit liabilities (refer to Note 19).
Residual values and useful lives of assets are reviewed and adjusted if appropriate at each balance sheet date.
Property, plant and equipment is reviewed for impairment whenever events or changes in circumstances indicate that the carrying amount may not be recoverable. An impairment loss is recognised for the amount by which the carrying amount of the asset exceeds its recoverable amount, which is the higher of the asset’s fair value less cost to sell and its value-in-use. For the purposes of assessing impairment, assets are grouped at the lowest level of separately identifiable cash flows.
176 COCA-COLA HBC NOTES TO THE CONSOLIDATED FINANCIAL STATEMENTS CONTINUED

The movements of property, plant and equipment by class of assets are as follows:
Land andbuildings € million
Plant andequipment
€ million
Returnable containers
€ million
Assets under construction
€ millionTotal
€ million
Cost As at 1 January 2017 1,406.6 3,622.1 394.1 102.4 5,525.2Additions 6.0 142.2 34.7 232.6 415.5Disposals (18.9) (205.8) (17.1) – (241.8)Reclassified to assets held for sale (refer to Note 18) (40.7) (14.4) – – (55.1)Reclassifications 89.1 138.6 – (227.7) –Foreign currency translation (58.1) (157.6) (35.7) (14.6) (266.0)As at 31 December 2017 1,384.0 3,525.1 376.0 92.7 5,377.8Depreciation and impairment As at 1 January 2017 440.5 2,466.2 211.0 0.9 3,118.6Charge for the year 37.7 235.3 27.7 – 300.7Impairment 6.7 7.5 1.7 0.2 16.1Disposals (11.5) (202.8) (14.8) – (229.1)Reclassified to assets held for sale (refer to Note 18) (28.8) (12.1) – – (40.9)Foreign currency translation (13.2) (85.7) (10.7) – (109.6)As at 31 December 2017 431.4 2,408.4 214.9 1.1 3,055.8Net book value as at 31 December 2017 952.6 1,116.7 161.1 91.6 2,322.0Cost As at 1 January 2018 1,384.0 3,525.1 376.0 92.7 5,377.8Additions 10.4 177.9 34.8 235.1 458.2Disposals (7.3) (192.8) (15.7) (3.5) (219.3)Reclassified from assets held for sale (refer to Note 18) – 0.7 – – 0.7Reclassified to assets held for sale (refer to Note 18) (9.7) (3.6) – – (13.3)Reclassifications 48.2 174.9 1.3 (224.4) –Foreign currency translation (28.2) (84.1) 3.9 0.1 (108.3)As at 31 December 2018 1,397.4 3,598.1 400.3 100.0 5,495.8Depreciation and impairment As at 1 January 2018 431.4 2,408.4 214.9 1.1 3,055.8Charge for the year 37.4 242.3 25.4 – 305.1Impairment 5.1 6.8 1.7 – 13.6Disposals (3.7) (187.1) (10.3) – (201.1)Reclassified from assets held for sale (refer to Note 18) – 0.5 – – 0.5Reclassified to assets held for sale (refer to Note 18) (6.8) (2.2) – – (9.0)Foreign currency translation (8.8) (53.4) 1.5 – (60.7)As at 31 December 2018 454.6 2,415.3 233.2 1.1 3,104.2Net book value as at 31 December 2018 942.8 1,182.8 167.1 98.9 2,391.6
Assets under construction at 31 December 2018 include advances for equipment purchases of €13.3m (2017: €22.6m). Depreciation charge for the year included in operating expenses amounted to €142.3m (2017: €141.9m). Depreciation charge for the year included in cost of goods sold amounted to €162.8m (2017: €158.8m).
1772018 INTEGRATED ANNUAL REPORTSR
CG
FS
SSR
SI
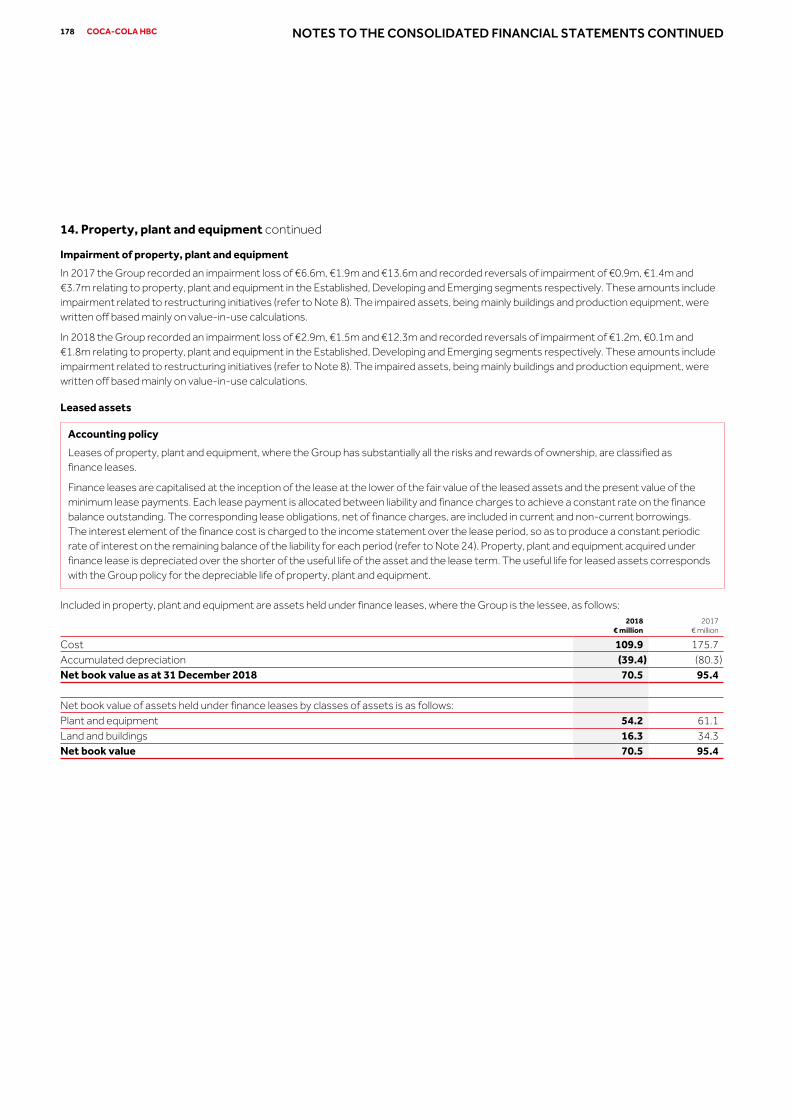
14. Property, plant and equipment continued
Impairment of property, plant and equipment
In 2017 the Group recorded an impairment loss of €6.6m, €1.9m and €13.6m and recorded reversals of impairment of €0.9m, €1.4m and €3.7m relating to property, plant and equipment in the Established, Developing and Emerging segments respectively. These amounts include impairment related to restructuring initiatives (refer to Note 8). The impaired assets, being mainly buildings and production equipment, were written off based mainly on value-in-use calculations.
In 2018 the Group recorded an impairment loss of €2.9m, €1.5m and €12.3m and recorded reversals of impairment of €1.2m, €0.1m and €1.8m relating to property, plant and equipment in the Established, Developing and Emerging segments respectively. These amounts include impairment related to restructuring initiatives (refer to Note 8). The impaired assets, being mainly buildings and production equipment, were written off based mainly on value-in-use calculations.
Leased assets
Accounting policy
Leases of property, plant and equipment, where the Group has substantially all the risks and rewards of ownership, are classified as finance leases.
Finance leases are capitalised at the inception of the lease at the lower of the fair value of the leased assets and the present value of the minimum lease payments. Each lease payment is allocated between liability and finance charges to achieve a constant rate on the finance balance outstanding. The corresponding lease obligations, net of finance charges, are included in current and non-current borrowings. The interest element of the finance cost is charged to the income statement over the lease period, so as to produce a constant periodic rate of interest on the remaining balance of the liability for each period (refer to Note 24). Property, plant and equipment acquired under finance lease is depreciated over the shorter of the useful life of the asset and the lease term. The useful life for leased assets corresponds with the Group policy for the depreciable life of property, plant and equipment.
Included in property, plant and equipment are assets held under finance leases, where the Group is the lessee, as follows:2018
€ million2017
€ million
Cost 109.9 175.7Accumulated depreciation (39.4) (80.3)Net book value as at 31 December 2018 70.5 95.4
Net book value of assets held under finance leases by classes of assets is as follows:Plant and equipment 54.2 61.1Land and buildings 16.3 34.3Net book value 70.5 95.4
178 COCA-COLA HBC NOTES TO THE CONSOLIDATED FINANCIAL STATEMENTS CONTINUED

15. Interests in other entities
List of principal subsidiaries
The following are the principal subsidiaries of the Group as at 31 December:
Country of registration
% of voting rights % ownership
2018 2017 2018 2017
AS Coca-Cola HBC Eesti Estonia 100.0% 100.0% 100.0% 100.0%CCB Management Services GmbH Austria 100.0% 100.0% 100.0% 100.0%CCHBC Armenia CJSC Armenia 90.0% 90. 0% 90.0% 90. 0%CCHBC Bulgaria AD Bulgaria 99.4% 99.4% 99.4% 99.4%CCHBC Insurance (Guernsey) Limited Guernsey 100.0% 100.0% 100.0% 100.0%CCHBC IT Services Limited Bulgaria 100.0% 100.0% 100.0% 100.0%Coca-Cola Beverages Austria GmbH Austria 100.0% 100.0% 100.0% 100.0%Coca-Cola Beverages Belorussiya Belarus 100.0% 100.0% 100.0% 100.0%Coca-Cola Beverages Ukraine Ltd Ukraine 100.0% 100.0% 100.0% 100.0%Coca-Cola Bottlers Chisinau S.R.L. Moldova 100.0% 100.0% 100.0% 100.0%Coca-Cola HBC B-H d.o.o. Sarajevo Bosnia and Herzegovina 100.0% 100.0% 100.0% 100.0%Coca-Cola HBC Česko a Slovensko, s.r.o.1 Czech Republic 100.0% 100.0% 100.0% 100.0%Coca-Cola HBC Česko a Slovensko, s.r.o. – organizačná zložka2 Slovakia 100.0% 100.0% 100.0% 100.0%Coca-Cola HBC Finance B.V. The Netherlands 100.0% 100.0% 100.0% 100.0%Coca-Cola HBC Greece S.A.I.C. Greece 100.0% 100.0% 100.0% 100.0%Coca-Cola HBC Holdings B.V. The Netherlands 100.0% 100.0% 100.0% 100.0%Coca-Cola HBC Hrvatska d.o.o. Croatia 100.0% 100.0% 100.0% 100.0%Coca-Cola HBC Hungary Ltd Hungary 100.0% 100.0% 100.0% 100.0%Coca-Cola HBC Ireland Limited Republic of Ireland 100.0% 100.0% 100.0% 100.0%Coca-Cola HBC Italia S.r.l. Italy 100.0% 100.0% 100.0% 100.0%Coca-Cola HBC Kosovo L.L.C. Kosovo 100.0% 100.0% 100.0% 100.0%Coca-Cola HBC Northern Ireland Limited Northern Ireland 100.0% 100.0% 100.0% 100.0%Coca-Cola HBC Polska sp. o.o. Poland 100.0% 100.0% 100.0% 100.0%Coca-Cola HBC Romania Ltd Romania 100.0% 100.0% 100.0% 100.0%Coca-Cola HBC Slovenija d.o.o. Slovenia 100.0% 100.0% 100.0% 100.0%Coca-Cola HBC Switzerland Ltd Switzerland 99.9% 99.9% 99.9% 99.9%Coca-Cola HBC-Srbija d.o.o. Serbia 100.0% 100.0% 100.0% 100.0%Coca-Cola Hellenic Bottling Company-Crna Gora d.o.o., Podgorica Montenegro 100.0% 100.0% 100.0% 100.0%Coca-Cola Hellenic Business Service Organisation Bulgaria 100.0% 100.0% 100.0% 100.0%Coca-Cola Hellenic Procurement GmbH Austria 100.0% 100.0% 100.0% 100.0%CC Beverages Holdings II B.V. The Netherlands 100.0% 100.0% 100.0% 100.0%Lanitis Bros Ltd Cyprus 100.0% 100.0% 100.0% 100.0%LLC Coca-Cola HBC Eurasia Russia 100.0% 100.0% 100.0% 100.0%Nigerian Bottling Company Ltd Nigeria 100.0% 100.0% 100.0% 100.0%SIA Coca-Cola HBC Latvia Latvia 100.0% 100.0% 100.0% 100.0%Star Bottling Limited Cyprus 100.0% 100.0% 100.0% 100.0%UAB Coca-Cola HBC Lietuva Lithuania 100.0% 100.0% 100.0% 100.0%
1. Effective 4 January 2017 Coca-Cola HBC Česka republika, s.r.o. was renamed Coca-Cola HBC Česko a Slovensko, s.r.o.2. Effective 1 April 2017 Coca-Cola HBC Slovenska republika, s.r.o was merged with Coca-Cola HBC Česko a Slovensko, s.r.o. – organizačná zložka, branch of Coca-Cola HBC
Česka republika, s.r.o.
1792018 INTEGRATED ANNUAL REPORTSR
CG
FS
SSR
SI

15. Interests in other entities continued
Associates and joint arrangements
Accounting policies
Investments in associates
Investments in associated undertakings are accounted for by the equity method of accounting. Associated undertakings are all entities over which the Group has significant influence but not control, generally accompanying a shareholding of between 20% to 50% of the voting rights.
The equity method of accounting involves recognising the Group’s share of the associates’ post-acquisition profit or loss and movements in other comprehensive income for the period in the income statement and other comprehensive income respectively. Unrealised gains and losses resulting from transactions between the Group and the associate are eliminated to the extent of the interest in the associate.
The Group’s interest in each associate is carried in the balance sheet at an amount that reflects its share of the net assets of the associate and includes goodwill on acquisition. When the Group’s share of losses in an associate equals or exceeds its interest in the associate, the Group does not recognise further losses, unless the Group has incurred obligations or made payments on behalf of the associate.
Investments in joint arrangements
Joint arrangements are arrangements in which the Group has contractually agreed sharing of control, which exists only when decisions about the relevant activities require unanimous consent. Joint arrangements are classified as joint ventures or joint operations depending upon the rights and obligations arising from the joint arrangement.
The Group classifies a joint arrangement as a joint venture when the Group has rights to the net assets of the arrangement. The Group accounts for its interests in joint ventures using the equity method of accounting as described in the section above.
The Group classifies a joint arrangement as a joint operation when the Group has the rights to the assets, and obligations for the liabilities, of the arrangement and accounts for each of its assets, liabilities, revenues and expenses, including its share of those held or incurred jointly, in relation to the joint operation.
If facts and circumstances change, the Group reassesses whether it still has joint control and whether the type of joint arrangement in which it is involved has changed.
Critical accounting judgements
The Group participates in several joint arrangements. Judgement is required in order to determine their classification as a joint venture where the Group has rights to the net assets of the arrangement, or a joint operation where the Group has rights to the assets and obligations for the liabilities of the arrangement. In making this judgement, consideration is given to the legal form of the arrangement, and the contractual terms and conditions, as well as other facts and circumstances (including the economic rationale of the arrangement and the impact of the legal framework).
180 COCA-COLA HBC NOTES TO THE CONSOLIDATED FINANCIAL STATEMENTS CONTINUED

a) Equity method investments
Changes in the carrying amounts of equity method investments are as follows:
Associates
€ millionJoint ventures
€ millionTotal
€ million
As at 1 January 2017 22.5 94.5 117.0Share of results of equity method investments 5.2 6.6 11.8Share of other comprehensive income of equity method investments (5.2) (0.1) (5.3)Share of total comprehensive income – 6.5 6.5Disposals (refer to Note 22) – (3.5) (3.5)Return of capital – (17.7) (17.7)Dividends (0.5) (5.0) (5.5)As at 31 December 2017 22.0 74.8 96.8Capital increase – 0.3 0.3Additions – 1.0 1.0Share of results of equity method investments 5.1 7.7 12.8Share of other comprehensive income of equity method investments 0.5 0.1 0.6Share of total comprehensive income 5.6 7.8 13.4Return of capital – (0.9) (0.9)Dividends (2.8) (8.5) (11.3)As at 31 December 2018 24.8 74.5 99.3
Included in investment in associates is the Group’s investment in Frigoglass Industries Limited and Frigoglass West Africa Ltd. The Group has an effective interest of 23.9% in both Frigoglass Industries Limited (2017: 23.9%) and Frigoglass West Africa Ltd (2017: 23.9%) through its investment in Nigeria Bottling Company Ltd.
In 2017, Frigoglass Industries Nigeria Limited and Frigoglass West Africa Ltd became guarantors under the amended banking facilities and notes issued by the Frigoglass Group, as part of the debt restructuring of the latter. The Group has no direct exposure arising from these guarantee arrangements, but the Group’s investment in these associates, which stood at €21.2m as at 31 December 2018, would be at potential risk if there was a default under the terms of the amended banking facilities or the notes and the Frigoglass Group (including the guarantors) was unable to meet its obligations thereunder.
During 2018, the Group reorganised its Water business joint operation in Serbia, which resulted in an increase to investments in joint ventures of €1.0m.
Investments in joint ventures
The Group has a significant joint venture with Heineken that is conducted through a number of legal entities being the BrewTech B.V. Group of companies, which is engaged in the bottling and distribution of soft drinks and beer in FYROM and the Brewinvest S.A. Group of companies which has minimal activity. BrewTech B.V. is incorporated in the Netherlands and the Group owns 50% (2017: 50%) of its share capital. Brewinvest S.A., parent company of Brewinvest S.A. Group of companies, which has minimal other activities, is incorporated in Greece and the Group owns 50% (2017: 50%) of its share capital. The structure of the joint venture provides the Group with rights to their net assets.
1812018 INTEGRATED ANNUAL REPORTSR
CG
FS
SSR
SI

15. Interests in other entities continuedSummarised financial information of the Group’s significant joint venture is as follows (the information below reflects the amount presented in the IFRS financial statements of the joint venture, and not the Group’s share in those amounts):
2018
€ million2017
€ million
Summarised balance sheet: Non-current assets 51.9 56.1Cash and cash equivalents 2.4 5.4Other current assets 19.2 7.8Total current assets 21.6 13.2Other current liabilities (including trade payables) (15.5) (11.2)Total current liabilities (15.5) (11.2)Non-current other liabilities (0.2) (0.1)Net assets 57.8 58.0 Summarised statement of comprehensive income: Revenue 67.2 61.8Depreciation and amortisation (3.3) (5.0)Interest income – 0.2Profit before tax 16.8 13.9Income tax expense (2.0) (1.7)Profit after tax 14.8 12.2Other comprehensive income – 0.1Total comprehensive income 14.8 12.3Dividends received and capital returns (refer to Note 26) 7.4 19.3 Reconciliation of net assets to carrying amount: Closing net assets 57.8 58.0Interest in joint venture at 50% 28.9 29.0Goodwill 16.9 16.9Non-controlling interest (1.6) (1.7)Carrying value 44.2 44.2
Summarised financial information on the Group’s investment in other joint ventures is as follows:
2018
€ million2017
€ million
Carrying amount 30.3 30.6Share of profit 0.3 0.5Share of other comprehensive income 0.1 (0.1)Share of total comprehensive income 0.4 0.4
The Group’s share of profit in other joint ventures includes restructuring initiatives within joint ventures of € nil (2017: €0.2m).
182 COCA-COLA HBC NOTES TO THE CONSOLIDATED FINANCIAL STATEMENTS CONTINUED

b) Joint operations with TCCC
The Group has a 50% interest in the Multon Z.A.O. group of companies (‘Multon’). Multon is engaged in the production and distribution of juices in Russia and is classified as a joint operation as the arrangement gives the Group rights to the assets and obligations for the liabilities relating to the joint arrangement. Other joint operations of the Group comprise mainly a 50% interest in each of the water businesses depicted below, which are engaged in the production and distribution of water in the respective countries.Country Joint operation Country Joint operation
Austria Römerquelle Poland MultivitaItaly Fonti del Vulture Switzerland ValserRomania Dorna Serbia VlasinkaBaltics Neptūno Vandenys
16. Inventories
Accounting policy
Inventories are stated at the lower of cost and net realisable value.
Cost for raw materials and consumables is determined on a weighted average basis. Cost for work in progress and finished goods is comprised of the cost of direct materials and labour plus attributable overhead costs. Cost of inventories includes all costs incurred to bring the product to its present location and condition.
Net realisable value is the estimated selling price in the ordinary course of business, less the estimated costs necessary to complete and sell the inventory.
Inventories consisted of the following at 31 December:
2018
€ million2017
€ million
Finished goods 219.5 197.7Raw materials and work in progress 176.6 151.4Consumables 67.1 67.7Total inventories 463.2 416.8
The amount of inventories recognised as an expense during 2018 was €3,196.8m (2017: €3,154.6m). During 2018 provision of obsolete inventories recognised as an expense amounted to €20.3m (2017: €10.6m), whereas provision reversed in the year amounted to €2.5m (2017: €1.2m).
17. Trade, other receivables and assets
Accounting policies
Trade receivables are amounts due from customers for goods sold or services performed in the ordinary course of business. They are initially recognised at fair value and subsequently measured at amortised cost using the effective interest rate method. The normal credit term is 7-90 days upon delivery.
The Group has applied the simplified approach for trade and other receivables upon the adoption of IFRS 9 and follows an Expected Credit Losses (‘ECLs’) approach for measuring the allowance of its trade receivables. The expected loss rate is assessed on the basis of historical credit losses of 24 months before 31 December 2018 and adjusted to reflect current and forward-looking information. ECLs are based on the difference between the contractual cash flows due in accordance with the contract and all the cash flows that the Group expects to receive. The carrying amount of the receivable is reduced by the amount of the provision, which is recognised as part of operating expenses. If a trade receivable ultimately becomes uncollectible, it is written off initially against any provision made in respect of that receivable with any excess recognised as part of operating expenses. Subsequent recoveries of amounts previously written off or provisions no longer required are credited against operating expenses.
Loans are initially recognised at the fair value net of transaction costs incurred. After initial recognition, all interest-bearing loans are subsequently measured at amortised cost. Amortised cost is calculated using the effective interest rate method whereby any discount, premium or transaction costs associated with a loan are amortised to the income statement over the borrowing period.
1832018 INTEGRATED ANNUAL REPORTSR
CG
FS
SSR
SI

17. Trade, other receivables and assets continuedTrade, other receivables and assets consisted of the following as at 31 December:
Current assets Non-current assets
2018
€ million2017
€ million2018
€ million2017
€ million
Trade and other receivables: Trade receivables 690.3 688.7 1.5 2.0Receivables from related parties (refer to Note 26) 81.1 89.8 – –Loans to related parties (refer to Note 26) 3.5 3.6 – –Loans receivable 1.0 1.2 2.3 0.7Receivables from sale of property, plant and equipment 6.6 2.8 – –Loans and advances to employees 5.2 5.5 – –Other receivables 78.9 72.3 – –Total trade and other receivables 866.6 863.9 3.8 2.7Other assets: Prepayments 63.7 72.9 13.1 14.6Pension plan assets (refer to Note 20) – – 11.8 2.0Non-current income tax receivable – – 17.2 8.5 VAT and other taxes receivable 34.4 30.0 – – Total other assets 98.1 102.9 42.1 25.1Total trade, other receivables and assets 964.7 966.8 45.9 27.8
Non-current trade receivables relate to re-negotiated receivables, which are expected to be settled within the new contractual due date.
Current assets classified within the categories ‘held-to-maturity’ and ‘at amortised cost’ in 2017 are recorded as ‘Other financial assets’ in the consolidated balance sheet (refer to Note 23 – ‘Financial instruments categories’).
Trade receivables classified as current assets consisted of the following at 31 December:
2018
€ million2017
€ million
Trade receivables 789.1 792.3Less: Provision for doubtful debts (98.8) (103.6)Total trade receivables 690.3 688.7
Trade receivables classified as current assets are as follows:
2018
€ million2017
€ million
Within due date 569.3 576.8Less: Provision for doubtful debts within due date (3.0) (3.4)Past due 219.8 215.5Less: Provision for doubtful debts past due (95.8) (100.2)Total trade receivables 690.3 688.7
The carrying amount of the trade receivables includes €0.3m which is subject to factoring agreement (2017: €0.3m). The Group continues to recognise the factored receivables in their entirety as it has retained the significant risks of ownership. The amount payable under the factoring agreement is presented within borrowings (refer to Note 24).
184 COCA-COLA HBC NOTES TO THE CONSOLIDATED FINANCIAL STATEMENTS CONTINUED

The ageing analysis of past due trade receivables is as follows:
2018
€ million
Up to three
monthsThree to six
monthsSix to nine
monthsMore than nine
months Total
Trade receivables past due but not impaired 100.1 7.1 3.0 13.8 124.0Trade receivables past due and impaired 3.9 2.7 1.6 87.6 95.8Total trade receivables past due 104.0 9.8 4.6 101.4 219.8
2017
€ million
Up to three
monthsThree to six
monthsSix to nine
monthsMore than nine
months Total
Trade receivables past due but not impaired 103.8 2.3 2.0 7.2 115.3Trade receivables past due and impaired 4.4 7.5 5.0 83.3 100.2Total trade receivables past due 108.2 9.8 7.0 90.5 215.5
The movement in the provision for doubtful debts during the year is as follows:
2018
€ million2017
€ million
As at 1 January (103.6) (92.0)Amounts written off during the year 1.5 5.3Amounts recovered during the year 9.1 6.0Increase in allowance recognised in income statement (6.1) (23.6)Foreign currency translation 0.3 0.7As at 31 December (98.8) (103.6)
There was no additional doubtful debts provision recognised on transition to IFRS 9 as a result of applying the expected credit loss model.
Receivables from related parties
The related party receivables, net of the provision for doubtful debts, are as follows:
2018
€ million2017
€ million
Within due date 72.4 85.7Past due 8.8 4.4Less: Provision for doubtful debts (0.1) (0.3)Total related party receivables 81.1 89.8
As at 31 December 2018, related party receivables of €8.7m (2017: €4.1m) were past due but not impaired. The ageing analysis of these receivables is as follows:
2018
€ million2017
€ million
Up to three months 7.4 3.3Three to six months 0.7 0.2Six to nine months 0.3 0.1More than nine months 0.3 0.5Total 8.7 4.1
Net impairment
Net impairment (gain)/loss on trade and other receivables recognised in the income statement is analysed as follows:
2018
€ million2017
€ million
Trade receivables (3.2) 17.3Receivables from related parties (0.1) 0.3Other receivables and assets (0.4) 3.7Net impairment (gain)/loss (3.7) 21.3
1852018 INTEGRATED ANNUAL REPORTSR
CG
FS
SSR
SI
18. Assets classified as held for sale
Accounting policy
Non-current assets and disposal groups are classified as held for sale if it is considered highly probable that their carrying amount will be principally recovered through a sale transaction rather than through continuing use. This condition is regarded as met only when the sale is highly probable and the asset (or disposal group) is available for immediate sale in its present condition. In order for a sale to be considered highly probable, management must be committed to a plan to sell the asset, an active programme to locate a buyer and complete the plan must have been initiated, and the sale expected to be completed within one year from the date of classification.
In the event that the criteria for continued classification as held for sale are no longer met, the assets are reclassified to property, plant and equipment and the depreciation charge is adjusted for the depreciation that would have been recognised had the assets not been classified as held for sale.
Non-current assets and disposal groups classified as held for sale are measured at the lower of the individual assets’ previous carrying amount and their fair value less costs to sell.
Changes in carrying amounts of assets classified as held for sale for the years ended 31 December are as follows:2018
€ million2017
€ million
As at 1 January 3.3 11.8Reclassified from property, plant and equipment (refer to Note 14) 4.3 14.2Disposals (4.5) (22.5)Reclassified to property, plant and equipment (refer to Note 14) (0.2) –Foreign currency translation 0.1 (0.2)As at 31 December 3.0 3.3
Total assets classified as held for sale as at 31 December 2017 amounted to €3.3m comprising the net book value of property, plant and equipment in our Established, Developing and Emerging markets that have been written down to fair value less cost to sell. The fair value of assets classified as held for sale was determined through the use of a sales comparison approach and is a non-recurring fair value measurement within Level 3 of the fair value hierarchy.
Total assets classified as held for sale as at 31 December 2018 amounted to €3.0m comprising the net book value of property, plant and equipment in our Established and Emerging markets that have been written down to fair value less cost to sell. The fair value of assets classified as held for sale was determined through the use of a sales comparison approach and is a non-recurring fair value measurement within Level 3 of the fair value hierarchy.
19. Trade and other payables
Accounting policy
Trade payables are recognised initially at fair value and subsequently measured at amortised cost using the effective interest rate method.
Trade and other payables consisted of the following at 31 December:2018
€ million2017
€ million
Trade payables 565.5 563.3Accrued liabilities 461.0 428.1Payables to related parties (refer to Note 26) 270.8 300.9Deposit liabilities 95.7 94.0Other tax and social security liabilities 90.3 84.8Salaries and employee related payables 39.0 41.8Contract liabilities 4.5 6.2Payable for purchase of own shares (refer to Note 25) 85.4 –Other payables 40.2 25.3Total trade and other payables 1,652.4 1,544.4
186 COCA-COLA HBC NOTES TO THE CONSOLIDATED FINANCIAL STATEMENTS CONTINUED

In 2017 an amount of €6.2m regarding contract liabilities has been reclassified from line ‘Trade payables’ to line ‘Contract liabilities’ and €1.0m regarding deferred income has been included in line ‘Other payables’.
Payable for purchase of own shares of €85.4m equivalent in UK sterling relates to the liability from an irrevocable share purchase agreement entered into in December 2018 (refer to Note 25).
Accrued liabilities regarding volume, marketing and promotional incentives as well as listing fees and other incentives provided to customers as at 31 December 2018 amounted to €182.1m (2017: €175.2m).
20. Provisions and employee benefitsProvisions and employee benefits consisted of the following at 31 December:
2018
€ million2017
€ million
Current: Employee benefits 59.2 61.8Restructuring provisions 10.9 7.7Other provisions 7.5 14.1Total current provisions and employee benefits 77.6 83.6 Non-current: Employee benefits 111.1 118.7Other provisions 1.1 1.5Total non-current provisions and employee benefits 112.2 120.2Total provisions and employee benefits 189.8 203.8
a) Provisions
Accounting policy
Provisions are recognised when: the Group has a present obligation (legal or constructive) as a result of a past event; it is probable that an outflow of resources embodying economic benefits will be required to settle the obligation; and a reliable estimate can be made of the amount of the obligation.
Where the Group expects a provision to be reimbursed, for example under an insurance contract, the reimbursement is recognised as a separate asset only when such reimbursement is virtually certain. If the effect of the time value of money is material, provisions are determined by discounting the expected future cash flows at a pre-tax rate that reflects current market assessments of the time value of money and the risks specific to the liability.
The movements in restructuring and other provisions comprise:
2018
€million2017
€million
Restructuring
provision Other provisionsRestructuring
provision Other provisions
As at 1 January 7.7 15.6 8.5 16.1Arising during the year 24.2 1.9 19.3 5.4Utilised during the year (19.2) (6.0) (17.3) (4.2)Unused amount reversed (1.7) (2.9) (2.5) (1.6)Foreign currency translation (0.1) – (0.3) (0.1)As at 31 December 10.9 8.6 7.7 15.6
Other provisions comprise a provision for employee litigation of €2.5m (2017: €3.2m) and other items of €6.1m (2017: €12.4m).
1872018 INTEGRATED ANNUAL REPORTSR
CG
FS
SSR
SI

20. Provisions and employee benefits continued
b) Employee benefits
Accounting policies
Employee benefits
The Group operates a number of defined benefit and defined contribution pension plans in its territories.
The defined benefit plans are made up of both funded and unfunded pension plans and employee leaving indemnities. The assets of funded plans are generally held in separate trustee-administered funds and are financed by payments from employees and/or the relevant Group companies.
The liability recognised in the balance sheet in respect of defined benefit plans is the present value of the defined benefit obligation at the balance sheet date less the fair value of the plan assets.
For defined benefit pension plans, pension costs are assessed using the projected unit credit method. Actuarial gains and losses arising from experience adjustments and changes in actuarial assumptions are charged or credited to equity in other comprehensive income in the period in which they arise. Such actuarial gains and losses are not reclassified to the income statement in subsequent periods. The defined benefit obligations are measured at the present value of the estimated future cash outflows using interest rates of high-quality corporate bonds that are denominated in the currency in which the benefits will be paid, and that have terms approximating to the terms of the related obligation. In countries where there is no deep market in such bonds, the market rates on government bonds are used. Past service cost is recognised immediately in the income statement. A number of the Group’s operations have other long-service benefits in the form of jubilee plans. These plans are measured at the present value of the estimated future cash outflows with immediate recognition of actuarial gains and losses in the income statement.
The Group’s contributions to the defined contribution pension plans are charged to the income statement in the period to which the contributions relate.
Termination benefits
Termination benefits are payable whenever an employee’s employment is terminated before the normal retirement date or whenever an employee accepts voluntary redundancy in exchange for these benefits. The Group recognises termination benefits at the earlier of the following dates: a) when the Group can no longer withdraw the offer of those benefits and b) when the Group recognises costs for a restructuring that is within the scope of IAS 37 Provisions, Contingent Liabilities and Contingent Assets and involves the payment of termination benefits. In the case of an offer made to encourage voluntary redundancy, the termination benefits are measured based on the number of employees expected to accept the offer.
Critical accounting estimates
The Group provides defined benefit pension plans as an employee benefit in certain territories. Determining the value of these plans requires several actuarial assumptions and estimates about discount rates, future salary increases and future pension increases. Due to the long-term nature of these plans, such estimates are subject to significant uncertainty.
Employee benefits consisted of the following at 31 December:2018
€ million2017
€ million
Defined benefit plans:Employee leaving indemnities 64.6 68.9Pension plans 10.1 27.7Long service (jubilee plans) and other benefits 9.8 7.4Total defined benefit plans 84.5 104.0Other employee benefits:Annual leave 6.1 7.5Other employee benefits 79.7 69.0Total other employee benefits 85.8 76.5Total employee benefits obligations 170.3 180.5
188 COCA-COLA HBC NOTES TO THE CONSOLIDATED FINANCIAL STATEMENTS CONTINUED

Other employee benefits are primarily comprised of employee bonuses including a management incentive plan which is a cash variable plan that operates over a three-year period.
Employees of Coca-Cola HBC’s subsidiaries in Austria, Bulgaria, Croatia, Greece, Italy, Montenegro, Nigeria, Poland, Romania, Serbia and Slovenia are entitled to employee leaving indemnities, generally based on each employee’s length of service, employment category and remuneration. These are unfunded plans where the Company meets the payment obligation as it falls due.
Coca-Cola HBC’s subsidiaries in Austria, Greece, Northern Ireland, the Republic of Ireland and Switzerland sponsor defined benefit pension plans. Of the three plans in the Republic of Ireland, two have plan assets, as do the two plans in Northern Ireland, one plan in Greece and two plans in Switzerland. The Greek plan, which was not significant, was closed in 2018. The Austrian plans do not have plan assets and the Company meets the payment obligation as it falls due. The defined benefit plans in Austria, Republic of Ireland and Northern Ireland are closed to new members.
Coca-Cola HBC provides long-service benefits in the form of jubilee plans to its employees in Austria, Croatia, Nigeria, Poland, Slovenia and Switzerland.
Defined benefit obligation by segment is as follows for the years ended 31 December:
€67.6m
€15.7m
€2.6m
€2.7m
€14.3m
€85.6m
Established Developing Emerging
Total €84.5m
Total €104.0m
2018
2017
The average duration of the defined benefit obligations is 18 years and the total employer contributions expected to be paid in 2019 are €17.1m.
Reconciliation of defined benefit obligations:
2018
€ million2017
€ million
Present value of defined benefit obligations at 1 January 489.6 525.6Current service cost 8.8 8.8Interest cost 8.7 9.0Plan participants’ contributions 4.7 4.4Past service cost 3.3 (0.2)Curtailment/settlement 0.7 (6.8)Benefits paid (23.9) (26.5)Loss from change in demographic assumptions (10.9) –Loss from change in financial assumptions (23.1) 6.1Experience adjustments 3.6 (3.5)Foreign currency translation 5.8 (27.3)Present value of defined benefit obligations at 31 December 467.3 489.6
1892018 INTEGRATED ANNUAL REPORTSR
CG
FS
SSR
SI

20. Provisions and employee benefits continuedReconciliation of plan assets:
2018
€ million2017
€ million
Fair value of plan assets at 1 January 395.9 401.4Interest income on plan assets 5.2 5.3Return on plan assets excluding interest income (14.2) 18.9Actual employer’s contributions 13.6 12.9Actual participants’ contributions 4.6 4.4Actual benefits paid (12.9) (18.6)Settlement – (5.7)Administrative expenses (0.2) (0.3)Foreign currency translation 6.2 (22.4)Fair value of plan assets at 31 December 398.2 395.9Opening unrecognised asset due to the asset ceiling (8.3) –Change in asset ceiling 5.1 (8.3)Exchange rate (gain)/loss (0.3) –Interest on unrecognised asset recognised in profit or loss (0.1) –Fair value of plan assets at 31 December including asset ceiling 394.6 387.6
The present value and funded status of defined benefit obligations were as follows at 31 December:
2018
€ million2017
€ million
Present value of funded obligations 391.3 411.3Fair value of plan assets (398.2) (395.9)Defined benefit obligations of funded plans (6.9) 15.4Present value of unfunded obligations 76.0 78.3Unrecognised asset due to asset ceiling 3.6 8.3Defined benefit obligations 72.7 102.0Plus: amounts recognised within non-current assets (refer to Note 17) 11.8 2.0Total defined benefit obligations 84.5 104.0
Funding levels are monitored in conjunction with the agreed contribution rate. The funding level of the funded plans as at 31 December 2018 was 101% (2017: 94%).
Two of the plans have a funded status surplus of € 11.8m as at 31 December 2018 (2017: € 2.0m) that is recognised as an asset on the basis that the Group has an unconditional right to future economic benefits via either a refund or a reduction in future contributions.
The movement in the defined benefit obligation recognised on the balance sheet was as follows:
2018
€ million2017
€ million
Defined benefit obligations as at 1 January 102.0 124.2Expense recognised in the income statement 16.0 10.4Remeasurements recognised in OCI (20.8) (6.9)Employer contributions (13.6) (12.9)Benefits paid (11.0) (7.9)Foreign currency translation 0.1 (4.9)Defined benefit obligations as at 31 December 72.7 102.0Plus: amounts recognised within non-current assets (refer to Note 17) 11.8 2.0Total defined benefit obligations as at 31 December 84.5 104.0
190 COCA-COLA HBC NOTES TO THE CONSOLIDATED FINANCIAL STATEMENTS CONTINUED

The expense recognised in the income statement comprised the following for the years ended 31 December:
2018
€ million2017
€ million
Service cost 12.8 7.5Net interest cost on defined benefit liability / (asset) 3.5 3.7Actuarial gains (0.5) (1.1)Administrative expenses 0.2 0.3Total 16.0 10.4
Defined benefit plan expense is included in staff costs and presented in cost of goods sold and operating expenses.
The assumptions (weighted average for the Group) used in computing the defined benefit obligation comprised the following for the years ended 31 December:
2018
%2017
%
Discount rate 2.0 1.8Rate of compensation increase 2.5 2.7Rate of pension increase 1.0 1.1Life expectancy for pensioners at the age of 65 in years: Male 22 22Female 24 24
Asset liability matching: Plan assets allocated to growth assets are monitored regularly to ensure they remain appropriate and in line with the Group’s long-term strategy to manage the plans. As the plans mature, the level of investment risk will be reduced by investing more in assets such as bonds that better match the liabilities.
Pension plan assets are invested in different asset classes in order to maintain a balance between risk and return. Investments are well diversified to limit the financial effect of the failure of any individual investment. Through its defined benefit plans the Group is exposed to a number of risks, as outlined below:
Asset volatility: The liabilities are calculated using a discount rate set with reference to corporate bond yields; if assets underperform this yield, a deficit will be created. The Northern Ireland, Republic of Ireland and Swiss plans hold a significant proportion of growth assets (equities) which are expected to outperform corporate bonds in the long term while providing volatility and risk in the short term.
Changes in bond yields: A decrease in corporate bond yields will increase the plan liabilities, although this will be partially offset by an increase in the value of the plans’ bond holdings, whereas an increase in corporate bond yields will decrease the plan liabilities, although this will be partially offset by a decrease in the value of the plans’ bond holdings.
Inflation: The Northern Ireland, Republic of Ireland and Swiss plans’ benefit obligations are linked to inflation, and higher inflation will lead to higher liabilities (although, in most cases, caps on the level of inflationary increases are in place to protect against extreme inflation). The majority of the assets are either unaffected by or loosely correlated with inflation, meaning that an increase in inflation will also increase the deficit.
Life expectancy: The majority of the pension plans’ obligations are to provide benefits for the life of the member, so increases in life expectancy will result in an increase in the liabilities.
1912018 INTEGRATED ANNUAL REPORTSR
CG
FS
SSR
SI
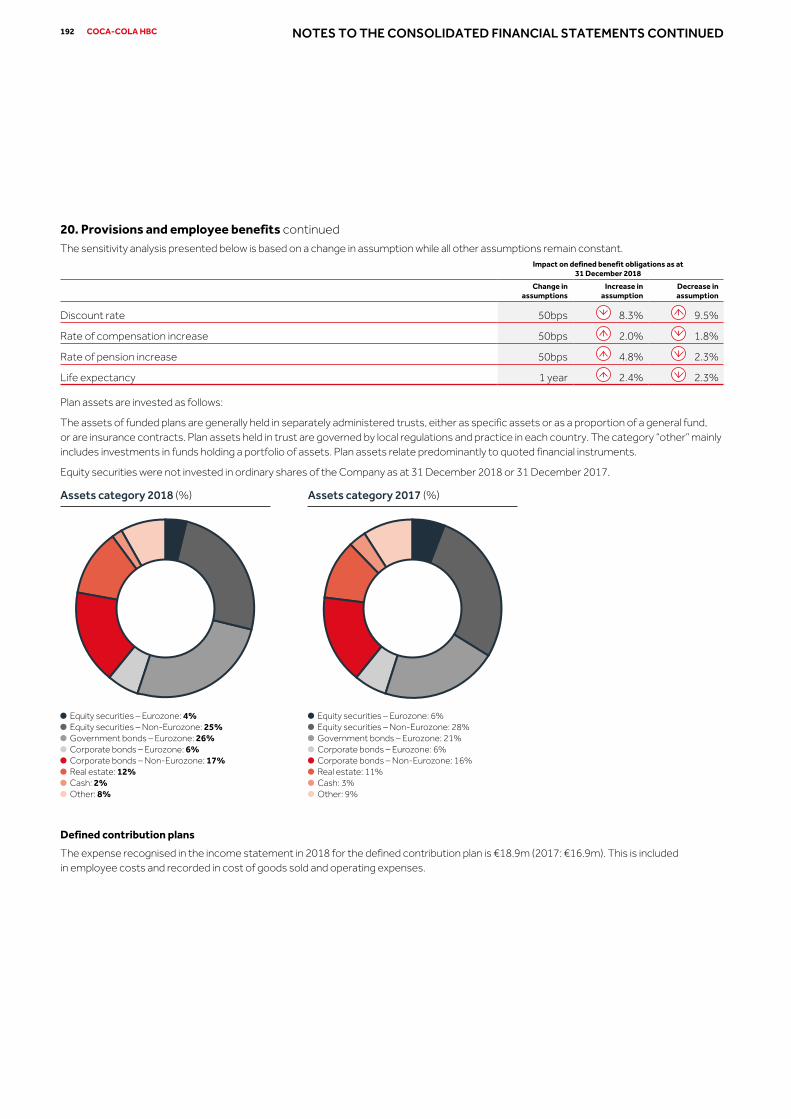
20. Provisions and employee benefits continuedThe sensitivity analysis presented below is based on a change in assumption while all other assumptions remain constant.
Impact on defined benefit obligations as at
31 December 2018
Change in
assumptionsIncrease in
assumptionDecrease in assumption
Discount rate 50bps 8.3% 9.5%
Rate of compensation increase 50bps 2.0% 1.8%
Rate of pension increase 50bps 4.8% 2.3%
Life expectancy 1 year 2.4% 2.3%
Plan assets are invested as follows:
The assets of funded plans are generally held in separately administered trusts, either as specific assets or as a proportion of a general fund, or are insurance contracts. Plan assets held in trust are governed by local regulations and practice in each country. The category “other” mainly includes investments in funds holding a portfolio of assets. Plan assets relate predominantly to quoted financial instruments.
Equity securities were not invested in ordinary shares of the Company as at 31 December 2018 or 31 December 2017.
Defined contribution plans
The expense recognised in the income statement in 2018 for the defined contribution plan is €18.9m (2017: €16.9m). This is included in employee costs and recorded in cost of goods sold and operating expenses.
Equity securities – Eurozone: 6%Equity securities – Non-Eurozone: 28%Government bonds – Eurozone: 21%Corporate bonds – Eurozone: 6%Corporate bonds – Non-Eurozone: 16%Real estate: 11%Cash: 3%Other: 9%
Equity securities – Eurozone: 4%Equity securities – Non-Eurozone: 25%Government bonds – Eurozone: 26%Corporate bonds – Eurozone: 6%Corporate bonds – Non-Eurozone: 17%Real estate: 12%Cash: 2%Other: 8%
Assets category 2018 (%) Assets category 2017 (%)
192 COCA-COLA HBC NOTES TO THE CONSOLIDATED FINANCIAL STATEMENTS CONTINUED

21. Offsetting financial assets and financial liabilities
Accounting policy
The Group offsets financial assets and financial liabilities to the net amount reported in the balance sheet when it currently has a legally enforceable right to offset the recognised amounts and it intends to settle on a net basis or to realise the asset and settle the liability simultaneously. The legally enforceable right must not be contingent on future events and must be enforceable in the normal course of business and in the event of default, insolvency or bankruptcy of the Company or the counterparty.
The Group enters into derivative transactions under International Swaps and Derivatives Association (ISDA) master netting agreements or other similar agreements. In general, under such agreements the counterparties can elect to settle into one single net amount the aggregated amounts owed by each counterparty on a single day in respect of all outstanding transactions of the same currency and the same type of derivative. In the event of default or early termination all outstanding transactions under the agreement are terminated and subject to any set-off. These agreements do not meet all of the IAS 32 criteria for offsetting in the balance sheet as the Group does not have any current legally enforceable right to offset amounts since the right can only be applied if elected by both counterparties.
The financial assets and financial liabilities presented below are subject to offsetting, enforceable master netting or similar agreements. The column ‘Net amount’ shows the impact on the Group’s balance sheet if all set-off rights were exercised.
a) Financial assets
As at 31 December 2018
Related amounts not set off in the
balance sheet
Gross amounts of recognised
financial assets€ million
Gross amounts of recognised
financial liabilities set off in the
balance sheet€ million
Net amounts of financial assets
presented in the balance sheet
€ million
Financial instruments
€ millionNet amount
€ million
Derivative financial assets 9.4 – 9.4 (4.9) 4.5Cash and cash equivalents 712.3 – 712.3 – 712.3Other financial assets (excluding derivatives) 278.8 – 278.8 – 278.8Trade receivables 749.6 (59.3) 690.3 – 690.3Total 1,750.1 (59.3) 1,690.8 (4.9) 1,685.9
As at 31 December 2017
Related amounts not set off in the
balance sheet
Gross amounts of recognised financial
assets€ million
Gross amounts of recognised financial
liabilities set off in the balance sheet
€ million
Net amounts of financial assets
presented in the balance sheet
€ million
Financial instruments
€ millionNet amount
€ million
Derivative financial assets 16.4 – 16.4 (5.0) 11.4Cash and cash equivalents 723.5 – 723.5 – 723.5Other financial assets (excluding derivatives) 150.9 – 150.9 – 150.9Trade receivables 757.2 (68.5) 688.7 – 688.7Total 1,648.0 (68.5) 1,579.5 (5.0) 1,574.5
1932018 INTEGRATED ANNUAL REPORTSR
CG
FS
SSR
SI

21. Offsetting financial assets and financial liabilities continued
b) Financial liabilitiesAs at 31 December 2018
Related amounts not set off in the
balance sheet
Gross amounts of recognised
financial liabilities€ million
Gross amounts of recognised
financial assets set off in the balance
sheet€ million
Net amounts of financial liabilities
presented in the balance sheet
€ million
Financial instruments
€ millionNet amount
€ million
Derivative financial liabilities 17.9 – 17.9 (4.9) 13.0Trade payables 624.8 (59.3) 565.5 – 565.5Total 642.7 (59.3) 583.4 (4.9) 578.5
As at 31 December 2017
Related amounts not set off in the
balance sheet
Gross amounts of recognised financial
liabilities€ million
Gross amounts of recognised financial assets set off in the
balance sheet€ million
Net amounts of financial liabilities presented in the
balance sheet€ million
Financial instruments
€ millionNet amount
€ million
Derivative financial liabilities 5.4 – 5.4 (5.0) 0.4Trade payables 638.0 (68.5) 569.5 – 569.5Total 643.4 (68.5) 574.9 (5.0) 569.9
22. Business combinationsAccounting policy
The acquisition method of accounting is used to account for business combinations. The consideration transferred is the fair value of any asset transferred, shares issued and liabilities assumed. The consideration transferred includes the fair value of any asset or liability resulting from a contingent consideration arrangement. Identifiable assets acquired and liabilities and contingent liabilities assumed are measured initially at their fair values at the acquisition date. The excess of the consideration transferred and the fair value of non-controlling interest over the net assets acquired and liabilities assumed is recorded as goodwill. All acquisition-related costs are expensed as incurred.
For each business combination, the Group elects whether it measures the non-controlling interest in the acquiree either at fair value or at the proportionate share of the acquiree’s identifiable net assets.
In December 2016, TCCC acquired 50% of the share capital of Neptūno Vandenys, UAB, a wholly owned subsidiary of the Group, for a total consideration of €10.3m, of which €9.8m was received in 2016 and the remaining in 2017 and is included in line ‘Net receipts from equity investments’ in the consolidated cash flow statement. This transaction resulted in a joint venture between the Group and TCCC. The gain on the transaction was immaterial.
During 2017, following the successful completion of the reorganisation of Neptūno Vandenys, UAB joint venture with TCCC, the Group obtained control over net assets of the joint venture amounting to €3.5m, with a corresponding decrease in the carrying amount of the investment in the joint venture (refer to Note 15a).
194 COCA-COLA HBC NOTES TO THE CONSOLIDATED FINANCIAL STATEMENTS CONTINUED

23. Financial risk management and financial instruments
Accounting policies
Financial assets
On initial recognition financial assets are recorded at fair value plus, in the case of financial assets not at fair value through profit and loss (FVTPL), any directly attributable transaction costs. Transaction costs of financial assets at FVTPL are expensed.
Financial assets are classified into three categories:
a) Financial assets at amortised cost (debt instruments)
The classification of debt instruments at amortised cost depends on two criteria: a) the Group’s business model for managing assets and b) whether the instruments’ contractual cash flows represent solely payments for principal and interest on the principal amount outstanding (the ‘SPPI criterion‘). If both criteria are met the financial assets of the Group are subsequently measured at amortised cost whereby any interest income is recognised using the effective interest method. This category includes trade receivables, treasury bills and time deposits. The accounting policy for trade receivables is described in Note 17.
b) Financial assets through other comprehensive income (FVOCI)
The Group has also investments in financial assets at fair value through other comprehensive income. These include equity investments that are not of a trading nature and which are subsequently recorded at fair value. The Group intends to hold these equity instruments for the foreseeable future and has irrevocably elected to classify them as FVOCI upon initial recognition. Subsequently there is no recycling of gains or losses to profit or loss on derecognition.
c) Financial assets through profit and loss (FVTPL)
The Group has also investments in financial assets at FVTPL which are subsequently measured at fair value and where changes in fair value are recognised in the income statement. Financial assets at FVTPL mainly comprise money market funds.
For those financial assets that are not subsequently held at fair value, the Group assesses whether there is evidence of impairment at each balance sheet date.
Derivative financial instruments
The Group uses derivative financial instruments, including currency, commodity and interest rate derivatives, to manage currency, commodity price and interest rate risk associated with the Group’s underlying business activities. The Group does not enter into derivative financial instruments for trading activity purposes.
All derivative financial instruments are initially recognised on the balance sheet at fair value and are subsequently remeasured at their fair value. Changes in the fair value of derivative financial instruments are recognised at each reporting date either in the income statement or in equity, depending on whether the derivative financial instrument qualifies for hedge accounting, and if so, whether it qualifies as a fair value hedge or a cash flow hedge.
Embedded derivatives in financial host contracts are recorded at fair value through profit or loss together with the host contracts.
Derivatives embedded in non-financial host contracts are accounted for as separate derivatives and recorded at fair value if:
· their economic characteristics and risks are not closely related to those of the host contracts;
· the host contracts are not designated as at fair value through profit or loss; and
· a separate instrument with the same terms as the embedded derivative meets the definition of a derivative.
These embedded derivatives are measured at fair value with changes in fair value recognised in profit or loss. Reassessment only occurs if there is either a change in the terms of the contract that significantly modifies the cash flows that would otherwise be required or a reclassification of a financial asset out of the fair value through profit or loss.
All derivative financial instruments that are not part of an effective hedging relationship (undesignated hedges) are classified as assets or liabilities at fair value through profit or loss (‘FVTPL’).
1952018 INTEGRATED ANNUAL REPORTSR
CG
FS
SSR
SI

23. Financial risk management and financial instruments continued
Accounting policies continued
At the inception of a hedge transaction the Group documents the relationship between the hedging instrument and the hedged item, as well as its risk management objective and strategy for undertaking the hedge transaction. This process includes linking the derivative financial instrument designated as a hedging instrument to the specific asset, liability, firm commitment or forecast transaction. The Group has established a hedge ratio of 1:1 for the hedging relationships as the underlying risks of the hedging instruments are identical to the hedged risks component. The economic relationship between the hedged item and the hedging instrument is assessed on an ongoing basis. Ineffectiveness may arise if the timing or the notional amount of the forecast transaction changes or if the credit risk changes, impacting the fair value movements of the hedging instruments.
Changes in the fair value of derivative financial instruments (both the intrinsic value and the aligned time value) that are designated and effective as hedges of future cash flows are recognised directly in other comprehensive income and the ineffective portion is recognised immediately in the income statement. Amounts accumulated in equity are recycled to the income statement as the related asset acquired or liability assumed affects the income statement.
Hedge accounting is discontinued when the hedging instrument expires or is sold, terminated, exercised, or no longer qualifies for hedge accounting. At that time, any cumulative gain or loss on the hedging instrument recognised in equity is retained in equity until the forecast transaction occurs. If a hedged transaction is no longer expected to occur, the net cumulative gain or loss recognised in equity is transferred to the income statement.
Regular purchases and sales of investments are recognised on the trade date, which is the day the Group commits to purchase or sell. The investments are recognised initially at fair value plus transaction costs, except in the case of FVTPL. For investments traded in active markets, fair value is determined by reference to stock exchange quoted bid prices. For other investments, fair value is estimated by reference to the current market value of similar instruments or by reference to the discounted cash flows of the underlying net assets.
Financial risk factors
The Group’s activities expose it to a variety of financial risks: market risk (including foreign currency risk, commodity price risk, interest rate risk), credit risk, liquidity risk and capital risk. The Group’s overall risk management programme focuses on the volatility of financial markets and seeks to minimise potential adverse effects on the Group’s cash flows. The Group uses derivative financial instruments to hedge certain risk exposures. Risk management is carried out by Group Treasury in a controlled manner, consistent with the Board of Directors’ approved policies. Group Treasury identifies, evaluates and hedges financial risks in close co-operation with the Group’s subsidiaries. The Board of Directors has approved the Treasury Policy which provides the control framework for all treasury and treasury-related transactions.
Market risk
a) Foreign currency risk
The Group is exposed to the effect of foreign currency risk on future transactions, recognised monetary assets and liabilities that are denominated in currencies other than the local entity’s functional currency, as well as net investments in foreign operations. Foreign currency forward, option and future contracts are used to hedge a portion of the Group’s foreign currency risk. The majority of the foreign currency forward, option and future contracts have maturities of less than one year after the balance sheet date. The foreign currency risk arising from the investment in foreign operations is not hedged.
Management has set up a policy that requires Group companies to manage their foreign exchange risk against their functional currency. To manage their foreign exchange risk arising from future transactions and recognised monetary assets and liabilities, entities in the Group use foreign currency forward, option and future contracts transacted by Group Treasury. Group Treasury’s risk management policy is to hedge, on an average coverage ratio basis, between 25% and 80% of anticipated cash flows for the next 12 months by using a layer strategy and 100% of balance sheet re-measurement risk in each major foreign currency for which hedging is applicable. Each subsidiary designates contracts with Group Treasury as fair value hedges or cash flow hedges, as appropriate. External foreign exchange contracts are designated at Group level as hedges of foreign exchange risk on specific monetary assets, monetary liabilities or future transactions on a gross basis.
The following tables present details of the Group’s sensitivity to reasonably possible increases and decreases in the Euro and US dollar against the relevant foreign currencies. In determining reasonably possible changes, the historical volatility over a 12-month period of the respective foreign currencies in relation to the Euro and the US dollar has been considered. The sensitivity analysis determines the potential gains and losses in the income statement or equity arising from the Group’s foreign exchange positions as a result of the corresponding percentage increases and decreases in the Group’s main foreign currencies relative to the Euro and the US dollar. The sensitivity analysis includes outstanding foreign currency denominated monetary items, external loans, and loans between operations within the Group where the denomination of the loan is in a currency other than the functional currency of the local entity.
196 COCA-COLA HBC NOTES TO THE CONSOLIDATED FINANCIAL STATEMENTS CONTINUED
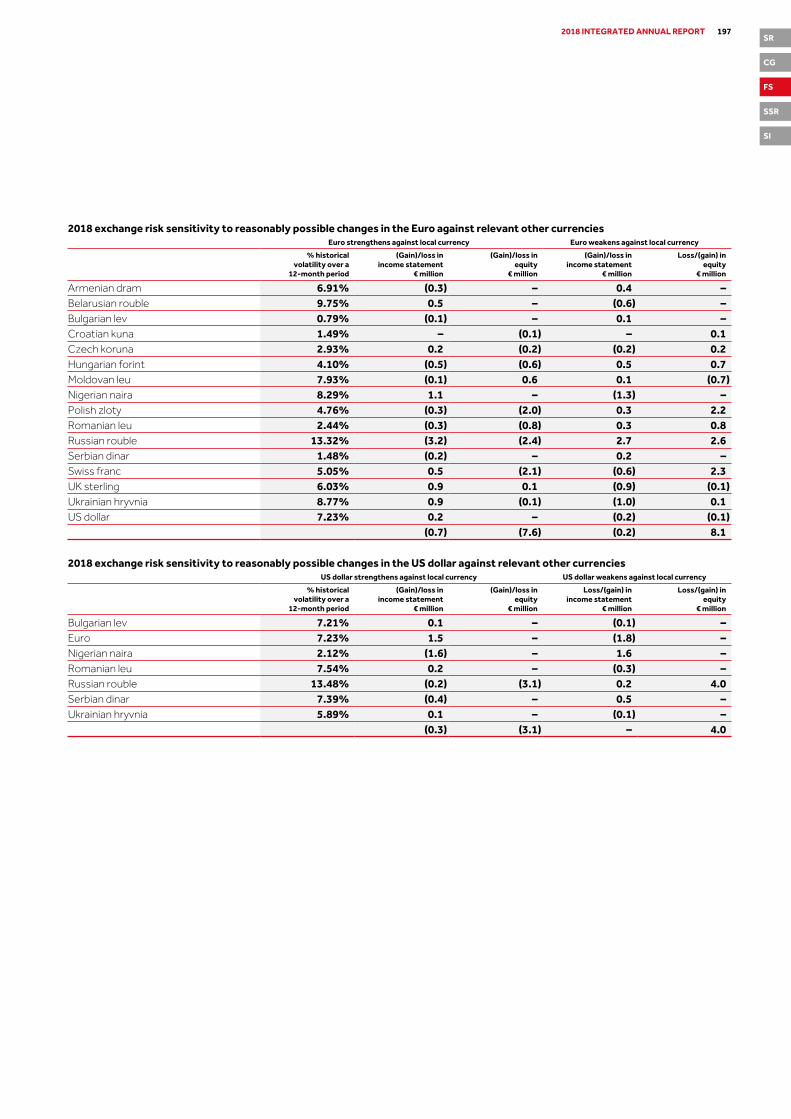
2018 exchange risk sensitivity to reasonably possible changes in the Euro against relevant other currencies Euro strengthens against local currency Euro weakens against local currency
% historicalvolatility over a
12-month period
(Gain)/loss in income statement
€ million
(Gain)/loss inequity
€ million
(Gain)/loss inincome statement
€ million
Loss/(gain) inequity
€ million
Armenian dram 6.91% (0.3) – 0.4 –Belarusian rouble 9.75% 0.5 – (0.6) –Bulgarian lev 0.79% (0.1) – 0.1 –Croatian kuna 1.49% – (0.1) – 0.1Czech koruna 2.93% 0.2 (0.2) (0.2) 0.2Hungarian forint 4.10% (0.5) (0.6) 0.5 0.7Moldovan leu 7.93% (0.1) 0.6 0.1 (0.7)Nigerian naira 8.29% 1.1 – (1.3) –Polish zloty 4.76% (0.3) (2.0) 0.3 2.2Romanian leu 2.44% (0.3) (0.8) 0.3 0.8Russian rouble 13.32% (3.2) (2.4) 2.7 2.6Serbian dinar 1.48% (0.2) – 0.2 –Swiss franc 5.05% 0.5 (2.1) (0.6) 2.3UK sterling 6.03% 0.9 0.1 (0.9) (0.1)Ukrainian hryvnia 8.77% 0.9 (0.1) (1.0) 0.1US dollar 7.23% 0.2 – (0.2) (0.1) (0.7) (7.6) (0.2) 8.1
2018 exchange risk sensitivity to reasonably possible changes in the US dollar against relevant other currencies US dollar strengthens against local currency US dollar weakens against local currency
% historicalvolatility over a
12-month period
(Gain)/loss in income statement
€ million
(Gain)/loss inequity
€ million
Loss/(gain) inincome statement
€ million
Loss/(gain) inequity
€ million
Bulgarian lev 7.21% 0.1 – (0.1) –Euro 7.23% 1.5 – (1.8) –Nigerian naira 2.12% (1.6) – 1.6 –Romanian leu 7.54% 0.2 – (0.3) –Russian rouble 13.48% (0.2) (3.1) 0.2 4.0Serbian dinar 7.39% (0.4) – 0.5 –Ukrainian hryvnia 5.89% 0.1 – (0.1) – (0.3) (3.1) – 4.0
1972018 INTEGRATED ANNUAL REPORTSR
CG
FS
SSR
SI

23. Financial risk management and financial instruments continued2017 exchange risk sensitivity to reasonably possible changes in the Euro against relevant other currencies
Euro strengthens against local currency Euro weakens against local currency
% historicalvolatility over a
12-month period
Loss/(gain) in income statement
€ million
(Gain)/loss inequity
€ million
(Gain)/loss inincome statement
€ million
Loss/(gain) inequity
€ million
Armenian dram 7.26% (0.5) – 0.6 –Bulgarian lev 0.59% (0.1) – 0.1 –Croatian kuna 1.95% 0.1 (0.1) (0.1) 0.1Czech koruna 3.46% (1.1) (0.3) 1.2 0.3Hungarian forint 3.54% 0.4 (0.3) (0.4) 0.3FYROM dinar 4.06% – – 0.1 –Moldovan leu 7.76% (0.2) 0.6 0.2 (0.7)Nigerian naira 22.76% 4.4 – (6.9) –Polish zloty 4.56% (0.2) (1.9) 0.2 2.1Romanian leu 2.83% 0.4 (1.2) – 0.4Russian rouble 12.10% 0.6 (3.3) 2.0 0.7Serbian dinar 2.24% 0.1 – – –Swiss franc 4.89% 0.6 (1.1) (0.6) 1.2UK sterling 8.17% 0.2 0.2 (0.2) (0.2)Ukrainian hryvnia 10.25% 1.0 – (1.3) –US dollar 7.34% (0.5) 0.3 0.6 (0.3) 5.2 (7.1) (4.5) 3.9
2017 exchange risk sensitivity to reasonably possible changes in the US dollar against relevant other currencies US dollar strengthens against local currency US dollar weakens against local currency
% historicalvolatility over a
12-month period
Loss/(gain) in income statement
€ million
(Gain)/loss inequity
€ million
Loss/(gain) inincome statement
€ million
Loss/(gain) inequity
€ million
Bulgarian lev 7.28% 0.1 – (0.1) –Euro 7.34% 1.6 – (1.8) –Hungarian forint 8.74% 0.1 – (0.1) –Nigerian naira 21.07% (1.7) – 2.0 –Romanian leu 7.65% 0.2 – (0.3) –Russian rouble 11.04% 2.7 (9.7) 1.1 5.1Serbian dinar 7.49% (0.1) – 0.1 –Ukrainian hryvnia 6.68% 0.1 – (0.1) – 3.0 (9.7) 0.8 5.1
198 COCA-COLA HBC NOTES TO THE CONSOLIDATED FINANCIAL STATEMENTS CONTINUED

b) Commodity price risk
The Group is affected by the volatility of certain commodity prices (being mainly sugar, aluminium, aluminium premium, PET and gas oil) in relation to certain raw materials necessary for the production of the Group’s products.
Due to the significantly increased volatility of commodity prices, the Group’s Board of Directors has developed and enacted a risk management strategy regarding commodity price risk and its mitigation. Although the Group continues to contract prices with suppliers in advance, to reduce its exposure to the effect of short-term changes in the price of sugar, aluminium, aluminium premium, gas oil and PET, the Group hedges the market price of sugar, aluminium, aluminium premium, PET and gas oil using commodity swap contracts based on a rolling forecast for a period up to 36 months. The Group Treasury’s Risk management policy is to hedge a minimum of 25% and a maximum of 80% of commodity exposure for the next 12 months except for PET where no minimum coverage is required and the maximum is at 50% for the first year.
The following table presents details of the Group’s income statement and equity sensitivity to increases and decreases in sugar, aluminium, aluminium premium, PET and gas oil prices. The table does not show the sensitivity to the Group’s total underlying commodity exposure or the impact of changes in volumes that may arise from increases or decreases in the respective commodity prices. The sensitivity analysis determines the potential effect on profit or loss and equity arising from the Group’s commodity swap contract positions as a result of the reasonably possible increases or decreases in the respective commodity price.
2018 commodity price risk sensitivity to reasonably possible changes in the commodity price of relevant commodities
Commodity price increases withall other variables held constant
Commodity price decreases withall other variables held constant
% historical volatility over a 12-month period
per contract maturity
(Gain)/loss inincome statement
€ million
(Gain)/loss inequity
€ million
Loss/(gain) inincome statement
€ million
Loss/(gain) inequity
€ million
Sugar 19.5% (0.3) (5.1) 0.3 5.1Aluminium 24.0% (0.1) (12.2) 0.1 12.2Aluminium premium 29.6% – (0.5) – 0.5Gas oil 24.2% – (2.9) – 2.9PET 22.2% (10.1) – 10.1 – (10.5) (20.7) 10.5 20.7
2017 commodity price risk sensitivity to reasonably possible changes in the commodity price of relevant commodities
Commodity price increases withall other variables held constant
Commodity price decreases withall other variables held constant
% historical volatilityover a 12-month period
per contract maturity
(Gain)/loss inincome statement
€ million
(Gain)/loss inequity
€ million
Loss/(gain) inincome statement
€ million
Loss/(gain) inequity
€ million
Sugar 19.3% (8.8) – 8.8 –Aluminium 15.4% (5.2) (1.1) 5.2 1.1Aluminium premium 18.0% (0.3) – 0.3 –Gas oil 22.7% (2.2) – 2.2 – (16.5) (1.1) 16.5 1.1
1992018 INTEGRATED ANNUAL REPORTSR
CG
FS
SSR
SI

23. Financial risk management and financial instruments continued
c) Interest rate risk
The sensitivity analysis in the following table has been determined based on exposure to interest rates of both derivative and non-derivative instruments existing at the balance sheet date and assuming constant foreign exchange rates. For floating rate liabilities, the analysis is prepared assuming the amount of liability outstanding at the balance sheet date was outstanding for the whole year. A 50 basis point increase or decrease for 2018 (2017: 50 basis point) represents management’s assessment of a reasonably possible change in interest rates.
Interest rate risk sensitivity to reasonably possible changes in interest rates
2018
€ million2017
€ million
Loss/(gain)in income
statement(Gain)/loss
In equity
Loss/(gain)in income
statement(Gain)/loss
In equity
Increase in basis points 0.3 (6.8) 0.1 –Decrease in basis points 2.0 – (0.1) –
The impact in the Group’s equity is attributable to the changes in the fair value of the swaptions entered in 2018 and designated as hedging instruments in a cash flow hedge.
Credit risk
Credit risk is the risk of financial loss to the Group if a customer or counterparty to a financial instrument fails to meet its obligations under the contract or arrangement. The Group has limited concentration of credit risk across trade and financial counterparties. Credit policies are in place and the exposure to credit risk is monitored on an ongoing basis.
The Group’s maximum exposure to credit risk in the event that counterparties fail to perform their obligations at 31 December 2018 in relation to each class of recognised financial asset is the carrying amount of those assets as indicated on the balance sheet.
Under the credit policies, before accepting any new credit customers, the Group investigates the potential customer’s credit quality, using either external agencies and in some cases bank references and/or historic experience, and defines credit limits for each customer. Customers that fail to meet the Group’s benchmark credit quality may transact with the Group only on a prepayment or cash basis. Customers are reviewed on an ongoing basis and credit limits are adjusted accordingly. There is no significant concentration of credit risk with regards to loans, trade and other receivables as the Group has a large number of customers which are geographically dispersed.
The Group has policies that limit the amount of credit exposure to any single financial institution. The Group only undertakes investment and derivative transactions with banks and financial institutions that have a minimum credit rating of ‘BBB-’ from Standard & Poor’s and ‘Baa3’ from Moody’s, unless the investment is in countries where the Sovereign Credit Rating is below the ‘BBB-/Baa3’. The Group also uses Credit Default Swaps of a counterparty in order to measure in a timelier way the creditworthiness of a counterparty and set up its counterparties in tiers in order to assign maximum exposure and tenor per tier. If the Credit Default Swaps of a certain counterparty exceed 400 basis points the Group will stop trading derivatives with that counterparty and will try to cancel any deposits on a best-effort basis. In addition, the Group regularly makes use of time deposits and money market funds to invest excess cash balances and to diversify its counterparty risk. As at 31 December 2018, an amount of €594.6m (2017: € 476.8m) is invested in time deposits and money market funds (refer to Note 24).
200 COCA-COLA HBC NOTES TO THE CONSOLIDATED FINANCIAL STATEMENTS CONTINUED

Liquidity risk
The Group actively manages liquidity risk to ensure there are sufficient funds available for any short-term and long-term commitments. Bank overdrafts and bank facilities, both committed and uncommitted, are used to manage this risk.
The Group manages liquidity risk by maintaining adequate cash reserves and committed banking facilities, access to the debt and equity capital markets, and by continuously monitoring forecast and actual cash flows. In Note 24, the undrawn facilities that the Group has at its disposal to manage liquidity risk are discussed under the headings ‘commercial paper programme’ and ‘committed credit facilities’.
The following tables detail the Group’s remaining contractual maturities for its financial liabilities. The tables include both interest and principal undiscounted cash flows, assuming that interest rates remain constant from 31 December 2018.
Up to one year€ million
One to two years
€ million
Two to five years
€ million
Overfive years
€ millionTotal
€ million
Borrowings 159.5 853.0 67.1 644.6 1,724.2Derivative liabilities 16.6 1.3 – – 17.9Trade and other payables 1,557.6 0.1 0.2 6.3 1,564.2As at 31 December 2018 1,733.7 854.4 67.3 650.9 3,306.3
Up to one year€ million
One to two years
€ million
Two to five years
€ million
Overfive years
€ millionTotal
€ million
Borrowings 203.3 41.6 887.7 668.6 1,801.2Derivative liabilities 4.5 0.9 – – 5.4Trade and other payables 1,458.8 0.2 1.0 5.3 1,465.3As at 31 December 2017 1,666.6 42.7 888.7 673.9 3,271.9
Capital risk
The Group monitors its financial capacity and credit ratings by reference to a number of key financial ratios including net debt to comparable adjusted EBITDA, which provides a framework within which the Group’s capital base is managed. This ratio is calculated as net debt divided by comparable adjusted EBITDA.
Adjusted EBITDA is calculated by adding back to operating profit the depreciation and impairment of property, plant and equipment, the amortisation and impairment of intangible assets, the employee share option and performance share costs and other non-cash items, if any. Comparable adjusted EBITDA refers to adjusted EBITDA excluding restructuring expenses and the unrealised gains or losses resulting from the mark-to-market valuation of derivatives and embedded derivatives related to commodity hedging.
Refer to Note 24 for the definition of net debt.
The Group’s objectives when managing capital are to safeguard the Group’s ability to continue as a going concern and to maintain an optimal capital structure to reduce the cost of capital.
In order to maintain or adjust the capital structure, the Group may increase or decrease debt, issue or buy back shares, adjust the amount of dividends paid to shareholders, or return capital to shareholders.
The Group’s goal is to maintain a conservative financial profile. This is evidenced by the credit ratings maintained with Standard & Poor’s and Moody’s. Rating agency Publication date Long-term debt Outlook Short-term debt
Standard and Poor’s April 2018 BBB+ Positive A2Moody’s October 2018 Baa1 Stable P2
The Group’s medium-to long-term target is to maintain the net debt to comparable adjusted EBITDA ratio within a 1.5 to 2.0 range.
2012018 INTEGRATED ANNUAL REPORTSR
CG
FS
SSR
SI

23. Financial risk management and financial instruments continuedThe ratios as at 31 December were as follows:
2018
€ million2017
€ million
Net debt (refer to Note 24) 613.3 751.8Operating profit 639.4 589.8Depreciation and impairment of property, plant and equipment 318.7 316.8Amortisation of intangible assets 0.5 0.4Employee stock options and performance shares 10.1 20.8Other non-cash items included in operating income – (0.3)Adjusted EBITDA 968.7 927.5Other restructuring expenses (primarily redundancy costs) 23.1 19.5Unrealised loss on commodity derivatives 8.5 2.3Total comparable adjusted EBITDA 1,000.3 949.3Net debt / comparable adjusted EBITDA ratio 0.61 0.79
The reconciliation of other restructuring expenses to total restructuring expenses for the years ended 31 December was as follows:
2018
€ million2017
€ million
Total restructuring expenses (refer to Note 8) 32.8 28.9Less: Impairment of property, plant and equipment (9.7) (9.4)Other restructuring expenses (primarily redundancy costs) 23.1 19.5
202 COCA-COLA HBC NOTES TO THE CONSOLIDATED FINANCIAL STATEMENTS CONTINUED

Hedging activity
The carrying amount of the derivative financial instruments are included in lines ‘Other financial assets’ and ‘Other financial liabilities’ of the consolidated balance sheet.
a) Cash flow hedges
The impact of the hedging instruments and hedge items on the consolidated balance sheet was:
As at 31 December 2018Notional amount
€ millionCarrying amount
€ millionPeriod of
maturity date
Contracts with positive fair values 434.4 4.5 Non-current 1.4 0.1 Commodity swap contracts 1.4 0.1 Jan20-Oct20Current 433.0 4.4 Foreign currency forward contracts 78.3 2.1 Jan19-Dec19Interest rate contracts 350.0 2.2 Dec19Commodity swap contracts 4.7 0.1 Jan19-Dec19
Contracts with negative fair values 216.0 (11.5)
Non-current 19.7 (1.3) Commodity swap contracts 19.7 (1.3) Jan20-Nov20Current 196.3 (10.2) Foreign currency forward contracts 120.5 (1.1) Jan19-Dec19Commodity swap contracts 75.8 (9.1) Jan19-Dec19
As at 31 December 2017Notional amount
€ millionCarrying amount
€ millionPeriod of
maturity date
Contracts with positive fair values 120.4 3.6 Current 120.4 3.6 Foreign currency forward contracts 57.3 0.7 Jan18-Dec18Foreign currency option contracts 58.2 2.3 Jan18-Jun18Commodity swap contracts 4.9 0.6 Jan18-Dec18
Contracts with negative fair values 107.5 (1.6)
Current 107.5 (1.6) Foreign currency forward contracts 107.5 (1.6) Jan18-Dec18
The impact on the hedging reserve as a result of applying cash flow hedge accounting was:
Spot component of foreign currency
forward contracts
Intrinsic value of foreign currency option contracts
Cost of hedging reserve of currency
derivativesCommodity swap
contractsInterest rate swap
contracts Total
Opening balance 1 January 2017 (3.6) (0.1) – 0.2 (50.2) (53.7)Net gain of cash flow hedges 1.6 (0.1) – 0.7 6.4 8.6
Change in fair value of hedging (9.4) 1.2 – 1.2 – (7.0) Reclassified to profit or loss 1.2 (1.3) – – 6.4 6.3 Reclassified to the cost of inventory 9.8 - – (0.5) – 9.3
Closing balance 31 December 2017 (2.0) (0.2) – 0.9 (43.8) (45.1)Net gain of cash flow hedges 9.2 2.1 – (11.2) 6.2 6.3
Change in fair value of hedging 8.9 2.6 – (11.2) (0.2) 0.1 Reclassified to profit or loss 0.3 (0.5) – – 6.4 6.2
Cost of hedging recognised in OCI – – (3.5) – (1.8) (5.3)Reclassified to the cost of inventory (7.0) (1.7) 3.0 (0.2) – (5.9) Closing balance 31 December 2018 0.2 0.2 (0.5) (10.5) (39.4) (50.0)
As of 1 January 2018 the transfer of cash flow hedge reserve to the cost of inventory is performed directly from equity.
2032018 INTEGRATED ANNUAL REPORTSR
CG
FS
SSR
SI

23. Financial risk management and financial instruments continuedThe effect of the cash flow hedges in the consolidated income statement was:
2018Loss/(Gain)
€million
2017Loss/(Gain)
€million
Net amount reclassified from other comprehensive income to cost of goods sold (0.2) (0.1)Net amount reclassified from other comprehensive income to finance costs 6.4 6.4Total 6.2 6.3
There was no significant ineffectiveness on the cash flow hedges during the years ended 31 December 2018 and 2017, in relation to cash flow hedges.
b) Fair value hedges
The fair value of the foreign currency and option contracts designated as fair value hedging instruments was €nil in 2018 (2017: €0.5m net loss).
c) Undesignated hedges
The fair values of derivative financial instruments as at 31 December which economically hedge Group’s risks and for which hedge accounting has not been applied were:
As at 31 December 2018Notional amount
€ millionCarrying amount
€ millionPeriod of
maturity date
Contracts with positive fair values 296.4 4.9 Non-current 54.2 1.6 Embedded derivatives 54.2 1.6 Jan 19-May21Current 242.2 3.3 Foreign currency forward contracts 160.7 3.2 Jan 19-Dec19Foreign currency future contracts 81.5 0.1 Jun19-Nov19
Contracts with negative fair values (165.4) (6.4)
Current (165.4) (6.4) Foreign currency forward contracts (215.4) (2.9) Jan 19-Dec19Commodity swap contracts 50.0 (3.5) Jan 19-Dec19
As at 31 December 2017Notional amount
€ millionCarrying amount
€ millionPeriod of
maturity date
Contracts with positive fair values 202.2 12.8 Non-current 91.2 4.4 Commodity swap contracts 18.2 1.8 Jan19-May20Embedded derivatives 73.0 2.6 Jan18-Aug21Current 111.0 8.4 Foreign currency forward contracts 27.2 0.9 Jan18-Dec18Foreign currency option contracts 33.0 0.9 Jan18-Jun18Foreign currency future contracts 5.6 1.2 Jan 18Commodity swap contracts 45.2 5.4 Jan18-Dec18
Contracts with negative fair values 22.8 (3.8)
Non-current 12.5 (0.9) Commodity swap contracts 12.5 (0.9) Jan19-May20Current 10.3 (2.9) Foreign currency forward contracts (1.5) (1.6) Jan18-Dec18Commodity swap contracts 11.8 (1.3) Jan18-Dec18
The effect of the undesignated hedges in the consolidated income statement was:
2018Loss/(Gain)
€million
2017Loss/(Gain)
€million
Net amount recognised in cost of goods sold 8.7 4.6Net amount recognised in operating expenses (6.3) (6.3)Total 2.4 (1.7)
204 COCA-COLA HBC NOTES TO THE CONSOLIDATED FINANCIAL STATEMENTS CONTINUED
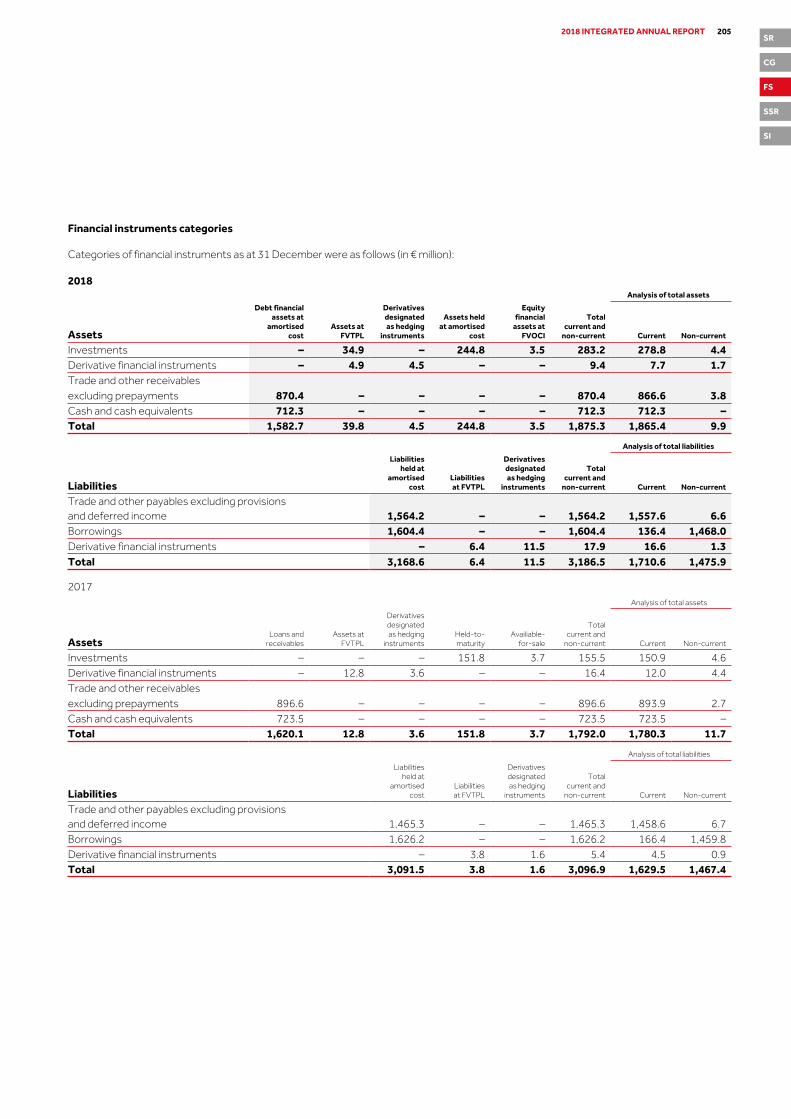
Financial instruments categories
Categories of financial instruments as at 31 December were as follows (in € million):
2018 Analysis of total assets
Assets
Debt financialassets at
amortisedcost
Assets atFVTPL
Derivativesdesignatedas hedging
instruments
Assets heldat amortised
cost
Equity financial
assets atFVOCI
Totalcurrent and
non-current Current Non-current
Investments – 34.9 – 244.8 3.5 283.2 278.8 4.4Derivative financial instruments – 4.9 4.5 – – 9.4 7.7 1.7Trade and other receivables excluding prepayments 870.4 – – – – 870.4 866.6 3.8Cash and cash equivalents 712.3 – – – – 712.3 712.3 –Total 1,582.7 39.8 4.5 244.8 3.5 1,875.3 1,865.4 9.9
Analysis of total liabilities
Liabilities
Liabilitiesheld at
amortisedcost
Liabilitiesat FVTPL
Derivativesdesignatedas hedging
instruments
Totalcurrent and
non-current Current Non-current
Trade and other payables excluding provisionsand deferred income 1,564.2 – – 1,564.2 1,557.6 6.6Borrowings 1,604.4 – – 1,604.4 136.4 1,468.0Derivative financial instruments – 6.4 11.5 17.9 16.6 1.3Total 3,168.6 6.4 11.5 3,186.5 1,710.6 1,475.9
2017 Analysis of total assets
Assets Loans and
receivables Assets at
FVTPL
Derivativesdesignatedas hedging
instrumentsHeld-to-maturity
Availiable-for-sale
Totalcurrent and
non-current Current Non-current
Investments – – – 151.8 3.7 155.5 150.9 4.6Derivative financial instruments – 12.8 3.6 – – 16.4 12.0 4.4Trade and other receivables excluding prepayments 896.6 – – – – 896.6 893.9 2.7Cash and cash equivalents 723.5 – – – – 723.5 723.5 –Total 1,620.1 12.8 3.6 151.8 3.7 1,792.0 1,780.3 11.7
Analysis of total liabilities
Liabilities
Liabilitiesheld at
amortisedcost
Liabilitiesat FVTPL
Derivativesdesignatedas hedging
instruments
Totalcurrent and
non-current Current Non-current
Trade and other payables excluding provisionsand deferred income 1,465.3 – – 1,465.3 1,458.6 6.7Borrowings 1,626.2 – – 1,626.2 166.4 1,459.8Derivative financial instruments – 3.8 1.6 5.4 4.5 0.9Total 3,091.5 3.8 1.6 3,096.9 1,629.5 1,467.4
2052018 INTEGRATED ANNUAL REPORTSR
CG
FS
SSR
SI

23. Financial risk management and financial instruments continued
Interest rate swap contracts
The Group entered into forward starting swap contracts of €500.0m in 2014 to hedge the interest rate risk related to its Euro denominated forecast issuance of fixed rate debt in March 2016. In August 2015 the Group entered into additional forward starting swap contracts of €100.0m. In March 2016 the forward starting swap contracts were settled and at the same time the new note was issued; the accumulated loss of €55.4m recorded in other comprehensive income is being amortised to the income statement over the term of the new note (refer to Note 24).
The Group entered into swaption contracts of €350.0m in 2018 to hedge the interest rate risk related to its Euro denominated forecast issuance of fixed rate debt in 2019 and formally designated them as cash flow hedges. The forecast debt issuance is related to the refinancing of the €800m Euro denominated fixed rate bond maturing in June 2020.
Embedded derivatives
During 2015 the Group recognised embedded derivatives whose risks and economic characteristics were not considered to be closely related to the commodity contract in which they were embedded. The fair value of the embedded derivatives as at 31 December 2018 amounted to a financial asset of €1.6m (2017: €2.6m).
Fair values of financial assets and liabilitiesFor financial instruments such as cash, deposits, debtors and creditors, investments, loans payable to related parties, short-term borrowings (excluding the current portion of bonds and notes payable) and other financial liabilities (other than bonds and notes payable), carrying values are a reasonable approximation of their fair values. According to the fair value hierarchy, the financial instruments measured at fair value are classified as follows:
Level 1
The fair value of FVOCI / available-for-sale listed equity securities as well as FVTPL securities is based on quoted market prices at the reported date. The fair value of bonds is based on quoted market prices at the reported date.
Level 2
The fair value of foreign currency forward, option and future contracts, commodity swap contracts, bonds and notes payable, interest rate swap contracts, forward starting swap contracts, embedded foreign currency derivatives and cross currency swap contracts is determined by using valuation techniques. These valuation techniques maximise the use of observable market data. The fair value of the foreign currency forward, option and future contracts, commodity swap contracts, embedded foreign currency derivatives and cross currency swap contracts is calculated by reference to quoted forward exchange, deposit rates and forward rate curve of the underlying commodity at the reported date for contracts with similar maturity dates. The fair value of interest rate option contracts is calculated by reference to the Black-Scholes valuation model and implied volatilities. The fair value of interest rate swap contracts is determined as the difference in the present value of the future interest cash inflows and outflows based on observable yield curves.
Level 3
The fair value of FVOCI / available-for-sale unlisted equity securities as well as certain undesignated derivatives is determined through the use of estimated discounted cash flows or other valuation technique.
206 COCA-COLA HBC NOTES TO THE CONSOLIDATED FINANCIAL STATEMENTS CONTINUED

The following table provides the fair value hierarchy in which fair value measurements are categorised for assets and liabilities measured at fair value as at 31 December 2018:
Level 1
€ millionLevel 2
€ millionLevel 3
€ millionTotal
€ million
Financial assets at FVTPL Foreign currency forward contracts – 3.2 – 3.2Embedded derivatives – 1.6 – 1.6Foreign currency futures contracts – 0.1 – 0.1Money market funds 34.9 – – 34.9
Derivative financial assets used for hedging Cash flow hedges
Foreign currency forward contracts – 2.1 – 2.1Interest rate swap contracts – 2.2 – 2.2Commodity swap contracts – 0.2 – 0.2
Assets at FVOCI Equity securities 0.7 – 2.8 3.5
Total financial assets 35.6 9.4 2.8 47.8Financial liabilities at FVTPL
Foreign currency forward contracts – (2.9) – (2.9)Commodity swap contracts – (0.4) (3.1) (3.5)
Derivative financial liabilities used for hedging Cash flow hedges
Foreign currency forward contracts – (1.1) – (1.1)Commodity swap contracts – (10.4) – (10.4)
Total financial liabilities – (14.8) (3.1) (17.9)
There were no transfers between Level 1, Level 2 and Level 3 in the period.
The following table provides the fair value hierarchy in which fair value measurements are categorised for assets and liabilities measured at fair value as at 31 December 2017:
Level 1
€ millionLevel 2
€ millionLevel 3
€ millionTotal
€ million
Financial assets at FVTPL Foreign currency forward contracts – 0.9 – 0.9Foreign currency option contracts – 0.9 – 0.9Embedded derivatives – 2.6 – 2.6Foreign currency futures contracts – 1.2 – 1.2Commodity swap contracts – 7.2 – 7.2
Derivative financial assets used for hedging Cash flow hedges
Foreign currency forward contracts – 0.7 – 0.7Foreign currency option contracts – 2.3 – 2.3Commodity swap contracts – 0.6 – 0.6
Available-for-sale financial assets Equity securities 1.0 – 2.7 3.7
Total financial assets 1.0 16.4 2.7 20.1Financial liabilities at FVTPL
Foreign currency forward contracts – (1.6) – (1.6)Commodity swap contracts – (2.2) – (2.2)
Derivative financial liabilities used for hedging Cash flow hedges
Foreign currency forward contracts – (1.6) – (1.6)Total financial liabilities – (5.4) – (5.4)
There were no transfers between Level 1, Level 2 and Level 3 in the period.
2072018 INTEGRATED ANNUAL REPORTSR
CG
FS
SSR
SI

24. Net debt
Accounting policy
Borrowings are initially recognised at the fair value net of transaction costs incurred.
After initial recognition, all interest-bearing borrowings are subsequently measured at amortised cost. Amortised cost is calculated using the effective interest rate method whereby any discount, premium or transaction costs associated with a borrowing are amortised to the income statement over the borrowing period.
Refer also to Note 14 for accounting policy on finance leases.
Cash and cash equivalents comprise cash balances and short-term, highly liquid investments that are readily convertible to known amounts of cash and which are subject to insignificant risk of change in value. Bank overdrafts are classified as short-term borrowings in the balance sheet and for the purpose of the cash flow statement. Time deposits and treasury bills which do not meet the definition of cash and cash equivalents are classified as short-term investments at amortised cost. Money market funds are classified as short-term investments at fair value through profit or loss.
Net debt is defined as current borrowings plus non-current borrowings less cash and cash equivalents, and certain other financial assets.
Net debt for the year ended 31 December comprised:
2018
€ million2017
€ million
Current borrowings 136.4 166.4Non-current borrowings 1,468.0 1,459.8Less: Cash and cash equivalents (712.3) (723.5) · Financial assets held to maturity – (150.9) · Financial assets at amortised cost (243.9) – · Financial assets at fair value through profit and loss (34.9) –
Less: Other financial assets (278.8) (150.9)Net debt 613.3 751.8
The financial assets at amortised cost comprise time deposits and the financial assets at fair value through profit and loss relate to money market funds. The line item ‘Other financial assets’ of the balance sheet includes derivative financial instruments of €7.7m (2017: €12.0m).
a) Borrowings
The Group held the following borrowings as at 31 December:
2018
€ million2017
€ million
Commercial paper 95.0 120.0Loans payable to related parties (refer to Note 26) 4.0 4.3Other borrowings 30.9 34.5 129.9 158.8Obligations under finance leases falling due within one year 6.5 7.6Total borrowings falling due within one year 136.4 166.4Borrowings falling due within one to two years
Bonds, bills and unsecured notes 798.3 –Loans payable to related parties (refer to Note 26) 13.3 –
Borrowings falling due within two to five years Bonds, bills and unsecured notes – 797.2
Borrowings falling due in more than five years Bonds, bills and unsecured notes 596.9 596.3
1,408.5 1,393.5Obligations under finance leases falling due in more than one year 59.5 66.3Total borrowings falling due after one year 1,468.0 1,459.8Total borrowings 1,604.4 1,626.2
208 COCA-COLA HBC NOTES TO THE CONSOLIDATED FINANCIAL STATEMENTS CONTINUED

Reconciliation of liabilities to cash flows arising from financing activities: Borrowings Finance leases
due within
one yeardue in more
than one yeardue within
one yeardue in more
than one year
Derivative assets/
(liabilities) Total
Balance at 1 January 2017 149.0 1,391.8 7.5 76.3 – 1,624.6Cash flows Proceeds from borrowings 82.2 – – – – 82.2Repayments of borrowings (83.8) – – – – (83.8)Principal repayments of finance lease obligations – – (7.2) – – (7.2)Interest paid (30.7) – (6.2) – – (36.9)Proceeds from/(payments for) settlement of derivatives regarding financing activities – – – – (3.1) (3.1)Total cash flows (32.3) – (13.4) – (3.1) (48.8)Finance leases increase – – 0.1 0.8 – 0.9Effect of changes in exchange rates (0.4) – (0.2) (3.5) – (4.1)Other non-cash movements 42.5 1.7 13.6 (7.3) 3.1 53.6Balance at 31 December 2017 158.8 1,393.5 7.6 66.3 – 1,626.2Cash flows Proceeds from borrowings 39.5 12.9 – – – 52.4Repayments of borrowings (69.6) – – – – (69.6)Principal repayments of finance lease obligations – – (7.7) – – (7.7)Interest paid (34.7) – (5.7) – – (40.4)Proceeds from/(payments for) settlement of derivatives regarding financing activities – – – – 1.4 1.4Total cash flows (64.8) 12.9 (13.4) – 1.4 (63.9)Finance leases increase – – – (0.8) – (0.8)Effect of changes in exchange rates – – – (0.4) – (0.4)Other non-cash movements 35.9 2.1 12.3 (5.6) (1.4) 43.3Balance at 31 December 2018 129.9 1,408.5 6.5 59.5 – 1,604.4
Commercial paper programme
In October 2013 the Group established a €1.0bn Euro-commercial paper programme (‘CP programme’) which was updated in September 2014 and then in May 2017, to further diversify its short-term funding sources. The Euro-commercial paper notes may be issued either as non-interest-bearing notes sold at a discount or as interest-bearing notes at a fixed or floating rate. All commercial paper issued under the CP programme must be repaid within 7 to 364 days. The CP programme has been granted the Short Term Euro Paper label (‘STEP’) and commercial paper is issued through Coca-Cola HBC’s 100%-owned subsidiary Coca-Cola HBC Finance B.V. and is fully, unconditionally and irrevocably guaranteed by Coca-Cola HBC AG. The outstanding amount under the CP programme as at 31 December 2018 was €95.0m (2017: €120.0m).
Committed credit facilities
In June 2015, the Group replaced its then-existing €500.0m syndicated revolving credit facility with a new €500.0m syndicated loan facility, provided by various financial institutions, expiring on 24 June 2020, with the option to be extended for one more year. In June 2016, the Company exercised its option and the banks agreed to extend the facility for one more year until 24 June 2021. This facility can be used for general corporate purposes and carries a floating interest rate over EURIBOR and LIBOR. No amounts have been drawn under the syndicated loan facility since inception. The borrower in the syndicated loan facility is Coca-Cola HBC’s 100%-owned subsidiary Coca-Cola HBC Finance B.V. and it is fully, unconditionally and irrevocably guaranteed by Coca-Cola HBC AG and Coca-Cola HBC Holdings B.V. and not subject to any financial covenants.
2092018 INTEGRATED ANNUAL REPORTSR
CG
FS
SSR
SI

24. Net debt continued
Euro medium-term note programme
In June 2013, the Group established a new €3.0bn Euro medium-term note programme (the ‘EMTN programme’). The EMTN programme was updated in September 2014 and again in September 2015. Notes are issued under the EMTN programme through Coca-Cola HBC’s 100%-owned subsidiary Coca-Cola HBC Finance B.V. and are fully, unconditionally and irrevocably guaranteed by Coca-Cola HBC AG.
In June 2013, Coca Cola HBC Finance B.V. completed the issue of €800m, 2.375%, seven-year fixed rate, Euro-denominated notes. The net proceeds of the new issue were used to repay the US$500m notes due in September 2013 and partially repay €183.0m of the 7.875% five-year fixed rate notes due in January 2014.
In March 2016, Coca-Cola HBC Finance B.V. completed the issue of a €600m Euro-denominated fixed rate bond maturing in November 2024. The coupon rate of the new bond is 1.875% which, including the amortisation of the loss on the forward starting swap contracts over the term of the fixed rate bond, results in an effective interest rate of 2.99% (refer to Note 23). The net proceeds of the new issue were used to partially repay €214.6m of the 4.25% seven-year fixed rate notes due in November 2016, the remaining €385.4m was repaid in November 2016 upon its maturity.
As at 31 December 2018, a total of €1.4bn in notes issued under the EMTN programme were outstanding.
The EMTN Programme has not been updated since September 2015, so further issues under the EMTN Programme are currently not possible pending a further update.
Summary of notes outstanding as at 31 December Book value Fair value
Notes Start date Maturity date Fixed coupon2018
€ million2017
€ million2018
€ million2017
€ million
€800 18 June 2013 18 June 2020 2.375% 798.3 797.2 822.5 841.5€600 10 March 2016 11 November 2024 1.875% 596.9 596.3 632.5 643.6Total 1,395.2 1,393.5 1,455.0 1,485.1
The fair values are within Level 1 of the value hierarchy.
Obligations under finance leases
Future minimum lease payments under finance leases together with the present value of the net minimum lease payments as at 31 December were as follows:
2018
€ million2017
€ million
Minimum
paymentsPresent value
of paymentsMinimum
paymentsPresent value
of payments
Less than one year 11.2 6.5 14.3 7.6Later than one year but less than two years 11.2 6.8 11.3 6.5Later than two years but less than three years 11.2 7.3 12.6 6.8Later than three years but less than four years 11.3 7.8 12.5 7.3Later than four years but less than five years 10.8 7.9 12.6 7.8Later than five years 36.5 29.7 49.9 37.9Total minimum lease payments 92.2 66.0 113.2 73.9Future finance charges on finance leases (26.2) – (39.3) –Present value of minimum lease payments 66.0 66.0 73.9 73.9
210 COCA-COLA HBC NOTES TO THE CONSOLIDATED FINANCIAL STATEMENTS CONTINUED

Total borrowings at 31 December were held in the following currencies:
Current Non-current
2018
€ million2017
€ million2018
€ million2017
€ million
Euro 129.8 152.0 1,412.8 1,414.1US dollar 2.3 11.0 23.0 24.1Russian rouble – – 13.3 –Polish zloty 1.0 1.0 11.2 12.4UK sterling 1.6 1.3 7.7 9.2Nigerian naira 1.1 0.4 – –Croatian kuna 0.3 0.3 – –Other 0.3 0.4 – –Total borrowings 136.4 166.4 1,468.0 1,459.8
The carrying amounts of interest-bearing borrowings held at fixed and floating interest rate as at 31 December 2018, as well as the weighted average interest rates and maturities of fixed rate borrowings, were as follows:
Fixedinterest rate
€ million
Floatinginterest rate
€ millionTotal
€ million
Euro 1,512.7 29.9 1,542.6US dollar 24.2 1.1 25.3Russian rouble – 13.3 13.3Polish zloty – 12.2 12.2UK sterling – 9.3 9.3Nigerian naira 1.1 – 1.1Croatian kuna 0.3 – 0.3Other 0.3 – 0.3Total interest-bearing borrowings 1,538.6 65.8 1,604.4
Other borrowings of €0.3m (2017: €0.3m) are subject to factoring agreements, based on which the customers are liable to the interest being charged (refer to Note 17).
Financial liabilities represent fixed and floating rate borrowings held by the Group. The Group’s policy is to hedge exposures to changes in the fair value of debt and interest rates by using a combination of cross-currency swap contracts, fixed-to-floating-rate interest rate swap contracts and interest rate option contracts. The weighted average interest rate of the fixed Euro liabilities is 2.5% and the weighted average maturity for which the interest is fixed is 3.2 years.
b) Cash and cash equivalents
Cash and cash equivalents as at 31 December comprise the following:
2018
€ million2017
€ million
Cash at bank, in transit and in hand 396.5 397.6Short-term deposits 315.8 325.9Total cash and cash equivalents 712.3 723.5
2112018 INTEGRATED ANNUAL REPORTSR
CG
FS
SSR
SI

24. Net debt continuedCash and cash equivalents are held in the following currencies:
2018
€ million2017
€ million
Euro 577.0 568.6Nigerian naira 49.8 82.8Russian rouble 22.9 9.8UK sterling 13.2 14.5Serbian dinar 9.6 7.2Polish zloty 9.0 0.2Romanian leu 8.7 9.9Swiss franc 5.4 6.3Hungarian forint 3.3 10.6US dollar 3.3 1.7Ukrainian hryvnia 1.9 3.0Croatian kuna 1.9 1.8Belarusian rouble 1.7 1.1Czech koruna 1.2 2.3Other 3.4 3.7Total cash and cash equivalents 712.3 723.5
As at 31 December 2018, time deposits of €243.9m (2017: €150.9m), which do not meet the definition of cash and cash equivalents, are recorded as other financial assets.
Cash and cash equivalents include an amount of €49.8m equivalent in Nigerian naira. This includes an amount of €13.3m equivalent in Nigerian naira, which relates to the outstanding balance held for the repayment of Nigerian Bottling Company Ltd’s former minority shareholders, following the 2011 acquisition of non-controlling interests.
Cash and cash equivalents held by our subsidiaries in Greece of €13.4m were subject to capital controls as at 31 December 2018.
The amount of dividends payable to the Company by its operating subsidiaries is subject to, among other restrictions, general limitations imposed by the corporate laws and exchange control restrictions of the respective jurisdictions where those subsidiaries are organised and operate. Also, there are fund transfer restrictions in certain countries in which we operate, in particular Belarus, Greece, Nigeria, Serbia and Ukraine, where these restrictions do not have a material impact on the Group’s liquidity, as the amounts of cash and cash equivalents held in such countries are generally retained for capital expenditure, working capital and dividend distribution purposes. Intra group dividends paid by certain of our subsidiaries are also subject to withholding taxes.
25. Equity
Accounting policies
Share capital
Coca-Cola HBC has only one class of shares, ordinary shares. When new shares are issued, they are recorded in share capital at their par value. The excess of the issue price over the par value is recorded to the share premium reserve. Incremental external costs directly attributable to the issue of new shares or to the process of returning capital to shareholders are recorded in equity as a deduction, net of tax, in the share premium reserve.
Dividends
Dividends are recorded in the Group’s consolidated financial statements, against the relevant equity component, in the period in which they are approved by the Group’s shareholders.
212 COCA-COLA HBC NOTES TO THE CONSOLIDATED FINANCIAL STATEMENTS CONTINUED

a) Share capital, share premium and Group reorganisation reserveNumber of
shares(authorisedand issued)
Sharecapital
€ million
Sharepremium€ million
Groupreorganisation
reserve€ million
Balance as at 1 January 2017 366,640,638 1,990.8 4,854.6 (6,472.1)Shares issued to employees exercising stock options (refer to Note 27) 4,122,401 24.3 46.7 –Dividends – – (162.0) –Balance as at 31 December 2017 370,763,039 2,015.1 4,739.3 (6,472.1)Shares issued to employees exercising stock options (refer to Note 27) 1,064,190 6.1 9.2 –Dividends – – (200.6) –Balance as at 31 December 2018 371,827,229 2,021.2 4,547.9 (6,472.1)
The Group reorganisation reserve relates to the impact from adjusting share capital, share premium and treasury shares to depict the respective statutory amounts of Coca-Cola HBC on 25 April 2013, together with the transaction costs incurred by the latter, relating primarily to the re-domiciliation of the Group and its admission to listing in the premium segment of the London Stock Exchange, following successful completion of the voluntary share exchange offer (refer also to Note 1). These transactions were treated as a reorganisation of an existing entity that has not changed the substance of the reporting entity.
In 2018, the share capital of Coca-Cola HBC increased by the issue of 1,064,190 (2017: 4,122,401) new ordinary shares following the exercise of stock options pursuant to the Coca-Cola HBC AG’s employees’ stock option plan. Total proceeds from the issuance of the shares under the stock option plan amounted to €15.3m (2017: €71.0m).
Following the above changes, as at 31 December 2018 the share capital of the Group amounted to €2,021.2m (2017: €2,015.1m) and comprised 371,827,229 shares with a nominal value of CHF 6.70 each.
b) Dividends
The shareholders of Coca-Cola HBC AG approved the 2016 dividend distribution of €0.44 per share at the Annual General Meeting held on 20 June 2017. The total dividend amounted to €162.0m and was paid on 25 July 2017. Of this, an amount of €1.5m related to shares held by the Group.
The shareholders of Coca-Cola HBC AG approved the 2017 dividend distribution of €0.54 per share at the Annual General Meeting held on 11 June 2018. The total dividend amounted to €200.6m and was paid on 24 July 2018. Of this, an amount of €1.8m related to shares held by the Group.
The Board of Directors of Coca-Cola HBC AG has proposed a €0.57 dividend per share in respect of 2018. If approved by the shareholders of Coca-Cola HBC AG, this dividend will be paid in 2019.
c) Reserves
The reserves of the Group at 31 December were as follows:2018
€ million2017
€ million
Treasury shares (184.1) (71.3)Exchange equalisation reserve (1,088.8) (1,026.3)Other reserves
Hedging reserve, net (49.6) (47.0)Tax-free reserve 163.8 163.8Statutory reserves 27.6 27.3Stock option and performance share reserve 102.9 104.4Available-for-sale financial assets valuation reserve, net 0.6 0.8Other 23.7 21.9
Total other reserves 269.0 271.2Total reserves (1,003.9) (826.4)
2132018 INTEGRATED ANNUAL REPORTSR
CG
FS
SSR
SI

25. Equity continued
Treasury shares
Treasury shares held by the Group represent shares acquired following approval of share buy-back programmes, forfeited shares under the equity compensation plan operated by the Group as well as shares representing the initial ordinary shares of Coca-Cola HBC acquired from Kar-Tess Holding. On 11 June 2018, the Annual General Meeting adopted a proposal for share buy-back of up to 7,500,000 ordinary shares of Coca-Cola HBC for the purpose of neutralising the dilution resulting from shares issued under Coca-Cola HBC’s equity compensation plan and meeting the requirements of the Company’s employee incentive scheme. The programme was partially completed during 2018 for a consideration of €27.8m and is expected to be completed in full in the first half of 2019. As a result of an irrevocable share purchase agreement entered into in December 2018, the Group has recognised a liability (refer to Note 19) with a corresponding deduction in treasury shares of €85.5m.
As at 31 December 2018, 4,478,128 (2017: 3,445,060) treasury shares were held by the Group.
Exchange equalisation reserve
The exchange equalisation reserve comprises all foreign exchange differences arising from the translation of the financial statements of Group entities with functional currencies other than the Euro.
Other reserves
Hedging reserve
The hedging reserve reflects changes in the fair values of derivatives accounted for as cash flow hedges, net of the deferred tax related to such balances.
Tax-free and statutory reserves
The tax-free reserve includes investment amounts exempt from tax according to incentive legislation, other tax-free income or income taxed at source.
Statutory reserves are particular to the various countries in which the Group operates. The amount of statutory reserves of the parent entity, Coca-Cola HBC AG, is €nil. During 2018, an amount of €0.3m (2017: €0.4m) was reclassified to statutory reserves relating to the establishment of additional reserves by the Group’s subsidiaries.
Stock option and performance share reserve
The stock option reserve represents the cumulative charge to the income statement for employee stock option and performance share awards (refer also to Note 27).
Other reserves
Other reserves are particular to the various countries in which the Group operates and include shares held for the Group’s employee share purchase plan, which is an equity compensation plan in which eligible employees may participate.
26. Related party transactions
a) The Coca-Cola Company
As at 31 December 2018, The Coca-Cola Company indirectly owned 22.9% (2017: 23.0%) of the issued share capital of Coca-Cola HBC. The Coca-Cola Company considers Coca-Cola HBC to be a ‘key bottler’ and has entered into bottlers’ agreements with Coca-Cola HBC in respect of each of the Group’s territories. All the bottlers’ agreements entered into by The Coca-Cola Company and Coca-Cola HBC are Standard International Bottlers’ (‘SIB’) agreements. The terms of the bottlers’ agreements grant Coca-Cola HBC the right to produce and the exclusive right to sell and distribute the beverages of The Coca-Cola Company in each of the countries in which the Group operates. Consequently, Coca-Cola HBC is obliged to purchase all concentrate for The Coca-Cola Company’s beverages from The Coca-Cola Company, or its designee, in the ordinary course of business. On 10 October 2012, The Coca-Cola Company agreed to extend the term of the bottlers’ agreements for a further 10 years until 2023.
The Coca-Cola Company owns or has applied for the trademarks that identify its beverages in each of the countries in which the Group operates. The Coca-Cola Company has authorised Coca-Cola HBC and certain of its subsidiaries to use the trademark ‘Coca-Cola’ in their corporate names.
214 COCA-COLA HBC NOTES TO THE CONSOLIDATED FINANCIAL STATEMENTS CONTINUED

The below table summarises transactions with The Coca-Cola Company and its subsidiaries:
2018
€ million2017
€ million
Purchases of concentrate, finished products and other items 1,525.3 1,379.9Net contributions received for marketing and promotional incentives 110.8 83.9Sales of finished goods and raw materials 17.6 14.3Other income 8.3 6.1Other expenses 3.8 3.6
The Coca-Cola Company makes discretionary marketing contributions to Coca-Cola HBC’s operating subsidiaries. The participation in shared marketing agreements is at The Coca-Cola Company’s discretion and, where co-operative arrangements are entered into, marketing expenses are shared. Such arrangements include the development of marketing programmes to promote The Coca-Cola Company’s beverages. Contributions received from The Coca-Cola Company for marketing and promotional incentives during the year amounted to €110.8m (2017: €83.9m): contributions made by The Coca-Cola Company to Coca-Cola HBC for price support and marketing and promotional campaigns in respect of specific customers in 2018 totalled €95.1m (2017: €59.6m), while contributions made by The Coca-Cola Company to Coca-Cola HBC for general marketing programmes in 2018 totalled €15.7m (2017: €24.3m). The Coca-Cola Company has also customarily made additional payments for marketing and advertising directly to suppliers as part of the shared marketing arrangements. The proportion of direct and indirect payments, made at The Coca-Cola Company’s discretion, will not necessarily be the same from year to year.
Other income primarily comprises rent and other items.
During 2017, the remaining consideration of €0.5m regarding the sale of 50% of the Group’s share in its subsidiary Neptūno Vandenys, UAB to European Refreshments, a subsidiary of TCCC, was received and is included in line ‘Net receipts from equity investments’ in the consolidated cash flow statement.
As at 31 December 2018, the Group had a total amount due from The Coca-Cola Company of €76.7m (2017: €79.3m), and a total amount due to The Coca-Cola Company of €256.1m including loan payable of €13.3m (2017: €260.2m including loan payable of €nil).
b) Frigoglass S.A. (‘Frigoglass’), Kar-Tess Holding and AG Leventis (Nigeria) Plc
Truad Verwaltungs AG currently indirectly owns 48.6% of Frigoglass and 50.7% of AG Leventis (Nigeria) Plc and also indirectly controls Kar-Tess Holding, which holds approximately 23.0% (2017: 23.0%) of Coca-Cola HBC’s total issued share capital.
The below table summarises transactions with the above entities:
Frigoglass & subsidiaries2018
€ million2017
€ million
Purchases of coolers, cooler parts, glass bottles, crowns, raw and other materials 138.7 117.3Maintenance and other expenses 21.0 18.1AG Leventis (Nigeria) Plc Purchases of finished goods and other materials 5.1 8.7Purchases of property, plant and equipment – 0.2Rental expenses 0.8 2.1
Frigoglass, a company listed on the Athens Exchange, is a manufacturer of coolers, cooler parts, glass bottles, crowns and plastics. Frigoglass has a controlling interest in Frigoglass Industries Limited, a company in which the Group has a 23.9% effective interest, through its investment in Nigerian Bottling Company Ltd. Furthermore, during 2015 the Group acquired through its investment in Nigerian Bottling Company Ltd a 23.9% effective interest in Frigoglass West Africa Ltd., a company in which Frigoglass has a controlling interest.
The Group entered into a supply agreement with Frigoglass for the purchase of cooling equipment in 1999. The supply agreement was extended in 2004, 2008, 2013 and, most recently, in 2018, on substantially similar terms. Coca-Cola HBC has the status of most favoured customer of Frigoglass, on a non-exclusive basis, provided that it obtains at least 60% (at prices which are agreed on an annual basis and which must be competitive) of its annual requirements for cooling equipment from Frigoglass. The current agreement expires on 31 December 2020.
As at 31 December 2018, Coca-Cola HBC owed €18.3m (2017: €14.8m) to and was owed €0.3m (2017: €0.2m) by Frigoglass.
As at 31 December 2018, the Group owed €1.4m (2017: €1.3m) to and was owed €0.1m (2017: €nil) by AG Leventis (Nigeria) Plc.
Capital commitments with Frigoglass and its subsidiaries at 31 December 2018 amounted to €28.1m (2017: €21.9m).
2152018 INTEGRATED ANNUAL REPORTSR
CG
FS
SSR
SI

26. Related party transactions continued
c) Other related parties
The below table summarises transactions with other related parties:
2018
€ million2017
€ million
Purchases 2.4 79.3Other expenses 18.7 23.2
Beverage Partners Worldwide (‘BPW’)
BPW was a 50/50 joint venture between The Coca-Cola Company and Nestlé. Effective 1 January 2018, TCCC and Nestlé have agreed to dissolve BPW. During 2017, the Group purchased inventory from BPW of €77.9m.
As at 31 December 2018, Coca-Cola HBC owed €nil (2017: €4.5m) to and was owed €nil (2017: €4.5m) by BPW.
Other
During 2018, the Group incurred subsequent expenditure for fixed assets of €2.4m (2017: €1.4m) from other related parties. Furthermore, during 2018, the Group incurred expenses of €18.7m (2017: €23.2m) mainly related to maintenance services for cold drink equipment and installations of coolers, fountains, vending and merchandising equipment from other related parties.
At 31 December 2018, the Group owed €2.7m (2017: €0.4m) to and was owed €0.1m (2017: €0.8m) by other related parties.
d) Joint ventures
During 2018, the Group purchased €10.6m of finished goods (2017: €19.7m) from joint ventures. In addition, during 2018 the Group recorded sales of finished goods and raw materials of €2.7m (2017: €12.6m) to joint ventures. Furthermore, the Group recorded other income of €4.2m (2017: €1.4m) and other expenses of €2.1m (2017: €nil) from joint ventures.
As at 31 December 2018, the Group owed €9.6m including loans payable of €4.0m (2017: €24.0m including loans payable €4.3m) to and was owed €7.4m including loans receivable of €3.5m (2017: €8.6m including loans receivable of €3.6m) by joint ventures. During 2018 the Group received dividends and capital returns of €7.4m (2017: €19.3m) from Brewinvest S.A. Group of companies, which are included in line ‘Net receipts from equity investments’ of the consolidated cash flow statement.
e) Directors and senior management
Anastassis G. David, Anastasios I. Leventis, Christo Leventis and Robert Ryan Rudolph have all been nominated by Kar-Tess Holding to the Board of Coca-Cola HBC. José Octavio Reyes and Ahmet C. Bozer have been nominated by TCCC to the Board of Coca-Cola HBC. There have been no transactions between Coca-Cola HBC and the Directors and senior management except for remuneration (refer to Note 8).
216 COCA-COLA HBC NOTES TO THE CONSOLIDATED FINANCIAL STATEMENTS CONTINUED
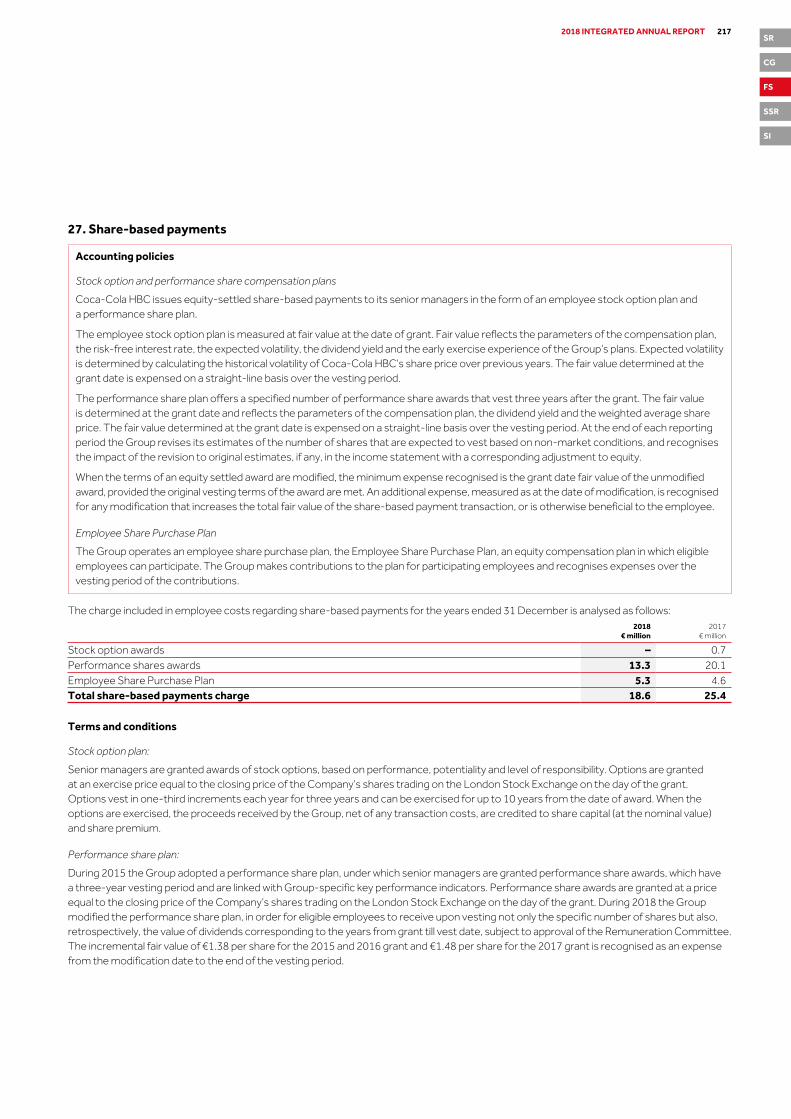
27. Share-based payments
Accounting policies
Stock option and performance share compensation plans
Coca-Cola HBC issues equity-settled share-based payments to its senior managers in the form of an employee stock option plan and a performance share plan.
The employee stock option plan is measured at fair value at the date of grant. Fair value reflects the parameters of the compensation plan, the risk-free interest rate, the expected volatility, the dividend yield and the early exercise experience of the Group’s plans. Expected volatility is determined by calculating the historical volatility of Coca-Cola HBC’s share price over previous years. The fair value determined at the grant date is expensed on a straight-line basis over the vesting period.
The performance share plan offers a specified number of performance share awards that vest three years after the grant. The fair value is determined at the grant date and reflects the parameters of the compensation plan, the dividend yield and the weighted average share price. The fair value determined at the grant date is expensed on a straight-line basis over the vesting period. At the end of each reporting period the Group revises its estimates of the number of shares that are expected to vest based on non-market conditions, and recognises the impact of the revision to original estimates, if any, in the income statement with a corresponding adjustment to equity.
When the terms of an equity settled award are modified, the minimum expense recognised is the grant date fair value of the unmodified award, provided the original vesting terms of the award are met. An additional expense, measured as at the date of modification, is recognised for any modification that increases the total fair value of the share-based payment transaction, or is otherwise beneficial to the employee.
Employee Share Purchase Plan
The Group operates an employee share purchase plan, the Employee Share Purchase Plan, an equity compensation plan in which eligible employees can participate. The Group makes contributions to the plan for participating employees and recognises expenses over the vesting period of the contributions.
The charge included in employee costs regarding share-based payments for the years ended 31 December is analysed as follows:
2018
€ million2017
€ million
Stock option awards – 0.7Performance shares awards 13.3 20.1Employee Share Purchase Plan 5.3 4.6Total share-based payments charge 18.6 25.4
Terms and conditions
Stock option plan:
Senior managers are granted awards of stock options, based on performance, potentiality and level of responsibility. Options are granted at an exercise price equal to the closing price of the Company’s shares trading on the London Stock Exchange on the day of the grant. Options vest in one-third increments each year for three years and can be exercised for up to 10 years from the date of award. When the options are exercised, the proceeds received by the Group, net of any transaction costs, are credited to share capital (at the nominal value) and share premium.
Performance share plan:
During 2015 the Group adopted a performance share plan, under which senior managers are granted performance share awards, which have a three-year vesting period and are linked with Group-specific key performance indicators. Performance share awards are granted at a price equal to the closing price of the Company’s shares trading on the London Stock Exchange on the day of the grant. During 2018 the Group modified the performance share plan, in order for eligible employees to receive upon vesting not only the specific number of shares but also, retrospectively, the value of dividends corresponding to the years from grant till vest date, subject to approval of the Remuneration Committee. The incremental fair value of €1.38 per share for the 2015 and 2016 grant and €1.48 per share for the 2017 grant is recognised as an expense from the modification date to the end of the vesting period.
2172018 INTEGRATED ANNUAL REPORTSR
CG
FS
SSR
SI

27. Share-based payments continued
Employee Share Purchase Plan:
The Employee Share Purchase Plan is administered by a Plan Administrator. Under the terms of this plan, employees have the opportunity to invest 1% to 15% of their salary in ordinary Coca-Cola HBC shares by contributing to the plan monthly.
Coca-Cola HBC will match up to a maximum of 3% of the employee’s salary by way of contribution. Employer contributions, in the form of cash allocation, take place on a monthly basis and are used to purchase matching shares on the open market, which is the London Stock Exchange, at the time of vesting. Matching contributions vest one year after the grant. Dividends received in respect of vested shares under the Plan are used to purchase additional shares at the time of dividend distribution. Shares are held under the Plan Administrator. For employees resident in Greece Coca-Cola HBC matches the employee’s contribution with an annual employer contribution, of up to 5% of the employee’s salary in December of each year, which vest immediately.
Stock option activity
The Group has not issued any new stock options in 2018 or 2017.
The following table summarises information regarding outstanding stock options exercisable at 31 December 2018:
Exercise price
(EUR)Exercise price
(GBP)
Vestingstatus as at
31 Dec 2018 End of period
Number ofstock options
outstanding
2005 December grant 13.19 11.24 fully vested 31.12.2020¹ 220,0012006 December grant 16.37 13.95 fully vested 12.12.2021¹ 397,5002007 December grant 26.41 22.51 fully vested 31.12.2022¹ 397,5002008 December grant 9.02 7.69 fully vested 11.12.2023¹ 220,0002009 December grant 15.70 13.38 fully vested 09.12.2019 722,0732010 December grant 19.31 16.46 fully vested 08.12.2020 947,0582011 March grant 18.53 15.79 fully vested 15.03.2021 18,3342011 December grant 11.98 10.21 fully vested 15.12.2021 379,3342013 June grant – 15.00 fully vested 20.06.2023 532,0002013 December grant – 16.99 fully vested 09.12.2023 681,5002014 December grant – 13.33 fully vested 09.12.2024 784,167Total 5,299,467
1. Relates to stock options granted under the previous stock option plans which expire in December 2020, 2021, 2022 and 2023 respectively.
A summary of stock option activity in 2018 under all plans is as follows:
Numberof stockoptions
2018
Weightedaverage
exercise price2018 (EUR)*
Weightedaverage
exercise price2018 (GBP)
Outstanding at 1 January 6,363,657 16.29 14.46Exercised (1,064,190) 14.49 13.10Outstanding at 31 December 5,299,467 16.29 14.73Exercisable at 31 December 5,299,467 16.29 14.73
A summary of stock option activity in 2017 under all plans is as follows:
Numberof stockoptions
2017
Weightedaverage
exercise price2017 (EUR)*
Weightedaverage
exercise price2017 (GBP)
Outstanding at 1 January 10,540,809 17.38 14.80Exercised (4,122,401) 17.19 15.25Expired (12,750) 25.37 22.51Forfeited / Cancelled (42,001) 20.98 18.62Outstanding at 31 December 6,363,657 16.29 14.46Exercisable at 31 December 6,363,657 16.29 14.46
* For convenience, the prices are translated as at the closing exchange rate.
218 COCA-COLA HBC NOTES TO THE CONSOLIDATED FINANCIAL STATEMENTS CONTINUED

Total proceeds from the issuance of the shares under the stock option plan in 2018 amounted to €15.3m (2017: €71.0m).
The weighted average remaining contractual life of share options outstanding under the stock option compensation plans at 31 December 2018 was 3.5 years (2017: 4.0 years).
Performance shares activity
A summary of performance shares activity is as follows:
Number ofperformance
shares2018
Number ofperformance
shares2017
Outstanding at 1 January 2,122,290 1,363,992Granted 678,969 824,074Vested (396,402) –Forfeited / Cancelled (126,986) (65,776)Outstanding at 31 December 2,277,871 2,122,290
The 2017 expense recognised for performance shares awards included the retrospective adjustment resulting from the reassessment of the performance conditions of the plan as well as the impact from the accelerated vesting of 396,402 shares, including dividend equivalent shares, due to the passing of the former CEO. In 2018, following approval of the Remuneration Committee, the 396,402 shares relating to the former CEO vested fully. The weighted average remaining contractual life of performance shares outstanding under the performance share plans at 31 December 2018 was 1.1 years (2017: 1.6 years).
The fair value of the 2018 performance share plan is £25.28 per share (2017: £18.70). Relevant inputs into the valuation are as follows: 2018 2017
Weighted average share price £25.28 £19.81Dividend yield nil 1.9%Weighted average exercise period 3.0 years 3.0 years
28. ContingenciesIn relation to the Greek Competition Authority’s decision of 25 January 2002, one of Coca-Cola Hellenic Bottling Company S.A.’s competitors has filed a lawsuit against Coca-Cola Hellenic Bottling Company S.A. claiming damages in an amount of €7.7m. The court of first instance heard the case on 21 January 2009 and subsequently rejected the lawsuit. The plaintiff has appealed the judgement and on 9 December 2013 the Athens Court of Appeals rejected the plaintiff’s appeal. Following the spin-off, Coca-Cola HBC Greece S.A.I.C. substituted Coca-Cola Hellenic Bottling Company S.A. as defendant in this lawsuit. Coca-Cola HBC Greece S.A.I.C. has not provided for any losses related to this case. The defendant has not filed for a cessation of the decision within the relevant deadline set by law, therefore the decision of the Athens Court of Appeal is final and irrecoverable, and the case has closed. On 19 April 2014, the same plaintiff filed a new lawsuit against Coca-Cola Hellenic Bottling Company S.A. (following the spin-off, Coca-Cola HBC Greece S.A.I.C.) claiming payment of €7.5m as compensation for losses and moral damages for alleged anti-competitive commercial practices of Coca-Cola Hellenic Bottling Company S.A. between 1994 and 2013. The two lawsuits partially overlap in the time period for which damages are sought by the plaintiff. The hearing of the new lawsuit was scheduled for 17 January 2019. On 21 December 2018 the plaintiff served to Coca-Cola HBC Greece S.A.I.C. its withdrawal from the lawsuit. In light of the above withdrawal this case has also closed.
On 6 September 2016, the Greek Competition Commission initiated an audit of Coca-Cola HBC Greece S.A.I.C.’s operations as part of an investigation into certain commercial practices in the sparkling, juice and water categories. Coca-Cola HBC Greece S.A.I.C. has a policy of strict compliance with Greek and EU competition law and it is co-operating fully with the Greek Competition Commission.
In 1992, our subsidiary Nigerian Bottling Company (‘NBC’) acquired a manufacturing facility in Nigeria from Vacunak, a Nigerian company. In 1994, Vacunak filed a lawsuit against NBC, alleging that a representative of NBC had orally agreed to rescind the sale agreement and instead enter into a lease agreement with Vacunak. As part of its lawsuit Vacunak sought compensation for rent and loss of business opportunities. NBC discontinued all use of the facility in 1995. On 19 August 2013, NBC received the written judgement of the Nigerian court of first instance issued on 28 June 2012 providing for damages of approximately €19.8m. NBC has filed an appeal against the judgement. Based on advice from NBC’s outside legal counsel, we believe that it is unlikely that NBC will suffer material financial losses from this case. We have consequently not provided for any losses in relation to this case.
The tax filings of the Group and its subsidiaries are routinely subjected to audit by tax authorities in most of the jurisdictions in which the Group conducts business. These audits may result in assessments of additional taxes. The Group provides additional tax in relation to the outcome of such tax assessments, to the extent that a liability is probable and estimable.
The Group is also involved in various other legal proceedings. Management believes that any liability to the Group that may arise as a result of these pending legal proceedings will not have a material adverse effect on the results of operations, cash flows, or the financial position of the Group taken as a whole.
2192018 INTEGRATED ANNUAL REPORTSR
CG
FS
SSR
SI
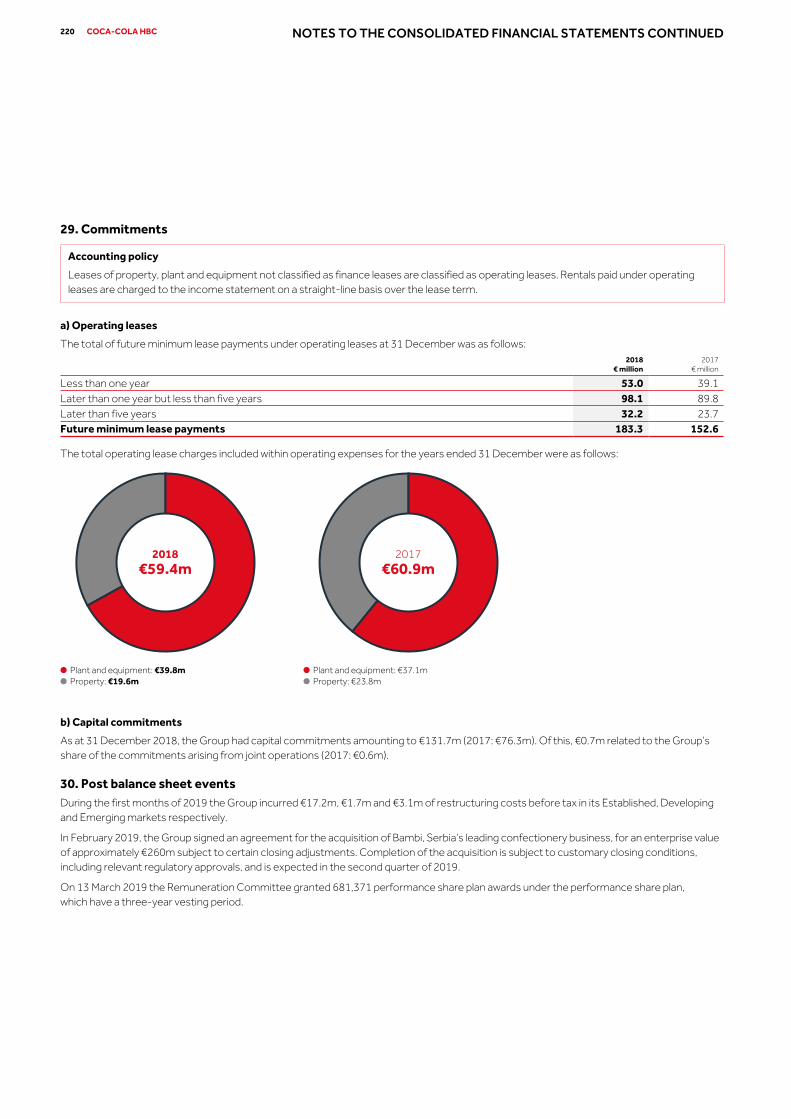
29. Commitments
Accounting policy
Leases of property, plant and equipment not classified as finance leases are classified as operating leases. Rentals paid under operating leases are charged to the income statement on a straight-line basis over the lease term.
a) Operating leases
The total of future minimum lease payments under operating leases at 31 December was as follows:
2018
€ million2017
€ million
Less than one year 53.0 39.1Later than one year but less than five years 98.1 89.8Later than five years 32.2 23.7Future minimum lease payments 183.3 152.6
The total operating lease charges included within operating expenses for the years ended 31 December were as follows:
b) Capital commitments
As at 31 December 2018, the Group had capital commitments amounting to €131.7m (2017: €76.3m). Of this, €0.7m related to the Group’s share of the commitments arising from joint operations (2017: €0.6m).
30. Post balance sheet eventsDuring the first months of 2019 the Group incurred €17.2m, €1.7m and €3.1m of restructuring costs before tax in its Established, Developing and Emerging markets respectively.
In February 2019, the Group signed an agreement for the acquisition of Bambi, Serbia’s leading confectionery business, for an enterprise value of approximately €260m subject to certain closing adjustments. Completion of the acquisition is subject to customary closing conditions, including relevant regulatory approvals, and is expected in the second quarter of 2019.
On 13 March 2019 the Remuneration Committee granted 681,371 performance share plan awards under the performance share plan, which have a three-year vesting period.
Plant and equipment: €37.1mProperty: €23.8m
2017€60.9m
Plant and equipment: €39.8mProperty: €19.6m
2018€59.4m
220 COCA-COLA HBC NOTES TO THE CONSOLIDATED FINANCIAL STATEMENTS CONTINUED
Report of the statutory auditor to the General Meeting of Coca‑Cola HBC AG Steinhausen/Zug
Report on the audit of the consolidated financial statements
OpinionWe have audited the consolidated financial statements of Coca‑Cola HBC AG and its subsidiaries (the Group), which comprise the consolidated statement of financial position as at 31 December 2018 and the consolidated income statement, consolidated statement of comprehensive income, consolidated statement of changes in equity and consolidated statement of cash flows for the year then ended, and notes to the consolidated financial statements, including a summary of significant accounting policies.
In our opinion, the accompanying consolidated financial statements (pages 153 to 220) give a true and fair view of the consolidated financial position of the Group as at 31 December 2018 and its consolidated financial performance and its consolidated cash flows for the year then ended in accordance with the International Financial Reporting Standards (IFRS) and comply with Swiss law.
Basis for opinionWe conducted our audit in accordance with Swiss law, International Standards on Auditing (ISAs) and Swiss Auditing Standards. Our responsibilities under those provisions and standards are further described in the “Auditor’s responsibilities for the audit of the consolidated financial statements” section of our report.
We are independent of the Group in accordance with the provisions of Swiss law and the requirements of the Swiss audit profession, as well as the IESBA Code of Ethics for Professional Accountants, and we have fulfilled our other ethical responsibilities in accordance with these requirements. We believe that the audit evidence we have obtained is sufficient and appropriate to provide a basis for our opinion.
Our audit approach
Overview Overall Group materiality: € 30.5 million, which represents 5% of profit before tax.
We conducted full scope audit work at subsidiary undertakings in 16 countries. Our audit scope addressed 87% of the Group’s consolidated net sales revenue and 90% of the Group’s assets. We also conducted specified audit procedures and analytical review procedures for other Group undertakings and functions.
As key audit matters, the following areas of focus, which are consistent with the prior year, have been identified:
· Goodwill and indefinite‑lived intangible assets impairment assessment
· Uncertain tax positions
· Provisions and contingent liabilitiesAudit scope
Key audit matters
Materiality
2212018 INTEGRATED ANNUAL REPORTSR
CG
FS
SSR
SI

MaterialityThe scope of our audit was influenced by our application of materiality. Our audit opinion aims to provide reasonable assurance that the consolidated financial statements are free from material misstatement. Misstatements may arise due to fraud or error. They are considered material if, individually or in aggregate, they could reasonably be expected to influence the economic decisions of users taken on the basis of the consolidated financial statements.
Based on our professional judgement, we determined certain quantitative thresholds for materiality, including the overall Group materiality for the consolidated financial statements as a whole as set out in the table below. These, together with qualitative considerations, helped us to determine the scope of our audit and the nature, timing and extent of our audit procedures and to evaluate the effect of misstatements, both individually and in aggregate, on the consolidated financial statements as a whole.
Overall Group materiality € 30.5 millionHow we determined it 5% of profit before taxRationale for the materiality benchmark applied
We chose profit before tax as the benchmark because, in our view, it is the bench mark against which the performance of the Group is most commonly measured, and it is a generally accepted benchmark.
We agreed with the Audit Committee that we would report to them misstatements above €1.0 million identified during our audit as well as any misstatements below that amount which, in our view, warranted reporting for qualitative reasons.
Audit scopeThe Group operates through its trading subsidiary undertakings in 28 countries, as set out on page 163 of the 2018 Integrated Annual Report. The processing of the accounting entries for these entities is largely centralised in a shared services centre in Bulgaria, except for the subsidiary undertakings in Russia, Ukraine, Belarus and Armenia, which process their accounting entries locally. The Group also operates a centralised treasury function in the Netherlands and in Greece and a centralised procurement function in Austria.
Mirroring the Group’s set-up, with the parent entity incorporated in Switzerland and the Group Finance Function located in Greece, we structured our audit as a referred reporting assurance engagement and involved PwC Athens as a Performing Firm, while performing specific procedures related to our role of Signing Firm of the audit report on the Consolidated Financial Statements prepared for Swiss statutory purposes.
In close liaison with the performing firm, we designed our audit by determining materiality and assessing the risks of material misstatement in the consolidated financial statements. In particular, we considered where subjective judgements were made; for example, in respect of significant accounting estimates that involved making assumptions and considering future events that are inherently uncertain. As in all of our audits, we also addressed the risk of management override of internal controls, including among other matters consideration of whether there was evidence of bias that represented a risk of material misstatement due to fraud.
We tailored the scope of our audit in order to perform sufficient work to enable us to provide an opinion on the consolidated financial statements as a whole, taking into account the geographic structure of the Group, the accounting processes and controls, and the industry in which the Group operates.
222 COCA-COLA HBC SWISS STATUTORY REPORTING
Key audit mattersKey audit matters are those matters that, in our professional judgement, were of most significance in our audit of the consolidated financial statements of the current period. These matters were addressed in the context of our audit of the consolidated financial statements as a whole, and in forming our opinion thereon, and we do not provide a separate opinion on these matters.
Goodwill and indefinite-lived intangible assets impairment assessmentKey audit matter How our audit addressed the key audit matterRefer to Note 13 for intangible assets including goodwill.
Goodwill and indefinite‑lived intangible assets as at 31 December 2018 amount to €1,622.3 million and €193.8 million, respectively.
The above noted amounts have been allocated to individual cash-generating units (‘CGUs’), which require the performance of an impairment assessment at least annually. The impairment assessment involves the determination of the recoverable amount of the CGU, being the higher of the value‑in‑use and the fair value less costs to dispose.
This area was a key matter for our audit due to the size of goodwill and indefinite‑lived intangible assets and because the determination of whether elements of goodwill and of indefinite‑lived intangible assets are impaired involves complex and subjective estimates and judgements by management about the future results of the CGUs. These estimates and judgements include assumptions surrounding revenue growth rates, direct costs, foreign exchange rates and discount rates.
Furthermore, macroeconomic volatility, competitor activity and regulatory/fiscal developments can adversely affect each CGU and potentially the carrying amount of goodwill and indefinite-lived intangible assets.
No impairment charge was recorded in 2018. Goodwill and franchise agreements held by the Nigeria CGU have been determined by management to remain sensitive to changes in the key drivers of cash flow forecasts given the continuing macroeconomic volatility in Nigeria.
We evaluated the appropriateness of management’s identification of the Group’s CGUs and the process by which management prepared the CGUs value‑in‑use calculations which we found to be satisfactory for the purposes of our audit. We tested the mathematical accuracy of the CGUs value‑in‑use calculations and compared them to the latest budget approved by the Directors and assessed the quality of the budgeting process by comparing the prior year budget with actual data.
With the support of our valuation specialists, we challenged management’s analysis around the key drivers of cash flow forecasts including selling price increases, short‑term and long‑term volume growth and the level of direct costs by comparing them with either the Group’s historical information or market data, as appropriate. We also evaluated the appropriateness of other key assumptions including discount, perpetuity growth and foreign exchange rates and we found the assumptions to be consistent and in line with our expectations.
We also performed sensitivity analyses on the key drivers of cash flow forecasts for the CGUs with significant balances of goodwill and indefinite‑lived intangible assets as well as for CGUs which remain sensitive to changes in the key drivers, including the goodwill and franchise agreements held by the Nigeria CGU.
We assessed the appropriateness and completeness of the related disclosures in Note 13, and consider them to be reasonable. As a result of our work, we found that the determination by management that no impairment was required for goodwill and indefinite‑lived intangible assets was supported by assumptions within reasonable ranges.
2232018 INTEGRATED ANNUAL REPORTSR
CG
FS
SSR
SI

Uncertain tax positionsKey audit matter How our audit addressed the key audit matterRefer to Note 10 for taxation and Note 28 for contingencies.
The Group operates in a large number of different tax jurisdictions and is subject to periodic tax audits by local tax authorities, in the normal course of business, on a range of tax matters in relation to corporate tax, transfer pricing and indirect taxes. As at 31 December 2018, the Group has current tax liabilities of €135.6 million, which include €98.5 million of provisions for tax uncertainties.
Where the amount of tax payable is uncertain, the Group establishes provisions based on management’s judgements as regards the likelihood of material tax exposures and the probable amount of the liability. We consider this area as a key audit matter given the number of judgements involved in estimating the provisions relating to uncertain tax positions and the complexities of dealing with tax rules and regulations in numerous jurisdictions.
We evaluated the related accounting policy for provisioning for tax exposures and found it to be appropriate.
In conjunction with our tax specialists, we evaluated management’s judgements in respect of estimates of tax exposures and contingencies in order to assess the adequacy of the Group’s tax provisions. In order to understand and evaluate management’s judgements, we considered the status of current tax authority audits and enquiries, the outcome of previous tax authority audits, judgemental positions taken in tax returns and current year estimates and recent developments in the various tax jurisdictions in which the Group operates.
We challenged management’s key assumptions, in particular in cases where there had been significant developments with tax authorities, noting no significant deviation from our expectations.
From the evidence obtained and in the context of the financial statements, taken as a whole, we consider the provisions in relation to uncertain tax positions as at 31 December 2018 to be appropriate.
Provisions and contingent liabilitiesKey audit matter How our audit addressed the key audit matterRefer to Note 20 for provisions and Note 28 for contingencies.
The Group faces a number of threatened and actual legal and regulatory proceedings. The determination of the provision and/or the level of disclosure required involves a high degree of judgement resulting in provisions and contingent liabilities being considered as a key audit matter.
We evaluated the design of, and tested, key controls in respect of litigation and regulatory procedures, which we found to be satisfactory for the purposes of our audit.
Our procedures included the following:
· where relevant, reading external legal advice obtained by management;
· discussing open matters with the Group general counsel; · meeting with local management and reading
subsequent correspondence; · assessing and challenging management’s conclusions through
understanding precedents set in similar cases; and · circularising relevant third‑party legal representatives and follow
up discussions, where appropriate, on certain material cases.
On the basis of the work performed, whilst noting the inherent uncertainty with such legal and regulatory matters, we determined the relevant provisions as at 31 December 2018 to be appropriate.
We assessed the appropriateness of the related disclosures in Note 28 and considered these to be reasonable.
224 COCA-COLA HBC SWISS STATUTORY REPORTING CONTINUED

Other information in the Annual ReportThe Board of Directors is responsible for the other information in the Annual Report. The other information comprises all information included in the Annual Report, but does not include the consolidated financial statements, the stand‑alone financial statements, the remuneration report of Coca-Cola HBC AG and our auditor’s reports thereon.
Our opinion on the consolidated financial statements does not cover the other information in the Annual Report and we do not express any form of assurance conclusion thereon.
In connection with our audit of the consolidated financial statements, our responsibility is to read the other information in the Annual Report and, in doing so, consider whether the other information is materially inconsistent with the consolidated financial statements or our knowledge obtained in the audit, or otherwise appears to be materially misstated. If, based on the work we have performed, we conclude that there is a material misstatement of this other information, we are required to report that fact. We have nothing to report in this regard.
Responsibilities of the Board of Directors for the consolidated financial statementsThe Board of Directors is responsible for the preparation of the consolidated financial statements that give a true and fair view in accordance with IFRS and the provisions of Swiss law, and for such internal control as the Board of Directors determines is necessary to enable the preparation of consolidated financial statements that are free from material misstatement, whether due to fraud or error.
In preparing the consolidated financial statements, the Board of Directors is responsible for assessing the Group’s ability to continue as a going concern, disclosing, as applicable, matters related to going concern and using the going concern basis of accounting unless the Board of Directors either intends to liquidate the Group or to cease operations, or has no realistic alternative but to do so.
Auditor’s responsibilities for the audit of the consolidated financial statementsOur objectives are to obtain reasonable assurance about whether the consolidated financial statements as a whole are free from material misstatement, whether due to fraud or error, and to issue an auditor’s report that includes our opinion. Reasonable assurance is a high level of assurance, but is not a guarantee that an audit conducted in accordance with Swiss law, ISAs and Swiss Auditing Standards will always detect a material misstatement when it exists. Misstatements can arise from fraud or error and are considered material if, individually or in the aggregate, they could reasonably be expected to influence the economic decisions of users taken on the basis of these consolidated financial statements.
As part of an audit in accordance with Swiss law, ISAs and Swiss Auditing Standards, we exercise professional judgment and maintain professional scepticism throughout the audit. We also:
· Identify and assess the risks of material misstatement of the consolidated financial statements, whether due to fraud or error, design and perform audit procedures responsive to those risks, and obtain audit evidence that is sufficient and appropriate to provide a basis for our opinion. The risk of not detecting a material misstatement resulting from fraud is higher than for one resulting from error, as fraud may involve collusion, forgery, intentional omissions, misrepresentations, or the override of internal control.
· Obtain an understanding of internal control relevant to the audit in order to design audit procedures that are appropriate in the circumstances, but not for the purpose of expressing an opinion on the effectiveness of the Group’s internal control.
· Evaluate the appropriateness of accounting policies used and the reasonableness of accounting estimates and related disclosures made.
· Conclude on the appropriateness of the Board of Directors’ use of the going concern basis of accounting and, based on the audit evidence obtained, whether a material uncertainty exists related to events or conditions that may cast significant doubt on the Group’s ability to continue as a going concern. If we conclude that a material uncertainty exists, we are required to draw attention in our auditor’s report to the related disclosures in the consolidated financial statements or, if such disclosures are inadequate, to modify our opinion. Our conclusions are based on the audit evidence obtained up to the date of our auditor’s report. However, future events or conditions may cause the Group to cease to continue as a going concern.
· Evaluate the overall presentation, structure and content of the consolidated financial statements, including the disclosures, and whether the consolidated financial statements represent the underlying transactions and events in a manner that achieves fair presentation.
· Obtain sufficient appropriate audit evidence regarding the financial information of the entities or business activities within the Group to express an opinion on the consolidated financial statements. We are responsible for the direction, supervision and performance of the Group audit. We remain solely responsible for our audit opinion.
2252018 INTEGRATED ANNUAL REPORTSR
CG
FS
SSR
SI

We communicate with the Board of Directors or its relevant committee regarding, among other matters, the planned scope and timing of the audit and significant audit findings, including any significant deficiencies in internal control that we identify during our audit.
We also provide the Board of Directors or its relevant committee with a statement that we have complied with relevant ethical requirements regarding independence, and to communicate with them all relationships and other matters that may reasonably be thought to bear on our independence, and where applicable, related safeguards.
From the matters communicated with the Board of Directors or its relevant committee, we determine those matters that were of most significance in the audit of the consolidated financial statements of the current period and are therefore the key audit matters. We describe these matters in our auditor’s report unless law or regulation precludes public disclosure about the matter or when, in extremely rare circumstances, we determine that a matter should not be communicated in our report because the adverse consequences of doing so would reasonably be expected to outweigh the public interest benefits of such communication.
Report on other legal and regulatory requirementsIn accordance with article 728a paragraph 1 item 3 CO and Swiss Auditing Standard 890, we confirm that an internal control system exists which has been designed for the preparation of consolidated financial statements according to the instructions of the Board of Directors.
We recommend that the consolidated financial statements submitted to you be approved.
PricewaterhouseCoopers AG
Michael FoleyAudit expert Auditor in charge
Lausanne, 15 March 2019
Luigi Voulgarelis
226 COCA-COLA HBC SWISS STATUTORY REPORTING CONTINUED

Report of the statutory auditor to the General Meeting of Coca‑Cola HBC AG Steinhausen/Zug
Report on the audit of the financial statements
OpinionWe have audited the financial statements of Coca‑Cola HBC AG, which comprise the balance sheet as at 31 December 2018, income statement and notes for the year then ended, including a summary of significant accounting policies.
In our opinion, the accompanying financial statements (pages 230 to 240) as at 31 December 2018 comply with Swiss law and the Company’s articles of incorporation.
Basis for opinionWe conducted our audit in accordance with Swiss law and Swiss Auditing Standards. Our responsibilities under those provisions and standards are further described in the “Auditor’s responsibilities for the audit of the financial statements” section of our report.
We are independent of the entity in accordance with the provisions of Swiss law and the requirements of the Swiss audit profession and we have fulfilled our other ethical responsibilities in accordance with these requirements. We believe that the audit evidence we have obtained is sufficient and appropriate to provide a basis for our opinion.
Our audit approach
Overview Overall materiality: CHF 41.1 million, which represents 0.5% of net assets.
We tailored the scope of our audit in order to perform sufficient work to enable us to provide an opinion on the financial statements as a whole, taking into account the structure of the entity, the accounting processes and controls, and the industry in which the entity operates.
As key audit matter, consistent with the prior year, the following area of focus has been identified:
· Valuation of investment in subsidiary
Audit scope
Key audit matters
Materiality
2272018 INTEGRATED ANNUAL REPORTSR
CG
FS
SSR
SI

MaterialityThe scope of our audit was influenced by our application of materiality. Our audit opinion aims to provide reasonable assurance that the financial statements are free from material misstatement. Misstatements may arise due to fraud or error. They are considered material if, individually or in aggregate, they could reasonably be expected to influence the economic decisions of users taken on the basis of the financial statements.
Based on our professional judgement, we determined certain quantitative thresholds for materiality, including the overall materiality for the financial statements as a whole as set out in the table below. These, together with qualitative considerations, helped us to determine the scope of our audit and the nature, timing and extent of our audit procedures and to evaluate the effect of misstatements, both individually and in aggregate, on the financial statements as a whole.
Overall materiality CHF 41.1 millionHow we determined it 0.5% of net assetsRationale for the materiality benchmark applied
We chose net assets as the benchmark because, in our view, it is the benchmark which reflects the actual substance of the entity. This is a generally accepted benchmark for ultimate holding entities.
Audit scopeWe designed our audit by determining materiality and assessing the risks of material misstatement in the financial statements. In particular, we considered where subjective judgements were made; for example, in respect of significant accounting estimates that involved making assumptions and considering future events that are inherently uncertain. As in all of our audits, we also addressed the risk of management override of internal controls, including among other matters consideration of whether there was evidence of bias that represented a risk of material misstatement due to fraud.
Report on key audit matters based on the circular 1/2015 of the Federal Audit Oversight AuthorityKey audit matters are those matters that, in our professional judgement, were of most significance in our audit of the financial statements of the current period. These matters were addressed in the context of our audit of the financial statements as a whole, and in forming our opinion thereon, and we do not provide a separate opinion on these matters.
Valuation of investment in subsidiaryKey audit matter How our audit addressed the key audit matterSee Notes 1 and 2.2 to the financial statements of the Company for the Directors’ disclosures of the related accounting policy and the detailed information on the valuation of the investment in subsidiary.
The investment in subsidiary as at 31 December 2018 amounts to CHF 8,265 million.
The valuation of the investment in subsidiary is inherently a matter of judgement as it relies on forecasts of future profitability and cash flows. Macroeconomic volatility, competitor activity and regulatory/fiscal developments can adversely affect each underlying cash‑generating unit and potentially the carrying amount of the total investments.
The Company’s market capitalisation is subject to share price volatility.
Management tests the carrying value of the Company’s investment annually by comparing the market capitalisation of the Group with the carrying value of the investment.
We reperformed the market capitalisation comparison test performed by management.
In addition, we obtained comfort over the valuation of investment in subsidiary by reviewing management’s goodwill impairment analysis performed for the purposes of the IFRS consolidated financial statements.
As a result of our work, we found management’s assumptions and their determination that no impairment was required to be reasonable, after having recorded the reduction of the investment to reflect the dividend received from Coca Cola HBC Holdings B.V. of CHF 236.3 million.
Responsibilities of the Board of Directors for the financial statementsThe Board of Directors is responsible for the preparation of the financial statements in accordance with the provisions of Swiss law and the Company’s articles of incorporation, and for such internal control as the Board of Directors determines is necessary to enable the preparation of financial statements that are free from material misstatement, whether due to fraud or error.
In preparing the financial statements, the Board of Directors is responsible for assessing the entity’s ability to continue as a going concern, disclosing, as applicable, matters related to going concern and using the going concern basis of accounting unless the Board of Directors either intends to liquidate the entity or to cease operations, or has no realistic alternative but to do so.
228 COCA-COLA HBC SWISS STATUTORY REPORTING CONTINUED

Auditor’s responsibilities for the audit of the financial statementsOur objectives are to obtain reasonable assurance about whether the financial statements as a whole are free from material misstatement, whether due to fraud or error, and to issue an auditor’s report that includes our opinion. Reasonable assurance is a high level of assurance, but is not a guarantee that an audit conducted in accordance with Swiss law and Swiss Auditing Standards will always detect a material misstatement when it exists. Misstatements can arise from fraud or error and are considered material if, individually or in the aggregate, they could reasonably be expected to influence the economic decisions of users taken on the basis of these financial statements.
As part of an audit in accordance with Swiss law and Swiss Auditing Standards, we exercise professional judgment and maintain professional scepticism throughout the audit. We also:
· Identify and assess the risks of material misstatement of the financial statements, whether due to fraud or error, design and perform audit procedures responsive to those risks, and obtain audit evidence that is sufficient and appropriate to provide a basis for our opinion. The risk of not detecting a material misstatement resulting from fraud is higher than for one resulting from error, as fraud may involve collusion, forgery, intentional omissions, misrepresentations, or the override of internal control.
· Obtain an understanding of internal control relevant to the audit in order to design audit procedures that are appropriate in the circumstances, but not for the purpose of expressing an opinion on the effectiveness of the entity’s internal control.
· Evaluate the appropriateness of accounting policies used and the reasonableness of accounting estimates and related disclosures made.
· Conclude on the appropriateness of the Board of Directors’ use of the going concern basis of accounting and, based on the audit evidence obtained, whether a material uncertainty exists related to events or conditions that may cast significant doubt on the entity’s ability to continue as a going concern. If we conclude that a material uncertainty exists, we are required to draw attention in our auditor’s report to the related disclosures in the financial statements or, if such disclosures are inadequate, to modify our opinion. Our conclusions are based on the audit evidence obtained up to the date of our auditor’s report. However, future events or conditions may cause the entity to cease to continue as a going concern.
We communicate with the Board of Directors or its relevant committee regarding, among other matters, the planned scope and timing of the audit and significant audit findings, including any significant deficiencies in internal control that we identify during our audit.
We also provide the Board of Directors or its relevant committee with a statement that we have complied with relevant ethical requirements regarding independence, and to communicate with them all relationships and other matters that may reasonably be thought to bear on our independence, and where applicable, related safeguards.
From the matters communicated with the Board of Directors or its relevant committee, we determine those matters that were of most significance in the audit of the financial statements of the current period and are therefore the key audit matters. We describe these matters in our auditor’s report unless law or regulation precludes public disclosure about the matter or when, in extremely rare circumstances, we determine that a matter should not be communicated in our report because the adverse consequences of doing so would reasonably be expected to outweigh the public interest benefits of such communication.
Report on other legal and regulatory requirementsIn accordance with article 728a paragraph 1 item 3 CO and Swiss Auditing Standard 890, we confirm that an internal control system exists which has been designed for the preparation of financial statements according to the instructions of the Board of Directors.
We further confirm that the proposed appropriation of available earnings complies with Swiss law and the Company’s articles of incorporation. We recommend that the financial statements submitted to you be approved.
PricewaterhouseCoopers AG
Michael FoleyAudit expert Auditor in charge
Lausanne, 15 March 2019
Luigi Voulgarelis
2292018 INTEGRATED ANNUAL REPORTSR
CG
FS
SSR
SI

Coca-Cola HBC AG’s financial statements, Zug
Balance sheetAs at 31 December
CHF thousands
Note 2018 2017
ASSETSCash and cash equivalents 489 601Short‑term receivables from direct and indirect participations 2.1 5,377 37,673Short‑term receivables from third parties 1,071 1,126Prepaid expenses and accrued income – 37Total current assets 6,937 39,437Investments in subsidiaries 2.2 8,264,856 8,501,197Property, plant and equipment 1,153 1,296Total non-current assets 8,266,009 8,502,493Total assets 8,272,946 8,541,930
LIABILITIES AND SHAREHOLDERS’ EQUITYTrade payables due to third parties 1,206 1,170Short‑term liabilities to direct and indirect participations 2.3 2,608 2,168Short‑term interest‑bearing liabilities to direct and indirect participations – 117Accrued expenses 2.3 39,990 20,002Total short-term liabilities 43,804 23,457Long‑term interest‑bearing liabilities to indirect participations 2.4 9,832 –Provisions 2.5 8,688 65Total long-term liabilities 18,520 65Share capital 2.6 2,491,242 2,484,112Legal capital reserves
Reserves from capital contributions 5,601,593 5,824,716Reserves for treasury shares 2.7 85,298 85,298
Retained earningsResults carried forward 126,232 137,297Loss for the year (60,140) (11,065)
Treasury shares 2.7 (33,603) (1,950)Total shareholders’ equity 2.8 8,210,622 8,518,408Total liabilities and shareholders’ equity 8,272,946 8,541,930
230 COCA-COLA HBC SWISS STATUTORY REPORTING CONTINUED

Coca-Cola HBC AG’s financial statements, Zug
Statement of income Year ended 31 December
CHF thousands
Note 2018 2017
Dividend income 236,341 203,385Other operating income 2.9 20,412 34,420Total operating income 256,753 237,805 Employee costs 2.10 (35,649) (27,463)Other operating expenses 2.11 (43,758) (15,719)Write down of investments 2.2 (236,341) (203,385)Depreciation of property, plant and equipment (192) (197)Total operating expenses (315,940) (246,764) Operating loss (59,187) (8,959) Finance income 399 –Finance costs (852) (1,835)Foreign exchange differences (281) – Loss before tax (59,921) (10,794)Direct taxes (219) (271) Loss for the year (60,140) (11,065)
2312018 INTEGRATED ANNUAL REPORTSR
CG
FS
SSR
SI

Notes to the financial statements of Coca-Cola HBC AG, Zug
IntroductionCoca-Cola HBC AG (‘the Company’) was incorporated on 19 September 2012 by Kar-Tess Holding. On 11 October 2012, the Company announced a voluntary share exchange offer to acquire all outstanding ordinary registered shares and all American depositary shares of Coca-Cola Hellenic Bottling Company S.A., Maroussi (GR) (‘CCHBC SA’). As a result of the successful completion of this offer, on 25 April 2013 the Company acquired 96.85% of the issued CCHBC SA shares, including shares represented by American depositary shares, and became the new parent company of the Group (the Company and its direct and indirect subsidiaries). On 17 June 2013, the Company completed its statutory buyout of the remaining shares of CCHBC SA that it did not acquire upon completion of its voluntary share exchange offer.
1. Accounting principles
Accounting principles applied in the preparation of the financial statements
These financial statements have been prepared in accordance with the provisions of commercial accounting as set out in the Swiss Code of Obligations (Art. 957 to 963b CO). Significant accounting and valuation principles are described below:
Dividend income
Dividend income is recognised when the right to receive payment is established.
Other operating income
The Company provides management services to its principal subsidiaries and acts as guarantor to its principal subsidiary, Coca‑Cola HBC Finance B.V. The income from these services is recognised in the accounting period in which the service is provided.
Exchange rate differences
The accounting records of the Company are retained in Euro and translated to Swiss francs (CHF) for presentation purposes. Except for investments in subsidiaries, property, plant and equipment, long-term liabilities and equity, which are translated at historical rates, all assets and liabilities denominated in foreign currencies are translated into CHF using the closing exchange rate as at 31 December 2018. Income and expenses are translated into CHF at the average exchange rate of the reporting year except for dividend income and related write down of investments (see Note 2.2) which are valued at the transaction date exchange rate. Net unrealised exchange losses are recorded in the income statement, while net unrealised gains are deferred within accrued liabilities.
Balance sheet as at Income statement for the year ended
Exchange rates 31 December 2018 31 December 2017 31 December 2018 31 December 2017
EUR 1.13 1.17 1.16 1.11USD 0.99 0.99 GBP 1.25 1.32
Investments in subsidiaries
Investments in subsidiaries are valued at historical cost and evaluated for impairment if identified triggering events occur.
Property, plant and equipment
Depreciation is calculated on the basis of the following useful lives and in accordance with the following methods:Property, plant and equipment Useful life Method
Leasehold improvement (building) 20 years 5% linearLeasehold improvement (office infrastructure) 10 years 10% linearBuilding infrastructure 12 years 8.33% linearFurniture and fixtures, office equipment and other tangible fixed assets 8 years 12.5% linearTelephony infrastructure 7 years 14.29% linearCommunication equipment, computers and PCs 4 years 25% linearTablets 3 years 33.33% linear
Treasury shares
Treasury shares are recognised at acquisition cost and deducted from shareholders’ equity at the time of acquisition. If treasury shares are sold, the gain or loss arising is recognised in the income statement as finance income or finance cost as appropriate.
232 COCA-COLA HBC SWISS STATUTORY REPORTING CONTINUED

2. Information relating to the balance sheet and statement of income
2.1. Short-term receivables from direct and indirect participations
The short‑term receivables from direct and indirect participations do not bear interest. As at 31 December
CHF thousands
Name of participation 2018 2017
Coca-Cola HBC Schweiz AG, Brüttisellen – 14CCB Management Services GmbH, Vienna 4,693 16,076Coca‑Cola HBC Finance B.V., Amsterdam 684 21,583Short-term receivables from direct and indirect participations 5,377 37,673
2.2. Investments in subsidiaries As at 31 December
CHF thousands
Direct subsidiary Share of capital Share of votes 2018 2017
Coca‑Cola HBC Holdings B.V., Amsterdam1 100% 100% 8,501,197 8,704,582Write down of investment (236,341) (203,385)Investments in subsidiaries 100% 100% 8,264,856 8,501,197
1. Coca‑Cola HBC Holdings B.V., Amsterdam was incorporated on 26 June 2013
In 2015 the Company adopted a practice to reduce the value of its investment in Coca-Cola HBC Holdings B.V. by an amount equal to the dividend received from that subsidiary. The amount of the write down in 2018 is equal to the dividend received in July 2018 from Coca-Cola HBC Holdings B.V. of CHF 236,341 thousand.
The principal direct and indirect participations of the Company are disclosed in Note 15 to the consolidated financial statements.
2.3. Short-term liabilities to direct and indirect participations and accrued expenses
The short‑term liabilities to the direct and indirect participations do not bear interest except for the liability to Coca‑Cola HBC Finance B.V. which is interest bearing.
As at 31 December
CHF thousands
Name of participation 2018 2017
CCB Management Services GmbH, Vienna 2,557 1,865Coca‑Cola Hellenic Business Service Organisation, Sofia – 50Coca‑Cola HBC Srbija d.o.o., Belgrade – 146Coca‑Cola HBC Finance B.V. Amsterdam 49 89Coca-Cola HBC Switzerland AG, Brüttisellen 1 –Coca‑Cola HBC Northern Ireland Ltd., Lisburn 1 18Total short-term non interest-bearing liabilities to direct and indirect participations 2,608 2,168
As at 31 December
CHF thousands
Name of participation 2018 2017
Coca‑Cola HBC Finance B.V., Amsterdam – 117Total short-term interest-bearing liabilities to direct and indirect participations – 117
As at 31 December
CHF thousands
Accrued expenses 2018 2017
Direct taxes 309 359Management Incentive Plan and Performance Share Plan for own employees 15,125 15,963Employee related costs (social security & insurance and payroll taxes) 2,192 1,734Provision for acquiring treasury shares to satisfy subsidiaries’ Performance Share Plan rights 17,067 –Other accrued expenses 5,297 1,205Net unrealised gains from foreign currency translation – 741Total accrued expenses 39,990 20,002
2332018 INTEGRATED ANNUAL REPORTSR
CG
FS
SSR
SI
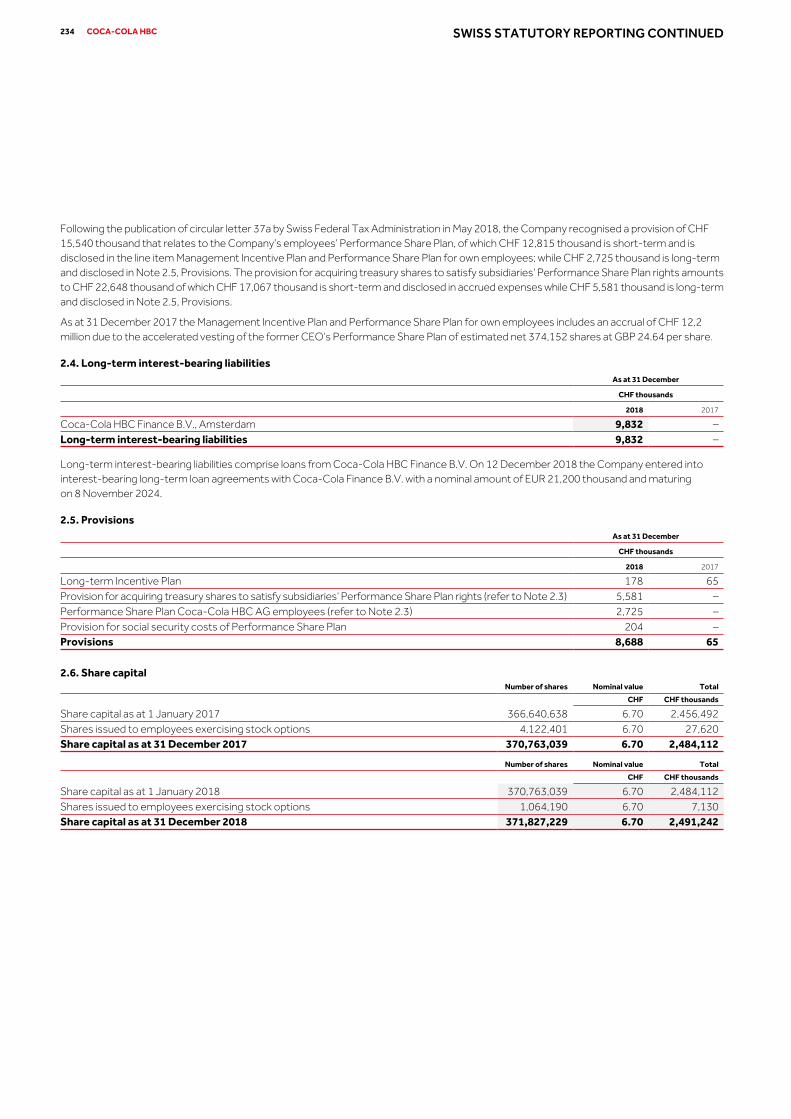
Following the publication of circular letter 37a by Swiss Federal Tax Administration in May 2018, the Company recognised a provision of CHF 15,540 thousand that relates to the Company’s employees’ Performance Share Plan, of which CHF 12,815 thousand is short-term and is disclosed in the line item Management Incentive Plan and Performance Share Plan for own employees; while CHF 2,725 thousand is long-term and disclosed in Note 2.5, Provisions. The provision for acquiring treasury shares to satisfy subsidiaries’ Performance Share Plan rights amounts to CHF 22,648 thousand of which CHF 17,067 thousand is short-term and disclosed in accrued expenses while CHF 5,581 thousand is long-term and disclosed in Note 2.5, Provisions.
As at 31 December 2017 the Management Incentive Plan and Performance Share Plan for own employees includes an accrual of CHF 12,2 million due to the accelerated vesting of the former CEO’s Performance Share Plan of estimated net 374,152 shares at GBP 24.64 per share.
2.4. Long-term interest-bearing liabilities As at 31 December
CHF thousands
2018 2017
Coca‑Cola HBC Finance B.V., Amsterdam 9,832 –Long-term interest-bearing liabilities 9,832 –
Long‑term interest‑bearing liabilities comprise loans from Coca‑Cola HBC Finance B.V. On 12 December 2018 the Company entered into interest-bearing long-term loan agreements with Coca-Cola Finance B.V. with a nominal amount of EUR 21,200 thousand and maturing on 8 November 2024.
2.5. Provisions As at 31 December
CHF thousands
2018 2017
Long-term Incentive Plan 178 65Provision for acquiring treasury shares to satisfy subsidiaries’ Performance Share Plan rights (refer to Note 2.3) 5,581 –Performance Share Plan Coca-Cola HBC AG employees (refer to Note 2.3) 2,725 –Provision for social security costs of Performance Share Plan 204 – Provisions 8,688 65
2.6. Share capital Number of shares Nominal value Total
CHF CHF thousands
Share capital as at 1 January 2017 366,640,638 6.70 2,456,492Shares issued to employees exercising stock options 4,122,401 6.70 27,620Share capital as at 31 December 2017 370,763,039 6.70 2,484,112
Number of shares Nominal value Total
CHF CHF thousands
Share capital as at 1 January 2018 370,763,039 6.70 2,484,112Shares issued to employees exercising stock options 1,064,190 6.70 7,130Share capital as at 31 December 2018 371,827,229 6.70 2,491,242
234 COCA-COLA HBC SWISS STATUTORY REPORTING CONTINUED
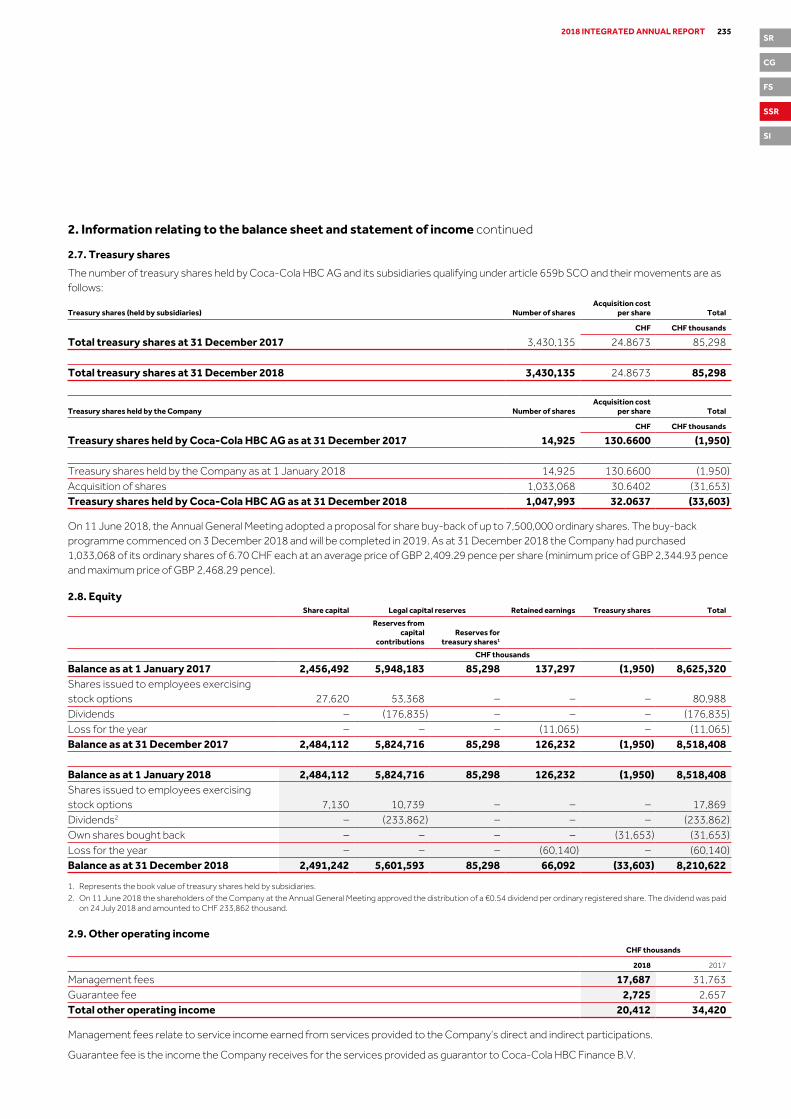
2. Information relating to the balance sheet and statement of income continued
2.7. Treasury shares
The number of treasury shares held by Coca-Cola HBC AG and its subsidiaries qualifying under article 659b SCO and their movements are as follows:
Treasury shares (held by subsidiaries) Number of sharesAcquisition cost
per share Total
CHF CHF thousands
Total treasury shares at 31 December 2017 3,430,135 24.8673 85,298 Total treasury shares at 31 December 2018 3,430,135 24.8673 85,298
Treasury shares held by the Company Number of sharesAcquisition cost
per share Total
CHF CHF thousands
Treasury shares held by Coca-Cola HBC AG as at 31 December 2017 14,925 130.6600 (1,950) Treasury shares held by the Company as at 1 January 2018 14,925 130.6600 (1,950)Acquisition of shares 1,033,068 30.6402 (31,653)Treasury shares held by Coca-Cola HBC AG as at 31 December 2018 1,047,993 32.0637 (33,603)
On 11 June 2018, the Annual General Meeting adopted a proposal for share buy‑back of up to 7,500,000 ordinary shares. The buy‑back programme commenced on 3 December 2018 and will be completed in 2019. As at 31 December 2018 the Company had purchased 1,033,068 of its ordinary shares of 6.70 CHF each at an average price of GBP 2,409.29 pence per share (minimum price of GBP 2,344.93 pence and maximum price of GBP 2,468.29 pence).
2.8. Equity Share capital Legal capital reserves Retained earnings Treasury shares Total
Reserves from capital
contributionsReserves for
treasury shares1
CHF thousands
Balance as at 1 January 2017 2,456,492 5,948,183 85,298 137,297 (1,950) 8,625,320Shares issued to employees exercising stock options 27,620 53,368 – – – 80,988Dividends – (176,835) – – – (176,835)Loss for the year – – – (11,065) – (11,065)Balance as at 31 December 2017 2,484,112 5,824,716 85,298 126,232 (1,950) 8,518,408 Balance as at 1 January 2018 2,484,112 5,824,716 85,298 126,232 (1,950) 8,518,408Shares issued to employees exercising stock options 7,130 10,739 – – – 17,869Dividends2 – (233,862) – – – (233,862)Own shares bought back – – – – (31,653) (31,653)Loss for the year – – – (60,140) – (60,140)Balance as at 31 December 2018 2,491,242 5,601,593 85,298 66,092 (33,603) 8,210,622
1. Represents the book value of treasury shares held by subsidiaries.2. On 11 June 2018 the shareholders of the Company at the Annual General Meeting approved the distribution of a €0.54 dividend per ordinary registered share. The dividend was paid
on 24 July 2018 and amounted to CHF 233,862 thousand.
2.9. Other operating income CHF thousands
2018 2017
Management fees 17,687 31,763Guarantee fee 2,725 2,657Total other operating income 20,412 34,420
Management fees relate to service income earned from services provided to the Company‘s direct and indirect participations.
Guarantee fee is the income the Company receives for the services provided as guarantor to Coca‑Cola HBC Finance B.V.
2352018 INTEGRATED ANNUAL REPORTSR
CG
FS
SSR
SI

2.10 Employee costs CHF thousands
2018 2017
Wages and salaries 10, 298 11,020Social security costs 3,922 985Pensions and employee benefits 21,429 15,458Total employee costs 35,649 27,463
Pensions and employee benefits mainly include Performance Share Plan expenses for CCHBC AG employees of the amount of CHF 15,540 thousand, refer to Note 2.3 for more information.
2.11 Other operating expenses
Other operating expenses that amount to CHF 43,758 thousand for 2018 mainly include CHF 16,776 thousand that correspond to estimated net costs to acquire treasury shares on behalf of the subsidiaries, to extinguish vested Performance Share Plan rights (refer to Note 2.3 for more information) and CHF 14,248 thousand for management fees to CCB Management Services GmbH.
3. Other information
3.1. Net release of hidden reserves
No hidden reserves were released for the years ended 31 December 2018 or 31 December 2017.
3.2. Number of employees
In 2018 and 2017 on an annual average basis, the number of full-time equivalent employees did not exceed 50.
3.3. Operating lease liabilities (not terminable or expiring within 12 months of balance sheet date) Residual term (years) 2018 2017
CHF thousands
Office rental, Turmstrasse 26, Steinhausen (Zug) 1 to 5 year 1,399 –Total lease liabilities 1,399 –
3.4. Contingent liabilities
Euro medium-term note programmes
In June 2013 the Group established a new €3.0bn Euro medium-term note programme (the ‘EMTN Programme’). The EMTN Programme was updated in September 2014 and then again in September 2015. Notes are issued under the EMTN Programme through the Company’s wholly owned subsidiary, Coca‑Cola HBC Finance B.V., a private limited liability company established under the laws of the Netherlands, and are guaranteed by the Company.
On 18 June 2013 Coca-Cola HBC Finance B.V. issued €800m 2.375% notes due 18 June 2020 under the EMTN Programme, which are guaranteed by the Company.
On 10 March 2016 Coca-Cola HBC Finance B.V. issued €600m 1.875% notes due 11 November 2024 under the EMTN Programme, which are guaranteed by the Company.
As at 31 December 2018, a total of €1.4bn in notes issued under the EMTN Programme were outstanding.
The EMTN Programme has not been updated since September 2015 so further issues under the EMTN Programme are currently not possible pending a further update.
Syndicated multi-currency revolving credit facility
In June 2015, a new syndicated multi‑currency revolving credit facility agreement was signed for €500m. Coca‑Cola HBC Finance B.V. is the original borrower, ING Bank N.V., London Branch the facility agent and the Company and Coca‑Cola HBC Holdings B.V are the two guarantors.
Commercial paper programme
In October 2013 the Group established a new €1.0bn Euro commercial paper programme (the ‘CP Programme’). The CP Programme was updated in September 2014 and then again in May 2017. Notes are issued under the CP Programme by Coca-Cola HBC Finance B.V. and guaranteed by the Company. The outstanding amount under the CP Programme was €95m as at 31 December 2018 (2017: €120m).
236 COCA-COLA HBC SWISS STATUTORY REPORTING CONTINUED
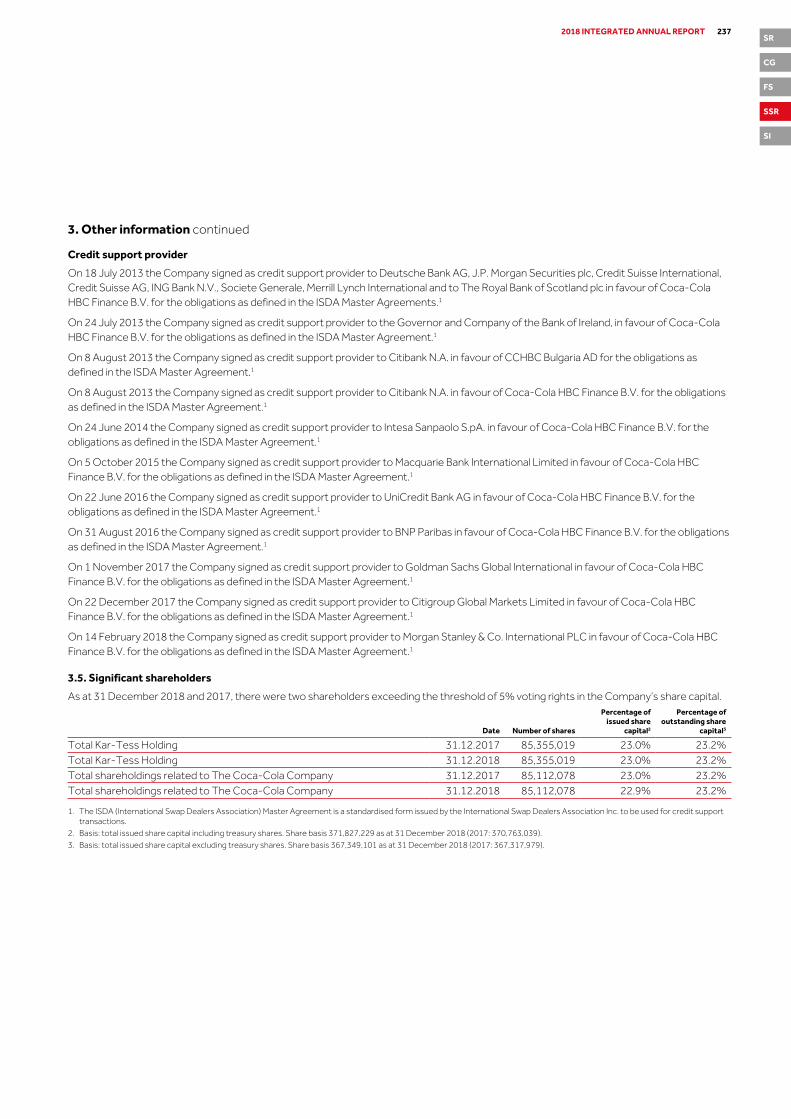
3. Other information continued
Credit support provider
On 18 July 2013 the Company signed as credit support provider to Deutsche Bank AG, J.P. Morgan Securities plc, Credit Suisse International, Credit Suisse AG, ING Bank N.V., Societe Generale, Merrill Lynch International and to The Royal Bank of Scotland plc in favour of Coca‑Cola HBC Finance B.V. for the obligations as defined in the ISDA Master Agreements.1
On 24 July 2013 the Company signed as credit support provider to the Governor and Company of the Bank of Ireland, in favour of Coca‑Cola HBC Finance B.V. for the obligations as defined in the ISDA Master Agreement.1
On 8 August 2013 the Company signed as credit support provider to Citibank N.A. in favour of CCHBC Bulgaria AD for the obligations as defined in the ISDA Master Agreement.1
On 8 August 2013 the Company signed as credit support provider to Citibank N.A. in favour of Coca‑Cola HBC Finance B.V. for the obligations as defined in the ISDA Master Agreement.1
On 24 June 2014 the Company signed as credit support provider to Intesa Sanpaolo S.pA. in favour of Coca‑Cola HBC Finance B.V. for the obligations as defined in the ISDA Master Agreement.1
On 5 October 2015 the Company signed as credit support provider to Macquarie Bank International Limited in favour of Coca-Cola HBC Finance B.V. for the obligations as defined in the ISDA Master Agreement.1
On 22 June 2016 the Company signed as credit support provider to UniCredit Bank AG in favour of Coca‑Cola HBC Finance B.V. for the obligations as defined in the ISDA Master Agreement.1
On 31 August 2016 the Company signed as credit support provider to BNP Paribas in favour of Coca-Cola HBC Finance B.V. for the obligations as defined in the ISDA Master Agreement.1
On 1 November 2017 the Company signed as credit support provider to Goldman Sachs Global International in favour of Coca‑Cola HBC Finance B.V. for the obligations as defined in the ISDA Master Agreement.1
On 22 December 2017 the Company signed as credit support provider to Citigroup Global Markets Limited in favour of Coca‑Cola HBC Finance B.V. for the obligations as defined in the ISDA Master Agreement.1
On 14 February 2018 the Company signed as credit support provider to Morgan Stanley & Co. International PLC in favour of Coca-Cola HBC Finance B.V. for the obligations as defined in the ISDA Master Agreement.1
3.5. Significant shareholders
As at 31 December 2018 and 2017, there were two shareholders exceeding the threshold of 5% voting rights in the Company’s share capital.
Date Number of shares
Percentage of issued share
capital2
Percentage of outstanding share
capital3
Total Kar‑Tess Holding 31.12.2017 85,355,019 23.0% 23.2%Total Kar‑Tess Holding 31.12.2018 85,355,019 23.0% 23.2%Total shareholdings related to The Coca‑Cola Company 31.12.2017 85,112,078 23.0% 23.2%Total shareholdings related to The Coca‑Cola Company 31.12.2018 85,112,078 22.9% 23.2%
1. The ISDA (International Swap Dealers Association) Master Agreement is a standardised form issued by the International Swap Dealers Association Inc. to be used for credit support transactions.
2. Basis: total issued share capital including treasury shares. Share basis 371,827,229 as at 31 December 2018 (2017: 370,763,039).3. Basis: total issued share capital excluding treasury shares. Share basis 367,349,101 as at 31 December 2018 (2017: 367,317,979).
2372018 INTEGRATED ANNUAL REPORTSR
CG
FS
SSR
SI

3.6. Shareholdings, conversion and option rights
The table below sets out a comparison of the interests in the Company’s total issued share capital that the members of the Board of Directors (‘Directors’) and Operating Committee hold (all of which, unless otherwise stated, are beneficial interests or are interests of a person connected with a Director or a member of the Operating Committee) and the interests in the Company’s share capital.
31 December 2018 31 December 2017
Number of shares
Percentage of issued share
capital1
Percentage of outstanding share
capital2 Number of shares
Percentage of issued share
capital1
Percentage of outstanding share
capital2
Directors Anastassis G. David3 – – – – – –Zoran Bogdanovic 22,819 0.01% 0.01% 19,869 0.01% 0.01%Dimitris Lois – – – 57,379 0.02% 0.02%Ahmet C. Bozer – – – – – –Charlotte J. Boyle 1,017 0.00% 0.00% – – –Antonio D’Amato4 – – – – – –Olusola (Sola) David-Borha – – – – – –William W. (Bill) Douglas III 10,000 0.00% 0.00% 10,000 0.00% 0.00%Reto Francioni – – – – – –Anastasios I. Leventis5 – – – – – –Christo Leventis6 – – – – – –Alexandra Papalexopoulou – – – – – –José Octavio Reyes – – – – – –Robert Ryan Rudolph – – – – – –John P. Sechi – – – – – –
31 December 2018 31 December 2017
Number of shares
Percentage of issued share
capital1
Percentage of outstanding share
capital2 Number of shares
Percentage of issued share
capital1
Percentage of outstanding share
capital2
Operating Committee Alain Brouhard 19,901 0.01% 0.01% 17,304 0.00% 0.00%Jan Gustavsson 59,544 0.02% 0.02% 56,633 0.02% 0.02%Keith Sanders 30,351 0.01% 0.01% 28,555 0.01% 0.01%Martin Marcel 22,832 0.01% 0.01% 9,171 0.00% 0.00%Michalis Imellos 18,003 0.00% 0.00% 16,650 0.00% 0.00%Nikolaos Kalaitzidakis 940 0.00% 0.00% – – –Naya Kalogeraki 3,906 0.00% 0.00% 1,755 0.00% 0.00%Sanda Parezanovic 3,012 0.00% 0.00% 2,236 0.00% 0.00%Sotiris Yannopoulos 13,781 0.00% 0.00% 12,385 0.00% 0.00%
238 COCA-COLA HBC SWISS STATUTORY REPORTING CONTINUED

3. Other information continuedThe following table sets out information regarding the stock options and performance shares held by members of the Operating Committee as at 31 December 2018:
Stock options (‘ESOP’) Performance shares (‘PSP’)
Number of
stock optionsAlready
vestedVesting at the
end of 2019 Granted in
2018
Unvested and subject to
performance conditions Vested
Zoran Bogdanovic7 210,000 210,000 – 86,404 171,245 –Alain Brouhard 260,000 260,000 – 20,136 101,411 –Jan Gustavsson 561,000 561,000 – 22,634 113,824 –Keith Sanders 430,000 430,000 – 21,994 110,939 –Martin Marcel 132,505 132,505 – 19,550 96,121 –Nikolaos Kalaitzidakis 11,000 11,000 – 12,080 43,572 –Michalis Imellos 277,500 277,500 – 25,200 125,955 –Naya Kalogeraki 45,000 45,000 – 18,572 61,761 –Sanda Parezanovic 48,500 48,500 – 17,517 80,163 –Sotiris Yannopoulos – – – 19,794 97,938 –
1. Basis: total issued share capital including treasury shares. Share basis 371,827,229 as at 31 December 2018 (2017: 370,763,039).2. Basis: total issued share capital excluding treasury shares. Share basis 367,349,101 as at 31 December 2018 (2017: 367,317,979).3. Anastassis David is a beneficiary of:
(a) a private discretionary trust for the primary benefit of present and future members of the family of the late Anastasios George Leventis, of which Truad Verwaltungs AG is the Trustee, whereby he has an indirect interest with respect to the 85,355,019 shares held by Kar-Tess Holding S.A.(b) a further private discretionary trust for the primary benefit of present and future members of the family of the late Anastasios George Leventis, of which Selene Treuhand AG is the Trustee, whereby he has an indirect interest with respect to 823,008 shares held by Selene Treuhand AG.
4. Antonio D’ Amato retired from the Board of Directors, the Remuneration Committee and the Nomination Committee on 20 June 2017.5. Anastasios I. Leventis is a beneficiary of:
(a) a private discretionary trust for the primary benefit of present and future members of the family of the late Anastasios George Leventis, of which Truad Verwaltungs AG is the Trustee, whereby he has an indirect interest with respect to the 85,355,019 shares held by Kar-Tess Holding S.A.(b) a further private discretionary trust for the primary benefit of present and future members of the family of the late Anastasios George Leventis, of which Selene Treuhand AG is the Trustee, whereby he has an indirect interest with respect to 286,879 shares held by Selene Treuhand AG.(c) a further private discretionary trust for the primary benefit of present and future members of the family of the late Christodoulos Papaneokleus Leventis, of which Mervail Company (PTC) Limited is the Trustee, whereby he has an indirect interest with respect to 623,664 shares held by Carlcan Holding Limited.
6. Christo Leventis is a beneficiary of:(a) a private discretionary trust for the primary benefit of present and future members of the family of the late Anastasios George Leventis, of which Truad Verwaltungs AG is the Trustee, whereby he has an indirect interest with respect to the 85,355,019 shares held by Kar-Tess Holding S.A.(b) a further private discretionary trust for the primary benefit of present and future members of the family of the late Anastasios George Leventis, of which Selene Treuhand AG is the Trustee, whereby he has an indirect interest with respect to 458,545 shares held by Selene Treuhand AG.(c) a further private discretionary trust for the primary benefit of present and future members of the family of the late Christodoulos Papaneokleus Leventis, of which Mervail Company (PTC) Limited is the trustee, whereby he has an indirect interest with respect to 757,307 shares held by Carlcan Holding Limited.
7. The Remuneration Committee determined at its meeting in March 2019 that, in line with the terms of the PSP, PSP awards granted to Zoran Bogdanovic in 2015 and 2016 vested over in aggregate 62,860 shares (including the dividend equivalent shares paid on PSP shares that vested in 2019).
3.7. Fees paid to the auditor
The audit and other fees paid to the auditor are disclosed in Note 8 of the consolidated financial statements.
3.8. Conditional capital
On 25 April 2013, the shareholders’ meeting agreed to the creation of conditional capital in the maximum amount of CHF 245,601 thousand, through issuance of a maximum of 36,657 thousand fully paid-in registered shares with a par value of CHF 6.70 each upon exercise of options issued to members of the Board of Directors, members of management, employees or advisers of the Company, its subsidiaries and other affiliated companies. The share capital of CHF 2,491,242 thousand as disclosed in the balance sheet differs from the share capital in the commercial register of CHF 2,484,112 thousand as per 31 December 2018 due to the exercise of management options in the course of full year 2018.
Conditional capital Number of sharesBook value per
share CHFTotal CHF thousand
Agreed conditional capital as per shareholders’ meeting on 25 April 2013 36,656,843 6.70 245,601Shares issued to employees exercising stock options until 31 December 2016 (3,149,493) 6.70 (21,102)Shares issued to employees exercising stock options in 2017 (4,122,401) 6.70 (27,620)Remaining conditional capital as at 31 December 2017 29,384,949 6.70 196,879Shares issued to employees exercising stock options in 2018 (1,064,190) 6.70 (7,130)Remaining conditional capital as at 31 December 2018 28,320,759 6.70 189,749
2392018 INTEGRATED ANNUAL REPORTSR
CG
FS
SSR
SI

Proposed appropriation of available earnings and reserves / declaration of dividend
1. Proposed appropriation of available earningsAvailable earnings and reserves CHF thousands
Balance brought forward from previous years 126,232Net loss for the year (60,140)Total available retained earnings to be carried forward 66,092 Reserves from capital contributions before distribution 5,601,593Total available retained earnings and reserves 5,667,685
2. Proposed declaration of a dividend from reservesThe Board of Directors proposes to declare a gross dividend of EUR 0.57 on each ordinary registered share with a par value of CHF 6.70 from the general capital contribution reserve. Own shares held directly by the Company are not entitled to dividends. The total aggregate amount of the dividends shall be capped at an amount of CHF 300,000 thousand (the ‘Cap’), and thus will reduce the general capital contribution reserve of CHF 5,601,593 thousand, as shown in the financial statements as of 31 December 2018, by a maximum of CHF 300,000 thousand. To the extent that the dividend calculated on EUR 0.57 per share would exceed the Cap on the day of the Annual General Meeting, due to the exchange rate determined by the Board of Directors in its reasonable opinion, the Euro per share amount of the dividend shall be reduced on a pro-rata basis so that the aggregate amount of all dividends paid does not exceed the Cap. Payment of the dividend shall be made at such time and with such record date as shall be determined by the Annual General Meeting and the Board of Directors.
3. Proposed appropriation of reserves/declaration of dividend
Variant 1: Dividend of EUR 0.57 at current exchange ratioAs of 31 December 2018 CHF thousands
Reserves from capital contributions before distribution 5,601,593Proposed dividend of EUR 0.571 (240,932)Reserves from capital contributions after distribution 5,360,661
Variant 2: Dividend if Cap is triggeredAs of 31 December 2018 CHF thousands
Reserves from capital contributions before distribution 5,601,593(Maximum) dividend if Cap is triggered2 (300,000)(Minimum) Reserves from capital contributions after distribution 5,301,593
1. Illustrative at an exchange rate of CHF 1.14 per EUR. Assumes that the shares entitled to a dividend amount to 370,779,236.2. Dividend is capped at a total aggregate amount of CHF 300,000 thousand.
240 COCA-COLA HBC SWISS STATUTORY REPORTING CONTINUED

Report of the statutory auditor to the General Meeting of Coca-Cola HBC AG Steinhausen/Zug
Report of the statutory auditor on the statutory remuneration report 2018We have audited the remuneration report of Coca-Cola HBC AG for the year ended 31 December 2018. The audit was limited to the information according to the articles 14-16 of the Ordinance against Excessive Compensation in Stock Exchange Listed Companies (Ordinance) on pages 242 to 245 of the remuneration report.
Board of Directors’ responsibilityThe Board of Directors is responsible for the preparation and overall fair presentation of the remuneration report in accordance with Swiss law and the Ordinance against Excessive Compensation in Stock Exchange Listed Companies (Ordinance). The Board of Directors is also responsible for designing the remuneration system and defining individual remuneration packages.
Auditor’s responsibilityOur responsibility is to express an opinion on the accompanying remuneration report. We conducted our audit in accordance with Swiss Auditing Standards. Those standards require that we comply with ethical requirements and plan and perform the audit to obtain reasonable assurance about whether the remuneration report complies with Swiss law and articles 14–16 of the Ordinance.
An audit involves performing procedures to obtain audit evidence on the disclosures made in the remuneration report with regard to compensation, loans and credits in accordance with articles 14–16 of the Ordinance. The procedures selected depend on the auditor’s judgment, including the assessment of the risks of material misstatements in the remuneration report, whether due to fraud or error. This audit also includes evaluating the reasonableness of the methods applied to value components of remuneration, as well as assessing the overall presentation of the remuneration report.
We believe that the audit evidence we have obtained is sufficient and appropriate to provide a basis for our opinion.
OpinionIn our opinion, the remuneration report of Coca-Cola HBC AG for the year ended 31 December 2018 complies with Swiss law and articles 14–16 of the Ordinance.
PricewaterhouseCoopers AG
Michael FoleyAudit expert Auditor in charge
Lausanne, 15 March 2019
Luigi Voulgarelis
2412018 INTEGRATED ANNUAL REPORTSR
CG
FS
SSR
SI

Statutory Remuneration Report
Additional disclosures regarding the Statutory Remuneration Report
The section below is in line with the Ordinance against Excessive Compensation in Listed Stock Companies, which requires disclosure of the elements of compensation paid to the Company’s Board of Directors and the Operating Committee. The numbers relate to the calendar years of 2018 and 2017. In the information presented below, the exchange rate used for conversion of 2018 remuneration data from Euro to CHF is 1/1.1546 and the exchange rate used for conversion of 2017 remuneration data from Euro to CHF is 1/1.1202.
As the Company is headquartered in Switzerland, it is required for statutory purposes to present compensation data for two consecutive years, 2017 and 2018. The applicable methodology used to calculate the value of stock option and performance shares follows Swiss standards. In 2018 and 2017, the fair value of performance shares from the 2018 and 2017 grants is calculated based on the performance share awards that are expected to vest, and not the stock options that vested in 2018 and 2017 respectively. Below is the relevant information for Swiss statutory purposes.
Remuneration for acting members of governing bodies
The Company’s Directors believe that the level of remuneration offered to Directors and the members of the Operating Committee should reflect their experience and responsibility as determined by, among other factors, a comparison with similar multinational companies and should be sufficient to attract and retain high-calibre Directors who will lead the Group successfully. In line with the Group ‘s commitment to maximise shareholder value, its policy is to link a significant proportion of remuneration for its Operating Committee to the performance of the business through short and long-term incentives. Therefore, the Operating Committee members’ financial interests are closely aligned with those of the Company’s shareholders through the equity-related long-term compensation plan.
The total remuneration of the Directors and members of the Operating Committee of the Company, including performance share grants, during 2018 amounted to CHF 16.4 million. Out of this, the amount relating to the expected value of performance share awards granted in relation to 2018 was CHF 3.3 million. Pension and post-employment benefits for Directors and the Operating Committee of the Company during 2018 amounted to CHF 0.9 million.
242 COCA-COLA HBC SWISS STATUTORY REPORTING CONTINUED

Remuneration of the Board of Directors 2018 CHF
Fees
Cash andnon-cashbenefits1
Cashperformance
incentives
Pension and post-employment
benefits
Total fair value of stock options at
the date grantedTotal
remuneration
Anastassis G. David 84,863 – – – – 84,863Ahmet C. Bozer 84,863 – – – – 84,863Charlotte J. Boyle 98,256 – – – – 98,256Olusola (Sola) David-Borha2 101,605 – – – – 101,605William W. (Bill) Douglas III 118,231 – – – – 118,231Reto Francioni3 123,196 – – – – 123,196Anastasios I. Leventis 98,256 – – – – 98,256Christo Leventis 84,863 – – – – 84,863Alexandra Papalexopoulou 111,650 – – – – 111,650José Octavio Reyes4 91,560 – – – – 91,560Robert Ryan Rudolph5 84,863 – – – – 84,863John P. Sechi 101,605 – – – – 101,605Zoran Bogdanovic6 – – – – – –Total Board of Directors 1,183,811 – – – – 1,183,811
1. Allowances consist of cost of living allowance, housing support, Employee Share Purchase Plan, private medical insurance, relocation expenses, home trip allowance, lump sum expenses and similar allowances.
2. For Olusola (Sola) David-Borha, on top of her fees, the Group paid CHF 8,083 in social security contributions as required by Swiss legislation.3. For Reto Francioni, on top of his fees, the Group paid CHF 9,801 in social security contributions as required by Swiss legislation.4. For José Octavio Reyes, on top of his fees, the Group paid CHF 5,119 in social security contributions as required by Swiss legislation.5. For Robert Ryan Rudolph, on top of his fees, the Group paid CHF 6,752 in social security contributions as required by Swiss legislation.6. Zoran Bogdanovic’s compensation was based on his role as CEO, member of the Operating Committee, and his employment agreement. Zoran Bogdanovic was not entitled
and did not receive additional compensation as a Director.
Non-Executive Directors do not participate in any of the Group’s incentive plans, nor do they receive any retirement benefits.
2432018 INTEGRATED ANNUAL REPORTSR
CG
FS
SSR
SI

Remuneration of the Board of Directors 2017 CHF
Fees
Cash andnon-cashbenefits1
Cashperformance
incentives
Pension and post-employment
benefits
Total fair value of stock options at the
date grantedTotal
remuneration
Anastassis G. David 78,411 – – – – 78,411Ahmet C. Bozer 78,411 – – – – 78,411Charlotte J. Boyle2 45,366 45,366Antonio D’Amato3 45,366 – – – – 45,366Olusola (Sola) David-Borha4 101,285 – – – – 101,285William W. (Bill) Douglas III 109,216 – – – – 109,216Reto Francioni5 122,678 – – – – 122,678Anastasios I. Leventis 90,733 – – – – 90,733Christo Leventis6 80,790 – – – – 80,790Alexandra Papalexopoulou 103,055 – – – – 103,055José Octavio Reyes7 89,693 – – – – 89,693Robert Ryan Rudolph8 84,605 – – – – 84,605John P. Sechi 93,869 – – – – 93,869Dimitris Lois9 – – – – – –Total Board of Directors 1,123,478 – – – – 1,123,478
1. Allowances consist of cost of living allowance, housing support, Employee Share Purchase Plan, private medical insurance, relocation expenses, home trip allowance, lump sum expenses and similar allowances.
2. Charlotte J. Boyle was appointed to the Board of Directors, the Remuneration Committee and the Nomination Committee on 20 June 2017. The Group has applied a half-year period base fee of CHF 45,366.
3. Antonio D’ Amato retired from the Board of Directors, the Remuneration Committee and the Nomination Committee on 20 June 2017. The Group has applied a half-year period base fee of CHF 45,366.
4. For Olusola (Sola) David-Borha, on top of her fees of CHF 93,869, the Group paid CHF 7,416 in social security contributions as required by Swiss legislation.5. For Reto Francioni, on top of his fees of CHF 113,696, the Group paid CHF 8,982 in social security contributions as required by Swiss legislation.6. In June 2017 social security contributions of CHF 2,379, withheld in December 2016, were returned to Christo Leventis, on top of his fees of CHF 78,411, as he was deemed not
subject to Swiss social security.7. For José Octavio Reyes, on top of his fees of CHF 84,572, the Group paid CHF 5,121 in social security contributions as required by Swiss legislation.8. For Robert Ryan Rudolph, on top of his fees of CHF 78,411, the Group paid CHF 6,194 in social security contributions as required by Swiss legislation.9. Dimitris Lois’ compensation was based on his role as CEO, member of the Operating Committee, and his employment agreement. Dimitris Lois was not entitled and did not receive
additional compensation as a Director.
Non-Executive Directors do not participate in any of the Group’s incentive plans, nor do they receive any retirement benefits.
244 COCA-COLA HBC SWISS STATUTORY REPORTING CONTINUED

Remuneration of the Operating Committee
The total remuneration paid to or accrued for the Operating Committee for 2018 amounted to CHF 16.4 million. 2018 CHF
Base salary
Cash and non-cash
benefits1
Cashperformance
incentives2
Pension and post-employment
benefits3
Total fair value of performance
shares at the date granted4
Totalremuneration
Zoran Bogdanovic, Chief Executive Officer 865,950 521,628 368,513 143,691 1,085,901 2,985,682Other members5 4,242,424 3,641,729 2,640,246 737,429 2,179,889 13,441,717Total Operating Committee 5,108,374 4,163,357 3,008,758 881,120 3,265,790 16,427,399
1. Cash and non-cash benefits consist of cost of living allowance, housing support, schooling, Employee Share Purchase Plan, private medical insurance, relocation expenses, home trip allowance, employer social security contributions, lump sum expenses and similar allowances.
2. The cash performance incentives represent the monetary value that was paid under MIP in 2018 reflecting the 2017 business performance.3. Members of the Operating Committee participate in the pension plan of their employing entity, as appropriate.4. Values under long-term incentives represent the fair value of performance shares that are expected to vest for the 2018 grant in order to comply with Swiss reporting guidelines.5. Nikolaos Kalaitzidakis was appointed to the role of Region Director on 1 May 2018.
The total remuneration paid to or accrued for the Operating Committee for 2017 amounted to CHF 22.5 million. 2017 CHF
Base salary
Cashand non-cash
benefits1
Cashperformance
incentives2
Pension and post-employment
benefits3
Total fair value of performance shares at the date granted4
Totalremuneration
Dimitris Lois5, 6, Chief Executive Officer (highest compensated member of the Operating Committee) 954,005 603,522 724,976 132,354 2,217,695 4,632,552Zoran Bogdanovic7, Chief Executive Officer 65,347 40,651 0 6,498 48,876 161,372Other members 4,194,756 5,066,461 2,719,887 699,118 5,057,260 17,737,482Total Operating Committee 5,214,108 5,710,634 3,444,863 837,970 7,323,831 22,531,406
1. Cash and non-cash benefits consist of cost of living allowance, housing support, schooling, Employee Share Purchase Plan, private medical insurance, relocation expenses, home trip allowance, employer social security contributions, lump sum expenses and similar allowances.
2. The cash performance incentives represent the monetary value that was paid under MIP in 2017 reflecting the 2016 business performance, inclusive of the value that was paid under LTIP in 2017 reflecting the 2014-2016 business performance for Naya Kalogeraki, Marcel Martin and Sanda Parezanovic.
3. Members of the Operating Committee participate in the pension plan of their employing entity, as appropriate.4. Values under long-term incentives represent the fair value of performance shares that are expected to vest for the 2017 grant in order to comply with Swiss reporting guidelines.5. Dimitris Lois’ compensation was based on his role as CEO, member of the Operating Committee, and his employment agreement. Dimitris Lois was not entitled to and did not
receive the fixed compensation applicable for Non-Executive Directors of the Board of Directors.6. Dimitris Lois’ compensation reflects the period 1 January to 2 October 2017 and includes two months’ payment made to the heirs as per Swiss law. Total fair value of performance
shares at the date granted has been prorated for the period 1 January to 2 October 2017.7. Zoran Bogdanovic’s compensation as CEO reflects the period 7 December to 31 December 2017. His compensation for the period 1 January to 6 December 2017 is included under
“Other Members”. Total fair value of performance shares at the date granted has been prorated for the period 7 December to 31 December 2017.
Credits and loans granted to governing bodies
In 2018, there were no credits or loans granted to active or former members of the Company’s Board of Directors, members of the Operating Committee or to any related persons. There are no outstanding credits or loans.
2452018 INTEGRATED ANNUAL REPORTSR
CG
FS
SSR
SI

Definitions and reconciliations of Alternative Performance Measures (APMs)
1. Comparable APMs1
In discussing the performance of the Group, ‘comparable’ measures are used, which are calculated by deducting from the directly reconcilable IFRS measures the impact of the Group’s restructuring costs, the mark-to-market valuation of the commodity hedging activity and certain other tax items, which are collectively considered as items impacting comparability, due to their nature. More specifically the following items are considered as items that impact comparability:
1. Restructuring costs
Restructuring costs comprise costs arising from significant changes in the way the Group conducts business, such as significant supply chain infrastructure changes, outsourcing of activities and centralisation of processes. These costs are included within the income statement line ‘Operating expenses’. However, they are excluded from the comparable results in order for the user to obtain a better understanding of the Group’s operating and financial performance achieved from underlying activity.
2. Commodity hedging
The Group has entered into certain commodity derivative transactions in order to hedge its exposure to commodity price risk. Although these transactions are economic hedging activities that aim to manage our exposure to sugar, aluminium, gas oil and PET price volatility, hedge accounting has not been applied. In addition, the Group recognises certain derivatives embedded within commodity purchase contracts that have been accounted for as stand-alone derivatives and do not qualify for hedge accounting. The fair value gains and losses on the derivatives and embedded derivatives are immediately recognised in the income statement in the cost of goods sold and operating expenses line items. The Group’s comparable results exclude the gains or losses resulting from the mark-to-market valuation of these derivatives and embedded derivatives. These gains or losses are reflected in the comparable results in the year when the underlying transactions occur, to match the profit or loss to that of the corresponding underlying transactions. We believe this adjustment provides useful information related to the impact of our economic risk management activities.
3. Other tax items
Other tax items represent the tax impact of changes in income tax rates affecting the opening balance of deferred tax arising during the year, included in the ‘Tax’ line item of the income statement. These are excluded from comparable after-tax results in order for the user to obtain a better understanding of the Group’s underlying financial performance.1. Comparable APMs refer to comparable cost of goods sold, comparable gross profit, comparable operating expenses, comparable EBIT, comparable EBIT margin, comparable
Adjusted EBITDA, comparable tax, comparable net profit and comparable EPS.
The Group discloses comparable performance measures to enable users to focus on the underlying performance of the business on a basis which is common to both years for which these measures are presented.
The reconciliation of comparable measures to the directly related measures calculated in accordance with IFRS is as follows:
Reconciliation of comparable financial indicators (numbers in € million except per share data) 2018
Cost of
goods sold Gross profitOperating expenses EBIT
Adjusted EBITDA Tax Net profit1 EPS (€)
As reported (4,142) 2,515 (1,876) 639 969 (163) 447 1.216Restructuring costs – – 33 33 23 (8) 25 0.068Commodity hedging loss / (gain) 8 8 1 8 8 (2) 7 0.018Other tax items – – – – – 1 1 0.004Comparable (4,134) 2,523 (1,843) 681 1,000 (171) 480 1.306
2017
Cost of
goods sold Gross profitOperating expenses EBIT
Adjusted EBITDA Tax Net profit1 EPS (€)
As reported (4,083) 2,439 (1,849) 590 928 (138) 426 1.168Restructuring costs – – 29 29 20 (7) 22 0.061Commodity hedging loss / (gain) 3 3 (1) 2 2 (1) 1 0.004Other tax items – – – – – – – –Comparable (4,080) 2,443 (1,822) 621 949 (146) 450 1.233
Figures are rounded.1. Net profit and comparable net profit refer to net profit and comparable net profit respectively after tax attributable to owners of the parent.
246 COCA-COLA HBC ALTERNATIVE PERFORMANCE MEASURES

Reconciliation of comparable EBIT per reportable segment (numbers in € million) 2018
Established Developing Emerging Consolidated
EBIT 232 131 277 639Restructuring costs 5 4 24 33Commodity hedging loss 4 2 2 8 Comparable EBIT 241 137 303 681
2017
Established Developing Emerging Consolidated
EBIT 238 92 260 590Restructuring costs 13 2 14 29Commodity hedging (gain) / loss (1) (1) 4 2Comparable EBIT 250 92 278 621
Figures are rounded.
2. FX-neutral APMsA business like ours, operating in 28 countries and with many different currencies, is bound to be affected by foreign exchange movements, and we report our financial results to reflect this. However, we manage the business against targets which are set to be comparable between years and within them, for otherwise foreign currency movements would undermine our ability to drive the business forward and control it. Through this Report, as in previous years, we will highlight comparable results and foreign-exchange-neutral results as well as the audited results which reflect the actual foreign currency effects experienced. It is through the relentless focus on managing by using comparable figures that we have succeeded in delivering significantly improved performance, although we recognise that in the shorter term currency movements may distort the underlying trends.
The Group also evaluates its operating and financial performance on an FX-neutral basis (i.e. without giving effect to the impact of variation of foreign currency exchange rates from year to year). FX-neutral APMs are calculated by adjusting prior year amounts for the impact of exchange rates applicable to the current year. FX-neutral measures enable users to focus on the performance of the business on a basis which is not affected by changes in foreign currency exchange rates applicable to the Group’s operating activities from year to year. The most common FX-neutral measures used by the Group are:
1. FX-neutral net sales revenue and FX-neutral net sales revenue per unit case
FX-neutral net sales revenue and FX-neutral net sales revenue per unit case are calculated by adjusting prior-year net sales revenue for the impact of changes in exchange rates applicable in the current year.
2. FX-neutral comparable input costs per unit case
FX-neutral comparable input costs per unit case is calculated by adjusting prior-year commodity costs and more specifically, sugar, resin, aluminium and fuel commodity costs, excluding commodity hedging as described above; and other raw materials costs for the impact of changes in exchange rates applicable in the current year.
The calculations of the FX-neutral APMs and the reconciliation to the most directly related measures calculated in accordance with IFRS are as follows:
Reconciliation of FX-neutral net sales revenue per unit case (numbers in € million unless otherwise stated) 2018
Established Developing Emerging Consolidated
Net sales revenue 2,470 1,307 2,880 6,657Currency impact – – – –FX-neutral net sales revenue 2,470 1,307 2,880 6,657Volume (m unit cases) 619 429 1,144 2,192FX-neutral net sales revenue per unit case (€) 3.99 3.05 2.52 3.04
2017
Established Developing Emerging Consolidated
Net sales revenue 2,436 1,173 2,912 6,522Currency impact (17) (6) (216) (239)FX-neutral net sales revenue 2,419 1,168 2,696 6,283Volume (m unit cases) 613 394 1,097 2,104FX-neutral net sales revenue per unit case (€) 3.94 2.96 2.46 2.99
Figures are rounded.
2472018 INTEGRATED ANNUAL REPORTSR
CG
FS
SSR
SI

3. Other APMs
Adjusted EBITDA and comparable Adjusted EBITDA
Adjusted EBITDA is calculated by adding back to operating profit the depreciation and impairment of property, plant and equipment, the amortisation and impairment of intangible assets, the employee share option and performance share costs and items, if any, reported in line ‘Other non-cash items’ of the consolidated cash flow statement. Adjusted EBITDA is intended to provide useful information to analyse the Group’s operating performance excluding the impact of operating non-cash items as defined above. The Group also uses comparable Adjusted EBITDA, which is calculated by deducting from Adjusted EBITDA the impact of the Group’s restructuring costs and the mark-to-market valuation of the commodity hedging activity. Comparable Adjusted EBITDA is intended to measure the level of financial leverage of the Group by comparing comparable Adjusted EBITDA to Net debt.
Adjusted EBITDA and comparable Adjusted EBITDA are not measures of profitability and liquidity under IFRS and have limitations, some of which are as follows: Adjusted EBITDA and comparable Adjusted EBITDA do not reflect our cash expenditures, or future requirements, for capital expenditures or contractual commitments; Adjusted EBITDA and comparable Adjusted EBITDA do not reflect changes in, or cash requirements for, our working capital needs; although depreciation and amortisation are non-cash charges, the assets being depreciated and amortised will often have to be replaced in the future and Adjusted EBITDA and comparable Adjusted EBITDA do not reflect any cash requirements for such replacements. Because of these limitations, Adjusted EBITDA and comparable Adjusted EBITDA should not be considered as measures of discretionary cash available to us and should be used only as supplementary APMs.
As a result of IFRS 16 adoption we expect Adjusted EBITDA and comparable Adjusted EBITDA to increase in 2019 as operating lease expense will be replaced by depreciation and interest.
Free cash flow
Free cash flow is an APM used by the Group and defined as cash generated by operating activities after payments for purchases of property, plant and equipment net of proceeds from sales of property, plant and equipment and including principal repayments of finance lease obligations. Free cash flow is intended to measure the cash generation from the Group’s business, based on operating activities, including the efficient use of working capital and taking into account its net payments for purchases of property, plant and equipment.
The Group considers the purchase and disposal of property, plant and equipment as ultimately non-discretionary since ongoing investment in plant, machinery, technology and marketing equipment, including coolers, is required to support the day-to-day operations and the CCHBC Group’s growth prospects. The Group presents free cash flow because it believes the measure assists users of the financial statements in understanding the Group’s cash-generating performance as well as availability for interest payment, dividend distribution and own retention. The free cash flow measure is used by management for its own planning and reporting purposes since it provides information on operating cash flows, working capital changes and net capital expenditure that local managers are most directly able to influence.
Free cash flow is not a measure of cash generation under IFRS and has limitations, some of which are as follows: free cash flow does not represent the Group’s residual cash flow available for discretionary expenditures since the Group has debt payment obligations that are not deducted from the measure; free cash flow does not deduct cash flows used by the Group in other investing and financing activities; and free cash flow does not deduct certain items settled in cash. Other companies in the industry in which the Group operates may calculate free cash flow differently, limiting its usefulness as a comparative measure.
Capital expenditure
The Group uses capital expenditure as an APM to ensure that the cash spending is in line with its overall strategy for the use of cash. Capital expenditure is defined as payments for purchases of property, plant and equipment plus principal repayments of finance lease obligations less proceeds from sale of property, plant and equipment.
As a result of IFRS 16 adoption we expect capital expenditure to increase in 2019 as a result of increased principal repayments of lease obligations due to the recognition of nearly all leases on the balance sheet.
248 COCA-COLA HBC ALTERNATIVE PERFORMANCE MEASURES CONTINUED

The following table illustrates how Adjusted EBITDA, free cash flow and capital expenditure are calculated:
2018
€ million2017
€ million
Operating profit (EBIT) 639 590Depreciation and impairment of property, plant and equipment 319 317Amortisation of intangible assets 1 –Employee share options and performance shares 10 21Adjusted EBITDA 969 927Gain on disposals of non-current assets (10) (4)Cash (consumed) / generated from working capital movements (46) 9Tax paid (116) (128)Net cash from operating activities 797 804 Payments for purchases of property, plant and equipment (437) (410)Principal repayments of finance lease obligations (8) (7)Proceeds from sale of property, plant and equipment 18 39Capital expenditure (427) (378) Net cash from operating activities 797 804Capital expenditure (427) (378)Free cash flow 370 426
Figures are rounded.
Net debt
Net debt is an APM used by management to evaluate the Group’s capital structure and leverage. Net debt is defined as current borrowings plus non-current borrowings less cash and cash equivalents and financial assets (time deposits and money market funds), as illustrated below:
As at 31 December
2018
€ million2017
€ million
Current borrowings 136 166Non-current borrowings 1,468 1,460Other financial assets (279) (151)Cash and cash equivalents (712) (724)Net debt 613 752
Figures are rounded.
2492018 INTEGRATED ANNUAL REPORTSR
CG
FS
SSR
SI
Independent assurance statement for the 2018 Integrated Annual Report
To the management and stakeholders of Coca-Cola Hellenic Bottling Company AG:denkstatt GmbH was commissioned by Coca-Cola Hellenic Bottling Company AG (hereinafter referred to as “the Company”) to provide independent third-party assurance, in accordance with the AA1000 Assurance Standard (AA1000AS), for the printed and downloadable pdf versions of the Company’s 2018 Integrated Annual Report (hereinafter referred to as “the Report”). We have reviewed sustainability-related data and content in the Report. Financial data were not reviewed as part of this process. The assurance engagement covered the nature and extent of the Company’s application of the principles of inclusivity, materiality and responsiveness to stakeholder dialogue, as described in the AA1000 Series of Standards. The application level of the Global Reporting Initiative (GRI) Standards (comprehensive option) was verified.
denkstatt is an independent professional services company. Our team of experts has extensive professional experience of assurance engagements related to non-financial information and sustainability management, meaning it is qualified to conduct this independent assurance engagement. denkstatt has implemented a certified quality and environmental management system which complies with the requirements of ISO 9001:2015 and ISO 14001:2015, and accordingly maintains a comprehensive quality control system.
Management responsibilitiesThe Company’s management is responsible for preparing the Report, statements within it and related website content. Management is also responsible for identifying stakeholders and material issues, defining commitments with respect to sustainability performance, and establishing and maintaining appropriate performance management and internal control systems from which reported information is derived.
Additionally, the Company’s management is responsible for establishing data collection and internal control systems to ensure reliable reporting, for specifying acceptable reporting criteria and for selecting data to be collected for the purposes of the Report. Management responsibilities also extend to preparing the Report in accordance with the GRI Standards.
Assurance provider’s responsibilitiesOur responsibilities are to:
· express our conclusions and make recommendations regarding the nature and extent of the Company’s adherence to the AA1000 Accountability Principles Standard (APS), and
· express our conclusions on the reliability of the information in the Report, and whether it is in accordance with the criteria in the GRI Standards.
During 2018 we did not perform any tasks or services for the Company or other clients which would lead to a conflict of interest. We were not responsible for the preparation of any part of the Report.
Scope of assurance, standards and criteria usedWe have fulfilled our responsibilities to provide appropriate assurance that the information in the Report is free of material misstatements. We planned and carried out our work based on the GRI Standards and the AA1000 Series of Standards. We used the criteria in AA1000AS to perform a Type 2 engagement and to provide high assurance regarding the nature and extent of the Company’s adherence to the principles of inclusivity, materiality and responsiveness.
Methodology, approach, limitations and scope of workWe planned and carried out our work in order to obtain all the evidence, information and explanations that we considered necessary to fulfil our responsibilities. Our work included the following procedures, comprising a range of evidence-gathering activities:
· Gathering information regarding the Company’s adherence to the principles of inclusivity, materiality, sustainability context, completeness and responsiveness as required by GRI and AA1000, and conducting interviews with members of the Executive Management, staff from the Sustainability Department, the Human Resources Department, the Procurement Department, the Finance Department, the Legal Affairs Department, the Marketing Department, the Product Quality and Safety Department and the Public Affairs and Communication Department, as well as various Group-level functional managers. This includes verifying the commitment of the Company’s management to these principles, the existence of systems and procedures to support adherence to these principles, and the embedding of the principles at country level.
The key topics of the interviews conducted at Group level were the materiality process, World Without Waste, water stewardship, community engagement, health and nutrition, sourcing, energy and climate, vehicle fleets, corporate governance, business ethics and anti-corruption, human rights and diversity as well as employee wellbeing and engagement.
· Conducting further interviews at national headquarters in Austria, Bulgaria, Estonia (Baltics), Hungary, Republic of North Macedonia, Poland and Russia in order to guarantee the completeness of the information required for the engagement.
250 COCA-COLA HBC ASSURANCE STATEMENT

· Site visits to nine bottling plants, with a focus on developing markets:
· Established markets: Edelstal (Austria)
· Developing markets: Varena (Lithuania), Zalaszentgrot (Hungary), Radzymin and Tylicz (Poland)
· Emerging markets: Kostinbrod (Bulgaria), Skopje (Republic of North Macedonia), Rostov and St. Petersburg (Russia)
· Making enquiries and conducting spot checks to assess implementation of the Company’s policies (at plant, country and Group level).
· Making enquiries and conducting spot checks regarding documentation required to assess the current data collection systems, and the procedures in place to ensure reliable and consistent reporting from the plants to Group level.
· Verifying all three inventory scopes (scopes 1, 2 and 3) as defined by the GHG Protocol, including progress against emission reduction targets, reported changes in emissions compared with base years (2004 and 2010) and emissions intensity figures for 2018.
· Verifying the GRI content index, which was published separately from the Report, to ensure consistency with the requirements of the GRI Standards (comprehensive option).
· Conducting additional interviews with five representatives of the following external stakeholder groups: packaging recycling and recovery systems; PET recycling companies; packaging associations; and non-governmental organisations. The interviews were conducted during the Joint Annual Stakeholder Forum of the Company and The Coca-Cola Company in Vienna in autumn 2018.
The scope of the assurance covered all of the information relevant to sustainability in the Report and focused on Company systems and activities during the reporting period. The following chapters were not covered in the sustainability assurance process:
· Financial Statements, Supplementary Information, Swiss Statutory Reporting.
ConclusionsOn the basis of our work, we found nothing to suggest that the information in the 2018 Integrated Annual Report is inaccurate or contains material misstatements. Any errors or misstatements identified during the engagement were corrected prior to the Report being published.
Positive developments · By defining its ‘Mission Sustainability – 2025 Commitments’ the Company has laid the foundation for ongoing strong sustainable development.
The 2025 Commitments provide a long-term perspective for the Company and cover a wide range of areas including environmental and social topics.
· The Company has made great efforts to demonstrate its contribution to achieving the UN Sustainable Development Goals (SDGs). All material topics as well as the Company’s ‘2025 Commitments’ were mapped to the targets related to the SDGs. The mapping clearly illustrates the contribution of the Company to sustainable development in a broader context.
· The Company has set up an excellent risk management system which incorporates sustainability-related aspects. In order to further develop risk management, the Smart Risk model was introduced in 2018. The frequency of risk reviews has been increased to monthly at country level, and interdisciplinarity is fostered to ensure a comprehensive approach.
· The documentation of data is highly sophisticated in most operations. Traceability of data has significantly improved over recent years due to well-structured monitoring and reporting processes at plant, country and Group level.
· The Company has been strongly engaged in improving the metrics used to evaluate progress towards the World Without Waste commitment. Stated recycling rates are based on a standard procedure, covering all steps from the collection process to the calculation methodology and plausibility checks. Country and material-specific roadmaps, which determine the technology and infrastructure requirements per country, are available.
· The Company is more strongly addressing the topic of consumer health and nutrition. In 2018 pilot projects for colour-coded nutrient labelling were introduced in 19 countries, to help consumers make informed choices. In addition, the Company demonstrated good progress in reducing sugar in sparkling drinks, in alignment with its UNESDA agreement. There are quarterly reviews in place to ensure compliance with the Company’s commitment not to sell soft drinks to primary schools.
Findings and conclusions regarding adherence to the AA1000 principles of inclusivity, materiality, responsiveness, and specific performance-related information.
Inclusivity · Group level: The Company has implemented a comprehensive and efficient stakeholder engagement process at Group level.
Its cornerstones are the annual internal and external stakeholder survey and the Annual Stakeholder Forum (held in Vienna in 2018).
· Country and plant level: Stakeholder engagement activities at country and plant level are being further developed. As a result of an increasing number of stakeholder forums and stakeholder surveys, the Company consistently includes the views of stakeholders across all levels and is well aware of stakeholders’ concerns.
2512018 INTEGRATED ANNUAL REPORTSR
CG
FS
SSR
SI

Materiality · Group level: An advanced process is in place for defining material topics for the Company. The materiality assessment process considers
stakeholders’ expectations regarding the relevant sustainability-related topics. Moreover, the impact of the Company on society and the environment is considered in the materiality assessment, as required by GRI Standards. The material topics identified during the assessment built the basis for the sustainability strategy and reporting.
· Country and plant level: As a growing number of countries has started to publish a GRI-compliant sustainability report, formalised processes for carrying out the materiality assessment have been more strongly implemented throughout the organisation. It should be ensured that all materiality assessments comply with the same basic rules so that they follow a consistent approach.
Responsiveness · Country level: There are sophisticated tools for stakeholder assessment in place, taking account of the influence and attitude of stakeholders.
Detailed communication plans are available that are based on the stakeholder assessment and show that communication measures are tailored to stakeholders’ needs. By including a wide range of stakeholders in communication, new sustainability-related topics can be addressed at an early stage.
· A strategic focus on reducing youth unemployment, has been defined for community engagement activities. Excellent projects have been implemented by the Company in this focus area, under the title #Youth Empowered which reflect the current local economic situation and are tailored to the needs of young people.
· Excellent examples of sustainability reporting (e.g. Baltics) and socio-economic impact assessments (e.g. North Macedonia) were found in the course of the assurance engagement. The Group should highlight such examples of good practice and encourage further enhancement of reporting in line with sustainability standards.
Additional conclusions and recommendations · The Company has committed to source 20% of PET from recycled PET and/or PET from renewable materials by 2020. Due to volatile
markets, the Company made limited progress towards meeting this commitment. We recommend that the Company focuses more strongly on increasing the share of recycled PET and/or PET from renewable materials in bottles, throughout country operations. The new 2025 commitments may be a game changer for further development.
· With its #Youth Empowered programme the Company has established a valuable approach to contributing to lower rates of youth unemployment throughout its territory. The Company has even defined a target of training 1 million young people through the Youth Empowered programme. In order to report robust data on progress, a clear curriculum for training must be defined within the Company. Auditable data regarding the number of participants and corporate volunteering also needs to be guaranteed.
· The Company has made progress in efficiently monitoring and reporting data related to human resources. With specific regard to the documentation of training hours, progress was observed during the audits. However, there seems to be differing understanding of individual HR indicators across the Group. Further alignment in defining and reporting HR figures is needed.
· We note the Company’s early achievement of its science-based carbon reduction targets for 2020, and its setting of a new carbon target to further reduce its greenhouse gas (GHG) emissions by 2025. In response to the Task Force on Climate-Related Financial Disclosures (TCFD) recommendations, the Company has also begun to evaluate the financial implications of climate-related risks and opportunities for its business. We encourage the Company to continue its efforts to reduce the carbon intensity of its operations, as well as the carbon footprint along its value chain, and to disclose the results of its assessment in line with the TCFD recommendations in future reporting.
· As an international organisation that is strongly rooted within local markets, the Company has to take responsibility for the environment and society at both global and local level. The organisation has successfully made major efforts to improve its sustainability performance in recent years. In order to maintain its pioneering role, we recommend that the Company works to increase awareness of social and environmental issues in society.
WILLIBALD KALTENBRUNNERLEAD AUDITOR
DENKSTATT GMBHCONSULTANCY FOR SUSTAINABLE DEVELOPMENT
Vienna, 5 March 2019
252 COCA-COLA HBC ASSURANCE STATEMENT CONTINUED

We take great pride in being regarded as a transparent and accessible company in all our communications with investment communities around the world. We engage with key financial audiences, including institutional investors, sell-side analysts and financial journalists, as well as our Company’s shareholders. The investor relations department manages the interaction with these audiences by attending ad hoc meetings and investor conferences throughout the year, in addition to the regular meetings and presentations held at the time of our results announcements.
ListingsCoca-Cola HBC AG (LSE: CCH) was admitted to the premium listing segment of the Official List of the UK Listing Authority and to trading on the London Stock Exchange’s main market for listed securities on 29 April 2013. With effect from 29 April 2013, Coca-Cola HBC AG’s shares are also admitted on the Athens Exchange (ATHEX: EEE). Coca-Cola HBC AG has been included as a constituent of the FTSE 100 and FTSE All-Share Indices from 20 September 2013.
London Stock Exchange Ticker symbol: CCH ISIN: CH019 825 1305 SEDOL: B9895B7 Reuters: CCH.L Bloomberg: CCH LN
Athens Exchange Ticker symbol: EEE ISIN: CH019 825 1305 Reuters: EEEr.AT Bloomberg: EEE GA
Credit rating Standard & Poor’s: L/T BBB+, S/T A2, positive outlook Moody’s: L/T Baa1, S/T P2, stable outlook
Share price performanceLSE: CCH 2018 2017 2016
In £ per share Close 24.52 24.20 17.70High 28.01 26.71 18.40Low 22.16 17.69 12.65Market capitalisation (£ million) 9,007 8,862 6,426
ATHEX: EEE 2018 2017 2016
In € per share Close 27.11 27.25 20.69High 31.90 29.80 20.99Low 24.99 20.47 16.00Market capitalisation (€ million) 9,959 9,979 7,512
Source: Bloomberg
Share capitalIn 2018, the share capital of Coca-Cola HBC increased by the issue of 1,064,190 new ordinary shares following the exercise of stock options pursuant to the Group’s employee stock option plan.
Total proceeds from the issuance of the shares under the stock option plan amounted to €15.3 million.
Following the above changes, and including 4,478,128 ordinary shares held as treasury shares, on 31 December 2018 the share capital of the Group amounted to €2,021.2 million and comprised 371,827,229 shares with a nominal value of CHF 6.70 each.
Major shareholdersThe principal shareholders of the Group are Kar-Tess Holding (a Luxembourg company), which holds approximately 23%, and The Coca-Cola Company, which indirectly holds approximately 23% of the Group’s issued share capital.
DividendsFor 2018, the Board of Directors has proposed a €0.57 dividend per share in line with the Group’s progressive dividend policy. This compares to a dividend payment of €0.54 per share in 2017. For more information on our dividend policy and dividend history, please visit our website at www.coca-colahellenic.com.
Financial calendar2 May 2019 First quarter trading update18 June 2019 Annual General Meeting8 August 2019 Half-year financial results7 November 2019 Third quarter trading update
Corporate websitewww.coca-colahellenic.com
Shareholder and analyst informationShareholders and financial analysts can obtain further information by contacting:
Investor Relations Tel: +30 210 618 3100 Email: [email protected] IR website: www.coca-colahellenic.com/investorrelations
Analysis of shareholding sizes
Geographic concentration
1 – 10,000: 9%10,001 – 100,000: 12%100,001 – 1,000,000: 38%1,000,001 – over: 39%Treasury shares: 2%
UK: 25%Continental Europe: 34%United States: 33%Rest of the world: 4%Retail investors: 4%
2532018 INTEGRATED ANNUAL REPORTSR
CG
FS
SSR
SI
SHAREHOLDER INFORMATION

Basis points (bps)One hundredth of one percentage point (used chiefly in expressing differences)
Brand Coca-Cola productsIncludes Coca-Cola, Coca-Cola Zero and Coca-Cola Light brands
BSOBusiness services organisation
BSSBusiness solutions and systems
CAGRCompound annual growth rate
Capital expenditure or CapExGross CapEx is defined as payments for purchase of property, plant and equipment.Net CapEx is defined as payments for purchase of property, plant and equipment less receipts from disposals of property, plant and equipment plus principal repayment of finance lease obligations
Carbon emissions (scope 1 and 2)Emissions of CO
2 and other greenhouse
gases from fuel combustion and energy use in Coca-Cola HBC’s own operations in bottling, storage, distribution and in offices
Carbon footprintGlobal emissions of CO
2 and other
greenhouse gases from Coca-Cola HBC’s wider value chain (raw materials, product cooling, etc.)
CHPCombined heat and power plants
Coca-Cola HBCCoca-Cola HBC AG, and, as the context may require, its subsidiaries and joint ventures; also, the Group, the Company
Coca-Cola SystemThe Coca-Cola Company and its bottling partners
Cold drink equipmentA generic term encompassing point-of-sale equipment such as coolers (refrigerators), vending machines and post-mix machines
Comparable adjusted EBITDAWe define comparable adjusted EBITDA as operating profit before deductions for depreciation and impairment of property, plant and equipment (included both in cost of goods sold and in operating expenses), amortisation and impairment of intangible assets, stock option compensation and other non-cash items, if any; and further adjusted for restructuring costs and mark to market valuation of commodity hedging activity
Comparable net profitRefers to net profit after tax attributable to owners of the parent adjusted for restructuring costs, mark to market valuation of commodity hedging activity and certain other tax items
Comparable operating profit (EBIT)Comparable operating profit (EBIT) refers to profit before tax excluding finance income/ (costs) and share of results of equity method investments and adjusted for restructuring costs and mark to market valuation of commodity hedging activity
Comparable operating expenditureComparable operating expenditure refers to operating expenditure adjusted for restructuring costs and mark to market valuation of certain commodity hedging activity
CustomerRetail outlet, restaurant or other operation that sells or serves Coca-Cola HBC products directly to consumers
DIFOTAIDeliver in full, on time and accurately invoiced
Dividend policyOur Board of Directors approved a dividend policy, effective from 2013, aiming to increase dividend payments progressively with a medium-term target payout ratio of 35-45% on comparable net profits
DMEDirect marketing expenses
EDSEvery Dealer Survey
Energy use ratioThe KPI used by Coca-Cola HBC to measure energy consumption in the bottling plants, expressed in megajoules of energy consumed per litre of produced beverage (MJ/lpb)
FMCGFast-moving consumer goods
Fragmented tradeKiosks, quick service restaurants (QSR) and hotels, restaurants and cafés (HoReCa)
Future consumptionA distribution channel where consumers buy multi-packs and larger packages from supermarkets and discounters which are not consumed on the spot
GDPGross domestic product
GfKWe work with the company Growth for Knowledge (GfK) to track our customer satisfaction level
GRIGlobal Reporting Initiative, a global standard for sustainability reporting
HoReCaDistribution channel encompassing hotels, restaurants and cafés
IFRSInternational Financial Reporting Standards, issued by the International Accounting Standards Board
IIRCThe International Integrated Reporting Council, a global coalition of regulators, investors, companies, standard-setters, the accounting profession and NGOs. The coalition is promoting communication about value creation as the next step in the evolution of corporate reporting
Immediate consumptionA distribution channel where consumers buy chilled beverages in single-serve packages and fountain products for immediate consumption, away from home
Inventory daysWe define inventory days as the average number of days an item remains in inventory before being sold, using the following formula: average inventory ÷ cost of goods sold x 365
IrelandThe Republic of Ireland and Northern Ireland
ItalyTerritory in Italy served by Coca-Cola HBC (excludes Sicily)
254 COCA-COLA HBC GLOSSARY

Joint value creation (JVC)An advanced programme and process to collaborate with customers in order to create shared value
Litre of produced beverage (lpb)Unit of reference to show environmental performance relative to production volume
MarketWhen used in reference to geographic areas, a country in which Coca-Cola HBC does business
NARTDNon-alcoholic ready-to-drink
NGOsNon-governmental organisations
Nm3
Normal cubic metre
NSRNet sales revenue
OBPPCOccasion, Brand, Price, Package, Channel
Operating leverageOperating leverage is the degree to which an increase in a company’s revenues will result in an increase in comparable EBIT
Organised tradeLarge retailers (e.g. supermarkets, discounters etc.)
PETPolyethylene terepthalate, a form of polyester used in the manufacturing of beverage bottles
Ready-to-drink (RTD)Drinks that are pre-mixed and packaged, ready to be consumed immediately with no further preparation
Right Execution Daily (RED)Major Group-wide programme to ensure in-outlet excellence
Receivable daysThe average number of days it takes to collect receivables using the following formula: average accounts receivable ÷ net sales revenue x 365
ROICReturn on invested capital. ROIC is the percentage return that a company makes over its invested capital. We define ROIC as the percentage of comparable net profit excluding net finance costs divided by the capital employed. Capital employed is calculated as the average of net debt and shareholders’ equity attributable to the owners of the parent through the year
SAPA powerful software platform that enables us to standardise key business processes and systems
SDGUN Sustainable Development Goals. On 25 September 2015, countries adopted a set of 17 goals to end poverty, protect the planet and ensure prosperity for all as part of a new sustainable development agenda. Each goal has specific targets to be achieved by 2030
Serving237ml or 8oz of beverage, equivalent to 1/24 of a unit case
Shared servicesCentre to standardise and simplify key finance and human resources processes
Small basketRefers to a shift in buying habits as consumers increase frequency of visits to stores but have smaller basket sizes which can result in lower volume but higher revenue
Sparkling beveragesNon-alcoholic carbonated beverages containing flavourings and sweeteners, but excluding, among others, waters and flavoured waters, juices and juice drinks, sports and energy drinks, teas and coffee
SKUStock Keeping Unit
Still and water beveragesNon-alcoholic beverages without carbonation including, but not limited to, waters and flavoured waters, juices and juice drinks, sports and energy drinks, teas and coffee
TerritoryThe 28 countries where Coca Cola HBC operates and in which we have bottling agreements with The Coca-Cola Company to be their exclusive distribution partner
UNESDAUnion of European Soft Drinks Associations
Unit case (u.c.)Approximately 5.678 litres or 24 servings, a typical volume measurement unit
UN Global Compact (UNGC)The world’s largest corporate citizenship initiative which provides a framework for businesses to align strategies with its 10 principles promoting labour rights, human rights, environmental protection and anti-corruption
VolumeAmount of physical product produced and sold, measured in unit cases
Volume shareShare of total unit cases sold
Value shareShare of total revenue
Waste ratioThe KPI used by Coca-Cola HBC to measure waste generation in its bottling plants, expressed in grammes of waste generated per litre of produced beverage (g/lpb)
Waste recyclingThe KPI used by Coca-Cola HBC to measure the percentage of production waste at bottling plants that is recycled or recovered
Water footprintA measure of the impact of water use, in operations or beyond, as defined by the Water Footprint Network methodology
Water use ratioThe KPI used by Coca-Cola HBC to measure water use in its bottling plants, expressed in litres of water used per litre of produced beverage (l/lpb)
Working capitalOperating current assets minus operating current liabilities excluding financing and investment activities
2552018 INTEGRATED ANNUAL REPORTSR
CG
FS
SSR
SI

Special note regarding forward-looking statementsThis document contains forward-looking statements that involve risks and uncertainties. These statements may generally, but not always, be identified by the use of words such as ‘believe’, ‘outlook’, ‘guidance’, ‘intend’, ‘expect’, ‘anticipate’, ‘plan’, ‘target’, ‘seek’, ‘estimates’, ’potential‘ and similar expressions to identify forward-looking statements. All statements other than statements of historical fact, including, among others, statements regarding the future financial position and results; Coca-Cola HBC’s outlook for 2019 and future years; business strategy and the effects of the global economic slowdown; the impact of the sovereign debt crisis, currency volatility, Coca-Cola HBC’s recent acquisitions, and restructuring initiatives on Coca-Cola HBC’s business and financial condition; Coca-Cola HBC’s future dealings with The Coca-Cola Company; budgets; projected levels of consumption and production; projected raw material and other costs; estimates of capital expenditure; free cash flow; and effective tax rates and plans and objectives of management for future operations, are forward-looking statements. You should not place undue reliance on such forward-looking statements. By their nature, forward-looking statements involve risk and uncertainty because they reflect Coca-Cola HBC’s current expectations and assumptions about future events and circumstances that may not prove accurate. Forward-looking statements speak only as of the date they are made. Coca-Cola HBC’s actual results and events could differ materially from those anticipated in the forward-looking statements for many reasons, including the risks described in the Risk and materiality section. Although Coca-Cola HBC believes that, as of the date of this document, the expectations reflected in the forward-looking statements are reasonable, Coca-Cola HBC cannot assure that Coca-Cola HBC’s future results, level of activity, performance or achievements will meet these expectations. Moreover, neither Coca-Cola HBC, nor its Directors, employees, advisers nor any other person assumes responsibility for the accuracy and completeness of any forward-looking statements. After the date of this Integrated Annual Report, unless Coca-Cola HBC is required by law or the rules of the UK Financial Conduct Authority to update these forward-looking statements, Coca-Cola HBC makes no commitment to update any of these forward- looking statements to conform them either to actual results or to changes in Coca-Cola HBC’s expectations.
About our reportThe 2018 Integrated Annual Report (the ‘Annual Report’) consolidates Coca-Cola HBC AG’s (also referred to as ‘Coca-Cola HBC’ or the ‘Company’ or the ‘Group’) UK and Swiss disclosure requirements, while meeting the disclosure requirements for its secondary listing on the Athens Exchange. In addition, the Annual Report aims to deliver against the expectations of the Company’s stakeholders and sustainability reporting standards, providing a transparent overview of the Group’s performance and progress in sustainable development for 2018.
Our strategy is designed to deliver responsible, sustainable and profitable growth. Our strategic objectives of driving volume growth, focusing on value, improving efficiency and investing in the business are supported by our people and our commitment to sustainability. The initiatives we implemented to achieve our objectives and the evidence of our success during the year form the basis of the narrative in the Annual Report, which is structured around our stakeholders: our people, communities, consumers, customers and other stakeholders, with whom we work to enhance efficiencies in the business.
The Annual Report is for the year ended 31 December 2018, and its focus is on the primary core business of non-alcoholic ready-to-drink beverages across the 28 countries in which we operate. Our website and any other website referred to in the Annual Report are not incorporated by reference and do not form part of the Annual Report.
The consolidated financial statements of the Group, included on pages 153-220, have been prepared in accordance with International Financial Reporting Standards (IFRS) as issued by the International Accounting Standards Board (IASB). Coca-Cola HBC AG’s statutory financial statements, included on pages 230-240, have been prepared in accordance with the Swiss Code of Obligations. Unless otherwise indicated or required by context, all financial information contained in this document has been prepared in accordance with IFRS. For Swiss law purposes, the annual management report consists of the sections entitled ‘Strategic Report’, ‘Corporate Governance’ (without the sub-section ‘Director’s Remuneration Report’), ‘Supplementary Information’ and ‘Glossary’.
The Group uses certain Alternative performance measures (‘APMs’) that provide additional insights and understanding to the Group’s underlying operating and financial performance, financial condition and cash flows. A full list of these APMs, their definition and reconciliation to the respective IFRS measures can be found on pages 246-249.
This report is prepared in accordance with the Global Reporting Initiative (GRI) standards, comprehensive option. In addition, the sustainability aspects of this Annual Report comply with the AA1000AS Assurance Standard, and the advanced level requirements for communication on progress against the 10 Principles of the United Nations Global Compact. In addition, the report is aligned with the principles and elements of the International Integrated Reporting Council’s (IIRC) framework. Carbon emissions are calculated using the GHG Protocol Corporate Accounting and Reporting Standard methodology. Furthermore, Coca-Cola HBC supports the Task Force on Climate-related Financial Disclosures (TCFD). The sustainability aspects of the Integrated Annual Report have been verified by an independent professional assurance provider as dictated by the Company’s Operating and Sustainability Steering Committees, and you can find the relevant assurance statement on pages 250-252. As with the rest of the information provided, the sustainability aspects of this Annual Report are for the full year ended 31 December 2018 and the related information presented is based on an annual reporting cycle.
We remain committed to strong corporate governance and leadership as well as transparency in our disclosures. We will continue to review our reporting approach and routines, to ensure they meet best practice reporting standards and the expectations of our stakeholders, and provide visibility on how we create sustainable value for the communities we serve.
256 COCA-COLA HBC

VISIT USwww.coca‑colahellenic.comThe Group site features all the latest news and stories from around our business and communities, as well as an interactive online version of this report.
Write to usWe have dedicated email addresses which you can use to communicate with us:

Co
ca‑Co
la Hellenic B
ottling C
om
pany 2018 Integrated Annual R
eport
Coca‑Cola HBC AGTurmstrasse 26, CH‑6312 Steinhausen, Switzerland
www.coca‑colahellenic.com
This report is printed on paper certified in accordance with the FSC® (Forest Stewardship Council®) and is recyclable and acid‑free. Pureprint Ltd is FSC certified and ISO 14001 certified showing that it is committed to all round excellence and improving environmental performance is an important part of this strategy. Pureprint Ltd aims to reduce at source the effect its operations have on the environment and is committed to continual improvement, prevention of pollution and compliance with any legislation or industry standards. Pureprint Ltd is a Carbon / Neutral® Printing Company.
Designed and produced by Black Sun Plc