income, income inequality and mortalityisec.ac.in/wp 249 - k s james and t s syamala .pdf · this...
TRANSCRIPT

Income, Income Inequalityand MortalityAn empirical investigation of therelationship in India, 1971-2003
K S JamesT S Syamala

ISBN 978-81-7791-105-3
© 2010, Copyright ReservedThe Institute for Social and Economic Change,Bangalore
Institute for Social and Economic Change (ISEC) is engaged in interdisciplinary researchin analytical and applied areas of the social sciences, encompassing diverse aspects ofdevelopment. ISEC works with central, state and local governments as well as internationalagencies by undertaking systematic studies of resource potential, identifying factorsinfluencing growth and examining measures for reducing poverty. The thrust areas ofresearch include state and local economic policies, issues relating to sociological anddemographic transition, environmental issues and fiscal, administrative and politicaldecentralization and governance. It pursues fruitful contacts with other institutions andscholars devoted to social science research through collaborative research programmes,seminars, etc.
The Working Paper Series provides an opportunity for ISEC faculty, visiting fellows andPhD scholars to discuss their ideas and research work before publication and to getfeedback from their peer group. Papers selected for publication in the series presentempirical analyses and generally deal with wider issues of public policy at a sectoral,regional or national level. These working papers undergo review but typically do notpresent final research results, and constitute works in progress.

INCOME, INCOME INEQUALITY AND MORTALITY
AN EMPIRICAL INVESTIGATION OF THE RELATIONSHIP IN INDIA, 1971-2003
K S James and T S Syamala∗
Abstract This study aims to understand the nuances behind the often-celebrated relationship between income and mortality in the context of India. The income-life expectancy relationship is non-linear in nature, with mortality responding sharply in the earlier years and rather slowly in the latter years. The regression analysis between per-capita income and the Gini-Coefficient with mortality for different decades revealed that the income-mortality relationship has been weaker in the 1970s but became stronger in the 1980s and the 1990s. In the 1990s, the relationship was mainly confined to the 0-4 and 70+ age groups. In addition, during the 1990s, besides income, the income inequality measure (Gini Coefficient) became an important predictor of mortality. The multi-level analysis also proved nearly the same pattern. The income-mortality relationship in India is limited to the childhood years. The income inequality measure also matters more in the case of childhood mortality. The study also looks at the pathways through which income or income inequality can influence mortality. Nevertheless, it is found that neither the access to care nor the bad health habits can explain this relationship completely. Perhaps, there is a need for further deep investigation into the relationship to understand the pathways through which it operates in India.
Introduction
The most frequently cited correlate of mortality is the socio-economic living standards measured either
at the household level or at aggregate level. The evidence of significant quantitative association
between economic status and health measures is abundant from the different count ries of the world,
whether developed or developing (Smith 1999). At the same time, considerable debate persists on the
relative importance of income in determining the health status of the people, particularly in developing
countries. In recent years, with the diffusion of medical technologies in developing countries, the
general perception is that mortality is, increasingly, being disassociated from economic factors (Preston
1976), despite the fact that most micro-level studies invariably bring out the clear association between
livings standards and mortality1.
The standard argument put forward as a reason for this relationship, at least in the context of
developed countries, is that it is a mere manifestation of easy access to care. The poor people are
denied health care due to lack of purchasing power or they are able to access only poor quality services.
If access to care is the reason for this relationship, it can be addressed, perhaps, with appropriate
policies to improve access to health services (Deaton 2002). However, much of the public health
literature did not accept this view (Deaton 2002, Cutler et al, 2006). Deaton (2002) summarises the
findings of various studies on the importance of access to care in the following words: “While the public
healt h literature contains sound arguments that differential access to medical care is not the root of the
gradient, the literature probably assigns too little weight to the effectiveness of medical care itself and
∗ Professor and Head, and Associate Professor, Population Research Centre, Institute for Social and Economic
Change, Dr V K R V Rao Road, Nagarabhavi, Bangalore – 560 072. 1 In India, all the large-scale surveys conducted in recent years, three rounds of National Family Health Survey
(NFHS), district level Reproductive and Child Health Survey (RCH) and the NSSO data on morbidity, reveal an inverse relationship between standard of living and mortality.

2
beyond that to the possibility that widening gradients are related to life saving bursts of technical
progress” (Deaton 2002, P: 18).
Another possible argument for the observed relationship between income and mortality is that
it is a reflection of bad health-related behaviour of the poor people. Health related behaviour such as
use of tobacco, smoking, consumption of alcohol etc., is generally found to be higher among the socio-
economically backward sections of the population in many countries. However, the studies have also
indicated that such behaviour can explain only a part of the income -mortality gradient (Deaton 2002).
Despite significant differences, many developing countries have recently experienced vast
improvement in life expectancy without commensurate increase in per capita income. This has led to
the argument that non-income factors play a crucial role in mortality transition in developing countries.
Contrary to this, Preston (1980) found a significant association between life expectancy and income
level even in developing countries. He has measured income in terms of the national income of the
country, which he argued is the best single indicator of the living standards in a country. The study
showed that considerable improvement in life expectancy during 1930 to 1960 could be attributed to
the improvement in the socio-economic standards. The income-mortality relationship is explained in
terms of improvement in food supply and the resultant increase in the health of the population.
In the mid-70s, researchers began to doubt whether national income continued to play any
role in determining population health in industrialised countries. Since then a few studies have recorded
evidence from the poor countries that the income -mortality relationship is strong only in countries with
low per capita income. The issue of concern here was the nature of the relationship between income
and health. Some of the studies have argued that the income -health relationship is best characterised
as a linear gradient of risk, with each higher level of income associated with better health and lower
morality (Marmot et al, 1991; Adler et al, 1993). However, a few other studies argued the income-
health relationship to be non-linear with income beyond the median level having diminishing effect on
health (Backlund et al, 1996; House et al, 1990). It appeared that at a certain level of development,
increase in income had little effect on national life expectancy (Preston, 1975).
Of late, it has also been argued that economic reform, which is the leading cause of
accelerated economic growth and increase in per capita income, is adversely affecting the status of the
people (Prasad and Sathyamala 2006). This has been argued in the case of India and China by other
authors as well (Cutler et al, 2006). They have attributed the slow decline in mortality in both the
countries in the 1990s to their economic reform policies. In other words, it is argued that economic
reforms and the consequent high growth of income widened income inequality in the country. This
widening inequality had an adverse impact on the general health of the people.
Over the years, there has been debate over the role of income as a determinant of population
health. This paved way for further studies to focus less on individual income and health measures and
more on distribution of economic and health benefits across different social and economic groups within
and across societies. The major findings of some of the studies were that better health outcomes are
positively correlated not only with absolute levels of income but also with equitable distribution of
income within society (Wilkinson, 1990; Kaplan et al, 1998; Ken Judge, 1995). The studies summarised
that mortality rates are no longer related only to per capita economic growth, but are related, instead,

3
to the scale of income inequality in each society. Studies conducted in the United States and Brit ain
have come out with evidence supporting the income inequality hypothesis.
Most of the studies on income, income inequality and mortality are conducted in the western
countries and very little is known about this relationship in the context of developing countries. While
studies have provided conflicting evidence of income-mortality relationship within developing countries,
the income inequality-mortality relationship remains completely unknown. This study, therefore, looks at
the income, income inequality and mortality relationship in India using data from 1971 to 2003. A broad
trend in in Per-capita Income (PCI) and Income Inequality (Gini coefficient) in different States of India
is given in Appendix IX.
The major objective of this study is to examine the income and income inequality relationship
with mortality in different states in India over the last three decades. It also tries to find out how the
income-mortality relationship changes over the period and how far the inequality measure mediates this
relationship. Further, the study looks at the pathways through which the relationship operates in India.
The Mortality is analysed separately for broad age gro ups because the relationship is different across
these broad classifications.
Data and Methodology
The data for the study come s from age-specific death rates for different states in India on an annual
basis since 1971 available from the Sample Registration System (SRS). The SRS provides death rate for
every five-year age group up to 70 years. For convenience, the age-specific mortality in the five-year
age group is collapsed into six broad categories using appropriate population weights.
The Per-capita Income data come s from the Central Statistical Organisation (CSO) for the
same period at constant prices. However, the CSO changes the base period of the income data from
time to time. The data from 1980-81 to 2002-03 is available with the same base year, 1993-94, from
the EPW Research Foundation. The data from 1970-71 to 1978-79, available for the 1980-81 base
period, is converted into the 1993-94 base year by splicing.
Another problem in comparing the data on income with mortality is that while income dat a is
provided for a financial year, the mortality data is available on a calendar-year basis. We have
compared the income data for 1970-71 to death rate of 1970 and followed a similar pattern for all the
years.
The income-inequality measure considered for the analysis is the Gini index computed from the
National Sample Survey Organisation (NSSO) consumption expenditure data. For previous years, the
Gini index is taken from the World Bank (1997). However, the data are not available for Punjab and
Haryana separately for the past. Hence, the same level of inequality is assumed for both states for
earlier years. The recent inequality index is drawn from the Economic Review. The data from NSSO on
consumption expenditure used for estimating the Gini index is not available on an annual basis. Hence,
for those years where data are not available we have assumed nearly the same inequality level of the
succeeding or preceding years, whichever is nearest.

4
Multilevel model
We utilised the linear multilevel modeling approach to address the relationship between income,
income-inequality and mortality more thoroughly (Goldstein 2003; Raudenbush and Bryk 2002). We
conceptualised the data as a three-level structure of “cells” of death rates at level-1, with time at level-
2, and within states at level-3 (Subramanian 2005; Subramanian et al, 2003). The cells are based on a
cross-tabulation of 15 age categories × 2 gender categories (male/female) × 2 categories of place of
residence (urban/rural) for each period. For every state, we observe d repeated measures on the
outcome (mortality rate) and for every cross-section (within a state) we observe d death rates based on
a combination of age, gender and place of residence. Consequently, the baseline model that we
specified for the analysis is as follows:
)( 0000 ijkjkkijkjkt
ijk euvty +++++= ßxββ
(1)
where, ijky is the logged death rate for cell i in time j in state k ; x is a vector of
categorical cell-level predictors (i.e., age, sex, and place of residence); t is a continuous variable time
(centered around year 1985). Three random terms are specified in the models (1): kv0 , jku0 and
ijke0 ; kv0 is the random displacement for state k in mortality rate, jku0 is the random effect
associated with time j in state k , and ijke0 is the level-1 residual for each cell i in time j in state
k .
In model (1) the regression and variance parametres take on the following interpretations: 0β
(associated with a constant, ijkx0 , which is a set of 1s, and therefore, not written) is the average
logged mortality rate for referenced individuals (which is mortality rate of rural males in the 0-4 years
age group in 1985) across all states over the entire study period; β is a vector of regression
coefficients associated with the vector of cell-level predictors; and tβ estimates the average linear
trend in mortality over time. No substantial improvement was noticeable for alternative (less
parsimonious) specifications of time (including non-linear and a saturated specification with a dummy
variable for each period). The random effects, kv0 , jku0 and ijke0 , are assumed to be identically,
independently and normally distributed with mean zero and variances, 20vσ , 2
0uσ , and 20eσ ,
respectively. The parameter 20vσ represents the variation between states in mortality rate based on
age, sex, place of residence and after accounting for the average changes in mortality over time; 20uσ
represents the between-time (within state) variation in mortality or the unobserved heterogeneit y
associated with time, and 20eσ represents the residual variation at the cell level. The presence of more
than one residual term (or the structure of the random part more generally) distinguishes the multilevel
model from the standard linear regression models or analysis of variance models (Goldstein 2003). The
underlying random structure (variance-covariance matrix, represented as ? ) of the model specified in

5
model (1) is typically specified as: ),0(~][ 200 vk NvVar σ ; ),0(~][ 2
00 ujk NuVar σ ;
),0(~][ 200 eijk NeVar σ ; and 0],,[ 000 =ijkjkk euvCov . Model (1) is usually referred to as the
“random-intercepts” or “variance components” model, since it allows us to partition variation according
to the different levels, with the variance in ijy being the sum of 20vσ + 2
0uσ + 20eσ .
In order to address time factor, we extended Model 1 to include a time-varying predictor
associated with per capita income in the fixed part of the model:
)( 0000 ijkjkkjkPCI
ijkjkt
ijk euvPCIty ++++++= βββ ßx
(2a)
where, PCIβ estimates the average linear effect of jkPCI (the logged per capita income at
time j in state k ) on changes in mortality. We also tested an alternative specification, where instead
of specifying states as a random effect ( kv0 ), we included them as a fixed effect, giving us the
following two-level multilevel Model (2b):
)( 000 ijjjjPCI
ijjt
ij euPCIty ++++++= stßßx stβββ
(2b)
where, jst is a vector of dummy variables for j -1 states, and stß is a vector of regression
coefficients associated with it. The results associated with PCIβ were not sensitive to the alternate
model specification. We present both the results. Model 2 was then extended to include an interaction
variable between the logged state per capita income ( jkPCI ) and age categories in the fixed part of
the model to address aim (2):
)(].[ 0000 ijkjkkjkijkagepci
jkPCI
ijkage
ijkjkt
ijk euvPCIageßPCIageßty ++++++++= βββ ßx
(3)
where, ijkage is a vector of dummy variables for i -1 age categories, and ageß is a vector of
regression coefficients associated with it. The vector of interaction parameters is given by agepciß and
is associated with vector of interaction variables ].[ jkijk PCIage . Model 3 was also tested with state as
a fixed effect. Models similar to 2a, 2b and 3 were specified for testing the relationship between state
income inequality and mortality decline. State income inequality was also logged. The coefficients
reported are Maximum Likelihood estimates, derived by using the Iterative Generalized Least Squares
algorithm as implemented with MlwiN (Goldstein 2003; Rasbash et al, 2004).
Income-Mortality Pattern
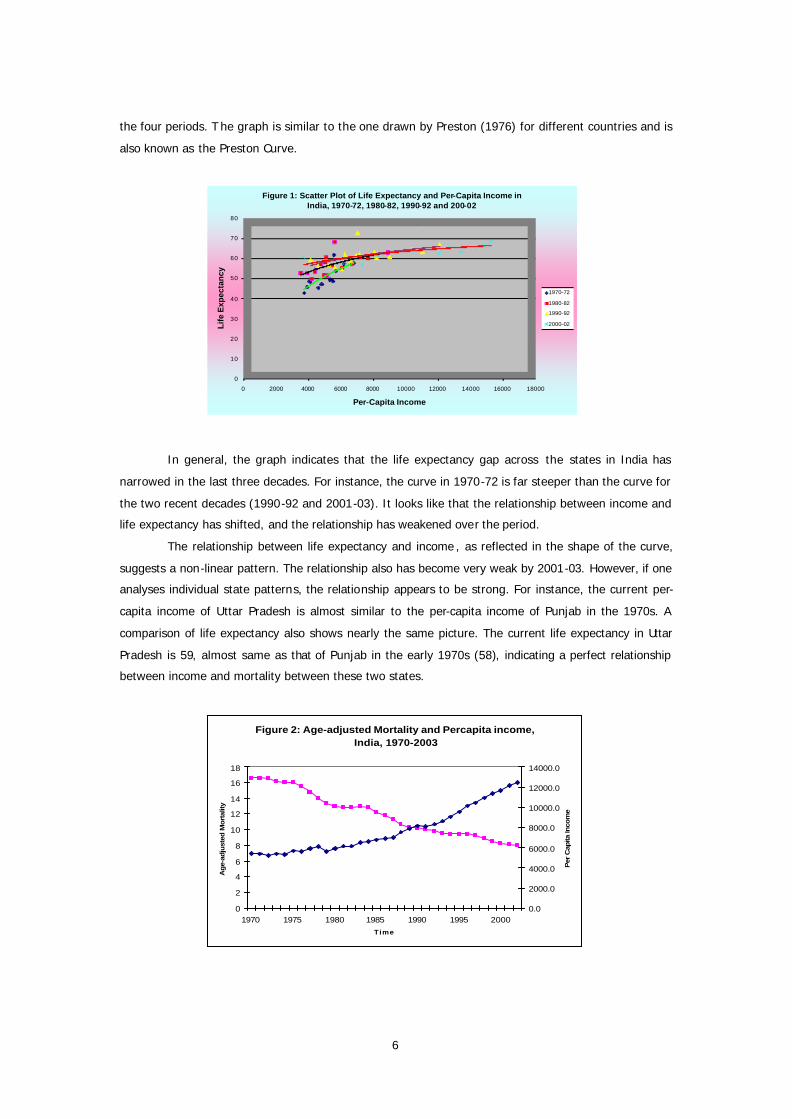
As a first step, we have plotted the relationship between income and life expectancy for four periods
(Figure 1). A logistic curve is also fitted on the scatter plot between income and life expectancy for all
6
the four periods. T he graph is similar to the one drawn by Preston (1976) for different countries and is
also known as the Preston Curve.
0
10
20
30
40
50
60
70
80
0 2000 4000 6000 8000 10000 12000 14000 16000 18000
Life
Exp
ecta
ncy
Per-Capita Income
Figure 1: Scatter Plot of Life Expectancy and Per-Capita Income in India, 1970-72, 1980-82, 1990-92 and 200-02
1970-72
1980-82
1990-92
2000-02
In general, the graph indicates that the life expectancy gap across the states in India has
narrowed in the last three decades. For instance, the curve in 1970-72 is far steeper than the curve for
the two recent decades (1990-92 and 2001-03). It looks like that the relationship between income and
life expectancy has shifted, and the relationship has weakened over the period.
The relationship between life expectancy and income , as reflected in the shape of the curve,
suggests a non-linear pattern. The relationship also has become very weak by 2001-03. However, if one
analyses individual state patterns, the relationship appears to be strong. For instance, the current per-
capita income of Uttar Pradesh is almost similar to the per-capita income of Punjab in the 1970s. A
comparison of life expectancy also shows nearly the same picture. The current life expectancy in Uttar
Pradesh is 59, almost same as that of Punjab in the early 1970s (58), indicating a perfect relationship
between income and mortality between these two states.
Figure 2: Age-adjusted Mortality and Percapita income, India, 1970-2003
0
2
4
6
8
10
12
14
16
18
1970 1975 1980 1985 1990 1995 2000
Time
Ag
e-ad
just
ed M
ort
ality
0.0
2000.0
4000.0
6000.0
8000.0
10000.0
12000.0
14000.0
Per
Cap
ita In
com
e

7
The non-linear relationship between income and mortality is also clear in Figure 2, which plots
age-adjusted mortality with per-capita income and time at the national level. The per-capita income of
India has been growing faster since the 1990s, but the pace of decline in mortality has been slower,
perhaps because mortality level is already low. Similarly, although per-capita income growth was slow
prior to 1990 there was a faster decline in mortality.
Life expectancy and age-adjusted mortality are summary indicators and, as such, often conceal
wide variations across different age groups in mortality. Perhaps, mortality in all age groups may not
respond to income similarly. For instance, the relationship of income with adult mortality is rather
complex while that of child mortality is commonly observed. Hence, the relationship between mortality
and income using summary mortality indicators may be misleading.
Mortality Pattern by Broad Age groups
In order to understand the income-mortality relationship more closely, we have plotted broad age group
mortality first against per-capita income and later against time. The graph is presented only at the all-
India level. There are significant variations in the pattern of mortality transition across the states, some
of which will be depicted subsequently. For more clarity, the death rate is converted into log odds
ratios. Figures 3 and 4 present the 0-4 age group’s death rate plotted against per-capita income and
time in India.
-5
-4
-3
-2
-1
0
5433 5654 5920 6769 8149 9558 11643
Lo
g O
dd
s R
atio
PGNP
Figure 3: Change In Mortality For 0-4 Age Group By Sex & PCI,India (1970-2003)
MALE
FEMALE
-4.5
-4
-3.5
-3
-2.5
-2
-1.5
-1
-0.5
0
1970 1973 1976 1979 1982 1985 1988 1991 1994 1997 2000 2003
Lo
g O
dd
s R
ati
o
YEAR
Figure 4: Change In Mortality For 0-4 Age Group By Sex, India (1970-2003)
MALE
FEMALE
Figure 3 indicates that there had been faster decline in child mortality in the beginning but
slowed down towards the end. Perhaps, one possible explanation is that at the initial level of economic
development, a smaller increase in income responds more positively to a decline in mortality than at
higher levels of economic development. Similar changes were also observed with time and mortality
(Figure 4). It is, therefore, difficult to predict whether the decline is merely due to the time factor
(technological improvement) or whether socio-economic development measured in terms of per-capita
income also plays a crucial role in reducing mortality. The figures also show female disadvantage in
mortality throughout the period and the magnitude does not significantly vary across time.
As against this, mortality in the 5-14 and 15-34 age groups depict s a slow decline in the past
and a faster decline in recent years (Figures 5 – 8). This is particularly true in the early adult years (15-
34 age group), where adult mortality shows an increasing trend during the second half of the 1980s to
first half of the 1990s. This trend is similar in the two graphs depicted by per-capita income and time. It

8
indicates that income plays only marginal role in mortality transition in the adult age group. As against
the gender pattern observed in the 0-4 age group, a narrow ing trend in the gender differentials in
mortality in recent years is apparent in the 5-14 and 15-34 age groups.
The late adult mortality (35-59 years) pattern, depicted in Figures 9 and 10, shows lower
mortality for females throughout the period. In recent years, the gap has further widened in for
females. The trend recorded in late adult mortality coincides with the early adult mortality pattern and
early old age mortality (60-69 years depicted in Figures 11 and 12). Hence, it is difficult to predict the
effect of per-capita income on the decline of mortality for these age groups from the current analysis.
The mortality trend, on the contrary, in the 70 years and above age group is in line with the 0-4 age
group’s mortality pattern (Figures 13 and 14). There has been a steady decline in mortality in the 70
years and above age group throughout the period.
Figure 8: Change In Mortality for 15-34 Age Group by Sex, India (1970-2003)
-6.4-6.2
-6 -5.8-5.6-5.4-5.2
-5 -4.8
1970 1975 1980 1985 1990 1995 2000YEAR
Log Odds RatioMALEFEMALE
Figure 7: Change in Mortality for 15-34 Age Group by Sex & PCI, India (1970-2003)
-6.4-6.2
-6-5.8-5.6-5.4-5.2
-5-4.8
5433 5605 6166 7543 9064 11643PGNP
Log Odds RatioMALEFEMALE
FIGURE 10: Change In Mortality for 35-59 Age Group By Sex, India (1970-2003)
-6
-5-4
-3-2
-10
1970 1975 1980 1985 1990 1995 2000 YEAR
Log Odds RatioMALEFEMALE
Figure 9: Change In Mortality For 35-59 Age Group by Sex & PCI, India (1970-2003)
-6-5
-4-3
-2-10
5433 5605 6166 7543 9064 11643PGNP
Log Odds RatioMALE
FEMALE
Figure 5: Change In Mortality For 5-14 Age Group By Sex & PCI,India (1970-2003)
-8-7-6-5-4-3-2-10
5433 5605 6166 7543 9064 11643 PGNP
Log Odds RatioMALE
FEMALE
-8-7-6-5-4-3-2-10
1970 1973 1976 1979 1982 1985 1988 1991 1994 1997 2000 2003
YEAR
Figure 6: Change In Mortality For 5-14 Age Group By Sex, India (1970-2003)
Log Odds Ratio MALE FEMALE

9
Overall, the child and adult mortality patterns signify faster rate of decline in the past and slow
decline in the recent years. Adult mortality shows slower decline in the past and faster decline in recent
years. However, the role of income in the decline of mortality in both groups cannot be clearly
established. Perhaps, it is true that income does not matter for all the age groups. However, before
coming to this conclusion, there is a need to undertake an analysis that is more comprehensive.
State level Variation in Mortality Pattern
In order to present a general idea of the differential pattern of decline in mortality across states in
India, we plotted a graph depicting log odds ratio of 0-4 mortality over the period for four states along
and at the all-India level. Figure 15 presents the change in the log odds ratio of 0-4 mortality in Kerala,
Karnataka, Orissa and Madhya Pradesh and all-India. The states are arbitrarily chosen. Two states are
in the advanced demographic transition and the other two in the early transition.
Figure 14: Change in Mortality for 70+ Age Group By Sex, India (1970-2003)
-3
-2.5
-2
-1.5
-1
-0.5
0
1970 1975 1980 1985 1990 1995 2000YEAR
Log Odds RatioMALE FEMALE
Figure 13: Change In Mortality For 70+ Age Group by Sex & PCI, India (1970-2003)
-3
-2.5
-2
-1.5
-1
-0.5
0
5433 5605 6166 7543 9064 11643PGNP
Log Odds Ratio MALE
FEMALE
Figure 12: Change In Mortality for 60-69 Age Group by Sex, India (1970-2003)
-4-3.5
-3
-2.5-2
-1.5
-1-0.5
0
1970 1975 1980 1985 1990 1995 2000YEAR
Log odds ratioMALEFEMALE
Figure 11: Change In Mortality For 60-69 Age Groupby Sex & PCI, India (1970-2003)
-4
-3.5
-3
-2.5
-2
-1.5
-1
-0.5
0
5433 5605 6166 7543 9064 11643PGNP
Log Odds RatioMALEFEMALE

10
Not only that mortality levels differ among states but the trend of decline also varies. It is clear
that while a drastic reduction of mortality is observed in Kerala in the early 1990s, an upward
movement of mortality is visible in other three states. Hence, an analysis of the mortality pattern should
also necessarily bring out the state-level differentials.
Statistical Analysis
The graphic presentation of data reveals some broad patterns of the income-mortality relationship
across different age groups in India. It also shows the importance of time, representing technological
changes. In this section, we examine the relationship between macroeconomic characteristics
associated with changes in per capita income and changes in income inequality and decline in mortality
in India. The per capita income mortality relationship is specifically examined over time after controlling
age, sex and place of residence. The analysis specifically examines the income-mortality relationship in
different age groups. Similarly, the income-inequality relationship is also examined over time, after
controlling age, sex and place of residence. The income-inequality measure used in the analysis is the
Gini coefficient.
Ordinary Least Square (OLS) model
As a first step, we carried out a simple OLS regression between per-capita income and Gini with
mortality in different age groups. The result of the analysis carried out for each decade separately is
presented in Table 1. The per capita income and Gini have been converted into log values.
Table 1: OLS regression coefficient of log of per-capita income (LN-PCI) and log of Gini Index (LN-GINI) on Mortality in different periods across states in India
YEAR 1970-79 1980-89 1990-2003 1970-2003
AGE-GROUP LN-PCI LN-GINI LN-PCI LN-GINI LN-PCI LN-GINI LN-PCI LN-GINI
0-4 -58.71 30.01 -37.54* 18.48 -15.14* 17.76* -42.54* -24.08
5-14 -6.67 2.61 3.50* -6.53 -6.54* -6.22* -2.26* -0.77
15-34 -3.69 1.06 2.98* -5.24 -4.14* -5.41* -1.36* -1.51
35-59 -8.64 6.28 8.06* -20.13 -11.73* -10.28 -3.99* -0.53
60-69 -41.25 38.61 27.23* -66.59 -39.84* -26.49 -13.31* 6.20
70+ -45.18 -49.27 -21.69 10.62 -6.80 84.43* -31.07* -21.84 * Significant at less than 0.05 level
Figure 15: Change in Mortality (0-4 age group) for Four States and all India, 1970-2003
-7
-6
-5
-4
-3
-2
-1
0
1970 1975 1980 1985 1990 1995 2000
Years
Log odds ratio
INDIAMP
ORISSA KARNATAKA
KERALA

11
The table brings out some interesting patterns for discussion. It seems that the per-capita
income has not been a significant factor in mortality change in the earlier decade (1970s) as against the
common understanding that the income-mortality relationship is strong at higher levels of mortality.
Perhaps, it indicates that the mortality change in India was mainly due to import of medical technology
rather than improvement in socio- economic conditions. On the contrary, the pattern of income-
mortality relationship altered significantly in India during the 1980s and the 1990s. In the 1980s, in
almost all the age categories, income shows a significant impact except for the 70 years and above
group. However, interestingly, only for childhood and very old age (70+) group, the relationship showed
a negative sign. For all other age groups, income had a significant positive impact on mortality. This
shows that for the older adults income affects mortality adversely indicating the onset of
epidemiological transition from infectious diseases to degenerative diseases that affect the rich equally.
However, this explanation may not hold well in case of younger age group (5-14). The possible reasons
for the adverse effect of income on mortality in this age group may purely be a cohort effect. As infant
and child mortality is generally high among the poor, those who have survived beyond age five among
the poor may be relatively healthier leading to lower mortality among them in the future. Surprisingly,
the pattern again changed in the 1990s and early 2000s and income shows a negative significant
relationship with mortality in almost all age groups during this period. It may be an indication that as
epidemiological transition advances, it affect s all sections irrespective of income. Nevertheless, a change
in life style may be necessary to limit the bad effect of epidemiological transition. Thus, although the
immediate effect of degenerative diseases may be on the rich, the subsequent effect will be universal
but adverse to the poor.
It is also interesting to see that income inequality shows a high positive association with
mortality in childhood and very old (70+) mortality in the 1990s and early 2000. While income remains
important, the changes that occurred during this period show the importance of the inequality pattern
on mortality, but inequality nearly remained insignificant in the earlier decades. Since the 1990s, the
Indian economy has been growing at a rapid pace and it might have worsened the inequality situation
in the country. The significant association of inequality and mortality since the 1990s may be a
reflection of the bad effect of higher economic growth and the resultant inequality on health. The
recently held National Family Health Survey-3 also showed near stagnancy in the nutritional levels of
children and women in India during the rapid economic transformation period (International Institute
for Population Sciences (IIPS) and Macro International 2007.)
Income and Mortality Estimation
For a detailed investigation of the income-mortality relationship over the period, we have estimated
different models. As a first step, per capita income and mortality has been analysed using both fixed
effect and random effect models (see Appendix I and II).
The SRS data used for the analysis is a type of repeated observations, so fixed and random
effect models are used in the analysis. In the time series data the observations are not independent. In
such cases, we can use the repetition to get better estimates. In the typical OLS estimates, the pooled
12
data would give biased estimates. The fixed and random effect models take into account the repetition
and therefore it is possible to control fixed or random individual differences.
According to this, income does not have significant impact on mortality. Both fixed effect and
random effect models do not bring out the association between income and mortality. On the contrary,
all other factors considered for the analysis like age, state, place of residence etc., were important for
mortality reduction. It is surprising because per-capita income has been found to be an important
predictor of mortality since the 1980s according to the OLS regression analysis. Perhaps the lack of
association between income and mortality may be because income does not influence mortality of all
age groups. To correct this and in order to investigate further, the relationship between age categories
and changes in state per capita income and mortality we have introduced an interaction effect between
different age groups and per capita income. The interaction effect is to find out the effect of age on
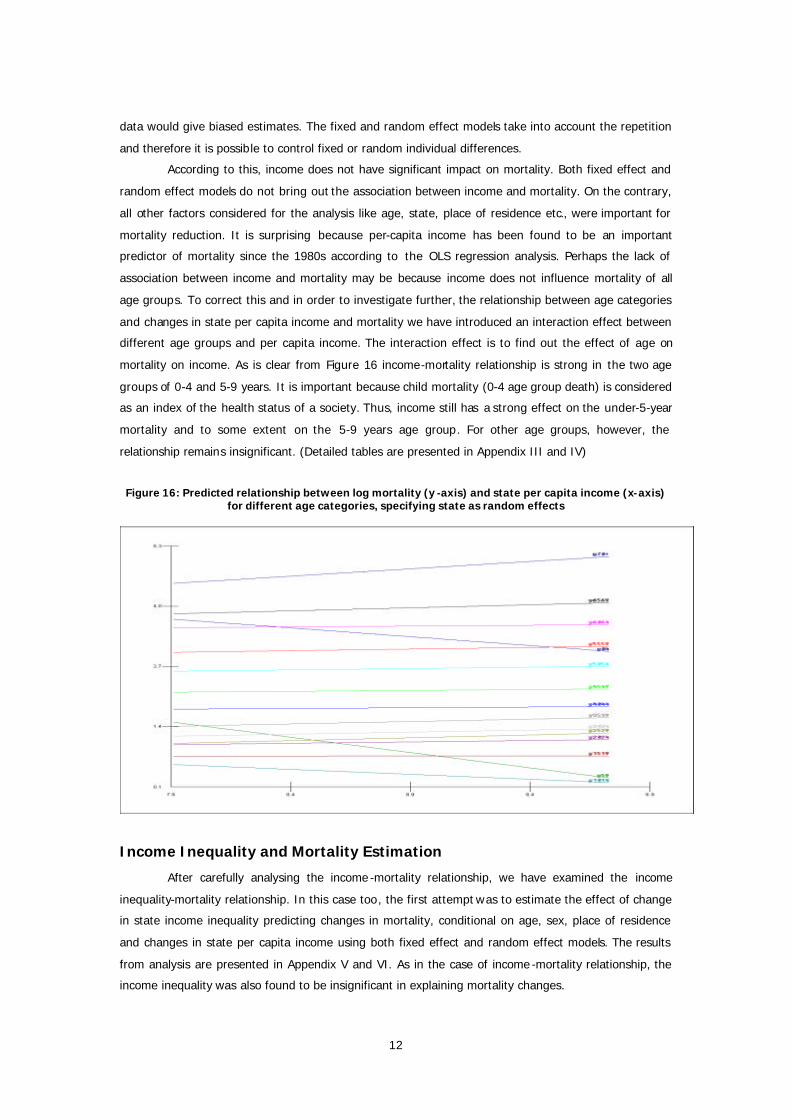
mortality on income. As is clear from Figure 16 income-mortality relationship is strong in the two age
groups of 0-4 and 5-9 years. It is important because child mortality (0-4 age group death) is considered
as an index of the health status of a society. Thus, income still has a strong effect on the under-5-year
mortality and to some extent on the 5-9 years age group. For other age groups, however, the
relationship remains insignificant. (Detailed tables are presented in Appendix III and IV)
Figure 16: Predicted relationship between log mortality (y -axis) and state per capita income (x-axis) for different age categories, specifying state as random effects
Income Inequality and Mortality Estimation
After carefully analysing the income -mortality relationship, we have examined the income
inequality-mortality relationship. In this case too, the first attempt was to estimate the effect of change
in state income inequality predicting changes in mortality, conditional on age, sex, place of residence
and changes in state per capita income using both fixed effect and random effect models. The results
from analysis are presented in Appendix V and VI. As in the case of income -mortality relationship, the
income inequality was also found to be insignificant in explaining mortality changes.

13
Figure 17: Predicted relationship between log mortality (y-axis) and state income inequality (x-axis) for different age categories, specifying state as random effects
However, other variables included in the model are significant. Perhaps it also indicates that
the inequality effect may not be universally true for all age groups. In order to test this hypothesis we
introduced the interaction terms between age-specific death rates and the income -inequality measure
(Gini coefficient). We did not find an association between changes in state income inequality and
changes in mortality. The results from the analysis is presented in Figure 17 and Appendix VII and VIII.
It is clear that an increase in state income inequality predicts decline in mortality only for the
under-5 age group. There is a positive association between state income inequality and mortality
decline in the 5-9 years age group when we specify state as a random effect. However, this slop is not
significantly different from that of 0-4 in the model when we specify state as a fixed effect. No
relationship was observed for other age groups.
On the whole, the analysis shows that income -mortality and income inequality-mortality
relationship is strong for the childhood years in India. For other age groups, income does not seem to
have a significant impact on mortality. This finding seems to be in line with the public health discourse
in India, particularly on the impact of modern medicines in controlling mortality in the country as
against improvement in socio-economic conditions. However, for the childhood years, generally, income
and public health measures matter more than medical technology.
While it is interesting that income -mortality relationship is still strong in the country, at least
for the childhood years, it is also important to ask why that is so. In other words, how does income
affect morality in the Indian context? While the income inequality argument has been very dominating
in recent years to understand the income-mortality relationship (Wilkinson 1990; Deaton 2002), the
accessibility argument has been prominent , often in the case of developing countries. In addition, it is
also often argued that the poor face several health risks due to smoking, chewing substances that affect
health, alcohol consumption etc.

14
Role of Health Accessibility
One of the important arguments put forward to explain the relationship between income and mortality
is the differences in the access to health care facilit ies between the rich and the poor. However, studies
carried out from several parts of the world reveal that even with equal access, income -mortality
relationship persists (Deaton 2002). Several issues have to be considered in determining accessibility to
health facilit ies. Physical accessibility is important because it determines the ease with which the people
are able to get treatment for any illness. However, mere physical accessibility may not help the poor in
receiving health care because they might be excluded due to financial inaccessibility. It is often reported
by different surveys in India that direct as well as indirect costs govern in accessing medical care (Mahal
et al, 2001).
There had also been criticism from many quarters overemphasizing medical facility for
achieving the desired health goals. Public health studies emphasise the limits of medicine in bringing
about improvement in health (Deaton, 2002). Even in India, Kerala had achieved a good health record
much before the advent of modern medical facilities. The mortality transition in Kerala dates back to the
beginning of the 20th Century and is mainly due to public health measures rather than medial
technological interventions (Panikar and Soman, 1984).
The district -level survey conducted as part of the Reproductive and Child Health Project in
2002-04 provides information on the physical accessibility to health facilities. The economic living
standard of the surveyed households is also provided and classified into three categories (poor, middle
and rich) based on the assets and amenities each household possesses. We have computed the
accessibility of government health facility in rural areas for different economic groups. Table 2 presents
the accessibility of different government health facilities by the standard of living index in India.
Table 2: Percentage distribution of Households with Distance to the Nearest Government Health Facilities by Standard of Living Index in Rural Areas, India, 2002-04
Stand of Living Distance to the PHC
<2 Km 2-5 Km 6 and above Low 4.4 33.6 62.0 Medium 5.2 37.6 57.3 High 6.1 38.5 55.3
Distance to the CHC Low 2.4 15.3 82.3 Medium 2.6 18.9 78.6 High 3.3 21.3 75.4
Distance to the Govt. dispensary Low 3.0 18.6 78.5 Medium 3.6 21.8 74.7 High 4.3 24.9 70.9
Distance to the Govt. Hospital Low 2.0 12.2 85.8 Medium 2.1 15.0 83.0 High 2.8 17.1 80.1
Distance to any govt. facility Low 5.8 36.3 57.9 Medium 6.3 38.8 54.9 High 6.9 39.9 53.2
Source: Computed from the District Level Household Survey conducted in India during 2002-04.

15
It shows that physical accessibility of the different levels of hospitals is not significantly
different for households with different economic living standards. The accessibility of any facility for
majority of the population is a matter of concern in India. For a large majority of the population a
government health facility is available only beyond 6 km away from home. It is difficult to believe that
the lack of accessibility to government health care facility is matched by a private care facility nearby.
With distance increasing, the poor may get affected more than the rich in terms of financial
accessibility. Thus, on the whole, it is clear that accessibility is an issue but does not seem to suggest
that the income -health relationship can be explained only in terms of accessibility as the poor and rich
are nearly equally affected by the accessibility issue.
Role of Health Habits
Another possible explanation for the income -mortality relationship is the health habits of the poor.
Unhealthy practices like smoking, drinking alcohol and chewing of tobacco etc., are considered more
common among the poor than the rich. The income -mortality relationship is also a reflection of these
bad practices. However, studies found no clear-cut findings to establish convincingly that the habits of
the poor are responsible for their bad health (Deaton 2002).
The National Family Health Survey (NFHS) conducted in 2006 collected the information on
some of the health habits of adult females in the age group 15-49 years and males in the age category
of 20-54 years. The survey also provides information on the standard of living of the household in a
five-point scale. Tables 3 and 4 provide information on the percentage of males and females who
smoke, drink alcohol and use tobacco by standard of living index.
Table 3: Percentage of females reporting alcohol use, smoking and use of tobacco by Wealth Index, India 2006
Background characteristics
Percentage Smoke
Percentage drink
Percentage use other forms of tobacco
Percentage either smoke, drink or chew
tobacco
Percentage who smoke, drink and
chew tobacco
Wealth Index
Poorest
Poorer
Middle
Richer
Richest
3.3
2.1
1.2
0.5
0.2
6.2
2.3
2.0
0.8
0.5
19.2
13.3
9.3
6.3
3.1.
23.8
16.1
11.7
7.3
3.7
0.2
-
-
-
-
Total 1.4 2.2 9.8 11.9 -
Source: Computed from National Family Health Survey data 2006.
It is clear that a higher percentage of the poor have bad health habits. However, the data also
bring out the fact that the bad health habits are comparatively very less among females in India. As
such, its impact on the health of the children will be negligible. The observed relationship between
income and health was primarily limited to the childhood years. Hence, it will be difficult to conclude
that poor health habits are the main reasons for the income -mortality relationship in the country.

16
Table 4: Percentage of males reporting alcohol use, smoking and use of tobacco by Wealth Index, India 2006
Background characteristics
Percentage Smoke
Percentage drink
Percentage use other forms of tobacco
Percentage either smoke, drink or chew
tobacco
Percentage who smoke,
drink and chew tobacco
Wealth Index
Poorest
Poorer
Middle
Richer
Richest
43.7
40.5
36.1
29.8
22.3
40.6
33.9
33.1
28.9
26.9
53.2
46.7
38.7
33.5
24.2
78.6
72.8
66.8
59.4
49.2
13.9
10.3
8.3
6.6
4.3
Total 33.5 32.0 37.9 63.9 8.0
Source: Computed from National Family Health Survey data 2006.
Conclusion
This study aims to understand the nuances behind the often-celebrated relationship between
income and mortality in India. The empirical estimation of this relationship is also largely motivated by
the long series of data on mortality and income available for every major state in India since 1971. The
age-specific mortality rate for rural and urban areas separately by gender available from the Sample
Registration System (SRS) is used for the analysis. The per-capita income data for the states for the
same period is derived from the Central Statistical Organisation (CSO). We have used multilevel fixed
effect and random effect models to understand the relationship.
The graphic presentation of the data showed that the income -life expectancy relationship is
non-linear in nature with mortality responding sharply in the earlier years and rather slowly in the latter
years. However, it was difficult to establish a one-to-one correspondence between income and mortality
through a graphic depiction because this relationship is also confounded by time (technological
improvement) and many other factors. Hence, a multivariate framework became essential to predict the
association between income and mortality.
The Ordinary Least Square regression analysis (OLS) between per-capita income, Gini
Coefficient of income distribution and mortality for different decades revealed that the income -mortality
relationship had been weak in the 1970s but became stronger in the 1980s and, to some extent, in the
1990s. In the 1990s, the relationship has been observed mainly for the 0-4 and 70-plus age group. In
addition, during the 1990s, other than income, the income inequality measure (Gini coefficient) has also
become an import ant predictor of mortality.
The multilevel analysis also proved nearly the same pattern. The income-mortality relationship
in India is limited, basically, to the childhood years. For the other age group the income -mortality
relationship does not seem to matter much. The income inequality matters more in the case of
childhood mortality. This is expected because the epidemiological transition from infectious diseases to
degenerative diseases in the country would have reduced the income -mortality relationship for adult
age groups.

17
The study looks into the impact of accessibility to health care and bad health habits as possible
explanations for the income-mortality relationship. However, it was found that at least in the case of
physical accessibility to governmental health facility, the income level did not seem to matter much in
rural areas. Bad habits like smoking, chewing tobacco and alcohol consumption were found to be more
prevalent among the poor sections of the population and comparatively less prevalent among women.
As such, its impact on childhood mortality will be negligible. Although access to care and bad baits are
important in mediating the relationship between income and mortality, they may not be able to explain
the income-mortality relationship in India.
On the whole, the analysis reveals that the income-mortality relationship is mainly restricted to
childhood years. Not only income, but also income distribution seems to matter in mortality transition at
least in recent years in the country.
References
Adler, N, T Boyce, M Chesney, S Folkman and L Syme (1993). Socioeconomic Inequalities in Health: No
Easy Solution. JAMA, 269 (24):3140-45.
Backlund D, P D Sorlier and N J Johnson (1996). The Shape of the Relationship between Income and
Mortality in United States: Evidences from the National Longitudinal Mortality Study. Annals of
epidemiology, 6 (1):12-23.
Cutler, David, Angus Deaton and Adriana Lleras-Muney (2006). The Determinants of Mortality. Journal
of Economic Perspectives, 20 (3): 97–120.
Deaton, Angus (2002). Policy Implications of the Gradient of Health and Wealth. Health Affairs, 21 (2):
13-30.
Deaton, Angus and Christina Paxson (2001). Mortality, Income, and Income Inequality Over Time in
Britain and the United States. NBER Working Paper No. 8534. Cambridge MA, USA: National
Bureau of Economic Research.
Fuchs, V (1974). Some Economic Aspects of Mortality in Developing Countries. In M Perlaman (eds),
The economics of health and medical care. New York: John Wiley.
Goldstein, H (2003). Multilevel statistical models. London: Arnold. (3rd edition)
House J, R Kessler, A R Herzog, R Mero, A Kinney and M Breslow (1990). Socioeconomic Status and
Health. Milbank Quarterly, 68:383-411.
International Institute for Population Sciences (IIPS) and Macro International (2007). National Family
Health Survey (NFHS-3) 2005-06: India: volume 1. Mumbai: IIPS.
Kaplan G A, E Pamuk, J W Lynch, R O Cohen and J L Balfour (1996). Income Inequality and Mortality in
the United States: Analysis of Mortality and Potential Pathways. BMJ, 312 (7037): 999-1003.
Ken Judge (1995). Income distribution and life expectancy: A Critical Appraisal. BMJ, 311 (7015):1282-
85.
Mahal A, A S Yazbeck, D H Peters and G N V Ramana (2001). The Poor and Health Service Use in India.
HNP Discussion Paper. Washington, DC: The World Bank.
Marmot M G, D G Smith and S Stansfeld (1991). Health Inequalities Among British Civil Servants: The
Whitehall II study. Lancet, 337 (8754): 1387-93.

18
Panikar, P G K and C R Soman (1984). Health Status of Kerala - Paradox of Economic Backwardness
and Health Development . Trivandrum: Centre for Development Studies.
Prasad, Sujata and C Sathyamala (eds) (2006). Securing Health for All: Dimensions and Challenges.
New Delhi: Institute for Human Development.
Preston, S H (1975). The Changing Relation between Mortality and the Overall Level of Economic
Development. Population Studies, 29 (2): 231-48.
Rasbash, J et al (2004). A user's guide to MLwiN version 2.0. London: Centre for Multilevel Modeling,
Institute of Education.
Raudenbush, S and A Bryk (2002). Hierarchical linear models: applications and data analysis methods.
Thousand Oaks: Sage Publications.
Subramanian, S V et al (2005). Racial Disparities in Context : A Multilevel Analysis of Neighborhood
Variations in Poverty and Excess Mortality among Black Populations in Massachusetts.
American Journal of Public Health, 95 (2): 260-65.
Subramanian, S V, K Jones and C Duncan (2003). Multilevel Methods for Public Health Research. In I
Kawachi and L F Berkman (eds), Neighborhoods and Health. Oxford University Press: New
York.
————— (2001). Multilevel Perspectives on Modeling Census Data. Environment and Planning, 33 (3):
399-417.
Wilkinson R G (1990). Income Distribution and Mortality: A "Natural" Experiment. Sociology of Health
and Illness, 12 (4): 391-412.
World Bank (1997). India: Achievements and Challenges in Reducing Poverty. Washington D C: The
World Bank.

19
Appendix I: Estimated random effect model (using state as random effect) between change in log per capita income and mortality across states in India from 1971-2003
PARAMETER ESTIMATE S. ERROR (U)
Constant 3.459* 0.300
Year 1985 -0.018* 0.001
Female -0.134* 0.005
Urban -0.345* 0.005
Age 5-9 -2.462* 0.014
Age 10-14 -2.989* 0.014
Age 15-19 -2.621* 0.014
Age 20-24 -2.323* 0.014
Age 25-29 -2.241* 0.014
Age 30-34 -2.115* 0.014
Age 35-39 -1.888* 0.014
Age 40-44 -1.581* 0.014
Age 45-49 -1.209* 0.014
Age 50-54 -0.738* 0.014
Age 55-59 -0.318* 0.014
Age 60-64 0.182* 0.014
Age 65-69 0.565* 0.014
Age 70+ 1.386* 0.014
Lpcnsdp -0.008 0.034
Lgini
20
Appendix II: Estimated fixed effect model (using state as fixed effect) between change in log per capita income and mortality across states in India from 1971-2003
PARAMETER ESTIMATE S. ERROR (U)
Constant 3.36* 0.297
Year 1985 -0.018* 0.001
Female -0.134* 0.005
Urban -0.345* 0.005
Age 5-9 -2.462* 0.014
Age 10-14 -2.989* 0.014
Age 15-19 -2.621* 0.014
Age 20-24 -2.323* 0.014
Age 25-29 -2.241* 0.014
Age 30-34 -2.115* 0.014
Age 35-39 -1.888* 0.014
Age 40-44 -1.581* 0.014
Age 45-49 -1.209* 0.014
Age 50-54 -0.738* 0.014
Age 55-59 -0.318* 0.014
Age 60-64 0.182* 0.014
Age 65-69 0.565* 0.014
Age 70+ 1.386* 0.014
Log per capita income (LPI) 0.009224 0.034
Assam 0.142* 0.023
Bihar 0.104* 0.033
Gujarat -0.006 0.024
Haryana -0.216* 0.026
Karnataka -0.119* 0.022
Kerala -0.551* 0.022
Maharashtra -0.153* 0.026
Madhya Pradesh 0.114* 0.022
Orissa 0.134* 0.024
Punjab -0.309* 0.029
Rajasthan -0.040* 0.022
Tamil Nadu -0.010 0.023
Uttar Pradesh 0.187* 0.024
West Bengal -0.102* 0.025

21
Appendix III: Estimated random e effect model (using state as random effect) between change in log per capita income and age on mortality across states in India from 1971-2003
PARAMETER ESTIMATE S. ERROR(U)
Constant 6.74* 0.365
Year 1985 -0.017* 0.001
Female -0.133* 0.005
Urban -0.346* 0.005
Age 5-9 -0.002 0.310
Age 10-14 -4.467* 0.309
Age 15-19 -6.019* 0.307
Age 20-24 -6.2* 0.307
Age 25-29 -6.664* 0.306
Age 30-34 -6.243* 0.307
Age 35-39 -6.141* 0.306
Age 40-44 -5.207* 0.306
Age 45-49 -4.9* 0.306
Age 50-54 -4.616* 0.306
Age 55-59 -4.291* 0.306
Age 60-64 -3.485* 0.306
Age 65-69 -3.939* 0.306
Age 70+ -4.755* 0.306
Log percapita income (LPI) -0.381* 0.041
LPI x Age 5-9 -0.280* 0.035
LPI x Age 10-14 0.167* 0.035
LPI x Age 15-19 0.386* 0.035
LPI x Age 20-24 0.441* 0.035
LPI x Age 25-29 0.503* 0.035
LPI x Age 30-34 0.469* 0.035
LPI x Age 35-39 0.484* 0.035
LPI x Age 40-44 0.412* 0.035
LPI x Age 45-49 0.420* 0.035
LPI x Age 50-54 0.441* 0.035
LPI x Age 55-59 0.452* 0.035
LPI x Age 60-64 0.417* 0.035
LPI x Age 65-69 0.512* 0.035
LPI x Age 70+ 0.699* 0.035

22
Appendix IV: Estimated fixed effect model (using state as fixed effect) between change in log per capita income and age on mortality across states in India from 1971-2003
PARAMETER ESTIMATE S. ERROR(U)
Constant 6.636* 0.363
Year 1985 -0.018* 0.001
Female -0.133* 0.005
Urban -0.346* 0.005
Age 5-9 -0.003 0.310
Age 10-14 -4.465* 0.309
Age 15-19 -6.018* 0.307
Age 20-24 -6.199* 0.306
Age 25-29 -6.663* 0.306
Age 30-34 -6.244* 0.307
Age 35-39 -6.141* 0.306
Age 40-44 -5.207* 0.306
Age 45-49 -4.899* 0.306
Age 50-54 -4.616* 0.306
Age 55-59 -4.291* 0.306
Age 60-64 -3.485* 0.306
Age 65-69 -3.94* 0.306
Age 70+ -4.756* 0.306
Log per capita income (LPI) -0.363* 0.042
LPI x Age 5-9 -0.2809* 0.035
LPI x Age 10-14 0.167* 0.035
LPI x Age 15-19 0.386* 0.035
LPI x Age 20-24 0.441* 0.035
LPI x Age 25-29 0.503* 0.035
LPI x Age 30-34 0.469* 0.035
LPI x Age 35-39 0.484* 0.035
LPI x Age 40-44 0.412* 0.035
LPI x Age 45-49 0.420* 0.035
LPI x Age 50-54 0.441* 0.035
LPI x Age 55-59 0.452* 0.035
LPI x Age 60-64 0.417* 0.035
LPI x Age 65-69 0.512* 0.035
LPI x Age 70+ 0.699* 0.035
Assam 0.142* 0.023
Bihar 0.102* 0.033
Gujarat -0.006 0.024
Haryana -0.216* 0.026
Karnataka -0.12* 0.022
Kerala -0.552* 0.022
Maharashtra -0.152* 0.026
Madhya Pradesh 0.114* 0.022
Orissa 0.133* 0.024
Punjab -0.308* 0.029
Rajasthan -0.040 0.022
Tamil Nadu -0.009 0.023
Uttar Pradesh 0.186* 0.024
West Bengal -0.101* 0.025

23
Appendix V: Estimated random effect model (using state as random effect) between change in income inequality and mortality across states in India from 1971-2003
PARAMETER ESTIMATE S. ERROR(U)
Constant 3.393* 0.359
Year 1985 -0.018* 0.001
Female -0.141* 0.005
Urban -0.335* 0.005
Age 5-9 -2.467* 0.014
Age 10-14 -2.986* 0.014
Age 15-19 -2.611* 0.014
Age 20-24 -2.314* 0.014
Age 25-29 -2.234* 0.014
Age 30-34 -2.112* 0.014
Age 35-39 -1.887* 0.014
Age 40-44 -1.585* 0.014
Age 45-49 -1.212* 0.014
Age 50-54 -0.738* 0.014
Age 55-59 -0.319* 0.014
Age 60-64 0.182* 0.014
Age 65-69 0.569* 0.014
Age 70+ 1.397* 0.014
Log of per capita income -0.006 0.035
Lgini 0.013 0.052

24
Appendix VI: Estimated fixed effect model (using state as fixed effect) between change in income inequality and mortality across states in India from 1971-2003
PARAMETER ESTIMATE S. ERROR(U)
Constant 3.227* 0.359
Year 1985 -0.018* 0.001
Female -0.141* 0.005
Urban -0.336* 0.005
Age 5-9 -2.467* 0.014
Age 10-14 -2.986* 0.014
Age 15-19 -2.611* 0.014
Age 20-24 -2.314* 0.014
Age 25-29 -2.234* 0.014
Age 30-34 -2.112* 0.014
Age 35-39 -1.887* 0.014
Age 40-44 -1.585* 0.014
Age 45-49 -1.212* 0.014
Age 50-54 -0.738* 0.014
Age 55-59 -0.319* 0.014
Age 60-64 0.182* 0.014
Age 65-69 0.569* 0.014
Age 70+ 1.397* 0.014
Lgini 0.026 0.052
Assam 0.172* 0.031
Bihar 0.112* 0.035
Gujarat -0.007 0.025
Haryana -0.218* 0.026
Karnataka -0.120* 0.022
Kerala -0.555* 0.023
Maharashtra -0.158* 0.027
Madhya Pradesh 0.113* 0.022
Orissa 0.137* 0.024
Punjab -0.311* 0.029
Rajasthan -0.041 0.022
Tamil Nadu -0.014 0.023
Uttar Pradesh 0.189* 0.024
West Bengal -0.100* 0.025
Lpcnsdp 0.014 0.035

25
Appendix VII: Estimated random effect model (using state as random effect) between change in income inequality and age on mortality across states in India from 1971-2003
PARAMETER ESTIMATE S. ERROR(U)
Constant 2.482* 0.428
Year 1985 -0.018* 0.001
Female -0.140* 0.005
Urban -0.336* 0.005
Age 5-9 -2.386* 0.344
Age 10-14 -1.756* 0.345
Age 15-19 -1.501* 0.343
Age 20-24 -1.255* 0.341
Age 25-29 -0.441 0.342
Age 30-34 -0.577 0.342
Age 35-39 -0.885* 0.342
Age 40-44 -0.755* 0.342
Age 45-49 -0.014 0.342
Age 50-54 -0.071 0.341
Age 55-59 0.891* 0.341
Age 60-64 0.682* 0.341
Age 65-69 1.399* 0.341
Age 70+ 2.048* 0.341
lpcnsdp -0.006 0.035
Log of Gini 0.284* 0.087
lgini.y5 -0.024 0.102
lgini.y1 -0.365* 0.103
lgini.y1 -0.330* 0.102
lgini.y2 -0.314* 0.101
lgini.y2 -0.533* 0.102
lgini.y3 -0.456* 0.101
lgini.y3 -0.297* 0.101
lgini.y4 -0.246* 0.102
lgini.y4 -0.356* 0.102
lgini.y5 -0.198 0.101
lgini.y5 -0.359* 0.101
lgini.y6 -0.149 0.101
lgini.y6 -0.246* 0.101
lgini.y7 -0.194 0.101

26
Appendix VIII: Estimated fixed effect model (using state as fixed effect) between change in income inequality and age on mortality across states in India from 1971-2003
PARAMETER ESTIMATE S. ERROR(U)
Cons 2.319* 0.428
Time 1985 -0.018* 0.001
Female -0.140* 0.005
Urban -0.336* 0.005
y5-9 -2.386* 0.344
y10-14 -1.756* 0.345
y15-19 -1.5* 0.343
y20-24 -1.255* 0.341
y25-29 -0.440 0.342
y30-34 -0.576 0.342
y35-39 -0.884* 0.341
y40-44 -0.754* 0.342
y45-49 -0.013 0.342
y50-54 -0.071 0.341
y55-59 0.891* 0.341
y60-64 0.682* 0.341
y65-69 1.4* 0.341
y70+ 2.049* 0.341
Lgini 0.297* 0.086
lgini.y5 -0.025 0.102
lgini.y1 -0.365* 0.103
lgini.y1 -0.330* 0.102
lgini.y2 -0.314* 0.101
lgini.y2 -0.533* 0.102
lgini.y3 -0.456* 0.102
lgini.y3 -0.297* 0.101
lgini.y4 -0.247* 0.102
lgini.y4 -0.356* 0.102
lgini.y5 -0.199 0.101
lgini.y5 -0.359* 0.101
lgini.y6 -0.149 0.101
lgini.y6 -0.246* 0.101
lgini.y7 -0.194 0.101
Assam 0.172* 0.031
Bihar 0.112* 0.035
Gujarat -0.006 0.025
Haryana -0.218* 0.026
Karnataka -0.120* 0.022
Kerala -0.554* 0.023
Maharashtra -0.158* 0.027
Madhya Pradesh 0.113* 0.022
Orissa 0.137* 0.024

27
Appendix IX: Trends in Per-capita Income (PCI) and Income Inequality (Gini coefficient) in different States of India
States/Year Gini coefficients PCI
1970-71 1983-84 1990-91 1999-2000
1970 1980 1990 2000
ANDHRA PRADESH 28.09364 30.23848 30.01559 25.74976 4163 4604 6873 10195
ASSAM NA NA 21.20512 21.4992 4534 4636 5574 5943
BIHAR 27.657 26.60933 20.97428 21.9517 -- 3539 4474 3798
GUJRATH 27.32074 26.4412 23.21736 25.35425 5919 6455 8788 12489
HARYANA NA 28.10036 NA 25.305 6228 7514 11125 13848
KARNATAKA 29.25638 31.57375 29.53555 26.8184 4612 4943 6631 11939
KERALA 34.13295 34.90914 30.25416 28.2985 5444 5592 6851 10714
MAHARASTRA 28.50948 30.72213 31.53555 29.4888 5810 7102 10159 7195
MADHYA PRADESH 31.8411 29.74826 31.09391 25.99357 4768 5084 6350 7195
ORISSA 28.85117 27.43316 26.25226 24.9485 4093 4085 4300 5562
PUNJAB NA 29.0088 NA 25.5654 6671 8442 11776 15071
RAJASTHAN 33.2989 33.83024 29.01362 22.58336 4119 4254 6760 8175
TAMIL NADU 31.07609 34.0609 29.59166 33.11934 5238 5266 7864 12994
UTTAR PRADESH 29.87202 29.93409 26.90478 26.20396 3870 4133 5342 5575
WEST BENGAL 27.9535 30.31079 29.17027 25.31512 -- 4717 5991 9796

187 Groundwater for Agriculural Use in India:An Institutional PerspectiveSarbani Mukherjee
188 Comparative Study of Traditional Vs.Scientific Shrimp Farming in West Bengal:A Technical Efficiency AnalysisPoulomi Bhattacharya
189 Urban and Service Delivery in Bangalore:Public-Private PartnershipSmitha K C and Sangita S N
190 Social Capital in Forest GovernanceRegimesSangita S N
191 Agriculture in Karnataka: A HistoricalView After the Fall of SerirangapatanaR S Deshpande and Malini Tantri
192 Personality Traits and AdministratorsAnitha V
193 Sustainability of Indian Agriculture:Towards an Assessment V M Rao
194 Emerging Development Issues of GreaterBangaloreG S Sastry
195 Rural Infrastructure Development Fund:Need for a Track ChangeMeenakshi Rajeev
196 Emerging Ground Water Crisis in UrbanAreas — A Case Study of Ward No. 39,Bangalore CityK V Raju, S Manasi and N Latha
197 In Pursuit of India’s Export earningadvantage: An Assessment of IT-EnabledServices IndustryMeenakshi Rajeev
198 A Patriarchal Link to HIV/AIDS in IndiaSkylab Sahu
199 Collective Action and Property Rights:Some Critical Issues in the Context ofKarnatakaK G Gayathri Devi
200 State, Society and Inclusive Governance:Community Forests in Andhra Pradesh,Karnataka and OrissaS N Sangita
201 Urban Poverty and Links with theEnvironment: An ExplorationK G Gayathri Devi
202 Groundwater Over-exploitation, Costsand Adoption Measures in the CentralDry Zone of KarnatakaAnantha K H and K V Raju
203 Changing Child Population: Growth,Trends and Levels in KarnatakaC M Lakshmana
204 Awareness About HIV/AIDS AmongKarnataka Woment: An Analysis of RCH2002-04 DataK S Umamani
205 The Microfinance Promise in FinancialInclusion and Welfare of the Poor:Evidence from Karnataka, IndiaNaveen K Shetty
206 Structure of Central Himalayan ForestsUnder Different Management Regimes:An Empirical StudySunil Nautiyal
207 Poverty and Natural Resources:Measuring the Links (Some Issues in theContext of Karnataka)K G Gayathri Devi
208 Federalism and Decentralisation in India:Andhra Pradesh and Tamil NaduV Anil Kumar
209 Capital, ‘Development’ and CanalIrrigation in Colonial IndiaPatric McGinn
210 Gender, Ecology and Development inKarnataka: Situation and Tasks AheadK G Gayathri Devi
211 Greenhouse Gases Emission andPotential Corbon Sequestration: A CaseStudy of Semi-Arid Area in South IndiaLenin Babu and K V Raju
212 Emerging Trends in Managing DrinkingWater – Case Studies of Coastal Villagesin KarnatakaManasi S, Latha N and K V Raju
213 Spatio-Temporal Analysis of ForestsUnder Different Management RegimesUsing Landsat and IRS ImagesSunil Nautiyal
214 Traditional Knowledge System(Medicine): A Case Study of ArakalgudTaluk, Karnataka, IndiaB K Harish, K Lenin Babu
215 Tribal Movement in Orissa: A StruggleAgainst Modernisation?Patibandla Srikant
216 Technological Progress, Scale Effect andTotal Factor Productivity Growth inIndian Cement Industry: PanelEstimation of Stochastic ProductionFrontierSabuj Kumar Mandal and S Madheswaran
217 Fisheries and Livelihoods in TungabhadraBasin, India: Current Status and FuturePossibilitiesManasi S, Latha N and K V Raju
218 Economics of Shrimp Farming: AComparative Study of Traditional Vs.Scientific Shrimp Farming in West BengalPoulomi Bhattacharya
219 Output and Input Efficiency ofManufacturing Firms in India: A Case ofthe Indian Pharmaceutical SectorMainak Mazumdar, Meenakshi Rajeevand Subhash C Ray
220 Panchayats, Hariyali Guidelines andWatershed Development: Lessons fromKarnatakaN Sivanna
221 Gender Differential in Disease Burden: It’sRole to Explain Gender Differential inMortalityBiplab Dhak and Mutharayappa R
Recent Working Papers

222 Sanitation Strategies in Karnataka: AReviewVeerashekharappa and Shashanka Bhide
223 A Comparative Analysis of Efficiency andproductivity of the Indian PharmaceuticalFirms: A Malmquist-Meta-FrontierApproachMainak Mazumdar and Meenakshi Rajeev
224 Local Governance, Patronage andAccountability in Karnataka and KeralaAnand Inbanathan
225 Downward Dividends of GroundwaterIrrigation in Hard Rock Areas of SouthernPeninsular IndiaAnantha K H
226 Trends and Patterns of Private Investmentin IndiaJagannath Mallick
227 Environmental Efficiency of the IndianCement Industry: An Interstate AnalysisSabuj Kumar Mandal and S Madheswaran
228 Determinants of Living Arrangements ofElderly in Orissa: An AnalysisAkshaya Kumar Panigrahi
229 Fiscal Empowerment of Panchayats inIndia: Real or Rhetoric?M Devendra Babu
230 Energy Use Efficiency in Indian CementIndustry: Application of DataEnvelopment Analysis and DirectionalDistance FunctionSabuj Kumar Mandaland S Madheswaran
231 Ethnicity, Caste and Community in aDisaster Prone Area of OrissaPriya Gupta
232 Koodankulam Anti-Nuclear Movement: AStruggle for Alternative Development?Patibandla Srikant
233 History Revisited: Narratives on Politicaland Constitutional Changes in Kashmir(1947-1990)Khalid Wasim Hassan
234 Spatial Heterogeneity and PopulationMobility in IndiaJajati Keshari Parida and S Madheswaran
235 Measuring Energy Use Efficiency inPresence of Undesirable Output: AnApplication of Data Envelopment Analysis(DEA) to Indian Cement IndustrySabuj Kumar Mandaland S Madheswaran
236 Increasing trend in Caesarean SectionDelivery in India: Role of Medicalisationof Maternal HealthSancheetha Ghosh
237 Migration of Kashmiri Pandits:Kashmiriyat Challenged?Khalid Wasim Hassan
238 Causality Between Energy Consumptionand Output Growth in Indian CementIndustry: An Application of Panel VectorError Correction ModelSabuj Kumar Mandal and S Madheswaran
239 Conflict Over Worship:A Study of the SriGuru Dattatreya Swami BababudhanDargah in South IndiaSudha Sitharaman
240 Living Arrangement Preferences of theElderly in Orissa, IndiaAkshaya Kumar Panigrahi
241 Challenges and Pospects in theMeasurement of Trade in ServicesKrushna Mohan Pattanaik
242 Dalit Movement and Emergence of theBahujan Samaj Party in Uttar Pradesh:Politics and PrioritiesShyam Singh
243 Globalisation, DemocraticDecentralisation and Social Secutiry inIndiaS N Sangita and T K Jyothi
244 Health, Labour Supply and Wages: ACritical Review of LiteratureAmrita Ghatak
245 Is Young Maternal Age A Risk Factor forSexually Transmitted Diseases andAnemia in India? An Examination inUrban and Rural AreasKavitha N
246 Patterns and Determinants of FemaleMigration in India: Insights from CensusSandhya Rani Mahapatro
247 Spillover Effects from MultinationalCorporations: Evidence From West BengalEngineering IndustriesRajdeep Singha and K Gayithri
248 Effectiveness of SEZs Over EPZs Struc-ture: The Performance at AggregateLevel
Malini L Tantri
Price: Rs. 30.00 ISBN 978-81-7791-105-3
INSTITUTE FOR SOCIAL AND ECONOMIC CHANGEDr V K R V Rao Road, Nagarabhavi P.O., Bangalore - 560 072, India
Phone: 0091-80-23215468, 23215519, 23215592; Fax: 0091-80-23217008E-mail: [email protected]; Web: www.isec.ac.in