india: the impact of mobile phones
TRANSCRIPT

8/6/2019 India: The Impact of Mobile Phones
http://slidepdf.com/reader/full/india-the-impact-of-mobile-phones 1/68
Moving the debate forward The Policy Paper Series • Number 9 • January 2009
India:The Impact
of MobilePhones

8/6/2019 India: The Impact of Mobile Phones
http://slidepdf.com/reader/full/india-the-impact-of-mobile-phones 2/68
b
India: The Impact of Mobile Phones Moving the debate forward • The Policy Paper Series • Number 9 • January 2009
This study on India is part of the Vodafone Public Policy series launched in 2004.
Our aim is to provide a platform for leading experts to write on issues that are importantto us at Vodafone and which may help policy makers as they strive to provide a regulatoryenvironment which stimulates growth and economic development.
We hope you nd this report informative.
Vittorio Colao, Chief Executive, Vodafone Group
ForewordIn this report, we have returned to the important subject of the economic impact of telecommunications on emerging markets by undertaking research looking in detail atIndia. As in the other reports in the Vodafone Public Policy Series, we have asked leadingresearchers to conduct the analysis. We are delighted that a team led by Dr. Rajat Kathuriaof the Indian Council for Research on International Economic Relations (ICRIER), one of India’s foremost independent research institutes, was able to direct and conduct this work.
The opinions expressed in this document are not ours but those of independent expertswhose views we respect even if we do not always agree with them. We believe that theyhave important things to say that should be of interest to anyone concerned with goodpublic policy, and the policies towards economic and social development of India andother emerging markets.
Neil Gough, Director, Public Policy-Emerging Markets, Vodafone Group
Diane Coyle, OBE, Enlightenment Economics and chair of Vodafone SIM Panel
Welcome
This paper can be seen online at www.vodafone.com/publicpolicyseries
Published by Vodafone Group Plc
Copyright © 2009 Vodafone Group Plc
ISBN 978-0-9552578-5-8
Contents Page
Welcome 00 – Vittorio Colao, Chief Executive, Vodafone Group
Foreword 00– Neil Gough and Diane Coyle
A policy overview 01– Dr. Rajiv Kumar
An econometric analysis of the impact of mobile 05– Professor Rajat Kathuria, Dr. Mahesh Uppal and Mamta
The impact of mobiles on agricultural productivity 21 – Sanjay Gandhi, Dr. Surabhi Mittal and Gaurav Tripathi
A survey of usage of mobile in poor urban areas 34– Professor Ankur Sarin and Professor Rekha Jain
The impact of mobiles in the SME sector 51– Dr. Mahesh Uppal and Professor Rajat Kathuria
8/6/2019 India: The Impact of Mobile Phones
http://slidepdf.com/reader/full/india-the-impact-of-mobile-phones 3/68
1
India: The Impact of Mobile PhonesMoving the debate forward • The Policy Paper Series • Number 9 • January 2009
A policy overviewAmidst the spreading gloom of the economic downturnfollowing the global nancial meltdown, the Indian telecomsector provides the proverbial silver lining. The growth inmobile connections has continued at around 10 milliona month and investment prospects remain bullish. It isimportant at this stage to ensure that investor condence ismaintained by further improving the regulatory environment
and ensuring that the policy regime promotes growth. In thiscontext, I am delighted that a team of eminent researchers ledby Professor Rajat Kathuria of ICRIER undertook to examine thesocial and economic impacts of mobile telephony in India, witha view to improving the knowledge content for policy-makingin this important sector. The project team has analysed whatwe consider to be an extremely important and relevant topictoday. This project is a good example of ICRIER’s strategy of carrying out research which generates analytical and empiricalresults relevant for generating analytical and empirical inputspushing forward the reform agenda and for contributing topolicy formulation in the country.
We believe the analysis and results reported here to be veryimportant for the Indian economy. There is a growing bodyof careful empirical economic research which providesa compelling picture of the positive impact of mobiletelecommunications on economic growth in developingeconomies. During the past few years this researchhas built a detailed understanding of the importanceof telecommunications infrastructure to economicdevelopment. The unique contribution of this report, whichmakes it of special interest to policy makers, is that it looks atimpacts within a single country, potentially delivering muchmore robust conclusions.
India has more diversity within its borders than any othercountry – it comprises 1.1 billion people, living and workingin very different circumstances and geographies. Yet it hasa national government and policy environment that setscritical economic policies (including telecommunications)
across the whole country. We have taken advantage of thatdiversity and the availability of state level data to investigateeconomic impacts within India across states, economicsectors and population segments. Furthermore, because evenstate level data can mask great differences, we have looked atspecic economic sectors (agriculture and small and mediumenterprises) and segments of the population (urban slum
dwellers) to extend our understanding.
Encouragingly, the econometric analysis reported hereextends the conclusion that there is a causal relationshipwithin the same country between higher mobile penetration(mobile subscriptions/population) in a region and highereconomic growth. Indian states with high mobile penetration
can be expected to grow aster than those states with lower
mobile penetration rates , by 1.2% points a year more onaverage for every 10% increase in the penetration rate.This is an important result. The paper in this report byKathuria and Uppal suggests, furthermore, that there areimportant network effects which magnify the economic
impact of mobiles on development when the level of mobilepenetration exceeds a critical mass of around 25%. Thisnding underlines the urgency o increasing teledensity across allstates and especially in those numerous areas of India that are
yet to reach this threshold level.
The extraordinary recent macro-economic performance of the Indian economy has also raised the question of how thebenets of the 8–10% annual GDP growth rate can ‘trickledown’ to poorer socio-economic groups in the country. In thatcontext, the ICRIER researchers have also looked at threesegments of the population – the agriculture sector, theSmall and Medium Enterprise (SME) sector and urban slum
dwellers. In each case, the research demonstrates that accessto telecommunications is an important catalyst to realizingproductivity and efciency improvements and therebymaking it possible for the benets of economic growth tobe shared. Mobiles currently provide more than 300 million
Rajiv Kumar is the Director and Chief Executive of the Indian Council for Research on International
Economic Relations (ICRIER), and a member of the Telecom Regulatory Authority of India since
January 2007.
Director and Chief ExecutiveICRIERDr. Rajiv Kumar

8/6/2019 India: The Impact of Mobile Phones
http://slidepdf.com/reader/full/india-the-impact-of-mobile-phones 4/68
2
India: The Impact of Mobile Phones Moving the debate forward • The Policy Paper Series • Number 9 • January 2009
points of connectivity in India, through which information andopportunity ows. Citizens with access to telecommunicationscan tap into the benets of broad economic and social growthmuch more easily than those who are unconnected.
This result is all the more important for two reasons, oneinternal and one external. The rst is that India is at a stagein its development when there is a large-scale movement of the population from the countryside to the towns, posing newchallenges for both rural and urban economies. The second isthat the global economic environment has become harsher,and it will be essential to take advantages of all possibleopportunities to sustain growth.
Of course, access to mobile telecommunications is certainlynot the only thing that matters to economic growth. In thisregard, the research also highlights the vital importance o
complementary skills and other inrastructure . Unless these are inplace, the full potential of better access to telecommunicationswill not be realised. There is no benet in farmers knowing theprices that their produce could be sold for in dif ferent marketsif the roads are too poor for them to be able to transport thegoods to those other markets. The research in this report onthe uses and impacts of mobiles in agriculture by Gandhi,Mittal and Tripathi show that improving productivity and ruralincomes requires an array of enablers in the production cycle,which runs from planting to the nal sale of produce; accessto information is an important enabler.
Equally, the value in mobiles offering SMEs the potentialto introduce different business models which woulddeliver greater efciency is only fully realised when the
entrepreneurs and their workforce have the basic literacyskills to use the technology appropriately. The case studiesof entrepreneurs using mobiles presented in the paper hereby Uppal and Kathuria demonstrate not only the potential forimproved productivity, incomes and employment (especiallyfor sole traders and very small businesses seeking to improvetheir livelihoods), but also the barriers to the realisation of that potential – importantly, education and also (in ruralareas) teledensity. Telecommunications cannot be seen inisolation from other parts of the development process.
In the urban slums mobile use is associated with relativelyhigh earning households and educational levels. The survey
work of Sarin and Jain reported here also reveals thathigher household incomes are associated with thosefamilies who have enjoyed the benets of access to mobilecommunications for the longest period. Importantly,the research shows that those urban slum dwellers whohave access to mobiles inhabit an economic and socialenvironment where connectivity is the norm. The researchreveals the importance of these network effects, that is theincreased value of mobiles if many others in the social andeconomic milieu are also users of mobiles.
While some parts of India are clearly enjoying the benetsof new-found access to telecommunications, other parts
are still lagging behind. The recent extraordinary growth intelecommunication connections in India, which has topped10 million per month in 2008, has understandably grabbedthe headlines. However, other realities are being obscuredsuch as:
• Teledensity in India lags well behind most other countriesat similar stages of development (for example, China,Pakistan and Sri Lanka have achieved signicantly superiorpenetration rates of 77%, 60% and 61% respectively).
• There is enormous variation within India, and many of the less developed states have average penetration ratesof well below 20%, including Bihar, UP, Orissa, MadhyaPradesh and Assam.
• The level of access to the internet remains persistentlylow across the whole country (at about 5%) and in less-developed states is virtually non-existent – only 0.1% inBihar and 0.2% in Assam, for example.
In a world where other countries are increasinglytaking advantage of the opportunities being created bytelecommunications and other technologies, this is not acomfortable position for India. India needs to catch up with its
major trading competitors such as China, Korea and Indonesiaif it is truly to join the ranks of emerging economies that havemade or are making the transactions to middle income leveleconomies. Other countries enjoying higher penetrationtelephony and internet access are driving innovation andmore sustainable economic growth. India cannot challengeor match the innovation capability of its competitors or meetits indigenous demand for skills and knowledge content if only 5% of the population regularly uses the internet.
What then are the implications for Indian policy makers andtelecommunications operators? What are the key elements of a forward looking telecommunications policy agenda that will
keep India moving forward at the rate required?The report clearly shows how putting a mobile in the handsof an individual is unlikely by itself to improve that person’slivelihood. But when it is associated with education onagricultural techniques and tools, as well as with better roadsand storage, easier access to information through telephonycan become very valuable.
Perhaps it is obvious that there also needs to be investmentin other, complementary, infrastructure, but the impact of this interaction between telecommunications and otherinfrastructure in a developing country may have previouslybeen underestimated. Poverty ultimately needs to be
alleviated by improved labour productivity. Mobile telephonyhas an important role to play because it provides a means forthe exchange of information and learning, but it is only oneelement in the process of productivity growth. For example,60% of the working population in India is engaged inagriculture and the barriers to raising agricultural productivitygains go far beyond communications access.
Therefore, access to telecommunications needs to beseen as a foundation on which other initiatives can bebuilt. The debate on telecommunications needs to beexpanded from a debate only about access, to a broadervision of how individuals can leverage the capabilities of
telecommunications to grasp fully the opportunities of economic development.
The current Indian regulatory environment has stimulatedinvestment in the mobile sector to an unprecedented level.However, India is now sprinting at a time when other countries

8/6/2019 India: The Impact of Mobile Phones
http://slidepdf.com/reader/full/india-the-impact-of-mobile-phones 5/68
3
India: The Impact of Mobile PhonesMoving the debate forward • The Policy Paper Series • Number 9 • January 2009
are already well ahead. Those other countries, such as Chinaand South Korea are shifting their attention from simple tele-density targets to the priorities of ensuring access to high-speed data networks and broadband. It is likely that India’sgreatest policy challenges still lay ahead – increasing access
to telecommunications for underserved citizens and thenalso extending that access to the internet.
In this context, what are the implications for Indian policymakers and telecommunications operators? The researchpoints to three areas which seem to be of particularimportance. The rst is spectrum policy, the second areaconcerns fees and universal service and the third is aboutthe general investment environment.
Spectrum policy
Spectrum policy is the most obvious. India is burdened withsevere spectrum constraints. Minutes per subscriber are higherin India than in almost any other country and cities in Indiahave some of the most densely populated areas. Both thesefactors increase the need for spectrum, yet Indian operatorsare struggling with average spectrum allocations only a thirdof those available to most operators in other countries.
Spectrum is a fundamental driver of cost in mobile networks– the less spectrum, the more sites are needed, and the costof deployment rises accordingly. This scarcity situation in 2G(GSM) is likely to be replicated in 3G. It causes Indian operatorsto have to invest more capital building capacity in urban areas
in order to overcome spectrum constraints and preserveservice quality, but thereby limiting capital available for theexpansion of coverage into rural areas or to lower incomeurban agglomerations.
The civilian spectrum shortage is created by two factors: theoccupation of critical frequencies by the military and othergovernment departments; and a policy bias towards a largenumber of operators. Many commentators argue that feweroperators would achieve greater economies of scale, whilestill preserving the benets of vigorous competition.
All over the world and across industries, it is amplydemonstrated that a market structure with relatively
few players but robust regulatory oversight can be morecompetitive than one populated by a large number of smallplayers. In fact market fragmentation has the disadvantageof none of the players having enough capacity and resourcesfor innovation and delivering greater value to the customer.There is also the danger of a single large rm emerging as avirtual monopoly in such markets, and drawing monopolyrents. The government would have to weigh these factorsagainst its apparent objectives of maximising resources.
A government initiative whereby additional spectrum ismade available to the industry has yet to deliver results.As a consequence, the Indian telecommunications industry
is being starved of spectrum and the private sector is beingdrained of capital.
The losers from this spectrum constraint are thepeople who are consequently being denied access to
telecommunications services. They are losing out becauselicensees are diverting investments to maintain quality of service in urban areas. A comprehensive review o the overall
national beneft o current policy on spectrum allocation is urgently
required . Are there more efcient alternatives for the military
and public sector which would free spectrum for private usewhile not adversely affecting the military’s ability to protectIndia’s national interests? This should include an estimate of the cost to the nation of the spectrum that is currently beingused by the military. Greater transparency in this regard wouldbe most desirable.
The most serious problem facing India surrounds dataservices. India’s current position, by international standards,is lagging, and we cannot afford any complacency. The rest of the world is increasingly concerned about increasing accessto high speed data rather than voice connectivity. High-speeddata services and the internet are seen as a critical capability
that will drive future global competitiveness in technologyand services.
For India, and the rest of the developing world, data serviceswill be delivered by wireless broadband access rather than xedline copper or bre networks. But the vision in India is likely tobe limited by the reality of insufcient spectrum availability.The rst 3G spectrum auction scheduled for January 2009 is tobe welcomed but the incremental capacity for each operator ismost likely to be consumed by voice capacity as a result of thedeciencies of 2G spectrum allocation. The delivery of world-class data services requires very large blocks of spectrum. A major strategic plan or data services is urgently required to plan
the availability o sufcient spectrum.
Licence, spectrum fees and USO
Policy-makers must address the access decit of thedisadvantaged segments of the population. This does notsimply equate to the rural population. The paper in this studyby Sarin and Jain reminds us how marginalized the urban poorare but also demonstrates how access to telecommunicationscan offer a route to increased incomes. Tackling the access
gap must include the urban poor as well as those living in rural
communities . There has been a natural focus in the past onthe rural poor given the proportion of India’s populationwhich lives in rural areas, but India is becoming increasinglyand dramatically urbanized. At present over 320 millionpeople live in urban areas, and the number is expected toincrease to a staggering 575 million by 2020.
The private sector has done much to invest intelecommunications provision for both the urban andrural poor, and private operators continue to invest at ever-increasing levels. However, in the context of the economicdividend from the sector, some aspects of policy mustbe re-evaluated.
The industry labours under ongoing heavy spectrum charges and licence ees that are likely to be counter-productive to the
broader national interests . Yet the prevailing policy mood seemsto be to increase them, not reduce them. Even the most minoroperator in a less economically developed state will pay a

8/6/2019 India: The Impact of Mobile Phones
http://slidepdf.com/reader/full/india-the-impact-of-mobile-phones 6/68
4
India: The Impact of Mobile Phones Moving the debate forward • The Policy Paper Series • Number 9 • January 2009
minimum of 8% of revenue (before any cost deductions) inrespect of combined licence and spectrum fees. How can anylicence fee or spectrum fee be justied in areas like these?India needs to nd ways to accelerate investment in areaswhich have low teledensity; licence and spectrum fees levied
from users drain resources from operators in those areas andinhibit investment. The recent policy towards reductions inlicence fees when a licensee attains coverage targets is awelcome move in the right direction. However, the overallpolicy towards fees should be re-evaluated in the context of these economic results.
There are signicant questions too about the nature of theuniversal service policy. The coffers of India’s USO fundcontinue to grow. The funds are being collected, but theyare not being spent for their intended purpose of increasingteledensity. This problem is not unique to India but at themoment the USO is effectively an additional tax on the sector,
driving up prices of services and effectively dis-enfranchisingthose the policy is targeted towards. The hard question hasto be asked about the most effective means of increasingaccess – is it though the intensication of competition andthe reduction of prices through the removal of governmentimposed levies and taxes, or through the (unspent) universalservice fund?
In the absence of plans for productive use of the accumulatedfund, the USO charges should be reviewed . A reduction wouldimprove investment incentives and increase the resources thesector has available for investment, at a time when funding forinvestment is difcult.
Overall investment environment
At the highest strategic level, Indian policy makers alsoneed to assess whether their approach is consistent with thepotential economic value of the sector.
India has chosen a policy of creating a highly competitive,fragmented industry, which has delivered extraordinarily lowprices and high minutes of use per subscriber. However, theselow prices are only currently enjoyed by about 25–30% of theIndian population – the rest do not have a mobile phone. The
real question is to whether the same model will eventuallydeliver universal access to telecommunications and mostimportantly access to high-quality data services.
India needs to set out a stable policy ramework to attract
long-term investment in telecommunications . That requires astable licensing structure, consistent policy decisions and apredictable framework for regulatory intervention. The historyof Indian telecommunications has been one of frequent shiftsin policies, regulations and taxation that create uncertaintyfor investors.
A stable and attractive policy approach is especiallyimportant in the context of the current global credit
crunch and with capital so scarce. Policies are neededwhich will attract long-term investors who will make thecommitments and investments required to create world-classtelecommunications networks and services that will deliverglobal competitiveness for all the citizens of India.
Therefore this is the time for the government to be assessingfundamental policy issues that impact sector investment,such as foreign direct investment caps, licence extensionterms, spectrum availability and allocations, and criteriafor mergers and acquisitions. All these issues affect the
economics of additional capital investment. There is a needto determine what sort of industry India needs and set thepolicy framework accordingly.
Conclusion
We believe that these ndings from a detailed study of onecountry carry lessons not only for India but also for othercountries facing similar challenges in terms of agriculturalproductivity, small business growth, and rural and urbanpoverty. Weaknesses in education and other physicalinfrastructure need to be tackled to maximise the potentialproductivity and growth benets of access to mobilecommunications in many other countries apart from India.A systematic, integrated set of development policies isrequired to address this.
We hope that this report will provide some impetus toa policy debate about the priorities and the needs of the telecommunications sector. Its recent track record inIndia is sufciently promising that there might not seemto be a pressing need to refresh the policy environmentfor telecommunications, or to develop a wider vision forthe sector. But we believe that such a policy shift will berequired to sustain the progress towards the truly world-class telecommunications services that India and its citizensdeserve. This will underpin India’s competitiveness in thevolatile global marketplace, and ensure that the benets of growth are more widely shared as the economy develops.The debate needs to start today.
We hope that the following papers will not only stimulate thatdebate but that they will also be of interest to you.

8/6/2019 India: The Impact of Mobile Phones
http://slidepdf.com/reader/full/india-the-impact-of-mobile-phones 7/68
5
India: The Impact of Mobile PhonesMoving the debate forward • The Policy Paper Series • Number 9 • January 2009
Director,Com First (India) Private Ltd
Dr. Mahesh Uppal
Professor of Economics, ICRIERProfessor, IMI
Prof. Rajat Kathuria
Rajat Kathuria is Professor of Economics at ICRIER, and is also a professor at the International
Management Institute (IMI), New Delhi.
Researcher,ICRIER
Mamta
An econometric analysis of the
impact of mobile
Dr. Mahesh Uppal is the Director of Com First (India) Private Ltd, a consultancy specializing in policy,
regulation, and strategy.
Mamta is a researcher at the Indian Council for Research on International Economic Relations (ICRIER).
1. Summary
During the past two decades, India has moved away from itsformer ‘command and control’ policies to become a market-based economy. This process started in the mid-1980s andgathered substantial momentum at the beginning of the1990s. The process of reform has continued in this decadewith a further opening of the economy and the creation of regulatory institutions to oversee the march towards fully
competitive markets. As a result of the liberalisation, GDPper capita has been rising by 7% annually, a rate that leads toits doubling in a decade. This contrasts with annual growthof GDP per capita of just 1% in the three decades from 1950to 1980. Rapid growth turned India into the third largest
economy in the world in 2006 (after the United States andChina and just ahead of Japan when measured at purchasingpower parities), accounting for nearly 7% of world GDP.1
Although India’s growth rate has been among the highest inthe world, it remains a low income country. With a per capitaincome of US$950 in 2007, India ranks 122nd.2 As well asa low average income, there are substantial disparities ineconomic performance between states. The average percapita Gross State Domestic Product (GSDP) of Delhi, the
richest state, is ve times that of Bihar, the poorest. There is abroad consensus amongst policy makers that growth needsto become more inclusive by increasing the prosperity of poorer states, whose economies have expanded at a slowerpace than those of the richer states in the past decade.
8/6/2019 India: The Impact of Mobile Phones
http://slidepdf.com/reader/full/india-the-impact-of-mobile-phones 8/68
6
India: The Impact of Mobile Phones Moving the debate forward • The Policy Paper Series • Number 9 • January 2009
Previous research suggests that the differences in economicperformance across states are associated with the extentto which they have introduced market-oriented reforms,alongside measures to improve infrastructure, educationand basic services.3
The physical infrastructure (or lack thereof) is widelyacknowledged to be one of the crucial impediments toachieving higher and more inclusive economic growth inIndia. The lack of adequate infrastructure is particularly acutein rural areas, home to 70% of India’s population and the52% of the work force that is primarily engaged in agricultureand related activities.4 Agriculture in India accounts for 18%of national income, implying extremely low agriculturalproductivity. The resulting migration of excess farm labour tourban areas in search of jobs is straining urban infrastructureand increasing the population living in city slums. India’surban population is expected to double over the next two
decades, to 575 million.Any strategy that seeks to address the problem of inclusivegrowth will therefore have to contend with these harshrealities of low productivity in the countryside, a massivemovement of people to the cities, and extensive poverty inboth rural and urban areas. Past policies have not had muchsuccess, often being defeated by the magnitude of theproblem as well as weaknesses in implementation. But themessage is clear. Rural productivity needs to increase bothas part of the development process and to raise incomes formillions of Indians who live below the poverty line, in thecountryside and the cities.
A sustainably faster rate of growth can only be achieved byimproving productivity, but underinvestment in infrastructureis an important barrier. India plans roughly to doubleinvestment in infrastructure, to $500 billion over the nex tve years, or about 8% of GDP each year. The PlanningCommission maintains that the growth target of the EleventhPlan (2007–12) is achievable only if the ‘infrastructure decitcan be overcome and adequate investment takes place tosupport higher growth’.5 The government expects privateinvestors to contribute two-fths of the total investmentin infrastructure, not only to expand capacity but also toimprove the quality of service.
The telecommunications sector has had the most successin attracting private investment and is often held up as anexample for other infrastructure sectors.6 Two familiar reasonsfor this status are worth repeating. First, India’s teledensity hasshown extraordinary growth since private participation in thesector was introduced, rising from less than 1% in 1998 to over30% today. Secondly, several research studies have foundthat the telecommunications infrastructure is one of thesignicant factors in economic growth, alongside others suchas overall investment, education, energy and transportationnetworks.7
The change in India’s telecoms landscape has been dramatic.
In 1994, the year the National Telecom Policy was drafted,fewer than 1 in 100 Indians owned a phone. Public sectorexecutives working for the incumbent monopoly were highlypopular, given their ability to short circuit the endless waitingtime for the privilege of owning a telephone. Less than 15
years on, teledensity has increased to more than 32% andsubscriber numbers are growing at a rate of about 10 millionper month. Ownership of a phone is no longer a functionof who you know, but rather conforms to the conventionalforces of demand and supply. Waiting lists are down and
voice calls in India are amongst the cheapest in the world.The Government’s target of 250 million phones by the end of 2007 was reached, quite unexpectedly, ahead of schedule.8
One of our research aims was to extend earlier studies byanalysing the growth impact of telecoms in India. While thetelecoms-growth link has been explored across differentcountries and within a particular country over time, fewstudies have assessed the relationship at the sub-nationallevel. India’s Federal structure, with some states suchas Uttar Pradesh, Maharashtra, and Madhya Pradeshlarger in geographical area and population than mostEuropean countries, readily lends itself to such analysis.9
Moreover, balanced regional development has always beenan objective in India’s plans and therefore studying the impactof telecoms liberalisation across states will provide valuableinsights for this policy aim.
The rapid spread of mobile telephony in India is the mostobvious manifestation of the benets of telecom sectorliberalisation. Fixed line penetration is in fact showing signsof decline, and future growth will come from mobile.Given that about 10 million wireless subscribers are beingadded every month, the impact of telecoms on state-levelgrowth rates can be explored through the impact of mobiletelephony. This chapter accordingly attempts to answer
three questions:• What is the impact of mobile penetration on state
growth rates;
• Do less-developed states show a greater impact of mobile penetration; and
• What are the links through which mobile telephonyaffects growth and what are the constraints, if any,which limit its impact?
The rst two questions are addressed by employing ‘top-down’ econometric analysis using state level economicindicators, while the third question is addressed using
‘bottom-up’ evidence from surveys and other information.The next section briey reviews the existing literature onthe impact of telecoms on growth. Section 3 assesses India’sregulatory and competitive landscape for telecoms andcompares Indian mobile telephony indicators with those of some other countries. The descriptive statistics presented inthis section underscore the phenomenal progress made bymobile in India, both when judged against past performanceand when compared with other countries, but also show thatIndia still lags other countries in important ways. Disparities inmobile penetration across states and between urban and ruralareas are also examined. Section 4 presents and analyses
the results of the econometric model and also draws uponsurvey based evidence to demonstrate the positive impactof mobiles on growth, the rst such estimates to conrm thegrowth dividend of mobile for Indian states. A nal sectionoffers some conclusions.

8/6/2019 India: The Impact of Mobile Phones
http://slidepdf.com/reader/full/india-the-impact-of-mobile-phones 9/68
7
India: The Impact of Mobile PhonesMoving the debate forward • The Policy Paper Series • Number 9 • January 2009
Our key conclusions are:
• Indian states with higher mobile penetration can beexpected to grow faster, with a growth rate 1.2% pointshigher for every 10% increase in the mobile penetrationrate. If Bihar were to enjoy the same mobile penetration
rate as Punjab then, according to our results, it would enjoya growth rate that is about 4% higher.
• There is evidence of a critical mass, around a penetrationrate of 25%, beyond which the impact of mobile on growthis amplied by network effects. This means there is animportant threshold for policy makers.
• As is borne out in many other studies, including this one,it is the level of telecoms penetration (not the growth)which contributes to economic growth. Past policyreforms have achieved rapid growth in mobile but Indialags well behind most other countries at similar stages of
development. There is enormous variation between states,between urban and rural areas, and between poor andrich households in the cities. Further reforms are neededto bridge these gaps. Effective competition, efcientspectrum management, and a market-based policyframework are the key regulatory levers.
2. The impact of telecommunicationson economic growth
A number of earlier studies have examined the relationshipbetween telecommunication services and economic growth.There is a positive relationship between GDP per capita andtelephone density indicators. The data for all countries, fromthe least developed to the most industrialised, generallyfall within a small band along a straight line. A similarrepresentation for mobile teledensity and per capita GSDPacross Indian states (Figure 1) also reveals data tightlyclustered around the line of best t.
Figure 1: Mobile density and Per Capita Income across
Indian states
0
10
20
30
40
50
60
70
80
100
90
0 10000 20000 30000 40000 50000 60000 70000 80000Per Capita GSDP
M o b i l e p e n e t r a t i o n
Source: TRAI, CSO; data for March 2008. Mobile density is subscriptions per
100 population
Noting the high correlation between telecoms penetrationand growth, early research focussed on the potential rolethat telecommunications could play in accelerating growthand economic development. For instance, Hardy (1980)used data from 15 developed and 45 developing countries
for the years 1960 through 1973 and estimated a singleequation in which GDP per capita is modelled to depend uponlagged GDP per capita, lagged teledensity and the numberof radios. The results indicated that the greater availabilityof telephones has a signicant positive effect on GDP, while
radios did not. The differential impact of telephones versusradios was interpreted as evidence of the network effects of telecommunications. A similar study by Norton (1992) usingdata from a sample of 47 countries for the post-WW II perioduntil 1977, found a positive and signicant impact on growth,interpreted as being due to the fact that telecommunicationswere reducing transaction costs, increasing the efciency of investment markets and consequently leading to increasedinvestment levels. In both these studies, the biggest effect of telecommunications on growth was found in less developedeconomies. The implication of this result is that we mightexpect the relationship between mobile teledensity and
economic activity across Indian States to vary with the levelof development of each state’s economy.
One aw in these early estimates of the large growthimpact of telecommunications is that causality will clearlyalso run from income level to telephone penetration, andignoring this two-way impact exaggerated the results.A series of papers by Cronin et al. conrmed the existenceof a two-way relationship. Cronin et al (1991) found thattelecommunications investment enhances economicactivity and growth, while economic growth stimulatesdemand for telecommunications infrastructure investment.In another study at the State and sub-State level for theUnited States, Cronin et al (1993a) established that thesame relationships operated at sub-national level. Cronin et
al (1993b) then analysed data between 1958 and 1990 forthe United States, taking account of the two-way causality,and found that that contributions to aggregate and sectoralproductivity growth rates from telecoms investment areboth quantiable and substantial. Röller and Waverman[RW] (1996) were the rst to quantify the impact of telecomson growth after controlling for the effect of rising GDP ondemand for telecoms. They addressed this ‘endogeneity’problem explicitly by estimating a four-equation structuraleconomic model with an aggregate production function,telecommunications demand and supply functions and a
telecommunications production function using data from 35countries for the years 1970 through 1990, controlling alsofor country-specic characteristics that might be correlatedwith a given country’s telecom infrastructure. They alsospecically allow for non-linear effects, whereby at a certaincritical mass network effects amplify the impact of telecomson growth. This landmark paper found that in their sampleof both developed and developing countries a 10% increasein the penetration rate leads to a 2.8% increase in GDP and,what’s more, that a minimum threshold of telecom density(of around 24%) must be achieved in order to generategrowth. In a later paper (2001) they found that about one-
third of the economic growth for a cross-section of 21OECD countries over the same period could be attributed togrowth in telecommunications infrastructure. In this study,the threshold teledensity or critical mass was about 30%.Torero, Choudhary and Bedi (2002) extended the RW model
8/6/2019 India: The Impact of Mobile Phones
http://slidepdf.com/reader/full/india-the-impact-of-mobile-phones 10/68
8
India: The Impact of Mobile Phones Moving the debate forward • The Policy Paper Series • Number 9 • January 2009
to include mobile phones. They used data from 113 countriesover a 20-year period and also found a positive causal linkfrom telecommunications to GDP. The effect in their workappears to be non-linear and is particularly pronounced forcountries with a telecom penetration rate in the range 5–15%.
The threshold at which the growth dividend of telecom beginsto take effect varies across these studies. It does suggest,however, that increases in teledensity might not immediatelygenerate higher growth effects in states with a particularlypoorly developed telecoms infrastructure. The telecomsdensity in certain states is so low that marginal improvementsmight not generate the desired growth effects – not untilthe critical threshold for network effects is reached.Thus, laggard states may require substantial investments intelecommunications infrastructure before they can benetfrom the growth-generating effects of these technologies.This is supported by our results, as described below.
It has recently become quite fashionable to adapt theRW framework for developing countries and particularlyfor estimating the growth dividend of mobile phones.Torero, Choudhary and Bedi (2002), Sridhar and Sridhar(2004) and Waverman, Meschi and Fuss (2005) are someexamples. The growth dividend of investment in (xed)telecommunications infrastructure in developed economiesis now fairly well established. Since the growth of mobilephones in developing economies such as India, China,Brazil and others has been sensational; it raises the obviousquestion whether mobile phones in developing economiesare playing the same role that xed telephony played in the
richer economies in the 1970s and 1980s. Mobile phones areoften the only means of communication for a large number of people. For example, the most recent numbers available forIndia reveal that while xed line penetration is roughly 3.5 perhundred and declining, the corresponding number for mobilestands at 28 per hundred, and growing. Because mobilessubstitute for xed lines in developing economies, theirgrowth impact should be stronger in these than in developedeconomies, where mobiles complement the extensive xedservice. Waverman, Meschi and Fuss (2005) used data on 92high and low income countries from 1980 to 2003, and foundthat mobile telephony has a positive and signicant impact on
economic growth, and indeed this impact could be twice aslarge in developing as compared to developed countries.
Mobile phones can perform in underserved areas and regionswhat xed lines did in many other regions and countries overtwo decades ago: widen markets, create better informationows, lower transactions costs and substitute for costly (intime and money) physical transport. The value of a mobilephone can be particularly high because other forms of communication such as postal systems, roads and xed linenetworks are often poor in developing countries. At the sametime, in many developing countries growth has been low dueto a host of other reasons – poor governance, lack of capital,low skill levels and many others. It is unlikely that increasedmobile penetration by itself will be able to alleviate theseother constraints on growth. This caution is supported by casestudies. For instance Jensen (2007) states that ‘improvementsin roads have lowered the cost of land transport, leading
to more arbitrage by wholesalers on land... In other cases,poor quality roads may limit the ability of improvementsin information (i.e. mobile penetration) to enhance marketperformance since arbitrage remains prohibitively expensive’.The economic impact of mobile is likely to be strongest when
the absence or inadequacy of existing telecommunicationsfacilities acts as a barrier or bottleneck to private economicactivities, but also when enough other infrastructure exists topermit the effective use of telecommunications.
There is no study that systematically investigates thegrowth impact of mobile phones at the sub-national level.India is ideally placed for such an analysis. First, there is widevariation in economic performance across Indian states.Secondly, mobile licences in India have been awarded forgeographic areas which are, to a large extent, contiguouswith state boundaries.10 The correspondence between amobile telecom licence and a state boundary allows us to
adapt the RW (2001) framework for Indian states. And nally,the explosive growth of mobile in India, especially in the lastve years, should allow us to identify any impact on economicperformance across states. We attempt to quantify thatimpact and explain differences, if any, across states.
Three caveats must be mentioned, however. First, mobile inIndia is relatively young (the rst licensee rolled out servicesin 1995, and it was not until 2003 that the service becameavailable in all Indian states) so there is little real trend as yet.Secondly, since mobiles are so new, there has been extremelyrapid growth in mobile penetration starting from zero.There could thus be a tendency to overestimate the impact
of mobile on growth, despite controlling for other growth-generating variables such as capital, labour and education.Thirdly, data at the state level for investment comparable todata at the national level obtainable from national accountsare simply not available. Likewise, employment data at thestate level are not available. These data have been compiledfrom different sources described in the Annex. The dataproblems lead us to be cautious in our interpretation of theestimates reported here. Nevertheless, the results showthat the growth dividend of mobile is substantial and policymakers will be well advised to harness its full potential.
3. Indian telecommunicationsacross states
The critical element in the development of the Indiantelecommunications infrastructure has been the explosivegrowth of mobile, which has beneted from a compellingtechnology and an increasingly liberal policy environment.It is a common sight to observe street vendors, rickshawpullers and newspaper hawkers routinely talking on theirmobile phones in cities. From being viewed as a luxury whenit was rst introduced, the mobile service is now usedeveryday by millions of Indians.

8/6/2019 India: The Impact of Mobile Phones
http://slidepdf.com/reader/full/india-the-impact-of-mobile-phones 11/68
9
India: The Impact of Mobile PhonesMoving the debate forward • The Policy Paper Series • Number 9 • January 2009
Figure 2: Growth of xed and mobile subscriptions
Source: TRAI (NB a log growth rate which is constant implies an actual growth rate which is accelerating.)
Table 2: Internet and broadband targets in millions of subscribers (actual numbers in parentheses)
Year Internet Subscribers Broadband Subscribers
2005 6 (5.55) 3 (0.18)
2007 18 (42.5, including 32 9 (3.1)mobile internet users)
2010 40 20
Source: TRAI broadband recommendations
Two notable implications follow from these developments.One, hitherto unserved or under-served people will for themost part gain access through wireless technologies, whetherthe services are described as xed, mobile, voice, or data.And secondly, given the importance of wireless to modern ICTinfrastructures, it thus becomes crucial for the government
to play a more effective role in managing scarce frequenciesfor optimal use. This is a point to which we return in theconcluding section.
The triggers for the massive increase in mobile penetrationhave been many. Factors such as price, income and tasteshave all been important determinants (this is explored moreformally in the economic model set out below). There hasbeen an enormous decline in prices. The effective price perminute for an outgoing mobile call has dropped from Rs.15.30 in 1998 to Rs. 0.68 today. This 98% decline would bemuch higher in real terms. Another measure, the AverageRevenue per User (ARPU), is around Rs. 250 per month,
compared to about Rs. 1550 in 1998.14 At the currentexchange rate that is roughly US$5 per month, representingabout 5% of an average Indian’s monthly income. The launchof micro pre-paid and handsets priced at less than Rs.1,000(US$20) have further reduced entry cost to the subscriberand extended demand. In addition, consumer nancingof handsets, facilitated by declining interest rates, allowsspreading the cost over manageable monthly instalments.Micro pre-paid allows recharge options for as low as Rs. 10(US$0.20). Other features of pre-paid reducing subscribers’entry costs include ‘lifetime validity’, full value recharge andspecial ‘on-net’ or ‘within network’ tariffs.15 Not surprisingly
therefore, 95% of new subscriptions are pre-paid, lifting thetotal number of subscribers on pre-paid from 76% in 2007 toabout 85% at the end of 2008. Income (measured by GDP percapita) has doubled since 1998, also contributing to demand.
The compound annual growth rate (CAGR) for mobilebetween 1999 and 2008 in India has been 83% while that of xed lines has been just 7.5%, and the growth of mobile is
accelerating, while the growth in the number of xed lines istrending down. In fact, in the last three years, the number of xed lines has decreased. In March 2008, mobiles accountedfor 86% of all telephones in India, and by October 2008 thisnumber had increased to 90%. Contrast this with the situationin 1999 when mobile constituted just 5% of all telephones.There are now over 325 million mobile users compared toabout 38 million xed users. Figure 2 shows the dramaticrise in the monthly addition to the mobile subscriber base.If the current trend continues, there will be over 540 millionsubscribers by the year 2010. This is truly remarkable,since no other ICT indicator comes close to mobile in
penetration level or rate of growth. Fixed line, Internetand broadband penetration in India remain very low at 3%,1% and 0.4%, respectively.
Table 1: All-India xed, mobile, internet and broadband
penetration rates
Mobile Fixed Internet Broadband
Density Density Density Density
27 3 1 0.4
Author’s calculation based on TRAI data; number per 100 population for March 2008
Particularly striking is the paltry broadband penetrationrate despite a low threshold speed for the gures: any
download speed above 256 kilobits per second (kbps) inIndia is classied as broadband, a level of service that wouldbe seen as inadequate in most countries.11 The number of subscriptions to broadband is woefully short of the targetset by DoT (See Table 2).12 The number of internet subscriberstoo would be signicantly below the policy target, were itnot for the rapid penetration of mobile internet. There areabout 32 million mobile subscribers accessing the internetthrough wireless networks today, compared to about11 million who access it through the xed network.India seriously lags behind on broadband. Even TRAI hasconceded that its future targets are unlikely to be achieved,unless critical issues inhibiting broadband expansion inurban as well as rural areas are addressed. These includeboth policy and regulatory constraints.13
Fixed line subscribers
Mobile subscribers
Log. (Rate of growth of fixed lines)
Log. (Rate of growth of mobiles)
0
50
22
1
27
2
32
4
38
6
41
13
4333
4757
46
150
41
165
39
261
39
315
100
150
200
250
300
350
M a r
9 9
M a r
0 0
M a r
0 1
M a r
0 2
M a r
0 3
M a r
0 4
M a r
0 5
M a r
0 6
M a r
0 7
M a r
0 8
S e p 0
8
S u b s c r i b e r s ( m
i l l i o n )
-40
-20
0
20
60
100
140
180
40
80
120
160
R a t e o f g r o w t h ( % )
8/6/2019 India: The Impact of Mobile Phones
http://slidepdf.com/reader/full/india-the-impact-of-mobile-phones 12/68
10
India: The Impact of Mobile Phones Moving the debate forward • The Policy Paper Series • Number 9 • January 2009
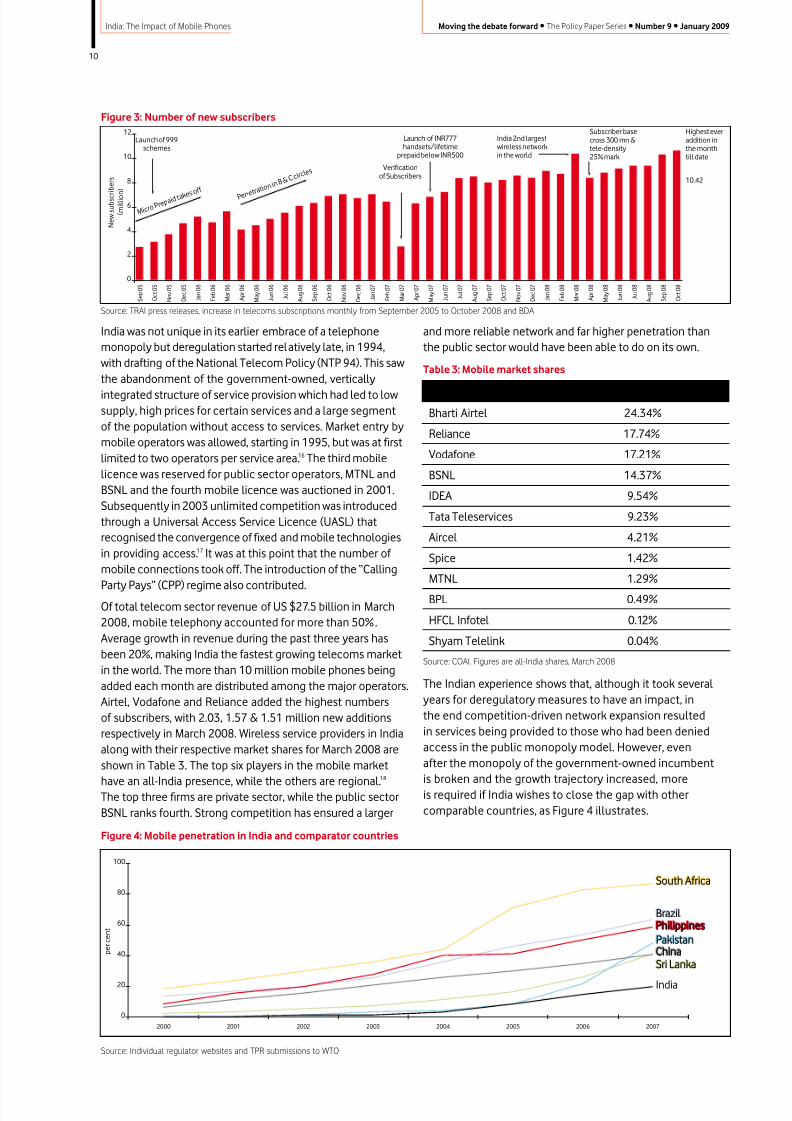
Figure 3: Number of new subscribers
Source: TRAI press releases, increase in telecoms subscriptions monthly from September 2005 to October 2008 and BDA
and more reliable network and far higher penetration thanthe public sector would have been able to do on its own.
Table 3: Mobile market shares
Service provider Market share, March 2008Bharti Airtel 24.34%
Reliance 17.74%
Vodafone 17.21%
BSNL 14.37%
IDEA 9.54%
Tata Teleservices 9.23%
Aircel 4.21%
Spice 1.42%
MTNL 1.29%
BPL 0.49%
HFCL Infotel 0.12%
Shyam Telelink 0.04%
Source: COAI. Figures are all-India shares, March 2008
The Indian experience shows that, although it took several years for deregulatory measures to have an impact, inthe end competition-driven network expansion resultedin services being provided to those who had been deniedaccess in the public monopoly model. However, evenafter the monopoly of the government-owned incumbentis broken and the growth trajectory increased, moreis required if India wishes to close the gap with othercomparable countries, as Figure 4 illustrates.
India was not unique in its earlier embrace of a telephonemonopoly but deregulation started relatively late, in 1994,with drafting of the National Telecom Policy (NTP 94). This sawthe abandonment of the government-owned, vertically
integrated structure of service provision which had led to lowsupply, high prices for certain services and a large segmentof the population without access to services. Market entry bymobile operators was allowed, starting in 1995, but was at rstlimited to two operators per service area.16 The third mobilelicence was reserved for public sector operators, MTNL andBSNL and the fourth mobile licence was auctioned in 2001.Subsequently in 2003 unlimited competition was introducedthrough a Universal Access Service Licence (UASL) thatrecognised the convergence of xed and mobile technologiesin providing access.17 It was at this point that the number of mobile connections took off. The introduction of the “Calling
Party Pays” (CPP) regime also contributed.Of total telecom sector revenue of US $27.5 billion in March2008, mobile telephony accounted for more than 50% .Average growth in revenue during the past three years hasbeen 20%, making India the fastest growing telecoms marketin the world. The more than 10 million mobile phones beingadded each month are distributed among the major operators.Airtel, Vodafone and Reliance added the highest numbersof subscribers, with 2.03, 1.57 & 1.51 million new additionsrespectively in March 2008. Wireless service providers in Indiaalong with their respective market shares for March 2008 areshown in Table 3. The top six players in the mobile market
have an all-India presence, while the others are regional.18
The top three rms are private sector, while the public sectorBSNL ranks fourth. Strong competition has ensured a larger
Figure 4: Mobile penetration in India and comparator countries
Source: Individual regulator websites and TPR submissions to WTO
0
2
4
6
8
10
12
N e w s u b s c r i b e r s
( m i l l i o
n )
S e p 0 5
O c t 0 5
N o v 0 5
D e c 0 5
J a n 0 6
F e b 0 6
M a r 0 6
A p r 0 6
M a y 0 6
J u n 0 6
J u l 0 6
A u g 0 6
S e p 0 6
O c t 0 6
N o v 0 6
D e c 0 6
J a n 0 7
F e b 0 7
M a r 0 7
A p r 0 7
M a y 0 7
J u n 0 7
J u l 0 7
A u g 0 7
S e p 0 7
O c t 0 7
N o v 0 7
D e c 0 7
F e b 0 8
M a r 0 8
A p r 0 8
M a y 0 8
J u n 0 8
J u l 0 8
A u g 0 8
S e p 0 8
O c t 0 8
J a n 0 8
Launch of 999schemes
M i c r o P r
e p a i d t a k e s o f f
Verificationof Subscribers
Launch of INR777handsets/lifetime
prepaid below INR500
India 2nd largestwireless networkin the world
Highest ever addition inthe monthtill date
10.42
Subscriber basecross 300 mn &tele-density25% mark
P e n e t r a t i
o n i n B &
C c i r c l e s
0
20
40
60
80
100
p e r c e n t
2000 2001 2002 2003 2004 2005 2006 2007
PakistanChinaSri Lanka
South Africa
BrazilPhilippines
India
PakistanChinaSri Lanka
South Africa
BrazilPhilippines

8/6/2019 India: The Impact of Mobile Phones
http://slidepdf.com/reader/full/india-the-impact-of-mobile-phones 13/68
11
India: The Impact of Mobile PhonesMoving the debate forward • The Policy Paper Series • Number 9 • January 2009
The low teledensity is mirrored in the low mobile coveragein India. Developing countries that are larger than India ingeographical area such as Brazil and China have achievedgreater mobile coverage while countries with lower percapita income such as Pakistan have realised higher mobile
teledensity.
Table 4: Mobile coverage in selected countries (% of populationcovered by mobile network, 2007)
% of population
Pakistan 90
Philippines 99
S Africa 99.79
Sri Lanka 95
China 97
Brazil 91
India 60.9
Source ITU, World Telecom Indicators 2008
On the other hand, mobile airtime rates in India havedropped to a level unmatched anywhere else in the world(see gure 5). At roughly 1 US cent a minute, the price is half of that prevailing in China and Pakistan. It is, therefore difcultto isolate a single factor responsible for India’s low relativeteledensity. One possibility is that it is due to India’s late start.By the time India launched mobile in 1995, China had 3.6million subscribers and Brazil 1.26 million. But this cannotbe the only reason as the gap continued to expand until
very recently.
Figure 5: Airtime rate per minute in selected countries
0
0.02
0.04
0.06
0.08
0.10
0.12
0.14
0.16
0.18
Brazil
0.17
S ou th A fr ic a P hi li pp in es C hi na P ak is ta n I nd ia
0.14
0.13
0.02 0.020.01
Source: Merrill Lynch 2Q08
Although net monthly additions in India are the highest inthe world today, the challenge is to ensure that growth doesnot slow, so that the gap between India and other countries isbridged sooner rather than later. This is all the more importantgiven the results of our econometric work reported below,which show a positive and signicant relationship betweenmobile density and income at the state level.
Mobile access differs between states and between urban andrural areas, but the gap is less than for other technologiesIt is often claimed that competition between the states toattract investment, especially since the 1991 economicreforms, has widened the already huge disparities betweenthem. The richer, better-administered and more literate stateshave proved more attractive than the poorer ones to investors.Between 1999 and 2008, when the Indian economy grew at
Table 5: Indicators for individual states
States Geographical Literacy Rate, Per Capita Mobile Fixed Internet BroadbandArea 2001 Income, 2008 Subscribers Subscribers Subscribers Subscribers
Sep-08 Sep-08 Dec-07 Jan-08
Sq. km. % Rs. Per 100 people Per 100 people Per 100 people Per 100 people
Delhi 1,483 81.67 67,661 111.60 14.56 8.23 2.5
Punjab 50,362 69.65 44,350 45.27 6.05 1.39 0.4
Tamil Nadu 130,058 73.45 36,344 45.10 5.55 1.58 0.72
Kerala 38,863 90.86 39,370 41.44 10.77 1.99 0.45
Himachal Pradesh 55,673 76.48 42,785 39.29 5.78 0.54 0.12
Maharashtra 307,713 76.88 43,681 37.46 5.56 0.35 0.08
Gujarat 196,024 69.14 41,826 35.31 3.82 0.97 0.36
Karnataka 191,791 66.64 31,001 34.12 4.87 1.3 0.62
Haryana 44,212 67.91 49,193 31.90 3.75 0.78 0.19
Andhra Pradesh 275,045 60.47 32,239 30.83 3.20 0.92 0.31
Rajasthan 342,239 60.41 20,787 26.96 2.63 0.61 0.11
WB and A&N 104,097 68.64 28,309 24.44 1.25 0.76 0.2
J&K 222,236 55.52 23,943 22.32 2.09 0.54 0.07
North East 176,645 63.25 26,789 18.80 2.48 2.87 0.04
UP 294,411 56.27 17,036 18.33 1.40 0.26 0.06
Madhya Pradesh 443,436 63.74 22,941 17.91 1.89 2.58 0.74Orissa 155,707 63.08 21,649 16.61 1.85 0.26 0.06
Assam 78,438 63.25 21,700 16.18 1.28 0.17 0.05
Bihar 173,877 47.00 14,113 12.21 1.11 0.1 0.03
Source: CSO, GoI, Census 2001, and TRAI

8/6/2019 India: The Impact of Mobile Phones
http://slidepdf.com/reader/full/india-the-impact-of-mobile-phones 14/68
12
India: The Impact of Mobile Phones Moving the debate forward • The Policy Paper Series • Number 9 • January 2009
an average annual rate of 7.3%, many richer states grew evenfaster: Gujarat at 8.8%, Haryana at 8.7% and Delhi at 7.4%.Among the poorest and most populous states, Bihar grew at5.1%, Uttar Pradesh at 4.4% and Madhya Pradesh at 3.5%.19
Mobile density to a large degree reects the differences
in per capita income across states. The simple correlationcoefcient between per capita income and mobile densityfor 2008 is 0.87 (where 1 would indicate perfect correlation).The corresponding correlation coefcients between percapita income and other ICT indicators across states are alsopositive but not as large; between xed and per capita incomeit is 0.8, for internet and per capita income it is 0.66 while forbroadband and per capita income it is 0.62.
Table 6: Coefcient of variation across states
Mobile Fixed Internet BroadbandDensity Density Density Density
0.66 0.77 1.04 1.16Source: Author’s estimates
Per capita income is however not the only determinant of penetration rate. A study published by Vodafone in 2005reported that certain African countries that started earlydown the path of telecom liberalisation – such as Gabon andMauritius – had achieved mobile penetration rates that weresurprisingly high given their social and economic indicators;and the converse is true for countries where there were noearly private licences issued, such as Algeria or Nigeria.20 Such variations also exist across Indian States. For exampleHaryana is the second richest state in India after Delhi, but
ranks ninth in overall mobile density, while Punjab and TamilNadu have similar penetration rates, although Punjab is 25%more prosperous. On the other hand, Kerala has a relativelylower per capita income, but a very high mobile penetrationrate. One explanation might be a large migrant populationfrom Kerala working in the Middle East wishing to stay intouch with family and friends. Metros, like Delhi and Mumbai,that had a distinct rst mover advantage, have achievedmuch higher mobile penetration rates. While the correlationof mobile density with share of service sector GSDP andliteracy rate is positive, (0.72 and 0.46 respectively), and withgeographical size it is negative (-0.46), the phenomenon of
the diffusion of mobile, however, cuts across many of theseobvious characteristics.
There are too many differences across and within Indianstates to identify robust explanations for differences inpenetration and usage. However competition-driven networkexpansion has certainly driven airtime charges and ARPUsto extremely low levels. By September 2008, the median
number of wireless operators in each state was 6, with onlyone state having as few as 4 and the rest 5 or more operators.The situation today is extraordinarily different compared tothe late nineties, when only a few states had access to mobileservices and the service itself was limited to the creamy layer.
As India’s economy grows rapidly, what will happen to theregional disparities? Mobile penetration is growing faster instates with the lowest current levels, showing a trend towardsconvergence. Internet and broadband penetration are evenlower than xed line penetration. The coefcient of variationacross states for the four ICT indicators – mobile, xed,internet and broadband – is the lowest for mobile, indicating
greater uniformity between states than other ICT indicators.This evidence from Indian states is consistent with evidence of convergence in mobile contrasting to divergence in access toother technologies elsewhere in the world.
Interestingly, both internet and broadband availability inIndia have until now been associated with Public SwitchedTelephone Network (PSTN) infrastructure consisting of copper loops to subscriber premises. The cost of providingaccess through this platform is greater than for wireless andis inuenced by the distance between the subscriber and thelocal exchange, the gauge of the phone wire, and the type of technology. Providing high speed broadband access through
wireless is cheaper, but depends on the availability and priceof spectrum and the extent of backhaul network essentialto provide services. Sufcient spectrum has not been madeavailable to provide high-speed internet access. Further, givenIndia’s landmass, the cost of creating backhaul infrastructurein rural areas is substantial and has been a signicant barrier.Consequently, the growth of internet access and dataservices has been severely sluggish. Broadband penetrationis negligible and far short of the policy target. At a policylevel, therefore, there is need to recognise the signicance of wireless in not only delivery of voice, but also data services.Growth in mobile telephony for voice services is importantbut not sufcient to be competitive on a global stage.
Figure 6: measures of mobile usage across states
Source: Authors calculation based on TRAI.data. Figures for March 2008.
ARPU
MOU
0
100
200
300
400
500
600
700
M O U ,
A R P U
STATES
A s s a m
C h e n n a i
G u j a r
a t
H a r y a
n a
K a r n a t k
a
K o l k a
t a
M a h a
r a s h t r a N .
E .
P u n j a b
T . N .
U . P . ( W )
A . P .
B i h a r
D e l h i H .
P . J &
K K e
r a l a
M . P .
M u m b a i
O r i s s
a
R a j a s
t h a n
U . P . ( E )
W . B .
& A &
N

8/6/2019 India: The Impact of Mobile Phones
http://slidepdf.com/reader/full/india-the-impact-of-mobile-phones 15/68
13
India: The Impact of Mobile PhonesMoving the debate forward • The Policy Paper Series • Number 9 • January 2009
At a policy level, there is a need to recognise the signicanceof wireless in not only delivery of voice, but also data services,and to stimulate the installation of backhaul infrastructure inrural areas through the use of appropriate incentives.
Table 7: A growth of mobile telephony in each state
1 J&K 268.35
2 North East 149.97
3 WB and A&N 141.43
4 Himachal Pradesh 121.46
5 Gujarat 113.21
6 Andhra Pradesh 110.92
7 Assam 110.80
8 Tamil Nadu 109.34
9 Bihar 108.60
10 Orissa 107.05
11 Madhya Pradesh 101.04
12 Haryana 100.75
13 Rajasthan 100.39
14 UP(E) 92.57
15 Punjab 92.26
16 Kerala 87.85
17 Maharashtra 85.01
18 Karnataka 81.6719 UP(W) 79.91
20 Chennai 64.60
21 Kolkata 62.35
22 Mumbai 55.06
23 Delhi 53.20
Source: Author estimates based on TRAI data; growth rate is annual average from
inception of mobile services in each state to March 2008.
Despite the massive increase in mobile density in the last three years, access in India is still skewed toward urban areas wheremuch of the industrial base is located. Urban teledensity isseven times higher than rural, which is home to 70% of India’spopulation. In other words, two thirds of the phones are in
urban areas where only 30% of the people live. The urban-ruralschism is in some ways starker than the gulf between states.It is therefore worth asking whether mobile technology couldbridge the rural-urban divide in the same way as it is has thepotential to reduce the divide between states.
There are reasons for optimism on this score, although thegap is still wide. The strong mobile growth in 2007–08 hasoccurred despite some signs of saturation in urban markets.This suggests there is higher potential future growth in non-urban markets. The latest gures show that at the all-Indialevel, urban teledensity (all attributable to mobile growth)increased by 34% while rural teledensity increased by 62%
from March 2007 to March 2008, the disparity reecting thelow rural base.
Until now, the focus of mobile operators’ attention hasbeen on the more lucrative urban markets. The high cost of infrastructure rollout in less dense rural areas and affordabilitybarriers for the rural population are likely reasons. But thereare signs this is changing. Infrastructure rollout in ruralareas is now eligible for subsidy (described in detail below)and all major providers have reported future plans forexpansion in rural India.22 In addition, according to DipankarGupta, the village is not what it used to be: 70% of India’spopulation, 56% of income, 64% of expenditure and 33% of
savings come from rural India.23 The rural share of spendingon popular consumer goods and durables ranges from 30%to 60%.24 When examining rural data it is important to bearin mind that a small percentage of a large number is a largenumber. One percent of rural India is 1.4 million households.25 Rural India therefore presents a huge opportunity but it alsorepresents a huge investment for telecoms operators. The keyfactor is the much lower population density of the rural areas– cost is driven largely by coverage (and area), while revenueopportunity is driven by population.
Rural
Urban
Total
0
10
20
30
40
50
60
70
M a r
9 7
M a r
9 6
M a r
9 8
M a r
9 9
M a r
0 0
M a r
0 1
M a r
0 2
M a r
0 3
M a r
0 4
M a r
0 5
M a r
0 6
M a r
0 7
M a r
0 8
S e p 0 8
0.31.34.0
0.3
1.6
4.8
0.4
1.9
5.8
0.5
2.3
6.9
0.7
2.9
8.2
0.9
3.6
10.4
1.2
4.3
12.2
1.5
5.1
14.3
1.6
7.0
20.7
1.7
9.0
26.9
1.9
12.7
39.5
5.5
18.2
48.2
8.4
26.2
61.3
9.4
28.2
66.0
0.31.34.0
0.3
1.6
4.8
0.4
1.9
5.8
0.5
2.3
6.9
0.7
2.9
8.2
0.9
3.6
10.4
1.2
4.3
12.2
1.5
5.1
14.3
1.6
7.0
20.7
1.7
9.0
26.9
1.9
12.7
39.5
5.5
18.2
48.2
8.4
26.2
61.3
9.4
28.2
66.0
Figure 7: Urban vs. Rural teledensity
Source: TRAI

8/6/2019 India: The Impact of Mobile Phones
http://slidepdf.com/reader/full/india-the-impact-of-mobile-phones 16/68
14
India: The Impact of Mobile Phones Moving the debate forward • The Policy Paper Series • Number 9 • January 2009
There is no doubt about the potential of mobile technology inaddressing the digital divide. Already there is more uniformityin mobile penetration between states and between rural andurban areas compared to any other ICT indicator. Helping theprocess along effectively will require appropriate regulation.
The change in policy to allow use of the Universal ServiceObligation Funds (USOF) to support roll out of wirelessinfrastructure in rural areas must be commended, eventhough delayed.26 In December 2006 the Indian Telegraph Actwas amended enabling USO support to all types of telegraphservices, including wireless, instead of just supporting xedservice roll out.27 Accordingly, wireless infrastructure is noweligible for support from the Universal Service ObligationFund (USOF). While this represents a vast improvement,disbursement of funds has been painfully slow. In fact theUSOF has accumulated funds faster than it has disbursedthem, raising serious questions about the size of the levy aswell as the speed of use.
Table 8: Universal Service Obligation Funds
(US $ Million)Year Opening Funds collected as Funds
Balance Universal Service disbursedFund Levy
2002–03 0 331 60
2003–04 271 429 40
2004– 05 659 692 263
2005– 06 1088 707 353
2006– 07 1441 842 300
2007–08 1984 1081 258
Total 4081 1274
Source: TRAI, Consultation Paper on ADC; gures are rounded to nearest million
About 69% of India’s 593,731 inhabited villages have access towireless infrastructure and with about US$2.8 billion currentlyavailable in USOF, the government ought to be able toextend this coverage.28 The government also has an ambitiousprogramme of covering 100,000 villages with internet kiosksunder the National eGovernance Programme (NeGP) to, inter
alia , provide citizen services. The initial impacts have notbeen encouraging, due to, among other reasons, low internetpenetration. With high bandwidth 3G services in the ofng,mobile could well prove to be the answer. Even marginalsubscribers with low budgets use data services and willneed more of those as 3G brings the power of multimediaand other broadband services. 3G will play an importantrole in catalyzing data and internet usage as well as in moreefcient use of spectrum. India is far behind the rest of theworld as far as data services are concerned. Policy in India hasfocused too much on voice, and it is important to move awayfrom regulation that revolves around voice calls in order tofacilitate the provision of internet and data services.
4. The impact of mobiles on economicgrowth in India
In this section we present the rst estimates of the impactof mobile penetration on economic growth across Indianstates. The data consist a panel of socio-economic variables
such as GSDP and its composition, population, investment,geographic area, and number of persons enrolled in tertiaryeducation for the period 2000–2008 for 19 states. Most of thedata are from ofcial government sources and are describedin detail in Annex 1. Also gathered are data on a number
of characteristics of telecommunication developments inindividual states such as xed and mobile phone penetration,average revenue per line and average revenue per minute forboth xed and mobile, minutes of use on mobile and internetand broadband penetration. Some of these data (e.g. internet,broadband, and revenue per minute) are available for only afew years and for only a few states. Annex 2 provides summarystatistics for the variables used in the study. As acknowledgedin the introduction, inadequate information is available in Indiaat the state level. The limited dataset means that we shouldapply some caution to the results, but the basic message isclear and consistent with other research – communicationsmatter signicantly for the growth of emerging markets.
The average growth rate for GSDP per capita for the period2000–2008 was about 7% and for mobile density it was 92%.Overall, GSDP is very strongly positively associated with thenumber of mobile phones (the correlation is 0.95). Given thishigh correlation, it is not surprising that a simple regressionof GDP on mobile phones nds substantial effects, explainingabout 90% of the variance in GSDP.
We therefore also estimated a structural model, slightlymodifying the framework developed by RW (2001), describedearlier. The model consists of three equations, an outputequation, a demand equation and a supply equation, allestimated together to take account of the two-way causation
between telecommunications and growth. The model ispresented in detail in Annex 3, along with detailedregression results.
The key results of the estimation are:
• The coefcient on mobile penetration is both positive andsignicant and implies that 10% increase in mobile penetration
delivers, on average a 1.2% point annual increase in output ,quite a high impact.
• The estimated demand equation shows mobile demand
is highly sensitive to price with a negative relationship and
positively correlated with increases in income . Both these linksare highly signicant. The own-price-elasticity of mobile
phones is minus 2.12, which implies that a 10% priceincrease would reduce demand by roughly 21%.
• On the other hand, fxed line prices do not seem to have any
impact on mobile demand . One possible explanation for thisis the much greater availability and utility of mobile phonesacross the states, thus rendering demand for mobilephones to be independent of xed line prices. Only in highmobile penetration states does the impact of xed lineprice on mobile demand conform to the idea that xedand mobile phones are substitutes i.e. the cross priceelasticity is positive and signicant, but the magnitudeis small.
• The positive and highly signicant income effect (theincome elasticity is 2.45) conrms that the causalrelationship between telecommunications and economicgrowth runs both ways. In addition, the estimate suggeststhat mobiles are ‘luxuries’ (in the technical sense) sincean income elasticity above one implies spending on mobile

8/6/2019 India: The Impact of Mobile Phones
http://slidepdf.com/reader/full/india-the-impact-of-mobile-phones 17/68
15
India: The Impact of Mobile PhonesMoving the debate forward • The Policy Paper Series • Number 9 • January 2009
rises more than in proportion with income . This conclusionhowever needs to be tempered with the fact that somepeople surveyed reported higher expenditure on telecomsthan on other items such as education and electricity,because they perceived it as a basic need and were willing
to incur higher costs. At one level, this conict reveals thedifculty of reconciling micro level survey evidence withmacro evidence; at another it suggests that there may becertain other exogenous factors driving demand for mobiletelephony, especially among people with low incomes.
• More than any other infrastructure, telecom networksare subject to ‘network effects’ meaning the growthimpact might be larger whenever a signicant thresholdnetwork size is achieved. This would imply that largergrowth effects might be seen in those states that haveachieved a critical mass in mobile infrastructure. We splitour sample into high and low penetration states based onthe median penetration level of 25% achieved in 2008 to
test whether such nonlinearities in telecommunicationsexist. The coefcient is higher for high penetration statescompared to low penetration states, (0.13 versus 0.1),implying that there is a threshold or critical mass , which hassignicant policy implications.
5. Conclusions
Despite the challenges, it is difcult not to have an acutesense that this is a momentous time for telecommunicationsin India. This sense is palpable in the sector as 10 years afterliberalisation, multinational companies which left India arereturning to bid for 3G licences. A unique combination of factors is now in play that could usher in a renewed period of growth for telecommunications and consequently enhancedeconomic activity in the individual states. Past policies havedelivered some important successes. However, India lags farbehind comparator countries in telecommunications access,and there is huge untapped potential in certain states and inrural areas, and increasingly in poor urban areas. There is anurgent need to bridge the gaps.
Differences in the diffusion of mobile telephony certainlyappear to explain some of the difference in growth ratesbetween states. States with higher penetration rates show
a greater growth dividend, and if this gap persists, then ourresults suggest that it will feed into signicant differencesin their growth rates in future, particularly as between thosestates which have and have not achieved a critical mass of telecoms penetration. If Bihar were to enjoy the same mobilepenetration rate as Punjab, then according to our econometricresults, it would enjoy a growth rate that is about 4% higher.
The policy implication of this result is unambiguous: therewould be a large payoff to increased teledensity in India’slagging states and regions.
The only realistic way to achieve this is thorough the wirelessplatform. Wireless has played a crucial role in extending
access in India and the present rates of growth and levelsof connectivity could not have been achieved without themassive expansion in mobile telephony. But their furtherdeployment needs to be complemented with an improvedregulatory and institutional environment. A poor policy andregulatory environment drives up the costs of supplying
services and inhibits investment. Rapid expansion of mobile,especially in low penetration states and regions, will makeit possible for these regions to make progress. Our analysissuggests the need for institutional and regulatory policiesthat facilitate effective competition and support a rapid
diffusion of mobile telephony.
Annex 1 Data denitions and sources
1. State Domestic Product (SDP): represents the valueof goods and services produced within the geographicalboundaries of the state in a particular year. The Directorateof Economics and Statistics prepares the estimates of Gross/Net State Domestic Product and Per Capita StateDomestic Product at current and constant prices any yearsas per guidelines of Central Statistical Commission (CSO)
covering all sectors of the economy. Besides estimatesof current year, previous year estimates are also revisedon the basis of latest availability of data. For our analysis,we use the new series of Gross State Domestic Product atcurrent prices released on 28th February 2008 adopting1999–2000 as the base year.
2. Capital: Project Investment excluding telecom investmentis taken as a proxy for capital. These are given in Rs. Crore(10 million) and available in State analysis service, CMIE.
• Project Investment: These are total outstandinginvestments projects which are under implementation,announced and proposed and have investment more
than one crore. Projects under implementation arethose on which civil work has started or have receivednecessary clearances, nalised or raised funds, etc.Announced and proposed projects are, primarily,intentions of the promoter/s.
• Telecom Investment: These are outstandinginvestments in telecommunication services projectswhich are under implementation, announced andproposed. Projects under implementation are those onwhich civil work has started or have received necessaryclearances, nalised or raised funds, etc. Announcedand proposed projects are, primarily, intentions of thepromoter/s.
3. Human Capital: This involves data relating to number of students enrolled in Post Senior Secondary education.This includes all graduation, masters and PhD students,including those enrolled in polytechnics. The data hasbeen gathered from various issues of Selected EducationStatistics published by Ministry of Human ResourceDevelopment, GOI.
4. Mobile Phone Penetration (per 100 persons): This dataincludes both GSM and CDMA subscribers. This is collectedfrom various published sources and TRAI.
5. Price of Mobile: This is proxied by Average Revenue per
User Of Mobile. This is collected from TRAI and COAI.6. Price of Fixed Line: This is proxied by average Revenue per
User Of Fixed Line. This is collected from TRAI and COAI.
7. Geographical Area (per sq. km): This is collected fromCensus of India, 2001.

8/6/2019 India: The Impact of Mobile Phones
http://slidepdf.com/reader/full/india-the-impact-of-mobile-phones 18/68
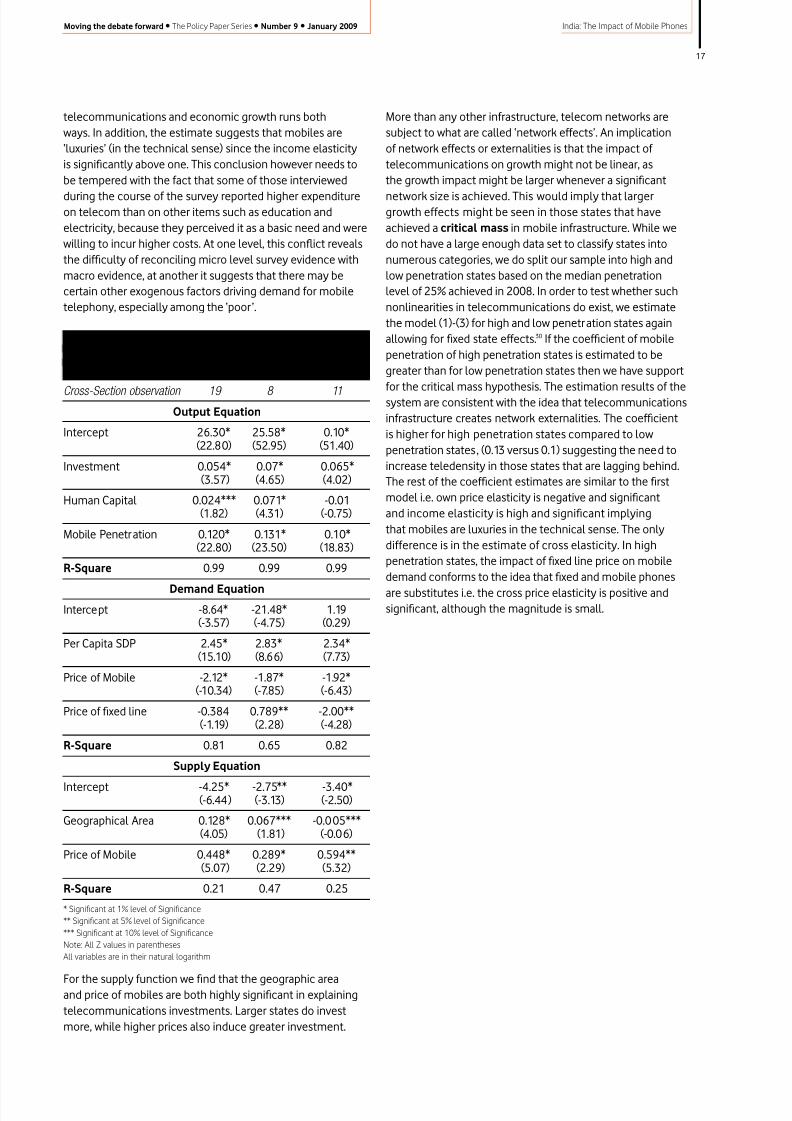
8/6/2019 India: The Impact of Mobile Phones
http://slidepdf.com/reader/full/india-the-impact-of-mobile-phones 19/68
17
India: The Impact of Mobile PhonesMoving the debate forward • The Policy Paper Series • Number 9 • January 2009
telecommunications and economic growth runs bothways. In addition, the estimate suggests that mobiles are‘luxuries’ (in the technical sense) since the income elasticityis signicantly above one. This conclusion however needs tobe tempered with the fact that some of those interviewed
during the course of the survey reported higher expenditureon telecom than on other items such as education andelectricity, because they perceived it as a basic need and werewilling to incur higher costs. At one level, this conict revealsthe difculty of reconciling micro level survey evidence withmacro evidence, at another it suggests that there may becertain other exogenous factors driving demand for mobiletelephony, especially among the ‘poor’.
All High LowStates Penetration Penetration
States States
Cross-Section observation 19 8 11Output Equation
Intercept 26.30* 25.58* 0.10*(22.80) (52.95) (51.40)
Investment 0.054* 0.07* 0.065*(3.57) (4.65) (4.02)
Human Capital 0.024*** 0.071* -0.01(1.82) (4.31) (-0.75)
Mobile Penetration 0.120* 0.131* 0.10*(22.80) (23.50) (18.83)
R-Square 0.99 0.99 0.99
Demand EquationIntercept -8.64* -21.48* 1.19
(-3.57) (-4.75) (0.29)
Per Capita SDP 2.45* 2.83* 2.34* (15.10) (8.66) (7.73)
Price of Mobile -2.12* -1.87* -1.92* (-10.34) (-7.85) (-6.43)
Price of xed line -0.384 0.789** -2.00** (-1.19) (2.28) (-4.28)
R-Square 0.81 0.65 0.82
Supply Equation
Intercept -4.25* -2.75** -3.40*(-6.44) (-3.13) (-2.50)
Geographical Area 0.128* 0.067*** -0.0 05*** (4.05) (1.81) (-0.06)
Price of Mobile 0.448* 0.289* 0.594**(5.07) (2.29) (5.32)
R-Square 0.21 0.47 0.25
* Signicant at 1% level of Signicance
** Signicant at 5% level of Signicance
*** Signicant at 10% level of Signicance
Note: All Z values in parentheses
All variables are in their natural logarithm
For the supply function we nd that the geographic areaand price of mobiles are both highly signicant in explainingtelecommunications investments. Larger states do investmore, while higher prices also induce greater investment.
More than any other infrastructure, telecom networks aresubject to what are called ‘network effects’. An implicationof network effects or externalities is that the impact of telecommunications on growth might not be linear, asthe growth impact might be larger whenever a signicant
network size is achieved. This would imply that largergrowth effects might be seen in those states that haveachieved a critical mass in mobile infrastructure. While wedo not have a large enough data set to classify states intonumerous categories, we do split our sample into high andlow penetration states based on the median penetrationlevel of 25% achieved in 2008. In order to test whether suchnonlinearities in telecommunications do exist, we estimatethe model (1)-(3) for high and low penetration states againallowing for xed state effects.30 If the coefcient of mobilepenetration of high penetration states is estimated to begreater than for low penetration states then we have support
for the critical mass hypothesis. The estimation results of thesystem are consistent with the idea that telecommunicationsinfrastructure creates network externalities. The coefcientis higher for high penetration states compared to lowpenetration states, (0.13 versus 0.1) suggesting the need toincrease teledensity in those states that are lagging behind.The rest of the coefcient estimates are similar to the rstmodel i.e. own price elasticity is negative and signicantand income elasticity is high and signicant implyingthat mobiles are luxuries in the technical sense. The onlydifference is in the estimate of cross elasticity. In highpenetration states, the impact of xed line price on mobiledemand conforms to the idea that xed and mobile phones
are substitutes i.e. the cross price elasticity is positive andsignicant, although the magnitude is small.

8/6/2019 India: The Impact of Mobile Phones
http://slidepdf.com/reader/full/india-the-impact-of-mobile-phones 20/68
18
India: The Impact of Mobile Phones Moving the debate forward • The Policy Paper Series • Number 9 • January 2009
Annex 4 State boundaries and mobile licences
State Licence for Mobile Licence for Fixed Line Classication
1 Andhra Pradesh Andhra Pradesh Andhra Pradesh A
2 Assam Assam Assam C
3 Bihar } Bihar including Jharkhand Bihar including Jharkhand C
4 Jharkhand
5 Delhi Delhi Delhi M
6 Gujarat Gujarat Gujarat A
7 Haryana Haryana Haryana B
8 Himachal Pradesh Himachal Pradesh Himachal Pradesh C
9 Jammu & Kashmir (J&K) J&K J&K C
10 Karnataka Karnataka Karnataka A
11 Kerala Kerala Kerala B12 Madhya Pradesh } Madhya Pradesh Madhya Pradesh B
including Chattisgarh including Chattisgarh13 Chattisgarh
14 Maharashtra } Maharashtra including Goa Maharashtra including Abut excluding Mumbai Mumbai & Goa
15 Goa
16 Tripura } North East I North East I C
17 Meghalaya
18 Mizoram
19 Arunachal Pradesh } North East II North East II C
20 Manipur
21 Nagaland
22 Orissa Orissa Orissa C
23 Punjab Punjab Punjab B
24 Rajasthan Rajasthan Rajasthan B
28 Tamil Nadu Tamil Nadu excluding chennai Tamil Nadu including Chennai A
30 Uttar Pradesh UP(E) UP(E) B
31 Uttaranchal UP(W) UP(W) B
32 West Bengal (WB) } WB and A&N including Sikkim WB and A&N including Sikkim Bbut excluding Kolkata but excluding Kolkata
33 Andaman & Nicobar
Islands (A&N)29 Sikkim
30 Chennai M
31 Kolkata M
32 Mumbai M
Note: North East I* refers to Meghalaya, Mizoram, and Tripura,
North East II refers to Arunachal Pradesh, Manipur, and Nagaland
The rst licences to be given for mobile were the four metros- Chennai, Delhi, Kolkata, and Mumbai; India’s four biggest cities in1995. Except Delhi, the others were carved out from states primarily for their revenue potential as a pilot exercise for the later statespecic licences which were awarded in 1996. For estimation we aggregate UP(E) and UP(W) and also combine North East I & II.

8/6/2019 India: The Impact of Mobile Phones
http://slidepdf.com/reader/full/india-the-impact-of-mobile-phones 21/68
19
India: The Impact of Mobile PhonesMoving the debate forward • The Policy Paper Series • Number 9 • January 2009
Annex 5 Operators by state
States Metro/Circle BSNL/MTNL Reliance Bharti Tata Vodafone Idea Aircel Spice BPL
Andhra Pradesh A 3 3 3 3 3 3
Gujarat A 3 3 3 3 3 3
Karnataka A 3 3 3 3 3 3
Maharashtra A 3 3 3 3 3 3
Tamil Nadu A 3 3 3 3 3 3
Haryana B 3 3 3 3 3 3
Kerala B 3 3 3 3 3 3
Madhya Pradesh B 3 3 3 3 3
Punjab B 3 3 3 3 3 3
Rajasthan B 3 3 3 3 3 3
UP(E) B 3 3 3 3 3 3 UP(W) B 3 3 3 3 3 3
West Bengal and B 3 3 3 3 3 3 Andaman & Nicobar
Assam C 3 3 3 3
Bihar C 3 3 3 3 3
Himachal Pradesh C 3 3 3 3 3 3
Jammu & Kashmir C 3 3 3 3
North East I * C 3 3 3 3
North East II * C 3 3 3 3
Orissa C 3 3 3 3 3
Chennai M 3 3 3 3 3 3
Delhi M 3 3 3 3 3 3
Kolkata M 3 3 3 3 3 3
Mumbai M 3 3 3 3 3 3
Source: Author tabulation based on TRAI data
References
Abraham Reuben (2007); Mobile Phones and Economic
Development: Evidence rom the Fishing Industry in India ,MIT Press; Volume 4, number 1, pg:5–17.
Abraham, James, Dean, R.David and Subramanian, A. (2007); Ringing in the next billion mobile consumers- A road
map or accelerating telecom growth in India . The BostonConsulting Group.
Ahluwalia, S. Montek (2002); State Level Perormance Under
Economic Reorms in India . published in EconomicPolicyReforms and the Indian Economy, edited by Anne O. Krueger,University of Chicago Press.
Buddecom Report (2007); Western Union Telecoms Markets
and Statistic .Cronin, F.J, Colleran, E.K, Herbert, P.L, Lewitzky, S (1993);“Telecommunications and growth”, Telecommunications Policy ,Vol. 17 pp.677–96.
Cronin, F.J, Parker, E.B, Colleran, E.K, Gold, M.A (1993);“Telecommunications Infrastructure Investment and EconomicDevelopment”, Telecommunications Policy 17: 415–430.
Cronin, F.J, Parker, E.B, Colleran, E.K, Gold, M.A (1991);“Telecommunications infrastructure and economic growth:an analysis of causality”, Telecommunications Policy , Vol. 15pp.529–34.
Desai, V. Ashok (2006); India’s Telecommunications Industry:
History, Analysis, Diagnosis , Sage Publication.
Economic Survey 2007–08; Government of India, Ministry of Finance, Economic Division.
Eggleston, Karen; Jensen, Robert and Zeckhauser,Richard (2002); Inormation and Communication Technologies,
Markets and Economic Development , in The Global Information
Technology Report 2001–02: Readiness for the NetworkedWorld, World Economic Forum, Geoffrey Kirkman OxfordUniversity Press, 62–74.
Global Wireless Matrix; Merill Lynch, Various Issues.

8/6/2019 India: The Impact of Mobile Phones
http://slidepdf.com/reader/full/india-the-impact-of-mobile-phones 22/68
20
India: The Impact of Mobile Phones Moving the debate forward • The Policy Paper Series • Number 9 • January 2009
International Telecommunication Union (2008);World Telecommunication/ICT Indicators , 12th Edition.
Kathuria, R. (2007); Telecom Liberalisation: A case study o
India’s Experience with Regulation , in, Regulation, Institutionsand the Law by Jaivir Singh(ed), Social Science Press.
Kathuria, R. (2004); Trade in Telecommunications Services
– Opportunities and Constraint , Working Paper 149, ICRIER,New Delhi.
Madden, G, Savage, S.J (1998); CEE telecommunications
investment and economic growth , Information Economics andPolicy, Vol. 10 pp.173–95.
OECD (2007), OECD Economic Surveys , India.
PricewaterhouseCoopers (PwC) (2007); India GSM Cellular
Benchmarking Study .
Roller, Lars-Hendrik and Waverman, Leonard (2001);
Telecommunications Inrastructure and Economic Development: A Simultaneous Approach ; The American Economic Review,Volume 91, 4th Issue, Pg; 909–923.
Roller, Lars-Hendrik and Waverman, Leonard (1996);Telecommunications Inrastructure and Economic Development:
A Simultaneous Approach ; Social Science Research CentreBerlin, Discussion paper.
Telecom Regulatory Authority of India (TRAI) (2007);Drat Recommendations on Growth o Broadband , 17th September.
Telecom Regulatory Authority of India (TRAI)(2004);Consultation Paper on Access Defcit Review , 23rd June.
Torero, Maximo; Chowdhury Shyamal and Bedi, S. Arjun(2002); Telecommunications Inrastructure and Economic Growth:
A Cross-Country Anaysis ; Information and CommunicationTechnology for Development and Poverty Reduction.Baltimore: Johns Hopkins University Press, 21–63.
The Vodafone Policy Paper Series (2005); Arica: The Impact
o Mobile Phones ; Volume no 2.
Wellenius, B (1997); Telecommunications Reform –How ToSucceed, Public Policy Journal , Private Infrastructure, Number130, The World Bank Group. Website: http://rru.worldbank.org/PublicPolicyJournal/Infrastructure-Telecom/.
World Bank, World Development Report 2008 .
Notes1 OECD Economic Surveys INDIA, 2007
2 World Development Report, 2008
3 Montek Ahluwalia , State Level Performance Under Economic Reforms in India
May 2000
4 Economic Survey, Government of India 2007–08
5 Planning Commission report on Infrastructure Development. The Eleventh Five
Year Plan period runs from 2007–08 to 2011–12 and envis ages an average rate of
growth of 8%.
6 Ibid
7 Madden and Savage, 1998 Datta and Agarwal 2004
8 See NTP 1999, unexpected because targets are usually optimistic and shortfalls
are acceptable
9 The Federal structure is made up of 28 states and 7 union territories*; Andaman
and Nicobar Islands*, Andhra Pradesh, Arunachal Pradesh, Assam, Bihar,
Chandigarh*, Chhattisgarh, Dadra and Nagar Haveli*, Daman and Diu*, Delhi*,
Goa, Gujarat, Haryana, Himachal Pradesh, Jammu and Kashmir, Jharkhand,
Karnataka, Kerala, Lakshadweep*, Madhya Pradesh, Maharashtra, Manipur,
Meghalaya, Mizoram, Nagaland, Orissa, Puducherry*, Punjab, Rajasthan, Sikkim,
Tamil Nadu, Tripura, Uttar Pradesh, Uttarakhand, West Bengal
10 For a summary on the classication of mobile licences and why these are slightlydifferent than xed, see Annex 4
11 Telecom Regulatory Authority o India,Drat Recommendations On Growth o Broadband
17th September, 2007
12 Internet and Broadband targets set by DoT in Broadband Policy 2004, Ibid
13 Ibid
14 Merrill Lynch 2Q04, Global Wireless Matrix
15 Lifetime has been claried by TRAI to be synonymous with the duration of the
service provider’s licence, which is valid for 20 years and renewable thereafter
for 10 years at a time.
16 Service Areas for mobile licensees are by and large contiguous with States,
except the four metros. See Annex I for details.
17 Recall that access networks for both these services are effectively wireless, with
even xed services now deploying WLL using CDMA technology. Describe UASL
18 See Annex for area of operation for wireless services
19 The Economist 11th December 200820 Africa: The Impact of Mobile Phones Number 2 March 2005
21 Western Union Telecoms Markets and Statistics, 2007, Buddecom Report
22 See for example Business India November 16, 2008, Sunil Mittal Interview to
Economic Times etc.
23 Dipankar Gupta “The Changing Villager” Seminar : 2008
24 Market Information Survey of Households, (Mish), National Council for Applied
Economic Research (NCAER) 2007
25 For example, Airtel has tied up with IFFCO, a fertiliser company, Tata Indicom has
tied up with Quallcom to provide real time information to the shing community
in South India, Reuters is providing relevant content to farmers in Maharashtra
and Punjab etc. The impact of these case studies is reported in the next chapter.
26 The government’s primary method of promoting universal access is through
USOF, funded by a 5% levy on service providers’ gross revenue
27 Universal Service was one of the main objectives of the New Telecom Policy
1999 which envisaged the provision of xed services to all at a reasonable price.
The USOF is nanced by a 5% levy on the adjusted gross revenue (AGR) of
service providers. It became operational in April 2002. The Fund is to be utilized
exclusively for meeting the Universal Service Obligation by providing access
to telegraph services to people in the rural and remote areas at affordable and
reasonable prices (www.dot.gov.in)
28 Measures to Improve Telecom Penetration in Rural India – The next 100 million
subscribers, TRAI December 2008
29 Torero, Choudhary and Bedi (2002). Op cit
30 This is also the method followed in Ibid

8/6/2019 India: The Impact of Mobile Phones
http://slidepdf.com/reader/full/india-the-impact-of-mobile-phones 23/68
21
India: The Impact of Mobile PhonesMoving the debate forward • The Policy Paper Series • Number 9 • January 2009
Senior Fellow,ICRIER
Dr. Surabhi Mittal
Consultant
Sanjay Gandhi
Dr. Surabhi Mittal is a Senior Fellow at ICRIER specialising in Agricultural Economics.
Researcher,ICRIER
Gaurav Tripathi
The impact of mobiles on
agricultural productivity
Sanjay Gandhi is a consultant with expertise in private sector development, and technology and
business strategy in emerging markets.
Gaurav Tripathi is a researcher at ICRIER
Introduction
The agricultural sector is critically important in anydeveloping economy and no less so in India, where itcontributes close to 20% of GDP and where 60% of thepopulation depends on agriculture either directly orindirectly. As India urbanizes, the urgent need to alleviatepoverty amongst both rural and urban populations makesit essential to catalyse agricultural productivity. The Indian
agricultural sector, however, despite periods of strong growthin the past, has more recently experienced low productivitygrowth. Serious challenges must be addressed in order toachieve faster productivity growth, including infrastructureconstraints, supply chain inefciencies and also signicant
problems in the diffusion of and access to information.Small‑scale producers, who make up the vast majority of Indian farmers, are often unable to access information thatcould increase yields and lead to better prices for their crops.
The increasing penetration of mobile networks andhandsets in India therefore presents an opportunity to makeuseful information more widely available. This could helpagricultural markets operate more efciently, and overcomesome of the other challenges faced by the sector. A key
backdrop to our investigation is the recent research byRobert Jensen examining the impact of mobile phone useby Kerala shermen.1 Jensen found that the introductionof mobile phones decreased price dispersion and wastageby spreading information which made the markets more

8/6/2019 India: The Impact of Mobile Phones
http://slidepdf.com/reader/full/india-the-impact-of-mobile-phones 24/68
22
India: The Impact of Mobile Phones Moving the debate forward • The Policy Paper Series • Number 9 • January 2009
efcient. Mobiles allow shermen, particularly the somewhatmore prosperous ones, to get timely price information anddecide the best place to land and sell their daily catch. A morerecent paper by Reuben Abraham also looking at Keralashermen found that widespread use of mobile phones
increased the efciency of markets by decreasing risk anduncertainty, although it noted that realizing the potentialefciencies depends on easy access to capital, especially atthe production end of the supply chain.2
It is timely to take a fresh look at the impact of mobileson agriculture in India because of the recent introductionof a number of mobile‑enabled information services.These services deliver a wide range of information tofarmers and shermen.
This paper is the rst to look at the impact of mobile phonesacross Indian agriculture, particularly for small farmers.The results are based on information collected through
focus groups and interviews carried out in Uttar Pradesh,Rajasthan, Tamil Nadu, Maharashtra and the NationalCapital Region of New Delhi.
The questions we sought to address include:
• Which types of agricultural information have the mostvalue for farmers and shermen?
• Are mobile phones in practice being used much foragricultural purposes, and if so how?
• Have mobile phones helped drive agricultural productivityimprovements for farmers and shermen, and if so how?
• What constraints are there on the potential for mobilephones to improve agricultural productivity?
The answers to these questions have important implicationsfor mobile operators, for information service providers,and for policy‑makers. We found evidence that mobilesare being used in ways which contribute to productivity.However, the key message of our research is that leveragingthe full potential of the greater access to information enabledby mobile – particularly for small producers – will requiresignicant improvements in the supporting infrastructure andalso in capacity‑building amongst farmers to enable them touse the information they access more effectively.
Background
There are an estimated 127.3 million ‘cultivators’ in India.3 The majority of them are farmers subsisting on small plotsof land less than 5 acres in size.4 Improving the livelihoods of small farmers has been a cornerstone of Indian governmentpolicy targets for many years and is imperative for social andeconomic development.
After experiencing strong growth for several decades untilthe 1980s, the agriculture sector has recently been growingmore slowly. Its growth over the past two years has averagedjust 2.5% compared with more than 8% for the economy asa whole. Agriculture’s share of GDP has declined from 48.7%
in 1950 to 18.7% in 2007. Indian states that experiencedaccelerating total factor productivity growth in crop sectorsduring the 1970s and 1980s have seen these growth ratesdecelerate since the early 1990s.5 Productivity growth hasbeen hampered by major challenges including decits in
physical inrastructure , in the availability of agricultural inputs such as seed, ertiliser and services in rural areas, and in access
to inormation . As Figure 1 indicates, all of these combineto create a communications and logistics environment forfarming, of which access to information is just one part.Weaknesses at any point in the chain will limit potentialgains elsewhere.
The weaknesses in the physical infrastructure includepoor road and other transportation infrastructure, limitedstorage facilities, limited irrigation and inadequate wholesalemarketplaces. A lack of refrigerated transport and coldstorage causes post‑harvest losses and inadequate market
access for perishable commodities like fruits and vegetables.Only 40% of farms in India are irrigated.6 Tube wells,which have become the principal source of irrigation, areoften ineffective due to frequent power shortages andunpredictable availability. Wholesale markets for agriculturalproduce often lack infrastructure for packing, grading andsorting, while middlemen dominate the supply chains and arethe major price setters. Small farmers are often unaware of how prices are set and end up taking whatever price they areoffered.7 When market price information is available to them,they are often unable to exploit the price disparities that existbetween major and minor markets due to their inability totransport their produce to different markets.
The availability of necessary products and services is variable in rural India. Small farmers often struggleto access high‑quality inputs such as advanced seedvarieties, or services such as soil testing or credit. The lackof efcient distribution networks and easy road accessmeans rural marketplaces are typically fragmented andgeographically isolated. There are therefore signicanthurdles to organisations seeking to supply these marketscost‑effectively. The lack of availability of key inputs such asfertiliser has also given rise to concerns about the distributionand sale of counterfeit products.8 Poor farmers lacking incollateral and credit history nd it difcult to obtain loansfrom formal nancial institutions, and many of them dependon informal channels such as moneylenders or agriculturaltraders.9 This often results in farmers paying exorbitantinterest rates and facing restrictions on where they can selltheir crop.
Finally, there is very uneven access to information.A national survey of farmers found that only 40% of farmerhouseholds accessed information about modern agriculturaltechniques and inputs.10 The most common informationsource used by households accessing information was “otherprogressive farmers” followed by input dealers. (See Table 1).

8/6/2019 India: The Impact of Mobile Phones
http://slidepdf.com/reader/full/india-the-impact-of-mobile-phones 25/68
23
India: The Impact of Mobile PhonesMoving the debate forward • The Policy Paper Series • Number 9 • January 2009
Table 1: Sources of agricultural information used by farmers
Source Per cent of Households
Other Progressive Farmers 16.7
Input Dealers 13.1Radio 13.0
Television 9.3
Newspaper 7.0
Extension Worker 5.7
Source: Situation assessment survey of farmers conducted by th e National Sample
Survey Organization (June, 2005), GoI
Note: The gures are proportions of the 40% of households that repor ted accessing
any information using each source.
The relevance of the information available is another issue.For example, farmers need accurate weather forecasts but
even when they are able to get forecasts, these will typicallybe state level forecasts which are too general to allow foreffective planning and action.
Our approach
Our research draws primarily on a series of eld investigationsconducted from August to November 2008 in the statesof Uttar Pradesh, Tamil Nadu, Maharashtra, Rajasthan andNew Delhi. These visits comprised a series of focus groupand individual interviews with farmers, shermen, labourers,traders, commission agents, non-prot organisations andbusinesses involved in the agriculture sector. The teamconducted 17 focus groups and 46 individual interviews.In total over 200 people were interviewed, of whom 160were small farmers with less than 6 acres of land.11
The farmers and shermen interviewed were mostly selectedby organisations providing information services to theircommunities. However, the interviews covered villages with
only standard mobile phone service as well as those wherean agricultural information service was available. In these, ourfocus groups and interviews covered both individuals who hadnot taken up the service as well as those who had signed up.
With the exception of the investigation to Delhi’s main fruitand vegetable market, the Azadpur mandi , all of the locationscovered were rural, with village populations ranging from3,000 to 10,000. All interviewees were over the age of 18,male and had varying degrees of formal education.12 A few of the small farmers had obtained university degrees, some of them post‑graduate degrees.
The farmers interviewed grew a wide variety of crops includingstaple and cash crops, perishables and non‑perishables, andcrops grown for household consumption. Almost all wereinvolved in growing multiple crops, as is normal, and wheatwas the most common crop grown amongst our interviewees.
Figure 1: Overview of communication needs in farming
1. Source: Situation assessment survey of farmers conducted by the national samples sur vey organisations (June 2005), Gol.
Middle men
Traders/
Commission agents
Intermediaries for access to markets: a
Cooperatives/Smallagro-processing etc.
Current sources for information on quality
inputs (only 40% do this)1
Other farmers: 16.7%
Radio, television,newspaper: 29.3%
Customised cropadvisory services
Input dealers/shop owners: 13.1%
Destination marketsfor products
Local Mandi
Agro-processing
Wholesale market
Access to credit: a
Marginal/small farmers
(<6 acres)
Bank/money lender
Medium farmers
(<20 acres)
Large farmers(>20 acres)
MarketPrices
Produce
Focus Group discussion in village Bighaiyan, Allahabad, Uttar Pradesh
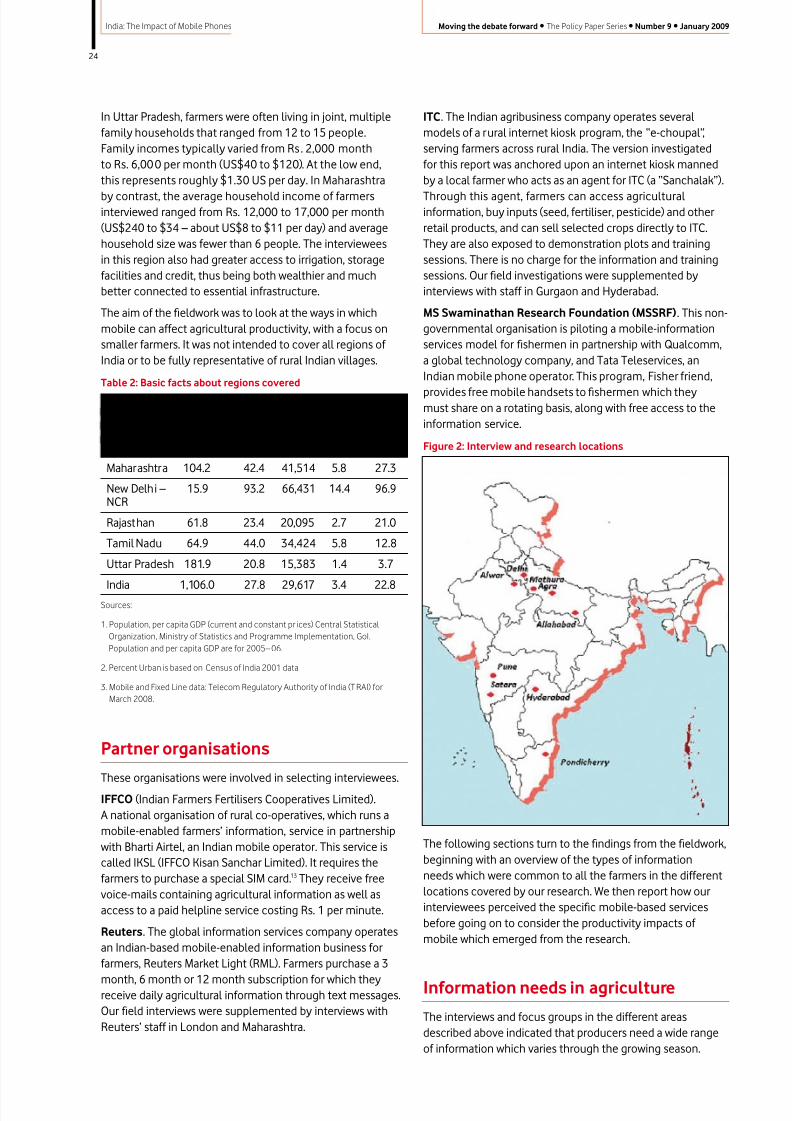
8/6/2019 India: The Impact of Mobile Phones
http://slidepdf.com/reader/full/india-the-impact-of-mobile-phones 26/68
24
India: The Impact of Mobile Phones Moving the debate forward • The Policy Paper Series • Number 9 • January 2009
In Uttar Pradesh, farmers were often living in joint, multiplefamily households that ranged from 12 to 15 people.Family incomes typically varied from Rs. 2,000 monthto Rs. 6,00 0 per month (US$40 to $120). At the low end,this represents roughly $1.30 US per day. In Maharashtra
by contrast, the average household income of farmersinterviewed ranged from Rs. 12,000 to 17,000 per month(US$240 to $34 – about US$8 to $11 per day) and averagehousehold size was fewer than 6 people. The intervieweesin this region also had greater access to irrigation, storagefacilities and credit, thus being both wealthier and muchbetter connected to essential infrastructure.
The aim of the eldwork was to look at the ways in whichmobile can affect agricultural productivity, with a focus onsmaller farmers. It was not intended to cover all regions of India or to be fully representative of rural Indian villages.
Table 2: Basic facts about regions covered
Region Population Percent Per Fixed MobileUrban Capita Lines Lines
GDP per 100 per 100(Rs.) people people
Maharashtra 104.2 42.4 41,514 5.8 27.3
New Delhi – 15.9 93.2 66,431 14.4 96.9NCR
Rajasthan 61.8 23.4 20,095 2.7 21.0
Tamil Nadu 64.9 44.0 34,424 5.8 12.8
Uttar Pradesh 181.9 20.8 15,383 1.4 3.7
India 1,106.0 27.8 29,617 3.4 22.8Sources:
1. Population, per capita GDP (current and constant pr ices) Central Statistical
Organization, Ministry of Statistics and Programme Implementation, GoI.
Population and per capita GDP are for 2005– 06.
2. Percent Urban is based on Census of India 2001 data
3. Mobile and Fixed Line data: Telecom Regulatory Authority of India (T RAI) for
March 2008.
Partner organisations
These organisations were involved in selecting interviewees.
IFFCO (Indian Farmers Fertilisers Cooperatives Limited).A national organisation of rural co‑operatives, which runs amobile‑enabled farmers’ information, service in partnershipwith Bharti Airtel, an Indian mobile operator. This service iscalled IKSL (IFFCO Kisan Sanchar Limited). It requires thefarmers to purchase a special SIM card.13 They receive freevoice‑mails containing agricultural information as well asaccess to a paid helpline service costing Rs. 1 per minute.
Reuters. The global information services company operatesan Indian‑based mobile‑enabled information business forfarmers, Reuters Market Light (RML). Farmers purchase a 3
month, 6 month or 12 month subscription for which theyreceive daily agricultural information through text messages.Our eld interviews were supplemented by interviews withReuters’ staff in London and Maharashtra.
ITC. The Indian agribusiness company operates severalmodels of a rural internet kiosk program, the “e‑choupal”,serving farmers across rural India. The version investigatedfor this report was anchored upon an internet kiosk mannedby a local farmer who acts as an agent for ITC (a “Sanchalak”).
Through this agent, farmers can access agriculturalinformation, buy inputs (seed, fertiliser, pesticide) and otherretail products, and can sell selected crops directly to ITC.They are also exposed to demonstration plots and trainingsessions. There is no charge for the information and trainingsessions. Our eld investigations were supplemented byinterviews with staff in Gurgaon and Hyderabad.
MS Swaminathan Research Foundation (MSSRF). This non‑governmental organisation is piloting a mobile‑informationservices model for shermen in partnership with Qualcomm,a global technology company, and Tata Teleservices, anIndian mobile phone operator. This program, Fisher friend,
provides free mobile handsets to shermen which theymust share on a rotating basis, along with free access to theinformation service.
Figure 2: Interview and research locations
The following sections turn to the ndings from the eldwork,beginning with an overview of the types of informationneeds which were common to all the farmers in the differentlocations covered by our research. We then report how ourinterviewees perceived the specic mobile-based servicesbefore going on to consider the productivity impacts of mobile which emerged from the research.
Information needs in agriculture
The interviews and focus groups in the different areasdescribed above indicated that producers need a wide rangeof information which varies through the growing season.

8/6/2019 India: The Impact of Mobile Phones
http://slidepdf.com/reader/full/india-the-impact-of-mobile-phones 27/68
25
India: The Impact of Mobile PhonesMoving the debate forward • The Policy Paper Series • Number 9 • January 2009
Nevertheless, the broad categories of information requiredwere common to all of them, irrespective of their locationand crops. These categories were: know-how which helps afarmer with fundamental information such as what to plantand which seed varieties to use; contextual inormation such as
weather, best practice for cultivation in the locality; and market inormation such as prices, demand indicators, and logisticalinformation. These are set out in Table 3 and Figure 2.
Table 3: Farmers’ information needs
Category Examples Typical Information Needs
Know‑how • Crop choice • What are options for new• Seed variety crops or seed varieties?
• Are there higher valuecrops or better seedvarieties I could beplanting?
Context • Weather • When should I sow?
• Plant protection When should I harvest?• Cultivation best given my climate/soil
practice • What are cultivationbest practices for mycrops and soil?
• What inputs should I use?How to best apply them?Where can I nd them?
Market • Market Prices • What are prices andInformation • Market Demand demand in relevant
• Logistics markets? • Has there been a
transport breakdown?
Of this range of information requirements, we found thatsmall farmers prioritized weather, plant protection (disease/pest remediation), seed information and market prices asthe most important. In Uttar Pradesh and Rajasthan, closeto 90% of farmers reported seed information as the highest
priority while over 70% cited market prices as the mostimportant category.14
While farmers were interested in the other categories of information, such as cultivation best practices and cropchoice, only a minority of the sample prioritized them.Typically these other categories would be most signicantwhere the farmer was seeking to try new strategies in orderto increase yields and revenues, although almost all farmerswill need to introduce crop changes periodically.
We found that most farmers had access to a varietyof non‑mobile enabled information sources that theyconsulted for agricultural information. This included TV,
radio, newspapers, other farmers, government agriculturalextension services, traders, input dealers, seed companiesand relatives. However, the perceived quality and relevanceof the information provided by these sources was highlyvariable. Most of the farmers we interviewed lacked accessto consistent, reliable information for many of their needsand often relied on a combination of traditional knowledge,experience and guesswork to make decisions. With theexception of villages with access to successful ITC rural kioskprograms, most of the farmers surveyed did not have a singlechannel or access platform that served as a comprehensivesource for their information needs.
Figure 3: Information needs through the agricultural cycle
Crop planning
Buying seeds
Market
Growing
Selling
Know-how
Context
Harvesting,packing andstoring
Planting
• Better information
on higher yield
crops, seed
varieties
• Identify best time
to plant
• Source inputs
eg fertiliser
• Use better fertiliser,
apply better
techniques
• Identify best time
to harvest, given
weather forecasts
• Compare traders
to find best
market prices
• Find best prices,
identify transport or
storage problems

8/6/2019 India: The Impact of Mobile Phones
http://slidepdf.com/reader/full/india-the-impact-of-mobile-phones 28/68
26
India: The Impact of Mobile Phones Moving the debate forward • The Policy Paper Series • Number 9 • January 2009
Mobile-enabled information services
A core part of our investigation was an assessment of newmobile‑based information services targeting farmers andshermen. We sought to evaluate whether these services
were providing a more effective way of fullling farmers’information needs – more timely, more accessible, moreconsistent, better customised – consequently leading toproductivity gains.
We looked at two mobile services targeting farmers,IFFCO Kisan Sanchar Limited (IKSL) and Reuters Market Light(RML) and the Fisher friend program for shermen. Each of these sources and distributes information in different ways,but all three provide an assortment of information coveringthe information categories identied above.
i) IKSL and Reuters Market LightIn our sample of farmers, 41% of those interviewed weresubscribers to one of the two services and no farmer in thesample subscribed to any other similar service.15
Customisation All IKSL subscribers in the state receivedthe same voice messages irrespective of location or cropchoice. By contrast, RML allowed farmers to choose twocrops and customised the information each farmer received.RML also supplied weather information at the taluka level– approximately a 50 km radius.16
Access . IKSL’s voice messages were sent at unpredictabletimes during the day and required that the farmer accessthem at the moment they were received. RML deliveredinformation via text message at preset times during the day,enabling more convenient access to the farmer at a time of hischoosing.17 However, an important factor in choice of deliverymethod is literacy. Most IKSL farmers reported that the voicemessage was preferable to a text message for this reason.RML subscribers largely preferred text messages and did notreport literacy concerns.18
Table 4: Mobile information services for farmers
IFFCO – IKSL Reuters – RMLLaunch date June 2007 October 2007 (pilot in January 2007)
Cost Free voice messages; Helpline Rs. 175 for three month packageservice available at Rs. 1/minute Rs. 350 for six months
Rs. 650 for one year
Nature of Delivery Voice message SMS‑text message
# of Daily Messages 5 4
Information Provided • Weather • Weather• Crop/animal husbandry advisory • Crop‑advisor y• Market Prices • Market Price (2 crops and 3 markets of choice)• Fertiliser availability • News (commodity specic and general –• Electricity timings occasionally includes market demand estimates)
• Government schemes
Figure 4: Examples of RML messages
The price information in this message comprises (for threemarkets): (i) minimum price, (ii) maximum price and(iii) quantity of the crop arriving in the market that day.
Cotton
Akot: Rs. 2650 – 2850 / Q 3500
Aurangabad: Rs 2700 – 2850 / Q 800
Shevgaon: Rs 2650 – 2700 / Q 2500
This message gives the Anuman (forecast) of weather forthe Satara taluka (administrative region) of Satara district:the name of the taluka, month & date, high and lowtemperatures, relative humidity (RH), chances of rain,and forecast of actual precipitation (9 mm here).
Anuman
Satara03/12
H: 29°C, L: 19°CRH: 77%Chances of Rain: 98%,Rain: 9 mm
Fruit seller, Rajasthan
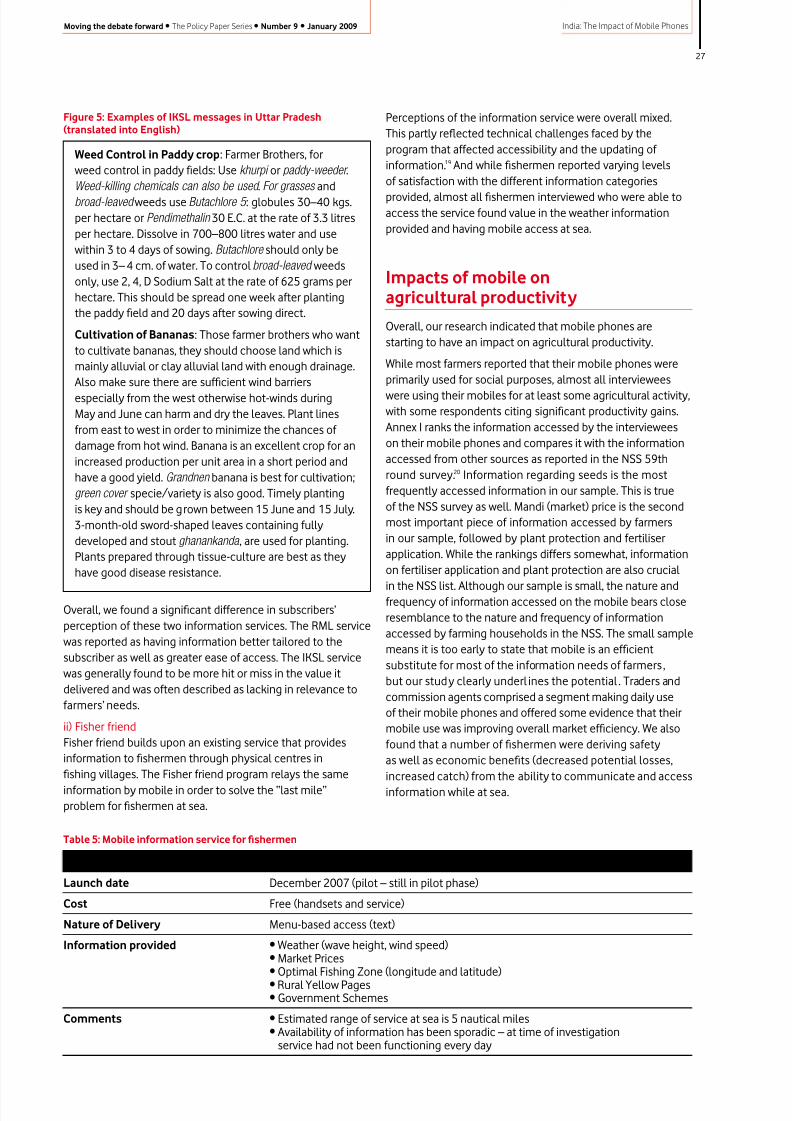
8/6/2019 India: The Impact of Mobile Phones
http://slidepdf.com/reader/full/india-the-impact-of-mobile-phones 29/68
27
India: The Impact of Mobile PhonesMoving the debate forward • The Policy Paper Series • Number 9 • January 2009
Figure 5: Examples of IKSL messages in Uttar Pradesh(translated into English)
Weed Control in Paddy crop: Farmer Brothers, forweed control in paddy elds: Use khurpi or paddy-weeder .Weed-killing chemicals can also be used . For grasses andbroad-leaved weeds use Butachlore 5 : globules 30–40 kgs.per hectare or Pendimethalin 30 E.C. at the rate of 3.3 litresper hectare. Dissolve in 700–800 litres water and usewithin 3 to 4 days of sowing. Butachlore should only beused in 3– 4 cm. of water. To control broad-leaved weedsonly, use 2, 4, D Sodium Salt at the rate of 625 grams perhectare. This should be spread one week after plantingthe paddy eld and 20 days after sowing direct.
Cultivation of Bananas: Those farmer brothers who wantto cultivate bananas, they should choose land which ismainly alluvial or clay alluvial land with enough drainage.Also make sure there are sufcient wind barriers
especially from the west otherwise hot‑winds duringMay and June can harm and dry the leaves. Plant linesfrom east to west in order to minimize the chances of damage from hot wind. Banana is an excellent crop for anincreased production per unit area in a short period andhave a good yield. Grandnen banana is best for cultivation;green cover specie/variety is also good. Timely plantingis key and should be grown between 15 June and 15 July.3‑month‑old sword‑shaped leaves containing fullydeveloped and stout ghanankanda , are used for planting.Plants prepared through tissue‑culture are best as theyhave good disease resistance.
Overall, we found a signicant difference in subscribers’perception of these two information services. The RML servicewas reported as having information better tailored to thesubscriber as well as greater ease of access. The IKSL servicewas generally found to be more hit or miss in the value itdelivered and was often described as lacking in relevance tofarmers’ needs.
ii) Fisher friendFisher friend builds upon an existing service that providesinformation to shermen through physical centres inshing villages. The Fisher friend program relays the same
information by mobile in order to solve the “last mile”problem for shermen at sea.
Perceptions of the information service were overall mixed.This partly reected technical challenges faced by theprogram that affected accessibility and the updating of information.19 And while shermen reported varying levelsof satisfaction with the different information categories
provided, almost all shermen interviewed who were able toaccess the service found value in the weather informationprovided and having mobile access at sea.
Impacts of mobile onagricultural productivity
Overall, our research indicated that mobile phones arestarting to have an impact on agricultural productivity.
While most farmers reported that their mobile phones wereprimarily used for social purposes, almost all interviewees
were using their mobiles for at least some agricultural activity,with some respondents citing signicant productivity gains.Annex I ranks the information accessed by the intervieweeson their mobile phones and compares it with the informationaccessed from other sources as reported in the NSS 59thround survey.20 Information regarding seeds is the mostfrequently accessed information in our sample. This is trueof the NSS survey as well. Mandi (market) price is the secondmost important piece of information accessed by farmersin our sample, followed by plant protection and fertiliserapplication. While the rankings differs somewhat, informationon fertiliser application and plant protection are also crucial
in the NSS list. Although our sample is small, the nature andfrequency of information accessed on the mobile bears closeresemblance to the nature and frequency of informationaccessed by farming households in the NSS. The small samplemeans it is too early to state that mobile is an efcientsubstitute for most of the information needs of farmers ,but our study clearly underl ines the potential . Traders andcommission agents comprised a segment making daily useof their mobile phones and offered some evidence that theirmobile use was improving overall market efciency. We alsofound that a number of shermen were deriving safetyas well as economic benets (decreased potential losses,increased catch) from the ability to communicate and accessinformation while at sea.
Table 5: Mobile information service for shermen
FISHER FRIEND
Launch date December 2007 (pilot – still in pilot phase)
Cost Free (handsets and service)
Nature of Delivery Menu‑based access (text)
Information provided • Weather (wave height, wind speed)• Market Prices• Optimal Fishing Zone (longitude and latitude)
• Rural Yellow Pages• Government Schemes
Comments • Estimated range of service at sea is 5 nautical miles• Availability of information has been sporadic – at time of investigation
service had not been functioning every day

8/6/2019 India: The Impact of Mobile Phones
http://slidepdf.com/reader/full/india-the-impact-of-mobile-phones 30/68
28
India: The Impact of Mobile Phones Moving the debate forward • The Policy Paper Series • Number 9 • January 2009
Among small farmers, almost all reported some increasein convenience and cost savings from using their mobilephones as basic communications devices to seek informationsuch as input availability or to check market prices. Beyondbasic communications, however, the team found differences
between reported mobile usage and benets gainedcomparing the farmers surveyed in Uttar Pradesh andRajasthan with the farmers surveyed in Maharashtra.21
Overall, the Maharashtra farmers reported greater use of theirmobile phones to access information and also greater useof the mobile‑enabled information services. These farmersalso reported a diverse set of benets accruing from mobileusage including yield improvements, price improvements andincreasing revenues from better adjusting supply to marketdemand.22 By contrast, among the farmers in Uttar Pradeshand Rajasthan who reported some benets from mobileaccess, almost all said these were limited to benets from
improvements to yield alone.There were a few underlying difference between these groupsof farmers. First, there was a difference in the informationservice accessed by these groups. The RML service wasactive in Maharashtra while IKSL served Uttar Pradesh andRajasthan. Secondly, the farmers interviewed in Maharashtrawere signicantly wealthier than their Uttar Pradesh andRajasthani counterparts and reported substantially fewerchallenges with infrastructure gaps, access to credit or otherpotential limitations on leveraging information. Finally, asignicant proportion of farmers interviewed in Maharashtrawere involved in cultivating horticulture and the unique
market characteristics of this crop may have played a role inthe reported impacts.
Drivers of mobile impactson productivity
Of all interviewees reporting that mobile had generatedpositive economic benets, the nature of that impact can becategorized in one of three ways: easy access to customised
content, mobility and time savings or convenience . The secondcategory is unique to the use of mobile phones. The others
reect the fact that mobile has become the primary (or only)communications mode for many farmers. However, as we notelater, the benecial productivity impacts of mobile dependalso on other basic infrastructure.
i) Easily accessible and customised contentFarmers described this as a key advantage of the mobile‑enabled information services. A number of IKSL and Reuters’subscribers reported that they had successfully avertedpotential losses by reacting quickly to weather and diseaseinformation (see box). Others reported improved yieldsby adopting new seed varieties and cultivation practices.Farmers who acted on cultivation information reported
that they beneted from replacing traditional “commonsense” practices with modern cultivation techniques.Weather information helped prevent seed and crop loss,and farmers in Maharashtra relied on weather informationto adjust irrigation levels.23
SAVING CROP LOSS AND IMPROVING YIELD
Name: Mr. JagdishAge: 40Education: Middle School Level
(14 years)
Location: Khanvaas village(Rajasthan)
Land Size: 9 acres (sharedbetween 3 brothers)
Service: IKSL
Impact of Mobile:
a) Cost savings from avoiding potential crop lossb) Increased revenue from higher yield
Cost Saving – Crop Loss: This farmer acted on timely weatherinformation received through IKSL to protect a harvested crop(Gwar – used as livestock fodder) that was lying on the ground
exposed to the elements. He estimates that, but for thisability to act, he would have lost 50% of this crop resulting inRs. 5,000–6,000 in losses.
Increased Revenue: The farmer made use of informationprovided by IKSL concerning planting techniques and diseaseto make changes in his farming practice. In his description,he shifted from “guess‑based” actions to following modernscientic cultivation practices. He credited these changeswith a 25% increase in annual earnings, to Rs. 125,000 fromRs. 100,000.
We found that in the case of the RML, which provides highlycustomised information on weather and market prices, all
of the subscribers interviewed reported positive benetsfrom information accessed through the service. By contrast,the ndings were overall more mixed from those with theIKSL service, which provides the same information to allsubscribers in a given state.
OPTIMISING SUPPLY TO INCREASE REVENUE
Locality: Arphal village (Maharashtra)Land Size: 3–6 acresService: RML
Impact of mobile:
Increased Revenue by matching production to
market demand
The farmers in this village had been engaged in horticulturalcultivation for the past two years. Flowers are a highlyperishable commodity and farmers monitor production andharvesting closely to minimise waste. The farmers receivedinformation from RML about a predicted increase in marketdemand for their crop. They applied a special fast growth tonicto increase production and thus capitalise on the informationreceived with higher sales.
The farmers reported that the amount of daily supply takento market is between 800–1200 ower sticks, depending ondemand. In the absence of market information, they typicallywould take fewer than 1,000 sticks per day. These farmershave now started to adjust the quantity of output they bringto market as a result of RML market demand information,offering the potential for further increased revenues on highdemand days.
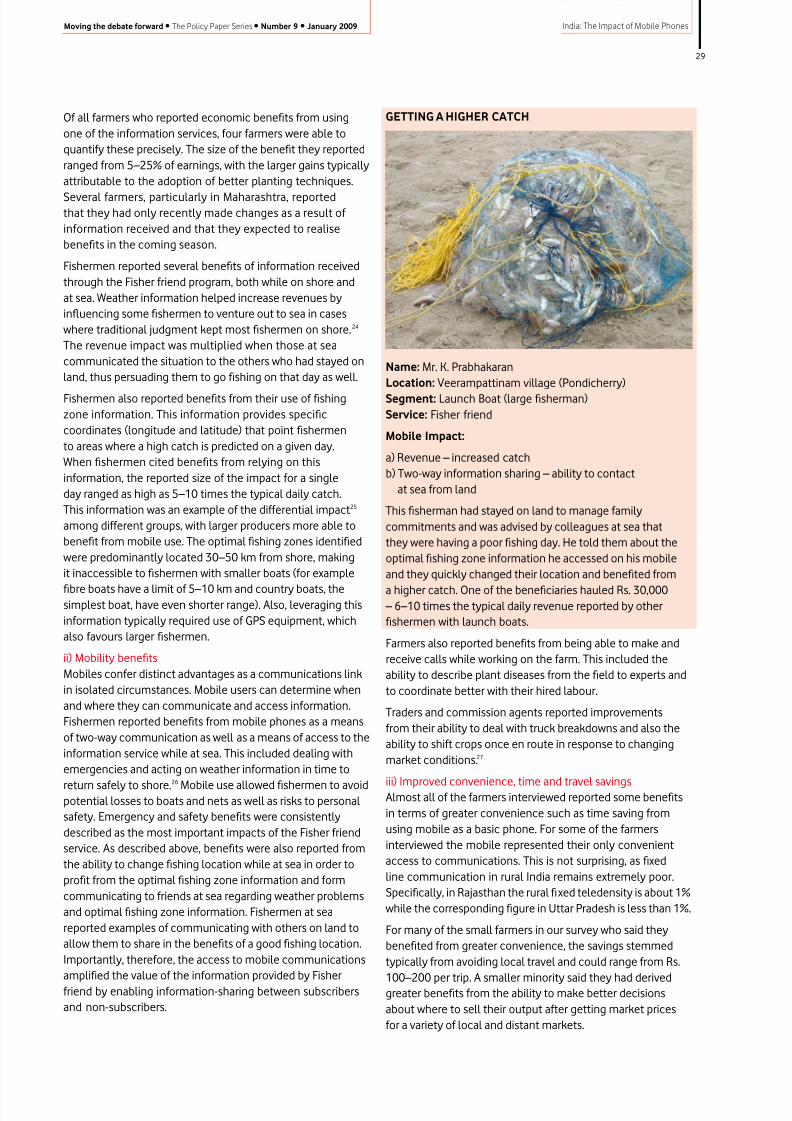
8/6/2019 India: The Impact of Mobile Phones
http://slidepdf.com/reader/full/india-the-impact-of-mobile-phones 31/68
29
India: The Impact of Mobile PhonesMoving the debate forward • The Policy Paper Series • Number 9 • January 2009
Of all farmers who reported economic benets from usingone of the information services, four farmers were able toquantify these precisely. The size of the benet they reportedranged from 5–25% of earnings, with the larger gains typicallyattributable to the adoption of better planting techniques.
Several farmers, particularly in Maharashtra, reportedthat they had only recently made changes as a result of information received and that they expected to realisebenets in the coming season.
Fishermen reported several benets of information receivedthrough the Fisher friend program, both while on shore andat sea. Weather information helped increase revenues byinuencing some shermen to venture out to sea in caseswhere traditional judgment kept most shermen on shore.24 The revenue impact was multiplied when those at seacommunicated the situation to the others who had stayed onland, thus persuading them to go shing on that day as well.
Fishermen also reported benets from their use of shingzone information. This information provides speciccoordinates (longitude and latitude) that point shermento areas where a high catch is predicted on a given day.When shermen cited benets from relying on thisinformation, the reported size of the impact for a singleday ranged as high as 5–10 times the typical daily catch.This information was an example of the differential impact25 among different groups, with larger producers more able tobenet from mobile use. The optimal shing zones identiedwere predominantly located 30–50 km from shore, makingit inaccessible to shermen with smaller boats (for example
bre boats have a limit of 5–10 km and country boats, thesimplest boat, have even shorter range). Also, leveraging thisinformation typically required use of GPS equipment, whichalso favours larger shermen.
ii) Mobility benetsMobiles confer distinct advantages as a communications linkin isolated circumstances. Mobile users can determine whenand where they can communicate and access information.Fishermen reported benets from mobile phones as a meansof two‑way communication as well as a means of access to theinformation service while at sea. This included dealing withemergencies and acting on weather information in time to
return safely to shore.26
Mobile use allowed shermen to avoidpotential losses to boats and nets as well as risks to personalsafety. Emergency and safety benets were consistentlydescribed as the most important impacts of the Fisher friendservice. As described above, benets were also reported fromthe ability to change shing location while at sea in order toprot from the optimal shing zone information and formcommunicating to friends at sea regarding weather problemsand optimal shing zone information. Fishermen at seareported examples of communicating with others on land toallow them to share in the benets of a good shing location.Importantly, therefore, the access to mobile communicationsamplied the value of the information provided by Fisherfriend by enabling information‑sharing between subscribersand non‑subscribers.
GETTING A HIGHER CATCH
Name: Mr. K. PrabhakaranLocation: Veerampattinam village (Pondicherry)Segment: Launch Boat (large sherman)Service: Fisher friend
Mobile Impact:
a) Revenue – increased catch b) Two‑way information sharing – ability to contact
at sea from land
This sherman had stayed on land to manage familycommitments and was advised by colleagues at sea thatthey were having a poor shing day. He told them about theoptimal shing zone information he accessed on his mobileand they quickly changed their location and beneted from
a higher catch. One of the beneciaries hauled Rs. 30,000– 6–10 times the typical daily revenue reported by othershermen with launch boats.
Farmers also reported benets from being able to make andreceive calls while working on the farm. This included theability to describe plant diseases from the eld to experts andto coordinate better with their hired labour.
Traders and commission agents reported improvementsfrom their ability to deal with truck breakdowns and also theability to shift crops once en route in response to changingmarket conditions.27
iii) Improved convenience, time and travel savingsAlmost all of the farmers interviewed reported some benetsin terms of greater convenience such as time saving fromusing mobile as a basic phone. For some of the farmersinterviewed the mobile represented their only convenientaccess to communications. This is not surprising, as xedline communication in rural India remains extremely poor.Specically, in Rajasthan the rural xed teledensity is about 1%while the corresponding gure in Uttar Pradesh is less than 1%.
For many of the small farmers in our survey who said theybeneted from greater convenience, the savings stemmedtypically from avoiding local travel and could range from Rs.
100–200 per trip. A smaller minority said they had derivedgreater benets from the ability to make better decisionsabout where to sell their output after getting market pricesfor a variety of local and distant markets.

8/6/2019 India: The Impact of Mobile Phones
http://slidepdf.com/reader/full/india-the-impact-of-mobile-phones 32/68
30
India: The Impact of Mobile Phones Moving the debate forward • The Policy Paper Series • Number 9 • January 2009
In villages with a successful ITC rural kiosk programme, accessto mobile phones increased the range of service of the localrepresentative, the Sanchalak. In one case the Sanchalakreported connecting with farmers 30–40 km away. Mobile usealso delivered convenience benets to farmers who were
starting to substitute some physical meetings with mobilephone conversations.28 It was also noted that mobile wasessential when the village suffered power shortages and therural kiosk was not available.
Discussions with ITC staff revealed that mobile phonesdid not replace the need for face‑to‑face communication.It was reported that farmers often need highly personalizedsolutions that benet from back and forth dialogue in personwith the Sanchalak as well as the larger farming community.For example, a farmer may be offered a generalized solutionfor fertiliser application – apply two bags of phosphatefertiliser for your crop and soil conditions. He may reply that,
given that he used two bags last year and there must still besome nutrients left in the ground, can he use just one bagthis year? Many of the queries from farmers could not be fullyresolved by phone alone. Rather, face‑to‑face interactionswere necessary, although aided by technology, to resolve thefarmer’s specic concerns through a process he trusts.
Infrastructure constraints
Our research identied some important mobile drivers forproductivity improvements in agriculture. But all seven of thefocus groups involving predominantly small farmers in UttarPradesh and Rajasthan highlighted infrastructure gaps thataffected their ability to realise productivity gains throughimproved yields and higher prices. In order for farmers torealise the full potential of access to new information, theymust be able to use it effectively. We found consistently thatinadequate infrastructure prevented this.
There are four specic infrastructure constraints which limitthe ability of farmers to leverage information:
• insufcient availability of inputs (reduces yield);
• inadequate irrigation (reduces yield);
• poor physical access to markets (reduces realised prices);
• inadequate crop storage (reduces realised prices).
Six of the focus groups highlighted problems such asdifculties sourcing inputs such as fertiliser, seed andmedicine. There were concerns about the difcultiesidentifying genuine products as many counterfeits aresold. In several groups the farmers noted that they needed
information that would help them identify these counterfeitsupplies, which remain a signicant productivity drainin India.29
Three of the focus groups specically mentioned lack of irrigation as a signicant constraint and two of them notedthat it had affected the sustainability of growing desiredcrops.30 One Rajasthani farmer noted that the “scarcity of water is the main hurdle for development of agriculture inthe region.”
Farmers reported poor road infrastructure and lack of refrigerated transport as problems affecting their access tomarkets. Many of the small farmers typically used small cartspowered by animal or small engines to deliver their goods tomarket and said that transport costs represented a prohibitivebarrier to accessing markets further aeld. This limited theiropportunity to prot from market price differences by sellingat markets where higher prices may be available. As one smallfarmer in Allahabad commented, even if he knew the prices ina larger regional market, “There were no roads that go there.”
The lack of storage facilities was cited as curtailing farmers’ability to choose when to sell their crop and thereby limiting
options to maximize price. One group of farmers noted thatlack of storage was a contributing factor to the effectivemonopoly of local commission agents that they believedcaused them to receive lower prices for their produce.
As a counterpoint to the ndings in Uttar Pradesh andRajasthan, the farmers surveyed in the ve focus groupsin Maharashtra did not report infrastructure constraintsoutside of a limited mention of cold storage concerns.31 There was widespread irrigation and diversication intowater‑dependent, high‑value crops like horticulture.32 There were no perceived concerns with availability of inputs33 or access to markets. Not surprisingly, these farmers
consequently reported greater ability to achieve both yieldand price benets from leveraging information.
ITC’s internet kiosk service is one attempt to overcome someof the challenges presented by inadequate infrastructure,by combining the provision of information on agricultural
Wall painted advertisement of ITC E Choupal with mobile number of Sanchalak Farming practices, Allahabad

8/6/2019 India: The Impact of Mobile Phones
http://slidepdf.com/reader/full/india-the-impact-of-mobile-phones 33/68
31
India: The Impact of Mobile PhonesMoving the debate forward • The Policy Paper Series • Number 9 • January 2009
practices with other services like insurance along with directsale of inputs. Recognizing the problems faced by the smallfarmers in their supply chain, the internet kiosk modelincludes information delivery, input provision and directprocurement. It seeks to overcome infrastructure constraints
by bringing markets to the farmer. Farmers we interviewedin villages with successful ITC programs reported yieldimprovements and price improvements as a result of the kioskprogram. The primary benets reported were the introductionof hybrid seed varieties and adoption of new farmingpractices, leading to productivity gains between 10–40%.Farmers noted that by receiving comparative market pricinginformation as well as a rm price offer in advance from ITC,they had greater ability to choose when and where to selltheir products. They also beneted from being to sell to ITClocally and getting transport costs reimbursed.
Other constraints
Inadequate infrastructure was the constraint most oftencited by farmers as limiting their ability to realise the fullproductivity potential of improved access to information,but other issues were also raised over the course of ourinvestigation. In particular, two of these stood out.
i) Access to creditA lack of formal credit can prevent purchase of importantinputs and can also reduce the farmer’s chances of gettingthe best price because of restrictions (explicit or implicit) onwhere he can sell his crop.34 Access to credit was a problemraised by the majority of small farmer focus groups, althoughwe were unable to evaluate reliably what difference thishurdle made to price received. We heard many contradictoryresponses as to whether or not farmers were bonded andthus had to sell to a specic trader, commission agent ormoneylender who had extended them credit earlier in the year.
ii) Capacity for risk‑taking
Many farmers are naturally cautious, especially poorer andmore vulnerable ones. However, in order for informationto drive agricultural productivity, farmers must be willingto try new strategies which may include new farming
Table 6: Example of the ITC ‘e-choupal’ model – Wheat in Uttar Pradesh
Problem Examples Solution
Lack of consistent, • Inputs, disease, sophisticated farming • Information provision through e‑choupalreliable information practices, accurate weather reports • Other services (soil‑testing, advice)
• market prices (in advance of market arrival ) available through regional hubs
Lack of availability • Seed, fertiliser, pesticide, fungicide, • Supply of inputs providedof inputs weedicide, medicine
Access to Markets • Crowded physical marketplace (could • Direct procurement by ITCand Storage take 2–3 days to enter) • Deal negotiated at time of farmer’s choosing
• lack of storage (less leverage over when • Transport costs reimbursedto sell – worse for perishable products)
• Transport costs to non‑local markets
Middlemen dominate • Unfair practices – higher transaction costs, • Direct procurement
the supply chain lower amount paid to producer • Transparent pricing known in advance• Payment based on gradations of quality
Source: Interviews, Team analysis.
Note: The specic range of services provided can vary among individual e-choupals.
techniques. While we found a small number who had madechanges based on the information they received via theirmobile phones, there were some who expressed reluctanceto try new approaches even when they had acquired relevantinformation. ITC staff said that in their experience persuading
small farmers to adopt new seed varieties or farmingmethods often requires a combination of approaches:repeated dissemination of information, demonstration plotsand farmer dialogues. Several focus groups in villages wherehybrid seed had been introduced noted that the seedcompanies also promoted diffusion of the seeds throughdemonstration plots and capacity building measures.It therefore seems likely that for broader rural productivitygains a set of similar capacity‑building activities tocomplement the basic information provision will be required.
Looking ahead
Over the course of the research we found a number of emerging ideas and applications for mobile phones thatshowed potential for the future.
• One example involved the use of camera phones to takephotos of crop diseases/pest infestations and send them to
experts immediately. This visual information can improvediagnosis and advice.35
• ITC has been piloting a new virtual commodity exchange,Tradersnet, that enables direct buying and selling of coffeeby producers and wholesale purchasers through an internetbased trading platform. SMS messages are sent to users’mobile phones every morning with the offers and gradesavailable for purchase on that day. At the end of the day,users receive a text message with details of what actuallytook place. ITC had expected that exchange memberswould use the internet to access the electronic exchangeto execute transactions. However, while members would
use the internet for research a number of them were notcomfortable using it for transactions. Instead, they wouldcall ITC representatives via their mobiles to execute tradeson their behalf. One future option is to enable all actions

8/6/2019 India: The Impact of Mobile Phones
http://slidepdf.com/reader/full/india-the-impact-of-mobile-phones 34/68
32
India: The Impact of Mobile Phones Moving the debate forward • The Policy Paper Series • Number 9 • January 2009
to take place on mobile phones, thus taking advantage of perceived higher comfort levels that users have with theirphones over PCs.
• In addition, ITC is considering whether and how mobilephones can extend the rural kiosk program. One possibility
is to get farmers to feed personal information into thesystem via their mobile phones, enabling the efcientdelivery of highly customised information back to theirmobiles. The information could be updated, allowing forcontinual adjustment and tailoring to the information thefarmer receives. Mobile phones could extend both thereach and possibly functionality of the current e‑choupalmodel and may be critical in ITC achieving its goal of reaching 100,000 villages.36
One key element in these examples is leveraging theportability, exible content delivery capability and two-waycommunications characteristics of mobile phones to deliver
low‑cost but highly customised solutions. One intervieweestressed that for a true revolution to occur with mobilephones in agriculture, mobility in particular was critical:farmers must be able to get information delivered to themat a time and place of their choosing.
Conclusions
Even at this early stage, mobile phones are being used inIndian agriculture and are starting to deliver agriculturalproductivity improvements, an impact which is enhanced
by the new mobile‑enabled information services. The mostcommon benet of mobile found in the research was derivedfrom the use of mobile phones as a basic communicationsdevice as for many of the farmers interviewed, it was the onlyconvenient phone access they had. There are signicantexamples of a range of benets arising from the use of mobiles in the context of rural India – not only from mobility,but also easy access to customised content and convenience.
Realization of the full potential impact of mobile phonesis limited, however, by a set of constraints that preventfarmers from fully leveraging the information they receive.The barriers apply more to small than to large farmers;
large farmers are more able to leverage the benets of thecommunications and information they can access.
The constraints include shortcomings in physicalinfrastructure affecting access to markets, storageand irrigation. Issues also arise with the availability tosmall farmers of critical products and services includingseeds, fertilisers, medicines and credit. Equally, to makefull use of the potential information delivered, farmersmust have sufcient risk-taking capacity to be willing toexperiment with the new strategies and ideas disseminated.Social networks may play an important role in building thetrust and condence required to inuence the adoption
of new mindsets and actions by small farmers. In additionbasic information will need to be supplemented by a rangeof other activities such as demonstrations and broadercommunications efforts.
This array of constraints means that additional interventionsmay be required to improve agricultural productivity growth.Increased public and private investment will be necessary toresolve critical infrastructure gaps. Policy changes may alsobe needed to encourage better access to high‑quality inputs
and credit for small farmers. Increased extension servicesand capacity‑building efforts can complement informationdissemination via mobile phones and associated services toaccelerate the adoption of new techniques.
However, even in the case of poor farmers facing signicantconstraints we found that there were still opportunities torealise productivity gains from the adoption of new farmingpractices and actions to mitigate crop losses. In the caseof shermen, there were, in addition to economic benets,safety benets and enhanced quality of life from decreasedisolation and vulnerability.
There are also lessons for current and future mobile‑enabled
information service providers about the information of greatest value to users in the agricultural sector.
• Customisation and frequent updating add substantialvalue. Generic information triggers dissatisfaction andreduces the frequency with which farmers access theservice. The most frequent criticism we heard was thatinformation was old and routine.
• Secondly, where literacy concerns are not paramount, textmessaging offers signicant advantages over voice-baseddelivery in terms of convenience and content exibility.
• Finally, information should be in the local language and any
platform should be intuitive for subscribers to understand.Most of the farmers we interviewed were prepared to pay forinformation services as long as they felt that they would getthe information they wanted – relevant, timely and reliable.
There are some important questions which were not coveredby our research. One is the extent to which information isshared by farmers who use mobile phones with those whodo not. As continued mobile penetration encourages moreinformation access and diffusion, further research may beable to evaluate if ultimately a tipping point will be reached,amplifying the impact of mobiles on productivity and farmrevenues. Finally, it may be useful to consider whether
and how much mobile phones may be increasing overallmarket efciency reected in decreasing price dispersionin wholesale agricultural markets.
This study provided a rst look at the potential for mobilephones to affect productivity in the agricultural sector asa whole. We saw many examples of benets created by thecharacteristics of mobility, customised content delivery andconvenience. As mobile penetration continues to increaseamong farming communities and information servicescontinue to adapt and proliferate, the scope exists for a muchgreater rural productivity impact in future, but achievingthe full productivity potential will depend on reducing other
constraints which limit the use of the information farmersand shermen can obtain from their mobile phones.

8/6/2019 India: The Impact of Mobile Phones
http://slidepdf.com/reader/full/india-the-impact-of-mobile-phones 35/68
33
India: The Impact of Mobile PhonesMoving the debate forward • The Policy Paper Series • Number 9 • January 2009
Annex I:Ranking of the use of moderntechnology by farmers to accessinformation on cultivation
Information Use of Modern Use of Technologya Mobileb
Seed I I
Mandi (Output) Price NA II
Fertiliser application II IV
Plant protection III III
Harvesting and Marketing IV V
Farm Machinery V VI
Note: a Results are based on the information provided in the Situation
Assessment Survey of Farmers, Access to Modern Technology for
Farming, NSS 59th Round, NSSO, GoI. June 2005. The sources of information used in this table are radio, television, newspapers ,
input dealers and other progressive farmers.
b Information based on the survey done under the study, consisting
of individual farmers in Uttar Pradesh, Rajasthan and Maharashtra.
NA: NSS survey did not cover ‘Mandi Prices’.
Notes
1 Jensen, Robert (2007). “The Digital Provide: Information (Technology), Market
Performance, and Welfare in the South Indian Fisheries Sector”. The Quarterly
Journal of Economics. Vol. CXXII, No. 3, pp. 879–924.
2 Abraha m, Reuben (2007). “Mobile Phones and Economic Development:
Evidence from the Fishing Industry in India”. Information Technologies andInternational Development, Vol. 4, No.1, pp.5–17.
3 2001 Indian census.
4 India’s average operati onal land holding is less than 2 hectar es (4.94 acres).
5 Kumar, Praduman and Surabhi Mittal (2006). “Agricultural Productivity Trends in
India: Sustainability Issues” Agricultural Economic Research Review. Volume 19,
Pp 71–88.
6 Ministry of Agriculture, GoI.
7 Some initiatives to improve the efciency and transparency of individual
wholesale markets are taking place. They seek to increase transparency and
overall market efciency by improving backward linkages to farmers and forward
linkages with wholesale purchasers. One example of this is the SAFAL terminal
market in Bangalore.
8 An article citing recent estimates by the Agrochemicals Policy Group
reported that spurious and substandard pesticides worth Rs. 1,200 crores
are sold to farmers every year in India resulting in loss of crops worth Rs.
6000 crores (1 crore = 10 million rupees).
See: http://businessstandard.co.in/india/storypage.php?autono=33441.
9 The share of rural credit from non-institutional agencies is above 40%.
10 Situation assessment survey o armers conducted by the National Sample Survey
organization (June, 2005), GoI . The sur vey evaluated access to information
on “Modern Technology for Farming”. Examples of the information
categories assessed include: improved seed variety, fertiliser application
and plant protection.
11 This included total land held by farming households that were often comprised
of joint family units living in the same house. The team used 6 acres as the cutoff
for the purposes of this study. Indian agricultural standards dene small farmers
as those with less than 4.94 acres of land.
12 This reects the both the realit y of the sector and the judgmen t of the
organisations that selected the participants investigated.
13 IFFCO-Air tel green card.
14 Percentages refer to results from 22 individual interviews conducted in UttarPradesh and Rajasthan.
15 The only other relevant service encountered in the areas surveyed was the
BSNL helpline. This was a toll-free service that farmers could call for agricultural
information. However, in every single case where a farmer we interviewed was
aware of this service, it was described as ‘not satisfactory’ and there were no
examples cited of successful use of this service.
16 Taluka is an administrative division of a larger district within a state.
17 RML had started their service with voice messages, but later switched to text
messages as they found that voice delivery limited content that could be
delivered and prevented predictable message delivery. The switch enabled
greater accessibility (predictable time delivery, text message permanently
stored on phone) and content customisation.
18 Maharashtra has a higher literacy rate than the other regions surveyed.
Literacy levels by state: Maharashtra (76.9%), Rajasthan (60.4%), Uttar Pradesh
(56.3%). Source: Census of India 2001.
19 The information provided was sourced centrally and distributed through MSSRF’s
local village centres as well as through Fisher friend. Fishermen reported that
for signicant periods of time the entire service or certain information – such as
optimal shing zone - was not available.
20 Results are based on the information provided in the Situation Assessment
Survey of Farmers, Access to Modern Technology for Farming, NSS 59th Round,
NSSO, GoI. June 2005.
21 Positive impact s were specical ly reported in only 1 of the 6 focus groups
involving IKSL subscribers. By contrast, all focus groups involving RML subscribers
in Maharashtra reported positive impacts from use of the service. Overall, of
small farmers interviewed who were IKSL subscribers, eleven out of 44 reported
positive impacts from use of the service. It should be noted that 10 of these 11
were from individual interviews and were specically sought out by the team to
recount examples of impact.
22 Farmers reported using market demand predications to adjust the quantity of
supply they harvested and took to market during a given period. Future market
demand predications were included, where possible, in the news message sent
to RML subscribers in the afternoon.
23 By reducing the amount of irrigation used when rain is forecast farmers reduce
the chances of fungal disease as well as conserving water.
24 An example was given that during a recent 3-week stretch the shermen
would have gone out to sea only 3 times if relying on traditional habits and
judgment. However, armed with knowledge of wave height, wind speed and
other weather conditions they ventured out 10 times instead and managed
to earn incremental revenues.
25 Fisher friend provided longitude, latitude and sea-depth information to identify
optimal shing zones. GPS information was important to make use of the data
and often the optimal zones were at a distance from shore that could only be
accessed by larger boats. The team did hear however, of some examples were
shermen with smaller boats were able to benet from this information as well.26 One example was given of a boat that suffered an engine breakdown far from
shore. While they were unsuccessful in contacting t he Coast Guard despite
repeated attempts, they were able to reach MSSRF s taff. The staff members
then contacted Coast Guard ofcials and a successful rescue operation was
carried out.
27 Although this investigation was not able to directly study the impact of
mobile on improving the overall efciency of markets, these activities
presumably contribute to smoothing out demand/supply imbalances and
reducing overall wastage.
28 In one ITC village it was reported that 20% of the farmer clients used their
mobile phones to communicate with the Sanchalak. However, even these
farmers continued to travel to the Sanchalak’s home for in-person meetings.
29 Input constraints relate not only to availability in general, but also to the
availability of “genuine” inputs.
30 Although only specically mentioned by three focus groups, the team found that
irrigation was not available to smaller farmers in almost all of the regions surveyedin Allahabad, Agra and Rajasthan. The primary reason cited was electricity
problems that made the tube well ineffective. Unlike Maharashtra, which suffered
from electricity limitations but had predictable electricity timings, the electricity
timings in the poorer regions were typically reported as unpredictable.
31 Two focus groups report ed access to storag e facilities while two groups had no
access, particularly to cold storage. However, even in the latter case the lack of
access to cold storage did not prevent them from taking advantage of market
arbitrage opportunities.
32 The availability of electricity (essential for some tube wells) ran on a predictable
schedule. Consequently, it was not described as a problem by the farmers
surveyed despite daily limitations of availability. Electricity was available from
5 hours/day-12 hours/day.
33 While one focus group mentioned a desire to get information on seed availability,
this appeared to be more in order to save search costs rather than difcultly in
ultimately getting the product. The greatest challenge noted by focus groups was
primarily around price volatility.34 This is sometim es referred to as the problem of “bondedness”
35 Tata Teleservice s has star ted to pilot this in Maharashtra .
36 There are currently 6400 e-choupals active that reach 40,000 villages.

8/6/2019 India: The Impact of Mobile Phones
http://slidepdf.com/reader/full/india-the-impact-of-mobile-phones 36/68
34
India: The Impact of Mobile Phones Moving the debate forward • The Policy Paper Series • Number 9 • January 2009
A survey of usage of mobile in poorurban areasIndia is an increasingly urban country, with over half a billionpeople expected to live in towns and cities by 2020. Morethan one fth of the urban population lives in slum areas, andin some major cities the slum areas account for almost half the population. With large numbers of migrants arriving fromthe countryside in search of better opportunities, the slumsare growing.
This makes the economic and social dynamism of the slumsa central issue for development. The key policy questionis whether life in the slums can become the focal point foran economic and social transformation which will alleviate
poverty. The alternative is that they will remain traps of despair and poverty. The rapid urbanization of the Indianpopulation and the consequent strain on urban infrastructuremeans that the economic and social plight of those living inthe slums will be one of the dening characteristics of Indiaduring the next twenty years.
This context makes it crucial to develop public policies andprivate opportunities which will allow slum dwellers to ndways to address their particular needs. This paper seeks toanalyse the uptake and use of mobile telephony within someof India’s urban slums, and its effect on the economic andsocial lives of their inhabitants. Few innovations have become
as pervasive as quickly as the mobile phone. While thereis much anecdotal evidence on the ways mobile use canimprove the social and economic status of poor people, thereis little systematic evidence on the benets of mobiles forthese groups.
Through a large survey covering 1774 people in 84 very poorareas in three metropolitan cities (Delhi, Ahmedabad andKolkata); this study focuses on understanding the social andeconomic impacts of mobiles on them.
The primary research question is: What has been the impact o
mobiles on users living in urban slums? The study focuses onthe social and economic impacts of mobiles on the lives of poor urban dwellers. The purpose was to understand howmobiles affect the way slum residents conduct their socialand economic lives and the returns that they derive fromtheir economic activities. The survey questions aimed to:
• understand the determinants of ownership and usage;• measure the perceived impacts of using a mobile;
• understand how these impacts came about.
The results suggest that mobile users in slums by and largeview their mobiles positively and derive more benetsfrom this usage than the amount they spend. A majority of respondents believe that the of use mobiles has led to animprovement in their economic situation. Not surprisingly,transaction‑intensive activities that require communicationand the gathering of information are most affected bymobiles. For example, nearly 60% of users engaged in self‑
employed activities report a positive impact in terms of earnings.1 Users report a positive effect of mobiles not onlyin reducing costs associated with doing work, such as lowertravel costs and better information regarding prices, but alsoon their ability to co‑ordinate with the people they work with,
Professor, Indian Institute of Management (IIM), Ahmedabad.
Prof. Rekha Jain
Professor, Indian Institute of Management (IIM), Ahmedabad.
Prof. Ankur Sarin
Rekha Jain is Professor, Indian Institute of Management, Ahmedabad, India and the Executive Chair of
the IIMA‑IDEA Telecom Centre of Excellence.
Ankur Sarin is a Professor at the Indian Institute of Management (IIM) in Ahmedabad.

8/6/2019 India: The Impact of Mobile Phones
http://slidepdf.com/reader/full/india-the-impact-of-mobile-phones 37/68
35
India: The Impact of Mobile PhonesMoving the debate forward • The Policy Paper Series • Number 9 • January 2009
working over larger geographical areas and avoiding the useof intermediaries in their transactions. In addition to economicimpacts of this kind, the results suggest that mobiles havea positive effect on social ties and relationships. Most usersreport that mobiles allow them to remain in touch and have
improved their knowledge about the welfare and whereaboutsof their friends and relatives. Interestingly, users also reportthat mobile usage has led to a decrease in the frequencywith which they meet their friends and relatives face‑to‑face.Therefore, while mobiles strengthen social relationships theyalso change how slum residents interact with each other.
While the positive economic and social impacts of mobileson slum residents are indeed promising, we need to note theevidence of differences between households. In our survey,average household income per month among users is Rs.6436 (US$129) and that among non‑users in our sampleis Rs.4373 (US$87), and there were similar differences
between users and non‑users in terms of education andother social characteristics. Thus even given the relativelyrapid reduction in the cost of owning and using mobiles, theprimary barrier to mobile usage among the slum populationstill remains nancial – especially for those in regular wagejobs. The survey also indicated some hierarchies withinhouseholds, with women far more likely than men to beonly infrequent mobile users or not to have access at all.The evidence on differential access according to economicor social status, whether within the household or betweenhouseholds, will be relevant to understanding how to reducebarriers to access in future.
Why study slums in urban India?
Although there is some research which argues that there isan urban bias in policy (Lipton, 1977; Varshney, 1998), for themost part it is the rural sector which has been the focus of poverty‑reduction policies. This is not surprising: the majorityof India’s population has always lived in villages and a higherproportion of them are below the poverty line. However, theimportance of the urban sector has been growing rapidly andalthough only 28% of India’s 1.2 billion people currently live incities, this proportion is rising. What’s more, the urban sector
contributes to more than 60% to India’s GDP – a far greaterthan the 29% urban share in 1950–51.
Since the creation of wealth is concentrated in certainregions and sectors, this has naturally led over the years tolarge‑scale migration from the countryside to Indian cities.Therefore, while India’s urbanization rate is far lower than thatof other countries like China (40%), the rate at which it hasbeen urbanizing has been increasing and by 2025, 40% of India’s population is projected to be urban (National Instituteof Urban Affairs, 2000). Furthermore, between 1983 and2004–05, the total numbers of rural poor declined by morethan 12% while the total number of urban poor increased
by nearly 14% (Chandrasekhar and Mukhopadhyay, 2008).India has not been alone in this rapid transformation, with60% of world’s population expected to be living in citiesby 2030 (The Economist, 2007). And like other developingcountries, India has largely been unprepared for this inux
from the countryside. Consistent with the poor planningand development of civic amenities and infrastructure,there have been few low cost housing facilities availablefor migrant workers who come to cities in search of bettereconomic opportunities. As a consequence, there has
been a proliferation of slums and of the nearly 300 millioninhabitants that live in India’s cities, 55% live in settlementsthat can be characterised as slums (UN‑Habitat 2008).
Understanding the context – slums inurban India
The living conditions and extent of poverty that characteriseslums varies dramatically between and within cities.In general, the ‘notied’ or authorised slums (the type of slums we collected data from in our survey), which arerecognised by the authorities, have signicantly betterliving conditions and lesser poverty than non-notied ornon‑authorised slums. For example, in 2002, estimates of the proportion of total population living below the povertyline were 34% in the notied slums versus 41% in non-notied slums and 21% in non-slum areas (Chandrasekharand Mukhopadhyay, 2008). Similarly, 84% of people liv ing innotied slums were estimated to have access to a water tapin contrast to 71% in non-notied slums. However, while thenotied or authorised slums are more likely to have somebasic amenities such as water and electricity, the provision
is meagre and usually inadequate to meet the demand.For example, there could be one tap in the locality in thenotied area, whereas in unauthorised slums, residentsmay have to walk a considerable distance to get water at all.Residents in the non-notied slums are typically unlikelyto benet from any public utilities, since these settlementsare unrecognised by the civic authorities and provision of these utilities would imply formal recognition.
The housing in the notied and non-notied slums alsotypically varies, with those in the former more likely to berelatively well constructed, for example, built out of morepermanent materials like bricks or concrete, while those
in non-notied slums will be built out of more temporarymaterials like unburnt bricks, bamboo, mud, reeds, andthatch. Regardless of the type of structure, usually a largenumber of people, a family or even an extended family livein a small room. Several families may live on the verandas of
Slum area, Ahmedabad

8/6/2019 India: The Impact of Mobile Phones
http://slidepdf.com/reader/full/india-the-impact-of-mobile-phones 38/68
36
India: The Impact of Mobile Phones Moving the debate forward • The Policy Paper Series • Number 9 • January 2009
such houses. In both cases the common space is heavily used.There is little or no personal space and household assets(such as TV and radio) are shared by all the family.
Given the living conditions, it is not surprising that it is thepoor among urban residents who are likely to inhabit theslums. Many of the slum dwellers, lacking the skills andcapabilities required in the new growth areas of the economy,are usually absorbed in the low‑paying informal sectors.Such jobs are not regular, offer little security, and are oftenexploitative. Most people have no savings and few assetsand therefore rely on the vagaries of the labour market forincome. As is the case in most Indian labour markets, gender,caste, training and education are the determinants of accessto jobs. The types of jobs available to them may be irregular,dependent on the type of neighborhood (construction site,industrial area), and the availability of capital among theself‑employed. Often people living in such areas may have
to commute long distances for work, as sometimes theslums are right on the periphery of cities.
Social life in slums
Slum dwellers face a difcult social life, not only becauseof overcrowding but also because of the high competitionfor shared resources (such as water), the threat of eviction,their insecure or non‑existent job tenures, and the need tore‑establish social links in a new environment as they moveaway from their roots. Support from family and communitybased networks and safety net systems (developed overgenerations in rural villages) may be limited and theprecarious nature of their work and dwellings makes themeven more vulnerable. Although some slum residents livein clearly dened occupational or caste based groupings,others do not (Loughhead and Mittal, 2001).
For slum dwellers, it is often not only education, skills andhealth that determine their ability to cope with vulnerabilities,but also their own capacity to deal with emergent situations.For example, they may not be in a position to take a risk suchas forgoing current earning opportunities in order to enhancetheir skills for a potentially higher earning job in the future.The immediate imperative to earn a living, coupled withnatural caution, also determines whether they can exploit newbusiness opportunities. For example, their decisions regardingwho to sell their services or goods to may be determined bywho they already trust (lower risk than a new supplier they donot know even if willing to give them a better price). A personwho has a better provision for their nances may be able totake on additional risk.
The socio-economic context of mobileuse in urban slums
Our underlying assumption is that the social and economiccontext of slums will drive the adoption and usage of mobiles in ways that are different from other sections of thepopulation in other locations. Due to the fact that there is somuch sharing of space and other assets, we could expect that
mobiles may be used as a shared service, especially since thehandset costs might be a deterrent to acquisition for personaluse. We also expect that the communication patterns will bedetermined by migration amongst other factors. For example,where male migrants have moved to cities, they would need
to communicate with their immediate families left behind.There would be a need to communicate not only about theirwelfare, but also about the status of any remittances theymight have sent. Even when entire families migrate to cities,they may well have roots in rural areas or smaller towns andperhaps be involved in supporting the larger family in theirplace of origin.
Furthermore, we expect that the type of economic activitymobile users are engaged in will determine the adoption andusage. Since many of them are involved in informal activities,the ability to be in touch with sources of job opportunities iscritical. Competition for such activities (such as casual labor)
is erce. This puts further pressure on those seeking jobs tobe in touch with the source of the opportunity. If they areself employed, or work as sub contractors, then the ability tocoordinate with their suppliers and customers is important, asthere may be no formal contracts to ensure service or payment,making them extremely vulnerable. Further, since residentsof slums probably commute for their work, coordination couldhelp them reduce their travel costs. Since slum dwellers arevery susceptible to harsh nancial circumstances and havepoor living conditions, they may frequently need to contactsources of help to cope with these. The possible frequent needto address nancial or non-nancial emergencies could drive
adoption and use of mobile.
Methodology
The survey sought to compare the experiences and currentstatus of a group of self‑selected users and non‑users livingin slums in the three cities. Households in which there is atleast one member who uses mobiles regularly – dened asusing a mobile at least once a week – were classied as ‘user’households and other households were classied as ‘non-user’households.2 Care should therefore be taken in interpretingthe differences between users and non‑users in the results
reported below. Since the use of mobile phones is a choicethat individuals make, the group of users and non‑users couldsystematically differ from each other in more ways thanjust mobile usage. While some of these, like earnings andeducation can be controlled and accounted for, others, whichare difcult to measure and observe, cannot. For example,people using mobiles are likely to have chosen to use thembecause of higher perceived or real impacts. Similarly peopleusing a mobile phone might simply be more motivated toimprove their life‑conditions or be informed about how todo so than non‑users. Therefore, attributing any observeddifference in outcomes between users and non‑users just to
mobile use becomes problematic in the presence of other(possibly unobservable and immeasurable) attributes thatare correlated both with mobile use and the outcomes beingconsidered. However, differences between the two groups canbe regarded as due partly to the impact of mobiles.

8/6/2019 India: The Impact of Mobile Phones
http://slidepdf.com/reader/full/india-the-impact-of-mobile-phones 39/68
37
India: The Impact of Mobile PhonesMoving the debate forward • The Policy Paper Series • Number 9 • January 2009
We also try to identify potential impacts by considering theways in which these impacts might operate through relevantsurvey questions.
To assess impacts, we asked users about changes in theirsocial and economic status since they started using mobiles.We asked non‑users to use the last year as the referenceperiod to benchmark changes that occurred withoutmobile usage.
The dimensions on which respondents were askedquestions included:
• Determinants and nature of mobile ownership
• Determinants of usage between households, i.e. whichhouseholds are more likely to be using mobile
• Usage within households, i.e. which members of thehousehold are more likely to use mobiles
• Nature and pattern of usage‑ Expenditure‑ Purpose of usage‑ Calling patterns‑ Use of Services
• Change in nature and patterns of economic activity
• Change in returns to economic activity
• Change in work practices and behavior
• Social impacts such as nature and intensity of socialcontacts, status:
• Pervasiveness of mobile ownership in a) social network
and b) economic network
• Barriers to mobile ownership
Data and sample design
Given the focus of the study on urban slums, we restrictedattention to three large metropolitan cities: Delhi, Ahmedabadand Kolkata, located in the northern, western and easternparts of the country respectively. Between them the threecities provide some degree of regional diversity and representa population of approximately 21 million. Within each city, we
stratied the slums into different geographic regions and usedthe method of probability proportional to size to select slumsto survey. To the extent that slums differ from each other, wetried to get as many different slums as possible to ensure oursample is representative of the city slum population.
There were 29 slums selected in Kolkata, 25 in Delhi and30 in Ahmedabad. Twenty households were interviewed inmost slums, with 40 interviewed in 4 slums and 60 in one.Within each of the areas, 70% of the interviewed householdswere selected to be ‘user’ households and 30% werenon‑user’ households. The households within each area werechosen purposively based on availability and willingness
to participate. The number of user households was thusover‑sampled in order to focus in detail on mobile impacts.The total number of households that we tried to interviewwas 1800 – 600 in each city – so of the total of 1800, 1260were to be users and 540 non‑users.
We collected data from both the primary user of the mobilephone as well as the person most knowledgeable about thehousehold socio‑economic status and practices, in casethe two were different. The determination of who were theprimary and secondary users was left to be self‑determined
by each of the households and was not based on any pre‑dened criteria.
Using the sampling methodology described, we weresuccessful in surveying 1774 households, of which 1235 wereusers and 539 were non‑users.3 Table 1 provides further detailsof the sample. The average size of the household in oursample was 4.37 members, with households in Ahmedabadand Delhi being larger than the Kolkata sample. Membersbelonging to the Scheduled Castes (SC) make up nearly 28%of our sample, while those from Scheduled Tribes (ST) andOther Backward Classes make up six and 16%, respectively of our samples.4 Compared to the whole population, we have a
disproportionate number of Scheduled Castes and ScheduledTribes in our sample. For instance, the 2001 Census suggeststhat Scheduled Castes made up around 20%, 26% and 6%of the respective slum population in slums in Ahmedabad,Delhi and Kolkata respectively. Similarly, Scheduled Tribesconstituted only around 1% of the slum population inthese cities during the 2001 census but constitute 6% of our sample.
Table 1. Description of the sample
All Ahmedabad Delhi Kolkata
No. of householdssurveyed 1774 597 575 602
No. of user householdssurveyed 1235 418 395 422
No. of non‑userhouseholds surveyed 539 179 180 180
Average size of households 4.32 4.51 4.50 3.96
Percentage of households that were
SC 28% 35% 31% 17%
ST 6% 11% 6% 1%
OBC 16% 25% 20% 2%
Others 51% 29% 43% 79%
Results
Users are better‑off than non‑usersThe survey corroborates the general perception that mobileuser households are economically advantaged and moreeducated compared to non‑user households (Souter et al.,2005; Samuel et.al., 2005; Zainudeen et.al., 2007; Barrantes,2008; Chabossou et.al., 2008) – see Table 2. In our sample theaverage total household earnings for users (with on average
around four persons in each household) is Rs. 6436 (US$129)per month while that for non‑users is Rs. 4377 (US$87)– a difference of more than Rs. 2000 (US$40). The per capitaper day income among users, is around Rs.49 orapproximately one US dollar. To put this in some context ,

8/6/2019 India: The Impact of Mobile Phones
http://slidepdf.com/reader/full/india-the-impact-of-mobile-phones 40/68
38
India: The Impact of Mobile Phones Moving the debate forward • The Policy Paper Series • Number 9 • January 2009
the monthly per capita poverty line for Delhi in 2004– 05 wasRs. 612 (US$1224), in West Bengal (the state where Kolkata islocated) was Rs. 449 and Gujarat (the state where Ahmedabadis located) was Rs.541 (US$10.81). Using these poverty lines– which are controversial as they are generally believed to
understate poverty considerably – and adjusting for ination,around 20% of non‑user households and 15% user householdsin our sample would be below the ofcial poverty line.
Table 2. Comparison of users and non-users
Percentage of Percentage of user households non-user
that are households that are
Highest level of education in household
Not literate 23% 33%
Literate withoutformal schooling 2% 3%
Literate but belowprimary 4% 7%
Primary 15% 18%
Middle 24% 20%
Secondary 19% 14%
Higher secondary 8% 4%
Diploma/Certicatecourse 1% 0%
Graduate 3% 1%
Post graduateand above 0.1% 0.0%
Total household earning(from roster) Rs. 6436 4377
Highest earning memberof the household Rs. 4283 3204
Average size of household 4.32 3.73
Castle
SC 28% 27%
ST 6% 9%
OBC 16% 17%
Others 51% 47%
It should also be noted the difference between the averageearnings of the highest earning members of user and non‑user households is around Rs.1000 (US$20) per month– half the difference between total earnings. This suggeststhat the differences in households’ size and earnings permember might also explain some of the disparities inhousehold earning. In fact, the per‑capita earnings betweenusers and non‑users differ by Rs. 317 (US$6.34) per month.Primary users on average earned over three times more thansecondary users and nearly 8 times the earnings of non‑users.
Consistent with the differential earnings, the literacy statusamong users is higher than that of non‑users. While 33%of non‑user households did not have a single memberwho was literate, only 23% of user households werecompletely illiterate.
The data also show a marked difference in average householdincome depending on the period over which a mobile phonehas been owned and used. For those households who havehad a mobile phone for over two years, average householdincomes was Rs.7289 (US$146) per month, for those who had
owned a phone for less that one year the average monthlyhousehold income was Rs.5566 (US$111) – almost 25% lower.
Users are more likely to be involved in self‑employed andregular wage activitiesHouseholds living in urban slums are typically engaged inmultiple economic activities and we nd evidence of this inour sample as well (Table 3). Among users, 42% of the totalactivities that households were involved in provided themwith regular wages while 36% were self‑employed activitiesand the rest were largely activities categorized as daily orcasual labour (21%). On the other hand, non‑users weremore likely to be engaged in daily or casual labour (33%) and
less likely to be engaged in self‑employed activities (27%).The proportion of regular wage activities carried out by usersand non‑users varied slightly between users and non‑users,(42% to 39%).
Table 3. Economic activities engaged in by type
Users Non-users
Self‑employed 36% 27%
Regular wage 42% 39%
Casual labour 21% 33%
The survey shows that for those households dependent
on either self employed incomes or casual labour thereare minimal differences between the user and non‑userpopulation (57% as opposed to 60%). However, a closerexamination shows a marked difference between the self employed household and the casual labour households– 36% of users are self employed whereas 27% on non‑usersare self employed. By their nature, self‑employed activities,which include work like running a shop, operating a publictransportation vehicle like a taxi or auto‑rickshaw, or beinga self‑employed professional like plumber or electrician, areones where mobile usage might be more productive andessential. Therefore, it seems that the type of employment
rather than the recent employment history (whetheremployed the previous week, as reported in Barrantes(2008)) of those surveyed are important determinantsof mobile usage.
Users and non‑users have different levels of networksof contactsThe survey results emphatically demonstrate that the primaryuse of a mobile still remains a device to connect with othersfor both economic and social purposes. Therefore, both thedecision to invest in a mobile and the value derived fromit are likely to depend on the others in the respondents’economic and social networks – the network externality.
The survey results reported in Table 4 suggests that usersand non‑users in some sense inhabit different networks withusers much more likely to be in networks with higher mobileusage. While 63% of users said that most or all of the peoplewho they usually need to talk to for work related purposes
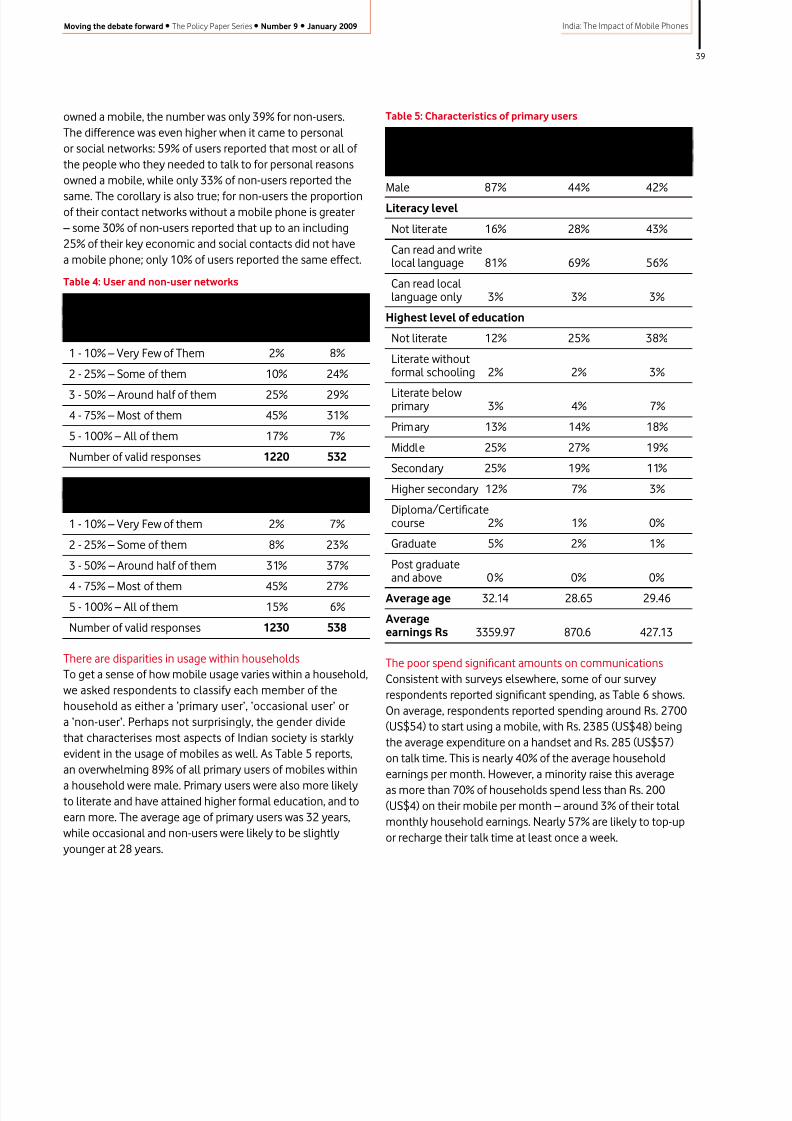
8/6/2019 India: The Impact of Mobile Phones
http://slidepdf.com/reader/full/india-the-impact-of-mobile-phones 41/68
39
India: The Impact of Mobile PhonesMoving the debate forward • The Policy Paper Series • Number 9 • January 2009
owned a mobile, the number was only 39% for non‑users.The difference was even higher when it came to personalor social networks: 59% of users reported that most or all of the people who they needed to talk to for personal reasonsowned a mobile, while only 33% of non‑users reported the
same. The corollary is also true; for non‑users the proportionof their contact networks without a mobile phone is greater– some 30% of non‑users reported that up to an including25% of their key economic and social contacts did not havea mobile phone; only 10% of users reported the same effect.
Table 4: User and non-user networks
What proportion of people to whomyou usually need to talk for workrelated purposes have a mobile? User Non-user
1 ‑ 10% – Very Few of Them 2% 8%
2 ‑ 25% – Some of them 10% 24%
3 ‑ 50% – Around half of them 25% 29%4 ‑ 75% – Most of them 45% 31%
5 ‑ 100% – All of them 17% 7%
Number of valid responses 1220 532
What proportion of your friends/relatives have a mobile phone?
1 ‑ 10% – Very Few of them 2% 7%
2 ‑ 25% – Some of them 8% 23%
3 ‑ 50% – Around half of them 31% 37%
4 ‑ 75% – Most of them 45% 27%5 ‑ 100% – All of them 15% 6%
Number of valid responses 1230 538
There are disparities in usage within householdsTo get a sense of how mobile usage varies within a household,we asked respondents to classify each member of thehousehold as either a ‘primary user’, ‘occasional user’ ora ‘non‑user‘. Perhaps not surprisingly, the gender dividethat characterises most aspects of Indian society is starklyevident in the usage of mobiles as well. As Table 5 reports,an overwhelming 89% of all primary users of mobiles within
a household were male. Primary users were also more likelyto literate and have attained higher formal education, and toearn more. The average age of primary users was 32 years,while occasional and non‑users were likely to be slightly
younger at 28 years.
Table 5: Characteristics of primary users
Percentage of Percentage of Percentageprimary users secondary of non-users
that are users that are that are
Male 87% 44% 42%
Literacy level
Not literate 16% 28% 43%
Can read and writelocal language 81% 69% 56%
Can read locallanguage only 3% 3% 3%
Highest level of education
Not literate 12% 25% 38%
Literate withoutformal schooling 2% 2% 3%
Literate belowprimary 3% 4% 7%
Primary 13% 14% 18%
Middle 25% 27% 19%
Secondary 25% 19% 11%
Higher secondary 12% 7% 3%
Diploma/Certicatecourse 2% 1% 0%
Graduate 5% 2% 1%
Post graduateand above 0% 0% 0%
Average age 32.14 28.65 29.46
Averageearnings Rs 3359.97 870.6 427.13
The poor spend signicant amounts on communicationsConsistent with surveys elsewhere, some of our surveyrespondents reported signicant spending, as Table 6 shows.On average, respondents reported spending around Rs. 2700(US$54) to start using a mobile, with Rs. 2385 (US$48) beingthe average expenditure on a handset and Rs. 285 (US$57)on talk time. This is nearly 40% of the average householdearnings per month. However, a minority raise this average
as more than 70% of households spend less than Rs. 200(US$4) on their mobile per month – around 3% of their totalmonthly household earnings. Nearly 57% are likely to top‑upor recharge their talk time at least once a week.

8/6/2019 India: The Impact of Mobile Phones
http://slidepdf.com/reader/full/india-the-impact-of-mobile-phones 42/68
40
India: The Impact of Mobile Phones Moving the debate forward • The Policy Paper Series • Number 9 • January 2009
Table 6: Spending on mobile
Expenditure when started Allusing a mobile
Average Cost of Handset (Rs) 2384.16
Average Cost of SIM/Talk time (Rs) 285.56
Expenditure per Month Percentage of householdson Mobile (Rs) picking this option
<50 11%
50–100 24%
100–150 20%
150–200 17%
200–250 11%
250–300 9%
>300 9%
Frequency of Topping Up
Once a week 59%
Once a month 37%
Once in 2 months 2%
Once in 3–6 months 1%
Once in 6 months or more 0%
Usage of mobiles
Mobiles are used primarily for workMobiles are primarily used for work and social purposes and tosome extent for emergencies; respondents found little use of them for entertainment, playing games or as an informationdevice. Nearly 60% of the user households reported highestor high use for work related use, while nearly 51% reportedhighest or high use for social interaction (talking to friendsrelatives in a non‑work related context). The primacy of theuse of mobile for work over social interaction is also reectedin the usage score that gives the weighted average over a 6point scale (0–5), though the difference is small. Further, 24%of user households reported highest use of mobile for work,
while only 19% have rated social interaction as the primaryuse. This differs from some survey results elsewhere whichreport social purposes as the principal use of mobiles, butthere are many possible explanations in either the contextor survey design which might explain this difference.
Table 7: Primacy of use
All
1-Social (Talking to friends and relatives for non-work)
Not used 5%
Lowest 5%
Low 7%
Neither low nor high 31%
High 32%
Highest 19%
Table 7: Primacy of use continued
All
2 - Work-related
Not used 8%
Lowest 6%
Low 6%
Neither low nor high 20%
High 36%
Highest 24%
3 - Entertainment
Not used 50%
Lowest 17%
Low 15%
Neither low nor high 12%High 5%
Highest 1%
4 - Information/News
Not used 64%
Lowest 14%
Low 9%
Neither low nor high 8%
High 5%
Highest 0%
5 - Playing games
Not used 54%
Lowest 18%
Low 17%
Neither low nor high 8%
High 3%
Highest 0%
6 - Emergency
Not used 18%
Lowest 39%Low 10%
Neither low nor high 13%
High 14%
Highest 6%
7 - Others
Not used 60%
Lowest 7%
Low 9%
Neither low nor high 15%
High 8%
Highest 1%
Number of valid responses 1230

8/6/2019 India: The Impact of Mobile Phones
http://slidepdf.com/reader/full/india-the-impact-of-mobile-phones 43/68
41
India: The Impact of Mobile PhonesMoving the debate forward • The Policy Paper Series • Number 9 • January 2009
Table 8: Primary use of mobile
Highest use
Social (Talking to friends andrelatives for non‑work) 19%
Work‑related 24%Entertainment 1%
Information/News 0%
Playing games 0%
Emergency 6%
Others 1%
Mobiles are used to maintain both ‘strong’ and ‘weak ties’Table 9 shows the usage patterns of user households in termsof frequency of use, calls to household members when atwork, friends and relatives living in the same city, friends
and relatives living in a different city, acquaintances, workrelated and emergencies. This information was gatheredto understand the primary driver of usage and the possibleconsequences on communication patterns. Reecting therelatively greater focus on work‑related use of mobiles, 38% of user households used the mobiles for work everyday, followedby calls to household members at work (21%), relatives andfriends staying in the same city (11%). A small proportion (6%)called their friends and relatives living in different city daily.A large proportion (80%) called their friends and relativesliving in the same city once or twice a week (46%) or once or
twice a month (34%), with a weekly frequency being lowerfor those friends and relatives living in different city (35% foronce or twice a week and 42 % for once or twice a month).The frequency of calling acquaintances once or twice aweek (35%) compared signicantly with the calling pattern
for friends and relatives living in different cities. The usagepatterns indicate that while work related calls are signicant,a substantial percentage of user households (35%) make callsonce or twice a month to their friends and relatives living indifferent cities, towns, villages and acquaintances.
These results indicate that mobiles are used to maintain bothtypes of ties identied in the sociological literature – ‘strong’ties such as close family members and friends and ‘weak’ tiessuch as contacts who might be useful for nding work forexample. However, in our survey the use of mobiles is heavierfor work‑purposes, as noted above.
Mobiles are used occasionally for emergencies
Only 20% of the user households rated highest or high useof mobiles for emergencies, reected in relatively low usagescore for emergency (1.82), as is the percentage score forhighest or high use for emergencies. This could be becauseemergencies do not occur often, leading to low usage foremergencies. Nearly 11% of user households reported usingthe mobile for emergencies on a daily basis. Although thisnumber appears to be high, we feel it could also be becauserespondents might have interpreted it to mean somethingimportant or to be done quickly.
Table 9: Usage patterns
Valid responses = 1234 Every day Once or Once or twice Once or Once Nevertwice a week a month twice every a year
few months
1 ‑ Household members Calls 21% 36% 22% 4% 0% 18%when at work Missed Calls 7% 16% 13% 1% 0% 62%
SMS 1% 3% 5% 0% 0% 91%
2 ‑ Relatives/friends living Calls 11% 46% 34% 7% 0% 2%in the same city Missed Calls 13% 29% 19% 4% 0% 34%
SMS 3% 10% 9% 2% 0% 76%
3 ‑ Relatives/friends living Calls 6% 35% 42% 12% 1% 4%in different city/town/ Missed Calls 7% 23% 22% 5% 0% 42%village SMS 1% 6% 8% 3% 0% 82%
4 ‑ Acquaintances Calls 9% 35% 29% 14% 1% 12%Missed Calls 5% 23% 19% 4% 0% 49%SMS 2% 4% 8% 4% 0% 82%
5 ‑ Work related Calls 38% 32% 16% 6% 0% 8%Missed Calls 11% 19% 12% 2% 0% 57%SMS 2% 4% 3% 1% 0% 89%
6 ‑ Emergency Calls 11% 10% 14% 26% 28% 12%Missed Calls 0% 3% 5% 2% 1% 89%SMS 0% 1% 1% 1% 0% 96%

8/6/2019 India: The Impact of Mobile Phones
http://slidepdf.com/reader/full/india-the-impact-of-mobile-phones 44/68
42
India: The Impact of Mobile Phones Moving the debate forward • The Policy Paper Series • Number 9 • January 2009
Table 10: Usage scores by purpose
Purpose Average usage score
Social (Talking to friends andrelatives for non‑work) 3.37
Work‑related 3.42Entertainment 1.07
Information/News 0.76
Playing games 0.89
Emergency 1.82
Others 1.06
Note: Average usage score is calculated by giving a score of 0 if the user stated that
s/he did not use the mobile at all for the identied purpose and a score 5 if the user
stated that it was the mos t important use of the mobile for him or her.
Most respondents use mobiles for productive purposesAs Table 7 above shows, only a small proportion of user
households have rated highest or high use for entertainment,information, news and playing games (6%, 5% and 3%). In linewith this, we nd that only 2% of the user households haveused the mobile for participating in contests on television orradio. Only 25% of user households had subscribed to anyadditional service. Of those that had subscribed ( Table 11),nearly 94% subscribe to caller tunes/ring tones, with the nexthighest usage being for Sports (12%), followed by Jokes, Newsand Horoscope updates at (8%, 6% and 2%).
Table 11: Usage of subscription services
Subscription to any service All
Ring tones/ Caller tunes 94%News updates 6%
Jokes 8%
Sports updates 12%
Horoscope updates 2%
Number of valid responses 309
Nearly 29% of user households have used mobiles forcontacting doctors and 21% for contacting a person workingin the government or a government ofce. The relativelyhigher use for contacting doctors possibly reects the fact
that calling a doctor is seldom discretionary.Table 12: Percentage using mobile to contact:
Doctor 29%
Government person/ofce 21%
Contests on television/radio 2%
Number of valid responses 1217
SMS is a low usage serviceThe usage of SMS may partly be driven by the level of comfort
people have in sending and receiving the messages. Lackof or weak literacy is an obvious barrier. Other factors thatdrive usage may be the relative cost vis‑à‑vis voice calls andnature of communication supported by SMS (asynchronous,a number of messages required for conrmation). In order
to assess one of these dimensions, respondents were askedtheir relative comfort in sending and receiving SMS (Table13). A large propor tion (45%) of user households were notcomfortable in either receiving or sending SMS, while 36%were comfortable in both receiving or sending SMS and 19%
were comfortable in receiving but not in sending SMS.Table 13: SMS usage
1‑Not comfortable with either sendingor receiving SMS 45%
2‑Comfortable with both sending andreceiving SMS 36%
3‑Comfortable with receiving SMS but notcomfortable sending SMS 19%
Number of valid responses 1234
Nearly 96% of user households indicated they never usedSMS in emergencies, 91% never sent an SMS to householdmembers when at work and 89% never used SMS for work.However, 19% of user households had used SMS once or twicea month or more for contacting relatives and friends stayingin the same city, and 14% had done the same for friends andrelatives living in different city. For acquaintances, the numberwas 12%. This indicates that SMS is used more to keep intouch with the not so immediate circle of relationships.For the immediate family, SMS is rarely used.
Mobiles change ways of workingResponses reported in Table 14 indicate that mobiles change
how people conduct their economic activities and do so inways that are likely to increase the economic value of theirwork. We nd rather strong evidence that mobiles improvethe ability of people to plan, co‑ordinate and search forbetter prices or lower costs. Over 70% of users for whom thequestion was applicable report that mobiles have improvedtheir ability to plan and co‑ordinate with people they workwith. Similarly, while 43% of non‑user households rarelyor never plan and co‑ordinate with their customers andsuppliers, around 80% of user households use their mobilesfor such planning and co‑ordination at least sometimes.
The fact that mobiles confer a distinct advantage over public
telephone booths is evident from the fact that while 35% of users report using the mobile to nd new or better work eithermost of the times or always, and 26% of non‑users reportusing telephone booths to do the same.
Mobiles also seem to enable some users to do their work overa larger geographical area. For example, while 40% of usersstate that there has been no change in the geographical area(as measured by distance from home) over which they dowork, 46% report that their mobile usage has either increasedthe area somewhat or a lot. The contrast with non‑users,of whom only 18% report an increase over the prior year,provides suggestive evidence for the hypothesis that mobiles
help poor people overcome or lower the transaction costs of doing business beyond their immediate vicinity.

8/6/2019 India: The Impact of Mobile Phones
http://slidepdf.com/reader/full/india-the-impact-of-mobile-phones 45/68
43
India: The Impact of Mobile PhonesMoving the debate forward • The Policy Paper Series • Number 9 • January 2009
Table 14: Effects on work practices
Check/conrm prices of variousmaterials from suppliers Users Non-users
Never 11% 25%
Rarely 10% 10%Sometimes 44% 44%
Most of the time 29% 18%
Always 6% 4%
Number of valid responses 384 108
Plan and coordinate with customers & suppliers
Never 8% 23%
Rarely 12% 20%
Sometimes 42% 35%
Most of the time 30% 20%
Always 7% 2%
Number of valid responses 433 120
Trying to nd work/improve work
Never 15% 22%
Rarely 15% 19%
Sometimes 35% 34%
Most of the time 29% 23%
Always 6% 3%
Number of valid responses 889 355
Geographical area (distance from home)where you do work
Decreased a lot ‑ 1%
Decreased somewhat ‑ 9%
No change 46% 67%
Increased somewhat 37% 21%
Increased a lot 17% 1%
Number of valid responses 1065 434
Ability to plan and co-ordinate withpeople you work with
Decreased a lot ‑ 2%Decreased somewhat ‑ 8%
No change 28% 52%
Increased somewhat 51% 36%
Increased a lot 20% 2%
Number of valid responses 1025 414
One of the striking ways in which mobiles appear to inuencework practices is the ability of users to nd work or jobsdirectly and without intermediaries. While only 39% of respondents say that their primary source of nding jobs or
work was direct contact with the customer prior to using amobile, 62% of respondents are now able to avoid the use of contractors or middlemen and no longer depend on personalfriends and relatives. The nding is signicant given that athird party intermediary still forms the primary source for 42%of non‑users compared to 15% of users.
Mobiles decrease transactions costs of work andincrease efciencyFor use of mobiles to actually translate to higher earnings orincome, the change in practices documented above shouldtranslate into either higher productivity, lower costs or higher
returns or some combination of all three. We nd someevidence for all three and report these in Table 15.
Table 15: Reported work benets
Users Non-users
Travel related expenditure
Decreased a lot 14% 3%
Decreased somewhat 51% 24%
No Change 35% 53%
Increased somewhat ‑ 19%
Increased a lot ‑ 2%
Number of valid responses 1208 512
Time taken to do work
Decreased a lot 15% 2%
Decreased somewhat 37% 14%
No Change 48% 66%
Increased somewhat ‑ 15%
Increased a lot ‑ 2%
Number of valid responses 1163 499
Wastage of unsold stock
Decreased a lot 17% 2%Decreased somewhat 52% 18%
No Change 31% 66%
Increased somewhat ‑ 15%
Increased a lot ‑ 0%
Number of valid responses 326 164
Money tied up in stocks/inventory
Decreased a lot 15% 1%
Decreased somewhat 52% 16%
No Change 33% 69%
Increased somewhat ‑ 14%
Increased a lot ‑ 1%
Number of valid responses 317 154
Time to procure materials/provide services
Decreased a lot 13% 2%
Decreased somewhat 38% 13%
No change 48% 73%
Increased somewhat ‑ 11%
Increased a lot ‑ 0%
Number of valid responses 600 230

8/6/2019 India: The Impact of Mobile Phones
http://slidepdf.com/reader/full/india-the-impact-of-mobile-phones 46/68
44
India: The Impact of Mobile Phones Moving the debate forward • The Policy Paper Series • Number 9 • January 2009
Table 15: Reported work benets continued
Users Non-users
Cost of procurement/providing the service
Decreased a lot 9% 3%
Decreased somewhat 35% 13%
No change 56% 66%
Increased somewhat ‑ 17%
Increased a lot ‑ 1%
Number of valid responses 611 247
Wages for your self, prices for the productsor services you sell
Decreased a lot ‑ 3%
Decreased somewhat ‑ 12%
No change 42% 52%
Increased somewhat 48% 30%
Increased a lot 10% 2%
Number of valid responses 867 315
Access to existing suppliers/service users/customers/place of work
Decreased a lot ‑ 1%
Decreased somewhat ‑ 12%
No change 40% 65%
Increased somewhat 45% 22%
Increased a lot 15% 1%
Number of valid responses 850 340
Finding new suppliers/service users/customers/place of work
Decreased a lot ‑ 2%
Decreased somewhat ‑ 10%
No change 40% 66%
Increased somewhat 45% 20%
Increased a lot 15% 2%
Number of valid responses 847 353
Access to sources of credit Decreased a lot ‑ 1%
Decreased somewhat ‑ 11%
No change 43% 59%
Increased somewhat 45% 29%
Increased a lot 12% 0%
Number of valid responses 844 350
Around 65% of users report that their travel costs havedecreased as a result of owning a mobile. A similar proportionof users for whom the question was relevant report a
reduction in wastage of unsold stock and a decrease in themoney tied up in stocks/inventories as a result of using amobile. Assuming that easier access to credit translates intoreduction in costs, around 57% of users also associate their
usage of mobiles with increased access to sources of credit.Although much larger than the proportion (15%) of non‑userswho report a similar decrease in the year gone by, only abouthalf the users report that there has been a decrease in thetime it takes to procure goods or provide services. Most of the
rest of the users reported no change.Mobiles increase prices received or wages and increase thenumber of new customers/suppliersAccompanying the reduction in costs, around 58% of usersstate that their wages or prices for the products of servicesthey sell have increased because of mobiles. Mobiles havenot only increased access to existing suppliers/services/customers/place of work, with 60% of respondents reportingan improvement, but also enabled a proportion of users tond new ones.
Mobiles are associated with improved economic status forthe poor
Given the results reported in the previous two tables,increased efciencies, lowered costs and higher returns, itis not surprising that a majority of users believe that theireconomic status has improved because of owning a mobile(see Table 16).
Table 16: Impact of mobile use on overall economic situation
Overall, how has the mobileaffected your economic status? All
Made things worse 0%
No effect 40%
Made things somewhat better 48%
Made things a lot better 12%
Number of Valid Responses 1233
Around 60% of users state that mobiles have made thingseither somewhat (48%) or a lot bet ter (12%). Given thecomplex constraints that bind the upward economicmobility of the poor, we feel that this result should not beunderestimated. To get a sense of these constraints, we alsoasked non‑users how their economic status has changed overthe last year and report these in Table 17.
Table 17: Change in economic status in past year
Overall, how has economicstatus of your householdchanged over the last year? Users Non-users
Worsened a lot 0% 2%
Worsened somewhat 3% 8%
No change 37% 59%
Improved somewhat 47% 28%
Improved it a lot 13% 4%
Number of Valid Responses 1234 538
Only 28% report that it had improved somewhat, while 4% statethat it has improved or a lot. When asked the same question,60% of users report an improvement, of which 13% said thattheir economic status had improved a lot over the last year.

8/6/2019 India: The Impact of Mobile Phones
http://slidepdf.com/reader/full/india-the-impact-of-mobile-phones 47/68
45
India: The Impact of Mobile PhonesMoving the debate forward • The Policy Paper Series • Number 9 • January 2009
To get a further sense of who is impacted and what type of activities are likely to be affected more by mobiles, we askedusers to report their perceptions of how different economicactivities they engage in were affected by mobiles (Table18). Self‑employed activities were also the most likely
to be positively impacted by mobiles, with nearly 61% of self‑employed activities positively impacted as opposedto 45% of daily/casual labor activities. The least impactedwere regular wage activities with only 36% being reportedto be positively impacted.
As described earlier, it is possible that some of this differencein the change of economic status might be attributable toother characteristics that distinguish users and non‑users.Indeed, since 36% of users started using a mobile withinthe last year, it is possible that mobile usage could be aresult of improved economic status and not a cause for it.
While acknowledging the possibility that our results capturethis kind of correlation, we believe the evidence of a positiveassociation between improved economic status and mobileusage has to be interpreted along with the other ndingsdescribed above that demonstrate how mobiles do affect theway people do their work, where they do it, at what cost andthe economic returns from it.
Mobiles change the level and nature of social interactionPrior work on the social impact of mobiles has tried toinvestigate not only the impact of mobiles on socialrelationships but also the way mobiles transform howpeople interact with each other and institutions like the
family and government. Although many possible routes forimpacts to occur have been hypothesized, few have beenempirically investigated. Users in our survey were asked howmobiles have affected their knowledge of the welfare andwhereabouts of the people they interact with socially. As asource of comparison, non‑users were asked to evaluate thesame over the last year and the average of their responses isreported in Table 19. Around 75% of mobile users repor t thatthey believe the mobile has increased their knowledge of welfare and whereabouts of friends and relatives. And thiswas true for friends and relatives living both in the same cityas well as those living outside it. In contrast, only around
35% of non‑users reported that they were more aware incomparison to a year ago.
Table 18: Mobile impact on different activities
Proportion of Percentage of Percentage of Percentage of Percentage of total household households households stating households households stating
activity accounted stating it to be activity positively stating activity activity not for by: primary activity impacted negatively impacted impacted
by mobile by mobile by mobile
Self Employment 36% 42% 60% 3% 37%
Regular wage 42% 39% 34% 2% 64%
Daily/Casual Labour 21% 19% 44% 1% 55%
Other 1% 0% 11% 0% 89%
100% 100%
Table 19: Social impacts
Users Non-users
1 - Your knowledge of welfare and whereaboutsof friends & relatives in same city?
Decreased a lot 1% 1%
Decreased somewhat 4% 5%
No change 19% 58%
Increased somewhat 61% 34%
Increased a lot 14% 3%
2 - Your knowledge of welfare and whereaboutsof friends & relatives outside city?
Decreased a lot 1% 1%
Decreased somewhat 4% 14%
No change 20% 54%
Increased somewhat 56% 26%
Increased a lot 19% 5%
3 - The frequency of meeting youracquaintances/distant relatives?
Decreased a lot 10% 4%
Decreased somewhat 31% 21%
No change 33% 54%
Increased somewhat 22% 18%
Increased a lot 4% 4%
Selling metalware in Rajasthan

8/6/2019 India: The Impact of Mobile Phones
http://slidepdf.com/reader/full/india-the-impact-of-mobile-phones 48/68
46
India: The Impact of Mobile Phones Moving the debate forward • The Policy Paper Series • Number 9 • January 2009
Table 19: Social impacts continued
Users Non-users
4 - The frequency of meeting yourimmediate family/friends?
Decreased a lot 6% 5%Decreased somewhat 34% 19%
No change 27% 51%
Increased somewhat 26% 19%
Increased a lot 6% 5%
5 - Number of people who you canturn to in case of emergency?
Decreased a lot 1% 3%
Decreased somewhat 4% 9%
No change 34% 58%
Increased somewhat 47% 24%Increased a lot 14% 6%
6 - Number of people who can help inimproving your current ability to earn?
Decreased a lot 1% 2%
Decreased somewhat 3% 7%
No change 37% 58%
Increased somewhat 50% 26%
Increased a lot 9% 7%
Number of valid responses 1232 539
Interestingly this rise in knowledge of the welfare of friendsand relatives among users seems to be accompanied by aslight decrease in the frequency with which they actuallymeet: 43% of users reported a decrease in the frequencywith which they met acquaintances and distant relatives as aresult of owning a mobile while 25% of non‑users reported asimilar decline over the previous year. Similarly, 42% of usersreported a decrease in the frequency of meeting immediatefriends and family and attribute this change to using mobilesand only 31% reported an increase. On the other hand, 24%of non‑users reported a decrease in the frequency of theirmeeting while 26% reported an increase.
What are the barriers to usage of mobiles?Despite the rapid fall in handset prices, more than 50% of respondents who do not currently use a mobile identify thecost of a handset as the primary barrier to owning a mobilein the urban slums and nearly 90% state it as one of the topthree reasons in Table 20. While 67% of non‑users also reportthe cost of calls among the top three reasons, only 15% statethat it is the primary reason why they do not use a mobile.Interestingly, about the same number report difculty in usinga mobile as the primary reason why they do not use a mobileand nearly half the non‑users identify it among the top threereasons. The need for improvement in the design of handsets,clarity of charges for call‑plans and information disseminationis evident from the fact that more than one in four non‑userhouseholds were likely to report difculty in understandingcharges or call plans and not enough knowledge about valueof mobiles were important barriers to their usage of mobiles.
Table 20: Barriers to mobile usage
Percentage of Percentage of non-users picking non-users
it among top picking it asthree reasons primary reason
1 ‑ Cost of handset 87.3% 53.2%
2 ‑ Cost of calls 68.9% 15.5%
3 - Difculty in using mobile 53.8% 13.8%
4 - Difculty in understandingcharges/call plans 26.0% 3.1%
5 ‑ Not enough knowledgeabout value of mobile 28.8% 4.9%
6 ‑ Others, describe 5.6% 3.0%
We also asked users to describe the two most importantfactors that would enable them to derive more value from
mobiles and report these in Table 21. Not too surprisingly,reduction in call charges – local (59%) and long distance(40%) – gured most often. Interestingly, nearly 40% of respondents reported that reduction in handset costs asamong the top two reasons that would increase the benetthey get from mobile phones. Only 2% of respondentsdescribed the provision of increased services like mobilebanking or accessing government information. We believe thishas to be interpreted carefully since the question was openended and given the near absence of such services in India,users are unlikely to know of the potential of such services.
Table 21: Factors that would enhance value of mobiles
Percentage of userspicking amongtop two factors
Reduction in handset cost 38%
Increased affordability for handsetswith advanced features 15%
Reduction in local call charges 59%
Reduction in long distance charges 38%
Reduction in SMS charges 6%
Availability of SMS in languagesother than English 3%
Increased services like mobile banking,accessing government information 2%
Better coverage 19%
Number of valid responses 1366
Has the value derived changed over time?As reported in Table 22, nearly 50% of respondents have useda mobile for around a year or less and around 27% had beenusing it for more than two years. When asked to comparehow the value they derive f rom mobile has changed overtime, most respondents said that the value derived had eitherincreased a little or a lot. Users who had used a mobile for
the longest were the most likely to report that the valuethey derive had increased a lot, with one out of every fourrespondent who had owned a mobile for more than two
years reporting the same.
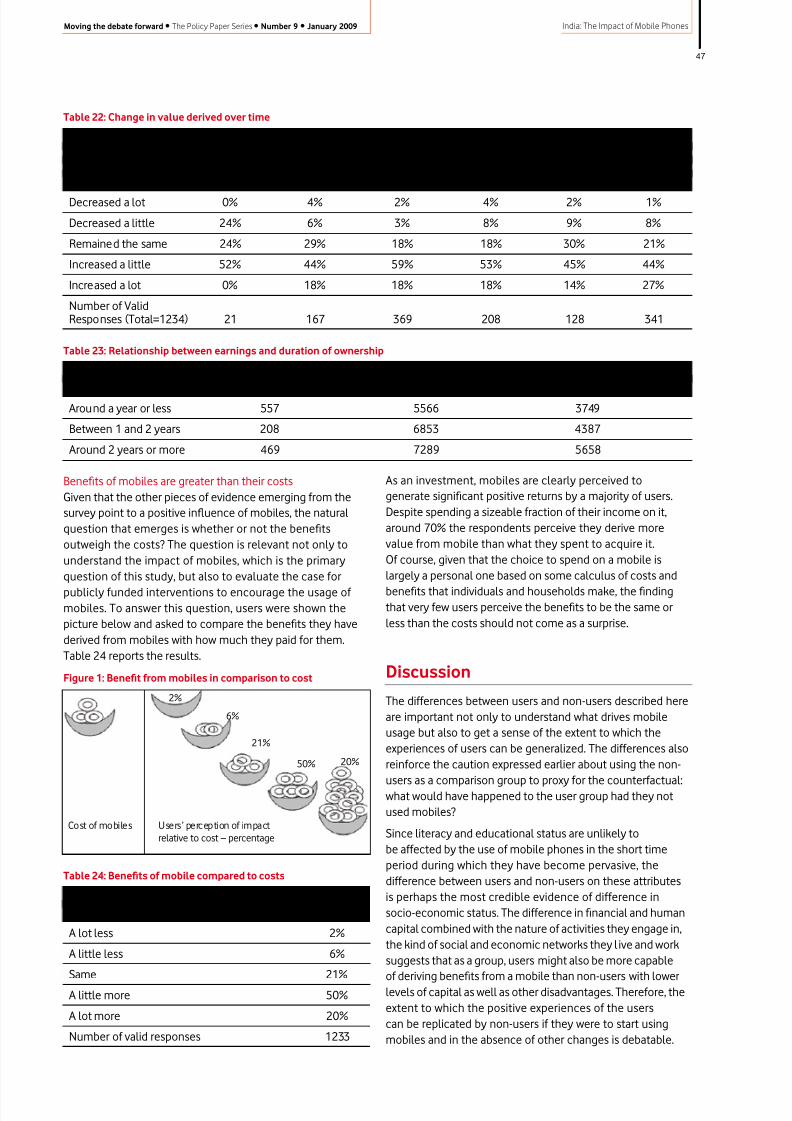
8/6/2019 India: The Impact of Mobile Phones
http://slidepdf.com/reader/full/india-the-impact-of-mobile-phones 49/68
47
India: The Impact of Mobile PhonesMoving the debate forward • The Policy Paper Series • Number 9 • January 2009
Table 22: Change in value derived over time
Value derived from For last For few For around For more For around For moremobile phones now month months a year than one year 2 years than 2 yearscompared to when and less thanstarted using it 2 years
Decreased a lot 0% 4% 2% 4% 2% 1%
Decreased a little 24% 6% 3% 8% 9% 8%
Remained the same 24% 29% 18% 18% 30% 21%
Increased a little 52% 44% 59% 53% 45% 44%
Increased a lot 0% 18% 18% 18% 14% 27%
Number of ValidResponses (Total=1234) 21 167 369 208 128 341
Table 23: Relationship between earnings and duration of ownership
Duration of ownership Number of users Average household Standard deviation
earnings per month Rs (household earnings) RsAround a year or less 557 5566 3749
Between 1 and 2 years 208 6853 4387
Around 2 years or more 469 7289 5658
As an investment, mobiles are clearly perceived togenerate signicant positive returns by a majority of users.Despite spending a sizeable fraction of their income on it,around 70% the respondents perceive they derive morevalue from mobile than what they spent to acquire it.Of course, given that the choice to spend on a mobile islargely a personal one based on some calculus of costs and
benets that individuals and households make, the ndingthat very few users perceive the benets to be the same orless than the costs should not come as a surprise.
Discussion
The differences between users and non‑users described hereare important not only to understand what drives mobileusage but also to get a sense of the extent to which theexperiences of users can be generalized. The differences alsoreinforce the caution expressed earlier about using the non‑
users as a comparison group to proxy for the counterfactual:what would have happened to the user group had they notused mobiles?
Since literacy and educational status are unlikely tobe affected by the use of mobile phones in the short timeperiod during which they have become pervasive, thedifference between users and non‑users on these attributesis perhaps the most credible evidence of difference insocio-economic status. The difference in nancial and humancapital combined with the nature of activities they engage in,the kind of social and economic networks they l ive and worksuggests that as a group, users might also be more capable
of deriving benets from a mobile than non-users with lowerlevels of capital as well as other disadvantages. Therefore, theextent to which the positive experiences of the userscan be replicated by non‑users if they were to start usingmobiles and in the absence of other changes is debatable.
Benets of mobiles are greater than their costsGiven that the other pieces of evidence emerging from thesurvey point to a positive inuence of mobiles, the naturalquestion that emerges is whether or not the benetsoutweigh the costs? The question is relevant not only tounderstand the impact of mobiles, which is the primaryquestion of this study, but also to evaluate the case for
publicly funded interventions to encourage the usage of mobiles. To answer this question, users were shown thepicture below and asked to compare the benets they havederived from mobiles with how much they paid for them.Table 24 reports the results.
Figure 1: Benet from mobiles in comparison to cost
Table 24: Benets of mobile compared to costs
Value derived from mobile phonecompared to payment for it Users
A lot less 2%
A little less 6%
Same 21%
A little more 50%
A lot more 20%
Number of valid responses 1233
Cost of mobiles Users’ perception of impact
relative to cost – percentage
2%
6%
21%
20%50%

8/6/2019 India: The Impact of Mobile Phones
http://slidepdf.com/reader/full/india-the-impact-of-mobile-phones 50/68
48
India: The Impact of Mobile Phones Moving the debate forward • The Policy Paper Series • Number 9 • January 2009
This thought is consistent with ndings from previous studiesthat suggest mobiles are valued by those who are alreadymore educated and those belonging to middle or highersocio-economic groups because of the economic benetsthey provide. This might also be because these groups are
able to take advantage of the efciency gains for greaterincome generation or exploit new information to generatenew opportunities or save expenditure. On the other hand,it may be difcult for the people who are not so well off oreducated to understand how these links work or exploit them.If individuals do not perceive economic benets, they are lesslikely to adopt and use mobile services, as for them the costof service may outweigh the perceived economic benets(Zainudeen et.al., 2007; Souter et.al., 2005).
A possible limitation of our study is that we do not try toquantify the magnitude of the impacts we could identify.For example, we do not try to put a number on the cost
reductions or earnings improvement because of mobiles.Instead we leave it to the respondent to report theirperceptions of changes either as a result of mobiles (users)or over the last year (non‑users). By eschewing an attemptto quantify the costs and benets we are consistent withmost of the other work estimating the impact of mobiles.We do recognise that having a more precise measure of theeconomic benet of owning a mobile would indeed be usefulfor policy makers to evaluate the benets of programs orpolicies that promote mobile use and ownership v is‑à‑visboth the costs of the program and in comparison to othercomparable interventions. However, we are sceptical aboutthe weight that could be put on a more numerically preciseset of results.
Conclusions
Taking the reports of impacts from mobile users in urbanslums in India and comparing them with the experience of non-users, we nd that:
• Mobile users in urban slums experience positive changes inboth their economic situation and their ability to maintainsocial ties, and in their self‑reports attribute these to theuse of mobile phones.
• Mobiles appear to decrease the transactions costsof work and increase its efciency. In particular, theyare able to benet signicantly users engaged in self-employed activities.
• Mobiles are changing how residents in the slum areasinteract with each other socially and in particular mightdecrease physical contact and substitute it with more‘virtual’ contact.
• Mobiles are much more likely to be used by malesthan by females within households. Therefore there isa reinforcement of disparities that characterise many
other resource allocation decisions both within andoutside households.
• Households that use mobiles differ from those that donot in signicant ways including earnings, household size,education and literacy status as well as the economic andsocial networks in which they live and work.
These nding clearly express the economic and social
signicance of mobile use in urban slums and the emphaticuse of the mobile as an essential tool to contemporary urbanlife. It is noteworthy that the interplay between existing levelsof income, economic activity and the use of mobile createsa virtuous cycle allowing households to edge their way frompoverty. We know that the majority of users substantiallyvalue the benets of mobile ownership over the costs of ownership and that over time mobile phone costs are beinglowered and income benets for households are growing.However, the survey also reveals that some households areunable to break into this virtuous cycle – in part this barrierappears to be related to income, issues of affordability and
deeper questions over the value of (and the perception of) thepositive network economic effects that would tip increasingnumber of households into the user communities.
Given these ndings, there is a need to evaluate thosepublic policy measures which address issues of access andaffordability of mobile telecommunications services. The keyquestion to be addressed is whether such policies should betargeted towards to urban poor more than at present, andwhether current measures are adequate. Importantly thereview of the existing policy portfolio needs to focus not juston the incentive mechanism for individual households butalso the processes by which individual users can benet from
the extent to which others use mobiles as well – the networkexternalities or point of critical mass – and therefore drive upthe value to themselves of the use of mobile communications.
References
Abraham, J., Dean, D. & Subramanian, A. (2007).Ringing in the Next Billion Mobile Consumers, A Roadmap or
Accelerating Telecom Growth in India, A BCG Report.
Aker, J. C. (2008). Does Digital Divide or Provide? The Impact o
Cell Phones on Grain Markets in Niger. Job Market Paper.
Ambastha R. (2004). Linking Urban Poverty and Housing,Combat Law, 3(3).
Barrantes, R. (2008). Substitutions and Complementarities
in Telecom Services Use: A Case Study o the Peruvian
Urban Poor, 17th Biennial Conference of the InternationalTelecommunications Society, Montreal .
Barrantes, R. & Galperinb, H. (2008). Can the Poor Aord
Mobile Telephony? Telecommunications Policy, 32(8), 521–530
Chabossou, A., Stork, C., Stork, M. & Zahonogo, P. Mobile
Telephony Access & Usage in Arica. Retrieved December 9,2008 from www.researchICTafrica.net
Chandrasekhar, S & Mukhopadhyay, A. Multidimensions o Urban Poverty: Evidence rom India (2007). Indira Gandhi Instituteof Development Research, Mumbai. Working Paper:2007‑008.

8/6/2019 India: The Impact of Mobile Phones
http://slidepdf.com/reader/full/india-the-impact-of-mobile-phones 51/68
49
India: The Impact of Mobile PhonesMoving the debate forward • The Policy Paper Series • Number 9 • January 2009
Coyle, D. (2005). Overview, The Vodaone Policy Paper Series,
Number 3
De Melo, J. (2000). Telecommunications and the Poor.
Internal World Bank Report. Washington, DC: World Bank.
De Silva, H., Zainudeen, A. & Ratnadiwakara, D. (2008).Perceived Economic Benefts o Telecom Access at the Bottom o
the Pyramid in Emerging Asia, LIRNEasia.
Donner, J. (2005). The Mobile Behaviors o Kigali’s
Microentrepreneurs: Whom they call…and why. In Kristof Nyiri,ed., A Sense o Place. Vienna: Passagen Verlag
Forestier, E., Grace, J. & Kenny, C. (2002). Can Inormation and
Communication Technologies be Pro-poor? TelecommunicationsPolicy, 26(11), 623–646.
Garbacz, C. & Thompson, H. (2007). Demand or
Telecommunication Services in Developing Countries,
Telecommunications Policy, 31(5), 276–289
Goodman, J. (2005). Linking Mobile Phone Ownership and Use to
Social Capital in Rural South Arica and Tanzania, The VodafonePolicy Paper Series, Number 3.
Granovetter, M, “The Strength o Weak Ties”, American Journalof Sociology, 78 (1973), 160–1380
Hardy, A. P. (1980). ‘The Role o the Telephone in Economic
Development’, Telecommunications Policy, 4(4): 278–286.
Jensen, R. (2007). The Digital Provide: Inormation (Technology)
Market Perormance, and Welare in the South Indian Fisheries
Sector. The Quarterly Journal of Economics, CXXII (3), 879–924.
Lall, S. (2003). Employment Strategies or the Poor in India: Search or Sustainability, Working Paper 7, InternationalWorkshop on Integrated Urban Housing Development.
Loughhead, S., Mittal, O., Wood, G. (2001), Urban Poverty
and Vulnerability in India: DFID’s Experiences rom a Social Policy
Perspective, Department for International Development,London.
Mobile Phone Adoption in Developing Countries, RetrievedDecember 9, 2008 from http://www.wikinvest.com/concept/Mobile_Phone_Adoption_in_Developing_Countries
Norton, S. (1992). Transactions Costs, Telecommunications
and the Microeconomics o Macroeconomic Growth. EconomicDevelopment and Cultural Change, 41(1), 175–196.
Phillip, S. (2002). Social Capital, Local Networks and Community
Development, in Ed (Rakodi, C. & Lloyd‑Jones, T.), Urban
Livelihoods - A People-centred Approach to Reducing Poverty, Department for International Development, Chapter 8.
Roller, L. & Waverman, L. (2001). Telecommunications
Inrastructure and Economic Development: A Simultaneous
Approach. American Economic Review, 91(4), 909–23.
Samuel, J., Shah, N. & Hadingham, W. (2005). Mobile
Communications in South Arica, Tanzania and Egypt: Results rom
Community and Business Surveys, Africa: The Impact of Mobile
Phones, The Vodafone Policy Paper Series, Number 3.
Sood, A. (2006). The Mobile Development Report, The Socio-
Economic Dynamics o Mobile Communications in Rural Areas and
their Consequences or Development.
Souter, D., Scott, N., Garforth, C., Jain, R., Mascarenhas,
O. & McKemey, K. (2005). The Economic Impact o
Telecommunications on Rural Livelihoods and Poverty Reduction,
A study o rural communities in India (Gujarat), Mozambique and
Tanzania, Report of DFID KaR Project 8347.
Telecom Regulatory Authority of India, The Indian
Telecom Services Perormance Indicators April– June 2008. Retrieved December 9, 2008 from http://www.trai.gov.in/WriteReadData/trai/upload/Reports/44/report7oct08.pdf
Telecom Regulatory Authority of India. (2008) Measures to
improve Telecom Penetration in Rural India – The next 100 million
subscribers. Paper No 1/2008.
Waverman, L., Meschi, M. & Fuss, M. (2005). The Impact
o Telecoms on Economic Growth in Developing Countries, The Vodafone Policy Paper Series, Number 3
Wireless Unbound, The Surprising Economic Value and Untapped
Potential o the Mobile Phone, McKinsey & Company,December 2006
Zainudeen, A., Sivapragasam, N., De Silva, H., Iqbal, T. &
Ratnadiwakara, D. (2007). Teleuse at the Bottom o the Pyramid:
Findings rom a Five-Country Study, LIRNEasia
Lipton, Michael. (1977). Why poor people stay poor: urban bias
in world development, Cambridge: Harvard UP
Varshney, Ashutosh, (1988) Democracy, Development and the
Countryside, Cambridge University Press.
UN-Habitat http://www.unhabitat.org/categories.asp?catid=46). Accessed on 16th December, 2008
continued…
Notes
1 To understand their economic lives, we asked respondents to classify their
economic activities into three categories – self-employed, regular wage and
daily/casual labour. Self-employed refers to activities like owning and running
a shop, operating a rickshaw, providing a service (e.g. plumbers, car penters).
Regular wage refers to activities for which they are compensated on a regular
basis while working for others. Daily or casual labour refers to activities which are
done on temporary contracts and include manual labour and construction work.
2 Since users in developing countr ies are likely to share mobile phones within and
between households, one of the complexities that researchers in the developing
world have had to grapple with is dening and distinguishing between ownership
and usage. Unfortunately, there has been no consistent denition of what
constitutes a “user” in the existing literature. For example, (Zainudeen et.al., 2007)
denes a “user” to be someone who has had used either their own phone or
someone else’s – paid for or free of charge – during the preceding three months.So, even if a user had made a single call, then he/she would qualify to be a user.
In contrast, the study by Chabossou et.al.(2008) considers anyone above the age
of 16, who owns a phone or has an active SIM card as a user regardless of whether
s/he has been using the phone and all others as non-users. Samuel et.al. (2005)
denes anyone who has never owned or used a phone to be a non-user, unlike
the other two studies.
3 Rather surprisingly, most respondents who owned a mobile in our sample – own
one exclusively. Only in Kolkata did 17 % of “users” not own a mobile but reported
using one. However, this might have also been a consequence of the way data
investigators screened households. Therefore, we might instead be looking at a
comparison between owners and non-owners.
4 The Indian constitution explicitly denes and makes provision for historically
disadvantaged groups labelled as Scheduled Castes (SC), Scheduled Tribes (ST)
and Other Backward Classes (OBC).
5 We acknowledge that whether or not a change qualied by the word “somewhat”
is large enough to be meaningful is debatable. However, since respondents weregiven the option of “No Change”, we conjecture that even when respondents
pick a response such as “ Increased Somewhat”, they are probably reporting small
but meaningful changes. While we often club all changes in the same direction
together in the text, we distinguish between the magnitude of the perceived
changes in the tables.

8/6/2019 India: The Impact of Mobile Phones
http://slidepdf.com/reader/full/india-the-impact-of-mobile-phones 52/68
50
India: The Impact of Mobile Phones Moving the debate forward • The Policy Paper Series • Number 9 • January 2009
Appendix 1: Essential features of some of the notable studies examiningthe impact of mobiles
No Reference CountriesCovered
Methodology PopulationCovered
Unit of Analysis
1 Abraham, J ., Dean, D. & Subramanian, A.(2007). Ringing in the Next Billion MobileConsumers, A Roadmap for AcceleratingTelecom Growth in India, A BCG Report.
India Varying numberof respondentsin different partsof the reportranging 1285–9174.
Urban, Rural Individual
2 Barrantes, R. (2008). Substitution andComplementarities in Telecom ServicesUse: A Case Study of the Peruvian UrbanPoor, 17th Biennial Conference of theInternational Telecommunications Society,Montreal.
Peru 1249respondents
Urban (SEC D, E) Household+ Individual
3 De Silva, H., Zainudeen, A. & RatnadiwakaraD. (2008). Perceived economic benets
of telecom access at the Bottom of thePyramid in emerging Asia, LIRNEasia.
Pakistan, India,Sri Lanka,
Philippines,Thailand
8662respondents
(Urban, Rural(SEC D, E)) *
Individual
4 Goodman, J. (2005). Linking mobile phoneownership and use to social capital in ruralSouth Africa and Tanzania, The VodafonePolicy Paper Series, Number 3.
South Africa,Tanzania
South Africa 252respondents,Tanzania 223respondents
Rural Individual
5 McKinsey Report, Wireless Unbound, TheSurprising Economic Value and UntappedPotential of the Mobile Phone, McKinsey &Company, December 2006
India, China,Philippines
618 respondents (Urban, Rural ) * Individual
6 Samuel, J ., Shah, N. & Hadingham, W.(2005). Mobile Communications in SouthAfrica, Tanzania and Egypt: Results
from Community and Business Surveys,Africa: The Impact of Mobile Phones, TheVodafone Policy Paper Series, Number 3.
South Africa,Tanzania,Egypt
South Africa252, Tanzania223, Egypt 150
Rural Individualsand SmallBusinesses
7 Sood A. (2006). The Mobile DevelopmentReport, The Socio‑Economic Dynamics of Mobile Communications in Rural Areas andtheir. Consequences for Development.
India 80 spotinterviews +Focus GroupDiscussions+ 40 depthinterviews
Small town,Urban Slum, Village,Remote village(SEC B, C, D, R1, R2,R3)
Individual
8 Souter, D. , Scott, N., Garforth, C. , Jain, R. ,Mascarenhas, O. & McKemey, K. (2005). TheEconomic Impact of Telecommunicationson Rural Livelihoods and PovertyReduction, A study of rural communities in
India (Gujarat), Mozambique and Tanzania,Report of DFID KaR Project 8347.
Mozambique,Tanzania, India(Gujarat)
Focus GroupDiscussions+ 2292respondents
Rural * Household(to a smallextent)+ Individual+ small
businesses
9 Chabossou, A., Stork, C., Stork, M. &Zahonogo, P. Mobile Telephony Access& Usage in Africa Retrieved December 9,2008 from www.researchICTafrica.net
17 Africancountries
Survey Rural Individual
* In India the study was done on xed lines.
* The results of urban slums and rural are not separately available, unless one examines the raw data. The raw data is publicly available.

8/6/2019 India: The Impact of Mobile Phones
http://slidepdf.com/reader/full/india-the-impact-of-mobile-phones 53/68
51
India: The Impact of Mobile PhonesMoving the debate forward • The Policy Paper Series • Number 9 • January 2009
The impact of mobiles in the SME sector
Any description of India’s economy is a tale of contrasts.In popular comment on India’s economic performance in
recent years, the contrast is drawn between celebration of the steady rise in the number of billionaires in the countryon the one hand and regret for slow progress in improvingthe living standards of the majority of the population on theother. Another telling contrast is between the high prole, bigbusinesses which capture the headlines and the ‘small fry’which contribute an estimated 39 % of India’s manufacturingoutput and provide employment to 31.2 million workers in therural and urban areas of the country. It is these 12.84 million1 small and medium enterprises (SMEs) that meet the bulk of Indians’ diverse needs for food, clothing, housing, education,entertainment, health and other goods and services. SMEs
are central to the process by which the economic benets of growth are distributed among the large part of the population.
Here we address the impact of mobile phones on this worldof small and medium enterprises. The growing need of employees for mobility is the main driver of the increasingadoption of mobiles by enterprises in India. Employees needto keep in touch with their ofces, shops etc., with othercolleagues in the eld, and with customers and contactsoutside the company.
We distinguish between two ways in which SMEs can usemobile telecommunications. Firstly, and most directly,SMEs can build specic business models around mobile
services e.g., developing applications for WAP or SMS‑basedbooking services, or information services (e.g. BookMyShow,
JustDial). The mobile phone is enabling more creative andservice‑oriented business models that are directly creatingemployment opportunities.
This mobile value added services (MVAS) market whichprovides services and applications that run on mobile phones
or networks is expected to reach over US$3 billion in revenuesin 2009.2 The MVAS market offers services of all kinds rangingfrom entertainment (e.g. lm gossip, gaming) to potentiallylife‑saving emergency information about nearest hospitals.This emerging MVAS business is driven by several major SMEsincluding companies who specialise in technology (e.g. BhartiTelesoft, OnMobile), mobile entertainment (e.g. Hungama),mobile marketing (e.g. ACL wireless, mobile2win, Indiatimes),and the emerging areas of mobile payments (e.g. mChek,Obopay, Ngpay), and location‑based services (e.g. MapmyIndia)
In this paper, we look at two examples in particular – SMSOneand the JustDial service – which have created new business
opportunities through mobile.
Perhaps more interesting is the second and indirect kind of impact of mobile. How can SMEs in general use mobiles toenhance their productivity and the efciency of their valuechain? Small businesses often face challenges in scalingup their businesses. This may be due to lack of funds orinadequate access to markets but it can also be due to thebasic problems of communications and interrelationships astheir businesses grow. We were interested in exploring howsmaller businesses use mobile phones to overcome thesecommunications challenges.
We have found a great wealth of examples of how mobilecommunications are enabling SMEs to move successfullyup the value chain and become more protable; mobilesmean they can provide a better service and achieve greaterefciency in their businesses. Arguably, the mobile phone
Professor of Economics, ICRIERProfessor, IMI
Prof. Rajat Kathuria
Director,Com First (India) Private Ltd
Dr. Mahesh Uppal
Dr. Mahesh Uppal is the Director of Com First (India) Private Ltd, a consultancy specializing in policy,
regulation, and strategy.
Rajat Kathuria is Professor of Economics at ICRIER, and is also a professor at the International
Management Institute (IMI), New Delhi.

8/6/2019 India: The Impact of Mobile Phones
http://slidepdf.com/reader/full/india-the-impact-of-mobile-phones 54/68
52
India: The Impact of Mobile Phones Moving the debate forward • The Policy Paper Series • Number 9 • January 2009
is permitting SMEs to make the transition from the streetcorner to the formal economy, with its attendant benets of decreased vulnerability and increased incomes.
The case studies we have selected here range from individuallyrun businesses – like Ranjit the henna artist, described below,
who started on the pavement but has now transformed hisbusiness in both geographical scope and in scale to becomemuch more substantial – to bigger SMEs like the taxi cabcompanies which are using mobiles to deliver a better serviceto more clients and operate more efciently. In all of the verydifferent examples we consider, the use of mobiles, combinedwith other enabling factors including other technologies suchas GPS, allows capable entrepreneurs to benet customers,employees and ultimately, of course, themselves. The detailsof the ways in which mobiles are used vary depending onthe size and nature of the business, but there are several keyimpacts illustrated by all the case studies:
• Increased income and revenues due to improved accessto customers;
• Better control o costs , whether due to reduced travel orco-ordination time, improved monitoring of work-ow, orbetter inventory control;
• Improved quality of products and services, and bettercustomer service, in turn creating the scope to raise pricesand earnings.
In addition, for sole traders who were formerly operatingentirely in the informal economy in difcult conditions, akey impact of mobile has been the regularisation of their
economic and social status. This suggests mobile could beplaying an important part in India’s transition to an urbaneconomy as it develops, and millions of people move fromthe countryside to the cities in search of a better livelihood.
Methodology
We follow a case study approach based on desk research,interviews and eld visits. The objective of the paper is notto provide a systematic review of Indian SMEs or even to try
to quantify the impact of mobile phones in this sector, butrather to focus on how mobile phones are being used bybusinesses. We have attempted to highlight the less obvious– but representative ‑ impacts of mobiles to understand thepotential for changes in business models and value creation.The examples are largely from urban areas where penetrationis signicant, in contrast to rural areas where coverage is onlynow beginning to expand. In many of the cases consideredin the study, use of mobiles has created new opportunitiesto make a living, or to be more productive and earn more, tomigrants from rural areas to the cities.
The nature and size of the SMEcontribution to India’s economy
The denition of Small and Medium Enterprises (SMEs) inIndia is based on the amount of investment in plant andmachinery. According to the Micro, Small and MediumEnterprise Act 2006, any enterprise with an investment of lessthan Rs. 100 million (US$2 million) can be dened as an SME.Since this denition is mainly meant for the manufacturingsector, it is not very useful for the wide range of knowledge‑based or other services. Indeed, by these thresholds all but1% of India’s businesses are SMEs.Close to 70% of India’s SMEs
are involved in manufacturing and trading including retail andwholesale. Professional and other services account for 22%,as Figure 1 shows.3
Figure 1: Distribution of SMEs by sector
These gures concern the formal sector. Of greater interestfor the purposes of our study is the informal or unorganisedsector.4 Approximately 80% of the SMES are unregistered eachoperating with initial investment of less than Rs. 0.5 million(US$10,000). Fewer than 2% have access to bank credit,while 90% of their products and services are absorbed in thedomestic market.5
Picture any Indian city or town and you will immediately beable to put these statistics in context. Barring a few moderncommercial and residential areas, the sidewalks are lined withbarbers, cobblers, waste recyclers and vendors of vegetables,fruit, and a myriad of non‑perishable items ranging from locks
Other services
FIRE (Financial Institution& Real Estate)
Wholesale
AMTUC (Agricultural, Mining,Transportation, Telecommunication,Utilities & Construction
Manufacturing
Retail
Professional services
Street sellers in Rajasthan
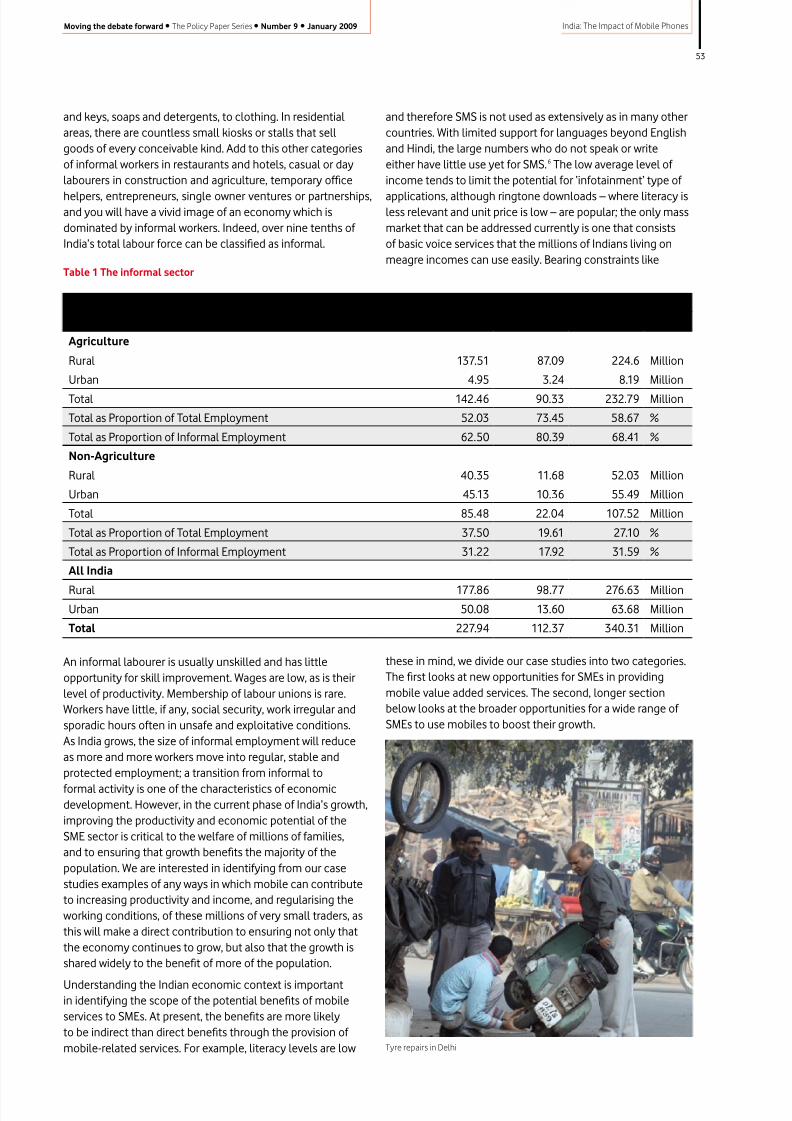
8/6/2019 India: The Impact of Mobile Phones
http://slidepdf.com/reader/full/india-the-impact-of-mobile-phones 55/68
53
India: The Impact of Mobile PhonesMoving the debate forward • The Policy Paper Series • Number 9 • January 2009
these in mind, we divide our case studies into two categories.The rst looks at new opportunities for SMEs in providingmobile value added services. The second, longer sectionbelow looks at the broader opportunities for a wide range of SMEs to use mobiles to boost their growth.
and therefore SMS is not used as extensively as in many othercountries. With limited support for languages beyond Englishand Hindi, the large numbers who do not speak or writeeither have little use yet for SMS.6 The low average level of income tends to limit the potential for ‘infotainment’ type of
applications, although ringtone downloads – where literacy isless relevant and unit price is low – are popular; the only massmarket that can be addressed currently is one that consistsof basic voice services that the millions of Indians living onmeagre incomes can use easily. Bearing constraints like
and keys, soaps and detergents, to clothing. In residentialareas, there are countless small kiosks or stalls that sellgoods of every conceivable kind. Add to this other categoriesof informal workers in restaurants and hotels, casual or daylabourers in construction and agriculture, temporary ofce
helpers, entrepreneurs, single owner ventures or partnerships,and you will have a vivid image of an economy which isdominated by informal workers. Indeed, over nine tenths of India’s total labour force can be classied as informal.
An informal labourer is usually unskilled and has littleopportunity for skill improvement. Wages are low, as is theirlevel of productivity. Membership of labour unions is rare.Workers have little, if any, social security, work irregular andsporadic hours often in unsafe and exploitative conditions.As India grows, the size of informal employment will reduceas more and more workers move into regular, stable andprotected employment; a transition from informal to
formal activity is one of the characteristics of economicdevelopment. However, in the current phase of India’s growth,improving the productivity and economic potential of theSME sector is critical to the welfare of millions of families,and to ensuring that growth benets the majority of thepopulation. We are interested in identifying from our casestudies examples of any ways in which mobile can contributeto increasing productivity and income, and regularising theworking conditions, of these millions of very small traders, asthis will make a direct contribution to ensuring not only thatthe economy continues to grow, but also that the growth isshared widely to the benet of more of the population.
Understanding the Indian economic context is importantin identifying the scope of the potential benets of mobileservices to SMEs. At present, the benets are more likelyto be indirect than direct benets through the provision of mobile‑related services. For example, literacy levels are low
Table 1 The informal sector
SectorEstimated Number of Workers
Male Female Total
Agriculture
Rural 137.51 87.09 224.6 Million
Urban 4.95 3.24 8.19 Million
Total 142.46 90.33 232.79 Million
Total as Proportion of Total Employment 52.03 73.45 58.67 %
Total as Proportion of Informal Employment 62.50 80.39 68.41 %
Non-Agriculture
Rural 40.35 11.68 52.03 Million
Urban 45.13 10.36 55.49 Million
Total 85.48 22.04 107.52 Million
Total as Proportion of Total Employment 37.50 19.61 27.10 %
Total as Proportion of Informal Employment 31.22 17.92 31.59 %
All India
Rural 177.86 98.77 276.63 MillionUrban 50.08 13.60 63.68 Million
Total 227.94 112.37 340.31 Million
Tyre repairs in Delhi

8/6/2019 India: The Impact of Mobile Phones
http://slidepdf.com/reader/full/india-the-impact-of-mobile-phones 56/68
54
India: The Impact of Mobile Phones Moving the debate forward • The Policy Paper Series • Number 9 • January 2009
New mobile livelihoods: using SMS formarketing and local search
In India, the subscriber base is increasing rapidly especiallyamong lower‑income users in urban markets and the largely
untapped rural markets. This expansion in access is beingdriven by innovation in services, especially tariffs, such asmicro pre‑paid, full value recharge and lifetime validity.7 The voice market remains dominant and constitutes 93% of wireless service provider revenue.8 Yet there are importantreasons why the prospects for the market for direct mobileservices are more limited in India as compared with othercountries.
Indian users clock some of highest minutes of usage butsome of the lowest usage of SMS. An average mobile user inIndia sends barely one message per day. Multiple languages,extensive illiteracy, and cheap voice calls, all conspire to
limit the popularity of SMS. This, in turn, hurts growth of textbased mobile value added services. In contrast, countries likeMalaysia and Singapore have almost 3 times as much SMSusage in India. China has double. In Philippines text messagesare especially popular, users clocking 15 SMS messages perday, on average.9 Interestingly, in the Philippines, the literacyrate is in excess of 93 per cent.10
A large proportion of subscribers use relatively basic handsets,which might limit most non‑voice services e.g. through slowdownloads, lack of camera, etc. Consequently, the take up of entertainment oriented services (e.g. Bollywood, live cricket),health, education etc. is low, even though public interest is
potentially high.
Nevertheless, straightforward income opportunities canemerge in links in the value‑chain that delivers new servicesto customers via mobiles. Here are two examples.
SMSOne, Pune, Maharashtra
Since directories are often unavailable and frequentlyinaccurate, collecting information to enable direct marketingis a valuable service. In 20 districts of Maharashtra province,
youths with about 10 years of education make over Rs5000a month each on average by sending SMS messages.The youths use their familiarity with the community to collect
roughly 1000 mobile phone numbers, at least a quarterof which belong to local businesses or entrepreneurs. The youths obtain written consent from each owner of the phonenumber to receive a limited number (typically 5 or 6) of informational and or promotional SMS messages each week.
SMSOne Media Services provides the bulk‑SMS software tosend roughly 5000–6000 messages to those mobile ownersenlisted by the young unemployed. The recipients of themessages pay nothing. The young person raises money tocover costs and generate his income from those who wantto reach the community. So, for example although messagesabout government and citizen‑centred services are delivered
free, small business ads, marriage invitations and otherclassied-type messages typically cost a rupee per message.Higher value messages such as those for canvassing supportin elections, can cost up to four times more.11
JustDial, Mumbai, Maharashtra
As personal access to telecommunications increases, morepersonalised services can be delivered to subscribers. In India,widespread access to the internet is many years away, so othermeans of accessing information offer value. JustDial, which
began operations in 1994, provides directory services on thelines of the familiar Yellow Pages to help its users to identifyand reach a wide range products and services. Callers dial itseasy‑to‑remember phone numbers in different towns and areprovided with information by JustDial staff. The range includeshelping somebody to locate a plumber who can x a leakingtap, a tutor for a student, a shop selling decorative tiles foroors, listings information about new lm releases, or detailsof restaurants offering pizza within a certain budget, JustDialcan help with an ever‑expanding range of queries, and is freefor callers; Its revenues come from businesses paying for alisting, as well leads that JustDial generates for them. JustDial
now supports SMS delivery that can contain more informationsuch as additional phone numbers, addresses and otherrelevant information.
JustDial, which had start‑up capital of US$1000, 14 yearsago, has annual revenues of $17 million and a $100 milliondollar valuation company today on the back of its informationbusiness. Its creator, in a recent interview,12 attributed hiscompany’s continuing success to the telecom revolution inIndia, which is largely fuelled by growth of mobile phones.Without this growth, the substantial JustDial business wouldbe signicantly smaller as the accessible market would belimited. Mobile phones have clearly allowed the business to
expand. They also enable users to receive the informationthey seek more efciently via SMS if they choose. JustDial isa very direct example of how economic growth is created as aconsequence of increased teledensity.
Use of mobile phones in SMEvalue chains
However, the broader impact of mobile phones on the SMEsector is more indirect than the provision of mobile‑basedservices. The attractiveness of the mobile phone to smallentrepreneurs lies in its user‑friendliness coupled with itsrelatively low price –starting at less than Rs 1000. We turnnow to several examples of these indirect impacts, whosepotential for the wider economy is more signicant.
The typical SME in India frequently consists of a singleself employed person or a sole trader. Even when morepeople are involved, small businesses necessarily forgo thespecialisation of larger businesses which have dedicatedpersons for specic functions such as sales, marketing,management and information technology (IT). Those workingin an SME must routinely resort to multi‑tasking. A mobilephone can be a powerful device can help relieve many of daily pressures that SMEs face as a result. For example, orderscan be taken on the phone even when a person is busyworking elsewhere; mobiles mean there is no need either tohave an employee sitting by a xed line or to miss importantcalls. Information can be exchanged more readily, and the

8/6/2019 India: The Impact of Mobile Phones
http://slidepdf.com/reader/full/india-the-impact-of-mobile-phones 57/68
55
India: The Impact of Mobile PhonesMoving the debate forward • The Policy Paper Series • Number 9 • January 2009
quality of work monitored. This section illustrates the rangeof ways in which SMEs can make use of mobiles to increasetheir productivity, their opportunities for earning revenue, andtheir service to customers.
LabourNet, Bangalore
LabourNet is an example of how the delivery of basic services(such as plumbing, the repair of appliances and maintenanceservices) can be transformed through better organisationfacilitated by mobile phones. Mobile phones have enabledLabourNet to deliver better service to customers withmore consistent service standards and quality. At the sametime, mobile contact allows the individual tradesmen toregularise their work and become more productive. Withincreasing economic activity, especially relating to the ITsector, Bangalore and Hyderabad have seen huge demandfor construction‑related activity. LabourNet is attemptingto create an effective and non‑exploitative marketplace for
construction work.
Traditionally in Bangalore, a client employs a Maistri (usually asmall subcontractor or independent foreman) who is usuallyentrusted with the task of putting together worker teams for aspecic construction project. The Maistri, a critical intermediarybetween clients and the informal workers, has obviousclout. Given the vulnerability of the workers, the Maistri‑worker relationship is rarely transparent or documented, andfrequently exploitative of the workers involved.
The LabourNet initiative was started in 2004 by Maya, anon-prot agency, with headquarters in Bangalore. It hascreated a network of workers in the informal service sectorthat can serve the construction, housekeeping, gardeningand transportation needs in the major cities of India by usingtechnology to help them nd jobs and business opportunities.The initiative currently includes 200,000 workers and isenvisaged to extend to a million workers over the next 7 yearsin 7 cities around India.
Maya aims to improve lives and livelihoods of traditionallybadly paid self‑employed construction workers. A variety of tradespersons ranging from masons, carpenters, plumbers,electricians and so on to more specialised trades such aswater proong experts, interior decorators, stone cutters,metal bar benders and many more are registered onLabourNet’s database. Potential clients call LabourNet’s callcentre where staff can match their needs with workers onits database with appropriate skills, and also the fees andother specic characteristics which may be relevant for theproposed assignment. A plumber may, for instance, not bewilling or able to work on high‑rise buildings.
All workers registering with LabourNet require a workingmobile phone on which they can be called in case there iswork for them. This mobile linkage is critical since the workers,who typically live in the urban slums, cannot be reached inany other way. They may even lack a stable or permanentresidential address. Also, many workers are often on‑site whenthey need to be contacted.
LabourNet solution benets clients as well as workers.Clients get workers who are checked and known toLabourNet. They can access the worker’s individual history,skill sets and employment experience. Since wages too areincluded in the database, there is little room for last minute
disputes or unexpected re‑negotiation of rates.For workers, LabourNet brings much additional value besidesnew work. It gives them a formal identity card which servesin many other situations – for example accessing buildingsor other services. The tracking of their performance can helpthem negotiate higher pay over time. In addition, registeringworkers can open their own bank account, usually extremelydifcult for itinerant and especially poor workers. Allregistered workers get accident insurance and can opt also tobuy health insurance – a substantial source of security in thevulnerable world that most informal workers inhabit.
The number of registrations has more than doubled each
year since the initiative started in 2004. As mentioned, inaddition to the Maistries, individual wage earners also registerwith LabourNet. As might be expected (see Table 3) whilethe Maistries spot the value of a LabourNet registration rst,growing numbers of wage earners who have mobile phones,also starting to do so.
Table 2: LabourNet registrations snapshot
Year Number of workers enrolled*
2004–05 518
2005–06 1237
2006–07 26622007–08 5452
* includes maistries and workers
Table 3: Distribution of workers
Maistries Wage earners Tota
Bar Bender 170 138 308
Carpenter 665 364 1029
Plumber 258 69 327
Electrician 262 90 352
Mason 790 1176 1966
Painter 402 352 754
Other 570 146 716
Total 3117 2335 5452

8/6/2019 India: The Impact of Mobile Phones
http://slidepdf.com/reader/full/india-the-impact-of-mobile-phones 58/68
56
India: The Impact of Mobile Phones Moving the debate forward • The Policy Paper Series • Number 9 • January 2009
Figure 2 How the LabourNet process works
Figure 3: LabourNet advertisement
Clients call LabourNet
Call is logged and request
is matched with database
of skills of Maistri and
his workers
Selected Maistri meets
with client to discuss
work and terms
If work terms are agreed,
the job is executed
LabourNet collects
feedback from the client
and Maistri to grade
Maistri and worker
performance and update
database profiles
Workers register skills,
salary, location, etc.
Registered Maistries
and Workers
Maistri contacts workers
to confirm availability
and terms

8/6/2019 India: The Impact of Mobile Phones
http://slidepdf.com/reader/full/india-the-impact-of-mobile-phones 59/68
57
India: The Impact of Mobile PhonesMoving the debate forward • The Policy Paper Series • Number 9 • January 2009
We also found numerous other examples of howentrepreneurs were using mobiles to expand and improvetheir business. A few of these are illustrated below:
Construction contractor Rajender Dhawal,New Delhi
Rajender Dhawal, 46, is a contractor who mobilises teams of workers for construction projects for a successful builder – a
job he has done since 1985. He supervises the work and alsoprocures building material on behalf of the builder.
Most people he needs to contact such as workers andsuppliers now have mobile phones. Thanks to the mobile,Mr. Dhawal’s work extends to neighbouring regions in UttarPradesh and Haryana. It now requires substantially less timeand effort to mobilize a team. Since many building workersare migrants from other parts of India, formerly he wouldsometimes need to go to meet them personally at theirbuilding sites or write to them in their home villages. It tookweeks to put together a team get projects started. Procuringmaterial was also more difcult and time-consuming
previously, since suppliers are often located near kilns orquarries. A trip to acquire supplies often took a whole day,sometimes longer. Since Mr. Dhawal has built relationshipswith suppliers over the years, many will take orders on thephone for his materials and accept payment on delivery. Witha phone it is also much simpler to coordinate supplies on sitesince he knows when to expect deliveries.
The savings in costs and time as a direct result of usinghis mobile have enabled him to negotiate with his builder‘employer’ to be able to take on additional, independent work.He now therefore takes on other turnkey projects where heprocures the material as well as the workers. His clients prefer
the one‑stop arrangement. Mr. Dhawal‘s responsibilities aregreater and consequently his income is higher.
The quality of his work has improved. He is able to give lastminute instructions to staff from wherever he is at any giventime. Several expensive mistakes have been preventedthanks to this constant contact. Building material trucksalmost always need to move during off‑peak and unsociablehours. Locating building sites at night is much easier since Mr.Dhawal can help with directions, if needed. He can be reachedfaster in crisis.
Last but not least, he is more in contact with his family too.
Although he still works long irregular hours, he can keep intouch with his homemaker wife through the day – far enoughin advance of his return that he can have a hot meal at homemost days.
Abdul Rashid, Trader in hand-crafted pashminashawls, Srinagar and New Delhi
Abdul Rashid divides his stay during the year equally betweenSrinagar and New Delhi. Since the mid 1980s, he has beenselling exclusive handmade shawls such as the well‑knownPashmina and Jamawar made by expert craftsmen in Kashmir.His workmen take close to 1 month to make a typicalshawl, although they take over a year to make some of themore extensively embroidered delicate ones. Mr. Rashid’sshawls can cost between $100 and $2,000, and on occasioneven more.
With the close to 200 people who are now associated
with him, Mr. Rashid is involved in design, choice of wooland other materials, selection of threads, the colours andhues of shawls and much other intermediate processing.He frequently provides mid‑season feedback and suggestsalterations in designs or quantities depending on marketdemand. He and his well‑knit community of friends andfamily carry the delicate shawls made by craftsmen in theKashmir hills to the buyer in the plains.
Mobile phones have been central to the growth of hisbusiness from its small start to today’s scale, through enablingmore client contact. He says that while he sold barely 50 eachseason before he acquired a phone 10 years ago, now he sells
over 500. Clients invariably call on the mobile, often when heis out with family. Since his shawls are expensive and oftenbought on impulse the cost of being unreachable can be high.Opportunity costs are huge.
Mobile phones are critical for quality control and reducingcost of inventory. A timely instruction for a seemingly smallchange affects revenues signicantly. A potential error canbe stopped in time. Since stocking unsold shawls can lock inrelatively large sums, timely action can reduce the leftovershawls sold at near cost to shops.
Mobiles have been critical for dealing with the uncertain cashows so typical of his business. He has frequently been able
to respond to urgent requests from craftsmen with a personalemergency or in need of critical raw materials which couldhurt employee welfare and commitment or compromisedelivery of orders.
Overseas buyers are few, but often make larger orders.Despite the time difference, he can be reached without muchlost sleep at either end.
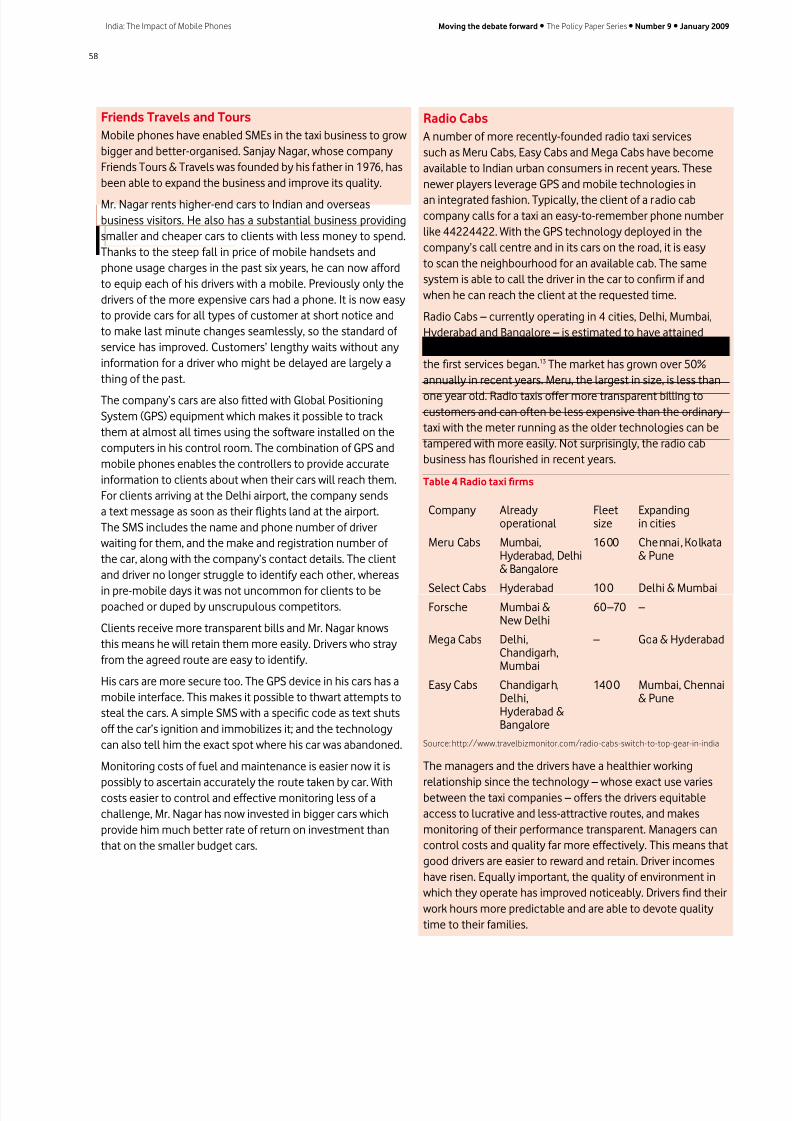
8/6/2019 India: The Impact of Mobile Phones
http://slidepdf.com/reader/full/india-the-impact-of-mobile-phones 60/68
58
India: The Impact of Mobile Phones Moving the debate forward • The Policy Paper Series • Number 9 • January 2009
Friends Travels and Tours
Mobile phones have enabled SMEs in the taxi business to growbigger and better‑organised. Sanjay Nagar, whose companyFriends Tours & Travels was founded by his father in 1976, hasbeen able to expand the business and improve its quality.
Mr. Nagar rents higher‑end cars to Indian and overseasbusiness visitors. He also has a substantial business providingsmaller and cheaper cars to clients with less money to spend.Thanks to the steep fall in price of mobile handsets andphone usage charges in the past six years, he can now affordto equip each of his drivers with a mobile. Previously only thedrivers of the more expensive cars had a phone. It is now easyto provide cars for all types of customer at short notice andto make last minute changes seamlessly, so the standard of service has improved. Customers’ lengthy waits without anyinformation for a driver who might be delayed are largely athing of the past.
The company’s cars are also tted with Global PositioningSystem (GPS) equipment which makes it possible to trackthem at almost all times using the software installed on thecomputers in his control room. The combination of GPS andmobile phones enables the controllers to provide accurateinformation to clients about when their cars will reach them.For clients arriving at the Delhi airport, the company sendsa text message as soon as their ights land at the airport.The SMS includes the name and phone number of driverwaiting for them, and the make and registration number of the car, along with the company’s contact details. The clientand driver no longer struggle to identify each other, whereas
in pre‑mobile days it was not uncommon for clients to bepoached or duped by unscrupulous competitors.
Clients receive more transparent bills and Mr. Nagar knowsthis means he will retain them more easily. Drivers who strayfrom the agreed route are easy to identify.
His cars are more secure too. The GPS device in his cars has amobile interface. This makes it possible to thwart attempts tosteal the cars. A simple SMS with a specic code as text shutsoff the car’s ignition and immobilizes it; and the technologycan also tell him the exact spot where his car was abandoned.
Monitoring costs of fuel and maintenance is easier now it is
possibly to ascertain accurately the route taken by car. Withcosts easier to control and effective monitoring less of achallenge, Mr. Nagar has now invested in bigger cars whichprovide him much better rate of return on investment thanthat on the smaller budget cars.
Radio Cabs
A number of more recently‑founded radio taxi servicessuch as Meru Cabs, Easy Cabs and Mega Cabs have becomeavailable to Indian urban consumers in recent years. Thesenewer players leverage GPS and mobile technologies in
an integrated fashion. Typically, the client of a radio cabcompany calls for a taxi an easy‑to‑remember phone numberlike 44224422. With the GPS technology deployed in thecompany’s call centre and in its cars on the road, it is easyto scan the neighbourhood for an available cab. The samesystem is able to call the driver in the car to conrm if andwhen he can reach the client at the requested time.
Radio Cabs – currently operating in 4 cities, Delhi, Mumbai,Hyderabad and Bangalore – is estimated to have attainedrevenues of Rs54.7 million (US$) in barely 4 years sincethe rst services began.13 The market has grown over 50%annually in recent years. Meru, the largest in size, is less than
one year old. Radio taxis offer more transparent billing tocustomers and can often be less expensive than the ordinarytaxi with the meter running as the older technologies can betampered with more easily. Not surprisingly, the radio cabbusiness has ourished in recent years.
Table 4 Radio taxi rms
Company Alreadyoperational
Fleetsize
Expandingin cities
Meru Cabs Mumbai,Hyderabad, Delhi& Bangalore
1600 Chennai , Kolkata& Pune
Select Cabs Hyderabad 100 Delhi & MumbaiForsche Mumbai &
New Delhi60–70 –
Mega Cabs Delhi,Chandigarh,Mumbai
– Goa & Hyderabad
Easy Cabs Chandigarh,Delhi,Hyderabad &Bangalore
1400 Mumbai, Chennai& Pune
Source: http://www.travelbizmonitor.com/radio-cabs-switch-to-top-gear-in-india
The managers and the drivers have a healthier working
relationship since the technology – whose exact use variesbetween the taxi companies – offers the drivers equitableaccess to lucrative and less‑attractive routes, and makesmonitoring of their performance transparent. Managers cancontrol costs and quality far more effectively. This means thatgood drivers are easier to reward and retain. Driver incomeshave risen. Equally important, the quality of environment inwhich they operate has improved noticeably. Drivers nd theirwork hours more predictable and are able to devote qualitytime to their families.

8/6/2019 India: The Impact of Mobile Phones
http://slidepdf.com/reader/full/india-the-impact-of-mobile-phones 61/68
59
India: The Impact of Mobile PhonesMoving the debate forward • The Policy Paper Series • Number 9 • January 2009
Mam Chand, Faridabad
Mam Chand is 40 years old. He hasfewer than 10 years of educationand is married with two children.He runs a taxi service outside Delhi
with a loose group of drivers whomhe coordinates through mobilephones. Typically, his customerscall his mobile number anddepending on the pressure of work and who is available, hewill designate a driver for the customer. Most of the hires arefor a full day (8 hours). Half day bookings are accepted too.
Mr. Chand currently makes Rs20,000 (US$400) per month– an amount that has doubled since he acquired a mobilephone. He no longer needs to employ another person to waitnext to the xed line in his makeshift ofce to receive calls.His customers can reach him – and do – at almost any hour.
Previously he would have drivers idle but now it is a rare daywhen his taxis are not fully booked out to clients. Several daysa week, he can do an extra shift of 8 hours.
Despite little formal education or training, he has become asophisticated mobile user for the needs of his business. Hehas two handsets – one GSM and one CDMA – from differentservice providers and frequently leverages their subtledifferences in tariff plans or in coverage. Equally his wife, ahome maker, can be aware of any sudden change in plans. It isnot uncommon for Mr. Chand to drive his clients outside Delhion trips that could take him 3 to 4 days.
Vegetable VendorsVegetable vendors are a familiar sight in mostneighbourhoods and residential areas. Almost half of India’spopulation is vegetarian. In urban areas, homemakers havetraditionally bought their daily vegetables and fruits fromhawkers who to go from home to home to sell the producethey procure each morning from the wholesale market.Most vegetable vendors operate in a set area (such as aparticular residential neighbourhood) and are often knownto residents by their characteristic shouts which announcetheir arrival and invite their customers to buy. But timesare changing. The traditional system of buying and sellingvegetables has been under pressure in recent times. More
women work outside the home. The schedules of vendors andtheir customers do not always match, causing missed salesopportunities and higher wastage of unsold produce.
Vendors are increasingly using mobile phones to overcomethese problems. The vegetable vendor serving a 12‑storeyblock of over 100 ats in East Delhi takes orders from theresidents every morning on his mobile. His clients tell himwhat they need and in what quantity. They can alert him if they have plans which affect their vegetable order, such as acelebration or a trip away from home. The vendor can makeup appropriate packets for his clients, who then receive it atthe appointed time on their door step. The whole task now
takes about three hours – freeing the vendor up for otherwork. His income has risen and the level of service received byhis customers has improved.
The mobile phone enables the vendor to devise a solutionthat works for both himself and his clients. He is well‑preparedwith the packages, bills and loose change. He has a well‑dened route covering each oor of the apartment blocksystematically. Clients appreciate the personalisation and the
convenience. Meeting each of them with a prior appointmenthas given his work a new dignity and to him a new status,as well as making the delivery process more convenient forboth parties. This point applies to many other traders suchas hawkers, repair persons. Previously seen as a necessarynuisance, their phones give them an opportunity to move upthe value chain and the status ladder. Slowly but signicantly,India’s traditionally hierarchical society may be becoming alittle bit atter.
Given the near ubiquity of mobile phones in urban areasthe choice of examples of SMEs of this sole trader varietyis predictably large. The ‘eco‑friendly’ deserve a special
mention. The waste recycler or ‘raddiwala’ who buys oldnewspapers, metal objects and much else from homes torecycle now often makes an appointment with regular clients,unlike earlier when he went on his tiring rounds much likethe vegetable vendor above. The ‘clean transport provider’,the cycle rickshaw puller, who helps people move in crowdedinner cities, when he has a longer booking – say, half dayor full day – might ask shoppers who want to stop often, tocall him when they are ready while he moves to park in lesscrowded part of the city nearby.
A priest in the busy (and for him also lucrative) weddingseason, when a city may have hundreds or even thousands of
ceremonies, might perform several in a single day. The sightof him coordinating his movement with clients as he is takingmore requests to ofciate in others, may be relatively new,but is increasingly familiar.
Rita Goyle, veterinary doctor, Ghaziabad
Rita Goyle, 40, is a vet who serves a large part of Delhi andits surroundings and uses a mobile phone to enhance hercustomer service. She has a mobile clinic, visiting pets athome in her compact car, with her supplies in a neat boxin the trunk of the car (including standard medication,injections, shampoos, dog biscuits, tick‑free talc and so on).Appointments are xed by mobile. This is more convenient
and saves time. Home visits cause less stress for the animals.
Communications between pet owners and the vet nolonger depend on intermediaries. In the past, clients oftendelegated domestic staff to take their animals to the vet. Itwas common for them to convey critical information such asthe pet’s symptoms incompletely or inaccurately. SometimesMs Goyle needed additional information which the personaccompanying the pet did not have. Confusion was common.
The mobile phone also enables her to delegate; if it was notfor her mobile phone she would never take a holiday. Sinceshe can be reached in emergencies, she now takes a vacationevery year.

8/6/2019 India: The Impact of Mobile Phones
http://slidepdf.com/reader/full/india-the-impact-of-mobile-phones 62/68
60
India: The Impact of Mobile Phones Moving the debate forward • The Policy Paper Series • Number 9 • January 2009
Ranjeet Gupta, henna artist, Delhi
Ranjeet Gupta ia a henna artist.The herb henna is a populardecoration for women in Indiaand Pakistan. It is believed to have
cooling therapeutic properties.It was traditionally applied duringweddings and auspicious occasions, and is often an importantpart of a bride’s preparation for her wedding. It is now popularfor parties and other social occasions as well. Women haveintricate henna patterns painted on their palms, soles of feet,arms and legs. This costs anything from Rs 20 (40 US cents) toseveral thousand rupees depending on the area of skin to bedecorated and the intricacy of the design.
Mr. Gupta started off on a pavement in Rani Bagh in westernDelhi nine years ago, where his clients would sit on a stoolto have henna applied to their palms. The ‘shop’ allowed
him to earn a living but was otherwise far from satisfactory.Many clients were understandably hesitant to get a cosmeticservice in a public place. He was also harassed by ofcialssince pavement businesses were technically illegal, althoughpopular. There was clearly little room to expand the business,which limited earnings potential.
Then Mr. Gupta acquired a mobile phone 6 years ago in 2002.He has two phones, one for business and one for privatecalls. His clients now call him to have henna applied at theirhome and at peak seasons like Rakhi and Diwali. It is also nolonger necessary to travel to procure dry henna powder sincesuppliers are willing to take orders on the phone. Productive
days are therefore not lost. He also gets work from otherstates like Rajasthan, Uttar Pradesh, and Jammu & Kashmir.Time and privacy being less of a problem, customers ask formore elaborate treatments. The bridal packages are the mostlucrative. Mr. Gupta has two large albums (i.e. bridal specicand one for regular user) of pictures to help customerschoose or design what they want. For Mr. Gupta, the money isbetter, and the conditions far better than working at the sideof the road – not to mention the tea and snacks he receives.
He has now graduated to being a contractor, training youngsters (and sometimes even older people) from villagesin the art. The basic course takes about 5 weeks and is popular
amongst young men and women. The fees are Rs3,000 ($60)for the short course. Students apprentice with him for about a
year before they graduate to bridal treatments. The businessis good for 10 months a year (since many Indians considerpart of the year inauspicious for weddings). His trainees go totheir villages during the quiet period.
Mr. Gupta believes the key to his success has been the mobilephone. He says that the workers whom he brings to Delhi fromtheir village buy a phone almost immediately after better clothesand a suitcase for their belongings. He also uses a camera phoneto capture designs – intense competition means designs need tobe guarded. Mr. Gupta believes competitors would poach more
than half of his business, if he was not reachable on his phone.His business allows him and his colleagues to make a livelihoodin a situation and environment where modestly educated andrelatively poor migrant workers struggle to make a living. He isalso happy to be his own boss rather than a wage labourer.
Rajiv Trehan, 24/7 backup power supplies, Delhi
Rajiv Trehan’s companyVeecon Electronics is over 20
years old and manufactures,sells, and maintains power
inverters which providebackup electricity during thefrequent periods of black outin most parts of Delhi. Theycan be used to run all sortsof household equipment,including kitchen appliances,power tools, TVs, computers,and more. He employs about18 people. Of these 6 work in his factory. Others take careof sales, marketing and maintenance. The company has aturnover of roughly Rs5million (US$100,000). It has around
6000 customers, a mix of domestic and business users,including several government agencies.
The mobile has helped him offer a 24/7 emergencybackup service to clients willing to pay much more to avoidinterruption to their power supplies. Mr. Trehan can respondimmediately as his staff are often on the road and can beredirected easily to deal with emergencies. He answers 15–20such emergency calls in a year. He says that thanks to mobileroaming services, he can deal seamlessly with an emergencyeven if his client is in another city. He even left his weddinganniversary celebration at 10pm to attend to a client sinceno other staff were available.
Conclusions
Given the importance of SMEs in India’s economy, it is easyto see that a working and affordable telecommunicationsservice represents an important business enabler.Telecommunications simply offer a means to distributeinformation, but when the information concerns orders,supplies, prices and employees, the phone (whether xed ormobile) becomes the lifeline of a business. A recent Ovumsurvey revealed that most SMEs in India are keen to exploitmobile technologies.14 Our varied examples suggest that there
are numerous opportunities in mobile use for SMEs from thesole trader to those employing many people and with a largeturnover. Frequent advantages of mobile use are:
• A more convenient and customized service for clients, withthe potential for higher charges in some cases as morevalue is delivered to customers;
• Improvement in quality of work through better monitoringand through retention of better quality staff,
• Savings in time and cost, from the avoidance of travelto co‑ordinate work or supplies, or from improvedinventory control;
• Higher incomes as work can be scheduled more efciently(and more work tted into working hours) or a higher-valueservice delivered;

8/6/2019 India: The Impact of Mobile Phones
http://slidepdf.com/reader/full/india-the-impact-of-mobile-phones 63/68
61
India: The Impact of Mobile PhonesMoving the debate forward • The Policy Paper Series • Number 9 • January 2009
• Disintermediation or direct contact between SMEs and actualusers of their services, which removes risks of dealing withintermediaries who often interface between SMEs and theirmore important clients;
• Increased income from improved access to new customers;
• Greater security for those in SMEs whose work is away fromnormal workplaces such as shops and ofces;
• Better co‑ordination of work and home life, especially forthose working long and/or irregular hours.
However, there remain important barriers to SMEs hoping totake advantage of the opportunities presented by mobiles.
First, it is interesting to note that most of the examplescited in our research have come from major urban areas,where teledensity is highest. Outside these urban areas, theopportunities to transform SMEs in the same way are limitedby mobile phone use amongst the customers themselves– for example the henna artist, the vegetable vendor andthe taxis services all depend upon the ability to reach thecustomer via a mobile phone. Where this is not possible,the improved and expanded business model is not viable.These are ‘on the ground’ examples of why a threshold levelof teledensity is required for the impact upon growth andproductivity to be realised.
A second issue is education and familiarity with thetechnology. Some of the services in our case studies requirea basic level of literacy which will not be found in more ruralareas where illiteracy and the prevalence of local languageswill inhibit the ability to execute these mobile‑enhancedbusiness models.
Therefore the increasing use of the mobile phone by SMEsis another factor making it even more urgent to address therural‑urban divide. In urban areas, where mobile penetrationrates are now approaching levels where most consumerswould have access to a mobile, entrepreneurs are leveragingthe benets of communications to grow and increase theirefciency and revenues. However, in rural areas, whichlack the base of consumers with mobile phones, theseopportunities will remain out of reach. Until such time asteledensity reaches a critical threshold in all India’s 600,000villages, the mobile phone may well exacerbate not eliminatethe urban‑rural divide.
Notes
1 Economic Survey, 2007–08, Ministr y of Finance , Governm ent of India
2 Future of Mobile VAS in India, BDA 2007
3 Figure 1, based on “Microsoft AMI Partners Report on IT adoption in the Indian
SMEs” February 2008, Available at http://download.microsoft.com/download/0/
e/f/0efb20ef-a08f-49a9-a589-3d8f2b116bda/Report-FINAL-AMI_Feb%2013.pdf 4 Economics literature relating to India has two types of terminologies viz.
informal or unorganized, to describe workers who work alone or in small private
enterprises. The differences between the two terms, though minor in the context
of this study, can be seen in the following:
“Informal labour consists of two major categories. First, small, non-capital
intensive enterprises run by independent, self employed persons, sometimes
employing a few hired workers. The second category consists of thousands of
wage workers who work as agr icultural and plantation labourers, mine/brick
kiln workers, construction-related workers, micro-production related workers,
domestics, repair/workshop related workers, vendors and home-based wor kers”
Report on Constr uction sector, ILO 2002.
‘The unorganized Sector consists of all private enterprises having less than ten
total workers, operating on a proprietary or par tnership basis’ Expert Group on
Informal Sector Statistics (Delhi Group) 11th &12th May 2006.
5 ILO Global Economic Recession and its Impact on World of Work, presentation by
Dr Sandra Rothboeck, ILO, FICCI, December 2008 and Economic Survey 2008,Ibid
6 “According to the most recent census of 2001, 29 ‘langu ages’ have more than
a million native speakers, 60 have more than 100,000 and 122 have more than
10,000 native speakers… The government of India has given 22 languages of
the 8th Schedule “the status of ofcial language.” (http://en.wikipedia.org/wiki/
Indian_languages)
7 The micro recharges that allow top up of prepaid cards by as little as Rs10 ($0.2)
or the “lifetime free incoming” packages are cases in point. The latter has come
in handy for SME managers who supervise teams to separate work related
and personal usage of phones. The package price includes basic rental and all
incoming calls. The manager is sure that after (s)he procures a handset and this
package for staff, (s)he can reach them without incurr ing additional cost or taking
on liability for personal calls made from the phone, for which the user pays extra
by buying additional credit.
8 Future of Mobile VAS in India, BDA 2007
9 “http://content.msn.co.in/MSNContribute/Story.aspx?PageID=84c6e0f6-8aed-48a2-b858-f0b8481d7518” http://content.msn.co.in/MSNContribute/Story.
aspx?PageID=84c6e0f6-8aed-48a2-b858-f0b8481d7518
10 http://www.ilo.org/public/english/region/asro/bangkok/skills-ap/skills/
philippines_literacy.htm
11 http://www.smsone.in/localsms.htm
12 Interview to TV channel, UTVI, broadcast on 27th September,2008
13 http://www.travelbizmonitor.com/radio-cabs-switch-to-top-gear-in-india
14 ‘SMEs in India: enthusiasm for mobile applications’, http://store.ovum.com /
Product.asp?tnpid=65284&tnid=65284&pid=38734&cid=0

8/6/2019 India: The Impact of Mobile Phones
http://slidepdf.com/reader/full/india-the-impact-of-mobile-phones 64/68
62
India: The Impact of Mobile Phones Moving the debate forward • The Policy Paper Series • Number 9 • January 2009
Acknowledgements
The contribution of Vodafone’s SIM (Socio‑economic Impactof Mobile) Advisory Panel in instigating and shaping this reportis gratefully acknowledged. Diane Coyle, Advisory Panel chair,edited the report. The panel members are: Professor MarcIvaldi, Ilkka Lakaniemi, David Porteous, Amanda Rowlatt,Professor Len Waverman and Professor Howard Williams.We thank them, and also Neil Gough, Director, Public Policy –Emerging Markets and Joaquim Croca Head of CR Reporting &Performance, of Vodafone, for all their comments and advice.
A report of this scope naturally collects numerous debtsalong the way and we gratefully and humbly acknowledgethe intellectual contribution of many who are mentionedbelow. But equally important has been the contribution of those who remain nameless but without whose wisdom, wewould have fallen short. The farmers and shermen in remotevillages who were gracious with both their time and insights,the technicians, artisans and vegetable vendors who readilyagreed to speak with us for hours with no apparent payoff,the Small and Medium Enterprises that unhesitatingly agreedto our often imposing demands on their time, the farmerscooperative societies, all of them cannot imagine the impacttheir views have had on the quality of this report. To them weowe a huge debt of gratitude.
Collecting information, especially at the sub‑national level inIndia can be taxing at the best of times. The second half of 2008, during which time the team gathered most of the data,gripped as it was by the global nancial crisis, can hardly bedescribed as the best of times. Despite their other exigencies,institutions such as IFFCO‑IKSL, RML, ITC, MSSRF, LabourNet,
JustDial Drishti, Eko, CKS, Friends Tours and Travels, TRAIand their teams of committed and helpful personnel neverinched at our demand for data and interviews. Theycorrected us when we were wrong, took surprisingly deepinterest in our study and helped the ICRIER team to gaininsight into many complex issues. We hope the report doesjustice to their involvement. We place on record our deepappreciation for their support.
We are also grateful to everyone who read, commented andgave advice at various stages of the report’s preparation,including Caroline Dewing and Jim Donahue of Vodafone.Besides, A.R. Thaigarajan, Aditya Dev Sood, Aditya Natesal,Amit Mehra, Anand Kute, Basant Dixit, Gayathri Vasudevan,Gavin d’Abreo, Harish Tomar, Kshitij Karnad, Manoranjan Kumar,Mansi Kohli, Nancy, Nitish Kumar, Nitesh N Bhiwgade, PankajVashisht, Paul Breloff, Pramod Kumar, Prashaant Jain, PraveenGaur, Rakesh Kapur, Rohan Samarajiva, S Senthilkumaran,Shabbir N. Mulla, Siva Kumar, Swapnil Naik, Satyan Misra,Subho Roy, Surendran, T. Sudhakar, Umesh Kumawat andSuresh Tomar all deserve to be thanked. To colleagues atICRIER who stood ready to help at every conceivable hour,
including Christmas, we are much obliged. A special mentionfor Rajkumar Shahi our resident IT expert, who never failed todeliver us from the evils of system crashes, whose frequencypredictably increased as the deadline drew closer.
For any errors remaining in the report, we claim responsibility.

8/6/2019 India: The Impact of Mobile Phones
http://slidepdf.com/reader/full/india-the-impact-of-mobile-phones 65/68
63
India: The Impact of Mobile PhonesMoving the debate forward • The Policy Paper Series • Number 9 • January 2009
Glossary
2G Second Generation o tele standards
3G Third Generation of tele standards
ADC Access Decit Charge
BWA Broadband Wireless Access
COAI Cellular Regulatory Authority of India
CPP Calling Party Pays
CSC Community Service Centre
CSO Central Statistical Organisation
DoT Department of Telecommunication
GDP Gross Domestic Product
GPS Global Positioning SystemGSDP Gross State Domestic Product
ICT Information and Communications Technology
IFFCO Indian Farmers Fertiliser Cooperatives Limited
IKSL IFFCO Kisan Sanchar Ltd.
IP Internet Protocol
ITU International Telecommunications union
MSSRF M.S. Swaminathan Research Foundation
MVAS Mobile Value Added Services
SME Small & Medium EnterprisesMSME Micro, Small and Medium Enterprises
GSM Global System for Mobile
CDMA Code Division Multiple Access
NSS National Sample Survey
RML Reuters Market Light
SMS Short Messaging Service
TRAI Telecom Regulatory Authority of India
USOF Universal Service Obligation Fund
VAS Value Added Service
CKS Center for Knowledge Societies
VOIP Voice‑Over‑Internet Protocol
WAP Wireless Application Protocol
WPC Wireless Planning and Coordination

8/6/2019 India: The Impact of Mobile Phones
http://slidepdf.com/reader/full/india-the-impact-of-mobile-phones 66/68
64
India: The Impact of Mobile Phones Moving the debate forward • The Policy Paper Series • Number 9 • January 2009
Notes

8/6/2019 India: The Impact of Mobile Phones
http://slidepdf.com/reader/full/india-the-impact-of-mobile-phones 67/68
c
India: The Impact of Mobile PhonesMoving the debate forward • The Policy Paper Series • Number 9 • January 2009
To keep the environmental impact of this document to a minimum, we have given careful consideration to the production process. The paper used was manufactured in the UK at mills
with ISO14001 accreditation. It is 75% recycled from de-inked post consumer waste. The document was printed in accordance with the ISO14001 environmental management system.
All the steps we have taken demonstrate our commitment to making sustainable choices.
Designed and produced by Barrett Howe Plc

8/6/2019 India: The Impact of Mobile Phones
http://slidepdf.com/reader/full/india-the-impact-of-mobile-phones 68/68