the impact of mobile phones on household...
TRANSCRIPT
i
THE IMPACT OF MOBILE PHONES ON HOUSEHOLD WELFARE IN INDONESIA: EVIDENCE AND IMPLICATIONS
by
Zaenal Arifin
B. Eng., Bandung Institute of Technology, 2004
Submitted to the Graduate School of Public and International Affairs
in partial fulfillment
of the requirements for the degree of
Master of Public and International Affairs
University of Pittsburgh
2011

ii
UNIVERSITY OF PITTSBURGH
GRADUATE SCHOOL OF PUBLIC AND INTERNATIONAL AFFAIRS
This thesis was presented
by
Zaenal Arifin
It was defended on
December 5, 2011
and approved by
Annemie Maertens, Ph.D., Assistant Professor, Graduate School of Public and International Affairs, University of Pittsburgh
Martin Staniland, Ph.D., Professor, Graduate School of Public and International Affairs, University of Pittsburgh
Sera Linardi, Ph.D., Assistant Professor, Graduate School of Public and International Affairs, University of Pittsburgh
Thesis Advisor: Muge Finkel, Ph.D., Assistant Professor, Graduate School of Public and International Affairs, University of Pittsburgh

iii
Copyright © by Zaenal Arifin
2011
iv
This study seeks to answer to what extent information and communication technology (ICT) can
increase household welfare. It is focused on ICT in the form of telecommunication technologies,
i.e., mobile phones. Using two different mobile phone variables and three different household
welfare measures from Indonesian national survey data, all regressions confirm that mobile
phone ownership had a positive and significant impact on per capita household consumption
during the period of 2006 – 2008. The impact ranged from 5.6% to 15.3% in the increases of per
capita total consumption, depending on the regression model chosen, implying that households
use mobile phones as a tool of finding resources and information linked to economic activities.
Moreover, the mobile phone impact was also higher for those households classified as poor and
for households in the rural areas. Interestingly, however, the impact of mobile phone on per
capita total consumption is greater for non-poor than poor rural households. This finding
indicates that the mobile phone is used as a supplement means or as a production factor to
improve the economic performance of the non-poor rural group.
THE IMPACT OF MOBILE PHONES ON HOUSEHOLD WELFARE IN INDONESIA: EVIDENCE AND IMPLICATIONS
Zaenal Arifin, MPIA
University of Pittsburgh, 2011

v
TABLE OF CONTENTS
PREFACE .................................................................................................................................... IX
1.0 INTRODUCTION ........................................................................................................ 1
1.1 BACKGROUND .................................................................................................. 1
1.2 RESEARCH QUESTIONS AND HYPOTHESES ........................................... 4
1.3 OUTLINE OF THE STUDY .............................................................................. 7
2.0 LITERATURE REVIEW ............................................................................................ 8
3.0 THE CONCEPT OF HOUSEHOLD ECONOMIC MODEL ............................... 11
4.0 ICT POLICIES AND THE MOBILE PHONE INDUSTRY IN INDONESIA .... 15
4.1 ICT POLICIES .................................................................................................. 15
4.2 MOBILE PHONE INDUSTRY ........................................................................ 19
5.0 RESEARCH METHODOLOGY ............................................................................. 22
5.1 DATA .................................................................................................................. 22
5.2 ESTIMATION METHOD ................................................................................ 22
5.3 PANEL CONSTRUCTION .............................................................................. 25
6.0 EMPIRICAL RESULTS AND INTERPRETATION ............................................ 29
6.1 IMPACT ON TOTAL CONSUMPTION ........................................................ 30
6.2 IMPACT ON POOR AND NON-POOR HOUSEHOLDS ............................ 34

vi
6.3 IMPACT ON RURAL AND URBAN HOUSEHOLDS ................................. 35
6.4 IMPACT ON POOR RURAL HOUSEHOLDS AND OTHER GROUPS .. 37
7.0 CONCLUSION AND IMPLICATIONS .................................................................. 41
7.1 CONCLUSION .................................................................................................. 41
7.2 IMPLICATIONS ............................................................................................... 43
7.3 VALIDITY AND FUTURE RESEARCH ....................................................... 44
APPENDIX A .............................................................................................................................. 47
APPENDIX B .............................................................................................................................. 48
BIBLIOGRAPHY ....................................................................................................................... 49

vii
LIST OF TABLES
Table 1. Development in ICT Infrastructures: Comparison of Indonesia, the Asian Pacific
Region, and the World .................................................................................................................. 18
Table 2. Comparison: ICT Infrastructures in ASEAN Member Countries .................................. 19
Table 3. Mobile Phone Companies and Their Coverage ............................................................. 20
Table 4. Variable Names and Descriptions .................................................................................. 27
Table 5. Summary Statistics ......................................................................................................... 28
Table 6. Hausman Test Results .................................................................................................... 29
Table 7. Regressions Results for Total Consumption .................................................................. 31
Table 8. Regressions Results for Poor and Non-poor Households .............................................. 35
Table 9. Regression Results for Rural and Urban Households .................................................... 37
Table 10. Regression Results for Poor Rural Households and Other Groups.............................. 39

viii
LIST OF FIGURES
Figure 1. Development of ICT Infrastructures in Indonesia, 2000 – 2009 .................................. 17

ix
PREFACE
I am deeply indebted to my thesis committee, Dr. Muge Finkel, Dr. Annemie Maertens, Dr.
Martin Staniland, and Dr. Sera Linardi for the invaluable guidance, numerous insights, and
critical comments they provided throughout my research process, and during the writing of my
thesis and my proposal and thesis defenses. I would also like to extend my appreciation to Dr.
Luke Condra, who offered me valuable advice and attended my thesis defense. My sincere
gratitude also goes to the members of the GSPIA community for their immense help and
hospitality during my study in Pittsburgh: Dean John T.S. Keeler, Dr. William N. Dunn, Dr.
Louise K. Comfort, Dr. Barbara Porter, Kelly McDevitt, Michael Rizzi, Renee Kidney, Julia
Korade, Skip Bradburn, Mary Ann Gebet, Shannon Brenner, Diane Kline, Grace Schetley, and
Susan Sawyers.
I owe special thanks to Lindsay Hillenberg of IIE for supporting me to navigate the
various obstacles and challenges that arose throughout my two years education in the United
States, including during my exchange program in Japan and other countries in South East Asia.
Likewise, I would like to express my gratitude to the USAID through HICD and PRESTASI
Programs which made my master’s program and this research possible. Finally, and most
importantly, I am sincerely grateful to my family for their attention, support, and invaluable
encouragement.
1
1.0 INTRODUCTION
1.1 BACKGROUND
Information and communication technology (ICT) are technologies capturing, processing,
storing, displaying, and communicating information through electronic means (Heeks, 1999;
OECD, 2001; ITU, 2009), and these technologies are expected to serve the purpose of
development by providing efficient ways of information gathering, processing, and
dissemination at marginal cost (Song, 2003; ADB, 2003; Adebayo & Adesope, 2007). Due to
the rapid innovation in ICT sectors, ICT has been considered a tool to achieve economic
performance and to meet development goals of both developed and developing countries.
ICT has contributed to increases in companies’ productivity by making business easier to
conduct for the clients, suppliers, and the distributors. For example, the OECD (2001) reports
that the ICT value added represents from 5% to 14% of the total business sector value added in
several OECD member countries in 1999. Furthermore, there is growing recognition of the role
ICT plays in economic growth. According to a study conducted by the Centre for Economic
Research in the UK (Waverman, Meschi, & Fuss, 2001), for instance, a developing country with
an average of 10 mobile phones per 100 in the population between 1996 and 2003 had a per
capita GDP growth more than 0.59% higher than an identical country with fewer phones.
In addition to contributing to economic growth, the access to and use of ICTs can
improve household welfare through various channels of socio-economic development (Song,
2003). In her study, Song found the channels include accelerating economic efficiency,

2
productivity and diversification gains to create positive effects on price and market, providing
access to better social services, such as health and education, enhancing the
integration/participation of the poor or poor livelihoods, and addressing barriers to poverty
reduction such as natural disasters. She further stated that ICT can provide access to more/better
information and save costs and time, which Flor (2001) asserted can generate income. In
addition, ICT can provide opportunities to reduce transaction costs, increase market coverage,
and improve competitiveness, even across borders (World Bank, 2003).
However, few studies have quantitatively established causality between ICT and
household welfare. In fact, many studies have expressed skepticism regarding the benefits of ICT
even on economic development in general (Torero & Braun, 2006). On the macro level, for
example, some studies reveal that socio-economic development contributes to a greater use of
ICT rather than the reverse. Specifically, the access to and use of ICT at household level may be
determined by various factors of households such as income, education, types of economic
activities, etc. (Trung, Tungm, Duc, Duc, & Hung, 2007). The authors of such studies also argue
that access to ICT depends on income, education, and resources and that the so-called “digital
divide”1 is part of a much broader development divide (May, 2010). Moreover, few studies of
ICT related projects which have carried out systematic impact assessments offer results which
are not conclusive about the relationship of ICT to poverty reduction (Batchelor & Sugden,
2003; Slater & Tacchi, 2004; May, 2010). Thus, the question of to what extent ICT have impact
on household welfare remains largely unanswered.
1 Digital divide refers to the gap or imbalance that exists between those who have access to Information and Communications Technology and also to the unequal access to resources. The digital divide can exist between those living in rural areas and those living in urban areas, between the educated and uneducated, between economic classes, and on a global scale, between more and less industrially developed nations (ICT4D, 2008).
3
This study seeks to answer the above question. It will focus on ICT in the form of
telecommunication technologies, i.e., mobile phones, for the following reasons. First, the mobile
phone has been one of the most successful ICT (Braund, Frauscher, Schwittay, & Petkoski,
2006) and the most widespread ICT across the world today, including in developing countries, is
the mobile phone (Furuholt & Matotay, 2011). Second, telecommunication technologies are
viewed as precursors of other advanced ICT services (Chowdhury, 2002). Third, some studies
have concluded that access to mobile phones has a fairly strong impact on people welfare. For
illustration, a study by Aker (2010) reveals that mobile phones have the potential to benefit
consumer and producer welfare and perhaps broaden economic development. One example she
provides to support this assertion is that mobile phones reduce grain price dispersion across
markets by a minimum of 6.4% and reduce intra-annual price variation by 10%.
Further, there has been explosive growth globally in mobile phone access and use, with
private—and in some cases, nonprofit—operations supplying access to poor people by way of
very low-margin, high-volume business models (Spence & Smith, 2010). In Indonesia, the area
of this study, during the period 2005 – 2009, the number of landline telephone subscribers
decreased an average of 0.67% per year; while in contrast, the number of mobile
phone subscribers has increased to 34% (MCI, 2010a). In terms of number of users, the mobile
teledensity2 in Indonesia has increased dramatically, from fewer than 3 million people in 2000 to
more than 150 million people in 2009 (World Bank, 2011; ITU, 2011). This is a dramatic
change, yet no study has explored the potential effects of mobile phones on household welfare in
the country. More importantly, no study has been conducted in the nation-wide context, and the
2 Teledensity is a term commonly used to describe the number of telephone lines per 100 population (ITU, 2010).

4
impact of mobile phones at the micro-level remains under-researched due to data limitations.
Therefore, this study aims to fill this gap.
1.2 RESEARCH QUESTIONS AND HYPOTHESES
This study will demonstrate empirically the relationship between mobile phones and household
welfare3 in Indonesia. Specifically, this study addresses the following questions. Does the use of
mobile phones increase household income? Is the impact of mobile phone usage different for
poor and non-poor households? Does the use of mobile phones have a different impact on
income generation for households living in rural and urban areas? How do mobile phones affect
poor rural households compared to other poor and non-poor in rural and urban areas? Such
questions are important for a country like Indonesia, which has experienced a rapid increase in
the mobile phone industry and given the present government’s commitment to reducing poverty.
Consequently, I expect the results from this study to provide evidence to test the
following hypotheses:
1. Mobile phone use has a positive impact on household total consumption.
By owning a mobile phone, households are expected to increase their income, which will
lead to higher consumption of goods and services. Information is critical for the efficient
functioning of markets (Jensen, 2007), and as a means of information gathering, the mobile
phone increases rapid access to information and enables interactive communication flow
3 Similar to study conducted by Song (2003), household welfare in study is defined as household income. The concept of household income refers to regular receipts such as wages and salaries, income from self employment, interest and dividends from invested funds, pensions or other benefits from social insurance and other current transfers receivable (The Canberra Group, 2001). In this study, household expenditure/consumption is used as a proxy for household income.
5
unhindered by space, volume, medium or time. As a result, mobile phones allow consumers
to seek the lowest price of goods and services. At the same time, with the increased access to
information, mobile phones also facilitate enterprises to increase productivity by acquiring
production inputs faster and from more suppliers, cutting the role of “middleman”, reducing
inter-market price dispersion, simplifying and reducing transaction costs, and at the same
time to expand the existing markets. For specific illustration, farmers can get immediate
information on weather, crop prices, and other production inputs, such as fertilizer and
pesticide, from other farmers in other regions. In other words, my hypothesis is that mobile
phones are used by households in order to seek information to improve the performance of
their economic activities.
2. The impact of mobile phone use is greater for poor households than non-poor households.
The lack of affordable access to necessary information and relevant knowledge among the
poor people has been a concern of development economists. Jensen (2007) argues that access
to information has the ability to empower poor communities, enhance the skills of those who
live in these communities, and link various institutions involved in poverty reduction. For
instance, poor households can use a mobile phone to gain access to information on health,
financial, and government services, and on production, storage and marketing of farm and
non-farm products, which can result in improvement in their productivity and income (Trung
et al., 2007). One of the demonstrated channels through which mobile phones improve the
welfare of the poor people is improved market efficiency and spatial integration (Jensen,
2007; Labonne & Chase, 2009; Aker, 2010). The recent variety of pricing of mobile phone
models offers affordability and choice for poor customers so that they can have access to
6
information. As a result, mobile phone ownership is expected to have a greater impact on
poor households than non-poor households.
3. The impact of mobile phone use is greater for households in rural areas than for those in
urban areas.
According to Bhavnani, Chiu, Janakiram, and Silarszky (2008) the value of mobile phone
services and the associated benefits is higher in rural areas. Obviously, there is a gap between
urban and rural areas in terms of infrastructure and technologies, especially ICT. Barrantes
(2010) points out that in rural areas, people usually lack fixed telephony and public phones
compared to those who live in urban areas. Particularly for many small businesses in rural
areas, mobile phones are the only source of communication and literally essential to their
businesses (Samuel, Shah, & Hadingham, 2005). Therefore, since rural households have
more limited options for communication than urban households, the ownership of mobile
phone service is expected to help rural households gain affordable access to relevant
information and knowledge services which can increase their income and livelihoods.
4. In rural areas, the impact of mobile phones is smaller among the poor than among the non-
poor households.
Considering the second and third hypotheses above, it is expected that the impact of mobile
phones is higher for both the poor households and those who live in rural areas. However,
when the two categories are combined together, the magnitude of mobile phones’ impact
may differ between the poor and non-poor groups. Mainly for rural households, owning a
mobile phone is a necessary condition, not a sufficient condition. While all mobile phone
users are expected to enjoy a positive increase in their total consumption, it is highly possible
that the non-poor group gains more than its poor counterparts because the non-poor rural
7
households start out with more means and sources of income to support their livelihood. In
this sense, a mobile phone is one of those resources which can assist and supplement the non-
poor rural households to achieve a higher consumption level, but it should be interplayed
with other factors.
1.3 OUTLINE OF THE STUDY
The remainder of this study is organized as follows: Chapter two reviews the previous literatures.
Chapter three presents and discusses the concept of household economic model used as
theoretical framework in this study. Chapter four outlines the ICT policies and the development
of the mobile phone industry in Indonesia. Chapter five describes the data which is used and the
methodology. The empirical results are presented and interpreted in Chapter six. Finally, in
Chapter seven, I present conclusion, deliberate implications and identify validity of this study,
and propose directions for the future research.

8
2.0 LITERATURE REVIEW
Few empirical studies have explored mobile phone ownership and its economic impact.
Particularly in developing countries, according to Jagun, Heeks, and Whalley (2008), micro-level
analysis of telecommunication’s impact has been less extensive. One of the pioneer studies in
this field is conducted by Bayes (2001). He examined the effects of village pay phones (VPPs)
from two angles, i.e. owners and buyers of mobile phone services. The VPPs was launched by
Grameen Bank (GB) of Bangladesh in which GB leased mobile phones to its members. Using
the selected random sample of phone owners, consisting of 50 persons in 50 different villages,
which constituted about 60% of all VPP owners, he found that the VPP owners earned an
average net profit of 277 Tk. per week. The profits accruing from phone services constituted
from about one-fifth to one-fourth of their total income. Moreover, based on the sample of users
of VPP services consisting of 400 individuals, which accounted for 27% of all VPP users, Bayes
found that the buyers experienced a surplus of 165 Tk. per user per week. In other words, the
surplus created amounted to 11% of the household income. In sum, the VPP turns mobile phones
into production goods, especially through lowering transaction costs and expanding access to
vital information input for the population.
Current research primarily, however, focuses on the short- to medium-term effect of
mobile phones on search costs, market agents’ behavior, and price dispersion (Aker & Mbiti,
2010). For example, using a panel data set of 300 sardine fishing units between 1997 and 2001

9
to examine the effect of mobile phones on the fisheries sector in Kerala, India, Jensen (2007)
found that the expansion of mobile phone coverage led to a significant reduction in the
dispersion of fish prices across markets as well as a decline in waste. He shows that this led to
important welfare improvements for both the fishermen and the consumers; the fishermen’s
profits increased by 8%, consumer prices declined by 4%, and consumer surplus increased by
6%. With improved access to information via mobile phones, the fishermen became better able
to take advantage of spatial arbitrage opportunities, thereby improving allocative efficiency.
Furthermore, using a panel data set of 395 traders and 205 farmers between 2005 and
2007 in Niger, Aker (2008) found that mobile phones reduced grain price dispersion across
markets by a minimum of 6.4% and reduced intra-annual price variation by 10%. Prior to the
introduction of mobile phones, search costs were prohibitively high, hence mobile phones reduce
price dispersion and lower transaction costs. Mobile phones increased traders’ welfare, primarily
by increasing their sales prices, as they were able to take advantage of spatial arbitrage
opportunities. Hence, she concluded that the introduction of mobile phones can be associated
with increased trader and consumer welfare. Specifically, the net effect of the sales prices was an
increase in average daily profits, equivalent to a 29% increase per year. In Aker’s study,
however, the effects of mobile phones upon farmers’ welfare were not measured.
To address the lack of measurement in Aker’s study, Muto and Yamano (2009)
conducted a similar study to estimate the impact of mobile phones on agricultural markets in
Uganda, focusing on farmers’ market participation rather than market efficiency. Using a panel
dataset of 856 farm households between 2003 and 2005 in 94 communities, they found that
mobile phone coverage was associated with a 10% increase in farmers’ probability of market
participation for bananas, although not maize; this suggests that mobile phones are more useful
10
for perishable crops. Moreover, the effect of mobile phone coverage was greater for farmers
located in communities farther away from district centers. While the authors do not empirically
explore the specific mechanisms behind their results, they suggest that improved access to price
information reduced marketing costs and increased farm-gate prices, thereby increasing
productive efficiency.
Further, Donner (2007) conducted a study of the use of mobile phones by
microentrepreneurs in Kigali, Rwanda. This study examines actual calling behavior by analyzing
recent calls and text messages made and received on users’ mobile phones. Based on sample of
277 respondents, Donner found that microentrepreneurs use their mobile phones to increase the
frequency of their contact with friends, family, and existing business contacts and to facilitate
new contacts with business partners, suppliers, and customers. Specifically, he demonstrated
changes to microentrepreneurs’ social and economic networks, facilitated by mobile phone
ownership and use, in which 20% of all the call partners were new to respondents’ networks and,
of the 80% whose relationships predated the mobile. In addition, the study also reveals that the
proportion of new entrants, who were concentrated in business calls, was highest, a predicted
38%, among the business-related call partners of those who own only a mobile phone.
An interesting study done by Labonne and Chase (2009) reveals that there is a positive
impact of access to information on poor farmers’ consumption in the Philippines. The study
combines spatially coded data on mobile phone coverage with household panel data on farmers
from some of the poorest areas of the Philippines. The regression results indicate that over the
2003 – 2006 period studied, farmers purchasing a mobile phone experienced a higher growth rate
in per capita consumption, ranging from 11 % to 17 %. The findings of this study suggest that
information technologies can contribute to poverty reduction in developing countries.

11
3.0 THE CONCEPT OF HOUSEHOLD ECONOMIC MODEL
Building upon agricultural household modeling (AHM) by Singh, Squire, and Strauss (1986) and
others, the objective of this theoretical framework is to provide a brief overview of household
economics. In most developing countries, as pointed out by Singh et al. (1986), agriculture
remains a principal source of income for the majority of the population, an important earner
of foreign exchange, and a central concern of government policymakers. Approximately 70%
of the labor force in the developing countries in the 1980s and about three quarters in the least
developed countries in the 1990s were employed in the agricultural sector (Bardhan & Udry,
1999). Likewise, since the 1970s, Indonesia has been a predominantly agrarian economy, with
agriculture contributing the largest share to gross domestic product (GDP), employment, and
export earnings (ADB, 2006). According to data from the Indonesian Central Statistical Agency
[BPS] (2010), agriculture has remained the largest sector in the country in terms of employment,
with 42.83 million people, or almost 40% for the population, making up the agriculture labor
force in 2010. Originally envisioned as a tool for price policy analysis, Taylor (2002) suggests
that the AHM has been used in a design of research ranging from technology adoption and
migration to deforestation and biodiversity.
Most households in the agricultural sector produce crops partly for sale and partly for
personal consumption. They also purchase some of their production inputs (such as fertilizer)
and provide some (household labor, for example) from their own resources. As a result,

12
households make simultaneous decisions about production (the level of output, the demand for
production factors, and the choice of technology) and consumption (labor supply and commodity
demand). The model of the household that is jointly engaged in production and consumption is
called commonly the AHM. Although the model is derived from the behavior of agriculture
households, the AHM can be applied as well to households that operate enterprises such as
small-scale trading or petty manufacturing (Bardhan & Udry, 1999), or to all but agribusiness-
operated commercial farms, which consume a very small share, if any, of their own output and
supply few, if any, of their own inputs (Taylor, 2002).
Singh et al. (1986) formulate the AHM by assuming a simple agricultural household that
produces one crop, for example rice, has a fixed amount of land, and uses one variable input, i.e.
family labor. In the production activities, the household consumes some of the rice, and sells
some in order to buy a nonagricultural commodity. Furthermore, Singh et al. (1986) assume that
the household can sell rice at a fixed price and buy labor at a fixed wage. The household cannot
consume more rice or more leisure (that is, reduce its labor supply or use more hired laborers)
than is allowed by its total income.
Because income contributes positively to total household utility or satisfaction, the
household will attempt to achieve the largest profit possible from its fixed quantity of land. This
implies that the household will want to hire labor until the marginal revenue product of labor
equals the market wage and so achieve maximum profits. In order to approximate the profit-
maximizing solution, households therefore require information on prices, which in this case
includes the price of rice and the wage rate, and information on the technological relationships
between inputs and outputs. These pieces of information are important for the households to
balance wages and marginal revenue from their product. Therefore, the importance of such
13
information, and technology linking inputs and outputs, coupled with the context of Indonesia as
an agricultural and developing country, lead to the AHM as the appropriate theoretical
framework for this study.
The basic idea of the AHM is that the household’s objective is to maximize utility subject
to constraints. Accordingly, based on the above explanation and this idea, Singh et al. (1986)
propose that for any production cycle, the household is assumed to maximize a utility function:
U = U (Χa, Xm, Xl) (2-1)
where the commodities are an agricultural (Xa), a market purchased good (Xm), and leisure (Xl).
For the household, leisure is achieved by reducing its labor supply and using more hired laborers.
Utility is maximized subject to a cash income constraint:
pmXm = pa(Q - Xa) - ԝ(L - F) (2-2)
where pm and pa are the prices of the market-purchased commodity and the staple, respectively,
Q is the household's production of the staple (so that Q - X, is the staple’s marketed surplus), ԝ
is the market wage, L is total labor input, and F is family labor input (so that L - F, if positive, is
hired labor and, if negative, off-farm labor supply).
Besides a cash income constraint, the household also faces a time constraint-it cannot
allocate more time to leisure, on-farm production, or off-farm employment than the total time
available to the household:
Xl + F = T (2-3)
where T is the total stock of household time. Moreover, the household also faces a production
constraint or production technology that depicts the relation between inputs and output:
Q = Q (L, A) (2-4)

14
where A is the household's fixed quantity of land.
The above three constraints on household behavior can be collapsed into a single
constraint. Substituting the production constraint into the cash income constraint for Q and
substituting the time constraint into the cash income constraint for F yields a single constraint of
the form
pmXm + pmXa + ԝXl= π +ԝT (2-5)
where π = paQ(L, A) - ԝL and is a measure of farm profits. In this equation, the left-hand side
shows total household "expenditure" on three items-the market-purchased commodity, the
household's "purchase" of its own output, and the household's "purchase" of its own time in the
form of leisure. The right-hand side represents a concept of full income in which the value of the
stock of time (ԝT) owned by the household is explicitly recorded. Equations (2-1) and (2-5) are
the base AHM postulated by Singh et al. (1986) and are used as the core of all the studies of
agricultural households reported in their book.

15
4.0 ICT POLICIES AND THE MOBILE PHONE INDUSTRY IN INDONESIA
4.1 ICT POLICIES
Indonesia has adopted ICT as a tool for governance and development. Its national ICT vision, is
“to bring into reality a modern information society, prosperous and highly competitive, with
strong support by ICT,” is reflected in the several policies that serve as the country’s ICT
framework. Of the numerous policies issued by the government in support of this vision, the first
initiative was the Telecommunication Act No. 36/1999 along with the Blueprint of Government
Policy on the Telecommunication Development Strategy. The Act and the Blue Print give
directions for telecommunication sector reform, which covers the importance of making new
policy on restructuring and liberalizing the telecommunication industry.
The government then issued Presidential Decree No. 50/2000, which included
establishing the National Coordinating Team of ICT. The main task of the team is to coordinate
the development and the utilization of ICT in all sectors from government agencies in Indonesia.
Furthermore, in April 2001, Presidential Instruction No. 6/2001 was issued, containing a five-
year National ICT Plan of Action for Indonesia. This was followed by the formation of an ICT
Coordinating Team by virtue of Presidential Decree No. 9/2003 and the issuing of Presidential
Instruction No. 3/2003 concerning National Policy on e-Government Development. The
government has also planned the year of 2015 to be the year of Indonesia Information Society,
16
where ICT will be an effective tool in the implementation of government, and in the business and
public sectors and also the social stratum communication or ICT for all (MCI, 2010a).
In addition to the above policies, the government has established some government
bodies to deal with ICT issues. In 1999, the government established the Ministry of
Communication and Information (MCI). The ministry is responsible for national policy
formulation, policy implementation, and technical policies in the field of communication and
informatics, including the post, telecommunications, broadcasting, information technology and
communications, multimedia services and the dissemination of information. Moreover, the MCI,
in collaboration with the private sector, develops several programs in efforts to optimally
develop ICT for increasing governance and the quality of government services. Besides MCI, the
government also established the State Ministry of Research and Technology, which handles
coordination of research on expanding the ICT infrastructure through telecommunications and
internet application development, digital broadcasting, development of energy-saving and low-
cost computers, and open source applications. The Indonesian National ICT Council was
established in 2006 to accelerate Information and Communication Technology (ICT) growth
through policies that would synchronize the ICT programs of all government departments,
ministries, and agencies.
17
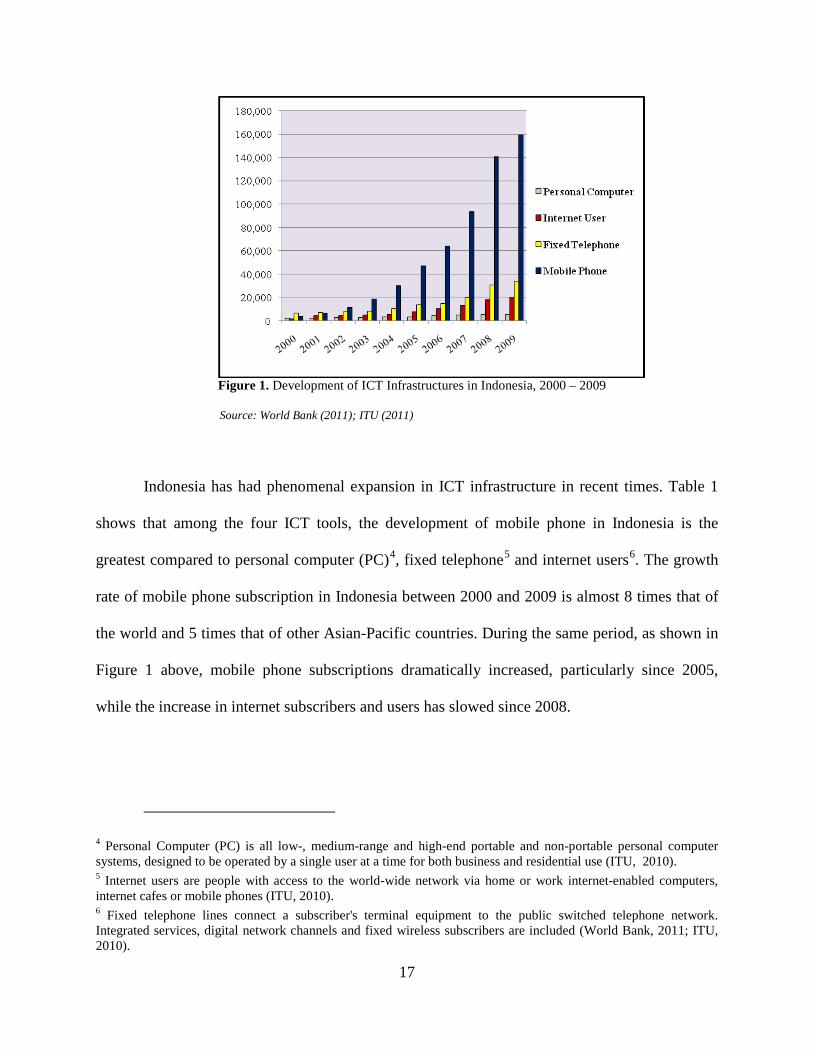
Figure 1. Development of ICT Infrastructures in Indonesia, 2000 – 2009
Source: World Bank (2011); ITU (2011)
Indonesia has had phenomenal expansion in ICT infrastructure in recent times. Table 1
shows that among the four ICT tools, the development of mobile phone in Indonesia is the
greatest compared to personal computer (PC)4, fixed telephone5 and internet users6. The growth
rate of mobile phone subscription in Indonesia between 2000 and 2009 is almost 8 times that of
the world and 5 times that of other Asian-Pacific countries. During the same period, as shown in
Figure 1 above, mobile phone subscriptions dramatically increased, particularly since 2005,
while the increase in internet subscribers and users has slowed since 2008.
4 Personal Computer (PC) is all low-, medium-range and high-end portable and non-portable personal computer systems, designed to be operated by a single user at a time for both business and residential use (ITU, 2010). 5 Internet users are people with access to the world-wide network via home or work internet-enabled computers, internet cafes or mobile phones (ITU, 2010). 6 Fixed telephone lines connect a subscriber's terminal equipment to the public switched telephone network. Integrated services, digital network channels and fixed wireless subscribers are included (World Bank, 2011; ITU, 2010).
18
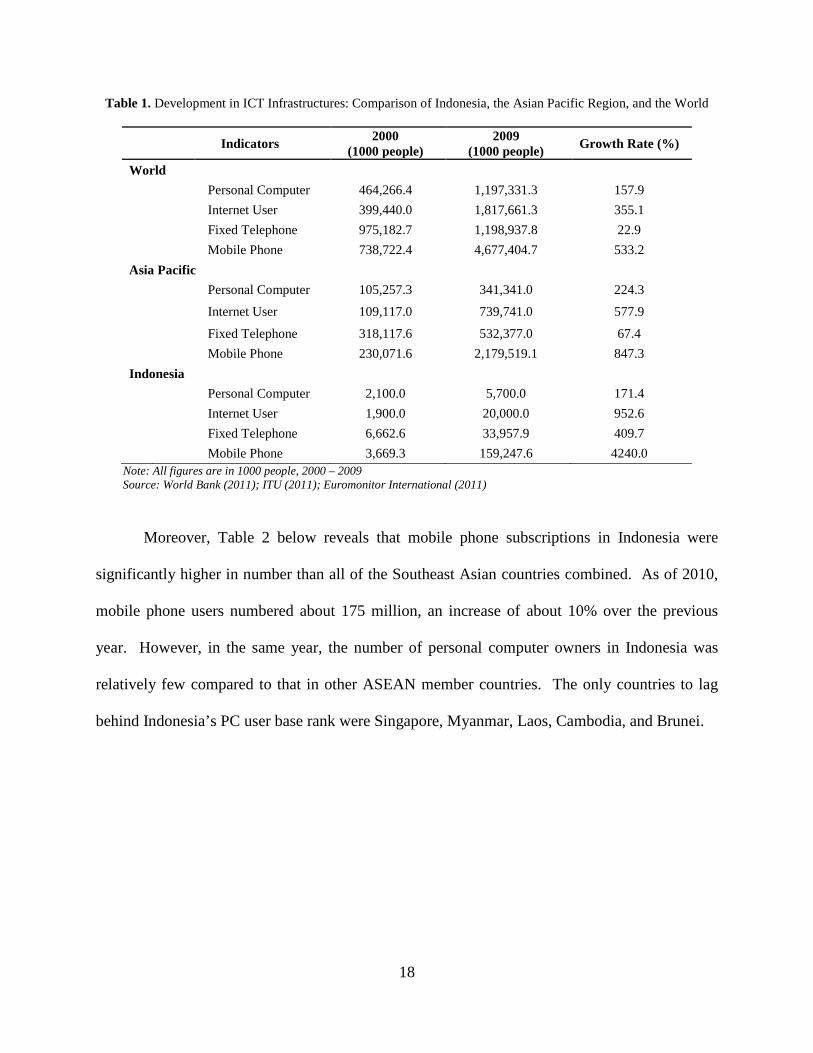
Table 1. Development in ICT Infrastructures: Comparison of Indonesia, the Asian Pacific Region, and the World
Indicators 2000 (1000 people)
2009 (1000 people) Growth Rate (%)
World Personal Computer 464,266.4 1,197,331.3 157.9
Internet User 399,440.0 1,817,661.3 355.1
Fixed Telephone 975,182.7 1,198,937.8 22.9
Mobile Phone 738,722.4 4,677,404.7 533.2 Asia Pacific
Personal Computer 105,257.3 341,341.0 224.3
Internet User 109,117.0 739,741.0 577.9
Fixed Telephone 318,117.6 532,377.0 67.4
Mobile Phone 230,071.6 2,179,519.1 847.3 Indonesia
Personal Computer 2,100.0 5,700.0 171.4
Internet User 1,900.0 20,000.0 952.6
Fixed Telephone 6,662.6 33,957.9 409.7
Mobile Phone 3,669.3 159,247.6 4240.0 Note: All figures are in 1000 people, 2000 – 2009 Source: World Bank (2011); ITU (2011); Euromonitor International (2011)
Moreover, Table 2 below reveals that mobile phone subscriptions in Indonesia were
significantly higher in number than all of the Southeast Asian countries combined. As of 2010,
mobile phone users numbered about 175 million, an increase of about 10% over the previous
year. However, in the same year, the number of personal computer owners in Indonesia was
relatively few compared to that in other ASEAN member countries. The only countries to lag
behind Indonesia’s PC user base rank were Singapore, Myanmar, Laos, Cambodia, and Brunei.

19
Table 2. Comparison: ICT Infrastructures in ASEAN Member Countries
Country Personal Computer
Internet User
Fixed Telephone
Mobile Phone
Brunei 51.8 335.3 80.5 435.4 Cambodia 68.8 84.9 59.7 7,494.4 Indonesia 6,119.8 28,406.6 36,424.6 174,932.8 Laos 201.5 364.2 140.5 3,753.8 Malaysia 9,238.6 16,518.0 4,988.7 32,387.4 Myanmar 657.3 132.5 566.0 601.5 Philippines 10,068.1 9,458.0 7,412.2 100,021.1 Singapore 3,950.8 3,466.5 1,945.5 7,216.0 Thailand 7,851.6 19,824.2 7,245.1 72,084.3 Vietnam 11,512.9 25,495.5 19,088.2 104,413.4
Note: All figures are in 1000 people, 2010 Source: World Bank (2011); ITU (2011); Euromonitor International (2011)
4.2 MOBILE PHONE INDUSTRY
The mobile phone industry in Indonesia has grown rapidly over the past decade. According to
MCI (2010b), by the end of 2001, the country had only around 13.25 million phone lines (fixed
and mobile), equivalent to 6.77% of the population. However, by 2005 mobile penetration
increased significantly at 20%, and five years later, in 2010, more than half of the population had
mobile phones, while the number of landlines declined by 10%. More specifically, by early
2008, the total mobile subscriber base in the country had passed 90 million, up from 12 million
just six years earlier, and it was expected that the milestone of 120 million mobile subscribers
would have been reached by the end of 2008 (Business Wire, 2008). Moreover, according to ITU
(2010), Indonesia’s mobile market has continued to expand at around 50% per annum and its
penetration rate, as of September 2009, was 56.8%.
Additionally, the mobile phone industry in the country is also marked by a great number
of telecommunication providers. According to data from MCI (2010b), the three biggest mobile
20
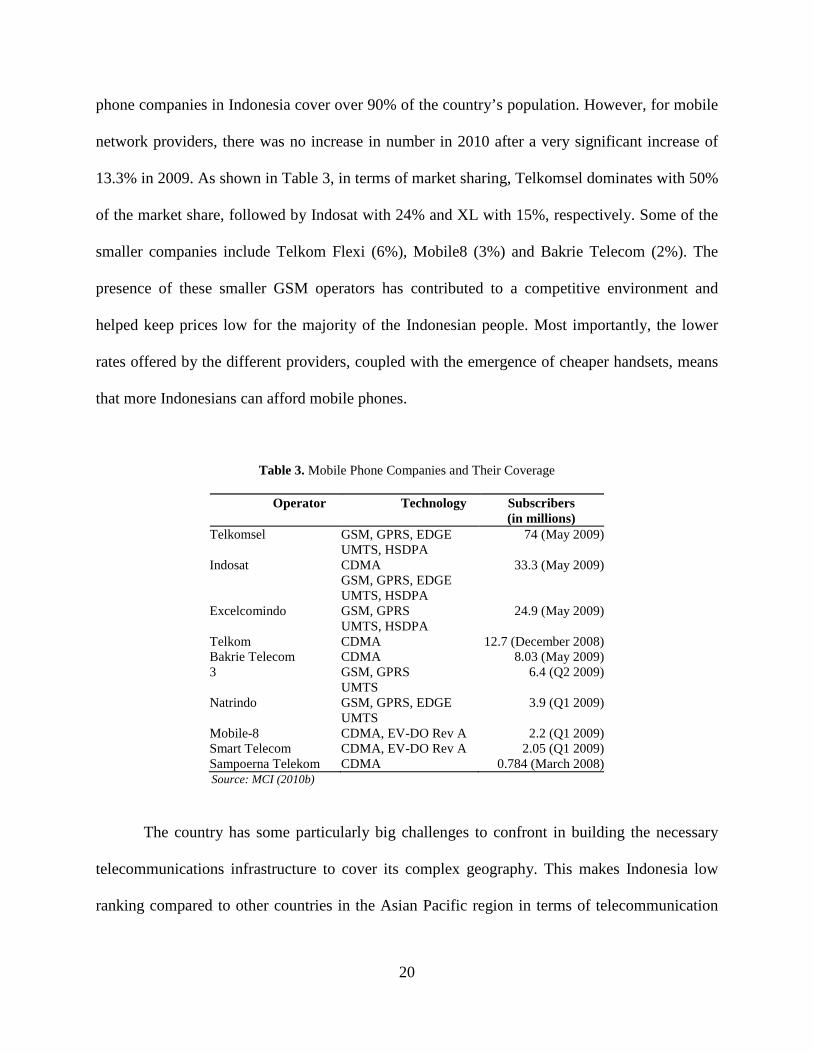
phone companies in Indonesia cover over 90% of the country’s population. However, for mobile
network providers, there was no increase in number in 2010 after a very significant increase of
13.3% in 2009. As shown in Table 3, in terms of market sharing, Telkomsel dominates with 50%
of the market share, followed by Indosat with 24% and XL with 15%, respectively. Some of the
smaller companies include Telkom Flexi (6%), Mobile8 (3%) and Bakrie Telecom (2%). The
presence of these smaller GSM operators has contributed to a competitive environment and
helped keep prices low for the majority of the Indonesian people. Most importantly, the lower
rates offered by the different providers, coupled with the emergence of cheaper handsets, means
that more Indonesians can afford mobile phones.
Table 3. Mobile Phone Companies and Their Coverage
Operator Technology Subscribers (in millions)
Telkomsel GSM, GPRS, EDGE UMTS, HSDPA
74 (May 2009)
Indosat CDMA GSM, GPRS, EDGE UMTS, HSDPA
33.3 (May 2009)
Excelcomindo GSM, GPRS UMTS, HSDPA
24.9 (May 2009)
Telkom CDMA 12.7 (December 2008) Bakrie Telecom CDMA 8.03 (May 2009) 3 GSM, GPRS
UMTS 6.4 (Q2 2009)
Natrindo GSM, GPRS, EDGE UMTS
3.9 (Q1 2009)
Mobile-8 CDMA, EV-DO Rev A 2.2 (Q1 2009) Smart Telecom CDMA, EV-DO Rev A 2.05 (Q1 2009) Sampoerna Telekom CDMA 0.784 (March 2008)
Source: MCI (2010b)
The country has some particularly big challenges to confront in building the necessary
telecommunications infrastructure to cover its complex geography. This makes Indonesia low
ranking compared to other countries in the Asian Pacific region in terms of telecommunication

21
infrastructures, although if we consider the attractiveness indicator,7 Indonesia is in the 23rd
position (ITU, 2009). Despite the growing market of the mobile phone industry, the digital
divide is sharp not only between Indonesia and its peers but within Indonesia itself. In the eastern
areas of the country, for example Maluku, Papua, and Nusa Tenggara, only 0.02 percent of the
population has fixed telephones. More than half of Indonesia's 70,000 villages (or about 43,000
villages) do not have access to any public telephones (Samarajiva & Zainudeen, 2008). As a
result, the availability of pre-paid mobile phone cards is expected to offer various coverage and
networks in those provinces so that the mobile phone technology can offer much-needed basic
telecommunication services to previously underserved communities.
7 The attractiveness indicator is one of the many indicators foreign investors usually use for deciding whether or not to invest in the telecommunication sector in a particular country. The indicator is calculated using the ratio between the penetration of telephone lines and the GDP per capita, which reflects the availability of telephone lines compared to the affordability of the country. In general, the smaller the number, the most attractive the country is to investment (ITU, 2009).
22
5.0 RESEARCH METHODOLOGY
5.1 DATA
For my analysis, I use data from the National Socioeconomic Survey (Susenas) collected by the
Indonesian National Statistics Agency (BPS). The survey is cross-sectional in design and was
administered at the household level. The robustness of any empirical analysis depends on the
quality of the data available and this study is no exception. Therefore, this study focuses on the
years 2006 to 2008 for two important reasons. First, though the section “ICT” was initially
included in the Susenas in 2005, the data available for the 2005 Susenas was not complete for all
provinces in Indonesia. Second, at the time of writing, although data from Susenas on mobile
phone ownership for the whole country only was available through 2009, the 2009 Susenas had a
different version of questionnaire than previous years. Therefore, to avoid any inconsistency,
only observations from 2006 – 2008 are included in the economic estimates.
5.2 ESTIMATION METHOD
Recall that equation (2-5) of the AHM model estimates profit π of the household in producing
and consuming a commodity i as follows:

23
πi = pm Xm + pmXa + ԝXl - ԝT (5-1)
where the right-hand side is the amount of all purchased inputs devoted to producing and
consuming a commodity, with pm representing the prices of the market-purchased commodity
and Xm, Xa, and Xl being an agricultural input, a market purchased good, and leisure, respectively.
Now if the household maximizes profit, and time allocated for leisure (ԝXl ) and the stock of time
(wT) are not constraints for the household to run the small-scale economic activities, mainly due
to the fact that they provide their family labor, the household will use all the profit for
consumption. This implies that household consumption depends directly on the production
constraints, i.e. production inputs owned by the household and purchased from market.
Therefore, equation (5-1) can be transformed as:
πi = pm (Xm + Xa) (5-2)
The mobile phone can be one of the production inputs because Singh et al. (1986) stated
that in order to approximate the profit-maximizing solution, households require information on
prices and the technological relationships between inputs and outputs. In this regard, mobile
phone can affect the production process by improving access to information and so allowing
functioning markets to work better (Jansen, 2007), by reducing search costs and inter-market
price dispersion (Aker, 2010) or by affecting “directly productive” uses, such as communicating
with clients, suppliers or producers’ associations and agricultural profits (Barrantes, 2010).
Based on the above function, I estimate the impact of mobile phone usage on household
per capita consumption, controlling other factors influenced to household consumption. If i
represents household and t represents time, the basic empirical model for this study is given as:
24
Cit = αit + β1MOBit+ β2CVit + µi + εit t = 1, 2,…, T (5-3)
where Cit is a measure of total household consumption of family i at year t. MOB is a variable
equal to one if household i at year t owns a mobile phone and zero otherwise. CV is a vector of
control variables that vary across households and time. The µi represents unobservable variables,
time-invariant heterogeneity across households arising from differences in location. The α, β1,
and β2 are coefficients to be estimated.
However, a problem exists with this equation due to a suspected correlation between
MOB and µi. This would mean that the error term ε becomes related to MOB so that β estimated
with the Ordinary Least Squares (OLS) regression model would be biased. Using a fixed effects
estimator on the panel data can resolve this problem. The fixed effects estimator has the ability to
control for unobservable variables. Therefore, under a strict exogeneity assumption for the
control variables, the regression model is unbiased, meaning the error term ε should be
uncorrelated with each explanatory variable across all time periods (Wooldridge, 2009). Now,
for each household i, if I average equation (5-3) over time, the equation can be written as:
Ci = αi + β1MOBi+ β2CVi + µi + εi (5-4)
Because µi is fixed over time, it appears in both equation (5-3) and (5-4). If I subtract (5-
4) from (5-3) for each t, the new equation is constructed as:
Cit–Ci = αit–αi + β1(MOBit–MOBi)+ β2(CVit–CVi) + µit–µi+ εit–εi (5-5)
∆Cit = ∆αit + ∆β1MOBit+ ∆β2CVit + ∆εit t = 1, 2,…, T (5-6)
From the equation (5-6), the unobserved effect has disappeared, as µi = 0 and time-
constant unobserved heterogeneity is no longer a problem. For this reason, I apply the empirical

25
estimation method using the fixed effect panel data model for equation (5-6). Accordingly, this
model permits regressors to be endogenous, provided that they are correlated only with a time-
invariant component of the error. Prior to this regression, to distinguish between fixed and
random effects, the Hausman test will be performed with the null hypothesis being that random
effects are consistent and efficient and the alternative being that random effects are inconsistent
(Cameron & Trivedi, 2009).
5.3 PANEL CONSTRUCTION
With the information available from the Susenas, I construct a panel dataset which contains
information on the household level. The predictor variable is mobile phone ownership for each
household, while the outcome variable of interest is household consumption. According to The
Canberra Group (2001) there are difficulties in collecting data on both income and
expenditure/consumption in household surveys. Income is a sensitive issue for many respondents
and non-response or misreporting of some income components may be significant. Moreover, the
manual of Susenas (BPS, 2002) says that it collects information on household
expenditure/consumption rather than income. Hence, per capita total consumption8, is used as
the basic measure of household income in this study. Nevertheless, the danger of using
consumption as a proxy for household income is that mobile phone can increase consumerism,
which can increase consumption without increasing income.
8 Per capita total consumption is total household consumption divided by the number of household members. The total consumption measure includes food and nonfood goods and services, whether purchased, home-produced, or received as a gift or payment in kind.
26
The traditional parameterization of the income distribution is log normal, while the
distribution of consumption is also close to log normal, and is in fact closer to log normal than
income (Battistin, Blundell, & Lewbel, 2009). This is true, as shown in Appendix A, the
distribution of the per capita total consumption is positively skewed, where the mass of the data
distribution is concentrated on the left of the figure. It is because of the data has relatively few
high values. As a consequence of this distribution, I take the normal logarithm in order to make it
normal, as we can see in Appendix B. The normal distribution of the per capita consumption also
satisfies the assumption of an OLS model.
In addition, I consider several control variables. First is the household’s ownership
status of their occupied residential buildings and any business loans they have from the
government or private entities, which variables both reflect physical capital of the household.
Government subsidies in the form of cheap rice, measured by the quantity times the price of the
rice, are also considered as a control variable. Furthermore, I also observe variables associated
with human capital stock. The variables included in this category are: household size, indicated
by the number of household members; age of household head, sex of household head,
employment status, a dummy for the household head having been an outpatient in the previous
month and an inpatient in the previous year, which reflects his/her ability to perform in economic
activities, particularly in order to earn income; and accumulated human capital, based on the
educational level of the household head. Further, the panel data also includes two dummy
variables that capture whether the household can be categorized as poor or non-poor and whether
the household is located in an urban or rural area. The two dummy variables are chosen in order
to see the different impact of mobile phone usage in both groups and both areas. The variables
and their descriptions are presented in Table 4 below.

27
Table 4. Variable Names and Descriptions
Variable Description Hhid Household identification number Year Year of observations Total consumption Normal logarithm per capita total consumption Mobile phone A dummy for owning mobile phone 1=Yes 0=No Number of mobile phones Number of mobile phones owned in the household Own home A dummy of ownership status of occupied residential building 1=privately
owned 0=not privately owned Received work loan A dummy for receiving work loan 1=Yes 0=No Quantity of cheap rice Quantity (kilograms) of cheap rice bought by household Price of cheap rice Price of cheap rice bought by household Receive cheap rice A dummy for ..Government subsidies in form of cheap rice (quantity times
price of the rice) Insurance A dummy of health insurance held by household 1=Yes 0=No Household size Household size Head age Age of household head Head Sex A dummy for household head’s sex 1=Male 0=Female Job status A dummy for employment status of household head 1=Business owner
0=Worker Outpatient A dummy for household head who has been an outpatient in the last 1 month
1=Yes 0=No Inpatient A dummy for household head who has been an inpatient in the last 1 year
1=Yes 0=No Education diploma A dummy of highest education diploma held by household head 1=above
compulsory education 0=up to compulsory education (no diploma to junior high school)
Poor Household categorized as poor 1=Yes 0=No Rural Area classification 1=Rural 0=Urban
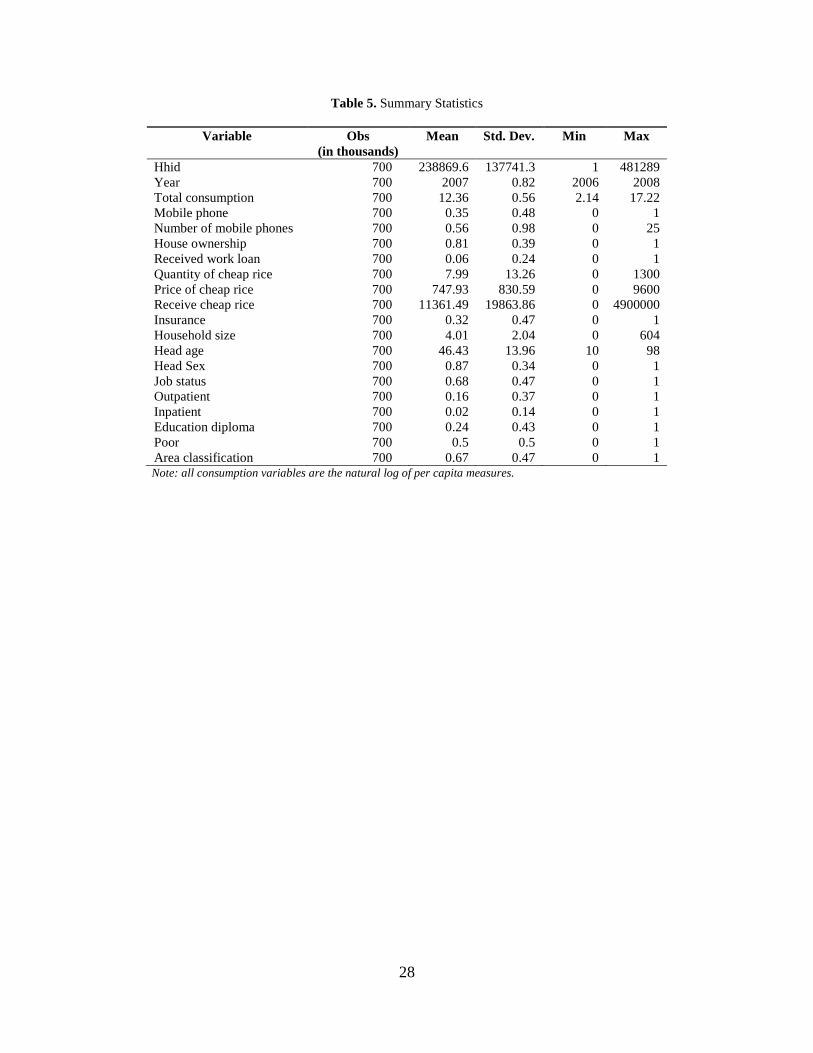
Table 5 provides summary statistics. As the most basic use of statistics, the table is used
to describe distributions, particularly the measures of central tendency (Acock, 2008). The table
summarizes unbalanced panel data which is merged from two different panel data sets.9 For the
purpose of this study, I only include the data which has the same level of analysis. I also exclude
any observation where the outcome is recorded as not matched. Consequently, after merging
there are 700,605 observations which are matched.
9 The first panel data contains basic variables at the household level with 725,759 observations; meanwhile the second panel data comprises all variables categorized as human capital stock at the individual level with total observations of 706,718.
28
Table 5. Summary Statistics
Variable Obs (in thousands)
Mean Std. Dev. Min Max
Hhid 700 238869.6 137741.3 1 481289 Year 700 2007 0.82 2006 2008 Total consumption 700 12.36 0.56 2.14 17.22 Mobile phone 700 0.35 0.48 0 1 Number of mobile phones 700 0.56 0.98 0 25 House ownership 700 0.81 0.39 0 1 Received work loan 700 0.06 0.24 0 1 Quantity of cheap rice 700 7.99 13.26 0 1300 Price of cheap rice 700 747.93 830.59 0 9600 Receive cheap rice 700 11361.49 19863.86 0 4900000 Insurance 700 0.32 0.47 0 1 Household size 700 4.01 2.04 0 604 Head age 700 46.43 13.96 10 98 Head Sex 700 0.87 0.34 0 1 Job status 700 0.68 0.47 0 1 Outpatient 700 0.16 0.37 0 1 Inpatient 700 0.02 0.14 0 1 Education diploma 700 0.24 0.43 0 1 Poor 700 0.5 0.5 0 1 Area classification 700 0.67 0.47 0 1
Note: all consumption variables are the natural log of per capita measures.

29
6.0 EMPIRICAL RESULTS AND INTERPRETATION
This section presents regression results in light of the framework for analysis and underlying
hypotheses described above. In order to determine between fixed or random effects, the
Hausman test was performed for the baseline model with the null hypothesis being that random
effects would be consistent and efficient and the alternative being that random effects would be
inconsistent. The test results, as shown in Table 6, confirm that the Prob>chi2 is 0.00 (below
0.05) so that I fail to reject the null hypothesis, and therefore, I have to use a fixed effects (FE)
model. The essential advantage of this model is that it can eliminate any concern that variation in
mobile phone ownership is driven by some unobserved time-invariant factor that also causes
changes in household consumption.
Table 6. Hausman Test Results
Coefficients (b) (B) (b-B) sqrt(diag(V_b-V_B))
fixed random Difference S.E.
Mob .1158671 .3252055 -.2093384 .00209 B = consistent under Ho and Ha; obtained from xtreg B = inconsistent under Ha, efficient under Ho; obtained from xtreg Test: Ho: difference in coefficients not systematic chi2(1) = (b-B)'[(V_b-V_B)^(-1)](b-B)
= 10032.29
Prob>chi2 = 0.0000

30
6.1 IMPACT ON TOTAL CONSUMPTION
The regression results, presented in Table 7, confirm my expectations, indicating that mobile
phone ownership has a positive and significant impact on per capita household total
consumption. It is important to note that because the per capita total consumption is in natural
logarithm form, I needed to convert it into exponential form. Another consideration is that all
regressions in this study compare households who have and do not have a mobile phone.
Therefore, in the baseline model (M1), when I exclude human capital variables, it shows that if
the household owns a mobile phone, its per capita total consumption is 1.11 higher than the
households which do not. This coefficient means that per capita total consumption of the mobile
phone user is estimated to have increased by about 11.1% during the period 2006 – 2008. Model
1 also indicates the variables house ownership, credit access, and government subsidy are
significant at 5 percent or better level.
For Model 2, where I include both basic and human capital variables, the impact of
mobile phone usage on per capita total consumption is higher than in Model 1, i.e. 12.2%,
holding other variables constant. This means that the human capital stock and the characteristics
of the household have an important impact on its total consumption. For instance, a higher
education attainment level and age of the household head imply a stronger ability to be
productive and generate more income. In summary, those variables strengthen the impact of
mobile phone usage on the household income, particularly because of the fact that factors such
as, literacy, being healthy, being young, and so forth are conducive to ICT absorption.

31
Table 7. Regressions Results for Total Consumption
Variables Total Consumption M1 M2 M3 M4
Mobile phone 0.1053*** 0.1151***
0.1091***
(0.00) (0.00)
(0.00)
Number of mobile phones
0.0388*** 0.004*
(0.00) (0.00)
House ownership 0.0004 0.0579*** 0.0547*** 0.0574***
(0.00) (0.00) (0.00) (0.00)
Received work loan -0.0150** 0.0039 0.0117* 0.0037
(0.00) (0.00) (0.00) (0.00)
Government rice subsidy -0.0000*** -0.0000*** -0.0000*** -0.0000***
(0.00) (0.00) (0.00) (0.00)
Insurance 0.0294*** 0.0088*** 0.0066** 0.0085***
(0.00) (0.00) (0.00) (0.00)
Household size
-0.0847*** -0.0853*** -0.0849***
(0.00) (0.00) (0.00)
Head age
0.0011*** 0.0010*** 0.0011***
(0.00) (0.00) (0.00)
Head sex
0.0201*** 0.0216*** 0.0202***
(0.00) (0.00) (0.00)
Job status
0.0244*** 0.0242*** 0.0246***
(0.00) (0.00) (0.00)
Outpatient
0.0012 0.0032 0.0012
(0.00) (0.00) (0.00)
Inpatient
0.0411*** 0.0421*** 0.0410***
(-0.01) (-0.01) (-0.01)
Education diploma
0.1743*** 0.1818*** 0.1736***
(0.00) (0.00) (0.00)
Constant 12.3434*** 12.5074*** 12.5347*** 12.5092***
(0.00) (-0.01) (-0.01) (-0.01)
R-sqr: within 0.018 0.127 0.123 0.127 between 0.096 0.195 0.181 0.195 overall 0.088 0.184 0.173 0.185 Number of Observations 700544 700544 700544 700544 Note: all consumption variables are the natural log of per capita measures. Robust standard error in parentheses. Significance are denoted by asterisks with * p<0.1; ** p<0.05; *** p<0.01.
Further, with Model 3 and 4, I estimate the impact of having more than one mobile phone
in the household on per capita total consumption. The coefficient of number of mobile phones in
Model 3 is much lower that of the previous two models, but still statistically different from zero
at the 1 percent significance level. The coefficient represents a 3.9% increase in household
consumption for each phone owned by the household. Unpredictably, Model 4 suggests that the
additional mobile phone in the household does not necessarily have a higher impact on the

32
household consumption. In other words, the first owned mobile phone is what made a big
difference on household consumption, but any additional mobile phones make little difference.
In Model 4, however, at least one household member, especially the household head, owning
mobile phone can advance per capita total consumption by some 11.5% compared to the
household who does not have a mobile phone.
Model 4 also shows that some control variables confirm my expectations. House
ownership, insurance, and household’s head size, age, sex, and education diploma are significant
at a 1 percent level. Obviously, the coefficient of house ownership is positive and statistically
significant at the 1 percent significance level, meaning that having a privately owned house can
increase per capita total consumption by 5.91% if other variables are held constant. Likewise,
having health insurance and receiving a work loan from private financial institutions,
cooperative/foundation, or government projects have a positive and significant impact on per
capita total consumption, although the impact’s levels are quite small, i.e. 0.85% and 0.37%
respectively. One type of government subsidy is in the form of cheap rice which only poor
households are eligible to buy. Unexpectedly, the subsidy policy has a negative impact to per
capita total consumption, but the coefficient is zero, i.e. -0.00%. The main explanation for this is
that households that receive the subsidy are desperately poor, and hence consume less than other
households. Moreover, if households are large in size, their total consumption is projected to
decrease by 8.14% and this decrease is statistically significant at a 1% level.
In addition, the expected signs for the human capital variables were also verified. For the
variable head age, if the household is older, the total consumption is estimated to have increased
by 0.11%. A related variable, head sex, is significant and positive in the total consumption, i.e.
2.04%, meaning that being a male has a higher effect on the household’s consumption because a

33
male household head can earn more money than the female ones. Moreover, if the household
head is a business owner, per capita total consumption is calculated to have increased by 2.49%
compared to counterparts whose occupation is worker. As expected, education diploma has a
strong positive impact on per capita total consumption, i.e. 8.96%, and is statistically significant
at the 1 percent significance level. This indicates that a household head having an education
beyond the compulsory level10 will have more opportunities to have more economic resources
and increase their welfare so that they can also increase the total consumption of their family.
While the other human capital variables conform to their expected sign, outpatient and
inpatient have a positive impact rather than the expected negative impact. For the outpatient
variable, although the coefficient is not statistically significant, if the household head has been an
outpatient in the last 1 month, his/her family’s per capita total consumption is estimated to
increase by a very small percentage, i.e. 0.12%. Similarly, inpatient is statistically significant at
the 1 percent significance level and has a positive impact on per capita total consumption, i.e.
4.15%. The impact of these two variables is positive because of the fact that the outcome
variable used in this study is household’s total consumption, not income, being an outpatient and
inpatient increase the consumption because they must spend more money on medical treatment
and medicine.
10 In Indonesia, according to the Law No. 2/1989, the Government Regulation No. 28/1990, and the National Education System Law No. 20/2003, compulsory education consists of six years of elementary school and three years of junior high school (Unesco, 2010).

34
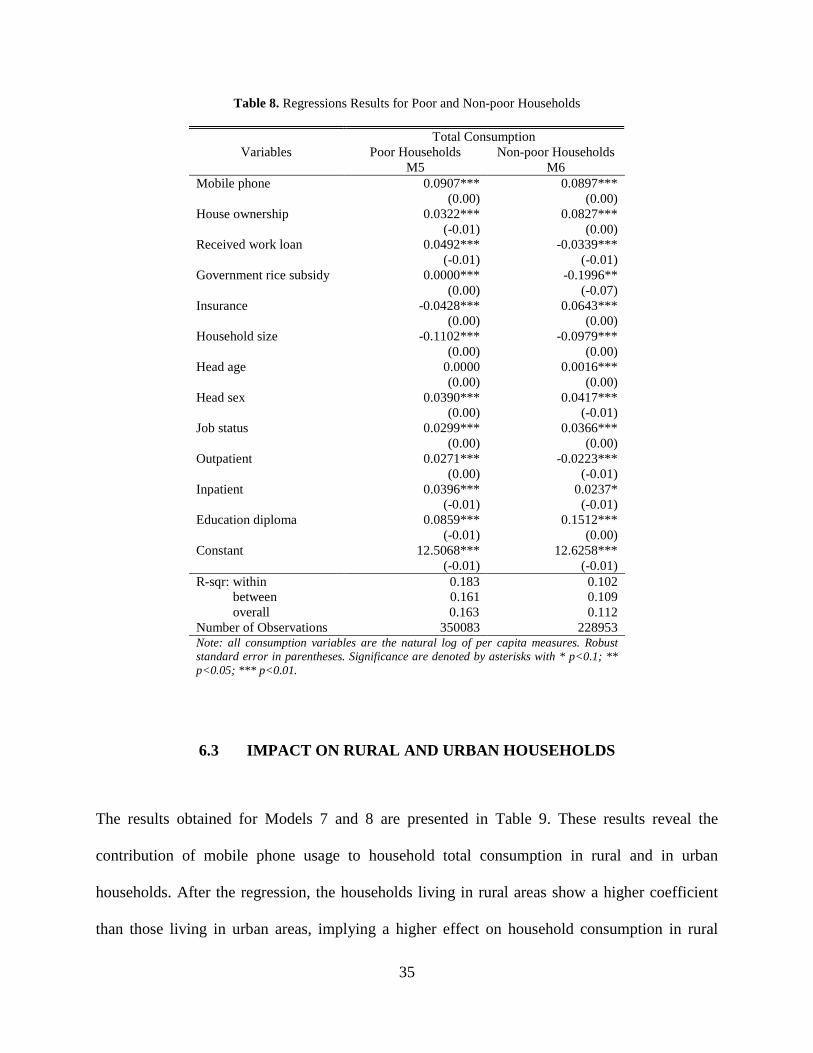
6.2 IMPACT ON POOR AND NON-POOR HOUSEHOLDS
Table 8 shows the regression results for the contribution of a mobile phone to the household total
consumption of the poor and non-poor groups. From the regression, the impact of mobile phone
use is somewhat greater for the poor than for the non-poor households. Being a mobile phone
user increases total consumption by 9.5% among the poor, which is slightly higher than the non-
poor households’ increase of 9.4%. The two models support my hypothesis that mobile phone
ownership has a greater impact on poor than on non-poor households. From Table 8, we can also
see that Model 5 and 6 explain the importance of household human capital variables for the
household consumption, where consistently the household’s head, sex, job status, and education
diploma are positive and significant for both the poor and non-poor households. Additionally, the
government rice subsidy does not change household consumption for the poor households.
However, if the household was non-poor, receiving the subsidy contributes negatively to
household consumption, implying that some problems might have occurred in those households,
such as diseases, crop failure, and so forth.
35
Table 8. Regressions Results for Poor and Non-poor Households
Variables Total Consumption
Poor Households Non-poor Households M5 M6
Mobile phone 0.0907*** 0.0897***
(0.00) (0.00)
House ownership 0.0322*** 0.0827***
(-0.01) (0.00)
Received work loan 0.0492*** -0.0339***
(-0.01) (-0.01)
Government rice subsidy 0.0000*** -0.1996**
(0.00) (-0.07)
Insurance -0.0428*** 0.0643***
(0.00) (0.00)
Household size -0.1102*** -0.0979***
(0.00) (0.00)
Head age 0.0000 0.0016***
(0.00) (0.00)
Head sex 0.0390*** 0.0417***
(0.00) (-0.01)
Job status 0.0299*** 0.0366***
(0.00) (0.00)
Outpatient 0.0271*** -0.0223*** (0.00) (-0.01) Inpatient 0.0396*** 0.0237*
(-0.01) (-0.01)
Education diploma 0.0859*** 0.1512***
(-0.01) (0.00)
Constant 12.5068*** 12.6258***
(-0.01) (-0.01)
R-sqr: within 0.183 0.102 between 0.161 0.109 overall 0.163 0.112 Number of Observations 350083 228953 Note: all consumption variables are the natural log of per capita measures. Robust standard error in parentheses. Significance are denoted by asterisks with * p<0.1; ** p<0.05; *** p<0.01.
6.3 IMPACT ON RURAL AND URBAN HOUSEHOLDS
The results obtained for Models 7 and 8 are presented in Table 9. These results reveal the
contribution of mobile phone usage to household total consumption in rural and in urban
households. After the regression, the households living in rural areas show a higher coefficient
than those living in urban areas, implying a higher effect on household consumption in rural

36
areas than urban. For the rural households, the ownership of a mobile phone in the household is
associated with an increase of 15.3% of per capita total consumption over rural households
which do not own one. However, for the urban households, ownership of a mobile phone is only
associated with an increase of 8.3% over urban households which do not have mobile phone.
Other interesting figures in the two models are the coefficients of insurance, head sex,
and outpatient. In Model 7, health insurance being owned by the household has a negative effect
on per capita total consumption for people living in rural areas. Even though households were
covered by health insurance, their consumption was estimated to have decreased by 1.75%,
implying that although the insurance is provided free of charge by the government, the insurance
is not helpful for rural people, partly because of lack of health facilities and medical doctors in
rural areas so that people cannot receive optimum benefits of the insurance when they have
health problems. In Model 8, all other variables are significant at the 1 and 5 percent significance
levels, except household head sex, indicating that whether the head of family is male or female
does not have influence on per capita total consumption of households living in urban areas,
while being a male head of household in rural areas has a positive and significant impact on
household income. Nonetheless, the coefficient of the variable in Model 8 is not statistically
significant at any level.

37
Table 9. Regression Results for Rural and Urban Households
Variables Total Consumption
Rural Area Urban Area M7 M8
Mobile phone 0.1421*** 0.0798***
(0.00) (0.00)
House ownership 0.0175*** 0.0814***
(0.00) (0.00)
Received work loan 0.0608*** -0.0560***
(-0.01) (-0.01)
Government rice subsidy -0.0000*** -0.0000***
(0.00) (0.00)
Insurance -0.0176*** 0.0397***
(0.00) (0.00)
Household size -0.1103*** -0.0680***
(0.00) (0.00)
Head age 0.0009*** 0.0009***
(0.00) (0.00)
Head sex 0.0555*** 0.0012
(0.00) (-0.01)
Job status 0.0097*** 0.0436***
(0.00) (0.00)
Outpatient 0.0232*** -0.0269*** (0.00) (-0.01) Inpatient 0.0447*** 0.0383**
(-0.01) (-0.01)
Education diploma 0.1576*** 0.1740***
(0.00) (0.00)
Constant 12.5405*** 12.6327***
(-0.01) (-0.01)
R-sqr: within 0.203 0.099 between 0.188 0.159 overall 0.196 0.138 Number of Observations 471590 228954 Note: all consumption variables are the natural log of per capita measures. Robust standard error in parentheses. Significance are denoted by asterisks with * p<0.1; ** p<0.05; *** p<0.01.
6.4 IMPACT ON POOR RURAL HOUSEHOLDS AND OTHER GROUPS
Looking at Models 9 to 12, as shown in Table 10, mobile phones have a positive and statistically
significant 1 percent impact on per capita total consumption. Surprisingly, among the four
groups, i.e. poor rural, poor urban, non-poor rural, and non-poor urban, Model 10 reveals that
ownership of a mobile phone has the highest impact on per capita total consumption for non-

38
poor households living in rural areas. This model shows an increase in total consumption of
14.21% over the same households without a mobile phone user. Mobile phone ownership shows
a lower significant impact of 11.18% for the poor households living in rural areas, as presented
in Model 9. Furthermore, in line with the third hypothesis, the impact of mobile phones on per
capita total consumption is much lower for urban households than rural ones. As revealed in both
Model 11 and 12, mobile phones have a significant positive impact on per capita total
consumption for poor urban and non-poor urban groups, i.e. 5.6% and 5.8%, respectively. These
results signify that people living in urban areas do not lack information and are more likely to
use the mobile phone for personal reasons than their rural counterparts, so they are less affected
by the impacts of mobile phone.
Particularly for Model 9 and 10, the above mentioned results confirm my hypothesis that
although both groups experience a positive increase in their total consumption, the non-poor
rural group enjoys a greater increase than their poor rural counterparts. The probable explanation
is that the non-poor rural households have more means and sources of income to support their
livelihood. For a more detailed explanation is that generally, the rural people in Indonesia can be
placed into two categories: small business owners or producers and workers. This categorization
reflects their differing current productive strategies, access to assets, and engagement with local
economic processes. As mentioned earlier, agriculture remains a principal source of income for
the majority of the country’s population, especially for those rural households. Therefore, the job
status of the rural households is farmers, farming traders or workers in the agriculture sector.
Regarding their job status, the non-poor rural households are those who own land, as physical
capital, and have access to financial capital to run their business, either by themselves and family

39
members, or with assistance from unpaid and paid workers. Meanwhile, the poor rural people are
farming related workers because they do not have their own land or access to financial capital.
Table 10. Regression Results for Poor Rural Households and Other Groups
Variables Total Consumption Poor Rural Non-poor Rural Poor Urban Non-poor Urban
M9 M10 M11 M12 Mobile phone 0.1060*** 0.1329*** 0.0547*** 0.0564***
(0.00) (0.00) (-0.01) (-0.01)
House ownership 0.0214*** 0.0115 0.0523*** 0.1116***
(-0.01) (-0.01) (-0.01) (-0.01)
Received work loan 0.0599*** 0.0423*** 0.0227 -0.0859***
(-0.01) (-0.01) (-0.01) (-0.01)
Government subsidy 0.0000*** 0.0000*** -0.0000*** -0.2048*
(0.00) (0.00) (0.00) (-0.08)
Insurance -0.0493*** 0.0406*** -0.0233** 0.0740***
(0.00) (-0.01) (-0.01) (-0.01)
Household size -0.1107*** -0.1068*** -0.1091*** -0.0933***
(0.00) (0.00) (0.00) (0.00)
Head age 0.0002 0.0014*** -0.0006* 0.0015***
(0.00) (0.00) (0.00) (0.00)
Head sex 0.0437*** 0.0518*** 0.0289** 0.0378***
(-0.01) (-0.01) (-0.01) (-0.01)
Job status 0.0219*** 0.0133* 0.0484*** 0.0518***
(0.00) (-0.01) (-0.01) (-0.01)
Outpatient 0.0315*** 0.0103 0.0132 -0.0452*** (0.00) (-0.01) (-0.01) (-0.01) Inpatient 0.0462*** 0.0267 0.0237 0.0259
(-0.01) (-0.02) (-0.02) (-0.02)
Education diploma 0.1041*** 0.1341*** 0.0547*** 0.1554***
(-0.01) (-0.01) (-0.01) (-0.01)
Constant 12.4823*** 12.6070*** 12.6230*** 12.7574***
(-0.01) (-0.01) (-0.02) (-0.01)
R-sqr: within 0.197 0.184 0.184 0.082 between 0.178 0.175 0.175 0.056 overall 0.179 0.179 0.179 0.065 Number of Observations 274136 197454 75947 153007 Note: all consumption variables are the natural log of per capita measures. Robust standard error in parentheses. Significance are denoted by asterisks with * p<0.1; ** p<0.05; *** p<0.01.
In addition, for the non-poor rural group, the higher impact of mobile phone on its per
capita consumption is related to the fact that a mobile phone is likely used as a production factor
to improve their performance in economic activities. In this regard, non-poor rural households
have more resources compared to the poor ones, so that they can take advantage of the

40
opportunities that their mobile phone gives them. Therefore, mobile phones can help them to
start a new business and reduces costs of the existing business by helping them to secure better
commodity markets and prices, increase sales, transfer of money, reduce transportation costs,
bypass the middleman, and maximize the outcomes of business journeys. The mobile phone
usage also increases the non-poor’s productivity by allowing timely communication of business-
related information with other producers in other regions and movement of their products to
other places where they can make a better sale. As a result, the non-poor rural group can increase
its business income and profits thereby achieve a higher consumption level.
However, for the poor rural group, due to the fact that most of the group members are
workers who do not have physical and financial capital, a mobile phone can help them not solely
to improve the performance of their economic activities. Rather mobile phone improves the
group’s livelihoods through some possible mechanisms. First, mobile phones can expand and
strengthen social networks. By using a mobile phone, poor rural households not only receive
support when they are in emergency conditions, but also give assistance to troubled relatives and
neighbors. Second, as poor rural people are workers, mobile phones enable them to search for
jobs. For illustration, the porter who spent his days hanging around outside of farming and
constructions sites and hoping to be hired to carry crops and construction materials can now go
only where the jobs are available or when they receive a call from their partners.

41
7.0 CONCLUSION AND IMPLICATIONS
7.1 CONCLUSION
This study examines the impact of mobile phones on household welfare in Indonesia based on
national survey data. Using two different mobile phone variables and three different household
welfare measures, all regressions confirm that mobile phone ownership had a positive and
significant impact on per capita total consumption during the period 2006 – 2008. The impact
ranged from 5.6% to 15.3% in the increase of per capita total consumption, depending on the
regression model chosen. This result indicates that households use mobile phones to improve
their economic performance, particularly as a means of finding resources and information linked
to economic benefits.
The impact of mobile phone usage was higher for the poor households and households
living in the rural areas. If a poor household owned a mobile phone, the per capita total
consumption was estimated to have increased by 9.5% during the years 2006 to 2008, an
increase slightly greater than that of the non-poor households, which is 9.4%. Moreover, a
comparison between urban and rural areas reveals that mobile phone ownership had a much
higher impact on rural households, with a 15.3% increase in rural household consumption
compared to an 8.3% increase in that of urban households. Indeed, this evidence refutes some
assumptions that the rural poor are not able or not willing to pay for mobile telecommunication

42
services and that the constraints of rural areas, such as low population density, lack of education
and electricity, low awareness, low disposable income, and poor health and living conditions,
would prevent mobile phone adoption, as pointed out by Bhavnani et al. (2008). In fact, the
mobile phone usage is shown to have the potential to reduce poverty and improve incomes of
rural households and their livelihoods.
However, if the variables poor and rural are considered together, the impact of mobile
phone on per capita total consumption is higher for non-poor rural households. The magnitude of
the impact is an increase in total consumption of 14.21% if the non-poor rural household is a user
of a mobile phone which compared to the 11.18% increase of the poor living in the same areas.
This finding indicates that the non-poor rural group enjoys more benefits than poor rural
counterparts from mobile phone usage, mostly because they have more means and sources of
income to support their livelihood, where the mobile phone is used as a supplement means or as
a production factor to improve the performance of their business.
As one of the few studies that closely examines the impact of mobile phone ownership on
household welfare in Indonesia, this study contributes to the growing literature of mobile phone
and ICT in general, and their impacts on economic development, especially at the national level,
contrasting with most of the current empirical studies in this field, which are case specific to a
certain area. Nevertheless, this study does not empirically capture the mechanism through which
the mobile phone has an impact on household welfare. Given the unprecedented growth of the
mobile phone industry and the number of subscribers in Indonesia, and the fact that there is no
empirical study which explores the potential effects of mobile phones on its users, this research
is expected to open up the field for further research.

43
7.2 IMPLICATIONS
This research has two main implications. First, by revealing that mobile phone ownership has a
strong impact on rural households, this study questions the commonly held belief that private
investment in ICT is more valuable in urban areas than in rural areas. It is likely that the reason
that many Indonesian rural people do not have a mobile phone is more related to people’s
information needs and types of information available via mobile phone services rather than to the
cost or skills required to use a mobile phone. Moreover, the high costs associated with the
expansion of mobile phones networks in rural areas is also related to the lack of electricity,
which people cannot charge batteries and power mobile telecommunications base stations.
However, there is an emerging trend in the development of mobile phone-based applications in
that they go beyond basic voice calls and text messaging to include data transfer, mobile web,
and video and audio recording and sharing. If these services are available and provide
information useful for their livelihoods, the rural people are willing to pay for it. Accordingly, a
practical implication of this study is that it would be beneficial for mobile phone companies and
applications providers in Indonesia to expand mobile phone coverage and provide services which
satisfy the information needs of the rural people. For the provision of electricity, there is also
small scale alternative energy solution, such as wind, solar and thermal, for powering base
stations and mobile phone batteries, which can provide a feasible way to expand mobile services
to rural populations and isolated areas in Indonesia.
Second, this study also demonstrates that mobile phones and ICT in general, have the
potential to be used as a means in reducing poverty. ICT is not an area that has been well-
integrated into the national poverty reduction strategies in Indonesia. More importantly, most of
the beneficiaries of the ICT development in the country have been those with resources and
44
skills, leaving out the majority of the poor. With the unique characteristics of the poor
populations, the present government’s policy on lowering the national poverty rate, and the
potential of mobile phones to act as a direct source of livelihood for poor people, therefore,
different approaches involving the intervention of the Indonesian government are needed.
Possible policies could include the public sector taking a role in: (a) including ICT as a tool for
poverty reduction; (b) facilitating the poor gaining affordable access to information by
persuading the mobile phone companies to reduce costs and increase mobile phone distribution
as widely as possible; (c) developing locally relevant content and design for both product and
social technologies which meet the needs of the poor.
7.3 VALIDITY AND FUTURE RESEARCH
Although my study’s findings suggest that mobile phone ownership has a positive and significant
impact on household welfare in Indonesia, indeed, interpreting the results should also be done
with care. In terms of internal validity, which has to do with the accuracy of the results, my study
has used national survey data conducted by a national statistical agency. As a result, the samples
of the survey are selected randomly. However, my results did not identify the impact of mobile
phones on food and non-food consumption over poor and non-poor groups and households living
in rural and urban areas. Distinguishing these two kind of consumptions are important because
an increase in non-food consumption means individuals are engaged in productive economic
activities which seem to be one of important determinants for them to become an active seeker of
information (Song, 2003). The non-food consumption is also generally found to be increasing
function of real income, and thus can be considered a valid welfare indicator and can be used as

45
a proxy for household welfare (Huppi & Ravallion, 1991). Furthermore, in terms of external
validity, which has to do with the generalizability of the findings to the population, I only capture
the impact of mobile phones in the Indonesian context and had no intention to generalize the
findings into a larger population. Therefore, this study has no threat to external validity.
Given the above mentioned validity and the fact that this study’s results provide
preliminary evidence that mobile phone ownership has potential impacts on economic
development, especially in Indonesia, however, my results are a first step in understanding how
mobile phone ownership impacts household welfare, and hence imply three directions for future
research. The first research direction is motivated by the fact that ICT includes a wide range of
essential tools for sharing information, such as fixed telephones, computers, and internet.
Provided the availability of such data in Susenas, it would be interesting to estimate and compare
which of the ICT instruments has the highest impact on household welfare in Indonesia. Most
importantly, with the same models and variables used in regression, this research should
distinguish the impact of mobile phones on food and non-food consumption over poor and non-
poor groups as well as households living in urban and rural areas.
The second research direction would be to identify the appropriate mobile phone
applications and services for different groups of users. The mobile phone handset has different
features and functions which can be used in diverse ways. Exploring who uses what mobile
communications services, what factors influence ownership, use, and non-use of mobile phones,
and which utilities are appropriate for different users can yield a better understanding of the
function of the mobile phone as a complex technology. This survey research type can further
compare the utility of the mobile phone to basic connectivity, or texting to voice, or voice
compared to newer features such as mobile-Internet, m-commerce, or m-banking.

46
The third research direction is related to exploring the empirical mechanisms through
which the impact of mobile phone usage materializes. I was not able to present those
mechanisms in this study because of limited data, time, and resources. Identifying the
mechanisms is the most significant direction future research can take in order to classify and
maximize the economic benefits for the mobile phone users, especially those are categorized as
being at the Bottom of Pyramid (BoP), the largest, but the poorest sector of the population.
Mohammad Yunus (2008) predicts that “the future of poverty, as I see it, will be decided by the
technological devices and services that are designed a priori for poor people.” Therefore,
involving poor people in the BoP, both in urban and rural areas in Indonesia, in experimental
research of the ICT-related technologies, is an area of study important to pursue.

47
APPENDIX A
DATA DISTRIBUTION OF PER CAPITA TOTAL CONSUMPTION
05.
0e-0
71.
0e-0
61.
5e-0
62.
0e-0
6D
ensi
ty
0 2.00e+07 4.00e+07 6.00e+07 8.00e+07pctotc

48
APPENDIX B
DATA DISTRIBUTION OF NATURAL LOGARITHM OF PER CAPITA TOTAL
CONSUMPTION
0.2
.4.6
.8D
ensi
ty
0 5 10 15 20lnpctotc

49
BIBLIOGRAPHY
Acock, Alan C. (2008). A Gentle Introduction to Stata, 2nd Edition. College Station, Texas: Stata Press.
Asian Development Bank. (2003). Toward E-development in Asia and the Pacific: A Strategic Approach to Information and Communication Technology (ICT). Manila: ADB. Retrieved from http://www.adb.org/Documents/Policies/ICT/ICT-policy.pdf
______. (2006). Indonesia: Strategic Vision for Agriculture and Rural Development. Manila: Asian Development Bank. Retrieved from http://www.adb.org/documents/Books/Strategic-Vision-Indonesia/Strategic-Vision-Indonesia.pdf
Adebayo, E., & Adesope, O. (2007). Awareness, Access and Usage of Information and Communication Technologies between Female Researchers and Extensionists. International Journal of Education and Development using ICT, 3(1). Retrieved from http://ijedict.dec.uwi.edu/viewarticle.php?id=282
Aker, Jenny C. (2008). Does Digital Divide or Provide? The Impact of Mobile Phones on Grain Markets in Niger. BREAD Working Paper 177. Retrieved from http://ipl.econ.duke.edu/bread/papers/working/177.pdf
______. (2010). Information from Markets Near and Far: Mobile Phones and Agricultural Markets in Niger. American Economic Journal: Applied Economics, 2(3): 46–59.
Aker, Jenny C., & Mbiti, Isaac M. (2010). Mobile Phones and Economic Development in Africa. Journal of Economic Perspectives, Volume 24, Number 3, Summer 2010.
Bardhan, Pranab & Udry, Christopher. (1999). Development Microeconomics. Oxford: Clarendon Press.
Barrantes, Roxana. (2005). Analysis of ICT Demand: What Is Digital Poverty and How to Measure It? In H. Galperin and J. Mariscal (eds.), Digital Poverty: Latin America and Caribbean Perspectives. Ottawa: IDRC. Retrieved from http://www.dirsi.net/espanol/files/02-Barrantes_23nov.pdf
______. (2010). The Impact of Mobile Phones on Profits from Livestock Activities – Evidence from Puno. Proceedings of the 4th ACORN-REDECOM Conference Brasilia (2010): 181 -196.
50
Batchelor, S., & Sugden, S. A. (2003). An analysis of Info Case Studies: Lessons Learned. London: Gamos Ltd.
Bayes, Abdul. 2001. Infrastructure and Rural Development: Insights from a Grameen Bank Village Phone Initiative in Bangladesh. Agricultural Economics 25 (2001), 261-272.
Bhavnani, Asheeta, Chiu, Rowena Won-Wai, Janakiram, Subramaniam, & Silarszky, Peter. (2008). The Role of Mobile Phones in Sustainable Rural Poverty Reduction. Washington D.C.: the World Bank. Retrieved from http://siteresources.worldbank.org/EXTINFORMATIONANDCOMMUNICATIONANDTECHNOLOGIES/Resources/The_Role_of_Mobile_Phones_in_Sustainable_Rural_Poverty_Reduction_June_2008.pdf
Battistin, Erich, Blundell, Richard, & Lewbel, Arthur. (2009). Why Is Consumption More Log Normal than Income? Gibrat’s Law Revisited. Journal of Political Economy, Vol. 117, No. 6, pp. 1140-1154.
Bertolini, R. (2002). Telecommunication Services in Sub-Saharan Africa: An Analysis of Access and Use in the Southern Volta Region in Ghana. Frankfurt: Peter Lang.
Badan Pusat Statistik. (2002). Work Manual Head of Provincial and Regency/Municipality Statistics Office, National Social Economic Survey (SUSENAS). Jakarta: BPS.
_____. (2010). Labor Force Situation in Indonesia, February 2010. Bulletin No. 33/05/Th. XIII, May 10th, 2010. Jakarta: Central Statistical Agency (BPS). Retrieved from http://dds.bps.go.id/eng/brs_file/eng-tenaker-10mei10.pdf
Braund, Paul, Frauscher, Kathrin, Schwittay, Anke, & Petkoski, Djordjija. (2006). A Report on the Global E-Discussion: Information and Communications Technology for Economic Development, Exploring Possibilities for Multi-sector Technology Collaborations. Washington, D.C.: World Bank. Retrieved from http://www.riosinstitute.org/RiOSWBIediscussio.pdf
Cameron, A. Colin & Trivedi, Pravin K. (2009). Microeconometrics Using Stata. College Station, Texas: Stata Press.
Chowdhury, Shyamal K. (2002). Institutional and Welfare Aspects of the Provision and Use of Information and Communication Technologies in the Rural Areas of Bangladesh and Peru. Frankfurt: Peter Lang.
De Silva, Harsha & Zainudeen, Ayesha. (2007). Teleuse on a Shoestring: Poverty reduction through telecom access at the ‘Bottom of the Pyramid’. Paper prepared for Centre for Poverty Analysis Annual Symposium on Poverty Research in Sri Lanka, 6 - 7 December 2007, Colombo. Retrieved from http://www.kiwanja.net/database/document/document_asia_BOP.pdf
51
Donner, Jonathan. (2007). The Use of Mobile Phones by Microentrepreneurs in Kigali, Rwanda: Changes to Social and Business Networks. Information Technologies and International Development Volume 3, Number 2, Winter 2006, 3–19.
Flor, A.G. 2001. ICT and Poverty: the Indisputable Link. Paper Presented at the Third Asia Development Forum on “Regional Economic Cooperation in Asia and the Pacific.” Organized by ADB, June 11-14.
Furuholt, Bjorn & Matotay, Edmund. (2011). The Developmental Contribution from Mobile Phones Across the Agricultural Value Chain in Rural Africa. The Electronic Journal on Information Systems in Developing Countries (2011) 48, 7, 1-16.
Greenberg, A. (2005). ICTs for Poverty Alleviation: Basic Tool and Enabling Sector.” SIDA4937. Retrieved from http://www.sida.se/publications
Haq, Rashida & Bhatti, Mohammad Ali. (2001). Estimating Poverty in Pakistan: The Non-food Consumption Share Approach. Research Report No. 183. Islamabad , Pakistan: Pakistan Institute of Development Economics. Retrieved from http://www.pide.org.pk/research/report183.pdf
Heeks, R. 1999. Information and Communication Technologies, Poverty and Development.” Development Informatics Working Paper Series 5. Manchester: IDPM.
Hernandez, Gabriel Murrieta & Cerda, Heriberto E. Cuanalo De La. (2010). Development against Poverty: a Dynamic Simulation Model. ICS'10 Proceedings of the 14th WSEAS International Conference on Systems: part of the 14th WSEAS CSCC Multi Conference - Volume II. Wisconsin: WSEAS.
Huppi, M., & Ravallion, M. (1991). The Sectoral Structure of Poverty during an Adjustment Period: Evidence for Indonesia in the Mid-1980s. World Development 19:12, 1653–1678.
ICT4D. (2008). Definition of Digital Divide. Retrieved from http://www.caricomict4d.org/ict-for-development-topics-mainmenu-132/digital-divide-mainmenu-175/69-definition-of-digital-divide.html.
ITU. (2009). Measuring the Information Society: the ICT Development Index. Geneva: International Telecommunications Union. Retrieved from http://www.itu.int/ITU-D/ict/publications/idi/2009/index.html
______. (2010). Definitions of World Telecommunication/ICT Indicators. Geneva: International Telecommunications Union. Retrieved from http://www.itu.int/ITU-D/ict/material/TelecomICT_Indicators_Definition_March2010_for_web.pdf
Labonne, Julien & Chase, Robert S. (2009). The Power of Information: The Impact of Mobile Phones on Farmers’ Welfare in the Philippines. Policy Research Working Paper 4996. Washington, D.C.: the World Bank.

52
May, Julian. (2010). Digital and other poverties: Exploring the Connection in Four East African Countries. Paper submitted to the Conference: Ten years of 'war against poverty', 8-10 September 2010, Manchester, UK.
Ministry of Communication and Information (MCI). (2010a). White paper of Information and Communications. Jakarta: MCI.
______. (2010b). Statistical Data Postal and Telecommunication Sector. Jakarta: MCI. Retrieved from http://www.postel.go.id/webupdate/Dastik/sem2english.asp
Muto, Megumi, & Takashi Yamano. (2009). The Impact of Mobile Phone Coverage Expansion on Market Participation: Panel Data Evidence from Uganda. World Development No. 37, (12): 1887–96.
Noll, Heinz-Herbert. (2007). Consumption, Income and Living Standards. A review of related recent research activities. Mannheim: GESIS.
OECD. (2001). OECD Science, Technology and Industrial Scoreboard 2001: Towards a Knowledge-based Economy. Retrieved from www.oecd-ilibrary.org/oecd-science-technology-and-industry-scoreboard-2001_5lmqcr2k9h9x.pdf
Samarajiva, Rohan and Zainudeen, Ayesha. (2008). ICT Infrastructure in Emerging Asia: Policy and Regulatory Roadblocks. New Delhi: Sage.
Samuel, Jonathan, Shah, Niraj, & Hadingham, Wenona. (2005). Mobile Communications in South Africa, Tanzania and Egypt: Results from Community and Business Surveys. An article in Africa: The Impact of Mobile Phone. The Vodafone Policy Paper Series, Number 3, March 2005.
Sife, Alfred Said, Kiondo, Elizabeth, and Macha, Joyce G. Lyimo. (2010). Contribution of Mobile Phones to Rural Livelihoods and Poverty Reduction in Morogoro Region, Tanzania. The Electronic Journal on Information Systems in Developing Countries (2010) 42, 3, 1-15.
Singh, Inderjit, Squire, Lyn, & Strauss, John. (1986). Agricultural Household Models: Extensions, Applications and Policy. Baltimore: The Johns Hopkins University Press.
Slater, D., & Tacchi, J. (2004). Research: ICT Innovations for Poverty Reduction. New Delhi: UNESCO. Retrieved from http://unesdoc.unesco.org/images/0013/001361/136121e.pdf
Spence, R. (2003). Information and Communications Technologies (ICTs) for Poverty Reduction: When, Where and How?” International Development Research Center Report 2003, pp 148. Retrieved from http:/ / www.idrc.ca/ uploads/ user-S/ 1074024575110618469203RS_ICT-Pov_18 _July.pdf
Spence, R., & Smith, Matthew L. (2010). ICT, Development, and Poverty Reduction: Five Emerging Stories. USC Annenberg School for Communication & Journalism, Volume 6, SE, Special Edition 2010, 11–17.

53
Song, Gi-Soon. (2005). The Impact of Information and Communication Technologies (ICTs) on Rural Households.” Frankfurt: Peter Lang.
Taylor, J. (2003). Agricultural Household Models: Genesis, Evolution, and Extensions. Review of Economics of the Household, Volume 1, No. 1.
The Canberra Group. (2001). Expert Group on Household Income Statistics: Final Report and Recommendations. Ottawa: The Canberra Group. Retrieved from http://www.lisproject.org/links/canberra/finalreport.pdf
Torero, M., & Braun, J. von. (2006). Information and Communication Technologies for Development and Poverty Reduction: The Potential of Telecommunications. Washington, D.C.: Johns Hopkins University Press and IFPRI.
Trung, Tran Quoc, Tungm, Nguyen, Duc, Le Thuc, Duc, Nguyen Cao, & Hung, Tran Hao. (2007). Trade Liberalization and Development in ICT Sector and its impact on household welfare in Viet Nam. Asia-Pacific Research and Training Network on Trade Working Paper Series, No. 33, February 2007. Retrieved from http://www.unescap.org/tid/artnet/pub/wp3307.pdf
Unesco. (2010). World Data on Education, 7th edition: Indonesia. Retrieved from http://unesdoc.unesco.org/images/0019/001931/193181e.pdf
Waverman, Leonard, Meschi, Meloria, & Fuss, Melvyn. 2001. The Impact of Telecoms on Economic Growth in Developing Countries. London: Centre for Economic Research. Retrieved from http://web.si.umich.edu/tprc/papers/2005/450/L%20Waverman-%20Telecoms%20Growth%20in%20Dev.%20Countries.pdf
Wooldridge, Jeffrey M. (2009). Introductory Econometrics: A Modern Approach, 4th edition. Florence, Kentucky: South-Western Cengage Learning.
World Bank. (2003). ICT and MDGs: A World Bank Group Perspective. World Bank Group Global ICT Department. Washington, D.C.: World Bank. Retrieved from http://info.worldbank.org/ict/assets/docs/mdg_Complete.pdf
______. (2010). Empowering Indonesian Communities through Direct Participation in Developing Infrastructure and Services. Washington, D.C.: World Bank. Retrieved from http://siteresources.worldbank.org/NEWS/Resources/Indonesia_Direct_Participation_4-11-10.pdf
Yunus, Muhammad. (2008). A Poverty Free World—When? How? Romanes Lecture at Oxford University.” Retrieved from http://muhammadyunus.org/speeches/a-poverty-free-world-when-how/
Zaidi, Asghar M., & de Vos, Klaas. (2001). Trends in Consumption-based Poverty and Inequality in the European Union during the 1980s. Journal of Population Economics. Volume 14, S: 367 – 390.