indicator report apr 10
TRANSCRIPT
8/9/2019 Indicator Report Apr 10
http://slidepdf.com/reader/full/indicator-report-apr-10 1/150
Telecom Regulatory Authority of India
The Indian Telecom Services Performance IndicatorsOctober - December 2009
New Delhi, India
6th April 2010
Mahanagar Doorsanchar Bhawan, Jawahar Lal Nehru Marg, New Delhi-110002
Tel: +91-11- 23230752, Fax: +91-11- 23236650Website: www.trai.gov.in
8/9/2019 Indicator Report Apr 10
http://slidepdf.com/reader/full/indicator-report-apr-10 2/150
Table of Contents
Snapshot .............................................................................................................................................. i
Executive Summary & Trends at a Glance ............................................................................. iii
Introduction ............................ xii
Chapter 1: Subscription Data .......................................................................................................1Section A: Access Service – An Overview ......................................................................2
Section B: Wireless Service................................................................................................7
Section C: Wireline Service ..............................................................................................15
Section D: Internet Service ..............................................................................................22
Section E: Other Value Added Services – PMRTS & VSAT ....................................29
Chapter 2: Revenue and Usage ..................................................................................................33
Section A: GSM – Full Mobility Service........................................................................34
Section B: CDMA – Full Mobility Service ....................................................................39
Section C: Internet Services ............................................................................................44
Chapter 3: Financial Data of Telecom Service Sector .........................................................45
Chapter 4: Quality of Service (QoS)...........................................................................................49Section A: Quality of Service Performance of Wireless Service Providers ........50
Section B: Quality of Service Performance of Wireline Service Providers.........56
Section C: Quality of Service Performance of Dial-up/ Broadband Service....60
Chapter 5: Performance of Cable TV, DTH and Radio Broadcasting Services............64
Annexures ..........................................................................................................................................71
Annexure 1.1: Licensed Cellular (GSM & CDMA) Service Providers .....................72
Annexure 1.2: Wireless Subscriber Base........................................................................73
Annexure 1.3: Wireline Subscriber Base ........................................................................77
Annexure 1.4: Service Provider wise details of PCOs .................................................78
Annexure 1.5: Service Provider wise details of Village Public Telephones ..........81
Annexure 1.6: List of Internet Service Providers Providing Internet Telephony Services .................................................................................................................84
Annexure 1.7: Subscriber Base for Internet Service Providers ...............................85
Annexure 1.8: Service Area wise PMRTS subscriber Base .......................................93
Annexure 2.1: GSM Full Mobility Service – Service Area wise Statistics.............95
Annexure 2.2: CDMA Full Mobility Service – Service Area wise Statistics..........96
Annexure 4.1: Performance of QoS Parameters for Cellular Mobile Services.....97
Annexure 4.2: Performance of QoS Parameters for Basic (Wire-line)Services ....................................................................................................................................103
Annexure 4.3: Quality of Service Performance of Broadband ServiceProviders ..................................................................................................................................106
Annexure 5.1: Broadcaster wise list of pay channels along with theirreported a-la-carte rates.....................................................................................................112
Annexure 5.2: List of operationalised private FM Radio Stations in India ......126
Annexure 5.3: List of applicants who have been granted DTH License .............134
Annexure 5.4: List of companies permitted by Ministry of I&B to set upteleports at various locations in India ...........................................................................135
8/9/2019 Indicator Report Apr 10
http://slidepdf.com/reader/full/indicator-report-apr-10 3/150
i
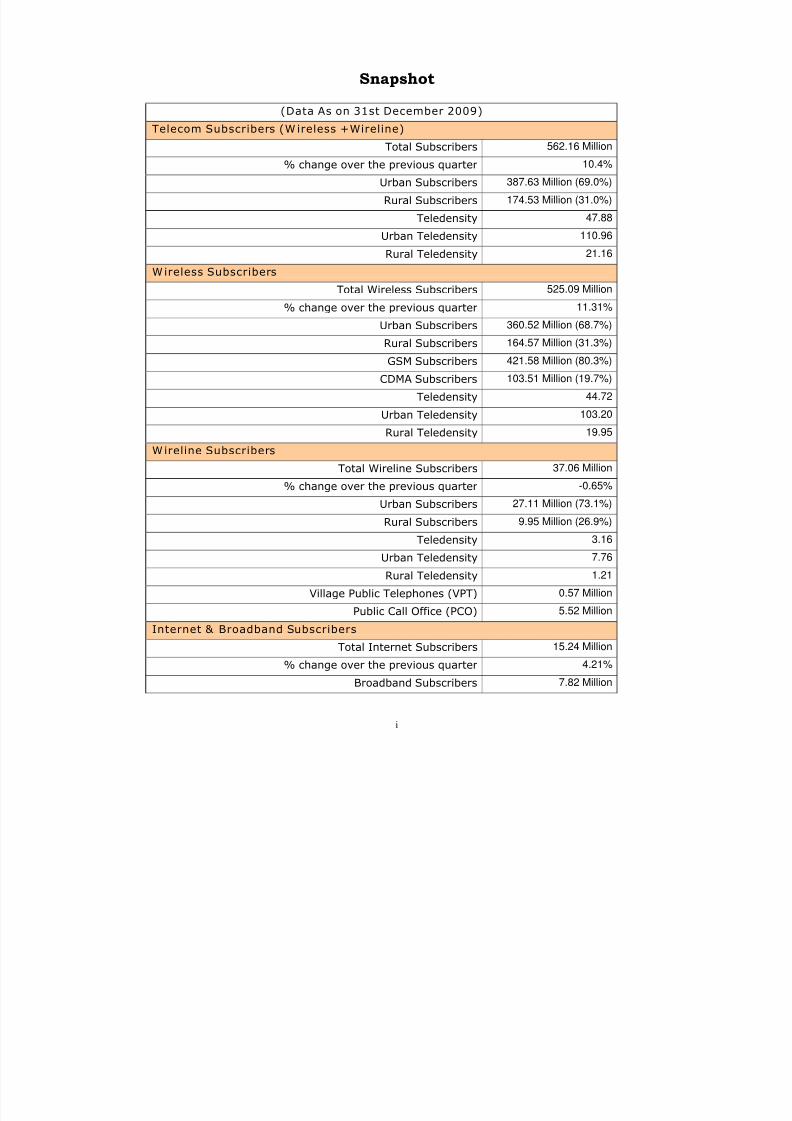
Snapshot
(Data As on 31st December 2009)
Telecom Subscribers (W ireless +Wireline)
Total Subscribers 562.16 Million
% change over the previous quarter 10.4%
Urban Subscribers 387.63 Million (69.0%)
Rural Subscribers 174.53 Million (31.0%)
Teledensity 47.88
Urban Teledensity 110.96
Rural Teledensity 21.16
Wireless Subscribers
Total Wireless Subscribers525.09 Million
% change over the previous quarter 11.31%
Urban Subscribers 360.52 Million (68.7%)
Rural Subscribers 164.57 Million (31.3%)
GSM Subscribers 421.58 Million (80.3%)
CDMA Subscribers 103.51 Million (19.7%)
Teledensity 44.72
Urban Teledensity 103.20
Rural Teledensity 19.95
Wireline Subscribers
Total Wireline Subscribers 37.06 Million
% change over the previous quarter -0.65%
Urban Subscribers 27.11 Million (73.1%)
Rural Subscribers 9.95 Million (26.9%)
Teledensity 3.16
Urban Teledensity 7.76
Rural Teledensity 1.21
Village Public Telephones (VPT) 0.57 Million
Public Call Office (PCO) 5.52 Million
Internet & Broadband Subscribers
Total Internet Subscribers 15.24 Million
% change over the previous quarter 4.21%
Broadband Subscribers 7.82 Million
8/9/2019 Indicator Report Apr 10
http://slidepdf.com/reader/full/indicator-report-apr-10 4/150
8/9/2019 Indicator Report Apr 10
http://slidepdf.com/reader/full/indicator-report-apr-10 5/150
iii
Executive Summary & Trends at a Glance
1. The number of telephone subscribers in India increased from
509.03 Million at the end of Sep-09 to 562.16 Million at the end of
Dec-09, registering a growth of 10.4%. The overall Teledensity in
India has reached 47.88 as on 31st December 2009.
2. Subscription in Urban Areas grew from 357.22 Million at the end
of Sep-09 to 387.63 Million at the end of Dec-09, taking the urban
Teledensity from 102.79 to 110.96. Rural subscription increased
from 151.81 Million to 174.53 Million leading to increase in Rural
Teledensity from 18.46 to 21.16, during this period.
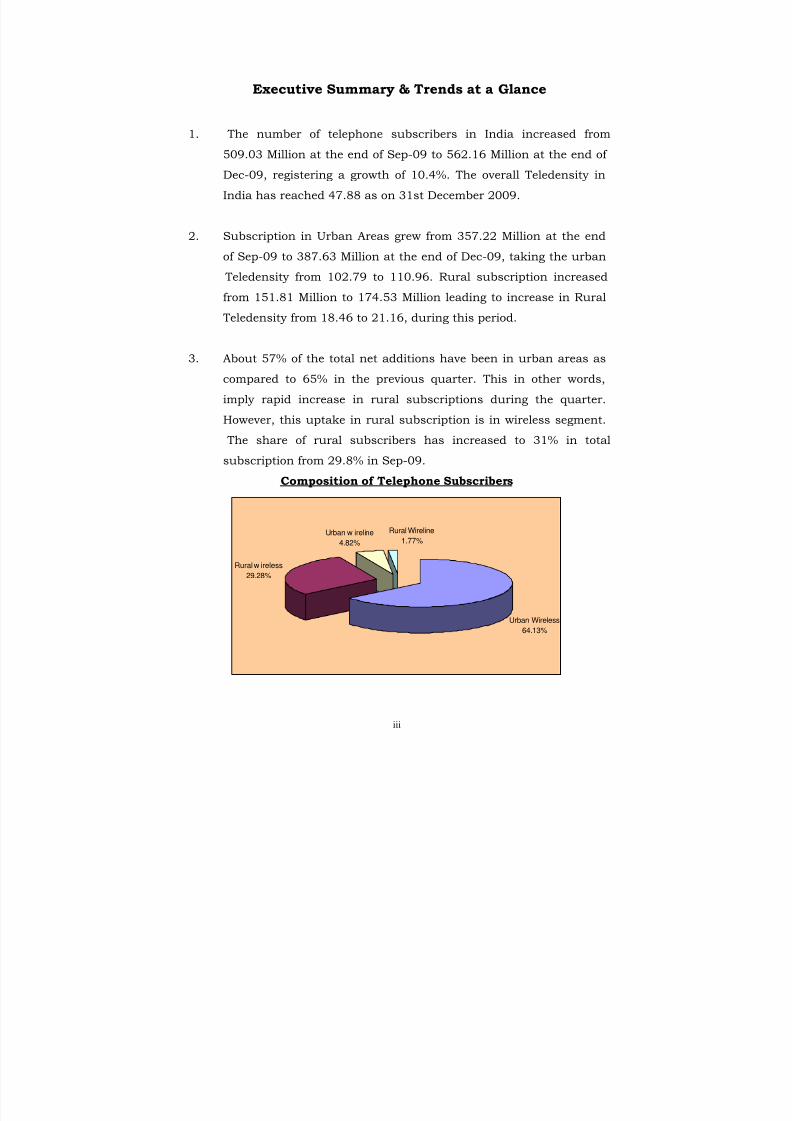
3. About 57% of the total net additions have been in urban areas as
compared to 65% in the previous quarter. This in other words,
imply rapid increase in rural subscriptions during the quarter.
However, this uptake in rural subscription is in wireless segment.
The share of rural subscribers has increased to 31% in totalsubscription from 29.8% in Sep-09.
Composition of Telephone Subscribers
Urban Wireless
64.13%
Rural w ireless
29.28%
Urban w ireline
4.82%
Rural Wireline
1.77%
8/9/2019 Indicator Report Apr 10
http://slidepdf.com/reader/full/indicator-report-apr-10 6/150
iv
4. With 53.37 Million net additions during the Quarter, Total Wireless
(GSM + CDMA) subscriber base increased to 525.09 Million at the
end of Dec-09, and wireless Tele-density reached 44.72.
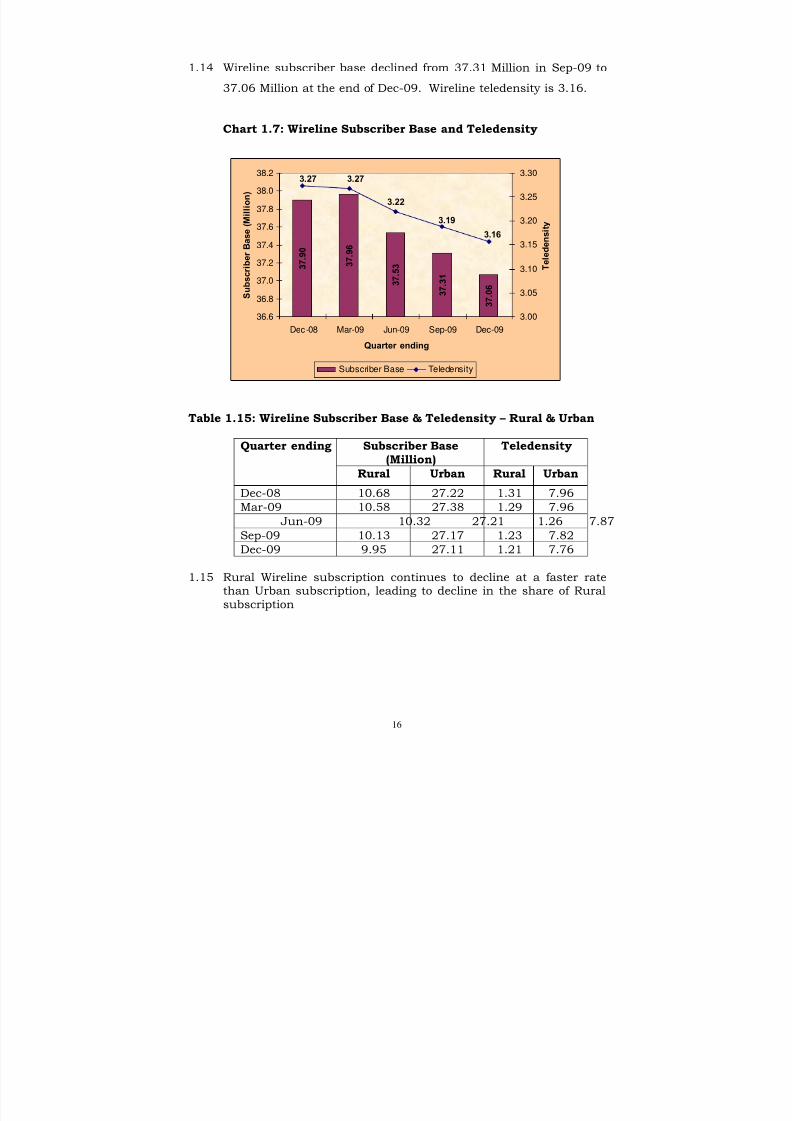
5. Wireline subscriber base declined from 37.31 million in Sep-09 to
37.06 Million at the end of Dec-09, bringing down the wireline
teledensity to 3.16 from 3.19 in Sep-09
6. Internet subscribers increased from 14.63 million to 15.24 million
at the end of December 2009 registering a quarterly growth rate of
4.21%. Top 10 ISPs together hold 95.93% of the total Internet
subscriber base.
7. Share of Broadband subscription in total Internet subscription
increased from 49.3% in Sep-09 to 51.3% in Dec-09. 86.54% of
the Broadband subscribers are using Digital Subscriber Line (DSL)
technology.
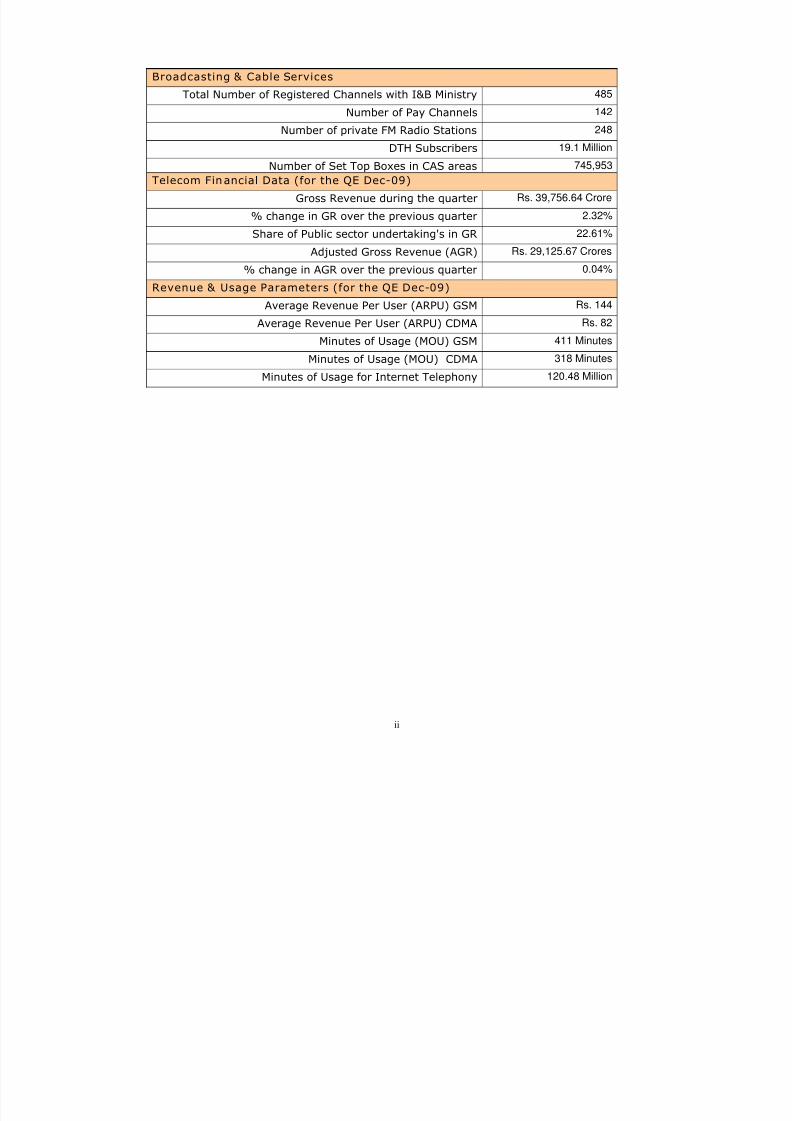
8. Average Revenue Per User (ARPU) for GSM-Full Mobility service
declined by 12.4%, from Rs. 164 in QE Sep-09 to Rs. 144 in QE
Dec-09.
9. MOU per subscriber for GSM – Full mobility service declined by
2.82%, from 423 in QE Sep-09 to 411 in QE Dec-09. The outgoing
MOUs declined by 2.67% and incoming by 2.96%.
10. ARPU for CDMA – Full mobility service declined by 7%, from Rs. 89
in QE Sep-09 to Rs. 82 in QE Dec-09.
8/9/2019 Indicator Report Apr 10
http://slidepdf.com/reader/full/indicator-report-apr-10 7/150
v
11. MOU per subscriber for CDMA-full mobility service increased by
3.2% from 308 (QE Sep-09) to 318 (QE Dec-09). The Outgoing
MOUs increased by 4.04% and Incoming MOUs by 2.5%.
12. Gross Revenue (GR) and Adjusted Gross Revenue (AGR) of Telecom
Sector for the QE Dec-09 has been Rs 39,756.64 Crore and Rs.
29,125.67 Crore respectively. There has been an increase of 2.32%
and 0.04%, as compared to previous quarter, in GR & AGR
respectively.
13. Average licence fee as percentage of AGR is 8.34% in Dec-09 as
against 8.41% in previous quarter.
14. The performance of wireline service providers improved as
compared to the previous quarter, in respect of the following
parameters:
a. Fault incidences per 100 subs/month
b. Answer to Seizure Ratio (ASR)
c. Point of Interconnection (POI) Congestion (No. of PoIs
not meeting the benchmark)
d. Metering and billing credibility - post paid
e. Period of applying credit/ waiver/ adjustment to
customer’s account from the date of resolution of
complaints
f. Accessibility of call centre/ customer care
g. %age of calls answered by the operators (voice to voice)
within 60 sec.
8/9/2019 Indicator Report Apr 10
http://slidepdf.com/reader/full/indicator-report-apr-10 8/150
vi
15. The wireline service performance has deteriorated in this quarter,
as compared to the previous quarter in respect of following
parameters:
a. % Fault repaired by next working day
b. % Fault repaired within 3 days
c. % Fault repaired within 5 days
d. Mean Time to Repair (MTTR)
e. Resolution of billing/charging/Credit & validity
complaints
f. Termination / Closure of service 100% within 7 days
16. The performance of the Basic Telephone Service (Wireline) Service
Providers is at same level as compared to the previous quarter in
respect of the parameter of “Call completion rate (in local network)”
and “Time Taken for Refund of deposits after closures”.
17. The performance of the wireless service providers improved in this
quarter in respect of the following parameters:a. BTSs Accumulated downtime (not available for service)
b. Worst affected BTSs due to downtime
c. Call Set-up Success Rate (within licensee's own network)
d. SDCCH/ Paging Chl. Congestion
e. Call Drop Rate
f. Worst affected cells having more than 3% TCH drop (call
drop) rate
g. Connection with good voice quality
h. Accessibility of call centre/ customer care
i. %age of calls answered by the operators (voice to voice)
within 60 sec.
8/9/2019 Indicator Report Apr 10
http://slidepdf.com/reader/full/indicator-report-apr-10 9/150
vii
j. %age requests for Termination / Closure of service complied
within 7 days
18. The performance of the wireless service providers has deteriorated
in this quarter as compared to the previous quarter in respect of
the following parameters:-
a. Point of Interconnection (POI) Congestion (No. of POIs not
meeting the benchmark)
b. Metering and billing credibility - pre paid
c. Resolution of billing/charging/validity complaints
d. Time taken for refund of deposits after closures
19. The performance of the Cellular Mobile Telephone Service
Providers is at same level as compared to the previous quarter in
respect of the parameter of TCH Congestion, Metering and billing
credibility - post paid and Period of applying credit/ waiver/
adjustment to customer’s account from the date of resolution of complaints.
20. Total Number of channels registered with Ministry of I&B
increased from 472 in Sep-09 to 485 in Dec-09. There are 142 pay
TV channels in existence as reported by 23 broadcasters/their
distributors at the Quarter ending Dec-09.
21. Maximum number of TV channels being carried by any of the
reported MSOs is 253 whereas in the conventional analogue form,
maximum number of channels being carried by the reported MSOs
is 100 channels.
8/9/2019 Indicator Report Apr 10
http://slidepdf.com/reader/full/indicator-report-apr-10 10/150
viii
22. The number of private FM Radio stations in operation remained as
248 at the end of Dec-09.
23. Besides the free DTH service of Doordarshan, there are 6 private
DTH licensees. All the 6 DTH licensees are offering pay DTH
services to the customers as on 31.12.2009 and their reported
subscriber base is 19.1 million.
24. Number of Set Top Boxes (STBs) installed in CAS notified areas of
Delhi, Mumbai, Kolkata and Chennai increased from 7,34,016 in
Sep-09 to 7,45,953 in Dec-09.
8/9/2019 Indicator Report Apr 10
http://slidepdf.com/reader/full/indicator-report-apr-10 11/150
ix
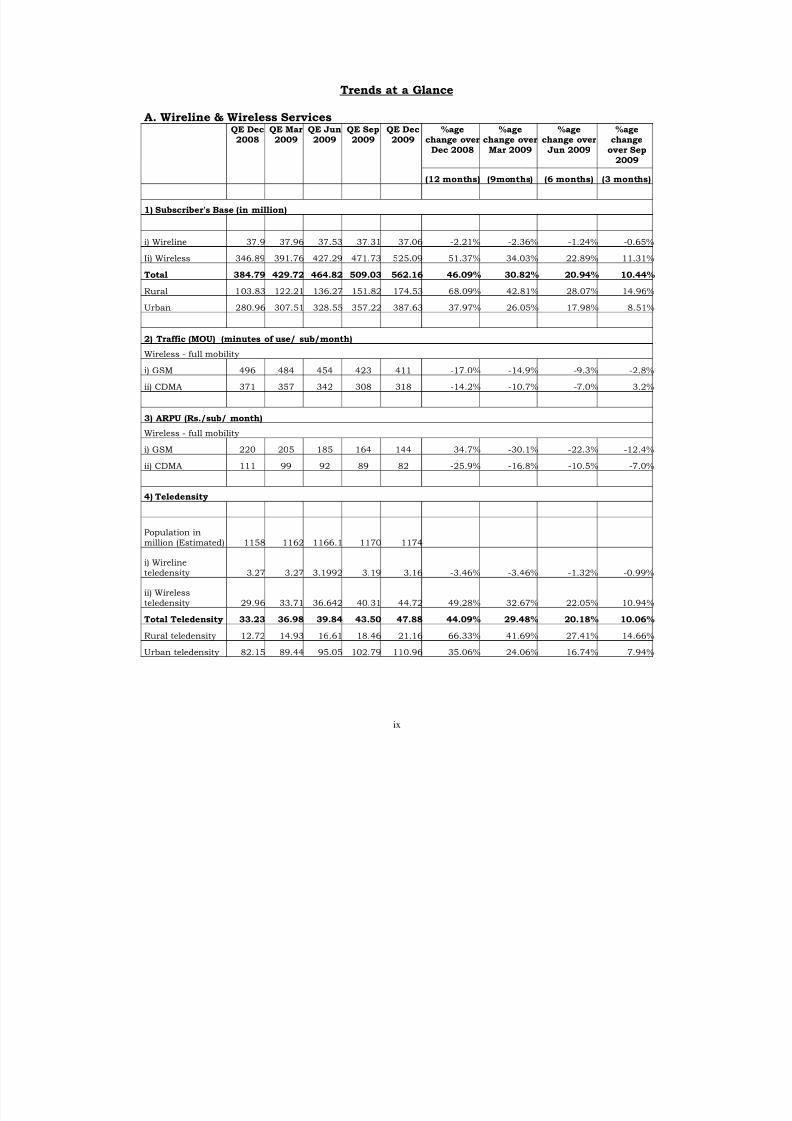
Trends at a Glance
A. Wireline & Wireless Services%age
change over
Dec 2008
%agechange over
Mar 2009
%agechange over
Jun 2009
%agechange
over Sep2009
QE Dec2008
QE Mar2009
QE Jun2009
QE Sep2009
QE Dec2009
(12 months) (9months) (6 months) (3 months)
1) Subscriber's Base (in million)
i) Wireline 37.9 37.96 37.53 37.31 37.06 -2.21% -2.36% -1.24% -0.65%
Ii) Wireless 346.89 391.76 427.29 471.73 525.09 51.37% 34.03% 22.89% 11.31%
Total 384.79 429.72 464.82 509.03 562.16 46.09% 30.82% 20.94% 10.44%
Rural 103.83 122.21 136.27 151.82 174.53 68.09% 42.81% 28.07% 14.96%Urban 280.96 307.51 328.55 357.22 387.63 37.97% 26.05% 17.98% 8.51%
2) Traffic (MOU) (minutes of use/ sub/month)
Wireless - full mobility
i) GSM 496 484 454 423 411 -17.0% -14.9% -9.3% -2.8%
ii) CDMA 371 357 342 308 318 -14.2% -10.7% -7.0% 3.2%
3) ARPU (Rs./sub/ month)
Wireless - full mobility
i) GSM 220 205 185 164 144 -34.7% -30.1% -22.3% -12.4%
ii) CDMA 111 99 92 89 82 -25.9% -16.8% -10.5% -7.0%
4) Teledensity
Population inmillion (Estimated) 1158 1162 1166.1 1170 1174
i) Wirelineteledensity 3.27 3.27 3.1992 3.19 3.16 -3.46% -3.46% -1.32% -0.99%
ii) Wirelessteledensity 29.96 33.71 36.642 40.31 44.72 49.28% 32.67% 22.05% 10.94%
Total Teledensity 33.23 36.98 39.84 43.50 47.88 44.09% 29.48% 20.18% 10.06%
Rural teledensity 12.72 14.93 16.61 18.46 21.16 66.33% 41.69% 27.41% 14.66%
Urban teledensity 82.15 89.44 95.05 102.79 110.96 35.06% 24.06% 16.74% 7.94%
8/9/2019 Indicator Report Apr 10
http://slidepdf.com/reader/full/indicator-report-apr-10 12/150
x
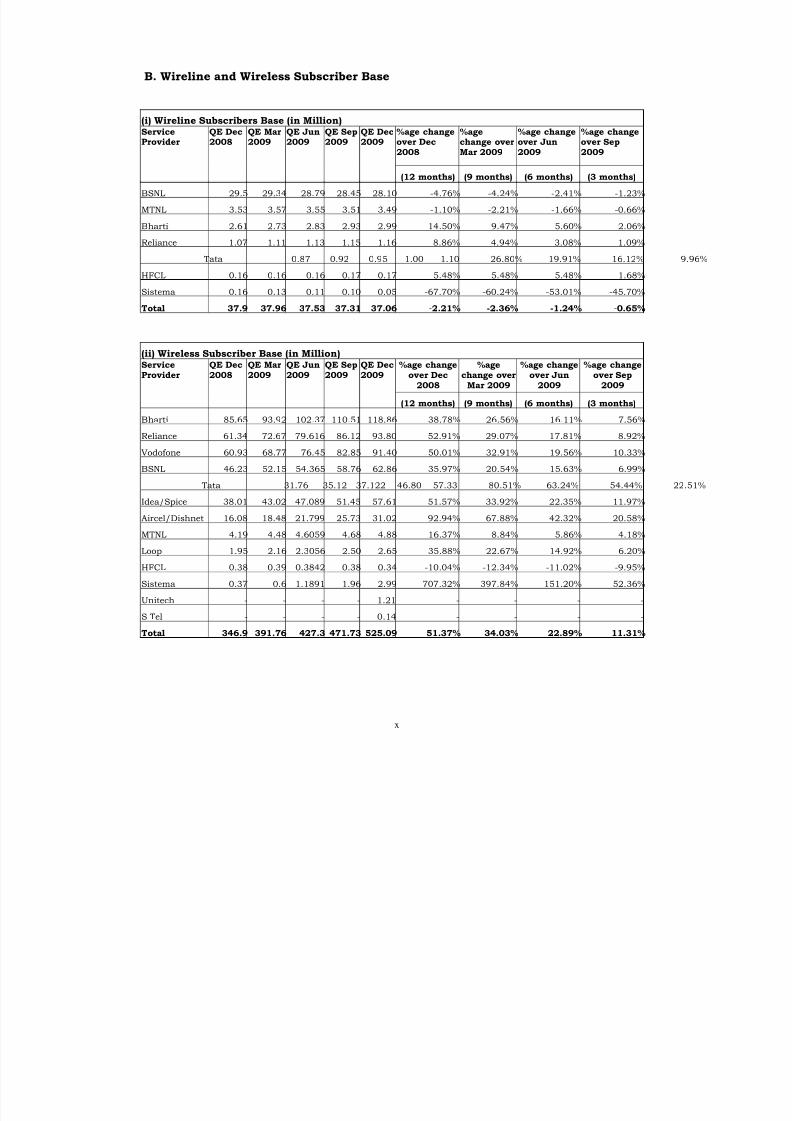
B. Wireline and Wireless Subscriber Base
(i) Wireline Subscribers Base (in Million)%age changeover Dec2008
%agechange overMar 2009
%age changeover Jun2009
%age changeover Sep2009
ServiceProvider
QE Dec2008
QE Mar2009
QE Jun2009
QE Sep2009
QE Dec2009
(12 months) (9 months) (6 months) (3 months)
BSNL 29.5 29.34 28.79 28.45 28.10 -4.76% -4.24% -2.41% -1.23%
MTNL 3.53 3.57 3.55 3.51 3.49 -1.10% -2.21% -1.66% -0.66%
Bharti 2.61 2.73 2.83 2.93 2.99 14.50% 9.47% 5.60% 2.06%
Reliance 1.07 1.11 1.13 1.15 1.16 8.86% 4.94% 3.08% 1.09%
Tata 0.87 0.92 0.95 1.00 1.10 26.80% 19.91% 16.12%
HFCL 0.16 0.16 0.16 0.17 0.17 5.48% 5.48% 5.48% 1.68%
Sistema 0.16 0.13 0.11 0.10 0.05 -67.70% -60.24% -53.01% -45.70%Total 37.9 37.96 37.53 37.31 37.06 -2.21% -2.36% -1.24% -0.65%
(ii) Wireless Subscriber Base (in Million)%age change
over Dec2008
%agechange overMar 2009
%age changeover Jun
2009
%age changeover Sep
2009
ServiceProvider
QE Dec2008
QE Mar2009
QE Jun2009
QE Sep2009
QE Dec2009
(12 months) (9 months) (6 months) (3 months)
Bharti 85.65 93.92 102.37 110.51 118.86 38.78% 26.56% 16.11% 7.56%
Reliance 61.34 72.67 79.616 86.12 93.80 52.91% 29.07% 17.81% 8.92%
Vodofone 60.93 68.77 76.45 82.85 91.40 50.01% 32.91% 19.56% 10.33%
BSNL 46.23 52.15 54.365 58.76 62.86 35.97% 20.54% 15.63% 6.99%
Tata 31.76 35.12 37.122 46.80 57.33 80.51% 63.24% 54.44%
Idea/Spice 38.01 43.02 47.089 51.45 57.61 51.57% 33.92% 22.35% 11.97%
Aircel/Dishnet 16.08 18.48 21.799 25.73 31.02 92.94% 67.88% 42.32% 20.58%
MTNL 4.19 4.48 4.6059 4.68 4.88 16.37% 8.84% 5.86% 4.18%
Loop 1.95 2.16 2.3056 2.50 2.65 35.88% 22.67% 14.92% 6.20%
HFCL 0.38 0.39 0.3842 0.38 0.34 -10.04% -12.34% -11.02% -9.95%
Sistema 0.37 0.6 1.1891 1.96 2.99 707.32% 397.84% 151.20% 52.36%
Unitech - - - - 1.21 - - - -
S Tel - - - - 0.14 - - - -
Total 346.9 391.76 427.3 471.73 525.09 51.37% 34.03% 22.89% 11.31%
8/9/2019 Indicator Report Apr 10
http://slidepdf.com/reader/full/indicator-report-apr-10 13/150
xi
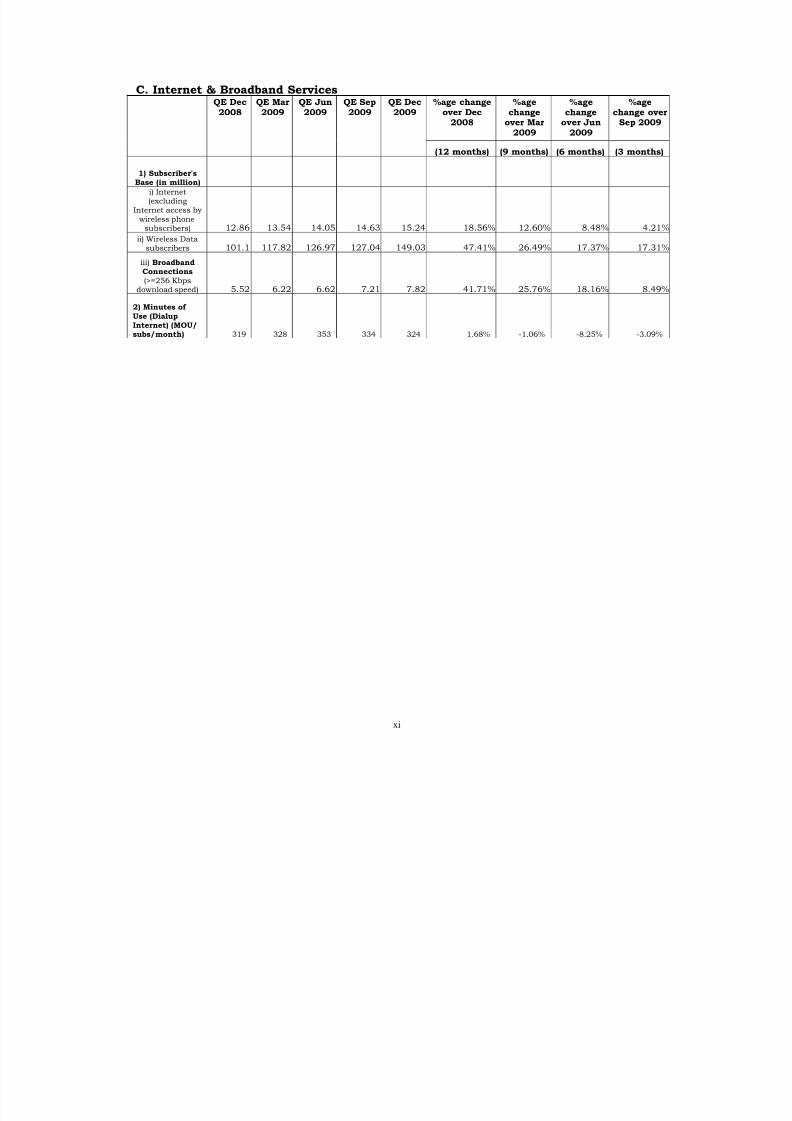
C. Internet & Broadband Services %age change
over Dec2008
%agechange
over Mar2009
%agechange
over Jun2009
%agechange ov
Sep 200
QE Dec2008
QE Mar2009
QE Jun2009
QE Sep2009
QE Dec2009
(12 months) (9 months) (6 months) (3 month
1) Subscriber'sBase (in million)
i) Internet(excluding
Internet access by
wireless phonesubscribers) 12.86 13.54 14.05 14.63 15.24 18.56% 12.60% 8.48% 4.2
ii) Wireless Datasubscribers 101.1 117.82 126.97 127.04 149.03 47.41% 26.49% 17.37% 17.3
iii) BroadbandConnections(>=256 Kbps
download speed) 5.52 6.22 6.62 7.21 7.82 41.71% 25.76% 18.16% 8.4
2) Minutes of
Use (DialupInternet) (MOU/subs/month) 319 328 353 334 324 1.68% -1.06% -8.25% -3.09
8/9/2019 Indicator Report Apr 10
http://slidepdf.com/reader/full/indicator-report-apr-10 14/150
xii
Introduction
This Report presents the Key Parameters and growth trends for the
Telecom Services in India for the quarter ending December 2009. Thisreport provides a broad perspective on the Telecom Services to serve as a
reference document for various stakeholders, research agencies and
analysts. The Executive Summary of various Telecom Services has been
given in the beginning, followed by ‘Performance Indicators at a Glance’.
Chapter-1 deliberates the growth pattern, in terms of Subscriber base
and teledensity, of Wireline, Wireless, Internet and Value Added Services
(VAS). Chapter-2 covers the key Revenue and usage parameters.
Chapter-3 gives the financial and accounting data. Chapter-4 covers
performance of various service providers in terms of QoS. The
information relating to Cable TV, DTH & Radio Broadcast services is
provided in Chapter-5.
2. This performance indicator Report has been prepared based on the
information furnished by the Service Providers. The report is also
available on TRAI’s website (www.trai.gov.in). Any suggestion pertaining
to this report may please be addressed to Advisor (ER), TRAI; Tel. +91-
11-23230752, Fax. +91-11-23236650 and e-mail: [email protected] or

8/9/2019 Indicator Report Apr 10
http://slidepdf.com/reader/full/indicator-report-apr-10 15/150
1
Chapter 1:Subscription Data
8/9/2019 Indicator Report Apr 10
http://slidepdf.com/reader/full/indicator-report-apr-10 16/150
2
Section A: Access Service – An Overview
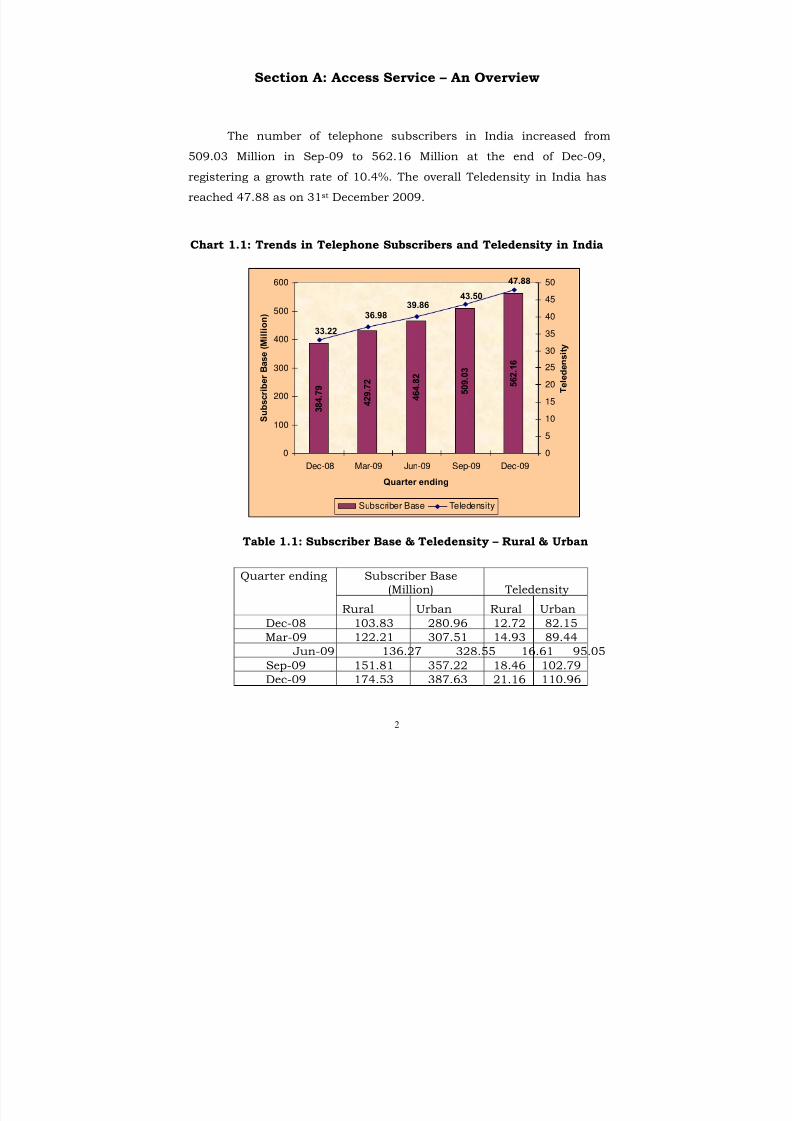
The number of telephone subscribers in India increased from
509.03 Million in Sep-09 to 562.16 Million at the end of Dec-09,
registering a growth rate of 10.4%. The overall Teledensity in India has
reached 47.88 as on 31st December 2009.
Chart 1.1: Trends in Telephone Subscribers and Teledensity in India
3 8 4 . 7
9
4 2 9 . 7
2
4 6 4 . 8
2
5 0 9 . 0
3
5 6 2 . 1
6
33.22
36.9839.86
43.50
47.88
0
100
200
300
400
500
600
Dec-08 Mar-09 Jun-09 Sep-09 Dec-09
Quarter ending
S u b s c r i b e r B a s e ( M i l l i o n )
0
5
10
15
20
25
30
35
40
45
50
T e l e d e n s i t y
Subscriber Base Teledensity
Table 1.1: Subscriber Base & Teledensity – Rural & Urban
Subscriber Base
(Million) Teledensity
Quarter ending
Rural Urban Rural Urban
Dec-08 103.83 280.96 12.72 82.15
Mar-09 122.21 307.51 14.93 89.44
Jun-09 136.27 328.55 16.61 95.05
Sep-09 151.81 357.22 18.46 102.79
Dec-09 174.53 387.63 21.16 110.96
8/9/2019 Indicator Report Apr 10
http://slidepdf.com/reader/full/indicator-report-apr-10 17/150
3
1.2 Subscription in Urban Areas grew from 357.22 Million in Sep-09 to
387.63 Million in Dec-09, taking the urban Teledensity from
102.79 to 110.96. Rural subscription increased from 151.81
Million to 174.53 Million, and the increase in Rural Teledensity is
from 18.46 to 21.16.
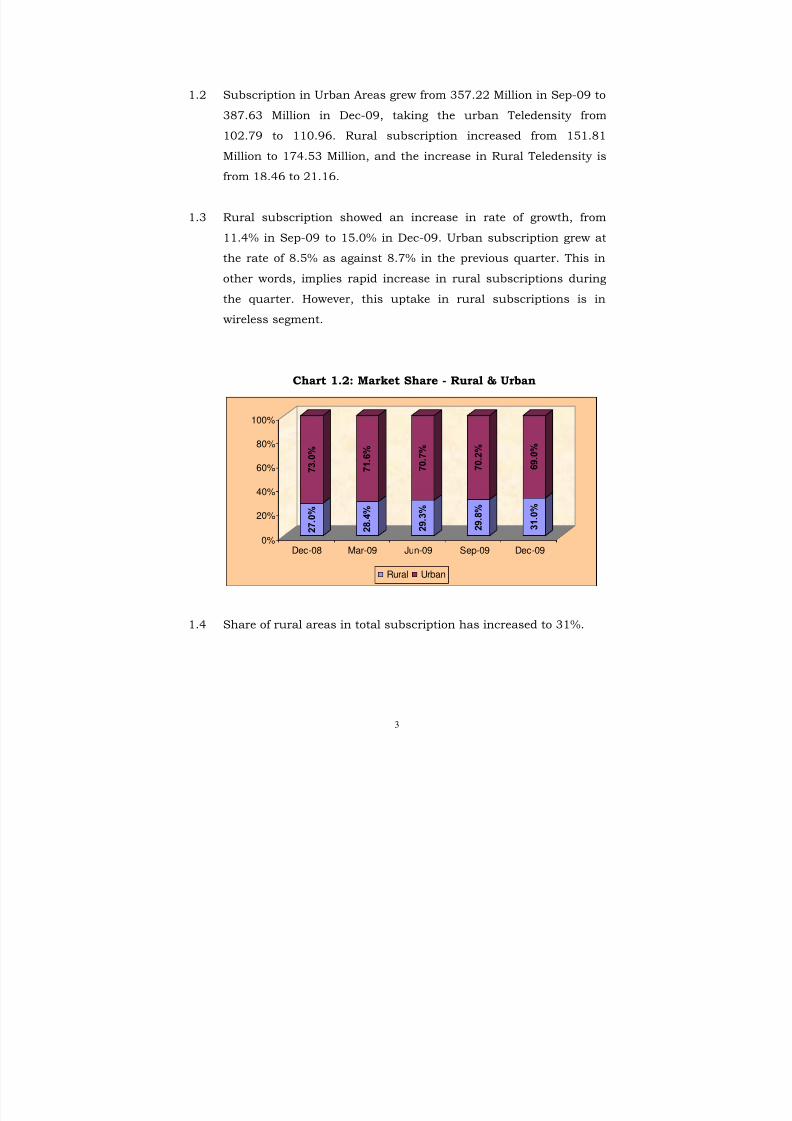
1.3 Rural subscription showed an increase in rate of growth, from
11.4% in Sep-09 to 15.0% in Dec-09. Urban subscription grew at
the rate of 8.5% as against 8.7% in the previous quarter. This in
other words, implies rapid increase in rural subscriptions during
the quarter. However, this uptake in rural subscriptions is in
wireless segment.
Chart 1.2: Market Share - Rural & Urban
2 7 . 0
%
7 3 . 0
%
2 8 . 4
%
7 1 . 6
%
2 9 . 3
%
7 0 . 7
%
2 9 . 8
%
7 0 . 2
%
3 1 . 0
%
6 9 . 0
%
0%
20%
40%
60%
80%
100%
Dec-08 Mar-09 Jun-09 Sep-09 Dec-09
Rural Urban
1.4 Share of rural areas in total subscription has increased to 31%.
8/9/2019 Indicator Report Apr 10
http://slidepdf.com/reader/full/indicator-report-apr-10 18/150
4
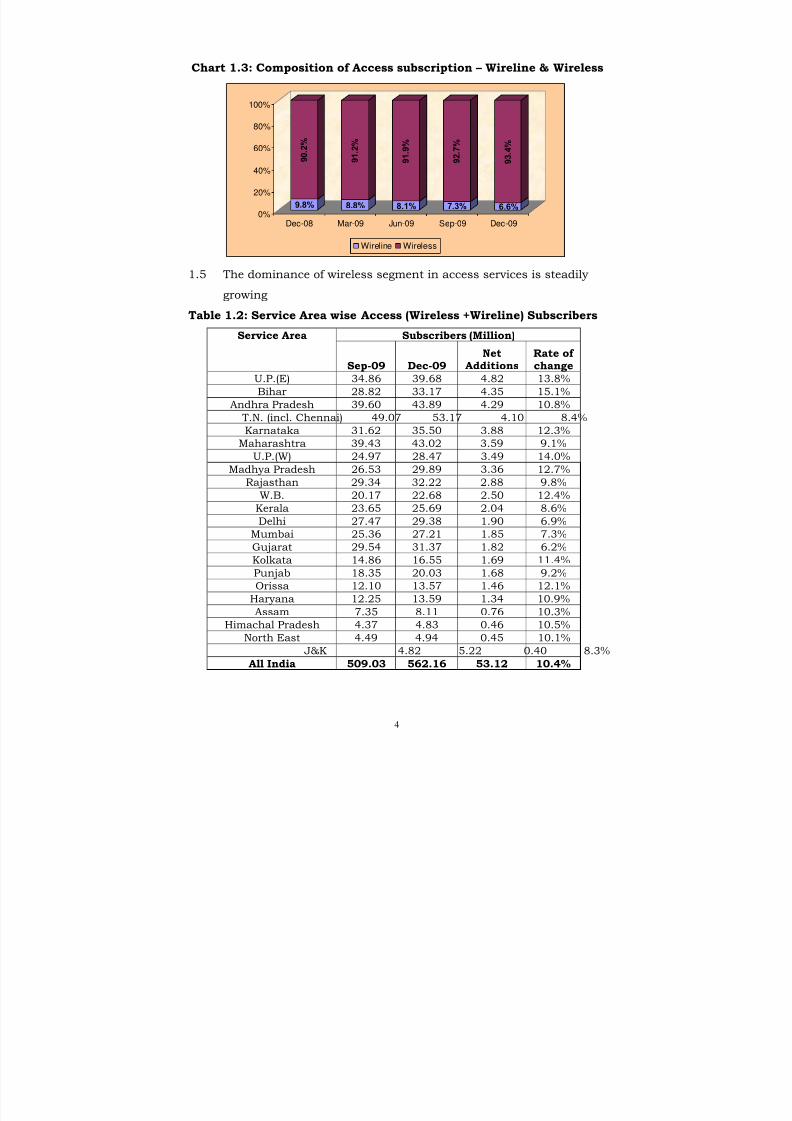
Chart 1.3: Composition of Access subscription – Wireline & Wireless
9.8%
9 0 . 2 %
8.8%
9 1 . 2 %
8.1%
9 1 . 9 %
7.3%
9 2 . 7 %
6.6%
9 3 . 4 %
0%
20%
40%
60%
80%
100%
Dec-08 Mar-09 Jun-09 Sep-09 Dec-09
Wireline Wireless
1.5 The dominance of wireless segment in access services is steadily
growing
Table 1.2: Service Area wise Access (Wireless +Wireline) Subscribers
Subscribers (Million)Service Area
Sep-09 Dec-09Net
AdditionsRate of change
U.P.(E) 34.86 39.68 4.82 13.8%
Bihar 28.82 33.17 4.35 15.1%
Andhra Pradesh 39.60 43.89 4.29 10.8%
T.N. (incl. Chennai) 49.07 53.17 4.10 8.4%
Karnataka 31.62 35.50 3.88 12.3%
Maharashtra 39.43 43.02 3.59 9.1%U.P.(W) 24.97 28.47 3.49 14.0%
Madhya Pradesh 26.53 29.89 3.36 12.7%
Rajasthan 29.34 32.22 2.88 9.8%
W.B. 20.17 22.68 2.50 12.4%
Kerala 23.65 25.69 2.04 8.6%
Delhi 27.47 29.38 1.90 6.9%
Mumbai 25.36 27.21 1.85 7.3%
Gujarat 29.54 31.37 1.82 6.2%
Kolkata 14.86 16.55 1.69 11.4%
Punjab 18.35 20.03 1.68 9.2%
Orissa 12.10 13.57 1.46 12.1%Haryana 12.25 13.59 1.34 10.9%
Assam 7.35 8.11 0.76 10.3%
Himachal Pradesh 4.37 4.83 0.46 10.5%
North East 4.49 4.94 0.45 10.1%
J&K 4.82 5.22 0.40 8.3%
All India 509.03 562.16 53.12 10.4%
8/9/2019 Indicator Report Apr 10
http://slidepdf.com/reader/full/indicator-report-apr-10 19/150
5
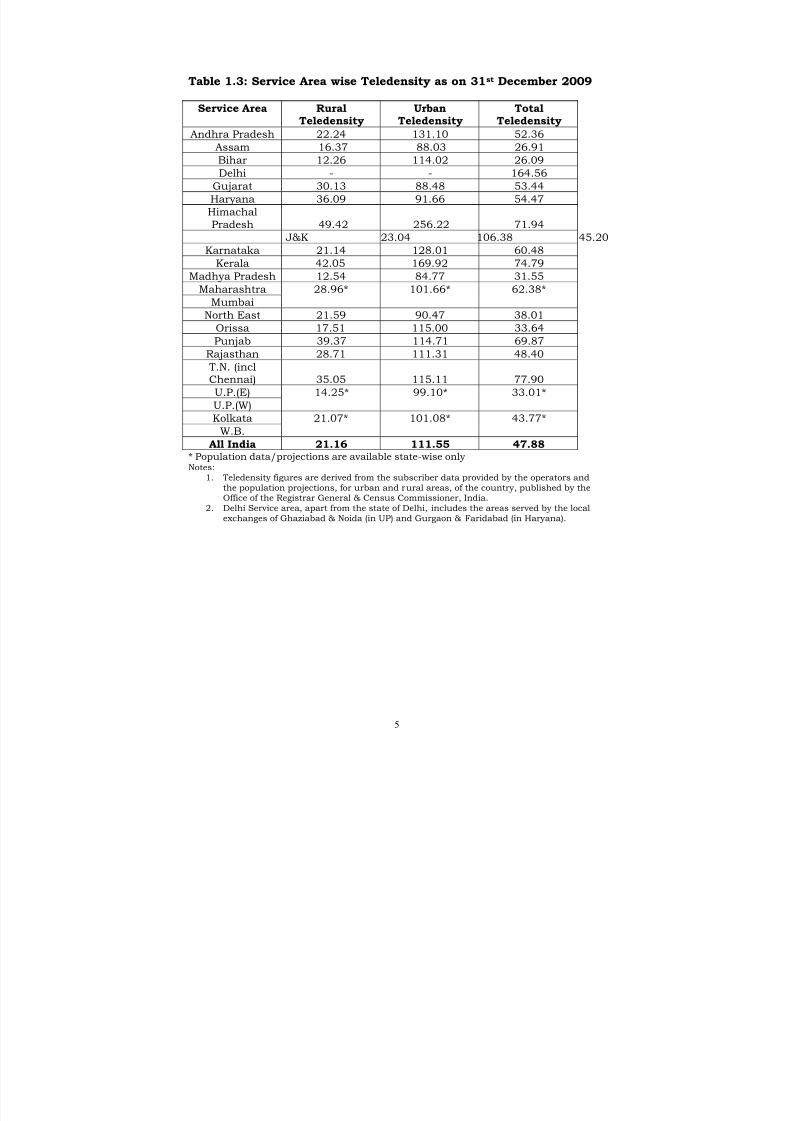
Table 1.3: Service Area wise Teledensity as on 31st December 2009
Service Area RuralTeledensity
UrbanTeledensity
TotalTeledensity
Andhra Pradesh 22.24 131.10 52.36
Assam 16.37 88.03 26.91Bihar 12.26 114.02 26.09
Delhi - - 164.56
Gujarat 30.13 88.48 53.44
Haryana 36.09 91.66 54.47
HimachalPradesh 49.42 256.22 71.94
J&K 23.04 106.38 45.20
Karnataka 21.14 128.01 60.48
Kerala 42.05 169.92 74.79
Madhya Pradesh 12.54 84.77 31.55
Maharashtra 28.96* 101.66* 62.38*Mumbai
North East 21.59 90.47 38.01
Orissa 17.51 115.00 33.64
Punjab 39.37 114.71 69.87
Rajasthan 28.71 111.31 48.40
T.N. (inclChennai) 35.05 115.11 77.90
U.P.(E) 14.25* 99.10* 33.01*
U.P.(W)
Kolkata 21.07* 101.08* 43.77*
W.B.
All India 21.16 111.55 47.88* Population data/projections are available state-wise onlyNotes:
1. Teledensity figures are derived from the subscriber data provided by the operators andthe population projections, for urban and rural areas, of the country, published by theOffice of the Registrar General & Census Commissioner, India.
2. Delhi Service area, apart from the state of Delhi, includes the areas served by the localexchanges of Ghaziabad & Noida (in UP) and Gurgaon & Faridabad (in Haryana).
8/9/2019 Indicator Report Apr 10
http://slidepdf.com/reader/full/indicator-report-apr-10 20/150
6
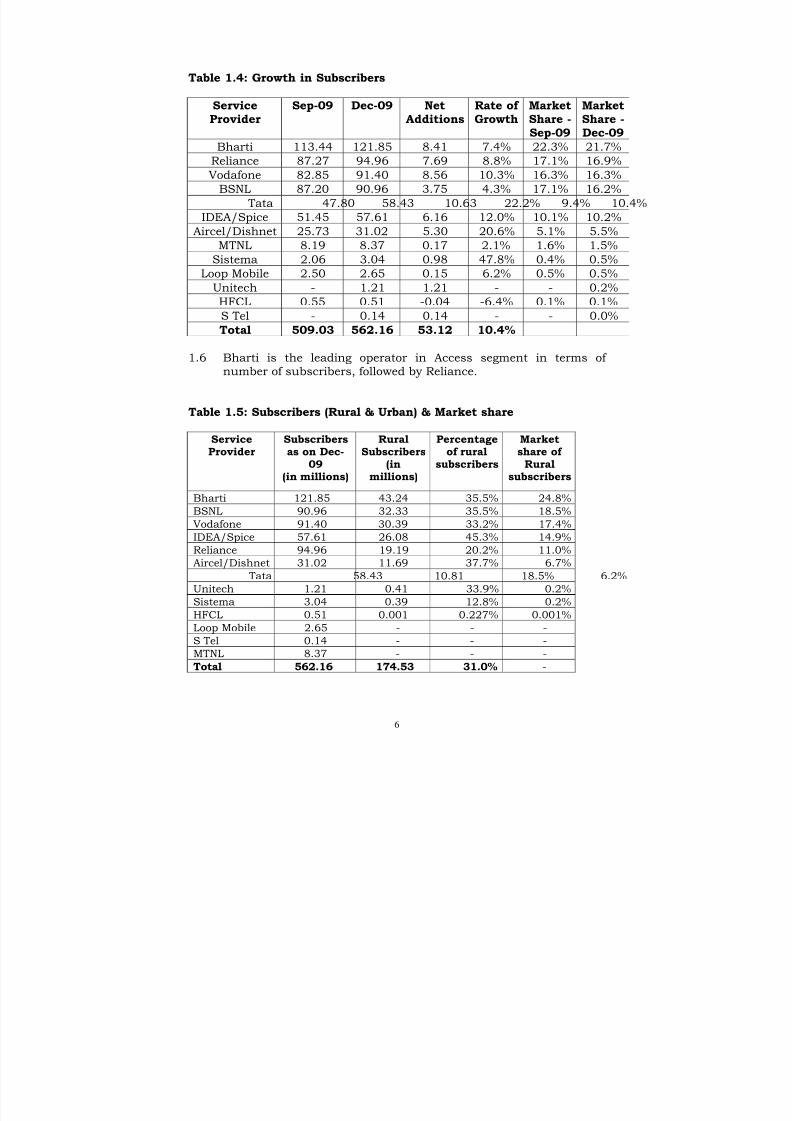
Table 1.4: Growth in Subscribers
ServiceProvider
Sep-09 Dec-09 NetAdditions
Rate of Growth
MarketShare -Sep-09
MarketShare -Dec-09
Bharti 113.44 121.85 8.41 7.4% 22.3% 21.7%Reliance 87.27 94.96 7.69 8.8% 17.1% 16.9%
Vodafone 82.85 91.40 8.56 10.3% 16.3% 16.3%
BSNL 87.20 90.96 3.75 4.3% 17.1% 16.2%
Tata 47.80 58.43 10.63 22.2% 9.4% 10.4%
IDEA/Spice 51.45 57.61 6.16 12.0% 10.1% 10.2%
Aircel/Dishnet 25.73 31.02 5.30 20.6% 5.1% 5.5%
MTNL 8.19 8.37 0.17 2.1% 1.6% 1.5%
Sistema 2.06 3.04 0.98 47.8% 0.4% 0.5%
Loop Mobile 2.50 2.65 0.15 6.2% 0.5% 0.5%
Unitech - 1.21 1.21 - - 0.2%
HFCL 0.55 0.51 -0.04 -6.4% 0.1% 0.1%
S Tel - 0.14 0.14 - - 0.0%
Total 509.03 562.16 53.12 10.4%
1.6 Bharti is the leading operator in Access segment in terms of number of subscribers, followed by Reliance.
Table 1.5: Subscribers (Rural & Urban) & Market share
ServiceProvider Subscribersas on Dec-09
(in millions)
RuralSubscribers(in
millions)
Percentageof ruralsubscribers
Marketshare of Rural
subscribers
Bharti 121.85 43.24 35.5% 24.8%
BSNL 90.96 32.33 35.5% 18.5%
Vodafone 91.40 30.39 33.2% 17.4%
IDEA/Spice 57.61 26.08 45.3% 14.9%
Reliance 94.96 19.19 20.2% 11.0%
Aircel/Dishnet 31.02 11.69 37.7% 6.7%
Tata 58.43 10.81 18.5% 6.2%
Unitech 1.21 0.41 33.9% 0.2%Sistema 3.04 0.39 12.8% 0.2%
HFCL 0.51 0.001 0.227% 0.001%
Loop Mobile 2.65 - - -
S Tel 0.14 - - -
MTNL 8.37 - - -
Total 562.16 174.53 31.0% -
8/9/2019 Indicator Report Apr 10
http://slidepdf.com/reader/full/indicator-report-apr-10 21/150
7
Section B: Wireless Service
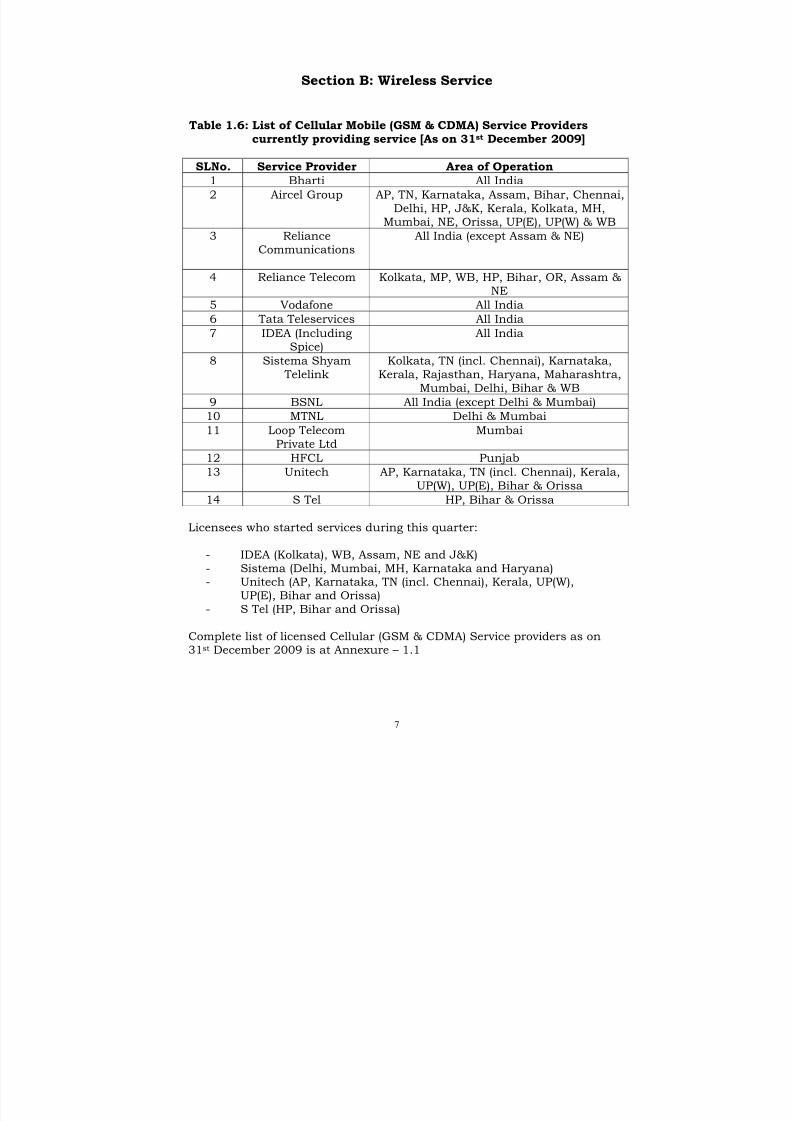
Table 1.6: List of Cellular Mobile (GSM & CDMA) Service Providerscurrently providing service [As on 31st December 2009]
SLNo. Service Provider Area of Operation1 Bharti All India
2 Aircel Group AP, TN, Karnataka, Assam, Bihar, Chennai,Delhi, HP, J&K, Kerala, Kolkata, MH,
Mumbai, NE, Orissa, UP(E), UP(W) & WB
3 RelianceCommunications
All India (except Assam & NE)
4 Reliance Telecom Kolkata, MP, WB, HP, Bihar, OR, Assam &
NE5 Vodafone All India
6 Tata Teleservices All India
7 IDEA (IncludingSpice)
All India
8 Sistema Shyam Telelink
Kolkata, TN (incl. Chennai), Karnataka,Kerala, Rajasthan, Haryana, Maharashtra,
Mumbai, Delhi, Bihar & WB
9 BSNL All India (except Delhi & Mumbai)
10 MTNL Delhi & Mumbai
11 Loop Telecom
Private Ltd
Mumbai
12 HFCL Punjab
13 Unitech AP, Karnataka, TN (incl. Chennai), Kerala,UP(W), UP(E), Bihar & Orissa
14 S Tel HP, Bihar & Orissa
Licensees who started services during this quarter:
- IDEA (Kolkata), WB, Assam, NE and J&K)- Sistema (Delhi, Mumbai, MH, Karnataka and Haryana)- Unitech (AP, Karnataka, TN (incl. Chennai), Kerala, UP(W),
UP(E), Bihar and Orissa)- S Tel (HP, Bihar and Orissa)
Complete list of licensed Cellular (GSM & CDMA) Service providers as on31st December 2009 is at Annexure – 1.1
8/9/2019 Indicator Report Apr 10
http://slidepdf.com/reader/full/indicator-report-apr-10 22/150
8
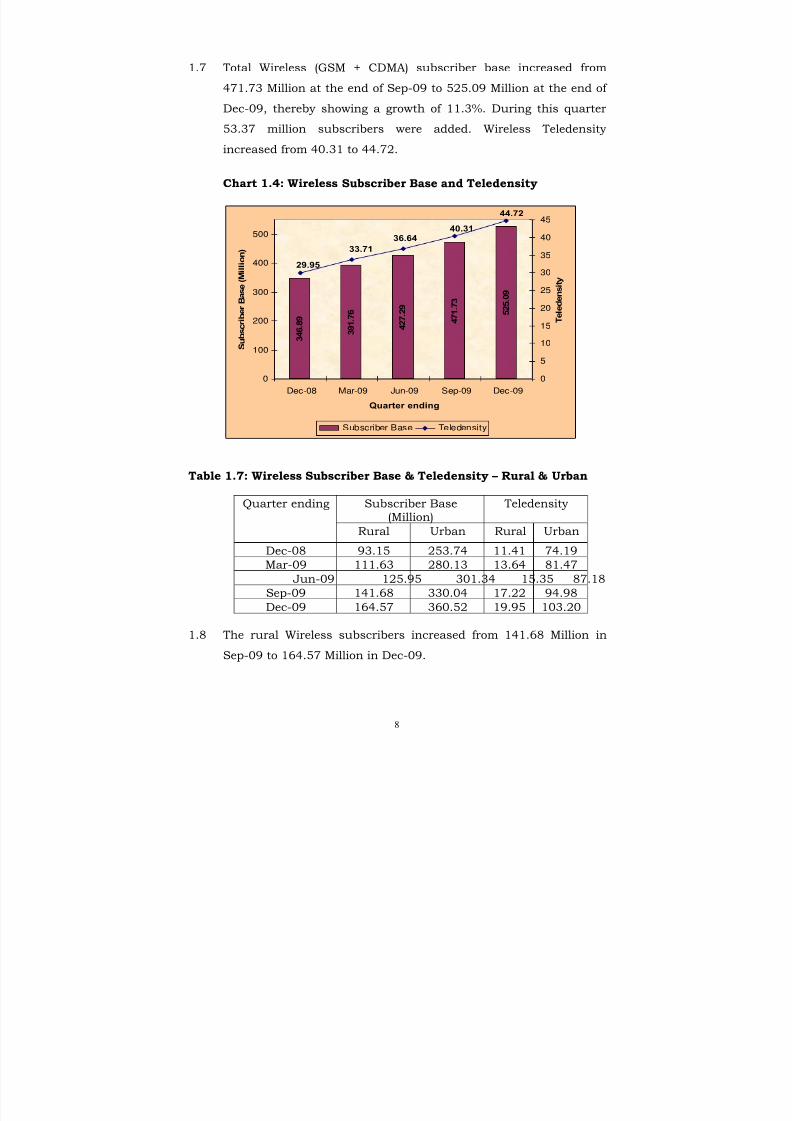
1.7 Total Wireless (GSM + CDMA) subscriber base increased from
471.73 Million at the end of Sep-09 to 525.09 Million at the end of
Dec-09, thereby showing a growth of 11.3%. During this quarter
53.37 million subscribers were added. Wireless Teledensity
increased from 40.31 to 44.72.
Chart 1.4: Wireless Subscriber Base and Teledensity
3 4 6 . 8 9
3 9 1 . 7 6
4 2 7 . 2 9
4 7 1 . 7 3
5 2 5 . 0 9
29.95
33.71
36.6440.31
44.72
0
100
200
300
400
500
Dec-08 Mar-09 Jun-09 Sep-09 Dec-09
Quarter ending
S u b s c r i b e r B a s e ( M i l l i o n )
0
5
10
15
20
25
30
35
40
45
T e l e d e n
s i t y
Subscriber Base Teledensity
Table 1.7: Wireless Subscriber Base & Teledensity – Rural & Urban
Subscriber Base(Million)
TeledensityQuarter ending
Rural Urban Rural Urban
Dec-08 93.15 253.74 11.41 74.19
Mar-09 111.63 280.13 13.64 81.47
Jun-09 125.95 301.34 15.35 87.18
Sep-09 141.68 330.04 17.22 94.98Dec-09 164.57 360.52 19.95 103.20
1.8 The rural Wireless subscribers increased from 141.68 Million in
Sep-09 to 164.57 Million in Dec-09.
8/9/2019 Indicator Report Apr 10
http://slidepdf.com/reader/full/indicator-report-apr-10 23/150
9
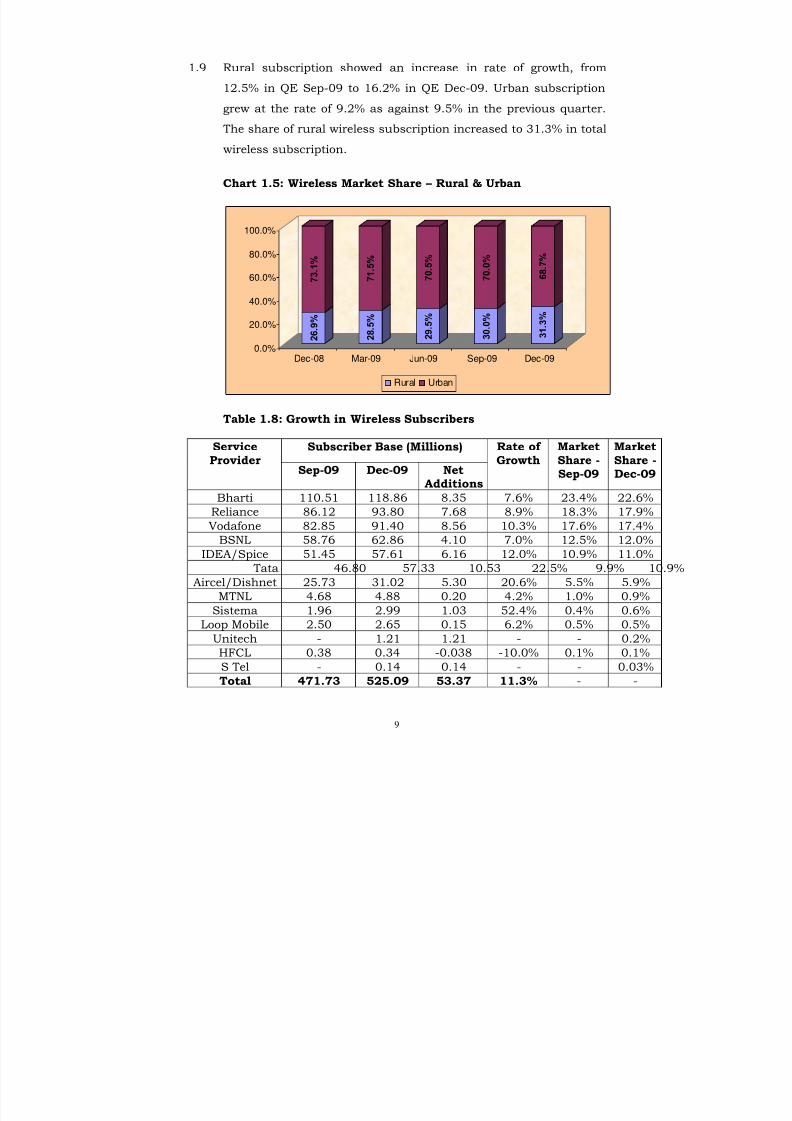
1.9 Rural subscription showed an increase in rate of growth, from
12.5% in QE Sep-09 to 16.2% in QE Dec-09. Urban subscription
grew at the rate of 9.2% as against 9.5% in the previous quarter.
The share of rural wireless subscription increased to 31.3% in total
wireless subscription.
Chart 1.5: Wireless Market Share – Rural & Urban
2 6 . 9 %
7 3 . 1 %
2 8 . 5 %
7 1 . 5 %
2 9 . 5 %
7 0 . 5 %
3 0 . 0 %
7 0 . 0 %
3 1 . 3 %
6 8 . 7 %
0.0%
20.0%
40.0%
60.0%
80.0%
100.0%
Dec-08 Mar-09 Jun-09 Sep-09 Dec-09
Rural Urban
Table 1.8: Growth in Wireless Subscribers
Subscriber Base (Millions)ServiceProvider
Sep-09 Dec-09 NetAdditions
Rate of Growth
MarketShare -Sep-09
MarketShare -Dec-09
Bharti 110.51 118.86 8.35 7.6% 23.4% 22.6%
Reliance 86.12 93.80 7.68 8.9% 18.3% 17.9%
Vodafone 82.85 91.40 8.56 10.3% 17.6% 17.4%
BSNL 58.76 62.86 4.10 7.0% 12.5% 12.0%
IDEA/Spice 51.45 57.61 6.16 12.0% 10.9% 11.0%
Tata 46.80 57.33 10.53 22.5% 9.9% 1
Aircel/Dishnet 25.73 31.02 5.30 20.6% 5.5% 5.9%
MTNL 4.68 4.88 0.20 4.2% 1.0% 0.9%
Sistema 1.96 2.99 1.03 52.4% 0.4% 0.6%
Loop Mobile 2.50 2.65 0.15 6.2% 0.5% 0.5%
Unitech - 1.21 1.21 - - 0.2%
HFCL 0.38 0.34 -0.038 -10.0% 0.1% 0.1%
S Tel - 0.14 0.14 - - 0.03%
Total 471.73 525.09 53.37 11.3% - -
8/9/2019 Indicator Report Apr 10
http://slidepdf.com/reader/full/indicator-report-apr-10 24/150
10
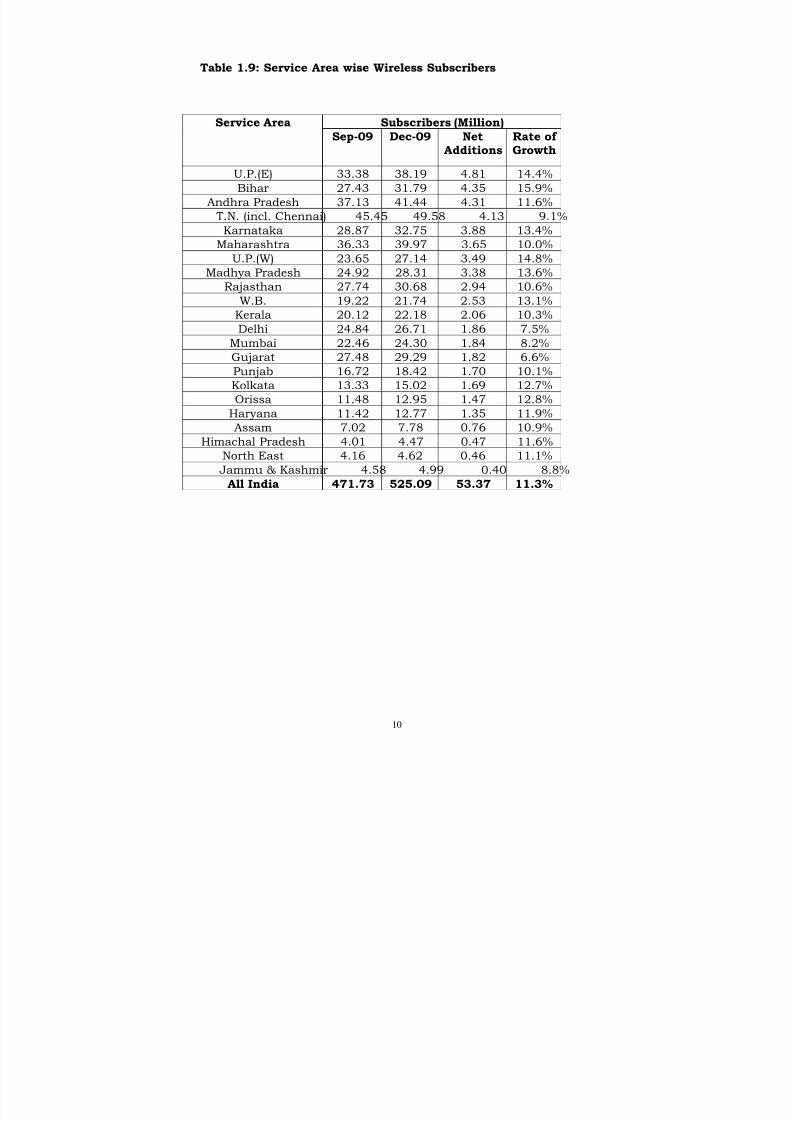
Table 1.9: Service Area wise Wireless Subscribers
Subscribers (Million)Service Area
Sep-09 Dec-09 Net
Additions
Rate of
Growth
U.P.(E) 33.38 38.19 4.81 14.4%
Bihar 27.43 31.79 4.35 15.9%
Andhra Pradesh 37.13 41.44 4.31 11.6%
T.N. (incl. Chennai) 45.45 49.58 4.13 9.1%
Karnataka 28.87 32.75 3.88 13.4%
Maharashtra 36.33 39.97 3.65 10.0%
U.P.(W) 23.65 27.14 3.49 14.8%
Madhya Pradesh 24.92 28.31 3.38 13.6%
Rajasthan 27.74 30.68 2.94 10.6%
W.B. 19.22 21.74 2.53 13.1%
Kerala 20.12 22.18 2.06 10.3%
Delhi 24.84 26.71 1.86 7.5%
Mumbai 22.46 24.30 1.84 8.2%
Gujarat 27.48 29.29 1.82 6.6%
Punjab 16.72 18.42 1.70 10.1%
Kolkata 13.33 15.02 1.69 12.7%
Orissa 11.48 12.95 1.47 12.8%
Haryana 11.42 12.77 1.35 11.9%
Assam 7.02 7.78 0.76 10.9%
Himachal Pradesh 4.01 4.47 0.47 11.6%North East 4.16 4.62 0.46 11.1%
Jammu & Kashmir 4.58 4.99 0.40 8.8%
All India 471.73 525.09 53.37 11.3%
8/9/2019 Indicator Report Apr 10
http://slidepdf.com/reader/full/indicator-report-apr-10 25/150
11
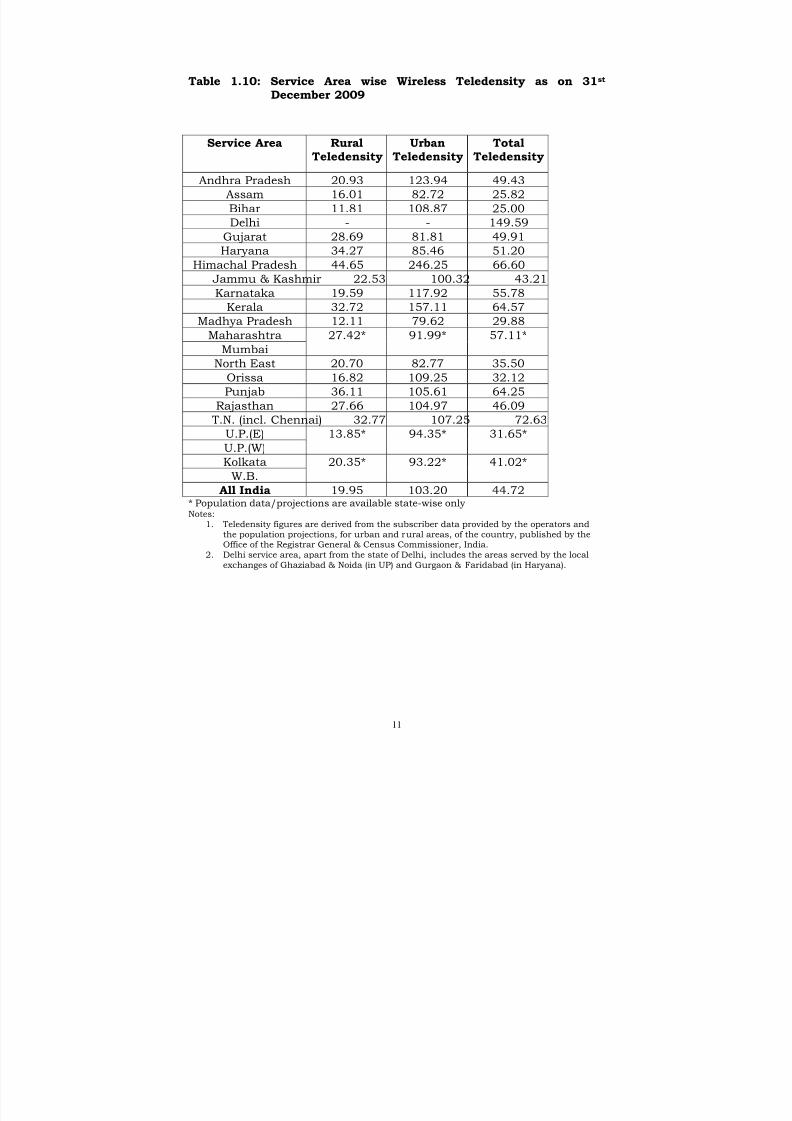
Table 1.10: Service Area wise Wireless Teledensity as on 31st
December 2009
Service Area RuralTeledensity UrbanTeledensity TotalTeledensity
Andhra Pradesh 20.93 123.94 49.43
Assam 16.01 82.72 25.82
Bihar 11.81 108.87 25.00
Delhi - - 149.59
Gujarat 28.69 81.81 49.91
Haryana 34.27 85.46 51.20
Himachal Pradesh 44.65 246.25 66.60
Jammu & Kashmir 22.53 100.32 43.21
Karnataka 19.59 117.92 55.78Kerala 32.72 157.11 64.57
Madhya Pradesh 12.11 79.62 29.88
Maharashtra
Mumbai
27.42* 91.99* 57.11*
North East 20.70 82.77 35.50
Orissa 16.82 109.25 32.12
Punjab 36.11 105.61 64.25
Rajasthan 27.66 104.97 46.09
T.N. (incl. Chennai) 32.77 107.25 72.63
U.P.(E)
U.P.(W)
13.85* 94.35* 31.65*
Kolkata
W.B.
20.35* 93.22* 41.02*
All India 19.95 103.20 44.72* Population data/projections are available state-wise onlyNotes:
1. Teledensity figures are derived from the subscriber data provided by the operators andthe population projections, for urban and rural areas, of the country, published by theOffice of the Registrar General & Census Commissioner, India.
2. Delhi service area, apart from the state of Delhi, includes the areas served by the localexchanges of Ghaziabad & Noida (in UP) and Gurgaon & Faridabad (in Haryana).
8/9/2019 Indicator Report Apr 10
http://slidepdf.com/reader/full/indicator-report-apr-10 26/150
12
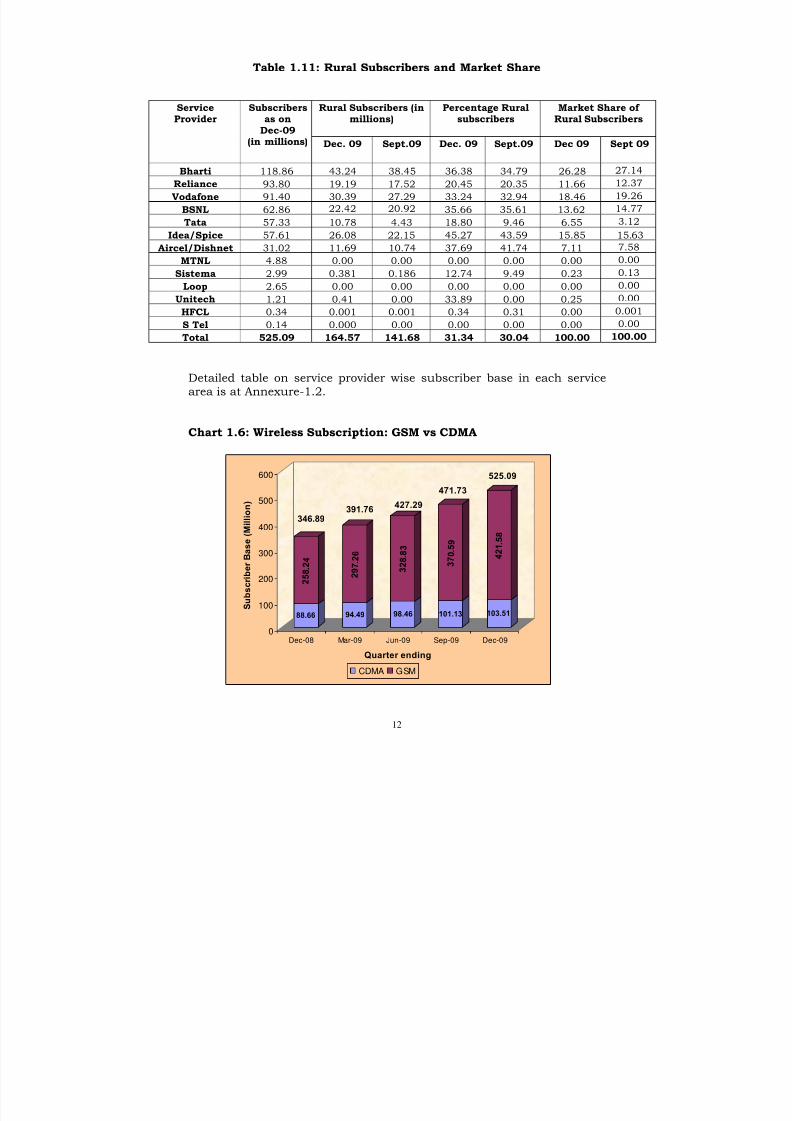
Table 1.11: Rural Subscribers and Market Share
Rural Subscribers (inmillions)
Percentage Ruralsubscribers
Market Share of Rural Subscribers
ServiceProvider
Subscribersas on
Dec-09(in millions)
Dec. 09 Sept.09 Dec. 09 Sept.09 Dec 09 Sept 09
Bharti 118.86 43.24 38.45 36.38 34.79 26.28 27.14
Reliance 93.80 19.19 17.52 20.45 20.35 11.66 12.37
Vodafone 91.40 30.39 27.29 33.24 32.94 18.46 19.26
BSNL 62.86 22.42 20.92 35.66 35.61 13.62 14.77
Tata 57.33 10.78 4.43 18.80 9.46 6.55 3.12
Idea/Spice 57.61 26.08 22.15 45.27 43.59 15.85 15.63
Aircel/Dishnet 31.02 11.69 10.74 37.69 41.74 7.11 7.58
MTNL 4.88 0.00 0.00 0.00 0.00 0.00 0.00
Sistema 2.99 0.381 0.186 12.74 9.49 0.23 0.13
Loop 2.65 0.00 0.00 0.00 0.00 0.00 0.00
Unitech 1.21 0.41 0.00 33.89 0.00 0.25 0.00
HFCL 0.34 0.001 0.001 0.34 0.31 0.00 0.001
S Tel 0.14 0.000 0.00 0.00 0.00 0.00 0.00
Total 525.09 164.57 141.68 31.34 30.04 100.00 100.00
Detailed table on service provider wise subscriber base in each servicearea is at Annexure-1.2.
Chart 1.6: Wireless Subscription: GSM vs CDMA
88.66
2 5 8
. 2 4
94.49
2 9 7
. 2 6
98.46
3 2 8
. 8 3
101.13
3 7 0
. 5 9
103.51
4 2 1
. 5 8
0
100
200
300
400
500
600
S u b s
c r i b e r B a s e ( M i l l i o n )
Dec-08 Mar-09 Jun-09 Sep-09 Dec-09
Quarter ending
CDMA GSM
471.73
346.89391.76
427.29
525.09
8/9/2019 Indicator Report Apr 10
http://slidepdf.com/reader/full/indicator-report-apr-10 27/150
13
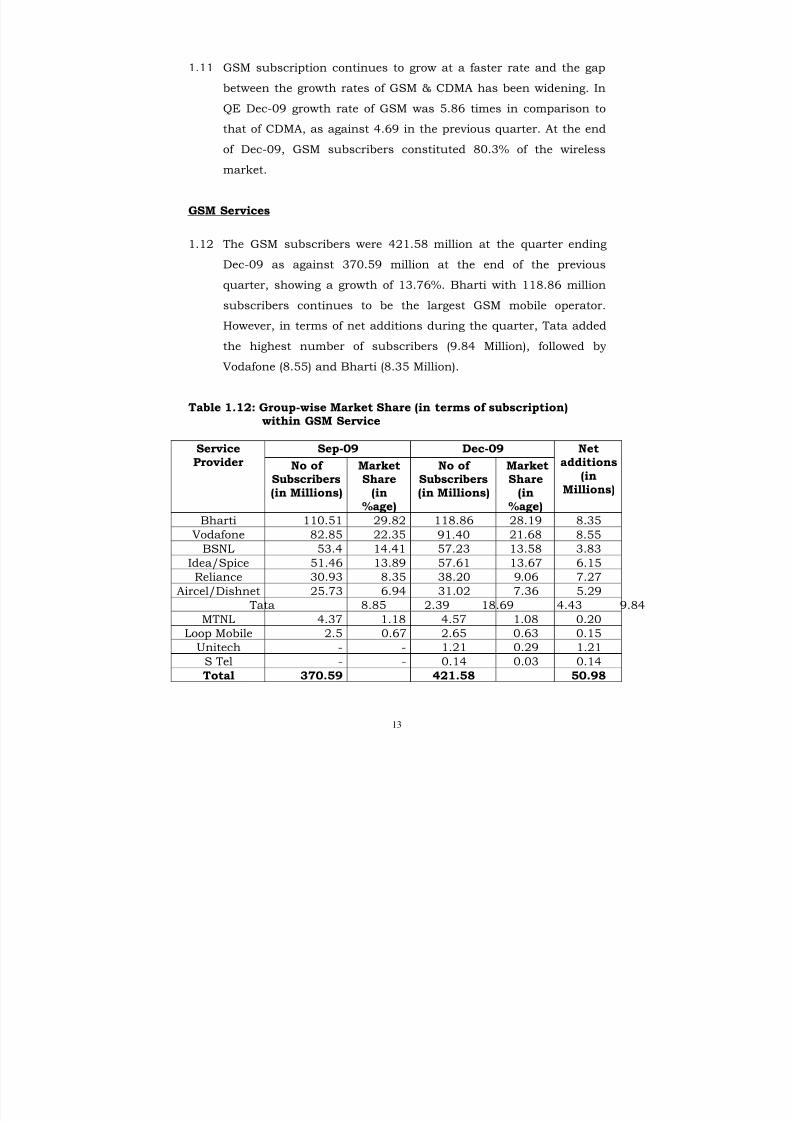
1.11 GSM subscription continues to grow at a faster rate and the gap
between the growth rates of GSM & CDMA has been widening. In
QE Dec-09 growth rate of GSM was 5.86 times in comparison to
that of CDMA, as against 4.69 in the previous quarter. At the end
of Dec-09, GSM subscribers constituted 80.3% of the wireless
market.
GSM Services
1.12 The GSM subscribers were 421.58 million at the quarter ending
Dec-09 as against 370.59 million at the end of the previous
quarter, showing a growth of 13.76%. Bharti with 118.86 million
subscribers continues to be the largest GSM mobile operator.
However, in terms of net additions during the quarter, Tata added
the highest number of subscribers (9.84 Million), followed by
Vodafone (8.55) and Bharti (8.35 Million).
Table 1.12: Group-wise Market Share (in terms of subscription)within GSM Service
Sep-09 Dec-09ServiceProvider No of
Subscribers(in Millions)
MarketShare
(in%age)
No of Subscribers(in Millions)
MarketShare
(in%age)
Netadditions
(inMillions)
Bharti 110.51 29.82 118.86 28.19 8.35
Vodafone 82.85 22.35 91.40 21.68 8.55
BSNL 53.4 14.41 57.23 13.58 3.83
Idea/Spice 51.46 13.89 57.61 13.67 6.15
Reliance 30.93 8.35 38.20 9.06 7.27
Aircel/Dishnet 25.73 6.94 31.02 7.36 5.29 Tata 8.85 2.39 18.69 4.43 9.84
MTNL 4.37 1.18 4.57 1.08 0.20
Loop Mobile 2.5 0.67 2.65 0.63 0.15
Unitech - - 1.21 0.29 1.21
S Tel - - 0.14 0.03 0.14
Total 370.59 421.58 50.98
8/9/2019 Indicator Report Apr 10
http://slidepdf.com/reader/full/indicator-report-apr-10 28/150
14
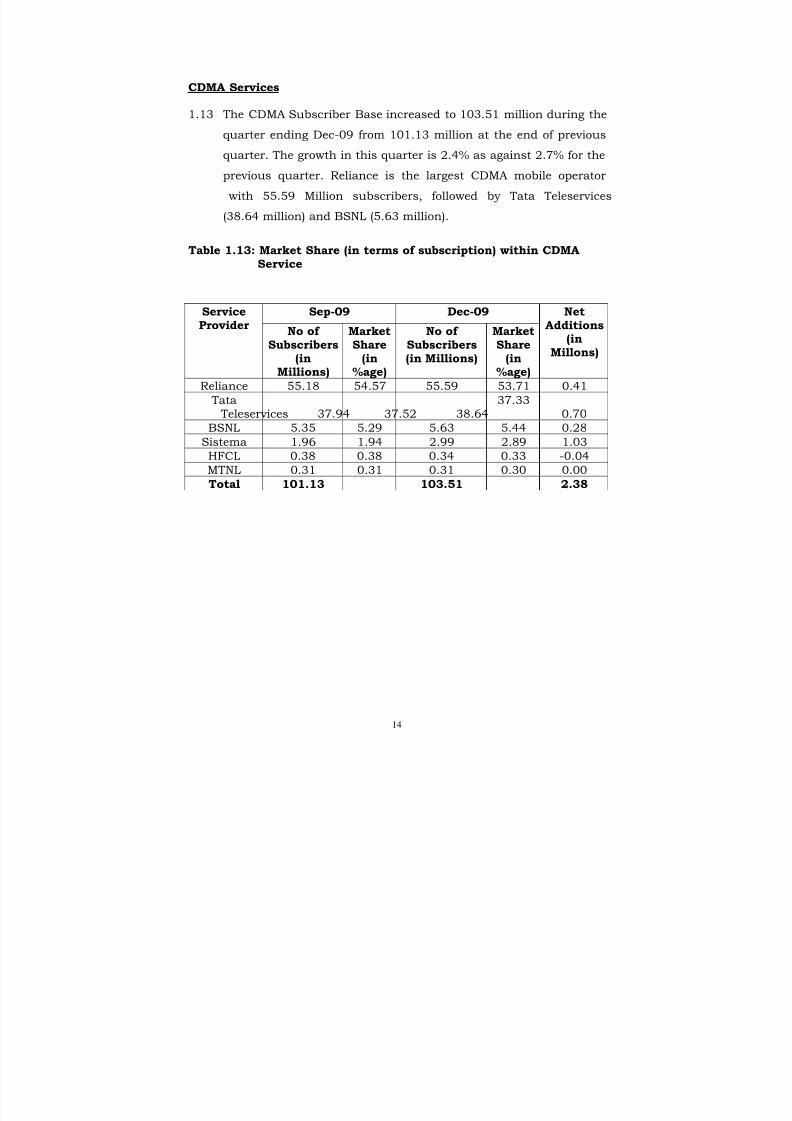
CDMA Services
1.13 The CDMA Subscriber Base increased to 103.51 million during the
quarter ending Dec-09 from 101.13 million at the end of previous
quarter. The growth in this quarter is 2.4% as against 2.7% for the
previous quarter. Reliance is the largest CDMA mobile operator
with 55.59 Million subscribers, followed by Tata Teleservices
(38.64 million) and BSNL (5.63 million).
Table 1.13: Market Share (in terms of subscription) within CDMAService
Sep-09 Dec-09ServiceProvider
No of Subscribers
(inMillions)
MarketShare
(in%age)
No of Subscribers(in Millions)
MarketShare
(in%age)
NetAdditions
(inMillons)
Reliance 55.18 54.57 55.59 53.71 0.41
Tata Teleservices 37.94 37.52 38.64
37.330.70
BSNL 5.35 5.29 5.63 5.44 0.28
Sistema 1.96 1.94 2.99 2.89 1.03HFCL 0.38 0.38 0.34 0.33 -0.04
MTNL 0.31 0.31 0.31 0.30 0.00
Total 101.13 103.51 2.38
8/9/2019 Indicator Report Apr 10
http://slidepdf.com/reader/full/indicator-report-apr-10 29/150
15
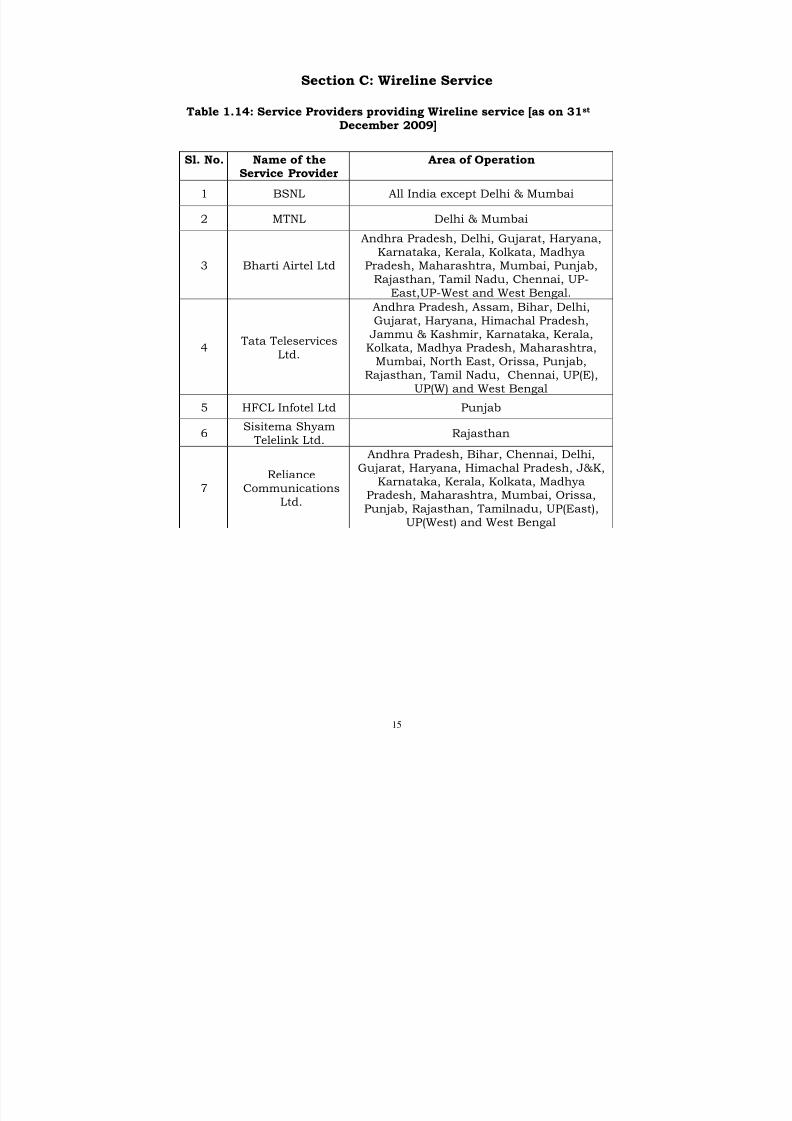
Section C: Wireline Service
Table 1.14: Service Providers providing Wireline service [as on 31st December 2009]
Sl. No. Name of theService Provider
Area of Operation
1 BSNL All India except Delhi & Mumbai
2 MTNL Delhi & Mumbai
3 Bharti Airtel Ltd
Andhra Pradesh, Delhi, Gujarat, Haryana,Karnataka, Kerala, Kolkata, Madhya
Pradesh, Maharashtra, Mumbai, Punjab,Rajasthan, Tamil Nadu, Chennai, UP-
East,UP-West and West Bengal.
4 Tata Teleservices
Ltd.
Andhra Pradesh, Assam, Bihar, Delhi,Gujarat, Haryana, Himachal Pradesh,
Jammu & Kashmir, Karnataka, Kerala,Kolkata, Madhya Pradesh, Maharashtra,
Mumbai, North East, Orissa, Punjab,Rajasthan, Tamil Nadu, Chennai, UP(E),
UP(W) and West Bengal
5 HFCL Infotel Ltd Punjab
6Sisitema Shyam
Telelink Ltd.
Rajasthan
7Reliance
CommunicationsLtd.
Andhra Pradesh, Bihar, Chennai, Delhi,Gujarat, Haryana, Himachal Pradesh, J&K,
Karnataka, Kerala, Kolkata, MadhyaPradesh, Maharashtra, Mumbai, Orissa,Punjab, Rajasthan, Tamilnadu, UP(East),
UP(West) and West Bengal
8/9/2019 Indicator Report Apr 10
http://slidepdf.com/reader/full/indicator-report-apr-10 30/150
8/9/2019 Indicator Report Apr 10
http://slidepdf.com/reader/full/indicator-report-apr-10 31/150
17
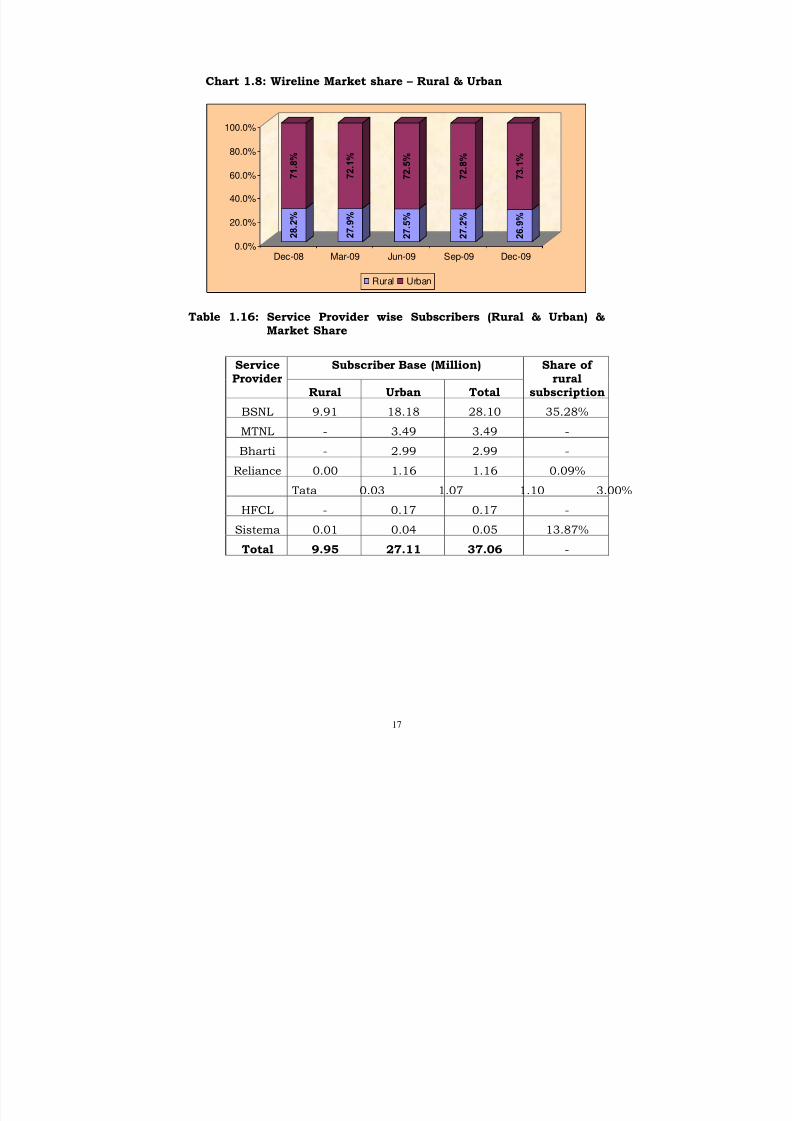
Chart 1.8: Wireline Market share – Rural & Urban
2 8 . 2
%
7 1 . 8
%
2 7 . 9
%
7 2 . 1
%
2 7 . 5
%
7 2 . 5
%
2 7 . 2
%
7 2 . 8
%
2 6 . 9
%
7 3 . 1
%
0.0%
20.0%
40.0%
60.0%
80.0%
100.0%
Dec-08 Mar-09 Jun-09 Sep-09 Dec-09
Rural Urban
Table 1.16: Service Provider wise Subscribers (Rural & Urban) &Market Share
Subscriber Base (Million)ServiceProvider
Rural Urban Total
Share of rural
subscription
BSNL 9.91 18.18 28.10 35.28%
MTNL - 3.49 3.49 -
Bharti - 2.99 2.99 -
Reliance 0.00 1.16 1.16 0.09%
Tata 0.03 1.07 1.10 3.00%
HFCL - 0.17 0.17 -
Sistema 0.01 0.04 0.05 13.87%
Total 9.95 27.11 37.06 -
8/9/2019 Indicator Report Apr 10
http://slidepdf.com/reader/full/indicator-report-apr-10 32/150
18
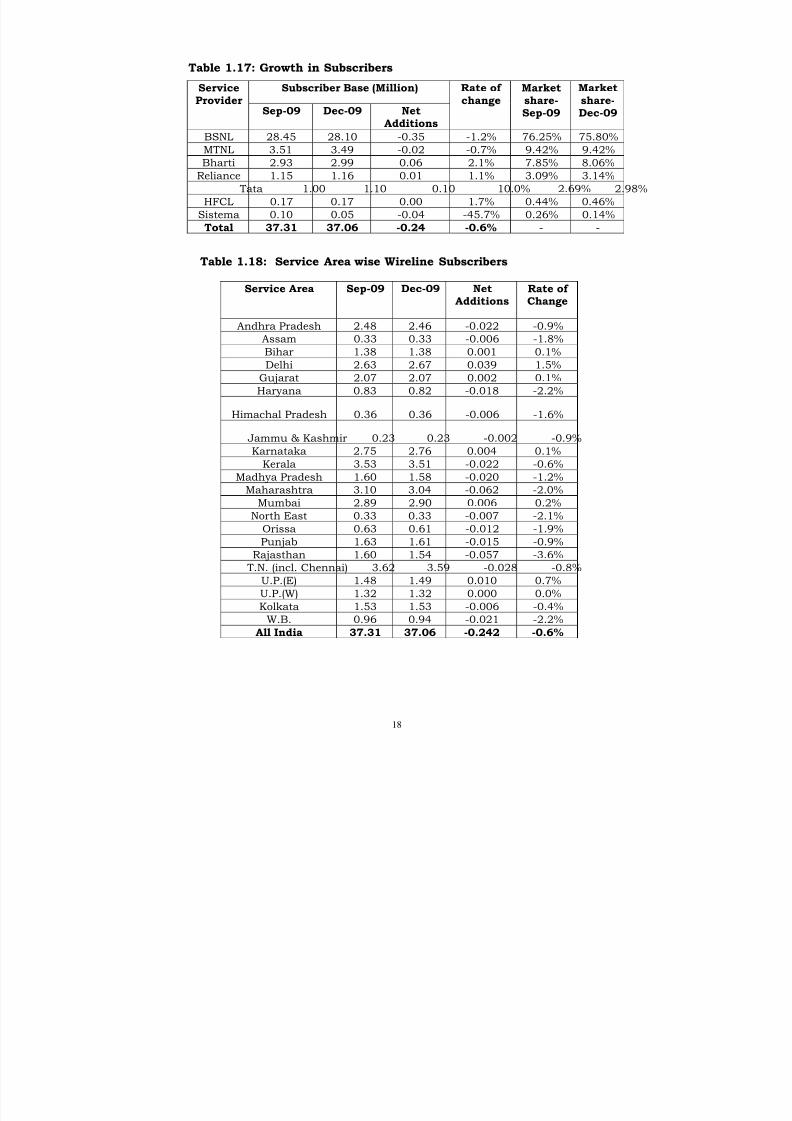
Table 1.17: Growth in Subscribers
Subscriber Base (Million)ServiceProvider
Sep-09 Dec-09 NetAdditions
Rate of change
Marketshare-Sep-09
Marketshare-Dec-09
BSNL 28.45 28.10 -0.35 -1.2% 76.25% 75.80%
MTNL 3.51 3.49 -0.02 -0.7% 9.42% 9.42%Bharti 2.93 2.99 0.06 2.1% 7.85% 8.06%
Reliance 1.15 1.16 0.01 1.1% 3.09% 3.14%
Tata 1.00 1.10 0.10 10.0% 2.69% 2.98%
HFCL 0.17 0.17 0.00 1.7% 0.44% 0.46%
Sistema 0.10 0.05 -0.04 -45.7% 0.26% 0.14%
Total 37.31 37.06 -0.24 -0.6% - -
Table 1.18: Service Area wise Wireline Subscribers
Service Area Sep-09 Dec-09 NetAdditions
Rate of Change
Andhra Pradesh 2.48 2.46 -0.022 -0.9%
Assam 0.33 0.33 -0.006 -1.8%
Bihar 1.38 1.38 0.001 0.1%
Delhi 2.63 2.67 0.039 1.5%
Gujarat 2.07 2.07 0.002 0.1%
Haryana 0.83 0.82 -0.018 -2.2%
Himachal Pradesh 0.36 0.36 -0.006 -1.6%
Jammu & Kashmir 0.23 0.23 -0.002 -0.9%Karnataka 2.75 2.76 0.004 0.1%
Kerala 3.53 3.51 -0.022 -0.6%
Madhya Pradesh 1.60 1.58 -0.020 -1.2%
Maharashtra 3.10 3.04 -0.062 -2.0%
Mumbai 2.89 2.90 0.006 0.2%
North East 0.33 0.33 -0.007 -2.1%
Orissa 0.63 0.61 -0.012 -1.9%
Punjab 1.63 1.61 -0.015 -0.9%
Rajasthan 1.60 1.54 -0.057 -3.6%
T.N. (incl. Chennai) 3.62 3.59 -0.028 -0.8%
U.P.(E) 1.48 1.49 0.010 0.7%
U.P.(W) 1.32 1.32 0.000 0.0%Kolkata 1.53 1.53 -0.006 -0.4%
W.B. 0.96 0.94 -0.021 -2.2%
All India 37.31 37.06 -0.242 -0.6%
8/9/2019 Indicator Report Apr 10
http://slidepdf.com/reader/full/indicator-report-apr-10 33/150
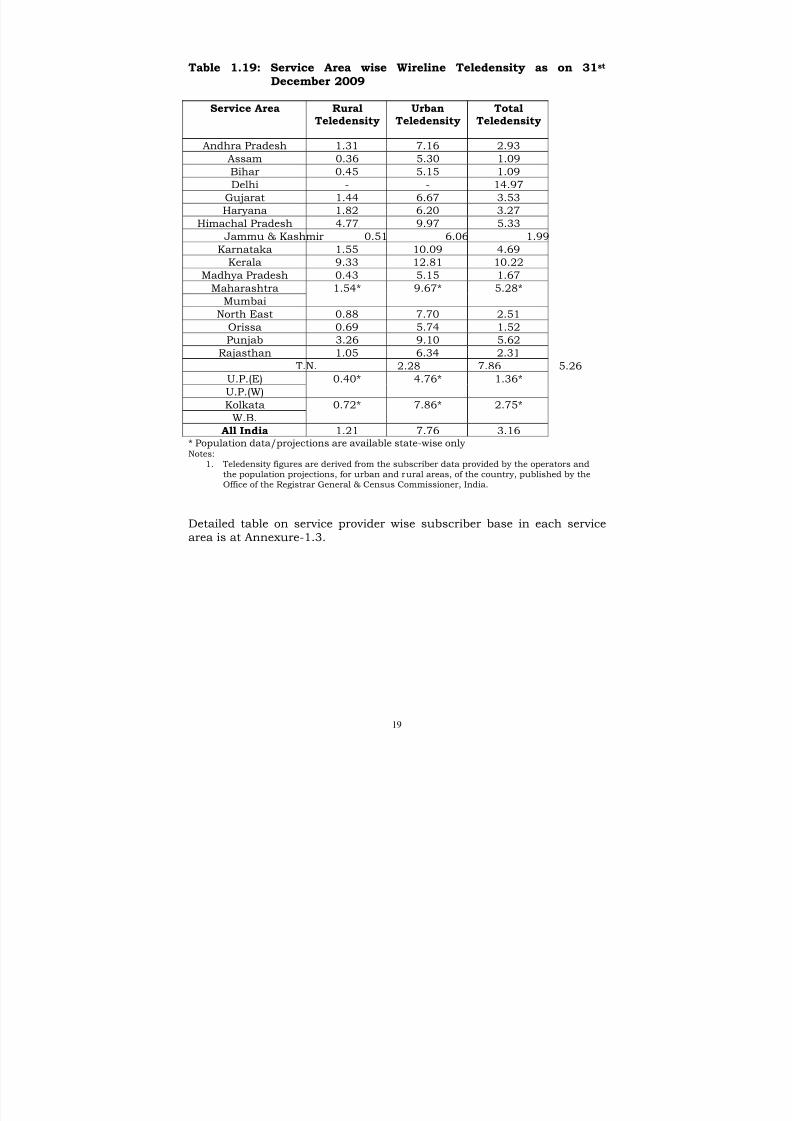
19
Table 1.19: Service Area wise Wireline Teledensity as on 31st December 2009
Service Area RuralTeledensity
UrbanTeledensity
TotalTeledensity
Andhra Pradesh 1.31 7.16 2.93Assam 0.36 5.30 1.09
Bihar 0.45 5.15 1.09
Delhi - - 14.97
Gujarat 1.44 6.67 3.53
Haryana 1.82 6.20 3.27
Himachal Pradesh 4.77 9.97 5.33
Jammu & Kashmir 0.51 6.06 1.99
Karnataka 1.55 10.09 4.69
Kerala 9.33 12.81 10.22
Madhya Pradesh 0.43 5.15 1.67
Maharashtra
Mumbai
1.54* 9.67* 5.28*
North East 0.88 7.70 2.51
Orissa 0.69 5.74 1.52
Punjab 3.26 9.10 5.62
Rajasthan 1.05 6.34 2.31
T.N. 2.28 7.86 5.26
U.P.(E)
U.P.(W)
0.40* 4.76* 1.36*
Kolkata
W.B.
0.72* 7.86* 2.75*
All India 1.21 7.76 3.16
* Population data/projections are available state-wise onlyNotes:
1. Teledensity figures are derived from the subscriber data provided by the operators andthe population projections, for urban and rural areas, of the country, published by theOffice of the Registrar General & Census Commissioner, India.
Detailed table on service provider wise subscriber base in each servicearea is at Annexure-1.3.
8/9/2019 Indicator Report Apr 10
http://slidepdf.com/reader/full/indicator-report-apr-10 34/150
20
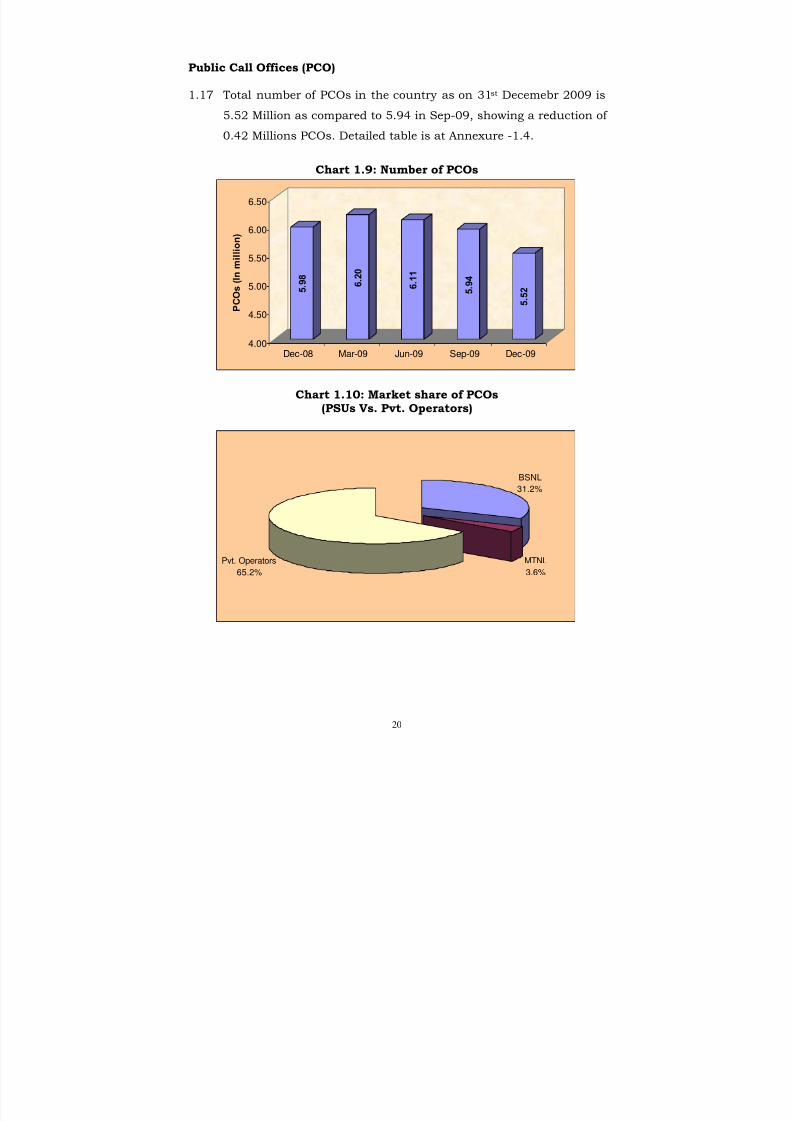
Public Call Offices (PCO)
1.17 Total number of PCOs in the country as on 31st Decemebr 2009 is
5.52 Million as compared to 5.94 in Sep-09, showing a reduction of
0.42 Millions PCOs. Detailed table is at Annexure -1.4.
Chart 1.9: Number of PCOs
5 . 9 8
6 . 2 0
6 . 1 1
5 . 9 4
5 . 5
2
4.00
4.50
5.00
5.50
6.00
6.50
P C O
s ( I n m i l l i o n )
Dec-08 Mar-09 Jun-09 Sep-09 Dec-09
Chart 1.10: Market share of PCOs(PSUs Vs. Pvt. Operators)
BSNL
31.2%
MTNL
3.6%
Pvt. Operators
65.2%
8/9/2019 Indicator Report Apr 10
http://slidepdf.com/reader/full/indicator-report-apr-10 35/150
21
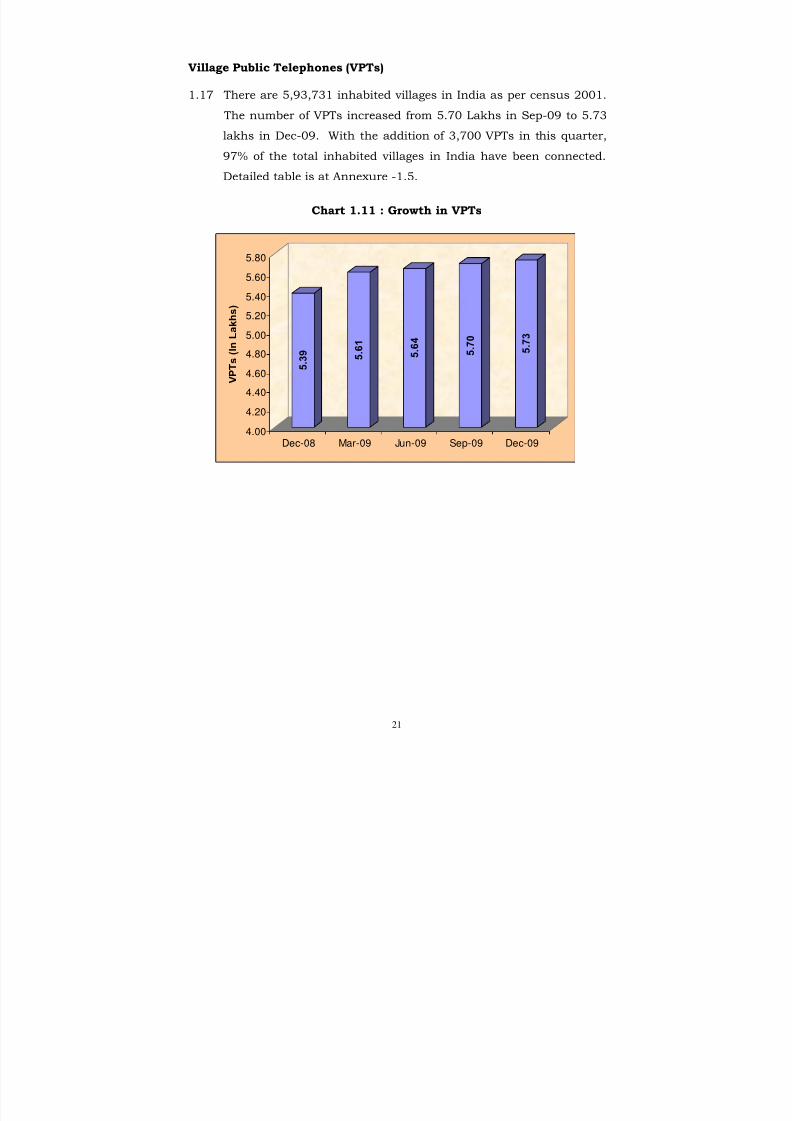
Village Public Telephones (VPTs)
1.17 There are 5,93,731 inhabited villages in India as per census 2001.
The number of VPTs increased from 5.70 Lakhs in Sep-09 to 5.73
lakhs in Dec-09. With the addition of 3,700 VPTs in this quarter,
97% of the total inhabited villages in India have been connected.
Detailed table is at Annexure -1.5.
Chart 1.11 : Growth in VPTs
5 . 3 9 5
. 6 1
5 . 6 4
5 . 7 0
5 . 7 3
4.00
4.20
4.40
4.60
4.80
5.00
5.20
5.40
5.60
5.80
V P T s ( I n L a k h s )
Dec-08 Mar-09 Jun-09 Sep-09 Dec-09
8/9/2019 Indicator Report Apr 10
http://slidepdf.com/reader/full/indicator-report-apr-10 36/150
22
Section D: Internet Service
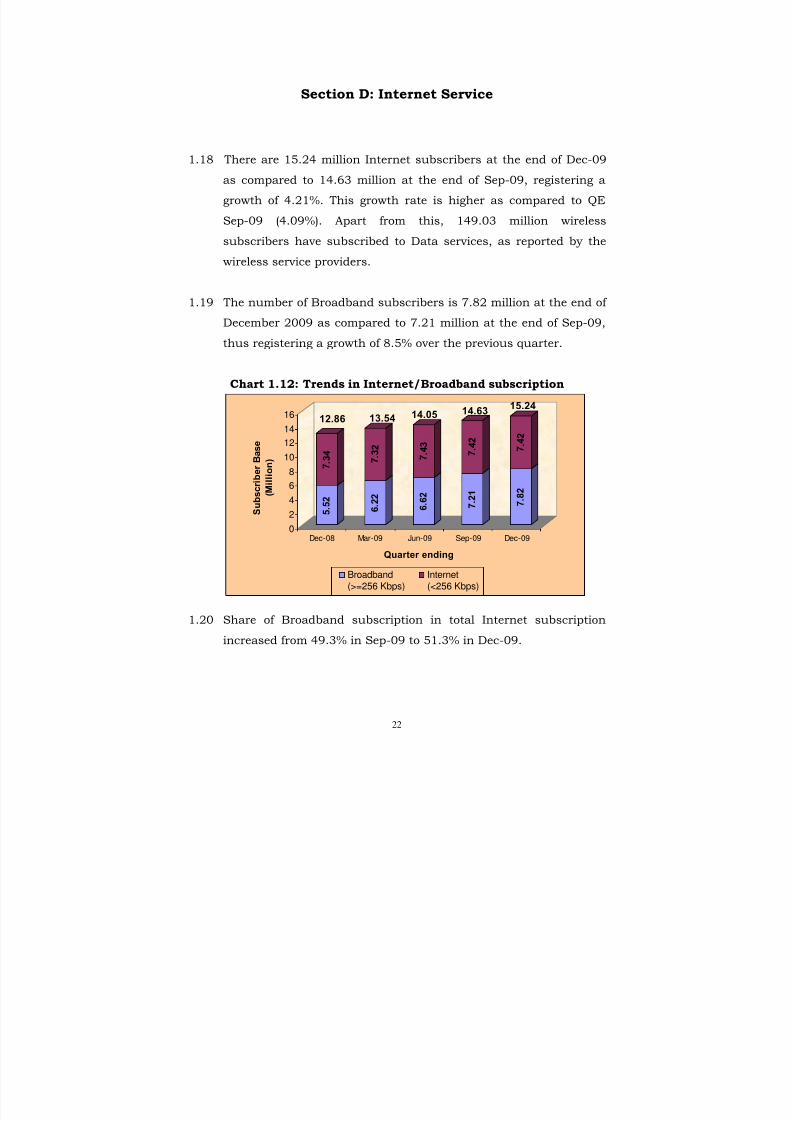
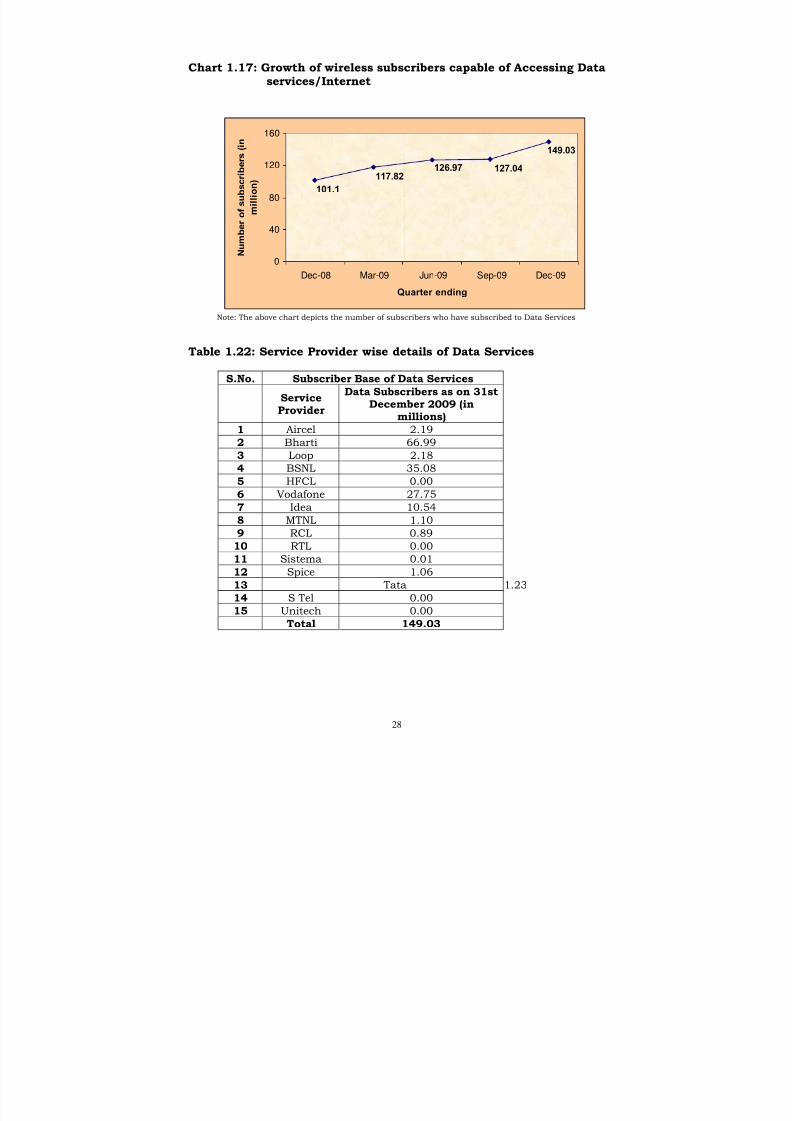
1.18 There are 15.24 million Internet subscribers at the end of Dec-09
as compared to 14.63 million at the end of Sep-09, registering a
growth of 4.21%. This growth rate is higher as compared to QE
Sep-09 (4.09%). Apart from this, 149.03 million wireless
subscribers have subscribed to Data services, as reported by the
wireless service providers.
1.19 The number of Broadband subscribers is 7.82 million at the end of
December 2009 as compared to 7.21 million at the end of Sep-09,
thus registering a growth of 8.5% over the previous quarter.
Chart 1.12: Trends in Internet/Broadband subscription
5 . 5 2
7 .
3 4
6 . 2 2
7 .
3 2
6 . 6 2
7 .
4 3
7 . 2 1
7 .
4 2
7 . 8 2
7 . 4
2
0
2
4
6
8
1012
14
16
S u b s c r i b e r B a s e
( M i l l i o n )
Dec-08 Mar-09 Jun-09 Sep-09 Dec-09
Quarter ending
Broadband
(>=256 Kbps)
Internet
(<256 Kbps)
15.24
12.86 13.54 14.05 14.63
1.20 Share of Broadband subscription in total Internet subscription
increased from 49.3% in Sep-09 to 51.3% in Dec-09.
8/9/2019 Indicator Report Apr 10
http://slidepdf.com/reader/full/indicator-report-apr-10 37/150
23
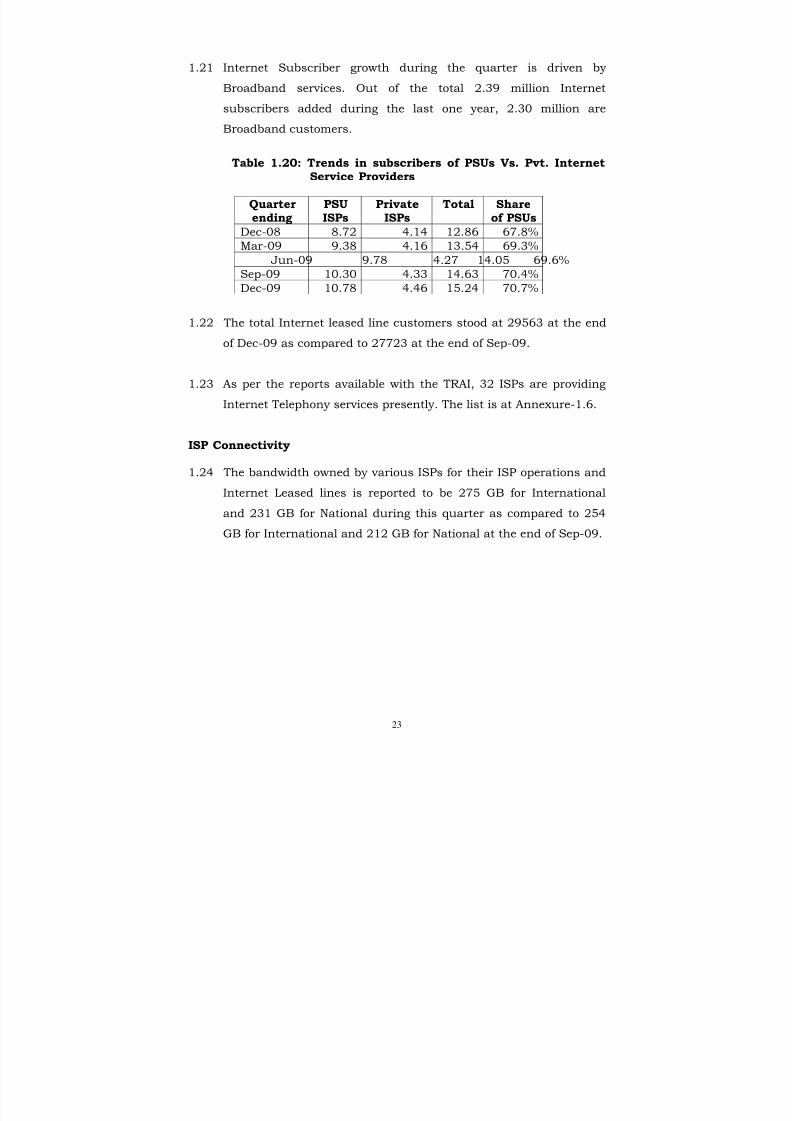
1.21 Internet Subscriber growth during the quarter is driven by
Broadband services. Out of the total 2.39 million Internet
subscribers added during the last one year, 2.30 million are
Broadband customers.
Table 1.20: Trends in subscribers of PSUs Vs. Pvt. InternetService Providers
Quarterending
PSUISPs
PrivateISPs
Total Shareof PSUs
Dec-08 8.72 4.14 12.86 67.8%
Mar-09 9.38 4.16 13.54 69.3%
Jun-09 9.78 4.27 14.05 69.6%
Sep-09 10.30 4.33 14.63 70.4%
Dec-09 10.78 4.46 15.24 70.7%
1.22 The total Internet leased line customers stood at 29563 at the end
of Dec-09 as compared to 27723 at the end of Sep-09.
1.23 As per the reports available with the TRAI, 32 ISPs are providing
Internet Telephony services presently. The list is at Annexure-1.6.
ISP Connectivity
1.24 The bandwidth owned by various ISPs for their ISP operations and
Internet Leased lines is reported to be 275 GB for International
and 231 GB for National during this quarter as compared to 254
GB for International and 212 GB for National at the end of Sep-09.
8/9/2019 Indicator Report Apr 10
http://slidepdf.com/reader/full/indicator-report-apr-10 38/150
24
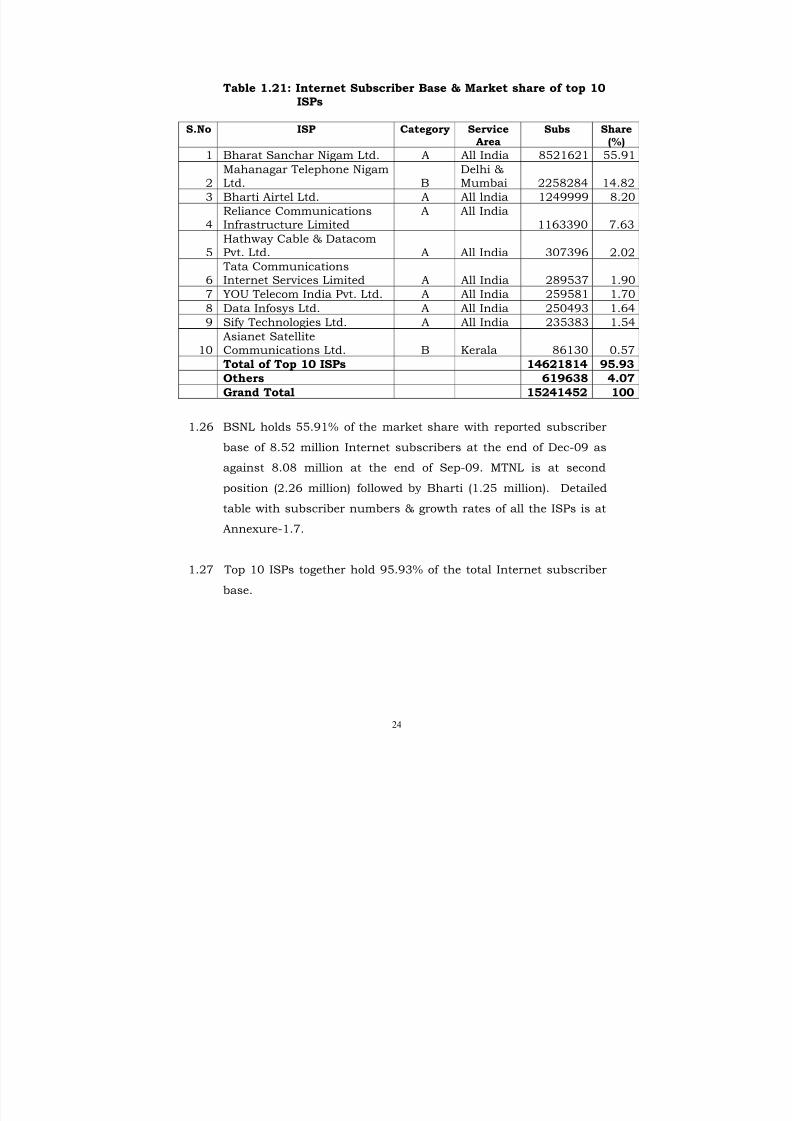
Table 1.21: Internet Subscriber Base & Market share of top 10ISPs
S.No ISP Category Service
Area
Subs Share
(%)1 Bharat Sanchar Nigam Ltd. A All India 8521621 55.91
2Mahanagar Telephone NigamLtd. B
Delhi &Mumbai 2258284 14.82
3 Bharti Airtel Ltd. A All lndia 1249999 8.20
4Reliance CommunicationsInfrastructure Limited
A All India1163390 7.63
5Hathway Cable & DatacomPvt. Ltd. A All India 307396 2.02
6 Tata CommunicationsInternet Services Limited A All India 289537 1.90
7 YOU Telecom India Pvt. Ltd. A All India 259581 1.708 Data Infosys Ltd. A All India 250493 1.64
9 Sify Technologies Ltd. A All India 235383 1.54
10Asianet SatelliteCommunications Ltd. B Kerala 86130 0.57
Total of Top 10 ISPs 14621814 95.93
Others 619638 4.07
Grand Total 15241452 100
1.26 BSNL holds 55.91% of the market share with reported subscriber
base of 8.52 million Internet subscribers at the end of Dec-09 as
against 8.08 million at the end of Sep-09. MTNL is at second
position (2.26 million) followed by Bharti (1.25 million). Detailed
table with subscriber numbers & growth rates of all the ISPs is at
Annexure-1.7.
1.27 Top 10 ISPs together hold 95.93% of the total Internet subscriber
base.
8/9/2019 Indicator Report Apr 10
http://slidepdf.com/reader/full/indicator-report-apr-10 39/150
25
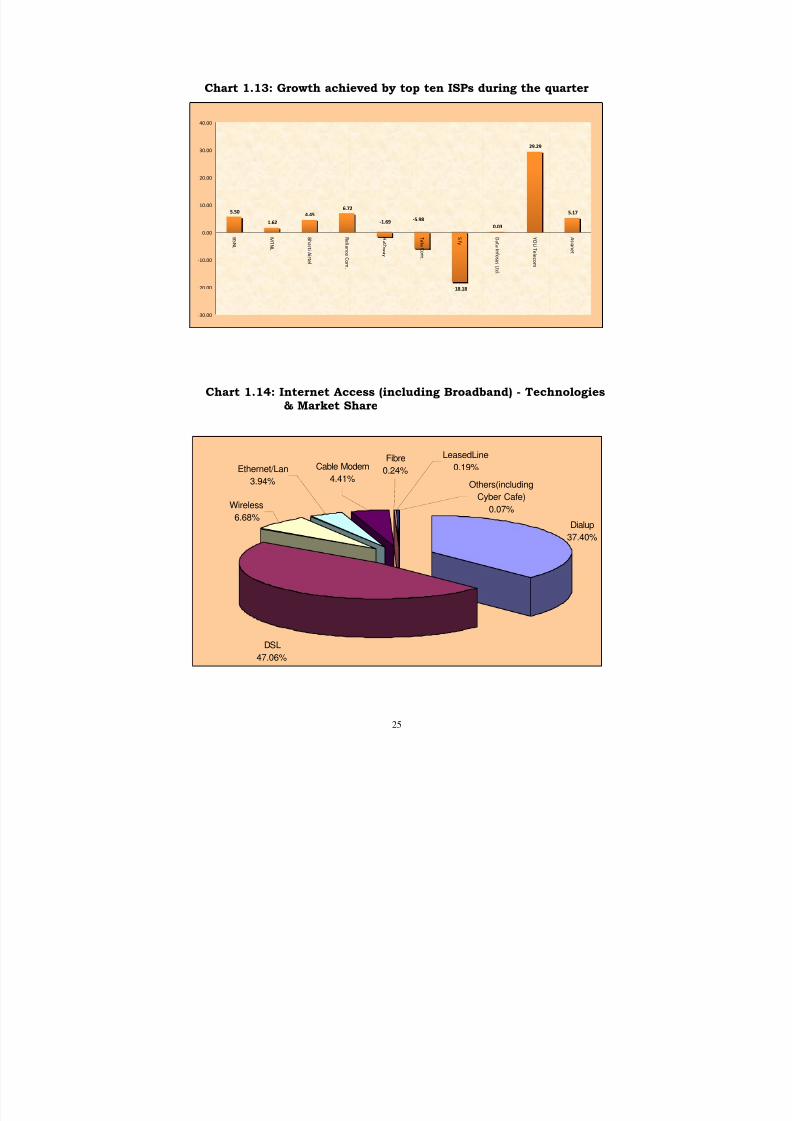
Chart 1.13: Growth achieved by top ten ISPs during the quarter
5.50
1.62
4.45
6.72
‐18.18
0.03
29.29
5.17
‐5.98‐1.69
‐30.00
‐20.00
‐10.00
0.00
10.00
20.00
30.00
40.00
B S NL
M T NL
B h a r t i A i r t e l
R e l i a n c e C o m .
H a t h w a y
T a t a C o m .
S i f y
D a t a I n f o s y s L t d .
Y O U T e l e c o m
A s i a n e t
Chart 1.14: Internet Access (including Broadband) - Technologies& Market Share
Dialup
37.40%
Others(including
Cyber Cafe)
0.07%Wireless
6.68%
Ethernet/Lan
3.94%
LeasedLine
0.19%Fibre
0.24%
DSL
47.06%
Cable Modem
4.41%
8/9/2019 Indicator Report Apr 10
http://slidepdf.com/reader/full/indicator-report-apr-10 40/150
26
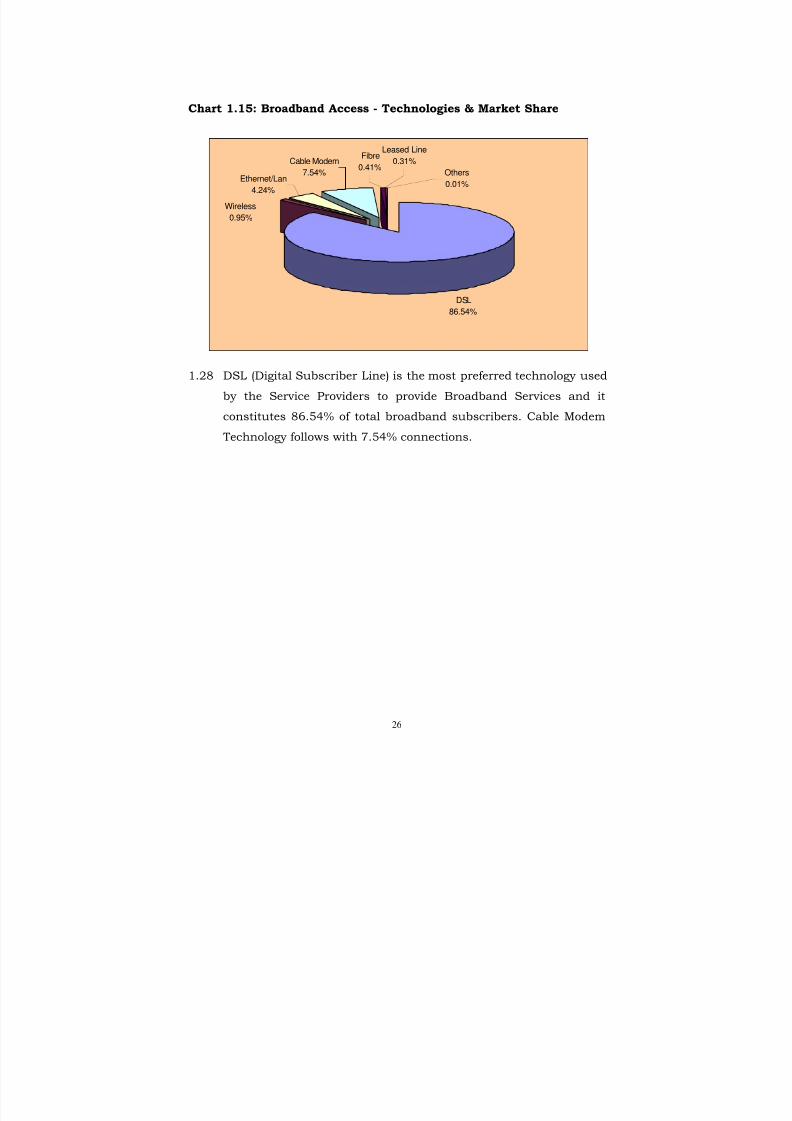
Chart 1.15: Broadband Access - Technologies & Market Share
DSL
86.54%
Fibre
0.41%
Wireless
0.95%
Leased Line
0.31%
Others
0.01%
Cable Modem
7.54%Ethernet/Lan
4.24%
1.28 DSL (Digital Subscriber Line) is the most preferred technology used
by the Service Providers to provide Broadband Services and it
constitutes 86.54% of total broadband subscribers. Cable Modem
Technology follows with 7.54% connections.
8/9/2019 Indicator Report Apr 10
http://slidepdf.com/reader/full/indicator-report-apr-10 41/150
27
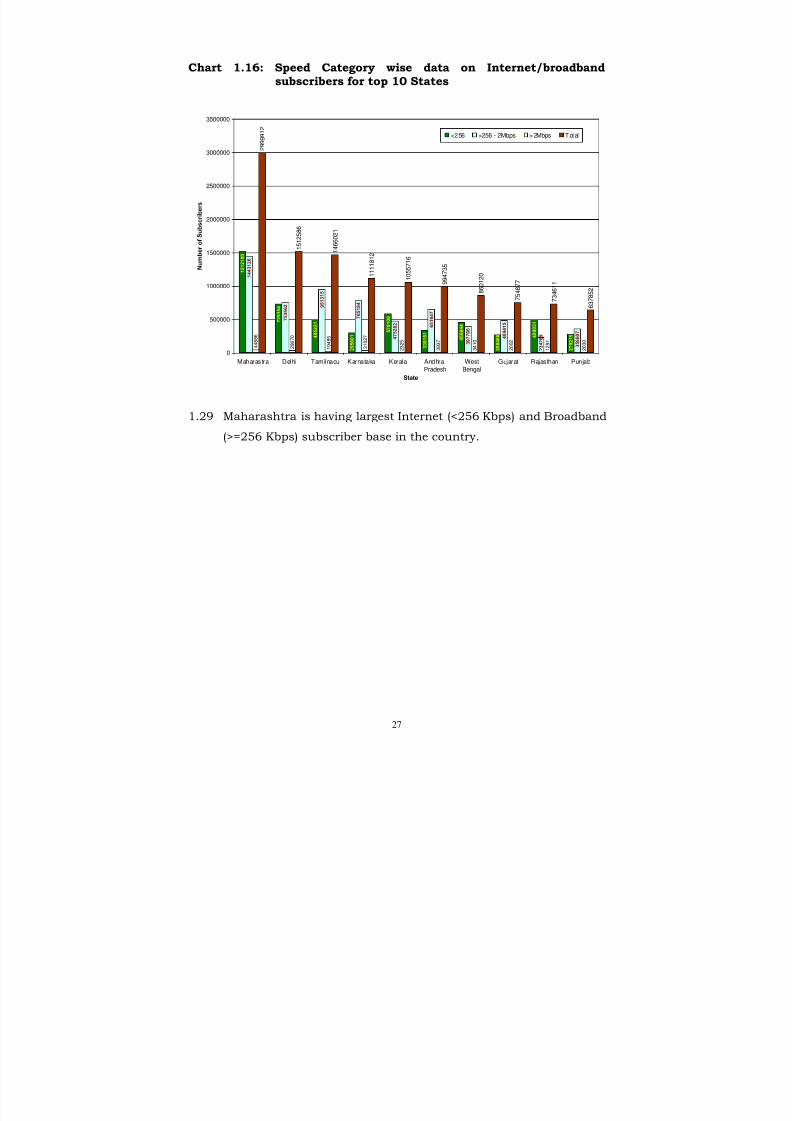
Chart 1.16: Speed Category wise data on Internet/broadbandsubscribers for top 10 States
7 2 9 3 5 4
4 9 5 2 2 1
2 9 5 6 0 1
5 7 8 1 0 9
3 3 9 1 5 1
4 5 8 9 4 4
2 6 8 4 6 0 4
9 9 0 3 1
2 7 9 2 1 5
7 5 3 5 6 2 9
5 1 3 1 5
7 8 5 1 8 4
4 7 5 2 8 2 6
5 1 6 4 7
3 9 7 7 6 6
4 8 4 4 1 5
2 3 4 2 8 9
3 5 6 6 0 7
4 4 6 8 6
2 9 6 7 0
1 9 4 8 5
3 1 0 2 7
2 3 2 5
3 9 3 7
3 4 1 0
2 0 0 2
1 2 9 1
2 0 3 0
2 9 9 9 9 1 2
1 5 1 2 5 8 6
1 4 6 6 0 2 1
1 1 1 1 8 1 2
1 0 5 5 7 1 6
9 9 4 7 3 5
8 6 0 1 2 0
7 5
4 8 7 7
7 3 4 6 1 1
6 3 7 8 5 2
1 5 1 2 1 0 0
1 4 4 3 1 2 6
0
500000
1000000
1500000
2000000
2500000
3000000
3500000
Maharastra Delhi Tamilnadu Karnataka Kerala Andhra
Pradesh
West
Bengal
Gujarat Rajasthan Punjab
State
N u m b e r o f S u b s c r i b e r s
<256 >256 - 2Mbps >2Mbps Total
1.29 Maharashtra is having largest Internet (<256 Kbps) and Broadband
(>=256 Kbps) subscriber base in the country.
8/9/2019 Indicator Report Apr 10
http://slidepdf.com/reader/full/indicator-report-apr-10 42/150
28
Chart 1.17: Growth of wireless subscribers capable of Accessing Dataservices/Internet
149.03
127.04126.97117.82
101.1
0
40
80
120
160
Dec-08 Mar-09 Jun-09 Sep-09 Dec-09
Quarter ending
N u m b e r o f s u b s c r i b e r s ( i
n
m i l l i o n )
Note: The above chart depicts the number of subscribers who have subscribed to Data Services
Table 1.22: Service Provider wise details of Data Services
S.No. Subscriber Base of Data Services
ServiceProvider
Data Subscribers as on 31stDecember 2009 (in
millions)
1 Aircel 2.19
2 Bharti 66.993 Loop 2.18
4 BSNL 35.08
5 HFCL 0.00
6 Vodafone 27.75
7 Idea 10.54
8 MTNL 1.10
9 RCL 0.89
10 RTL 0.00
11 Sistema 0.01
12 Spice 1.06
13 Tata 1.2314 S Tel 0.00
15 Unitech 0.00
Total 149.03
8/9/2019 Indicator Report Apr 10
http://slidepdf.com/reader/full/indicator-report-apr-10 43/150
29
Section E: Other Value Added Services – PMRTS & VSAT
Public Mobile Radio Trunk Services (PMRTS)
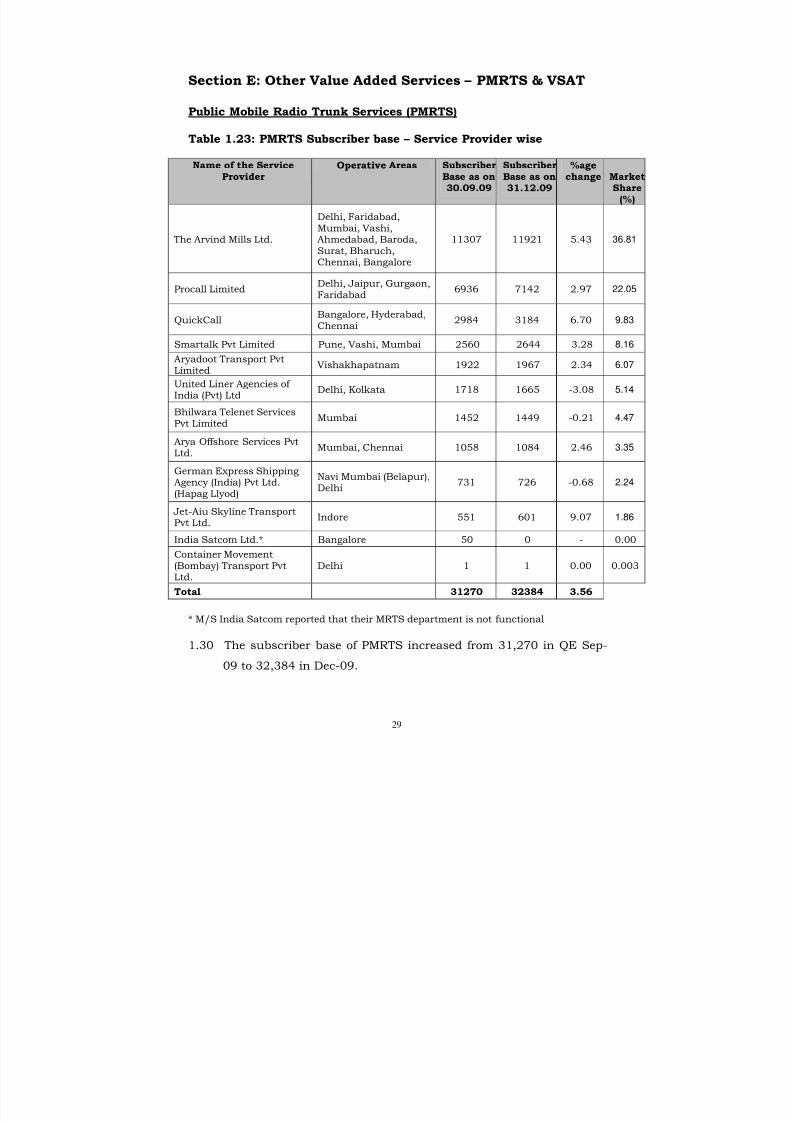
Table 1.23: PMRTS Subscriber base – Service Provider wise
Name of the ServiceProvider
Operative Areas SubscriberBase as on30.09.09
SubscriberBase as on31.12.09
%agechange Market
Share(%)
The Arvind Mills Ltd.
Delhi, Faridabad,Mumbai, Vashi,Ahmedabad, Baroda,Surat, Bharuch,Chennai, Bangalore
11307 11921 5.43 36.81
Procall LimitedDelhi, Jaipur, Gurgaon,
Faridabad6936 7142 2.97 22.05
QuickCallBangalore, Hyderabad,Chennai
2984 3184 6.70 9.83
Smartalk Pvt Limited Pune, Vashi, Mumbai 2560 2644 3.28 8.16
Aryadoot Transport PvtLimited
Vishakhapatnam 1922 1967 2.34 6.07
United Liner Agencies of India (Pvt) Ltd
Delhi, Kolkata 1718 1665 -3.08 5.14
Bhilwara Telenet ServicesPvt Limited
Mumbai 1452 1449 -0.21 4.47
Arya Offshore Services PvtLtd.
Mumbai, Chennai 1058 1084 2.46 3.35
German Express ShippingAgency (India) Pvt Ltd.(Hapag Llyod)
Navi Mumbai (Belapur),Delhi
731 726 -0.68 2.24
Jet-Aiu Skyline TransportPvt Ltd.
Indore 551 601 9.07 1.86
India Satcom Ltd.* Bangalore 50 0 - 0.00
Container Movement(Bombay) Transport PvtLtd.
Delhi 1 1 0.00 0.003
Total 31270 32384 3.56
* M/S India Satcom reported that their MRTS department is not functional
1.30 The subscriber base of PMRTS increased from 31,270 in QE Sep-
09 to 32,384 in Dec-09.
8/9/2019 Indicator Report Apr 10
http://slidepdf.com/reader/full/indicator-report-apr-10 44/150
8/9/2019 Indicator Report Apr 10
http://slidepdf.com/reader/full/indicator-report-apr-10 45/150
31
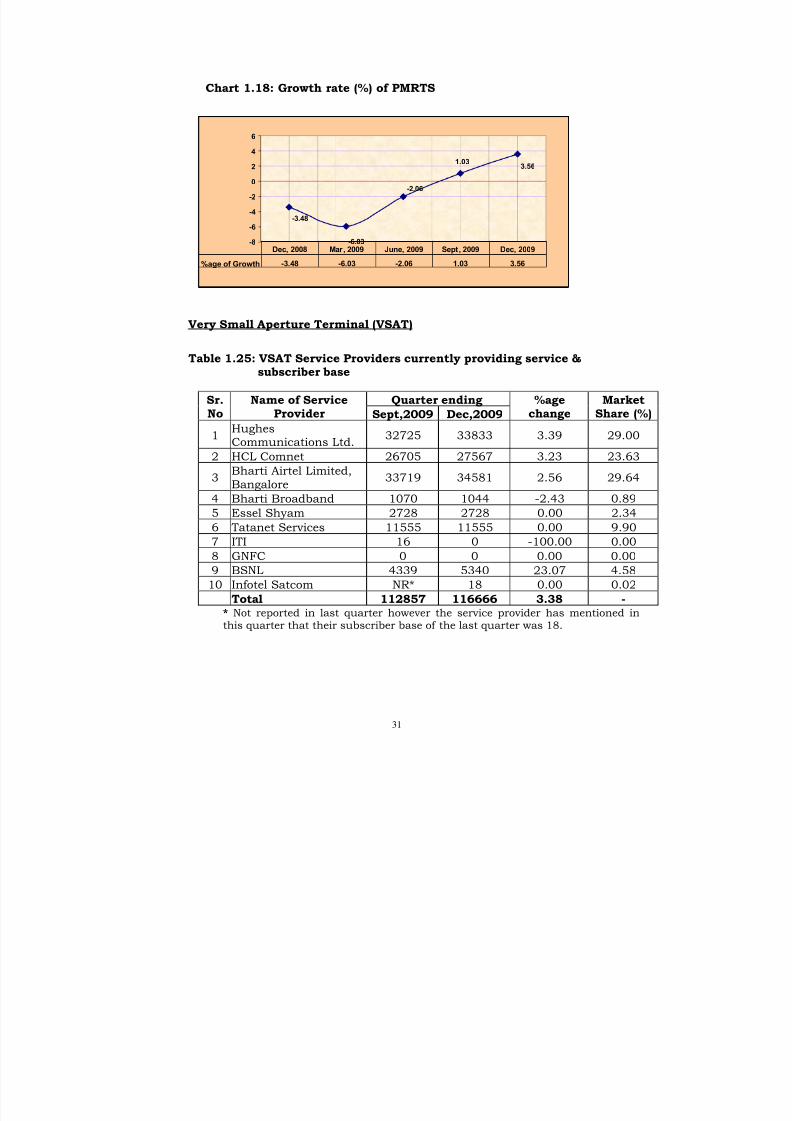
Chart 1.18: Growth rate (%) of PMRTS
-6.03
-2.06
1.033.56
-3.48
-8
-6
-4
-2
0
2
4
6
%age of Growth -3.48 -6.03 -2.06 1.03 3.56
Dec, 2008 Mar, 2009 June, 2009 Sept, 2009 Dec, 2009
Very Small Aperture Terminal (VSAT)
Table 1.25: VSAT Service Providers currently providing service &subscriber base
Quarter endingSr.No
Name of ServiceProvider Sept,2009 Dec,2009
%agechange
MarketShare (%)
1Hughes
Communications Ltd.32725 33833 3.39 29.00
2 HCL Comnet 26705 27567 3.23 23.63
3Bharti Airtel Limited,Bangalore
33719 34581 2.56 29.64
4 Bharti Broadband 1070 1044 -2.43 0.89
5 Essel Shyam 2728 2728 0.00 2.34
6 Tatanet Services 11555 11555 0.00 9.90
7 ITI 16 0 -100.00 0.00
8 GNFC 0 0 0.00 0.00
9 BSNL 4339 5340 23.07 4.58
10 Infotel Satcom NR* 18 0.00 0.02Total 112857 116666 3.38 -* Not reported in last quarter however the service provider has mentioned inthis quarter that their subscriber base of the last quarter was 18.
8/9/2019 Indicator Report Apr 10
http://slidepdf.com/reader/full/indicator-report-apr-10 46/150
32
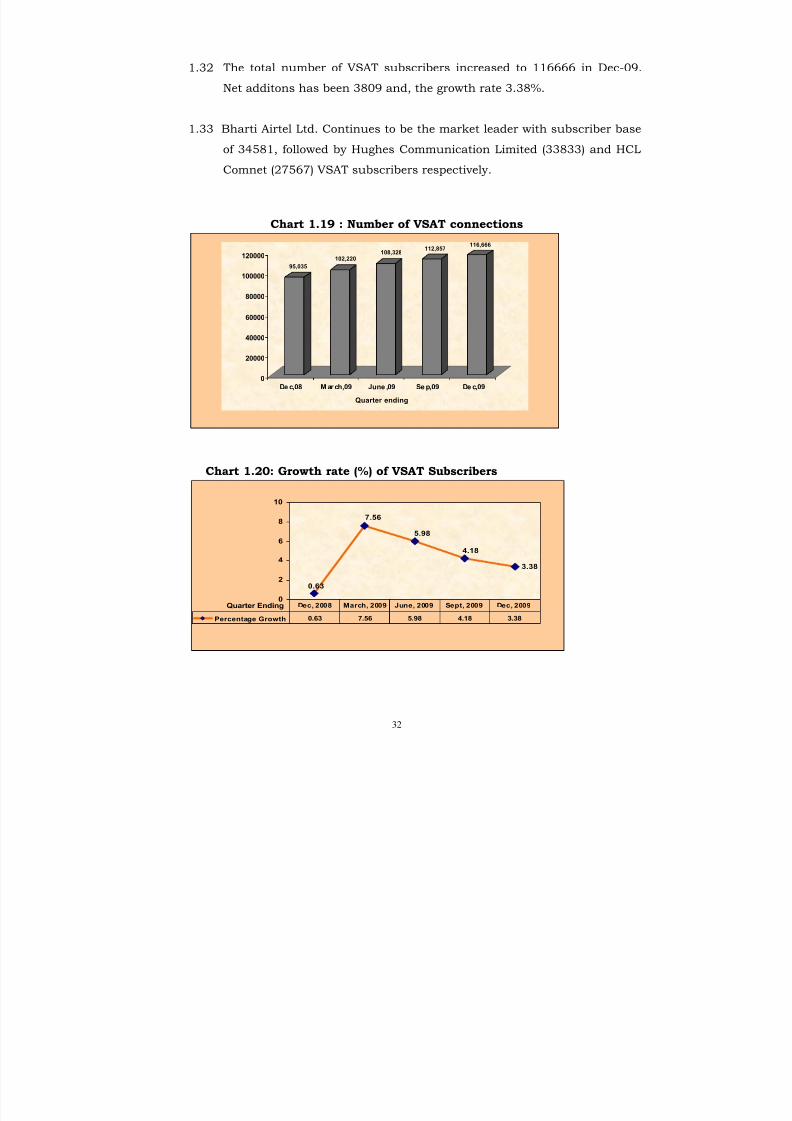
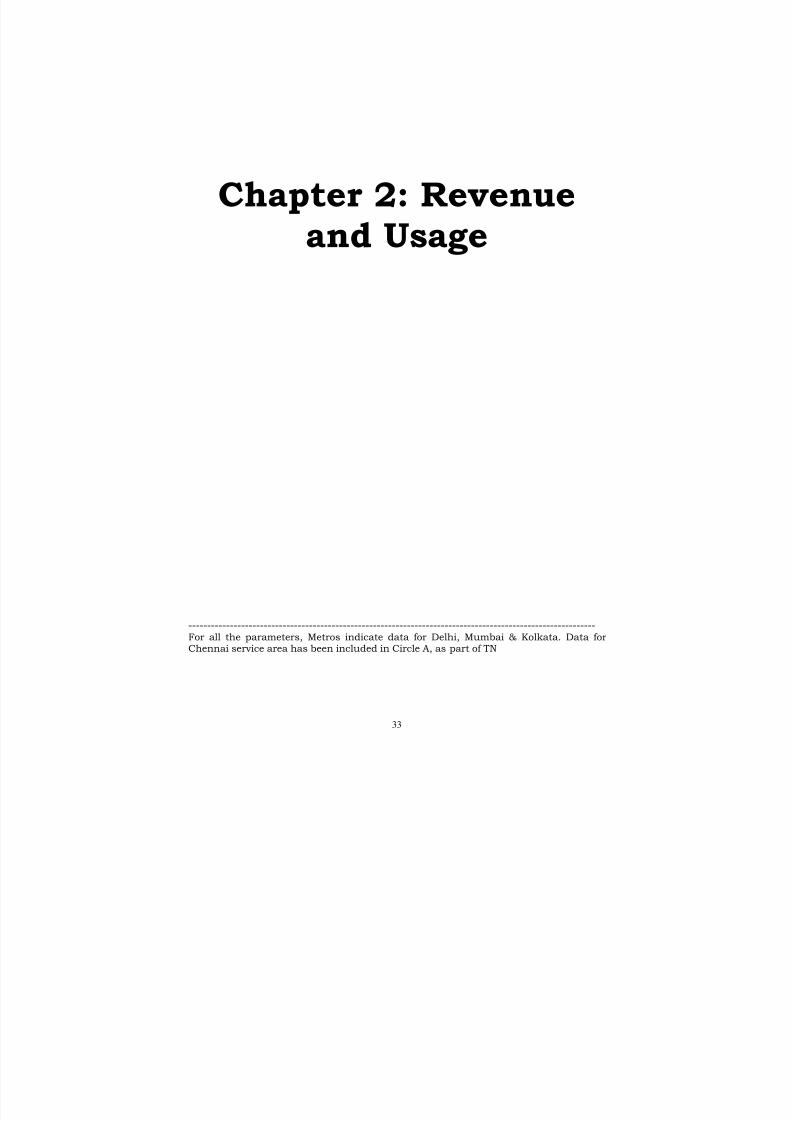
1.32 The total number of VSAT subscribers increased to 116666 in Dec-09.
Net additons has been 3809 and, the growth rate 3.38%.
1.33 Bharti Airtel Ltd. Continues to be the market leader with subscriber base
of 34581, followed by Hughes Communication Limited (33833) and HCL
Comnet (27567) VSAT subscribers respectively.
Chart 1.19 : Number of VSAT connections
95,035
102,220108,328
112,857116,666
0
20000
40000
60000
80000
100000
120000
De c,08 M ar ch,09 June ,09 Se p,09 De c,09
Quarter ending
Chart 1.20: Growth rate (%) of VSAT Subscribers
3.38
4.18
5.98
7.56
0.63
0
2
4
6
8
10
Quarter Ending
Percentage Growth 0.63 7.56 5.98 4.18 3.38
Dec, 2008 March, 2009 June, 2009 Sept, 2009 Dec, 2009
8/9/2019 Indicator Report Apr 10
http://slidepdf.com/reader/full/indicator-report-apr-10 47/150
33
Chapter 2: Revenueand Usage
------------------------------------------------------------------------------------------------------------For all the parameters, Metros indicate data for Delhi, Mumbai & Kolkata. Data forChennai service area has been included in Circle A, as part of TN
8/9/2019 Indicator Report Apr 10
http://slidepdf.com/reader/full/indicator-report-apr-10 48/150
34
Section A: GSM – Full Mobility Service
Table 2.1: Key Indicators
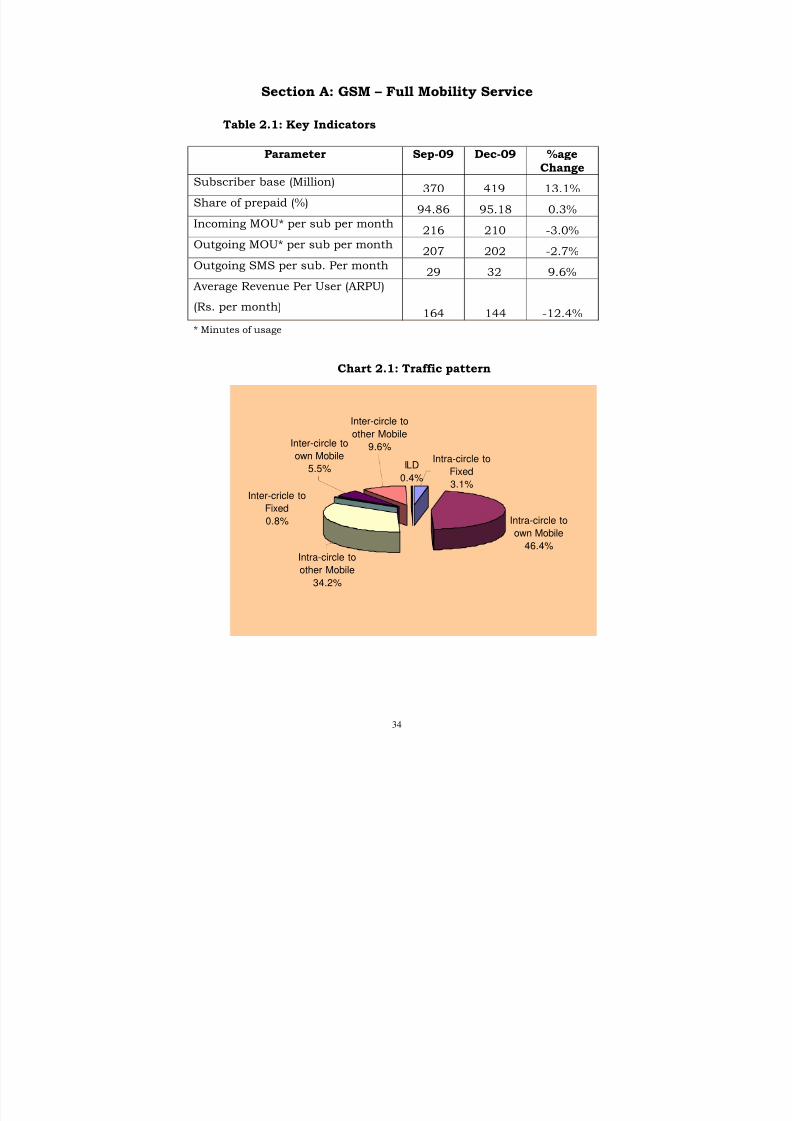
Parameter Sep-09 Dec-09 %ageChange
Subscriber base (Million)370 419 13.1%
Share of prepaid (%)94.86 95.18 0.3%
Incoming MOU* per sub per month216 210 -3.0%
Outgoing MOU* per sub per month207 202 -2.7%
Outgoing SMS per sub. Per month29 32 9.6%
Average Revenue Per User (ARPU)
(Rs. per month)164 144 -12.4%
* Minutes of usage
Chart 2.1: Traffic pattern
Intra-circle to
own Mobile
46.4%
ILD
0.4%
Inter-circle to
other Mobile
9.6%
Inter-cricle to
Fixed
0.8%
Intra-circle to
other Mobile
34.2%
Intra-circle to
Fixed
3.1%
Inter-circle toown Mobile
5.5%
8/9/2019 Indicator Report Apr 10
http://slidepdf.com/reader/full/indicator-report-apr-10 49/150
35
Chart 2.2: Proportion of prepaid subscribers
9 4 . 1 6 %
9 4 . 7 5 %
9 7 . 0 5 %
9 7 . 4 2 % 9 7
. 5 3 %
9 5 . 9 2 %
8 6 . 6 7 %
8 8 . 0 2 %
9 4 . 8 6 %
9 5 . 1 8 %
60%
65%
70%
75%
80%
85%
90%
95%
100%
Circle A Circle B Circle C Metros All India
Sep-09 Dec-09
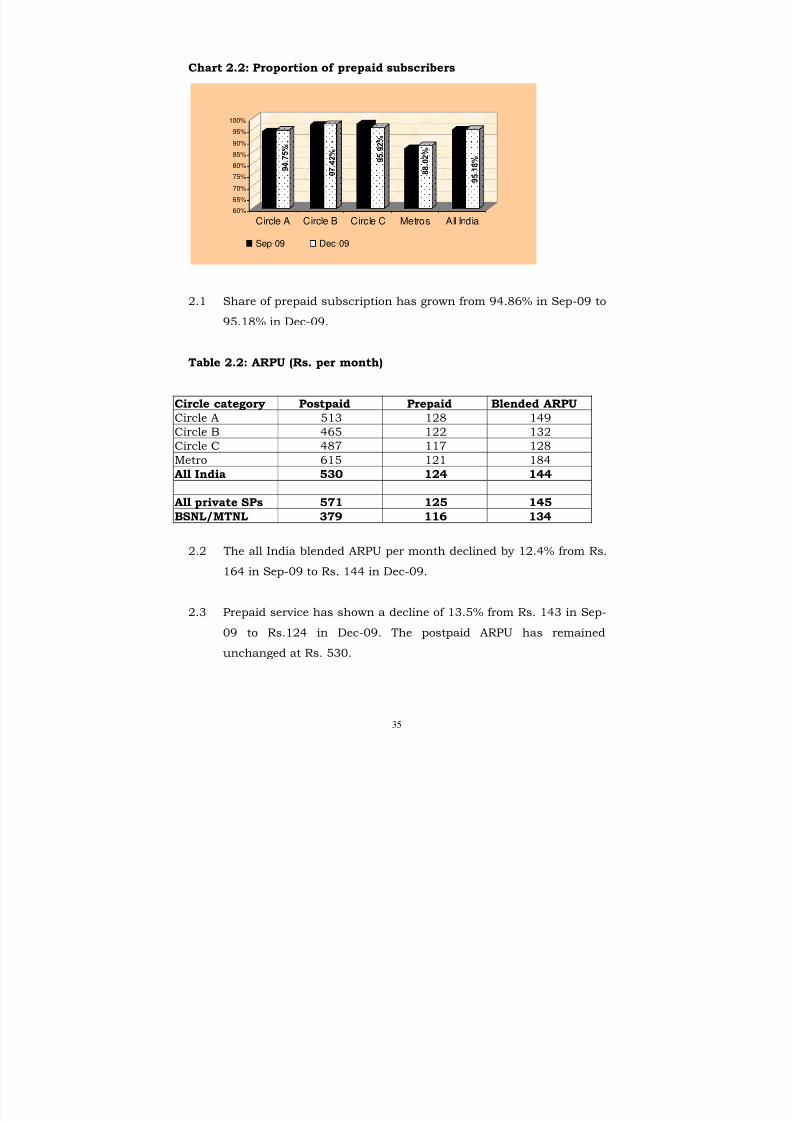
2.1 Share of prepaid subscription has grown from 94.86% in Sep-09 to
95.18% in Dec-09.
Table 2.2: ARPU (Rs. per month)
Circle category Postpaid Prepaid Blended ARPU
Circle A 513 128 149
Circle B 465 122 132
Circle C 487 117 128Metro 615 121 184
All India 530 124 144
All private SPs 571 125 145
BSNL/MTNL 379 116 134
2.2 The all India blended ARPU per month declined by 12.4% from Rs.
164 in Sep-09 to Rs. 144 in Dec-09.
2.3 Prepaid service has shown a decline of 13.5% from Rs. 143 in Sep-
09 to Rs.124 in Dec-09. The postpaid ARPU has remained
unchanged at Rs. 530.
8/9/2019 Indicator Report Apr 10
http://slidepdf.com/reader/full/indicator-report-apr-10 50/150
36
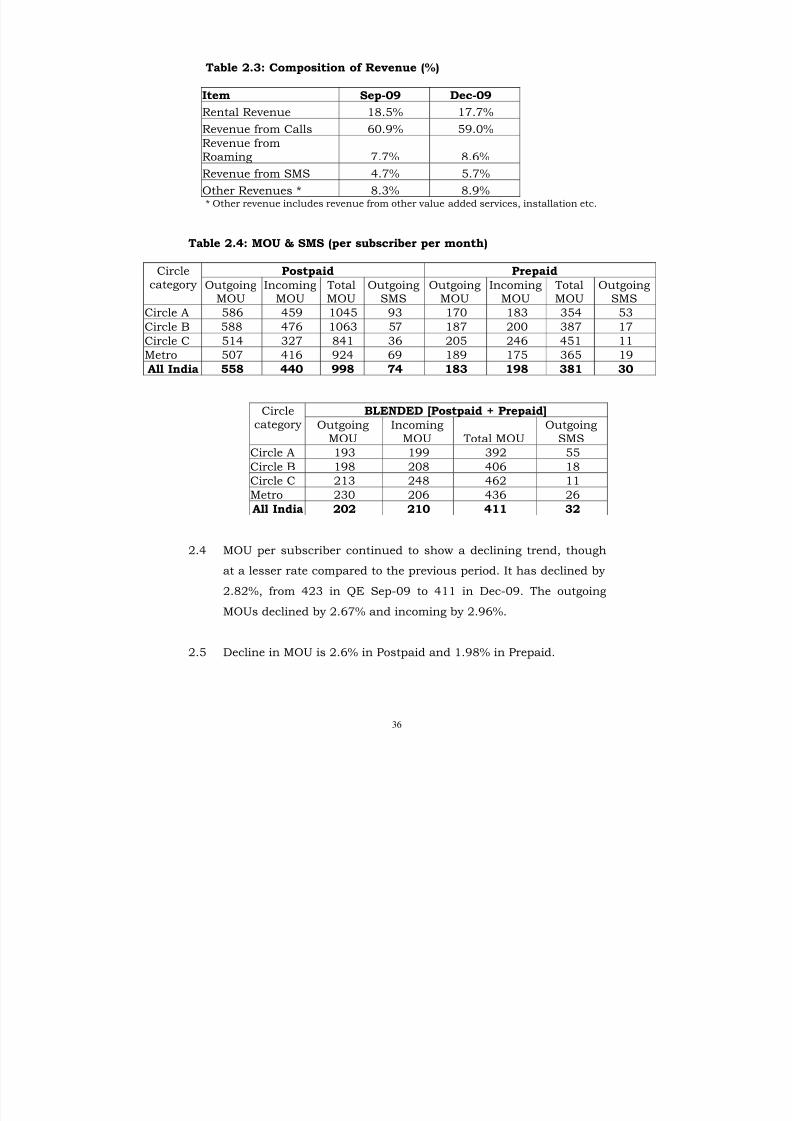
Table 2.3: Composition of Revenue (%)
Item Sep-09 Dec-09
Rental Revenue 18.5% 17.7%
Revenue from Calls 60.9% 59.0%
Revenue fromRoaming 7.7% 8.6%
Revenue from SMS 4.7% 5.7%
Other Revenues * 8.3% 8.9%* Other revenue includes revenue from other value added services, installation etc.
Table 2.4: MOU & SMS (per subscriber per month)
Postpaid PrepaidCirclecategory Outgoing
MOU
Incoming
MOU
Total
MOU
Outgoing
SMS
Outgoing
MOU
Incoming
MOU
Total
MOU
Outgoing
SMSCircle A 586 459 1045 93 170 183 354 53
Circle B 588 476 1063 57 187 200 387 17
Circle C 514 327 841 36 205 246 451 11
Metro 507 416 924 69 189 175 365 19
All India 558 440 998 74 183 198 381 30
BLENDED [Postpaid + Prepaid] Circlecategory Outgoing
MOU
Incoming
MOU Total MOU
Outgoing
SMSCircle A 193 199 392 55
Circle B 198 208 406 18
Circle C 213 248 462 11
Metro 230 206 436 26
All India 202 210 411 32
2.4 MOU per subscriber continued to show a declining trend, though
at a lesser rate compared to the previous period. It has declined by
2.82%, from 423 in QE Sep-09 to 411 in Dec-09. The outgoing
MOUs declined by 2.67% and incoming by 2.96%.
2.5 Decline in MOU is 2.6% in Postpaid and 1.98% in Prepaid.
8/9/2019 Indicator Report Apr 10
http://slidepdf.com/reader/full/indicator-report-apr-10 51/150
37
2.6 The overall ratio of incoming-outgoing MOUs remained unchanged
at 51:49.
2.7 Outgoing SMS per subscriber increased from 29 in Sep-09 to 32 in
Dec-09.
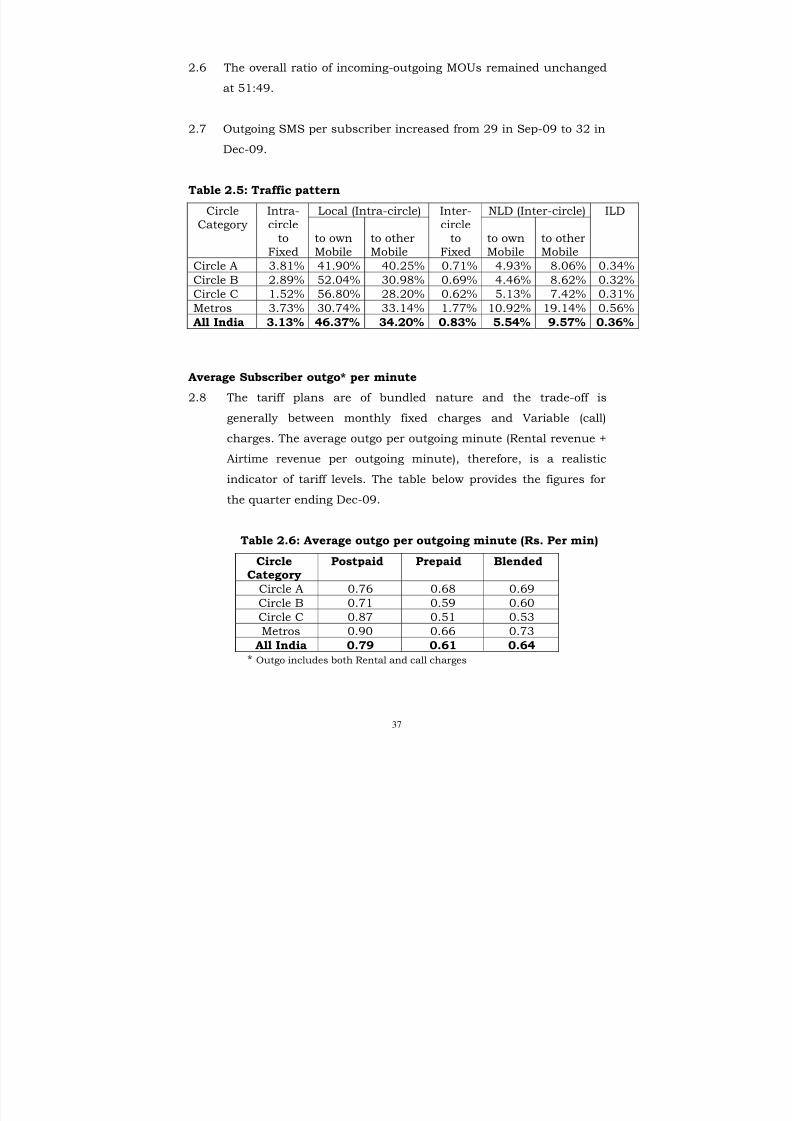
Table 2.5: Traffic pattern
Local (Intra-circle) NLD (Inter-circle)CircleCategory
Intra-circle
toFixed
to ownMobile
to otherMobile
Inter-circle
toFixed
to ownMobile
to otherMobile
ILD
Circle A 3.81% 41.90% 40.25% 0.71% 4.93% 8.06% 0.34%
Circle B 2.89% 52.04% 30.98% 0.69% 4.46% 8.62% 0.32%
Circle C 1.52% 56.80% 28.20% 0.62% 5.13% 7.42% 0.31%Metros 3.73% 30.74% 33.14% 1.77% 10.92% 19.14% 0.56%
All India 3.13% 46.37% 34.20% 0.83% 5.54% 9.57% 0.36%
Average Subscriber outgo* per minute
2.8 The tariff plans are of bundled nature and the trade-off is
generally between monthly fixed charges and Variable (call)
charges. The average outgo per outgoing minute (Rental revenue +Airtime revenue per outgoing minute), therefore, is a realistic
indicator of tariff levels. The table below provides the figures for
the quarter ending Dec-09.
Table 2.6: Average outgo per outgoing minute (Rs. Per min)
CircleCategory
Postpaid Prepaid Blended
Circle A 0.76 0.68 0.69Circle B 0.71 0.59 0.60
Circle C 0.87 0.51 0.53
Metros 0.90 0.66 0.73
All India 0.79 0.61 0.64
* Outgo includes both Rental and call charges
8/9/2019 Indicator Report Apr 10
http://slidepdf.com/reader/full/indicator-report-apr-10 52/150
38
2.9 All India blended average outgo per minute declined from Rs. 0.71
in Sep-09 to Rs. 0.64 in Dec-09 indicating further reduction in
tariff levels.
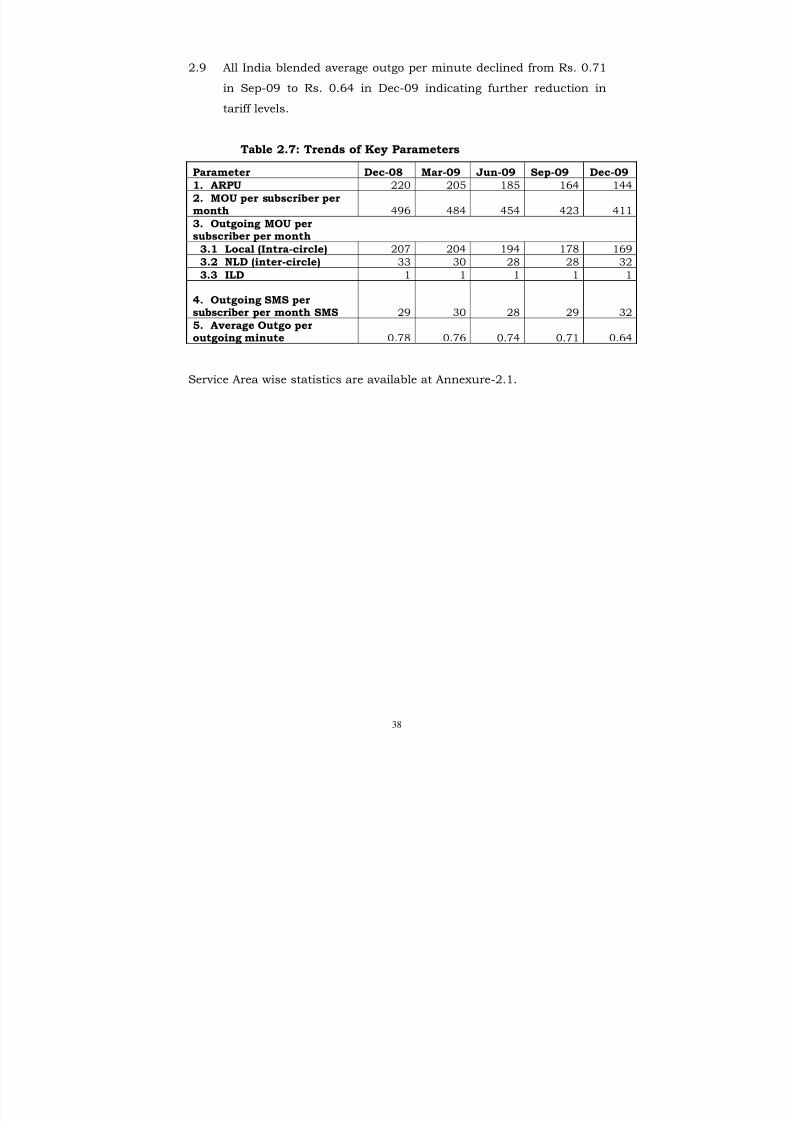
Table 2.7: Trends of Key Parameters
Parameter Dec-08 Mar-09 Jun-09 Sep-09 Dec-09
1. ARPU 220 205 185 164 144
2. MOU per subscriber permonth 496 484 454 423 411
3. Outgoing MOU persubscriber per month
3.1 Local (Intra-circle) 207 204 194 178 169
3.2 NLD (inter-circle) 33 30 28 28 32
3.3 ILD 1 1 1 1 1
4. Outgoing SMS persubscriber per month SMS 29 30 28 29 32
5. Average Outgo peroutgoing minute 0.78 0.76 0.74 0.71 0.64
Service Area wise statistics are available at Annexure-2.1.
8/9/2019 Indicator Report Apr 10
http://slidepdf.com/reader/full/indicator-report-apr-10 53/150
39
Section B: CDMA – Full Mobility Service
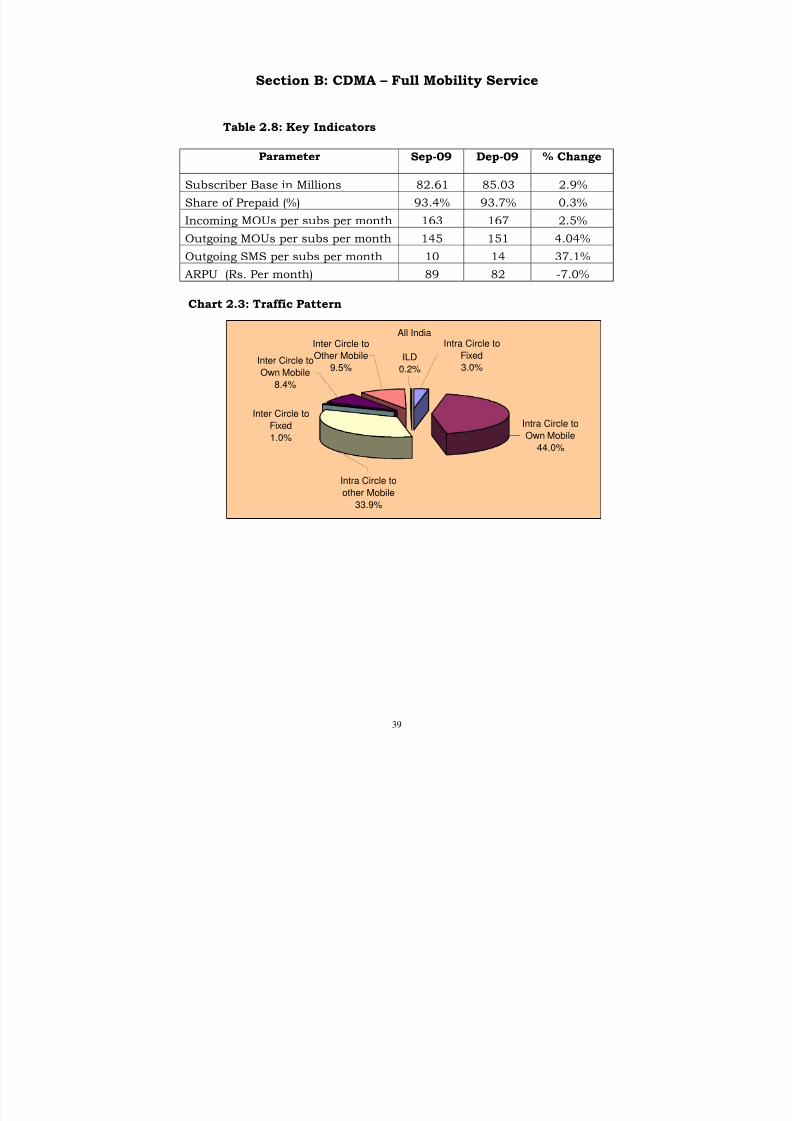
Table 2.8: Key Indicators
Parameter Sep-09 Dep-09 % Change
Subscriber Base in Millions 82.61 85.03 2.9%
Share of Prepaid (%) 93.4% 93.7% 0.3%
Incoming MOUs per subs per month 163 167 2.5%
Outgoing MOUs per subs per month 145 151 4.04%
Outgoing SMS per subs per month 10 14 37.1%
ARPU (Rs. Per month) 89 82 -7.0%
Chart 2.3: Traffic Pattern
All IndiaIntra Circle to
Fixed
3.0%ILD
0.2%
Inter Circle to
Other Mobile
9.5%
Inter Circle to
Fixed
1.0%
Inter Circle to
Own Mobile
8.4%
Intra Circle to
other Mobile
33.9%
Intra Circle to
Own Mobile
44.0%
8/9/2019 Indicator Report Apr 10
http://slidepdf.com/reader/full/indicator-report-apr-10 54/150
40
Chart 2.4: Proportion of prepaid subscribers
9 2 . 7
% 9 3 . 0
% 9 5 . 4
% 9 5 . 7 %
9 6 . 1
%
9 5 . 9
%
8 9 . 6
% 9 0 . 2
%
9 3 . 4
%
9 3 . 7
%
86.0%
87.0%
88.0%
89.0%
90.0%
91.0%
92.0%
93.0%
94.0%
95.0%
96.0%
97.0%
Circle A Circle B Circle C Metro All India
Sep-09 Dec-09
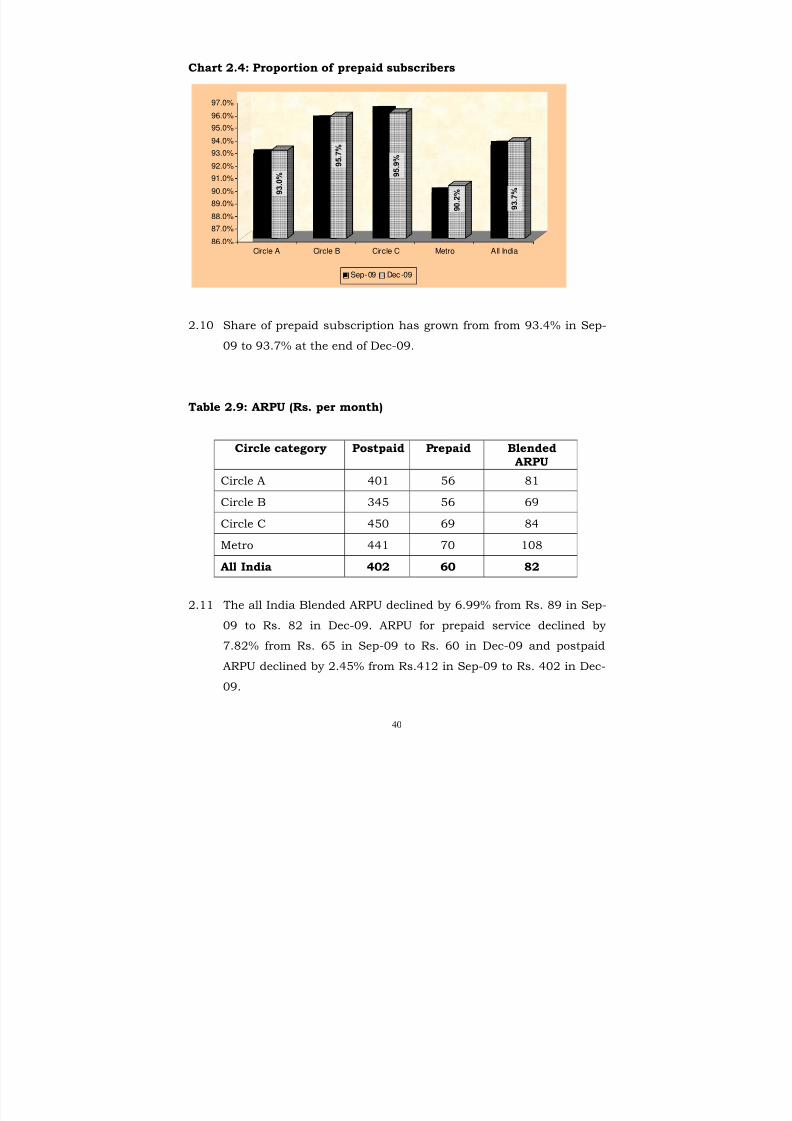
2.10 Share of prepaid subscription has grown from from 93.4% in Sep-
09 to 93.7% at the end of Dec-09.
Table 2.9: ARPU (Rs. per month)
Circle category Postpaid Prepaid BlendedARPU
Circle A 401 56 81
Circle B 345 56 69
Circle C 450 69 84
Metro 441 70 108
All India 402 60 82
2.11 The all India Blended ARPU declined by 6.99% from Rs. 89 in Sep-
09 to Rs. 82 in Dec-09. ARPU for prepaid service declined by
7.82% from Rs. 65 in Sep-09 to Rs. 60 in Dec-09 and postpaid
ARPU declined by 2.45% from Rs.412 in Sep-09 to Rs. 402 in Dec-
09.
8/9/2019 Indicator Report Apr 10
http://slidepdf.com/reader/full/indicator-report-apr-10 55/150
41
Table 2.10: Composition of Revenue (%)
Item Sep-09 Dec-09
Rental Revenue 26.6% 27.6%
Revenue from Calls 56.0% 56.1%
Revenue from Roaming 1.9% 1.5%
Revenue from SMS 5.1% 5.6%
Other Revenues * 10.4% 9.1%
* Other revenue includes revenue from other value added services, installation etc.
Table 2.11: MOU & SMS (per subscriber per month)
Postpaid PrepaidCirclecategory
OutgoingMOU
IncomingMOU
TotalMOU
OutgoingSMS
OutgoingMOU
IncomingMOU
TotalMOU
OutgoingSMS
Circle A 525 340 865 22 101 134 235 14
Circle B 609 351 960 23 126 152 279 8
Circle C 790 346 1136 8 165 222 387 5
Metro 500 346 846 51 134 166 300 22
All India 552 345 897 31 123 155 278 13
Blended (postpaid + prepaid)Circlecategory
OutgoingMOU
IncomingMOU
Total MOU OutgoingSMS
Circle A 132 149 281 15
Circle B 148 161 309 9
Circle C 189 227 416 5
Metro 171 184 356 25
All India 151 167 318 14
8/9/2019 Indicator Report Apr 10
http://slidepdf.com/reader/full/indicator-report-apr-10 56/150
42
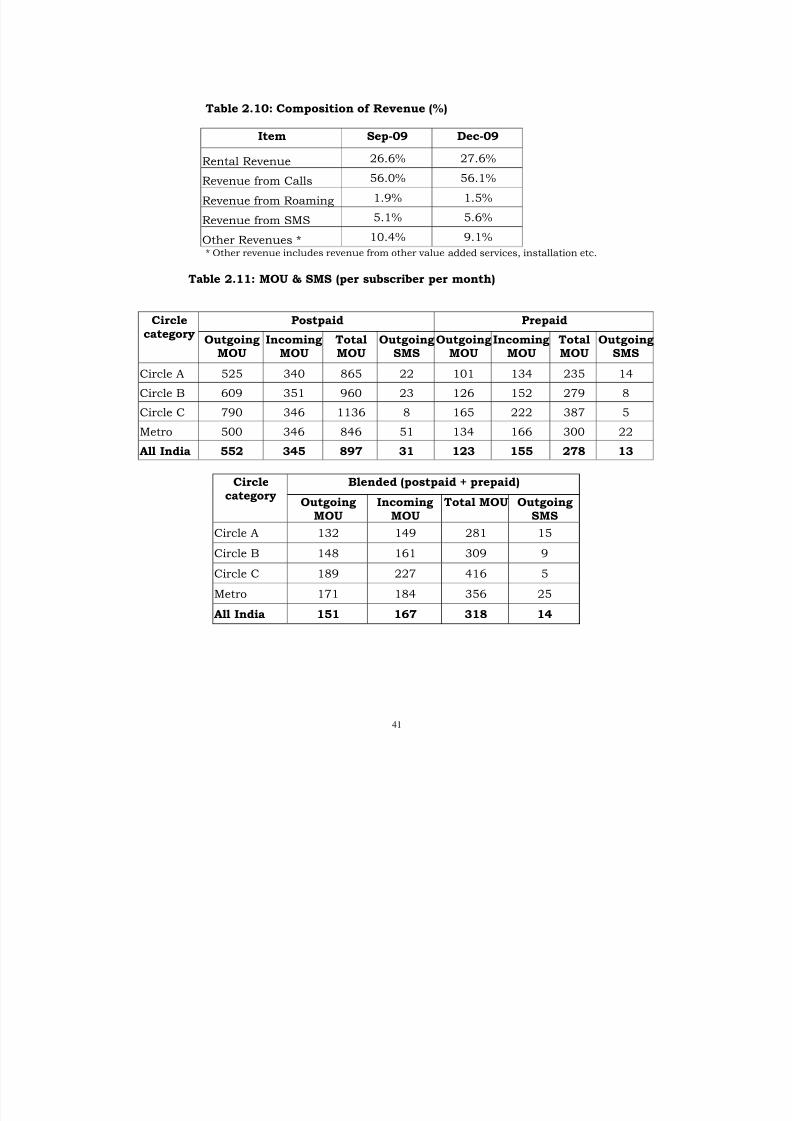
2.12 The total MOU per subscriber per month increased by 3.23%, from
308 in Q.E Sep-09 to 318 in Q.E Dec-09. The outgoing MOUs
increased by 4.04% and the incoming MOUs by 2.50%.
2.13 Prepaid MOUs increased by 4.37% and postpaid MOUs by 0.80%.
2.14 SMS usage increased from 10 in Sep-09 to 14 in Dec-09.
Table 2.12: Traffic Pattern
Local (Intra-circle) NLD (Inter-circle)CircleCategory
Intra-circle
toFixed
to ownMobile
to otherMobile
Inter-circle
toFixed
to ownMobile
to otherMobile
ILD
Circle A 4.0% 38.2% 42.4% 0.9% 7.2% 7.1% 0.2%
Circle B 2.3% 48.9% 32.1% 0.8% 7.6% 8.0% 0.2%
Circle C 1.1% 48.7% 34.2% 1.1% 8.0% 6.9% 0.0%
Metros 3.8% 41.6% 25.9% 1.3% 10.9% 16.3% 0.1%
All India 3.0% 44.0% 33.9% 1.0% 8.4% 9.5% 0.2%
Table 2.13: Average outgo per outgoing minute
[Rs. Per min]
Circle
Category
Postpaid Prepaid Blended
Circle A 0.74 0.51 0.58
Circle B 0.58 0.43 0.45
Circle C 0.54 0.39 0.42
Metros 0.84 0.52 0.62
All India 0.71 0.47 0.52
* Outgo includes both Rental and call charges
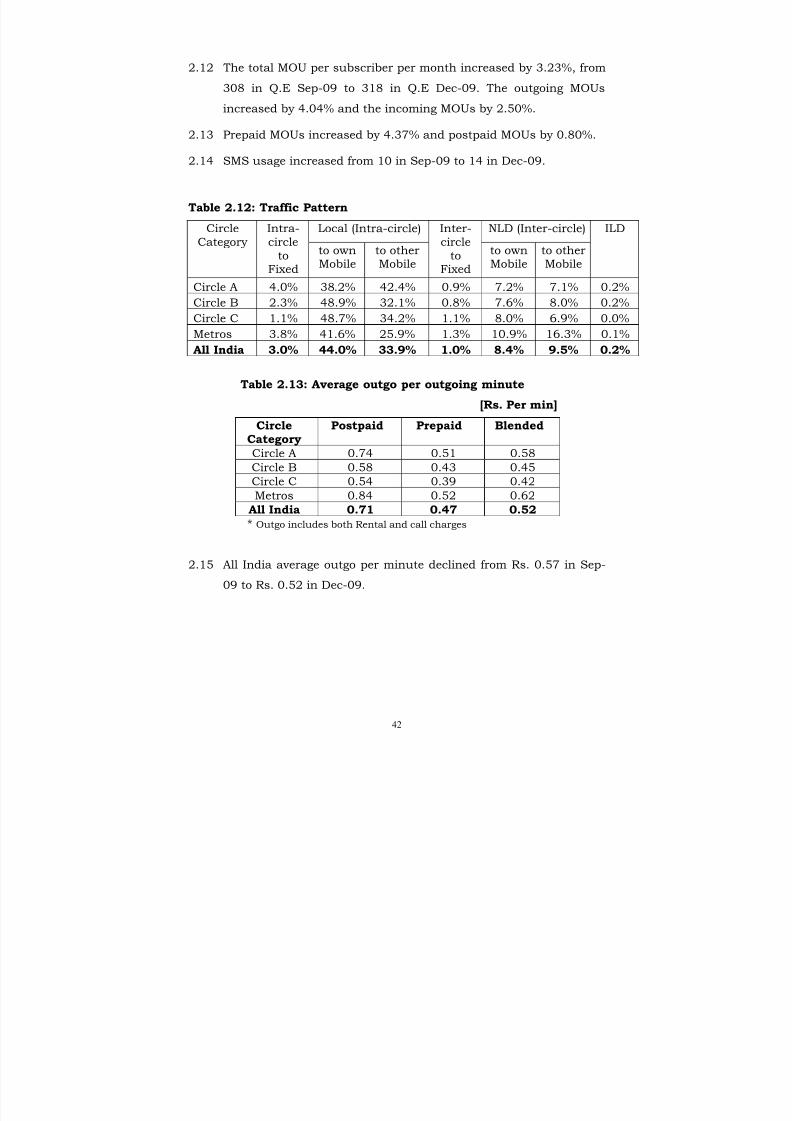
2.15 All India average outgo per minute declined from Rs. 0.57 in Sep-
09 to Rs. 0.52 in Dec-09.
8/9/2019 Indicator Report Apr 10
http://slidepdf.com/reader/full/indicator-report-apr-10 57/150
43
Table 2.14: Trends of Key Parameters
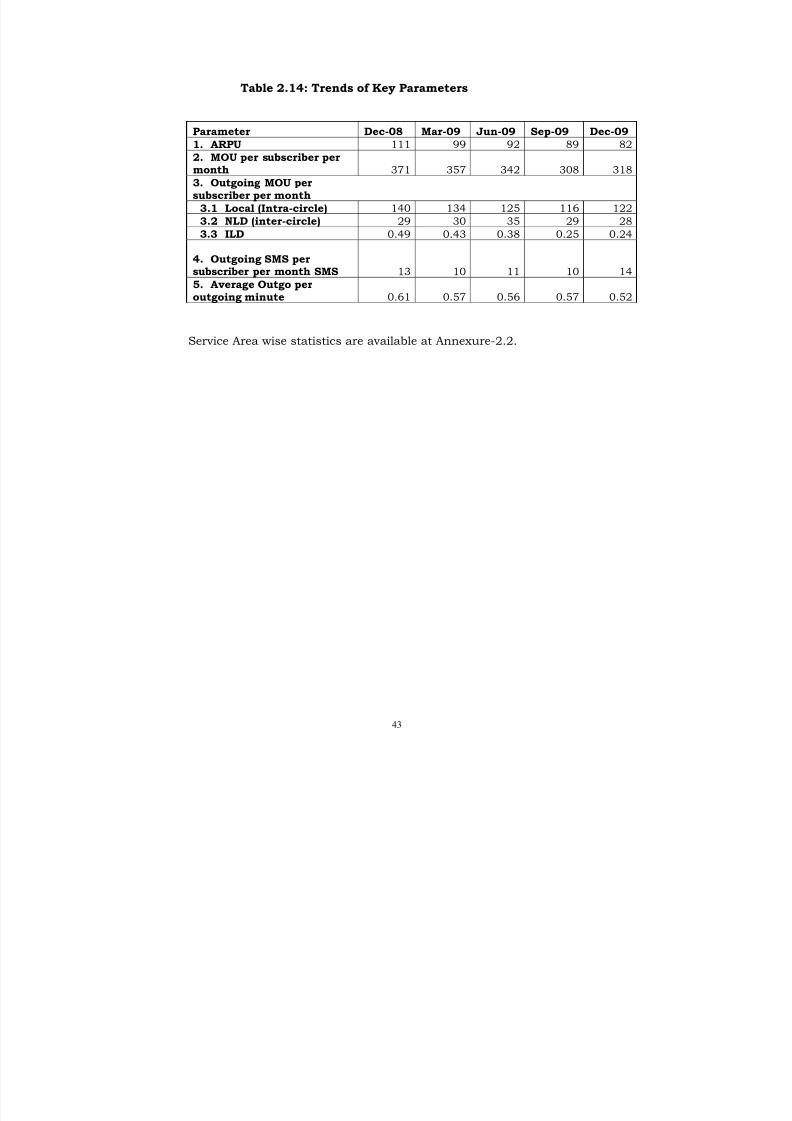
Parameter Dec-08 Mar-09 Jun-09 Sep-09 Dec-09
1. ARPU 111 99 92 89 822. MOU per subscriber permonth 371 357 342 308 318
3. Outgoing MOU persubscriber per month
3.1 Local (Intra-circle) 140 134 125 116 122
3.2 NLD (inter-circle) 29 30 35 29 28
3.3 ILD 0.49 0.43 0.38 0.25 0.24
4. Outgoing SMS persubscriber per month SMS 13 10 11 10 14
5. Average Outgo per
outgoing minute 0.61 0.57 0.56 0.57 0.52
Service Area wise statistics are available at Annexure-2.2.
8/9/2019 Indicator Report Apr 10
http://slidepdf.com/reader/full/indicator-report-apr-10 58/150
44
Section C: Internet Services
Revenue of ISPs
2.16 The total Revenue of the Internet Services as reported by ISPs was
Rs.2154.78 crores for the quarter ending Dec-09 as compared to
Rs. 2109.34 crores in the quarter ending Sep-09, showing an
increase of 2.15%.
Dial up Access
2.17 The average Minutes of Usage (MoU) per subscriber per month
during the day time i.e. between 8 a.m to 8 p.m, increased from
237.06 in QE Sep-09 to 243.96 in QE Dec-09 and during night
time i.e. between 8 p.m to 8 a.m., it has declined from 97.37 to
80.14.
Internet Telephony
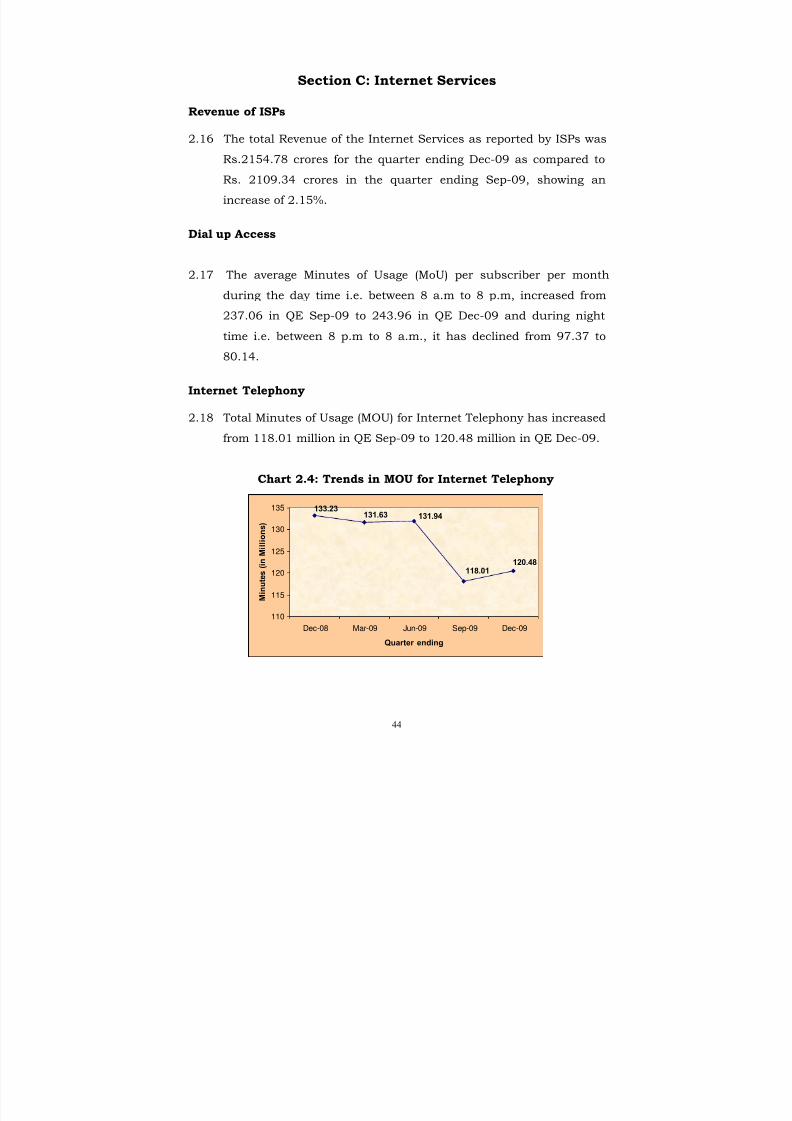
2.18 Total Minutes of Usage (MOU) for Internet Telephony has increased
from 118.01 million in QE Sep-09 to 120.48 million in QE Dec-09.
Chart 2.4: Trends in MOU for Internet Telephony
120.48118.01
131.94131.63133.23
110
115
120
125
130
135
Dec-08 Mar-09 Jun-09 Sep-09 Dec-09
Quarter ending
M i n
u t e s ( i n M i l l i o n s )
8/9/2019 Indicator Report Apr 10
http://slidepdf.com/reader/full/indicator-report-apr-10 59/150
8/9/2019 Indicator Report Apr 10
http://slidepdf.com/reader/full/indicator-report-apr-10 60/150
46
Table 3.1: Gross Revenue (GR), Adjusted Gross Revenue (AGR), License
Fee (LF) & Spectrum Charges
Particulars QE Sep-09
(Rs. in Crore)
QE Dec-09
(Rs. in Crore)
%age Change
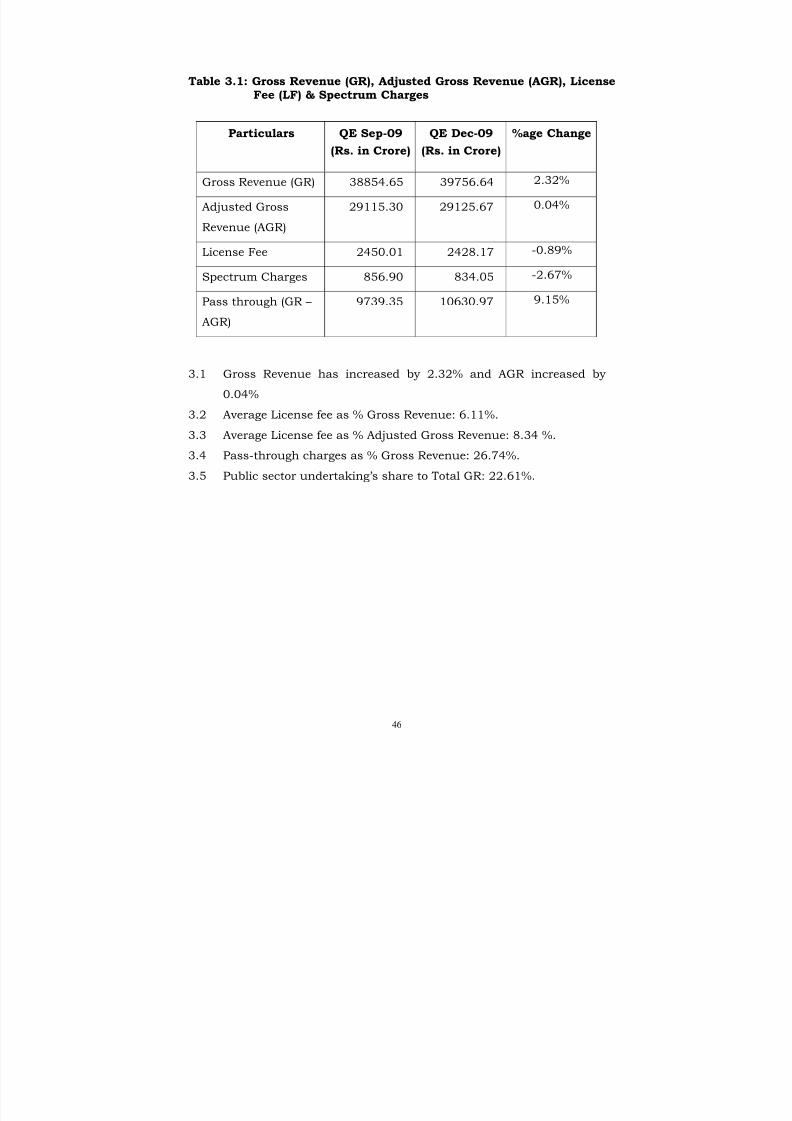
Gross Revenue (GR) 38854.65 39756.64 2.32%
Adjusted Gross
Revenue (AGR)
29115.30 29125.67 0.04%
License Fee 2450.01 2428.17 -0.89%
Spectrum Charges 856.90 834.05 -2.67%
Pass through (GR –
AGR)
9739.35 10630.97 9.15%
3.1 Gross Revenue has increased by 2.32% and AGR increased by
0.04%
3.2 Average License fee as % Gross Revenue: 6.11%.
3.3 Average License fee as % Adjusted Gross Revenue: 8.34 %.
3.4 Pass-through charges as % Gross Revenue: 26.74%.
3.5 Public sector undertaking’s share to Total GR: 22.61%.
8/9/2019 Indicator Report Apr 10
http://slidepdf.com/reader/full/indicator-report-apr-10 61/150
47
Table 3.2: Service-wise Gross Revenue, Adjusted Gross Revenue(AGR), Licence Fee and Spectrum Charges (Rs. in Crore)
QE Dec-09Service GR AGR LF SpectrumCharges
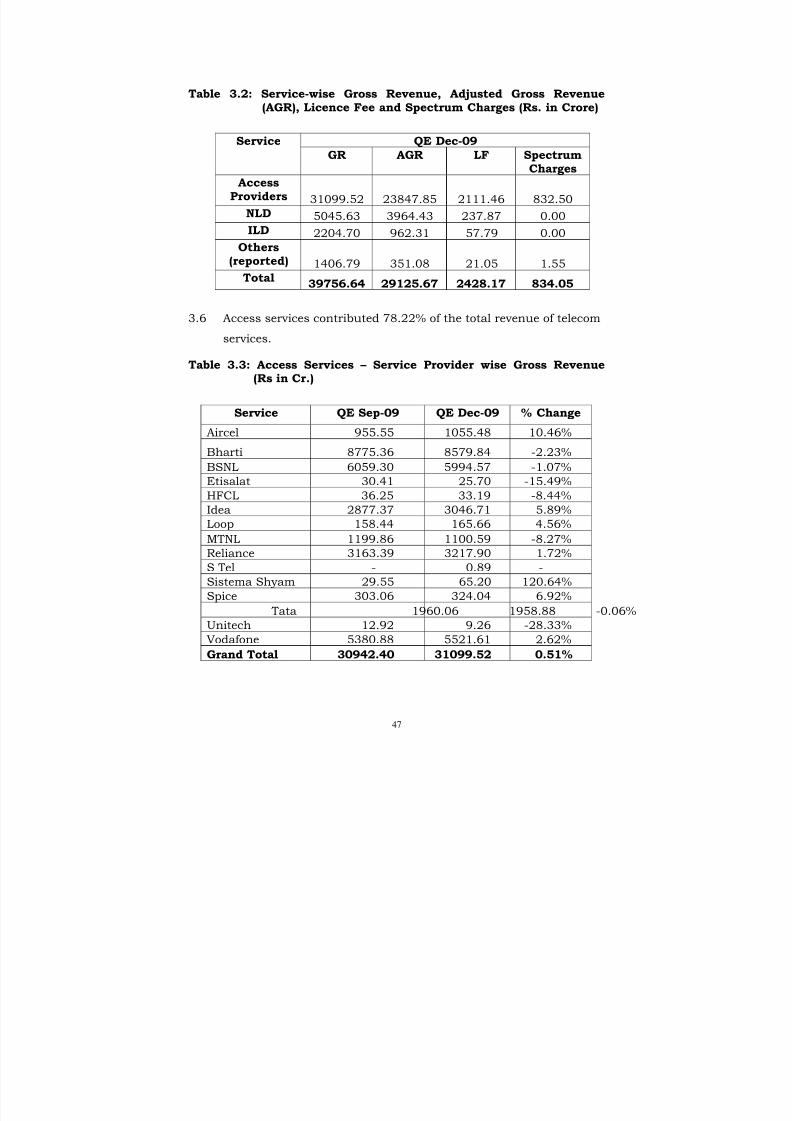
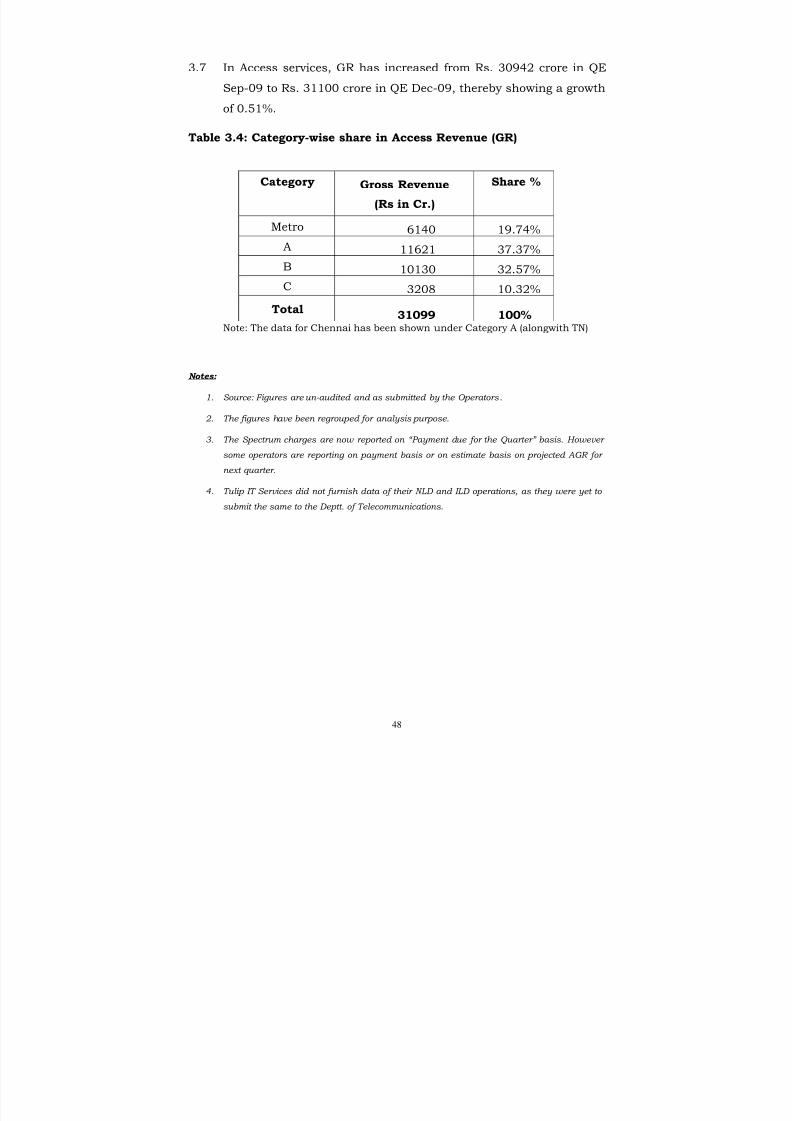
AccessProviders 31099.52 23847.85 2111.46 832.50
NLD 5045.63 3964.43 237.87 0.00
ILD 2204.70 962.31 57.79 0.00
Others(reported) 1406.79 351.08 21.05 1.55
Total39756.64 29125.67 2428.17 834.05
3.6 Access services contributed 78.22% of the total revenue of telecom
services.
Table 3.3: Access Services – Service Provider wise Gross Revenue(Rs in Cr.)
Service QE Sep-09 QE Dec-09 % Change
Aircel 955.55 1055.48 10.46%
Bharti 8775.36 8579.84 -2.23%
BSNL 6059.30 5994.57 -1.07%
Etisalat 30.41 25.70 -15.49%
HFCL 36.25 33.19 -8.44%
Idea 2877.37 3046.71 5.89%
Loop 158.44 165.66 4.56%
MTNL 1199.86 1100.59 -8.27%
Reliance 3163.39 3217.90 1.72%
S Tel - 0.89 -
Sistema Shyam 29.55 65.20 120.64%
Spice 303.06 324.04 6.92%
Tata 1960.06 1958.88 -0.06%
Unitech 12.92 9.26 -28.33%
Vodafone 5380.88 5521.61 2.62%
Grand Total 30942.40 31099.52 0.51%
8/9/2019 Indicator Report Apr 10
http://slidepdf.com/reader/full/indicator-report-apr-10 62/150
8/9/2019 Indicator Report Apr 10
http://slidepdf.com/reader/full/indicator-report-apr-10 63/150
49
Chapter 4: Quality of Service (QoS)
8/9/2019 Indicator Report Apr 10
http://slidepdf.com/reader/full/indicator-report-apr-10 64/150
50
Section A: Quality of Service Performance of WirelessService Providers
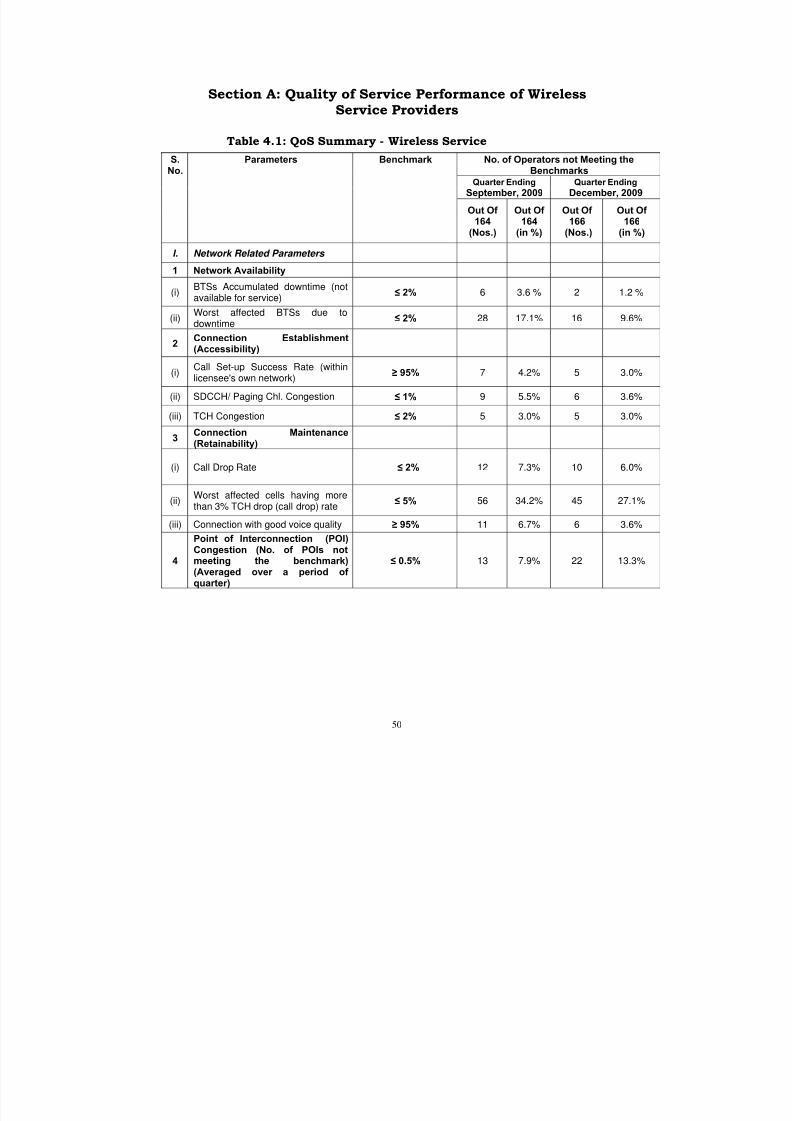
Table 4.1: QoS Summary - Wireless ServiceNo. of Operators not Meeting the
BenchmarksQuarter Ending
September, 2009Quarter Ending
December, 2009
S.No.
Parameters Benchmark
Out Of 164
(Nos.)
Out Of 164
(in %)
Out Of 166
(Nos.)
Out Of 166
(in %)
I. Network Related Parameters
1 Network Availability
(i)
BTSs Accumulated downtime (not
available for service) ≤ 2% 6 3.6 % 2 1.2 %
(ii)Worst affected BTSs due todowntime
≤ 2% 28 17.1% 16 9.6%
2Connection Establishment(Accessibility)
(i)Call Set-up Success Rate (withinlicensee's own network)
≥ 95% 7 4.2% 5 3.0%
(ii) SDCCH/ Paging Chl. Congestion ≤ 1% 9 5.5% 6 3.6%
(iii) TCH Congestion ≤ 2% 5 3.0% 5 3.0%
3
Connection Maintenance
(Retainability)
(i) Call Drop Rate ≤ 2% 12 7.3% 10 6.0%
(ii)Worst affected cells having morethan 3% TCH drop (call drop) rate
≤ 5% 56 34.2% 45 27.1%
(iii) Connection with good voice quality ≥ 95% 11 6.7% 6 3.6%
4
Point of Interconnection (POI)Congestion (No. of POIs notmeeting the benchmark)(Averaged over a period of quarter)
≤ 0.5% 13 7.9% 22 13.3%
8/9/2019 Indicator Report Apr 10
http://slidepdf.com/reader/full/indicator-report-apr-10 65/150
51
No. of Operators not Meeting the
BenchmarksQuarter Ending
September, 2009Quarter Ending
December, 2009
S.No.
Parameters Benchmark
Out Of 164
(Nos.)
Out Of 164
(in %)
Out Of 166
(Nos.)
Out Of 166
(in %)
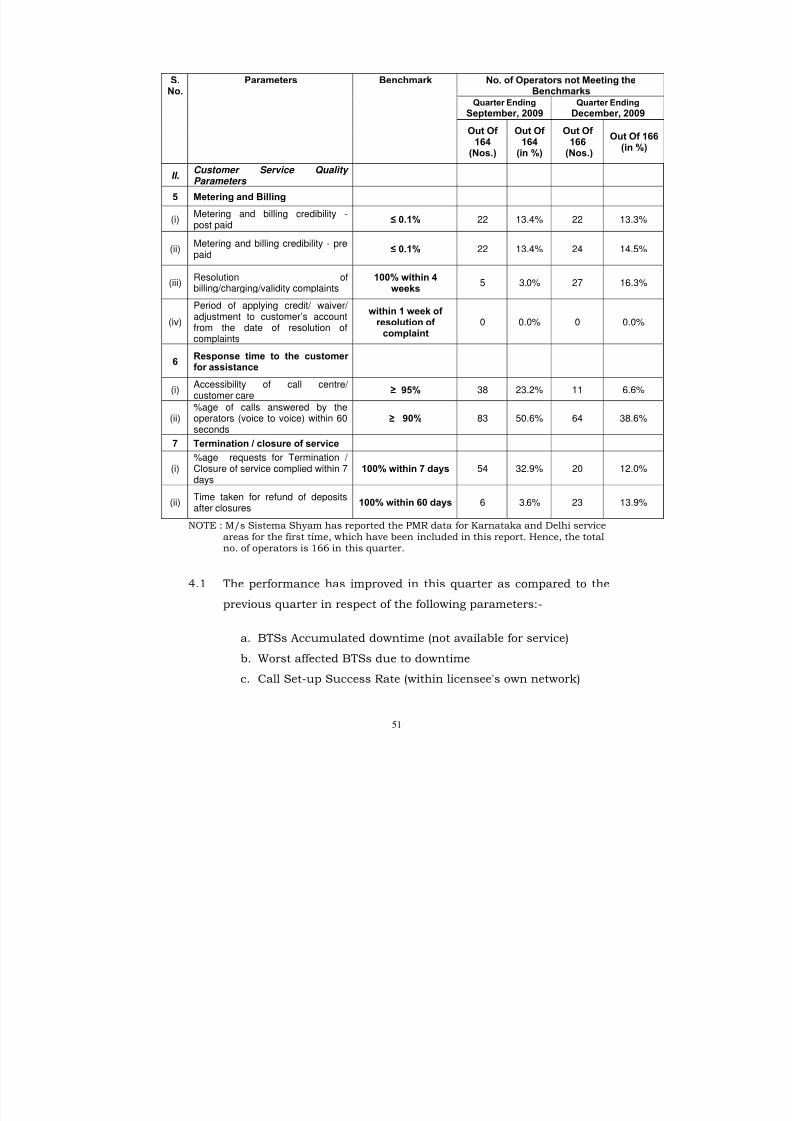
II.Customer Service Quality Parameters
5 Metering and Billing
(i)Metering and billing credibility -post paid
≤ 0.1% 22 13.4% 22 13.3%
(ii)Metering and billing credibility - prepaid
≤ 0.1% 22 13.4% 24 14.5%
(iii)Resolution ofbilling/charging/validity complaints
100% within 4weeks
5 3.0% 27 16.3%
(iv)
Period of applying credit/ waiver/ adjustment to customer’s accountfrom the date of resolution ofcomplaints
within 1 week of resolution of
complaint0 0.0% 0 0.0%
6Response time to the customer for assistance
(i)Accessibility of call centre/ customer care
≥ 95% 38 23.2% 11 6.6%
(ii)%age of calls answered by theoperators (voice to voice) within 60seconds
≥ 90% 83 50.6% 64 38.6%
7 Termination / closure of service
(i)%age requests for Termination / Closure of service complied within 7days
100% within 7 days 54 32.9% 20 12.0%
(ii)Time taken for refund of depositsafter closures
100% within 60 days 6 3.6% 23 13.9%
NOTE : M/s Sistema Shyam has reported the PMR data for Karnataka and Delhi serviceareas for the first time, which have been included in this report. Hence, the totalno. of operators is 166 in this quarter.
4.1 The performance has improved in this quarter as compared to the
previous quarter in respect of the following parameters:-
a. BTSs Accumulated downtime (not available for service)
b. Worst affected BTSs due to downtime
c. Call Set-up Success Rate (within licensee's own network)
8/9/2019 Indicator Report Apr 10
http://slidepdf.com/reader/full/indicator-report-apr-10 66/150
8/9/2019 Indicator Report Apr 10
http://slidepdf.com/reader/full/indicator-report-apr-10 67/150
53
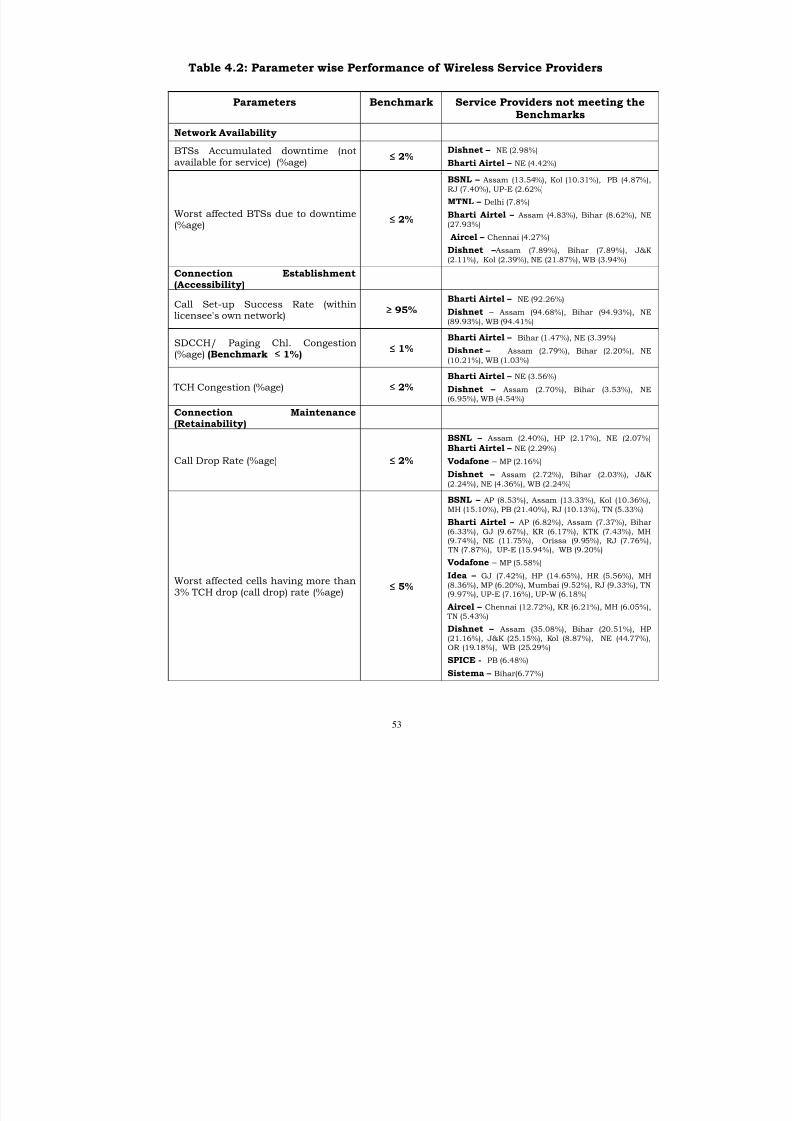
Table 4.2: Parameter wise Performance of Wireless Service Providers
Parameters Benchmark Service Providers not meeting theBenchmarks
Network Availability
BTSs Accumulated downtime (notavailable for service) (%age)
≤ 2%Dishnet – NE (2.98%)
Bharti Airtel – NE (4.42%)
Worst affected BTSs due to downtime(%age)
≤ 2%
BSNL – Assam (13.54%), Kol (10.31%), PB (4.87%),
RJ (7.40%), UP-E (2.62%)
MTNL – Delhi (7.8%)
Bharti Airtel – Assam (4.83%), Bihar (8.62%), NE
(27.93%)
Aircel – Chennai (4.27%)
Dishnet – Assam (7.89%), Bihar (7.89%), J&K
(2.11%), Kol (2.39%), NE (21.87%), WB (3.94%)
Connection Establishment(Accessibility)
Call Set-up Success Rate (withinlicensee's own network)
≥ 95%Bharti Airtel – NE (92.26%)
Dishnet – Assam (94.68%), Bihar (94.93%), NE
(89.93%), WB (94.41%)
SDCCH/ Paging Chl. Congestion(%age) (Benchmark ≤ 1%)
≤ 1%Bharti Airtel – Bihar (1.47%), NE (3.39%)
Dishnet – Assam (2.79%), Bihar (2.20%), NE
(10.21%), WB (1.03%)
TCH Congestion (%age) ≤ 2%Bharti Airtel – NE (3.56%)
Dishnet – Assam (2.70%), Bihar (3.53%), NE
(6.95%), WB (4.54%)
Connection Maintenance(Retainability)
Call Drop Rate (%age) ≤ 2%
BSNL – Assam (2.40%), HP (2.17%), NE (2.07%)
Bharti Airtel – NE (2.29%)
Vodafone – MP (2.16%)
Dishnet – Assam (2.72%), Bihar (2.03%), J&K
(2.24%), NE (4.36%), WB (2.24%)
Worst affected cells having more than
3% TCH drop (call drop) rate (%age)≤
5%
BSNL – AP (8.53%), Assam (13.33%), Kol (10.36%),
MH (15.10%), PB (21.40%), RJ (10.13%), TN (5.33%)
Bharti Airtel – AP (6.82%), Assam (7.37%), Bihar
(6.33%), GJ (9.67%), KR (6.17%), KTK (7.43%), MH(9.74%), NE (11.75%), Orissa (9.95%), RJ (7.76%),
TN (7.87%), UP-E (15.94%), WB (9.20%)
Vodafone – MP (5.58%)
Idea – GJ (7.42%), HP (14.65%), HR (5.56%), MH
(8.36%), MP (6.20%), Mumbai (9.52%), RJ (9.33%), TN(9.97%), UP-E (7.16%), UP-W (6.18%)
Aircel – Chennai (12.72%), KR (6.21%), MH (6.05%),
TN (5.43%)
Dishnet – Assam (35.08%), Bihar (20.51%), HP
(21.16%), J&K (25.15%), Kol (8.87%), NE (44.77%),OR (19.18%), WB (25.29%)
SPICE - PB (6.48%)
Sistema – Bihar(6.77%)
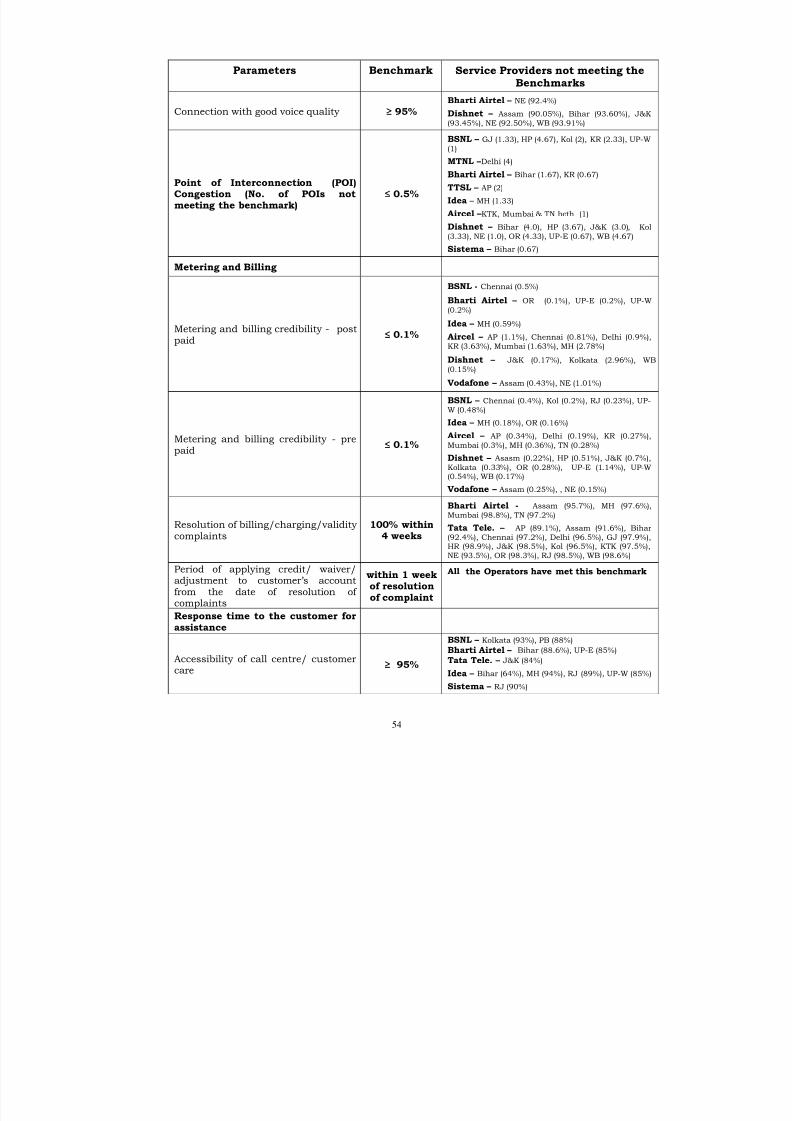
8/9/2019 Indicator Report Apr 10
http://slidepdf.com/reader/full/indicator-report-apr-10 68/150
54
Parameters Benchmark Service Providers not meeting theBenchmarks
Connection with good voice quality ≥ 95%Bharti Airtel – NE (92.4%)
Dishnet – Assam (90.05%), Bihar (93.60%), J&K
(93.45%), NE (92.50%), WB (93.91%)
Point of Interconnection (POI)Congestion (No. of POIs notmeeting the benchmark)
≤ 0.5%
BSNL – GJ (1.33), HP (4.67), Kol (2), KR (2.33), UP-W
(1)
MTNL – Delhi (4)
Bharti Airtel – Bihar (1.67), KR (0.67)
TTSL – AP (2)
Idea – MH (1.33)
Aircel – KTK, Mumbai & TN both (1)
Dishnet – Bihar (4.0), HP (3.67), J&K (3.0), Kol
(3.33), NE (1.0), OR (4.33), UP-E (0.67), WB (4.67)
Sistema – Bihar (0.67)
Metering and Billing
Metering and billing credibility - postpaid
≤ 0.1%
BSNL - Chennai (0.5%)
Bharti Airtel – OR (0.1%), UP-E (0.2%), UP-W
(0.2%)
Idea – MH (0.59%)
Aircel – AP (1.1%), Chennai (0.81%), Delhi (0.9%),
KR (3.63%), Mumbai (1.63%), MH (2.78%)
Dishnet – J&K (0.17%), Kolkata (2.96%), WB
(0.15%)
Vodafone – Assam (0.43%), NE (1.01%)
Metering and billing credibility - prepaid ≤ 0.1%
BSNL – Chennai (0.4%), Kol (0.2%), RJ (0.23%), UP-
W (0.48%)
Idea – MH (0.18%), OR (0.16%)
Aircel – AP (0.34%), Delhi (0.19%), KR (0.27%),
Mumbai (0.3%), MH (0.36%), TN (0.28%)
Dishnet – Asasm (0.22%), HP (0.51%), J&K (0.7%),
Kolkata (0.33%), OR (0.28%), UP-E (1.14%), UP-W(0.54%), WB (0.17%)
Vodafone – Assam (0.25%), , NE (0.15%)
Resolution of billing/charging/validitycomplaints
100% within4 weeks
Bharti Airtel - Assam (95.7%), MH (97.6%),
Mumbai (98.8%), TN (97.2%)
Tata Tele. – AP (89.1%), Assam (91.6%), Bihar
(92.4%), Chennai (97.2%), Delhi (96.5%), GJ (97.9%),HR (98.9%), J&K (98.5%), Kol (96.5%), KTK (97.5%),
NE (93.5%), OR (98.3%), RJ (98.5%), WB (98.6%)
Period of applying credit/ waiver/adjustment to customer’s account
from the date of resolution of complaints
within 1 week
of resolutionof complaint
All the Operators have met this benchmark
Response time to the customer forassistance
Accessibility of call centre/ customercare
≥ 95%
BSNL – Kolkata (93%), PB (88%) Bharti Airtel – Bihar (88.6%), UP-E (85%)
Tata Tele. – J&K (84%)
Idea – Bihar (64%), MH (94%), RJ (89%), UP-W (85%)
Sistema – RJ (90%)
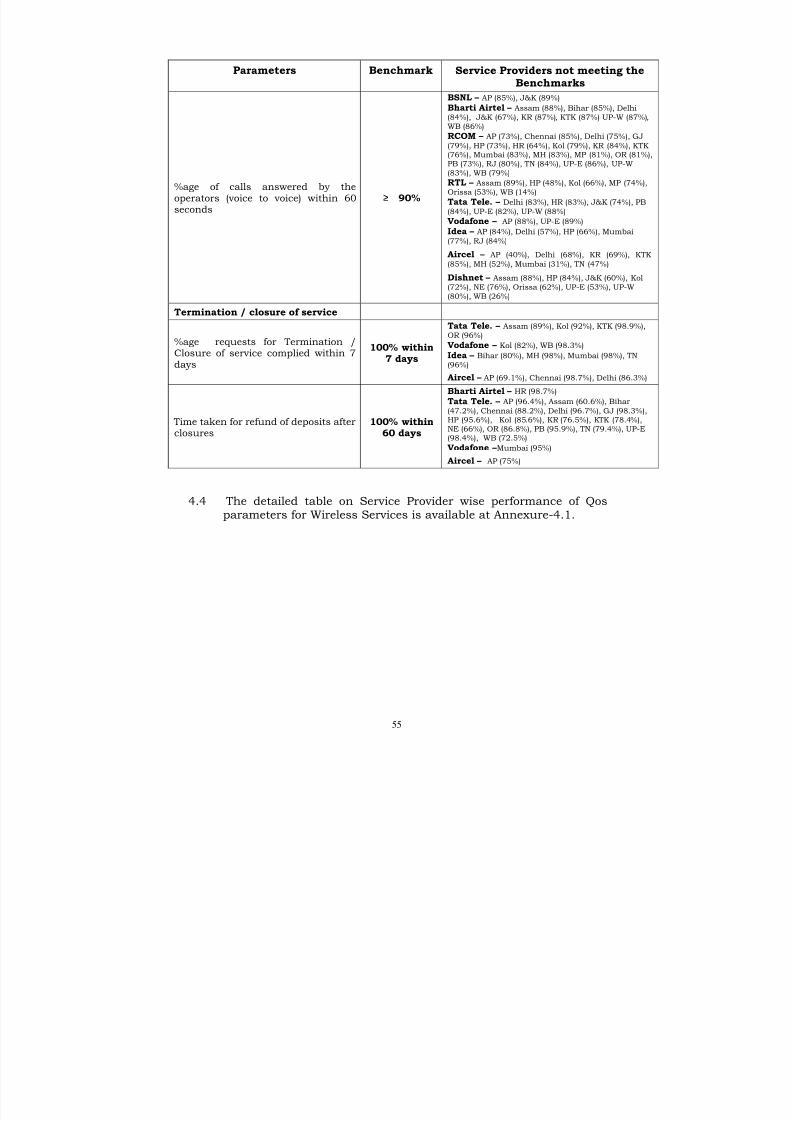
8/9/2019 Indicator Report Apr 10
http://slidepdf.com/reader/full/indicator-report-apr-10 69/150
55
Parameters Benchmark Service Providers not meeting theBenchmarks
%age of calls answered by theoperators (voice to voice) within 60seconds
≥ 90%
BSNL – AP (85%), J&K (89%) Bharti Airtel – Assam (88%), Bihar (85%), Delhi
(84%), J&K (67%), KR (87%), KTK (87%) UP-W (87%),
WB (86%) RCOM – AP (73%), Chennai (85%), Delhi (75%), GJ
(79%), HP (73%), HR (64%), Kol (79%), KR (84%), KTK(76%), Mumbai (83%), MH (83%), MP (81%), OR (81%),PB (73%), RJ (80%), TN (84%), UP-E (86%), UP-W
(83%), WB (79%) RTL – Assam (89%), HP (48%), Kol (66%), MP (74%),
Orissa (53%), WB (14%)
Tata Tele. – Delhi (83%), HR (83%), J&K (74%), PB
(84%), UP-E (82%), UP-W (88%)
Vodafone – AP (88%), UP-E (89%) Idea – AP (84%), Delhi (57%), HP (66%), Mumbai
(77%), RJ (84%)
Aircel – AP (40%), Delhi (68%), KR (69%), KTK
(85%), MH (52%), Mumbai (31%), TN (47%)
Dishnet – Assam (88%), HP (84%), J&K (60%), Kol
(72%), NE (76%), Orissa (62%), UP-E (53%), UP-W
(80%), WB (26%)
Termination / closure of service
%age requests for Termination /Closure of service complied within 7days
100% within7 days
Tata Tele. – Assam (89%), Kol (92%), KTK (98.9%),
OR (96%)
Vodafone – Kol (82%), WB (98.3%)
Idea – Bihar (80%), MH (98%), Mumbai (98%), TN
(96%) Aircel – AP (69.1%), Chennai (98.7%), Delhi (86.3%)
Time taken for refund of deposits afterclosures
100% within60 days
Bharti Airtel – HR (98.7%) Tata Tele. – AP (96.4%), Assam (60.6%), Bihar
(47.2%), Chennai (88.2%), Delhi (96.7%), GJ (98.3%),HP (95.6%), Kol (85.6%), KR (76.5%), KTK (78.4%),NE (66%), OR (86.8%), PB (95.9%), TN (79.4%), UP-E(98.4%), WB (72.5%)
Vodafone – Mumbai (95%)
Aircel – AP (75%)
4.4 The detailed table on Service Provider wise performance of Qosparameters for Wireless Services is available at Annexure-4.1.
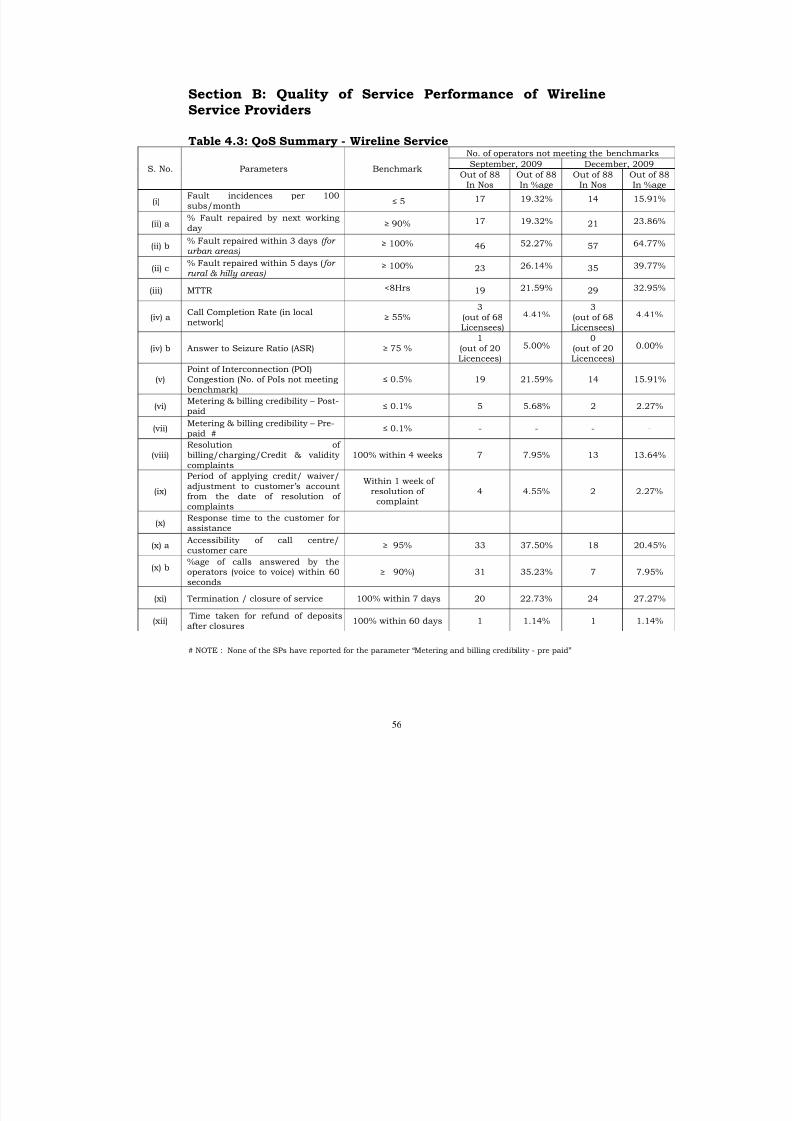
8/9/2019 Indicator Report Apr 10
http://slidepdf.com/reader/full/indicator-report-apr-10 70/150
56
Section B: Quality of Service Performance of WirelineService Providers
Table 4.3: QoS Summary - Wireline Service No. of operators not meeting the benchmark
September, 2009 December, 2009S. No. Parameters Benchmark
Out of 88In Nos
Out of 88In %age
Out of 88In Nos
Out ofIn %a
(i)Fault incidences per 100subs/month
≤ 5 17 19.32% 14 15.91
(ii) a% Fault repaired by next workingday
≥ 90% 17 19.32% 21 23.86
(ii) b% Fault repaired within 3 days (for urban areas)
≥ 100% 46 52.27% 57 64.77
(ii) c% Fault repaired within 5 days ( for rural & hilly areas)
≥ 100% 23 26.14% 35 39.77
(iii) MTTR
<8Hrs
19
21.59%
29
32.95
(iv) aCall Completion Rate (in localnetwork)
≥ 55%3
(out of 68Licensees)
4.41%3
(out of 68Licensees)
4.41
(iv) b Answer to Seizure Ratio (ASR) ≥ 75 %1
(out of 20Licencees)
5.00%0
(out of 20Licencees)
0.00
(v)Point of Interconnection (POI)Congestion (No. of PoIs not meetingbenchmark)
≤ 0.5% 19 21.59% 14 15.91
(vi)Metering & billing credibility – Post-paid
≤ 0.1% 5 5.68% 2 2.27
(vii)Metering & billing credibility – Pre-paid #
≤ 0.1% - - - -
(viii)Resolution of billing/charging/Credit & validitycomplaints
100% within 4 weeks 7 7.95% 13 13.64
(ix)
Period of applying credit/ waiver/adjustment to customer’s accountfrom the date of resolution of complaints
Within 1 week of resolution of complaint
4 4.55% 2 2.27
(x)Response time to the customer forassistance
(x) aAccessibility of call centre/customer care
≥ 95% 33 37.50% 18 20.45
(x) b%age of calls answered by theoperators (voice to voice) within 60seconds
≥ 90%) 31 35.23% 7 7.95
(xi) Termination / closure of service 100% within 7 days 20 22.73% 24 27.27
(xii) Time taken for refund of depositsafter closures
100% within 60 days 1 1.14% 1 1.14
# NOTE : None of the SPs have reported for the parameter “Metering and billing credibility - pre paid”
8/9/2019 Indicator Report Apr 10
http://slidepdf.com/reader/full/indicator-report-apr-10 71/150
57
4.5 The performance has improved as compared to the previous
quarter, in respect of the following parameters:
a. Fault incidences per 100 subs/month
b. Answer to Seizure Ratio (ASR)
c. Point of Interconnection (POI) Congestion (No. of PoIs
not meeting the benchmark)
d. Metering and billing credibility - post paid
e. Period of applying credit/ waiver/ adjustment to
customer’s account from the date of resolution of
complaints
f. Accessibility of call centre/ customer care
g. %age of calls answered by the operators (voice to voice) within 60 sec.
4.6 The performance has deteriorated in this quarter, as compared to
the previous quarter, in respect of the following parameters:-
a. % Fault repaired by next working day
b. % Fault repaired within 3 days
c. % Fault repaired within 5 days
d. Mean Time To Repair (MTTR)
e. Resolution of billing/charging/Credit & validity
complaints
f. Termination / Closure of service 100% within 7 days
4.7 The performance of the Basic Telephone Service (Wireline) Service
Providers is at same level as compared to the previous quarter in
respect of the parameter of “Call completion rate (in local network)”
and “Time Taken for Refund of deposits after closures”.
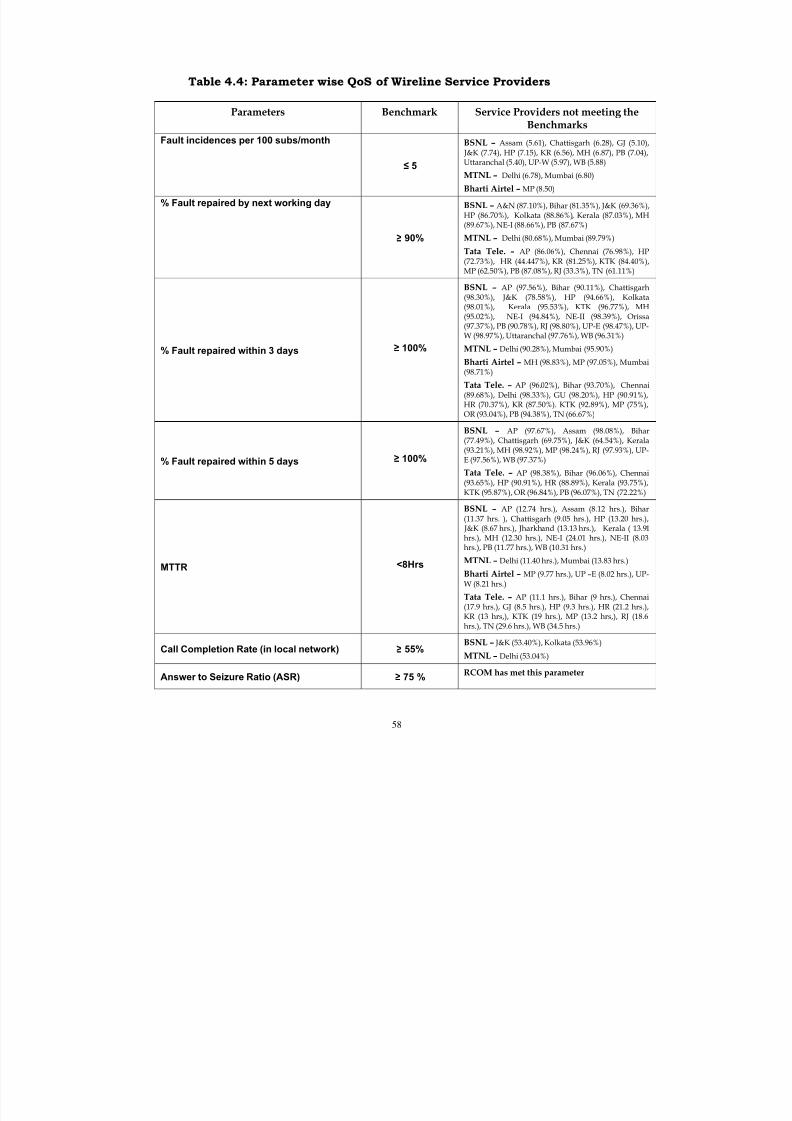
8/9/2019 Indicator Report Apr 10
http://slidepdf.com/reader/full/indicator-report-apr-10 72/150
58
Table 4.4: Parameter wise QoS of Wireline Service Providers
Parameters Benchmark Service Providers not meeting theBenchmarks
Fault incidences per 100 subs/month
≤ 5
BSNL – Assam (5.61), Chattisgarh (6.28), GJ (5.10), J&K (7.74), HP (7.15), KR (6.56), MH (6.87), PB (7.04),Uttaranchal (5.40), UP-W (5.97), WB (5.88)
MTNL – Delhi (6.78), Mumbai (6.80)
Bharti Airtel – MP (8.50)
% Fault repaired by next working day
≥ 90%
BSNL – A&N (87.10%), Bihar (81.35%), J&K (69.36%),HP (86.70%), Kolkata (88.86%), Kerala (87.03%), MH(89.67%), NE-I (88.66%), PB (87.67%)
MTNL – Delhi (80.68%), Mumbai (89.79%)
Tata Tele. – AP (86.06%), Chennai (76.98%), HP
(72.73%), HR (44.447%), KR (81.25%), KTK (84.40%),MP (62.50%), PB (87.08%), RJ (33.3%), TN (61.11%)
% Fault repaired within 3 days ≥ 100%
BSNL – AP (97.56%), Bihar (90.11%), Chattisgarh
(98.30%), J&K (78.58%), HP (94.66%), Kolkata(98.01%), Kerala (95.53%), KTK (96.77%), MH(95.02%), NE-I (94.84%), NE-II (98.39%), Orissa(97.37%), PB (90.78%), RJ (98.80%), UP-E (98.47%), UP-W (98.97%), Uttaranchal (97.76%), WB (96.31%)
MTNL – Delhi (90.28%), Mumbai (95.90%)
Bharti Airtel – MH (98.83%), MP (97.05%), Mumbai(98.71%)
Tata Tele. – AP (96.02%), Bihar (93.70%), Chennai
(89.68%), Delhi (98.33%), GU (98.20%), HP (90.91%),HR (70.37%), KR (87.50%). KTK (92.89%), MP (75%),OR (93.04%), PB (94.38%), TN (66.67%)
% Fault repaired within 5 days ≥ 100%
BSNL – AP (97.67%), Assam (98.08%), Bihar
(77.49%), Chattisgarh (69.75%), J&K (64.54%), Kerala(93.21%), MH (98.92%), MP (98.24%), RJ (97.93%), UP-E (97.56%), WB (97.37%)
Tata Tele. – AP (98.38%), Bihar (96.06%), Chennai(93.65%), HP (90.91%), HR (88.89%), Kerala (93.75%),KTK (95.87%), OR (96.84%), PB (96.07%), TN (72.22%)
MTTR <8Hrs
BSNL – AP (12.74 hrs.), Assam (8.12 hrs.), Bihar
(11.37 hrs. ), Chattisgarh (9.05 hrs.), HP (13.20 hrs.), J&K (8.67 hrs.), Jharkhand (13.13 hrs.), Kerala ( 13.91hrs.), MH (12.30 hrs.), NE-I (24.01 hrs.), NE-II (8.03hrs.), PB (11.77 hrs.), WB (10.31 hrs.)
MTNL – Delhi (11.40 hrs.), Mumbai (13.83 hrs.)
Bharti Airtel – MP (9.77 hrs.), UP –E (8.02 hrs.), UP-
W (8.21 hrs.)
Tata Tele. – AP (11.1 hrs.), Bihar (9 hrs.), Chennai(17.9 hrs.), GJ (8.5 hrs.), HP (9.3 hrs.), HR (21.2 hrs.),KR (13 hrs,), KTK (19 hrs.), MP (13.2 hrs,), RJ (18.6hrs.), TN (29.6 hrs.), WB (34.5 hrs.)
Call Completion Rate (in local network) ≥ 55%BSNL – J&K (53.40%), Kolkata (53.96%)
MTNL – Delhi (53.04%)
Answer to Seizure Ratio (ASR) ≥ 75 %RCOM has met this parameter
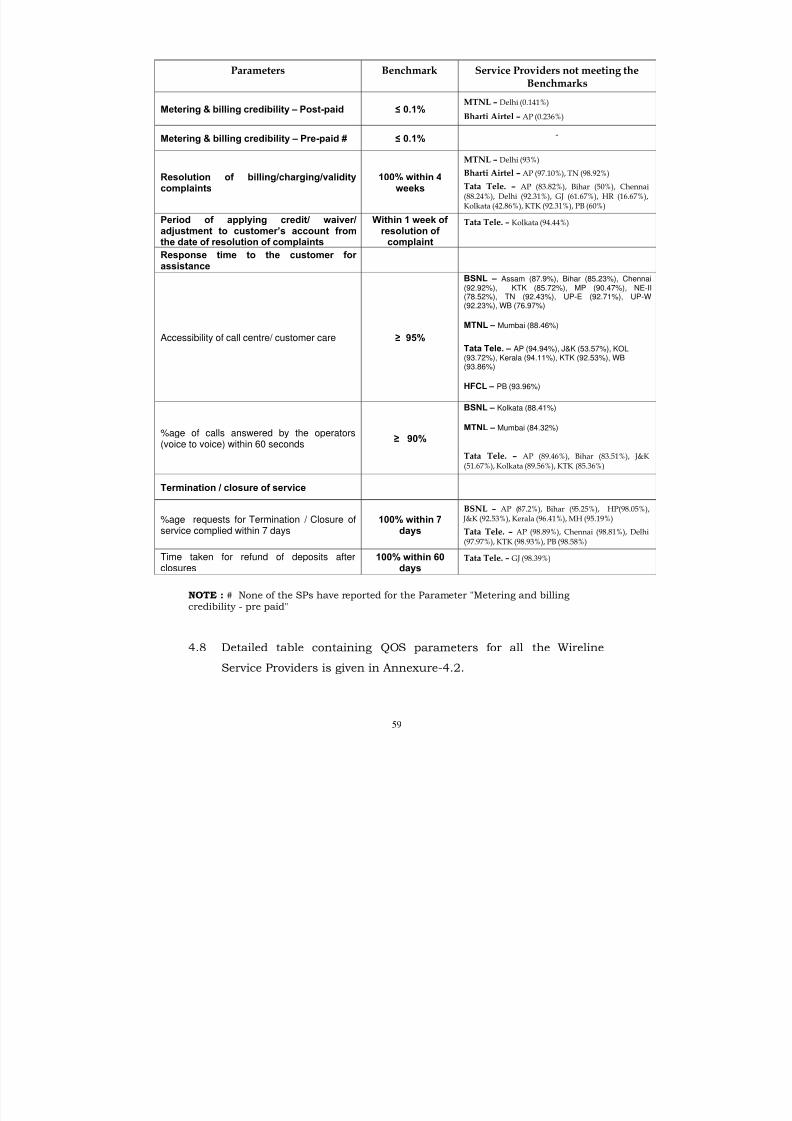
8/9/2019 Indicator Report Apr 10
http://slidepdf.com/reader/full/indicator-report-apr-10 73/150
59
Parameters Benchmark Service Providers not meeting theBenchmarks
Metering & billing credibility – Post-paid ≤ 0.1% MTNL – Delhi (0.141%)
Bharti Airtel – AP (0.236%)
Metering & billing credibility – Pre-paid # ≤ 0.1% -
Resolution of billing/charging/validitycomplaints
100% within 4weeks
MTNL – Delhi (93%)
Bharti Airtel – AP (97.10%), TN (98.92%)
Tata Tele. – AP (83.82%), Bihar (50%), Chennai(88.24%), Delhi (92.31%), GJ (61.67%), HR (16.67%),Kolkata (42.86%), KTK (92.31%), PB (60%)
Period of applying credit/ waiver/adjustment to customer’s account fromthe date of resolution of complaints
Within 1 week of resolution of
complaint
Tata Tele. – Kolkata (94.44%)
Response time to the customer for assistance
Accessibility of call centre/ customer care ≥ 95%
BSNL – Assam (87.9%), Bihar (85.23%), Chennai(92.92%), KTK (85.72%), MP (90.47%), NE-II
(78.52%), TN (92.43%), UP-E (92.71%), UP-W(92.23%), WB (76.97%)
MTNL – Mumbai (88.46%)
Tata Tele. – AP (94.94%), J&K (53.57%), KOL(93.72%), Kerala (94.11%), KTK (92.53%), WB(93.86%)
HFCL – PB (93.96%)
%age of calls answered by the operators
(voice to voice) within 60 seconds≥
90%
BSNL – Kolkata (88.41%)
MTNL – Mumbai (84.32%)
Tata Tele. – AP (89.46%), Bihar (83.51%), J&K(51.67%), Kolkata (89.56%), KTK (85.36%)
Termination / closure of service
%age requests for Termination / Closure ofservice complied within 7 days
100% within 7days
BSNL – AP (87.2%), Bihar (95.25%), HP(98.05%), J&K (92.53%), Kerala (96.41%), MH (95.19%)
Tata Tele. – AP (98.89%), Chennai (98.81%), Delhi
(97.97%), KTK (98.93%), PB (98.58%)
Time taken for refund of deposits afterclosures
100% within 60days
Tata Tele. – GJ (98.39%)
NOTE : # None of the SPs have reported for the Parameter "Metering and billingcredibility - pre paid"
4.8 Detailed table containing QOS parameters for all the Wireline
Service Providers is given in Annexure-4.2.
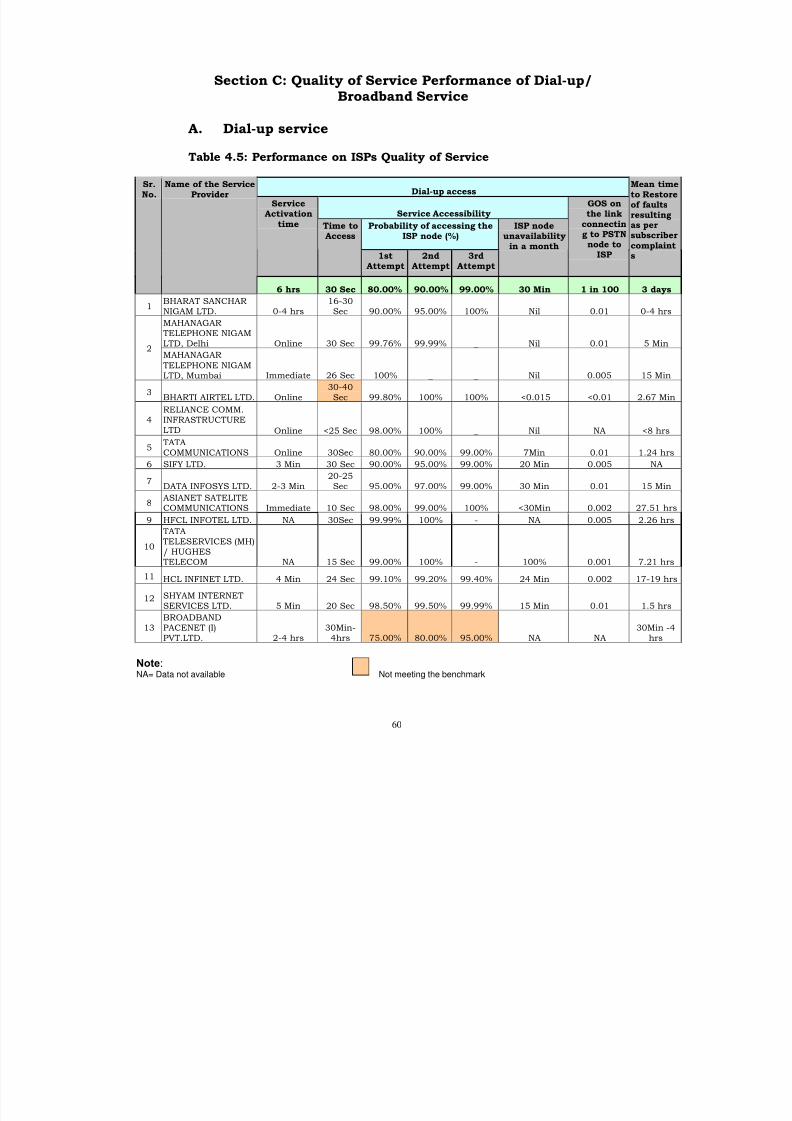
8/9/2019 Indicator Report Apr 10
http://slidepdf.com/reader/full/indicator-report-apr-10 74/150
60
Section C: Quality of Service Performance of Dial-up/Broadband Service
A. Dial-up service
Table 4.5: Performance on ISPs Quality of Service
Dial-up access
Service Accessibility
Probability of accessing theISP node (%)
ServiceActivation
time Time toAccess
1stAttempt
2ndAttempt
3rdAttempt
ISP nodeunavailability
in a month
GOS onthe link
connecting to PSTNnode to
ISP
Meanto Reof fauresultas persubsccomps
Sr.No.
Name of the ServiceProvider
6 hrs 30 Sec 80.00% 90.00% 99.00% 30 Min 1 in 100 3 d
1BHARAT SANCHARNIGAM LTD. 0-4 hrs
16-30Sec 90.00% 95.00% 100% Nil 0.01 0-4
MAHANAGAR TELEPHONE NIGAMLTD, Delhi Online 30 Sec 99.76% 99.99% _ Nil 0.01 5 M
2MAHANAGAR
TELEPHONE NIGAMLTD, Mumbai Immediate 26 Sec 100% _ _ Nil 0.005 15
3BHARTI AIRTEL LTD. Online
30-40Sec 99.80% 100% 100% <0.015 <0.01 2.67
4RELIANCE COMM.INFRASTRUCTURELTD Online <25 Sec 98.00% 100% _ Nil NA <8
5 TATACOMMUNICATIONS Online 30Sec 80.00% 90.00% 99.00% 7Min 0.01 1.24
6 SIFY LTD. 3 Min 30 Sec 90.00% 95.00% 99.00% 20 Min 0.005 N
7DATA INFOSYS LTD. 2-3 Min
20-25Sec 95.00% 97.00% 99.00% 30 Min 0.01 15
8ASIANET SATELITECOMMUNICATIONS Immediate 10 Sec 98.00% 99.00% 100% <30Min 0.002 27.5
9 HFCL INFOTEL LTD. NA 30Sec 99.99% 100% - NA 0.005 2.26
10
TATA TELESERVICES (MH)/ HUGHES TELECOM NA 15 Sec 99.00% 100% - 100% 0.001 7.21
11 HCL INFINET LTD. 4 Min 24 Sec 99.10% 99.20% 99.40% 24 Min 0.002 17-1
12 SHYAM INTERNET SERVICES LTD. 5 Min 20 Sec 98.50% 99.50% 99.99% 15 Min 0.01 1.5
13BROADBANDPACENET (I)PVT.LTD. 2-4 hrs
30Min-4hrs 75.00% 80.00% 95.00% NA NA
30Mh
Note:NA= Data not available Not meeting the benchmark
8/9/2019 Indicator Report Apr 10
http://slidepdf.com/reader/full/indicator-report-apr-10 75/150
61
Service Activation Time
4.9 HFCL Infotel Ltd and Tata Teleservices Ltd. have not provided the
data. All other ISPs have met the TRAI benchmark of 6 hrs.
Time to Access
4.10 All the ISPs have met the TRAI benchmark of 30 sec.
Probability of Accessing the ISP Node
4.11 All the Internet Service Operators have met this benchmark of 80%
for first attempt, 90% for second attempt and 99% for third
attempt in this quarter. However, M/s Broadband Pacenet (I) Pvt
Ltd has not met the benchmark in all the three attempts.
ISP Node unavailability
4.12 ISP Nodes unavailability should not exceed 30 minutes in a
month. All the ISPs have met the TRAI benchmark. However M/s
HFCL Infotel Ltd and M/s Broadband Pacenet (I) Pvt Ltd have not
provided the data.
Grade of Service
4.13 ISPs are required to maintain the Grade of Service on the link
connecting PSTN Node to the ISP Node as 1 in 100. All the ISPs
have maintained the Grade of Service. M/s. Reliance Comm.
Infrastructure Ltd and M/s Broadband Pacenet (I) Pvt. Ltd have
not provided data.
Mean Time to Restore (MTTR)
4.14 ISPs are required to rectify 90% of faults resulting due to
subscriber complaint within 24 hours and 99% within three days.
All the Operators have met this benchmark. M/s Sify Ltd has not
provided data.
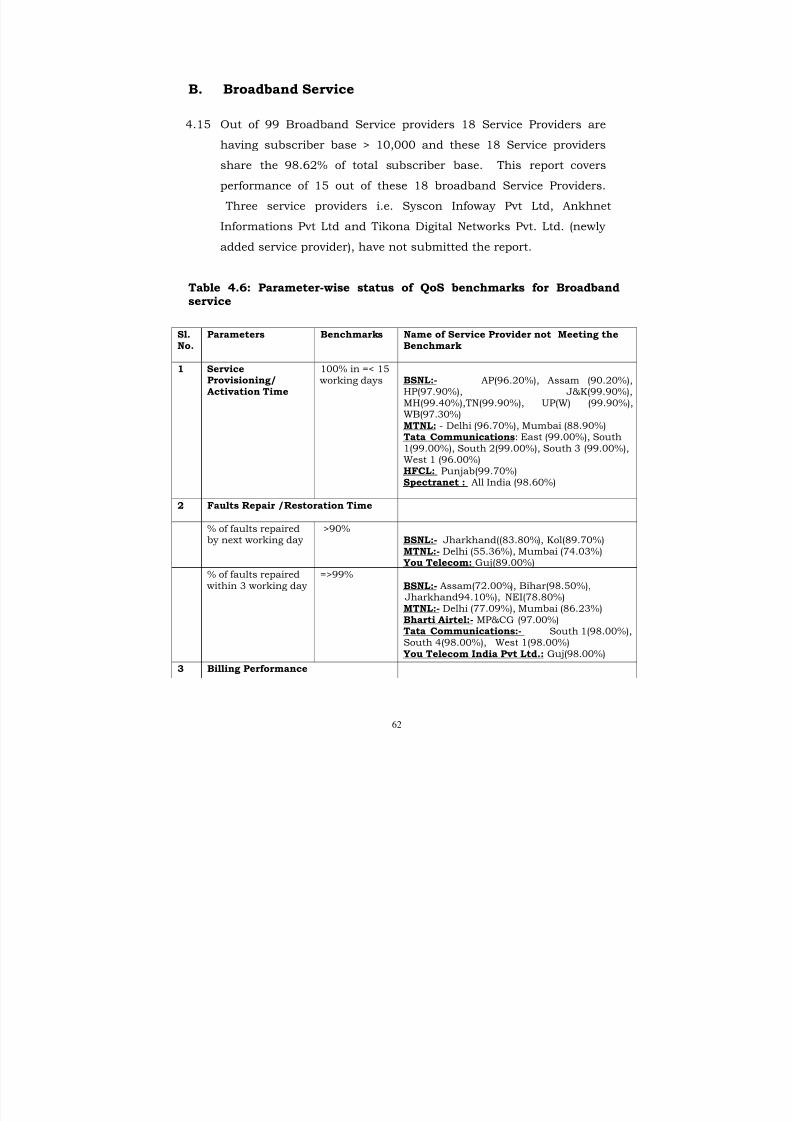
8/9/2019 Indicator Report Apr 10
http://slidepdf.com/reader/full/indicator-report-apr-10 76/150
62
B. Broadband Service
4.15 Out of 99 Broadband Service providers 18 Service Providers are
having subscriber base > 10,000 and these 18 Service providersshare the 98.62% of total subscriber base. This report covers
performance of 15 out of these 18 broadband Service Providers.
Three service providers i.e. Syscon Infoway Pvt Ltd, Ankhnet
Informations Pvt Ltd and Tikona Digital Networks Pvt. Ltd. (newly
added service provider), have not submitted the report.
Table 4.6: Parameter-wise status of QoS benchmarks for Broadbandservice
Sl.No.
Parameters Benchmarks Name of Service Provider not Meeting theBenchmark
1 ServiceProvisioning/Activation Time
100% in =< 15 working days BSNL:- AP(96.20%), Assam (90.20%),
HP(97.90%), J&K(99.90%),MH(99.40%),TN(99.90%), UP(W) (99.90%),WB(97.30%)MTNL: - Delhi (96.70%), Mumbai (88.90%)Tata Communications: East (99.00%), South1(99.00%), South 2(99.00%), South 3 (99.00%),West 1 (96.00%)HFCL: Punjab(99.70%)Spectranet : All India (98.60%)
2 Faults Repair /Restoration Time
% of faults repairedby next working day
>90%BSNL:- Jharkhand((83.80%), Kol(89.70%)MTNL:- Delhi (55.36%), Mumbai (74.03%)You Telecom: Guj(89.00%)
% of faults repaired
within 3 working day
=>99%
BSNL:- Assam(72.00%), Bihar(98.50%), Jharkhand94.10%), NEI(78.80%)MTNL:- Delhi (77.09%), Mumbai (86.23%)Bharti Airtel:- MP&CG (97.00%)Tata Communications:- South 1(98.00%),South 4(98.00%), West 1(98.00%)You Telecom India Pvt Ltd.: Guj(98.00%)
3 Billing Performance
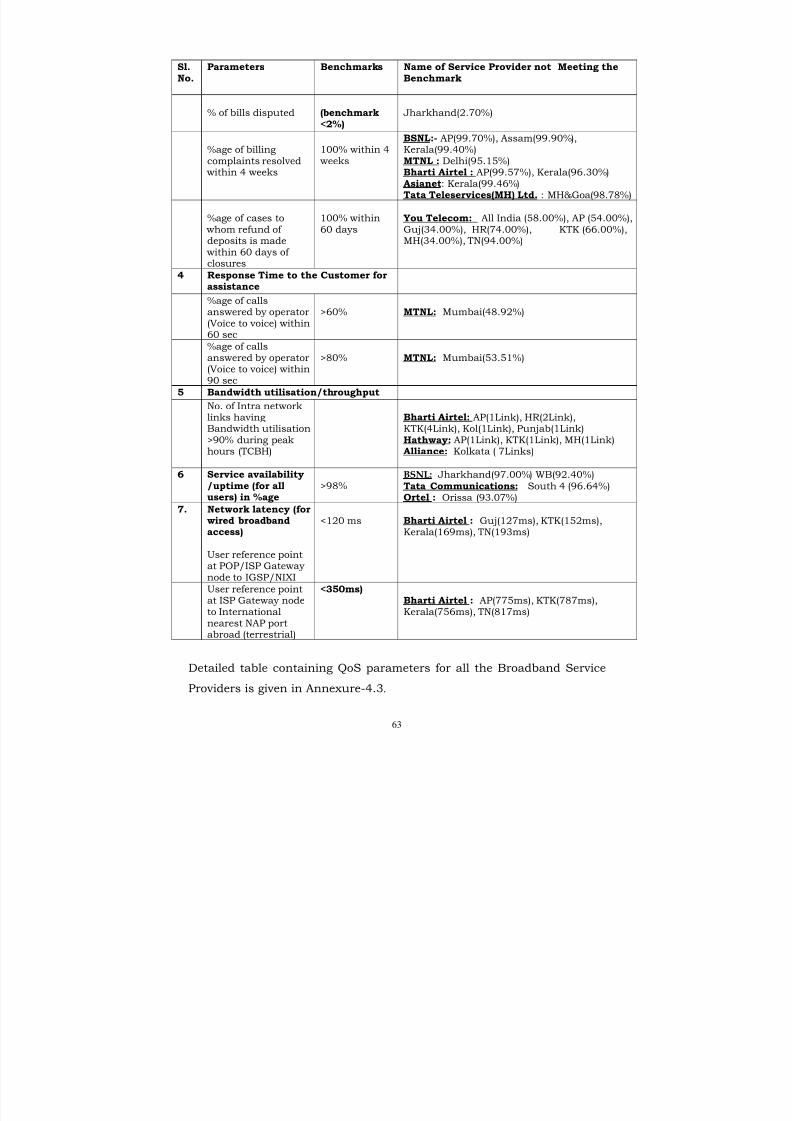
8/9/2019 Indicator Report Apr 10
http://slidepdf.com/reader/full/indicator-report-apr-10 77/150
63
Sl.No.
Parameters Benchmarks Name of Service Provider not Meeting theBenchmark
% of bills disputed (benchmark<2%)
Jharkhand(2.70%)
%age of billingcomplaints resolved
within 4 weeks
100% within 4 weeks
BSNL:- AP(99.70%), Assam(99.90%),
Kerala(99.40%)MTNL : Delhi(95.15%)Bharti Airtel : AP(99.57%), Kerala(96.30%)Asianet: Kerala(99.46%)Tata Teleservices(MH) Ltd. : MH&Goa(98.78%)
%age of cases to whom refund of deposits is made
within 60 days of closures
100% within60 days
You Telecom: All India (58.00%), AP (54.00%),Guj(34.00%), HR(74.00%), KTK (66.00%),MH(34.00%), TN(94.00%)
4 Response Time to the Customer forassistance
%age of callsanswered by operator(Voice to voice) within60 sec
>60% MTNL: Mumbai(48.92%)
%age of callsanswered by operator(Voice to voice) within90 sec
>80% MTNL: Mumbai(53.51%)
5 Bandwidth utilisation/throughput
No. of Intra networklinks havingBandwidth utilisation
>90% during peakhours (TCBH)
Bharti Airtel: AP(1Link), HR(2Link),KTK(4Link), Kol(1Link), Punjab(1Link)
Hathway: AP(1Link), KTK(1Link), MH(1Link) Alliance: Kolkata ( 7Links)
6 Service availability/uptime (for allusers) in %age
>98%BSNL: Jharkhand(97.00%) WB(92.40%)Tata Communications: South 4 (96.64%)Ortel : Orissa (93.07%)
7. Network latency (forwired broadbandaccess)
User reference pointat POP/ISP Gatewaynode to IGSP/NIXI
<120 ms Bharti Airtel : Guj(127ms), KTK(152ms),Kerala(169ms), TN(193ms)
User reference pointat ISP Gateway nodeto Internationalnearest NAP portabroad (terrestrial)
<350ms) Bharti Airtel : AP(775ms), KTK(787ms),Kerala(756ms), TN(817ms)
Detailed table containing QoS parameters for all the Broadband Service
Providers is given in Annexure-4.3.
8/9/2019 Indicator Report Apr 10
http://slidepdf.com/reader/full/indicator-report-apr-10 78/150
64
Chapter 5:Performance of Cable
TV, DTH and RadioBroadcasting Services
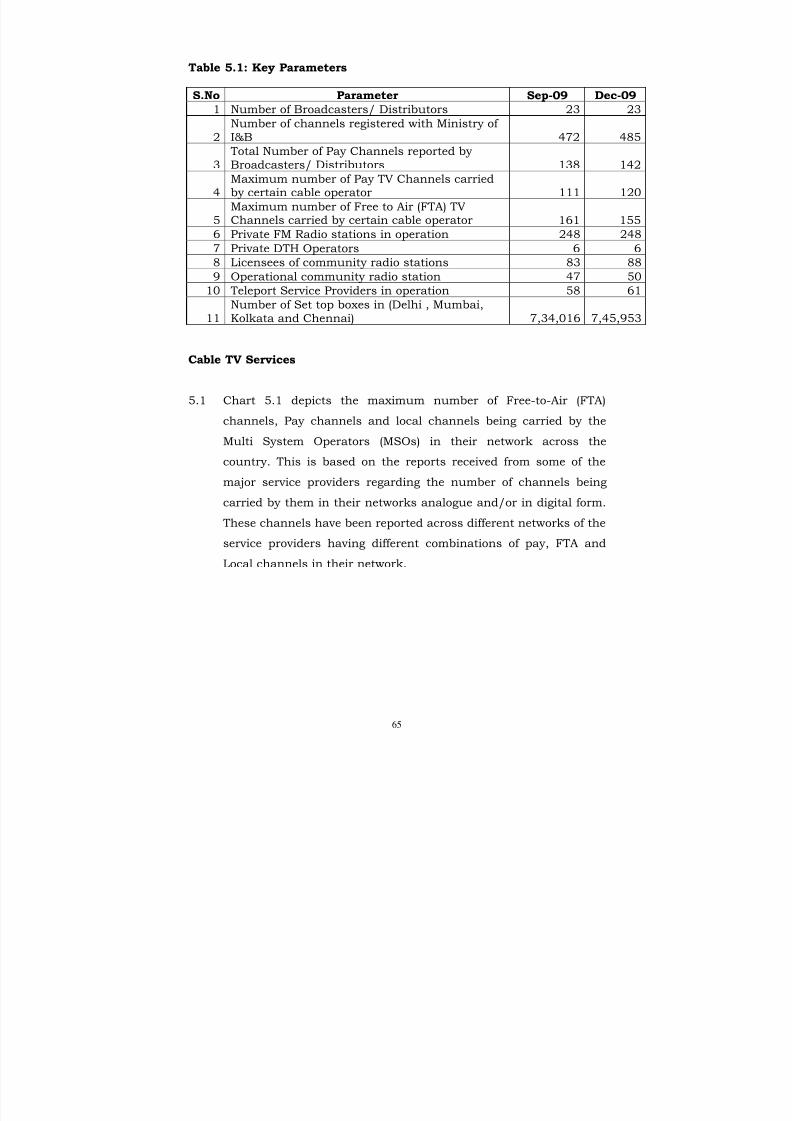
8/9/2019 Indicator Report Apr 10
http://slidepdf.com/reader/full/indicator-report-apr-10 79/150
65
Table 5.1: Key Parameters
S.No Parameter Sep-09 Dec-091 Number of Broadcasters/ Distributors 23 23
2Number of channels registered with Ministry of I&B 472 485
3 Total Number of Pay Channels reported byBroadcasters/ Distributors 138 142
4Maximum number of Pay TV Channels carriedby certain cable operator 111 120
5Maximum number of Free to Air (FTA) TVChannels carried by certain cable operator 161 155
6 Private FM Radio stations in operation 248 248
7 Private DTH Operators 6 6
8 Licensees of community radio stations 83 88
9 Operational community radio station 47 50
10 Teleport Service Providers in operation 58 61
11Number of Set top boxes in (Delhi , Mumbai,Kolkata and Chennai) 7,34,016 7,45,953
Cable TV Services
5.1 Chart 5.1 depicts the maximum number of Free-to-Air (FTA)
channels, Pay channels and local channels being carried by the
Multi System Operators (MSOs) in their network across the
country. This is based on the reports received from some of the
major service providers regarding the number of channels being
carried by them in their networks analogue and/or in digital form.
These channels have been reported across different networks of the
service providers having different combinations of pay, FTA and
Local channels in their network.
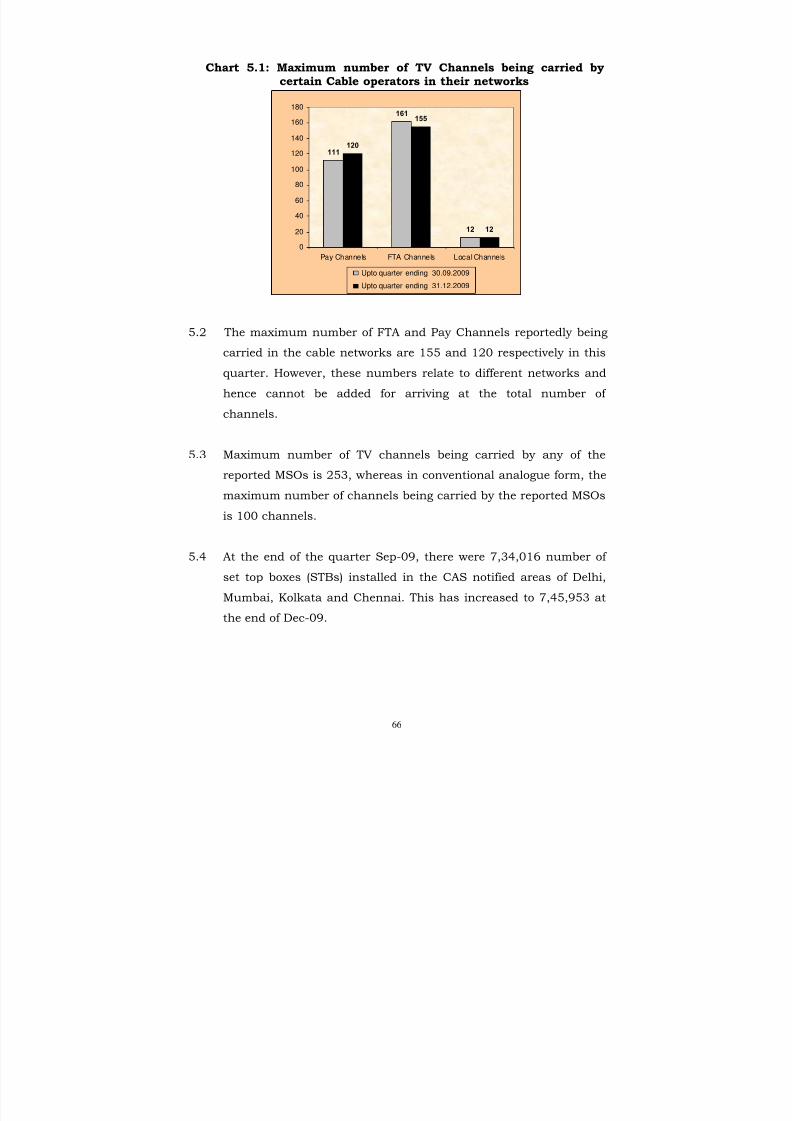
8/9/2019 Indicator Report Apr 10
http://slidepdf.com/reader/full/indicator-report-apr-10 80/150
66
Chart 5.1: Maximum number of TV Channels being carried bycertain Cable operators in their networks
111
161
12
120
155
12
0
20
40
60
80
100
120
140
160
180
Pay Channels FTA Channels Local Channels
Upto quarter ending 30.09.2009
Upto quarter ending 31.12.2009
5.2 The maximum number of FTA and Pay Channels reportedly being
carried in the cable networks are 155 and 120 respectively in this
quarter. However, these numbers relate to different networks and
hence cannot be added for arriving at the total number of
channels.
5.3 Maximum number of TV channels being carried by any of the
reported MSOs is 253, whereas in conventional analogue form, the
maximum number of channels being carried by the reported MSOs
is 100 channels.
5.4 At the end of the quarter Sep-09, there were 7,34,016 number of
set top boxes (STBs) installed in the CAS notified areas of Delhi,
Mumbai, Kolkata and Chennai. This has increased to 7,45,953 at
the end of Dec-09.
8/9/2019 Indicator Report Apr 10
http://slidepdf.com/reader/full/indicator-report-apr-10 81/150
67
Chart 5.2 : Set Top Boxes (STBs)
199335
280768
81752
172161
734016
198016
290939
82879
174119
745953
0 200000 400000 600000 800000
Delhi
Mumbai
Kolkata
Chennai
Total
C A S n o t i f i e d a r e a s
Number of STBs
Upto quarter ending 31.12.2009
Upto quarter ending 30.09.2009
Satellite TV Channels
5.5 At the end of Dec-09, Total Number of channels registered with
Ministry of I&B is 485. There are reportedly 142 pay TV channels in
existence. These 142 pay TV channels are being broadcasted/
distributed by 23 broadcasters or their distributors. The list of
broadcasters/distributors of pay TV channels alongwith the
reported rates of pay channels for Non-CAS areas is at Annexure-
5.1.
5.6 In the quarter ending Dec-09, 5 channels were converted from FTAto pay by the broadcaster (M/s Channel Plus) and one channel
namely 'Play TV' was discontinued by the broadcaster (M/s Zee
Turner Limited). The details of converted channels from FTA to Pay
are as under :-
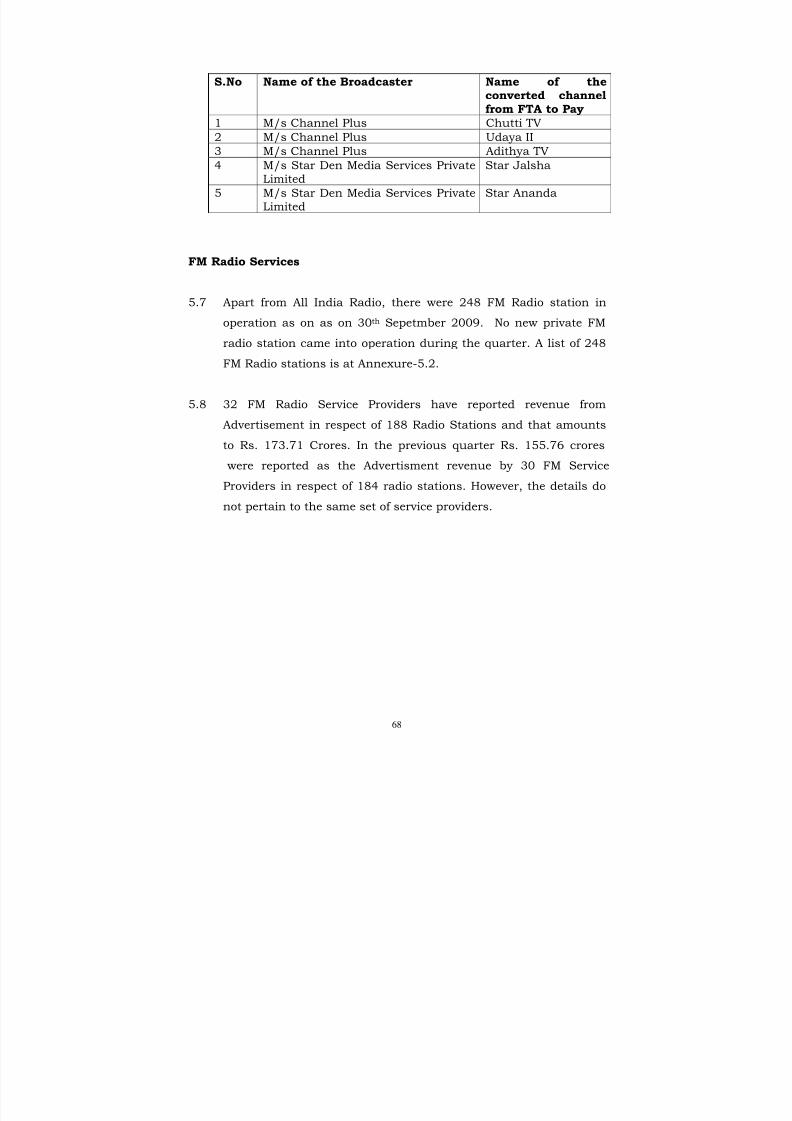
8/9/2019 Indicator Report Apr 10
http://slidepdf.com/reader/full/indicator-report-apr-10 82/150
68
S.No Name of the Broadcaster Name of theconverted channelfrom FTA to Pay
1 M/s Channel Plus Chutti TV
2 M/s Channel Plus Udaya II
3 M/s Channel Plus Adithya TV4 M/s Star Den Media Services Private
LimitedStar Jalsha
5 M/s Star Den Media Services PrivateLimited
Star Ananda
FM Radio Services
5.7 Apart from All India Radio, there were 248 FM Radio station in
operation as on as on 30th Sepetmber 2009. No new private FM
radio station came into operation during the quarter. A list of 248
FM Radio stations is at Annexure-5.2.
5.8 32 FM Radio Service Providers have reported revenue from
Advertisement in respect of 188 Radio Stations and that amounts
to Rs. 173.71 Crores. In the previous quarter Rs. 155.76 crores
were reported as the Advertisment revenue by 30 FM Service
Providers in respect of 184 radio stations. However, the details do
not pertain to the same set of service providers.
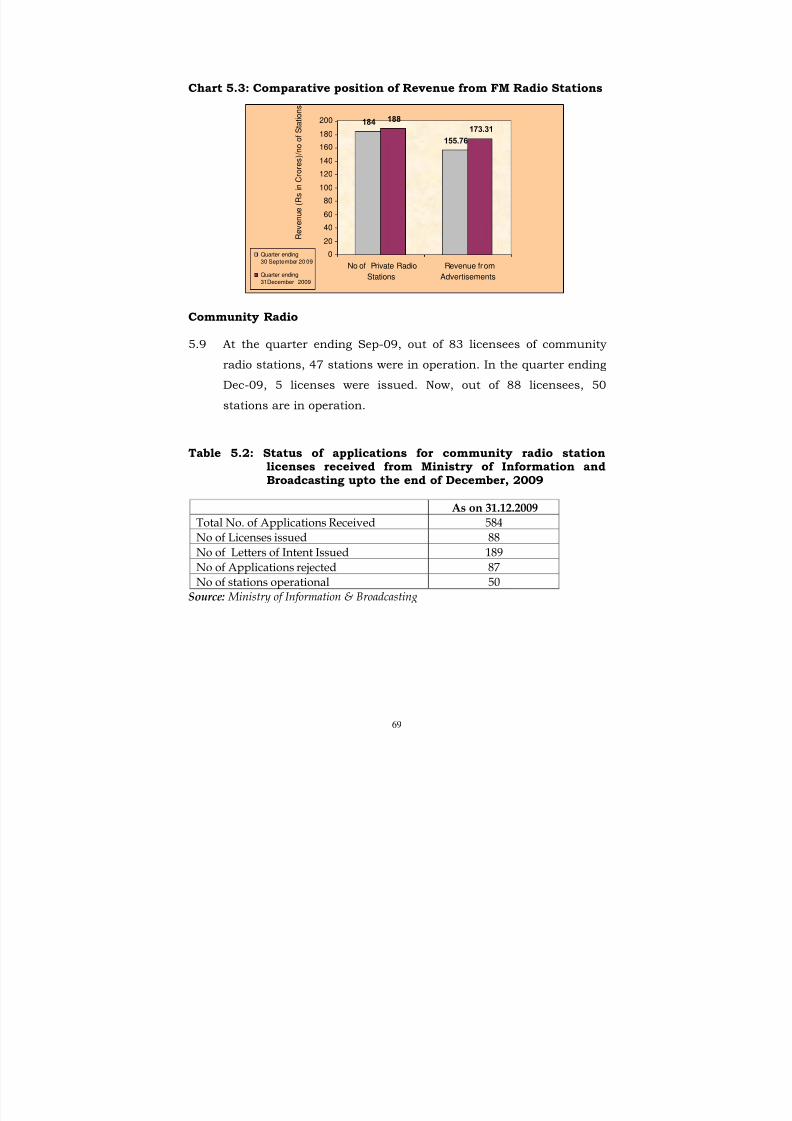
8/9/2019 Indicator Report Apr 10
http://slidepdf.com/reader/full/indicator-report-apr-10 83/150
69
Chart 5.3: Comparative position of Revenue from FM Radio Stations
184
155.76
188
173.31
0
20
40
60
80
100
120
140
160
180
200
No of Private Radio
Stations
Revenue from
Advertisements
R e v e n u e ( R s i n C r o r e s ) / n o
o f S t a t i o n s
Quarter ending
30 September 20 09
Quarter ending
31December 2009
Community Radio
5.9 At the quarter ending Sep-09, out of 83 licensees of community
radio stations, 47 stations were in operation. In the quarter ending
Dec-09, 5 licenses were issued. Now, out of 88 licensees, 50
stations are in operation.
Table 5.2: Status of applications for community radio stationlicenses received from Ministry of Information andBroadcasting upto the end of December, 2009
As on 31.12.2009
Total No. of Applications Received 584
No of Licenses issued 88
No of Letters of Intent Issued 189
No of Applications rejected 87
No of stations operational 50Source: Ministry of Information & Broadcasting
8/9/2019 Indicator Report Apr 10
http://slidepdf.com/reader/full/indicator-report-apr-10 84/150
70
DTH Services
5.10 Besides the free DTH service of Doordarshan, there are 6 private
DTH licensees.
5.11 All the six private licensees are offering pay DTH services to the
consumers as on 31.12.2009. Total number of reported registered
subscribers is 19.1 million. The list of DTH licensees is at
Annexure-5.3.
Teleport Service
5.12 Upto quarter ending Sep-09, there were 58 Teleport ServiceProviders in operation in India. 3 new licenses were issued in this
quarter, taking the number of Teleport Service providers to 61. A
list of the stations is at Annexure-5.4.

8/9/2019 Indicator Report Apr 10
http://slidepdf.com/reader/full/indicator-report-apr-10 85/150
71
Annexures
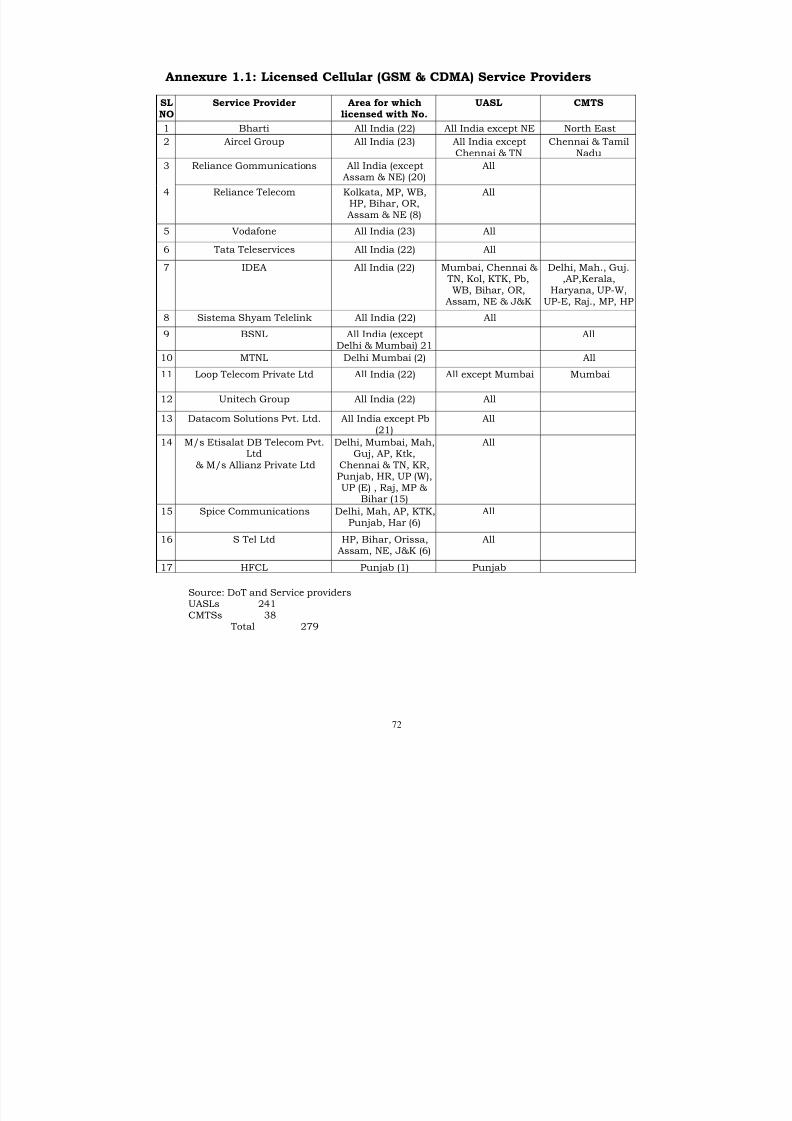
8/9/2019 Indicator Report Apr 10
http://slidepdf.com/reader/full/indicator-report-apr-10 86/150
72
Annexure 1.1: Licensed Cellular (GSM & CDMA) Service Providers
Source: DoT and Service providersUASLs 241CMTSs 38
Total 279
SL NO
Service Provider Area for whichlicensed with No.
UASL CMTS
1 Bharti All India (22) All India except NE North East
2 Aircel Group All India (23) All India exceptChennai & TN
Chennai & TamilNadu
3 Reliance Gommunications All India (exceptAssam & NE) (20)
All
4 Reliance Telecom Kolkata, MP, WB,HP, Bihar, OR,Assam & NE (8)
All
5 Vodafone All India (23) All
6 Tata Teleservices All India (22) All
7 IDEA All India (22) Mumbai, Chennai & TN, Kol, KTK, Pb,
WB, Bihar, OR,Assam, NE & J&K
Delhi, Mah., Guj.,AP,Kerala,
Haryana, UP-W,UP-E, Raj., MP, HP
8 Sistema Shyam Telelink All India (22) All
9 BSNL All India (exceptDelhi & Mumbai) 21
All
10 MTNL Delhi Mumbai (2) All
11 Loop Telecom Private Ltd All India (22) All except Mumbai Mumbai
12 Unitech Group All India (22) All
13 Datacom Solutions Pvt. Ltd. All India except Pb(21)
All
14 M/s Etisalat DB Telecom Pvt.Ltd
& M/s Allianz Private Ltd
Delhi, Mumbai, Mah,Guj, AP, Ktk,
Chennai & TN, KR,Punjab, HR, UP (W),UP (E) , Raj, MP &
Bihar (15)
All
15 Spice Communications Delhi, Mah, AP, KTK,Punjab, Har (6)
All
16 S Tel Ltd HP, Bihar, Orissa,Assam, NE, J&K (6)
All
17 HFCL Punjab (1) Punjab
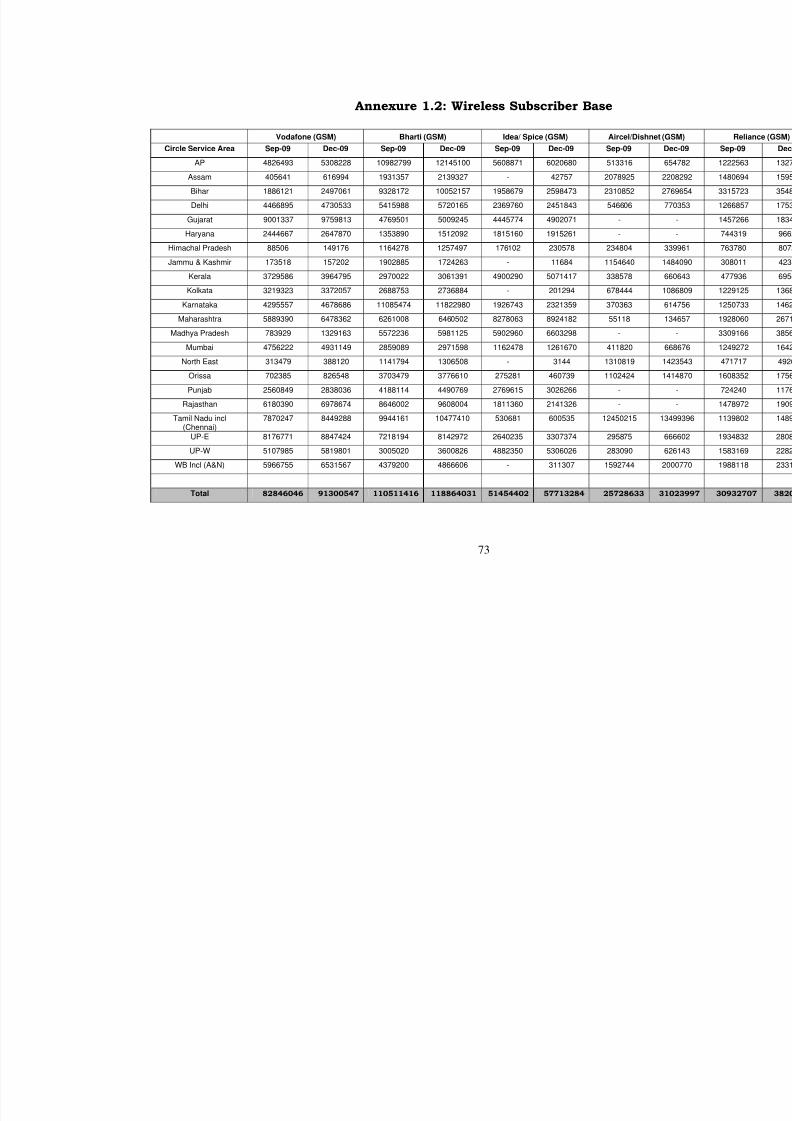
8/9/2019 Indicator Report Apr 10
http://slidepdf.com/reader/full/indicator-report-apr-10 87/150
73
Annexure 1.2: Wireless Subscriber Base
Vodafone (GSM) Bharti (GSM) Idea/ Spice (GSM) Aircel/Dishn
Circle Service Area Sep-09 Dec-09 Sep-09 Dec-09 Sep-09 Dec-09 Sep-09
AP 4826493 5308228 10982799 12145100 5608871 6020680 513316
Assam 405641 616994 1931357 2139327 - 42757 2078925
Bihar 1886121 2497061 9328172 10052157 1958679 2598473 2310852
Delhi 4466895 4730533 5415988 5720165 2369760 2451843 546606
Gujarat 9001337 9759813 4769501 5009245 4445774 4902071 -
Haryana 2444667 2647870 1353890 1512092 1815160 1915261 -
Himachal Pradesh 88506 149176 1164278 1257497 176102 230578 234804
Jammu & Kashmir 173518 157202 1902885 1724263 - 11684 1154640
Kerala 3729586 3964795 2970022 3061391 4900290 5071417 338578
Kolkata 3219323 3372057 2688753 2736884 - 201294 678444 Karnataka 4295557 4678686 11085474 11822980 1926743 2321359 370363
Maharashtra 5889390 6478362 6261008 6460502 8278063 8924182 55118
Madhya Pradesh 783929 1329163 5572236 5981125 5902960 6603298 -
Mumbai 4756222 4931149 2859089 2971598 1162478 1261670 411820
North East 313479 388120 1141794 1306508 - 3144 1310819
Orissa 702385 826548 3703479 3776610 275281 460739 1102424
Punjab 2560849 2838036 4188114 4490769 2769615 3026266 -
Rajasthan 6180390 6978674 8646002 9608004 1811360 2141326 -
Tamil Nadu incl(Chennai)
7870247 8449288 9944161 10477410 530681 600535 12450215
UP-E 8176771 8847424 7218194 8142972 2640235 3307374 295875
UP-W 5107985 5819801 3005020 3600826 4882350 5306026 283090
WB Incl (A&N) 5966755 6531567 4379200 4866606 - 311307 1592744
Total 82846046 91300547 110511416 118864031 51454402 57713284 25728633
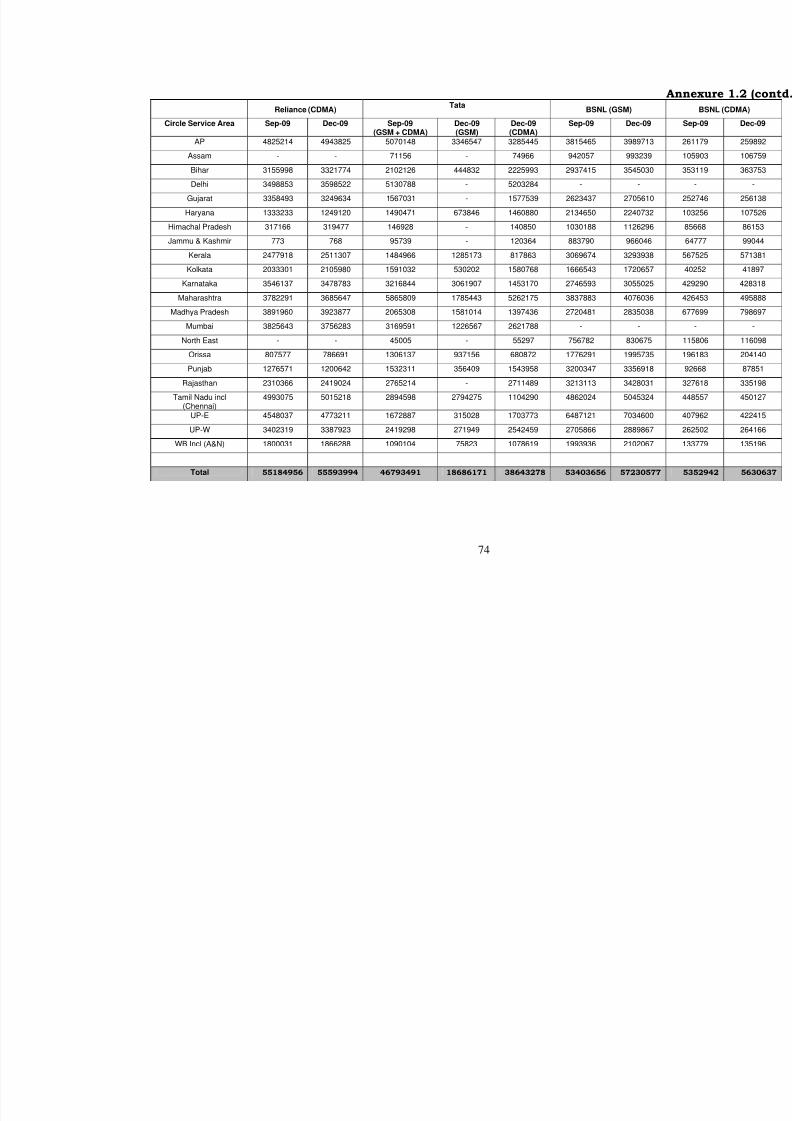
8/9/2019 Indicator Report Apr 10
http://slidepdf.com/reader/full/indicator-report-apr-10 88/150
74
Reliance (CDMA)Tata
BSNL (GSM)
Circle Service Area Sep-09 Dec-09 Sep-09(GSM + CDMA)
Dec-09(GSM)
Dec-09(CDMA)
Sep-09 Dec-09
AP 4825214 4943825 5070148 3346547 3285445 3815465 3989713
Assam - - 71156 - 74966 942057 993239
Bihar 3155998 3321774 2102126 444832 2225993 2937415 3545030
Delhi 3498853 3598522 5130788 - 5203284 - -
Gujarat 3358493 3249634 1567031 - 1577539 2623437 2705610
Haryana 1333233 1249120 1490471 673846 1460880 2134650 2240732
Himachal Pradesh 317166 319477 146928 - 140850 1030188 1126296
Jammu & Kashmir 773 768 95739 - 120364 883790 966046
Kerala 2477918 2511307 1484966 1285173 817863 3069674 3293938
Kolkata 2033301 2105980 1591032 530202 1580768 1666543 1720657
Karnataka 3546137 3478783 3216844 3061907 1453170 2746593 3055025
Maharashtra 3782291 3685647 5865809 1785443 5262175 3837883 4076036
Madhya Pradesh 3891960 3923877 2065308 1581014 1397436 2720481 2835038
Mumbai 3825643 3756283 3169591 1226567 2621788 - -
North East - - 45005 - 55297 756782 830675
Orissa 807577 786691 1306137 937156 680872 1776291 1995735
Punjab 1276571 1200642 1532311 356409 1543958 3200347 3356918
Rajasthan 2310366 2419024 2765214 - 2711489 3213113 3428031
Tamil Nadu incl(Chennai)
4993075 5015218 2894598 2794275 1104290 4862024 5045324
UP-E 4548037 4773211 1672887 315028 1703773 6487121 7034600
UP-W 3402319 3387923 2419298 271949 2542459 2705866 2889867
WB Incl (A&N) 1800031 1866288 1090104 75823 1078619 1993936 2102067
Total 55184956 55593994 46793491 18686171 38643278 53403656 5723057
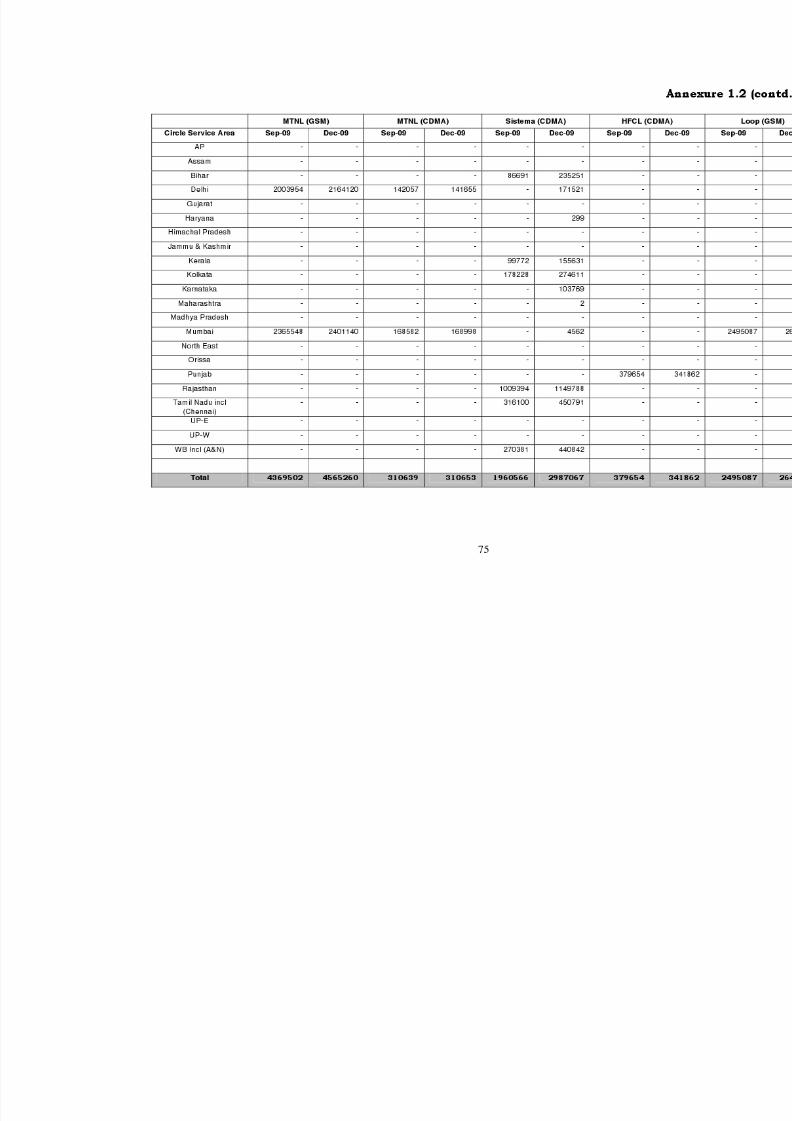
8/9/2019 Indicator Report Apr 10
http://slidepdf.com/reader/full/indicator-report-apr-10 89/150
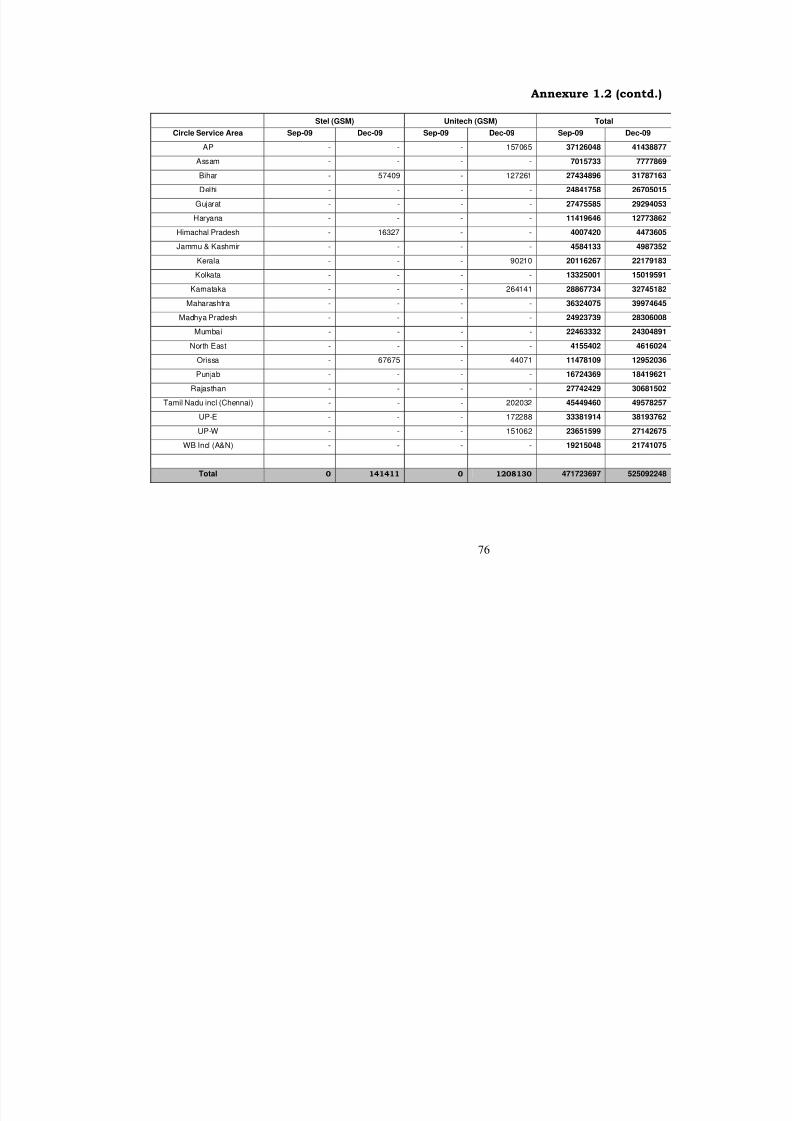
8/9/2019 Indicator Report Apr 10
http://slidepdf.com/reader/full/indicator-report-apr-10 90/150
76
Annexure 1.2 (contd
Stel (GSM) Unitech (GSM) Total
Circle Service Area Sep-09 Dec-09 Sep-09 Dec-09 Sep-09 Dec-09
AP - - - 157065 37126048 414388
Assam - - - - 7015733 77778
Bihar - 57409 - 127261 27434896 317871
Delhi - - - - 24841758 267050
Gujarat - - - - 27475585 292940
Haryana - - - - 11419646 127738
Himachal Pradesh - 16327 - - 4007420 44736
Jammu & Kashmir - - - - 4584133 49873
Kerala - - - 90210 20116267 221791
Kolkata - - - - 13325001 150195
Karnataka - - - 264141 28867734 327451
Maharashtra - - - - 36324075 399746
Madhya Pradesh - - - - 24923739 283060
Mumbai - - - - 22463332 243048
North East - - - - 4155402 46160
Orissa - 67675 - 44071 11478109 129520
Punjab - - - - 16724369 184196
Rajasthan - - - - 27742429 306815
Tamil Nadu incl (Chennai) - - - 202032 45449460 495782
UP-E - - - 172288 33381914 381937
UP-W - - - 151062 23651599 271426
WB Incl (A&N) - - - - 19215048 217410
Total 0 141411 0 1208130 471723697 5250922
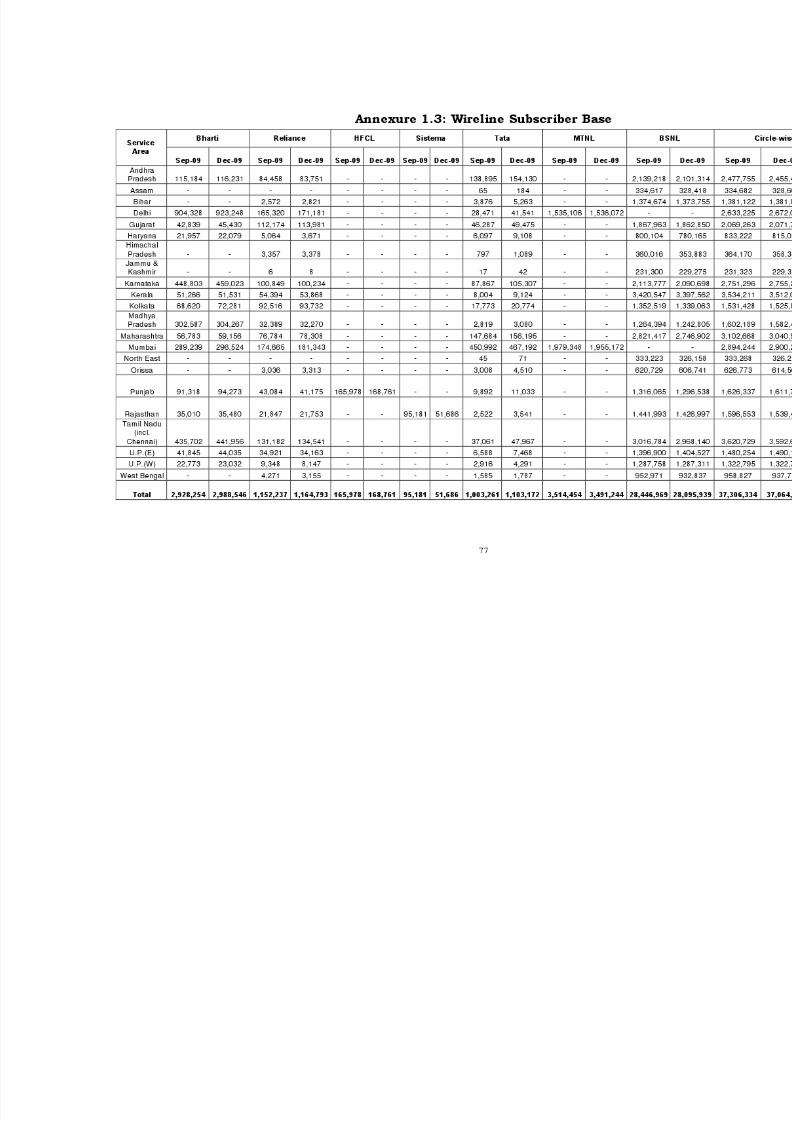
8/9/2019 Indicator Report Apr 10
http://slidepdf.com/reader/full/indicator-report-apr-10 91/150
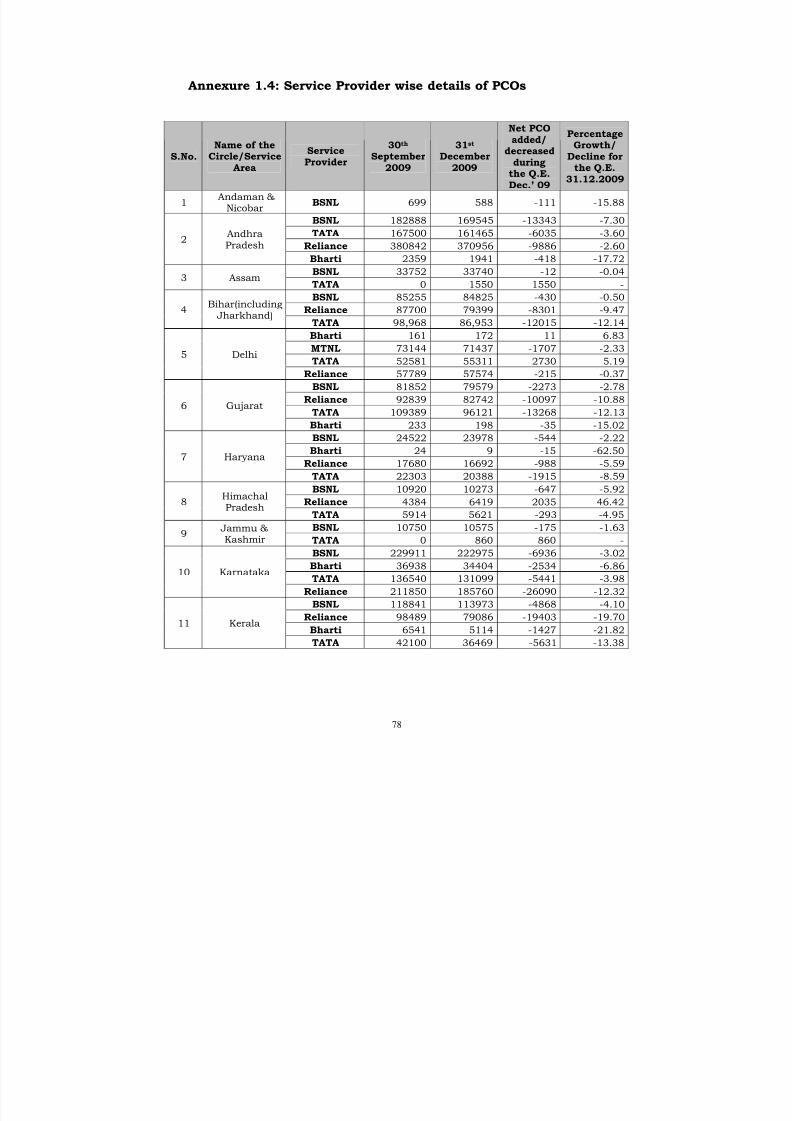
8/9/2019 Indicator Report Apr 10
http://slidepdf.com/reader/full/indicator-report-apr-10 92/150
78
Annexure 1.4: Service Provider wise details of PCOs
S.No.Name of the
Circle/ServiceArea
ServiceProvider
30th
September
2009
31st
December
2009
Net PCOadded/
decreasedduring
the Q.E.Dec.’ 09
Percentage
Growth/Decline for
the Q.E.31.12.2009
1Andaman &
NicobarBSNL 699 588 -111 -15.88
BSNL 182888 169545 -13343 -7.30
TATA 167500 161465 -6035 -3.60
Reliance 380842 370956 -9886 -2.602
AndhraPradesh
Bharti 2359 1941 -418 -17.72
BSNL 33752 33740 -12 -0.043 Assam
TATA 0 1550 1550 -
BSNL 85255 84825 -430 -0.50Reliance 87700 79399 -8301 -9.474
Bihar(including Jharkhand)
TATA 98,968 86,953 -12015 -12.14
Bharti 161 172 11 6.83
MTNL 73144 71437 -1707 -2.33
TATA 52581 55311 2730 5.195 Delhi
Reliance 57789 57574 -215 -0.37
BSNL 81852 79579 -2273 -2.78
Reliance 92839 82742 -10097 -10.88
TATA 109389 96121 -13268 -12.136 Gujarat
Bharti 233 198 -35 -15.02
BSNL 24522 23978 -544 -2.22Bharti 24 9 -15 -62.50
Reliance 17680 16692 -988 -5.597 Haryana
TATA 22303 20388 -1915 -8.59
BSNL 10920 10273 -647 -5.92
Reliance 4384 6419 2035 46.428HimachalPradesh
TATA 5914 5621 -293 -4.95
BSNL 10750 10575 -175 -1.639
Jammu &Kashmir TATA 0 860 860 -
BSNL 229911 222975 -6936 -3.02
Bharti 36938 34404 -2534 -6.86
TATA 136540 131099 -5441 -3.9810 Karnataka
Reliance 211850 185760 -26090 -12.32BSNL 118841 113973 -4868 -4.10
Reliance 98489 79086 -19403 -19.70
Bharti 6541 5114 -1427 -21.8211 Kerala
TATA 42100 36469 -5631 -13.38
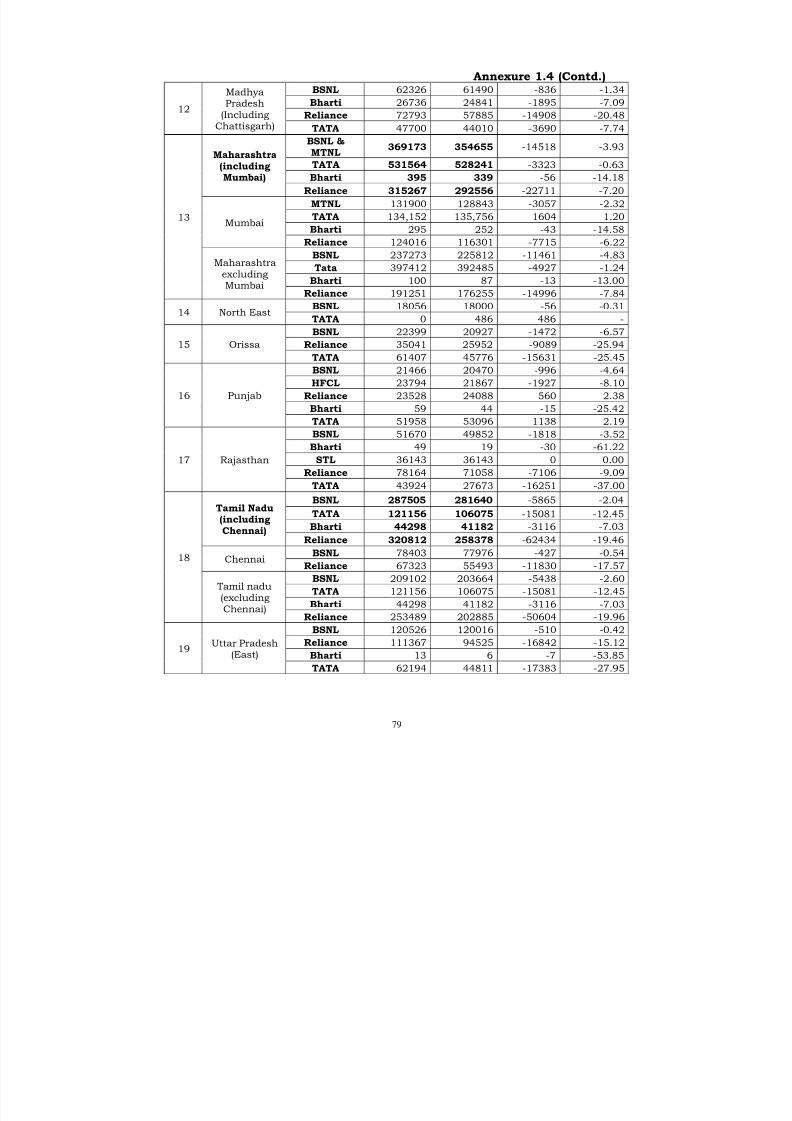
8/9/2019 Indicator Report Apr 10
http://slidepdf.com/reader/full/indicator-report-apr-10 93/150
79
Annexure 1.4 (Contd.)BSNL 62326 61490 -836 -1.34
Bharti 26736 24841 -1895 -7.09
Reliance 72793 57885 -14908 -20.4812
MadhyaPradesh
(IncludingChattisgarh) TATA 47700 44010 -3690 -7.74
BSNL &MTNL 369173 354655 -14518 -3.93
TATA 531564 528241 -3323 -0.63
Bharti 395 339 -56 -14.18
Maharashtra(includingMumbai)
Reliance 315267 292556 -22711 -7.20
MTNL 131900 128843 -3057 -2.32
TATA 134,152 135,756 1604 1.20
Bharti 295 252 -43 -14.58Mumbai
Reliance 124016 116301 -7715 -6.22
BSNL 237273 225812 -11461 -4.83
Tata 397412 392485 -4927 -1.24
Bharti 100 87 -13 -13.00
13
MaharashtraexcludingMumbai
Reliance 191251 176255 -14996 -7.84BSNL 18056 18000 -56 -0.31
14 North EastTATA 0 486 486 -
BSNL 22399 20927 -1472 -6.57
Reliance 35041 25952 -9089 -25.9415 Orissa
TATA 61407 45776 -15631 -25.45
BSNL 21466 20470 -996 -4.64
HFCL 23794 21867 -1927 -8.10
Reliance 23528 24088 560 2.38
Bharti 59 44 -15 -25.42
16 Punjab
TATA 51958 53096 1138 2.19
BSNL 51670 49852 -1818 -3.52
Bharti 49 19 -30 -61.22
STL 36143 36143 0 0.00
Reliance 78164 71058 -7106 -9.09
17 Rajasthan
TATA 43924 27673 -16251 -37.00
BSNL 287505 281640 -5865 -2.04
TATA 121156 106075 -15081 -12.45
Bharti 44298 41182 -3116 -7.03
Tamil Nadu(includingChennai)
Reliance 320812 258378 -62434 -19.46
BSNL 78403 77976 -427 -0.54Chennai
Reliance 67323 55493 -11830 -17.57
BSNL 209102 203664 -5438 -2.60
TATA 121156 106075 -15081 -12.45Bharti 44298 41182 -3116 -7.03
18
Tamil nadu(excludingChennai)
Reliance 253489 202885 -50604 -19.96
BSNL 120526 120016 -510 -0.42
Reliance 111367 94525 -16842 -15.12
Bharti 13 6 -7 -53.8519
Uttar Pradesh(East)
TATA 62194 44811 -17383 -27.95

8/9/2019 Indicator Report Apr 10
http://slidepdf.com/reader/full/indicator-report-apr-10 94/150
80
Annexure 1.4 (Contd.)
BSNL 56384 56012 -372 -0.66
Reliance 91602 77305 -14297 -15.61
Bharti 24 9 -15 -62.5020
Uttar Pradesh(West)
(includingUttranchal)
TATA 48877 45958 -2919 -5.97
BSNL 120025 117030 -2995 -2.50
Reliance 79710 68353 -11357 -14.25
Bharti 7 11 4 57.14
West Bengal(includingKolkata)
TATA 93451 91562 -1889 -2.02
BSNL 62284 61277 -1007 -1.62
Reliance 25029 22255 -2774 -11.08
Bharti 7 11 4 57.14Kolkata
TATA 41779 40515 -1264 -3.03
BSNL 57741 55753 -1988 -3.44
Reliance 54681 46098 -8583 -15.70
21
West Bengal(excludingKolkata) TATA 51672 51047 -625 -1.21
TOTAL 5 937 221 5 520 132 - 417 089 -7.02
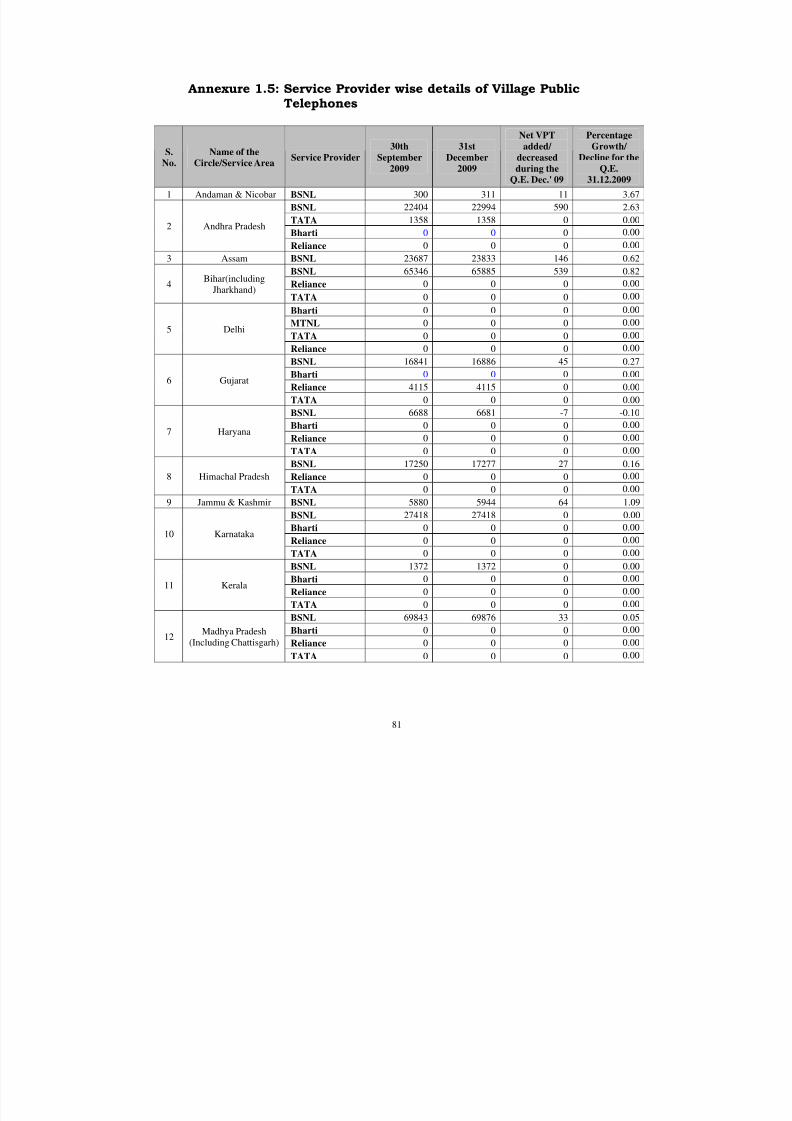
8/9/2019 Indicator Report Apr 10
http://slidepdf.com/reader/full/indicator-report-apr-10 95/150
81
Annexure 1.5: Service Provider wise details of Village PublicTelephones
S.
No.
Name of the
Circle/Service AreaService Provider
30thSeptember
2009
31stDecember
2009
Net VPT
added/ decreased
during the
Q.E. Dec.' 09
Percentage
Growth/ Decline for the
Q.E.
31.12.2009
1 Andaman & Nicobar BSNL 300 311 11 3.67
BSNL 22404 22994 590 2.63
TATA 1358 1358 0 0.00
Bharti 0 0 0 0.002 Andhra Pradesh
Reliance 0 0 0 0.00
3 Assam BSNL 23687 23833 146 0.62
BSNL 65346 65885 539 0.82
Reliance 0 0 0 0.004Bihar(including
Jharkhand)TATA 0 0 0 0.00
Bharti 0 0 0 0.00
MTNL 0 0 0 0.00
TATA 0 0 0 0.005 Delhi
Reliance 0 0 0 0.00
BSNL 16841 16886 45 0.27
Bharti 0 0 0 0.00
Reliance 4115 4115 0 0.006 Gujarat
TATA 0 0 0 0.00
BSNL 6688 6681 -7 -0.10
Bharti 0 0 0 0.00
Reliance 0 0 0 0.00
7 Haryana
TATA 0 0 0 0.00
BSNL 17250 17277 27 0.16
Reliance 0 0 0 0.008 Himachal Pradesh
TATA 0 0 0 0.00
9 Jammu & Kashmir BSNL 5880 5944 64 1.09
BSNL 27418 27418 0 0.00
Bharti 0 0 0 0.00
Reliance 0 0 0 0.0010 Karnataka
TATA 0 0 0 0.00
BSNL 1372 1372 0 0.00
Bharti 0 0 0 0.00
Reliance 0 0 0 0.0011 Kerala
TATA 0 0 0 0.00
BSNL 69843 69876 33 0.05
Bharti 0 0 0 0.00
Reliance 0 0 0 0.0012
Madhya Pradesh
(Including Chattisgarh)
TATA 0 0 0 0.00
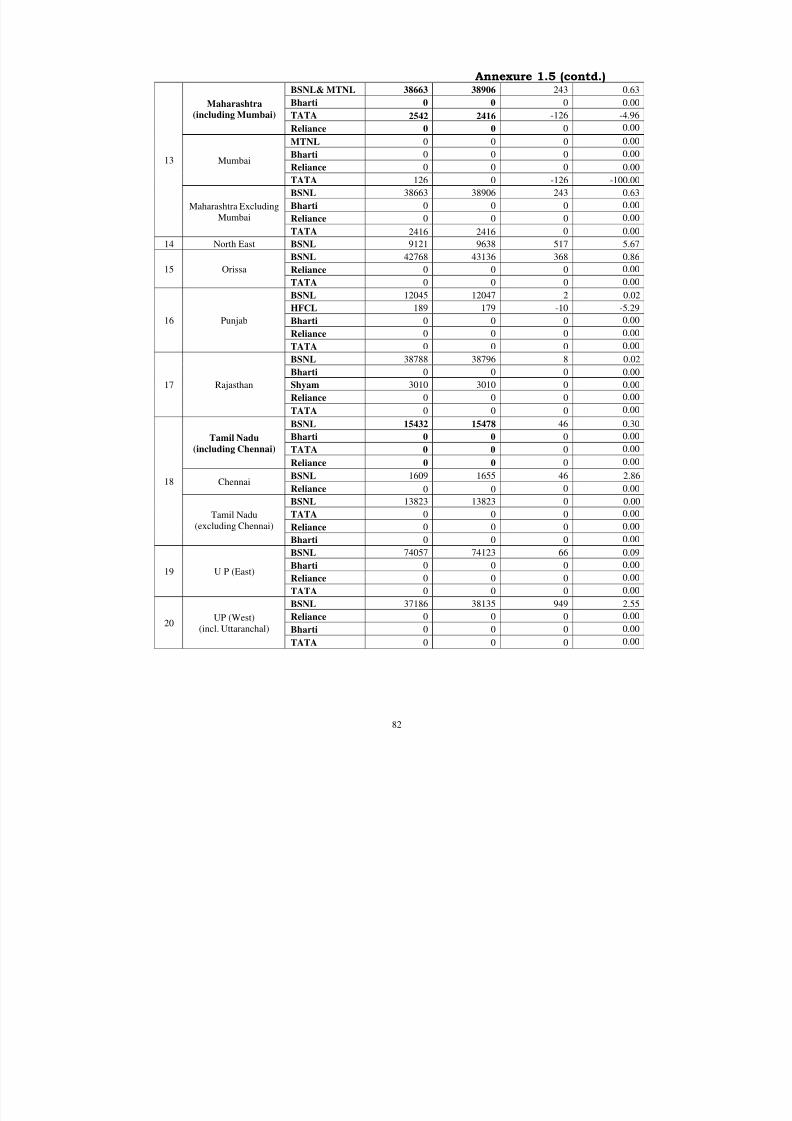
8/9/2019 Indicator Report Apr 10
http://slidepdf.com/reader/full/indicator-report-apr-10 96/150
82
Annexure 1.5 (contd.)BSNL& MTNL 38663 38906 243 0.63
Bharti 0 0 0 0.00
TATA 2542 2416 -126 -4.96
Maharashtra
(including Mumbai)
Reliance 0 0 0 0.00
MTNL 0 0 0 0.00
Bharti 0 0 0 0.00
Reliance 0 0 0 0.00Mumbai
TATA 126 0 -126 -100.00
BSNL 38663 38906 243 0.63
Bharti 0 0 0 0.00
Reliance 0 0 0 0.00
13
Maharashtra Excluding
Mumbai
TATA 2416 2416 0 0.00
14 North East BSNL 9121 9638 517 5.67
BSNL 42768 43136 368 0.86
Reliance 0 0 0 0.0015 Orissa
TATA 0 0 0 0.00
BSNL 12045 12047 2 0.02HFCL 189 179 -10 -5.29
Bharti 0 0 0 0.00
Reliance 0 0 0 0.00
16 Punjab
TATA 0 0 0 0.00
BSNL 38788 38796 8 0.02
Bharti 0 0 0 0.00
Shyam 3010 3010 0 0.00
Reliance 0 0 0 0.00
17 Rajasthan
TATA 0 0 0 0.00
BSNL 15432 15478 46 0.30
Bharti 0 0 0 0.00
TATA 0 0 0 0.00Tamil Nadu(including Chennai)
Reliance 0 0 0 0.00
BSNL 1609 1655 46 2.86Chennai
Reliance 0 0 0 0.00
BSNL 13823 13823 0 0.00
TATA 0 0 0 0.00
Reliance 0 0 0 0.00
18
Tamil Nadu
(excluding Chennai)
Bharti 0 0 0 0.00
BSNL 74057 74123 66 0.09
Bharti 0 0 0 0.00
Reliance 0 0 0 0.0019 U P (East)
TATA 0 0 0 0.00BSNL 37186 38135 949 2.55
Reliance 0 0 0 0.00
Bharti 0 0 0 0.0020
UP (West)
(incl. Uttaranchal)
TATA 0 0 0 0.00
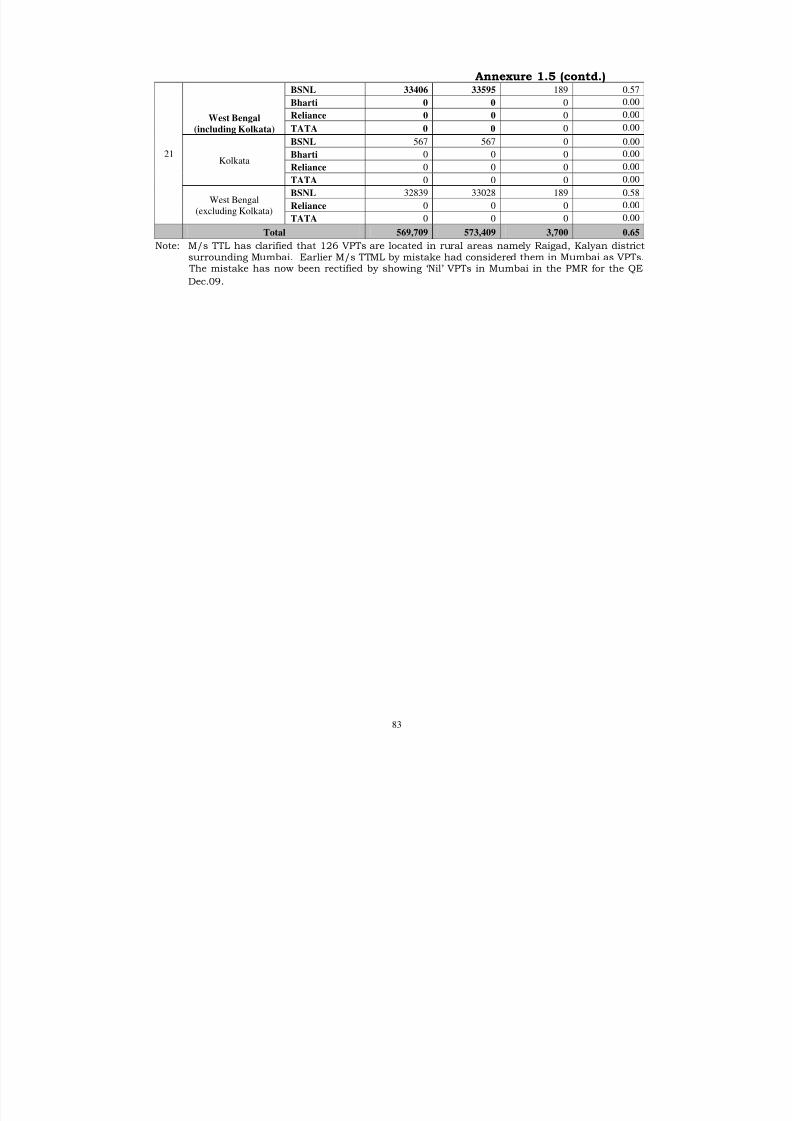
8/9/2019 Indicator Report Apr 10
http://slidepdf.com/reader/full/indicator-report-apr-10 97/150
83
Annexure 1.5 (contd.) BSNL 33406 33595 189 0.57
Bharti 0 0 0 0.00
Reliance 0 0 0 0.00West Bengal
(including Kolkata) TATA 0 0 0 0.00
BSNL 567 567 0 0.00
Bharti 0 0 0 0.00
Reliance 0 0 0 0.00Kolkata
TATA 0 0 0 0.00
BSNL 32839 33028 189 0.58
Reliance 0 0 0 0.00
21
West Bengal
(excluding Kolkata)TATA 0 0 0 0.00
Total 569,709 573,409 3,700 0.65
Note: M/s TTL has clarified that 126 VPTs are located in rural areas namely Raigad, Kalyan districtsurrounding Mumbai. Earlier M/s TTML by mistake had considered them in Mumbai as VPTs.
The mistake has now been rectified by showing ‘Nil’ VPTs in Mumbai in the PMR for the QE
Dec.09.
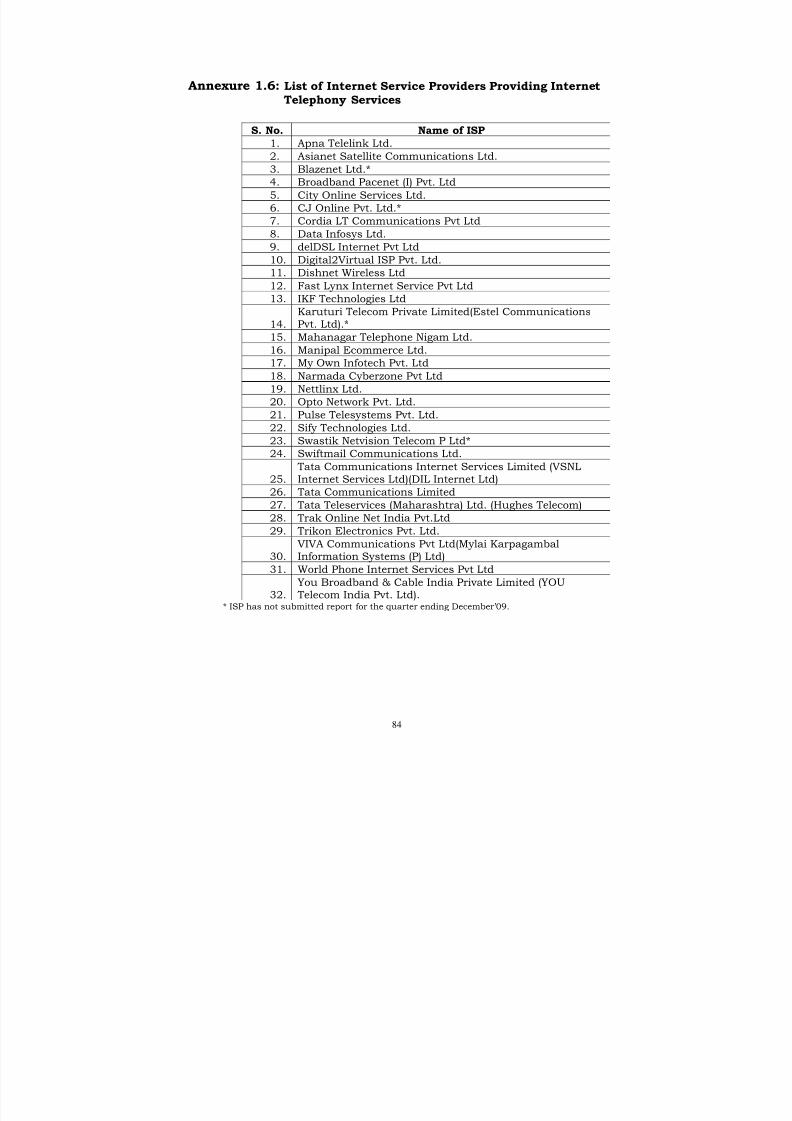
8/9/2019 Indicator Report Apr 10
http://slidepdf.com/reader/full/indicator-report-apr-10 98/150
84
Annexure 1.6: List of Internet Service Providers Providing InternetTelephony Services
S. No. Name of ISP
1. Apna Telelink Ltd.2. Asianet Satellite Communications Ltd.
3. Blazenet Ltd.*
4. Broadband Pacenet (I) Pvt. Ltd
5. City Online Services Ltd.
6. CJ Online Pvt. Ltd.*
7. Cordia LT Communications Pvt Ltd
8. Data Infosys Ltd.
9. delDSL Internet Pvt Ltd
10. Digital2Virtual ISP Pvt. Ltd.
11. Dishnet Wireless Ltd
12. Fast Lynx Internet Service Pvt Ltd
13. IKF Technologies Ltd
14. Karuturi Telecom Private Limited(Estel CommunicationsPvt. Ltd).*
15. Mahanagar Telephone Nigam Ltd.
16. Manipal Ecommerce Ltd.
17. My Own Infotech Pvt. Ltd
18. Narmada Cyberzone Pvt Ltd
19. Nettlinx Ltd.
20. Opto Network Pvt. Ltd.
21. Pulse Telesystems Pvt. Ltd.
22. Sify Technologies Ltd.
23. Swastik Netvision Telecom P Ltd*24. Swiftmail Communications Ltd.
25. Tata Communications Internet Services Limited (VSNL Internet Services Ltd)(DIL Internet Ltd)
26. Tata Communications Limited
27. Tata Teleservices (Maharashtra) Ltd. (Hughes Telecom)
28. Trak Online Net India Pvt.Ltd
29. Trikon Electronics Pvt. Ltd.
30. VIVA Communications Pvt Ltd(Mylai KarpagambalInformation Systems (P) Ltd)
31. World Phone Internet Services Pvt Ltd
32. You Broadband & Cable India Private Limited (YOU
Telecom India Pvt. Ltd).* ISP has not submitted report for the quarter ending December’09.
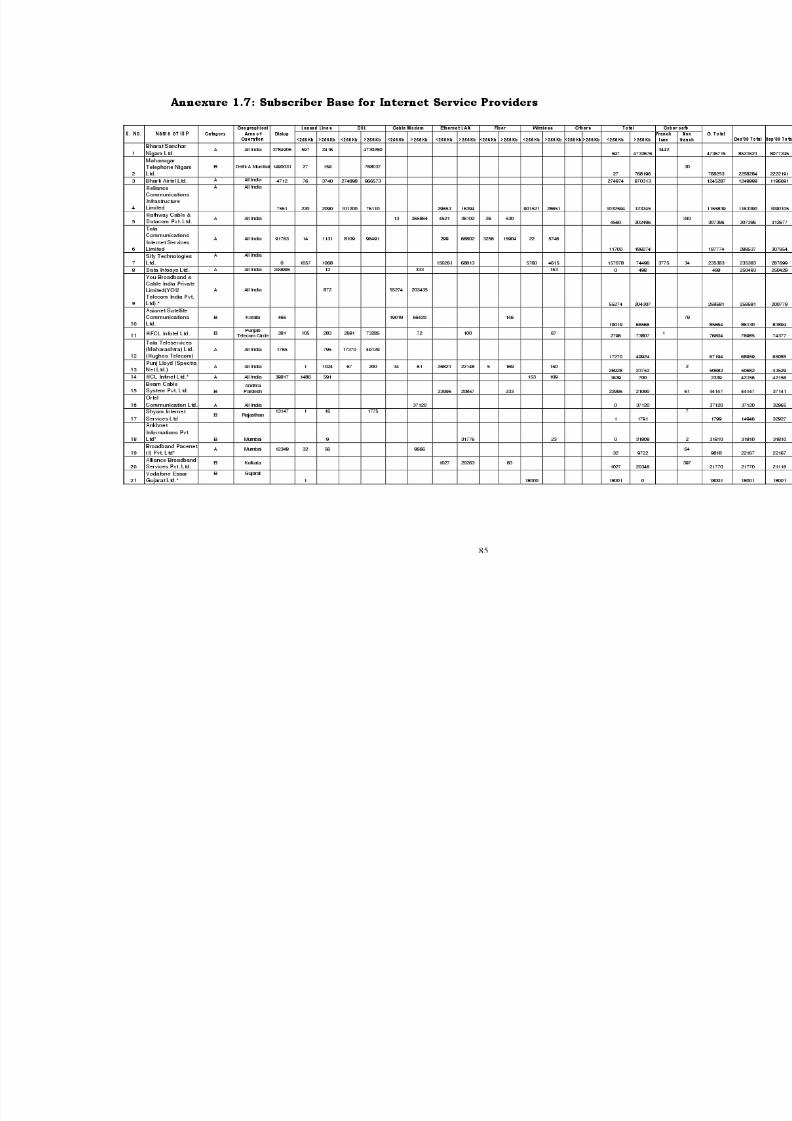
8/9/2019 Indicator Report Apr 10
http://slidepdf.com/reader/full/indicator-report-apr-10 99/150
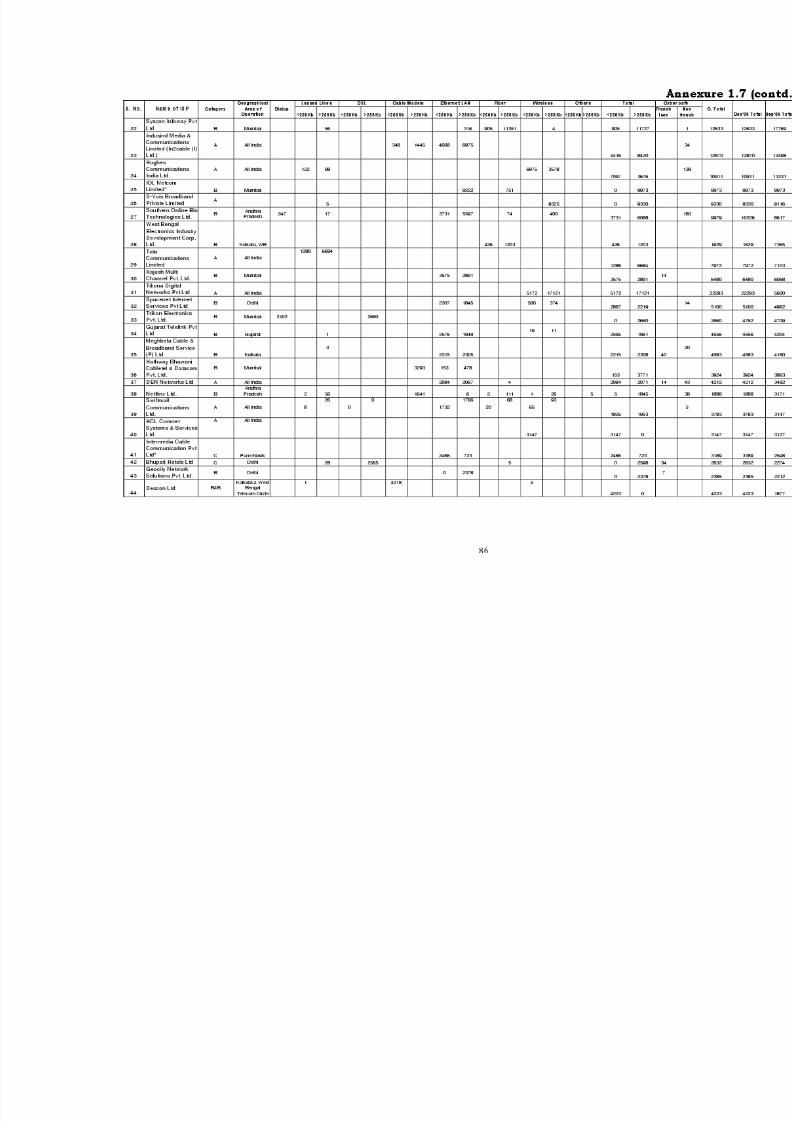
8/9/2019 Indicator Report Apr 10
http://slidepdf.com/reader/full/indicator-report-apr-10 100/150
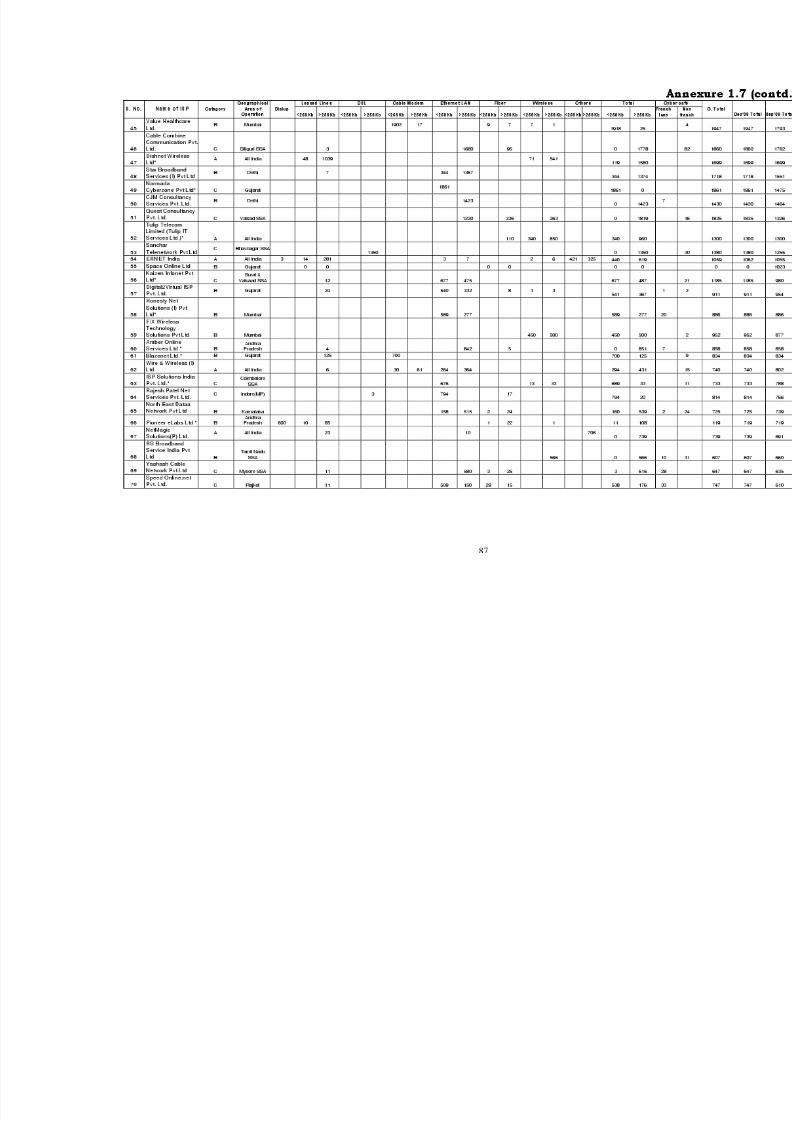
8/9/2019 Indicator Report Apr 10
http://slidepdf.com/reader/full/indicator-report-apr-10 101/150
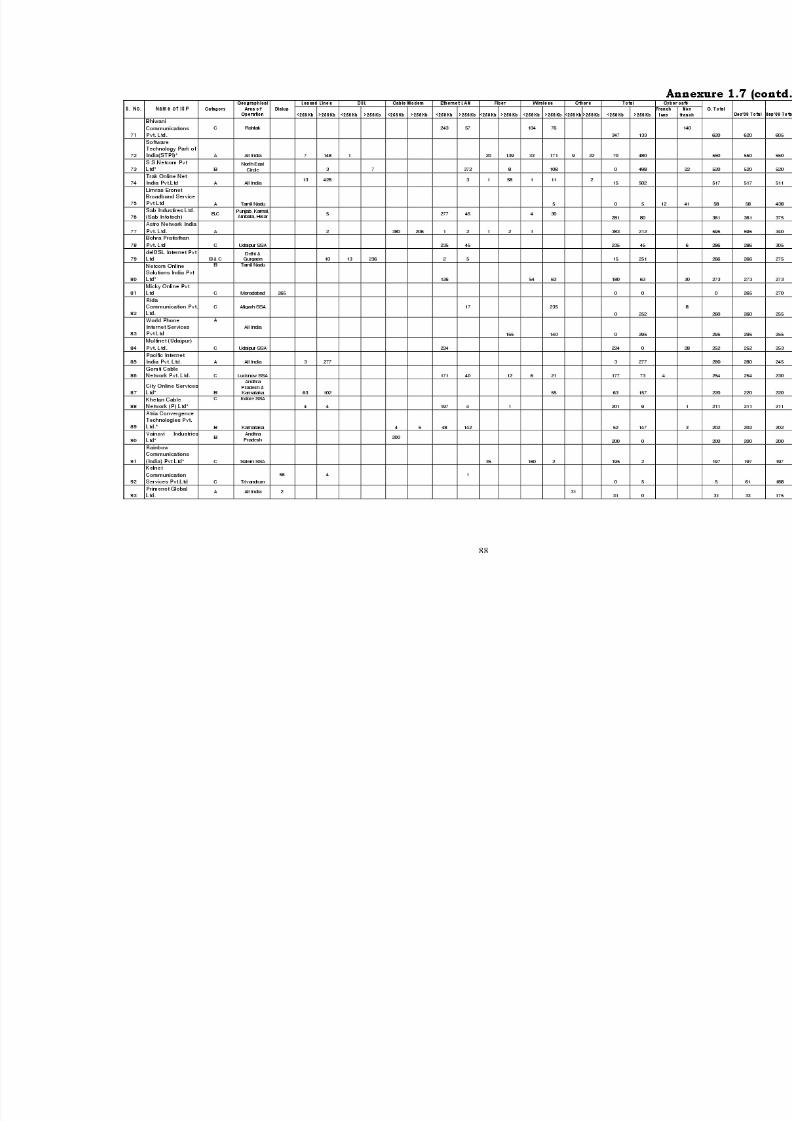
8/9/2019 Indicator Report Apr 10
http://slidepdf.com/reader/full/indicator-report-apr-10 102/150
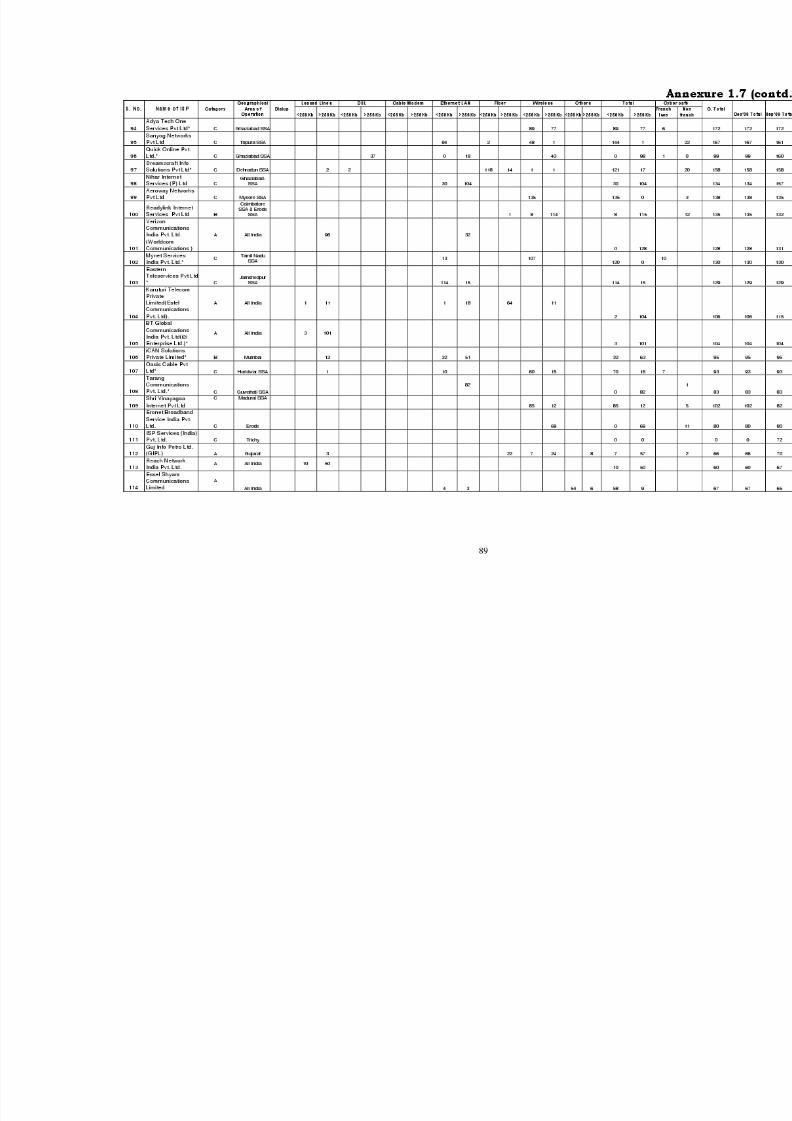
8/9/2019 Indicator Report Apr 10
http://slidepdf.com/reader/full/indicator-report-apr-10 103/150
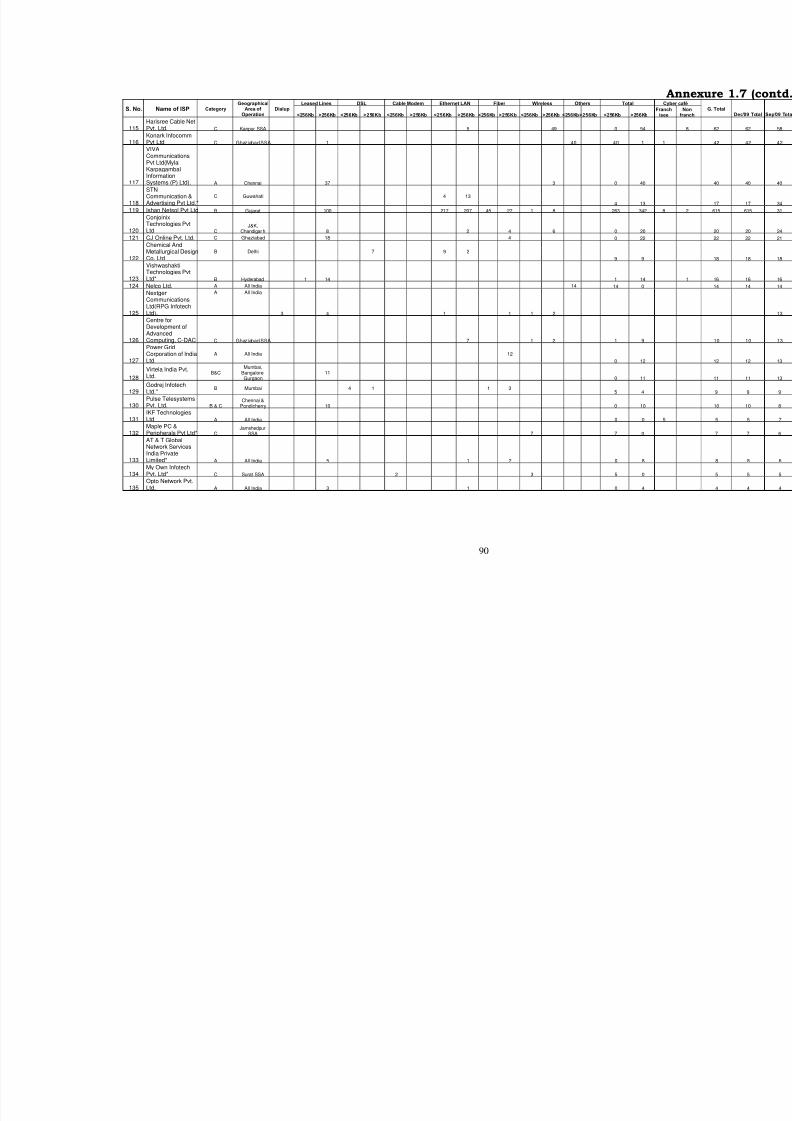
8/9/2019 Indicator Report Apr 10
http://slidepdf.com/reader/full/indicator-report-apr-10 104/150
90
Leased Lines DSL Cable Modem Ethernet LAN Fiber Wireless Others Total
S. No. Name of ISP CategoryGeographical
Area of Operation
Dialup
<256Kb >256Kb <256Kb >256Kb <256Kb >256Kb <256Kb >256Kb <256Kb >256Kb <256Kb >256Kb <256Kb>256Kb <256Kb >256Kb
115Harisree Cable NetPvt. Ltd. C Kanpur SSA 5 49 0 54
116Konark InfocommPvt Ltd C Ghaziabad SSA 1 40 40 1
117
VIVACommunicationsPvt Ltd(MylaiKarpagambalInformationSystems (P) Ltd). A Chennai 37 3 0 40
118
STNCommunication &Advertising Pvt Ltd.*
C Guwahati 4 13
4 13
119 Ishan Netsol Pvt Ltd B Gujarat 100 217 207 45 27 1 8 263 342
120
ConjoinixTechnologies PvtLtd C
J&K,Chandigarh 8 2 4 6 0 20
121 CJ Online Pvt. Ltd. C Ghaziabad 18 4 0 22
122
Chemical AndMetallurgical DesignCo. Ltd
B Delhi 7 9 2
9 9
123
VishwashaktiTechnologies PvtLtd* B Hyderabad 1 14 1 14
124 Nelco Ltd. A All India 14 14 0
125
NextgenCommunicationsLtd(RPG InfotechLtd).
A All India
3 4 1 1 1 2
126
Centre forDevelopment ofAdvancedComputing, C-DAC C Ghaziabad SSA 7 1 2 1 9
127
Power GridCorporation of IndiaLtd.
A All India 12
0 12
128
Virtela India Pvt.Ltd.
B&CMumbai,
Bangalore,Gurgaon
110 11
129Godrej InfotechLtd.*
B Mumbai 4 1 1 35 4
130Pulse TelesystemsPvt. Ltd. B & C
Chennai &Pondicherry 10 0 10
131IKF TechnologiesLtd A All India 0 0
132Maple PC &Peripherals Pvt Ltd* C
JamshedpurSSA 7 7 0
133
AT & T GlobalNetwork ServicesIndia PrivateLimited* A All India 5 1 2 0 8
134My Own InfotechPvt. Ltd* C Surat SSA 2 3 5 0
135Opto Network Pvt.Ltd. A All India 3 1 0 4
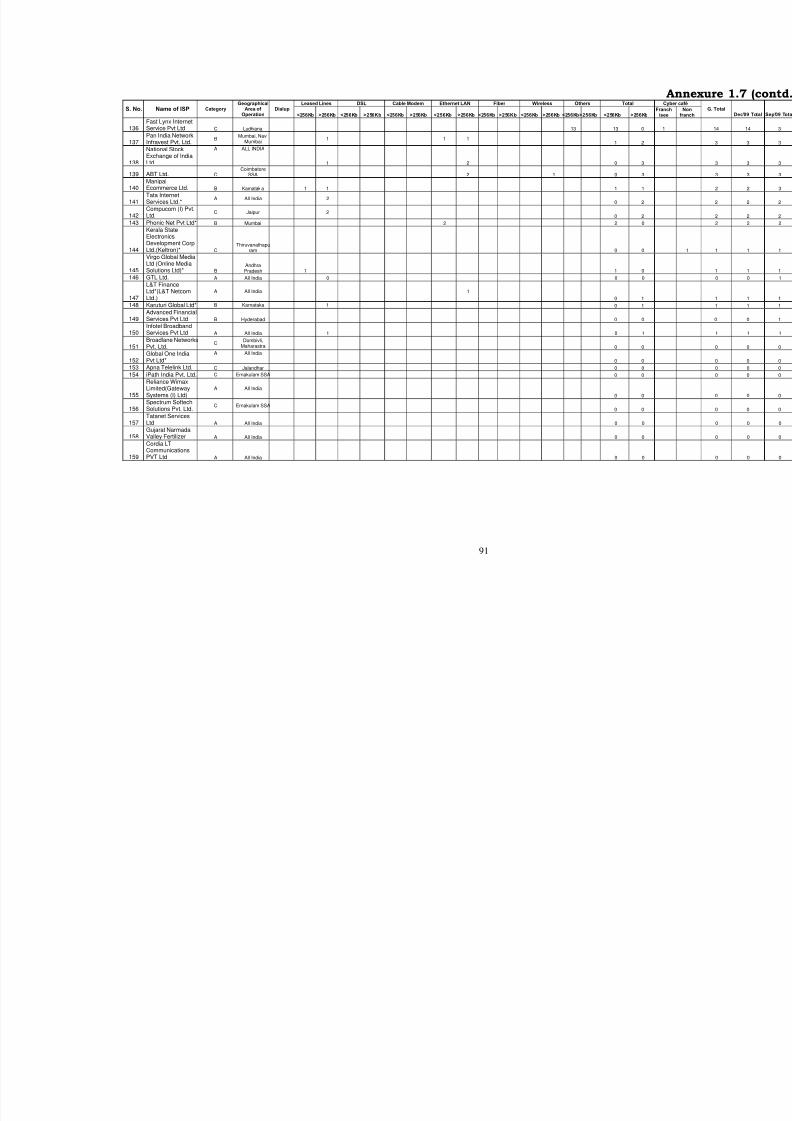
8/9/2019 Indicator Report Apr 10
http://slidepdf.com/reader/full/indicator-report-apr-10 105/150
91
Leased Lines DSL Cable Modem Ethernet LAN Fiber Wireless Others Total
S. No. Name of ISP CategoryGeographical
Area of Operation
Dialup
<256Kb >256Kb <256Kb >256Kb <256Kb >256Kb <256Kb >256Kb <256Kb >256Kb <256Kb >256Kb <256Kb>256Kb <256Kb >256Kb
136Fast Lynx InternetService Pvt Ltd C Ludhiana 13 13 0
137Pan India NetworkInfravest Pvt. Ltd.
BMumbai, Navi
Mumbai1 1 1
1 2
138
National StockExchange of IndiaLtd
A ALL INDIA
1 2 0 3
139 ABT Ltd. CCoimbatore
SSA 2 1 0 3
140ManipalEcommerce Ltd. B Karnatak a 1 1 1 1
141Tata InternetServices Ltd.*
A All India 20 2
142Compucom (I) Pvt.Ltd.
C Jaipur 20 2
143 Phonic Net Pvt Ltd* B Mumbai 2 2 0
144
Kerala StateElectronicsDevelopment CorpLtd.(Keltron)* C
Thiruvanathapuram 0 0
145
Virgo Global MediaLtd (Online MediaSolutions Ltd)* B
AndhraPradesh 1 1 0
146 GTL Ltd. A All India 0 0 0
147
L&T Finance
Ltd*(L&T NetcomLtd.) A All India 10 1
148 Karuturi Global Ltd* B Karnataka 1 0 1
149Advanced FinancialServices Pvt Ltd B Hyderabad 0 0
150Infotel BroadbandServices Pvt Ltd A All India 1 0 1
151Broadlane NetworksPvt. Ltd.
CDombivli,
Maharastra 0 0
152Global One IndiaPvt Ltd*
A All India
0 0
153 Apna Telelink Ltd. C Jalandhar 0 0
154 iPath India Pvt. Ltd. C Ernakulam SSA 0 0
155
Reliance WimaxLimited(GatewaySystems (I) Ltd)
A All India
0 0
156Spectrum SoftechSolutions Pvt. Ltd.
C Ernakulam SSA0 0
157Tatanet ServicesLtd A All India 0 0
158Gujarat NarmadaValley Fertilizer A All India 0 0
159
Cordia LTCommunicationsPVT Ltd A All India 0 0

8/9/2019 Indicator Report Apr 10
http://slidepdf.com/reader/full/indicator-report-apr-10 106/150
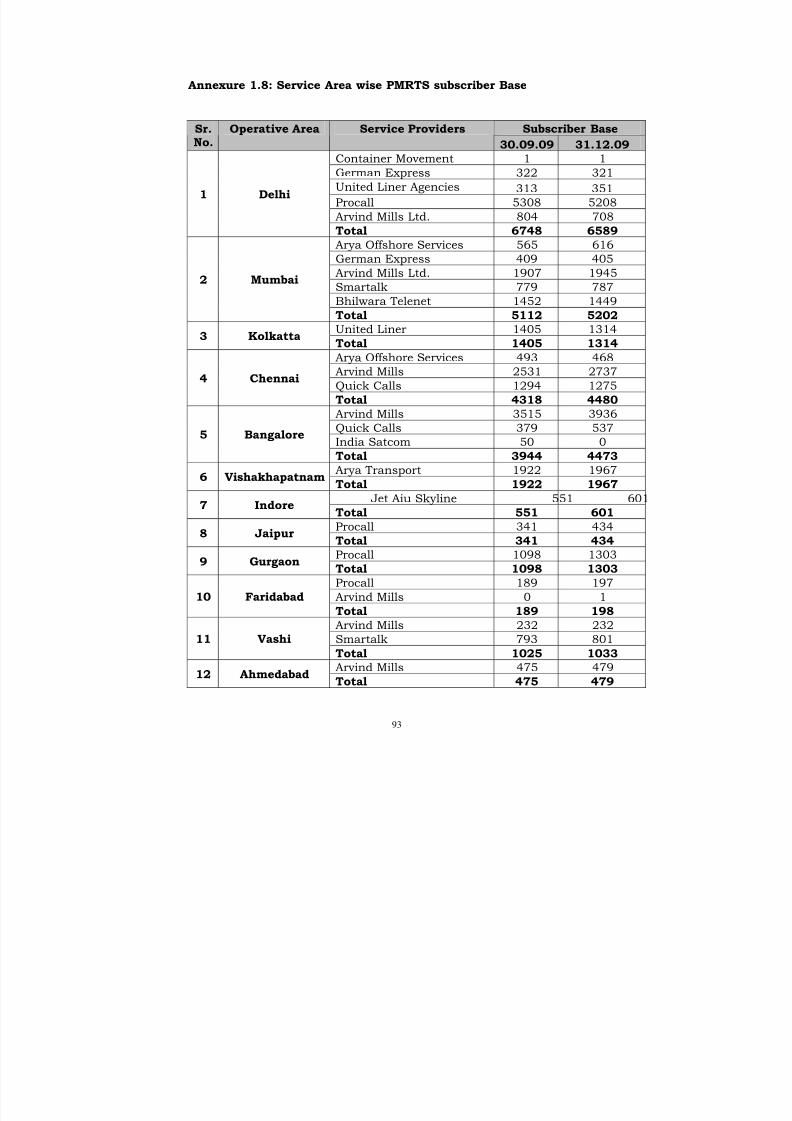
8/9/2019 Indicator Report Apr 10
http://slidepdf.com/reader/full/indicator-report-apr-10 107/150
93
Annexure 1.8: Service Area wise PMRTS subscriber Base
Subscriber BaseSr.
No.
Operative Area Service Providers
30.09.09 31.12.09Container Movement 1 1
German Express 322 321
United Liner Agencies 313 351
Procall 5308 5208
Arvind Mills Ltd. 804 708
1 Delhi
Total 6748 6589
Arya Offshore Services 565 616
German Express 409 405
Arvind Mills Ltd. 1907 1945
Smartalk 779 787
Bhilwara Telenet 1452 1449
2 Mumbai
Total 5112 5202United Liner 1405 1314
3 KolkattaTotal 1405 1314
Arya Offshore Services 493 468
Arvind Mills 2531 2737
Quick Calls 1294 12754 Chennai
Total 4318 4480
Arvind Mills 3515 3936
Quick Calls 379 537
India Satcom 50 05 Bangalore
Total 3944 4473
Arya Transport 1922 19676 Vishakhapatnam
Total 1922 1967
Jet Aiu Skyline 551 6017 Indore
Total 551 601
Procall 341 4348 Jaipur
Total 341 434Procall 1098 1303
9 GurgaonTotal 1098 1303
Procall 189 197
Arvind Mills 0 110 Faridabad
Total 189 198
Arvind Mills 232 232
Smartalk 793 80111 Vashi
Total 1025 1033Arvind Mills 475 479
12 AhmedabadTotal 475 479
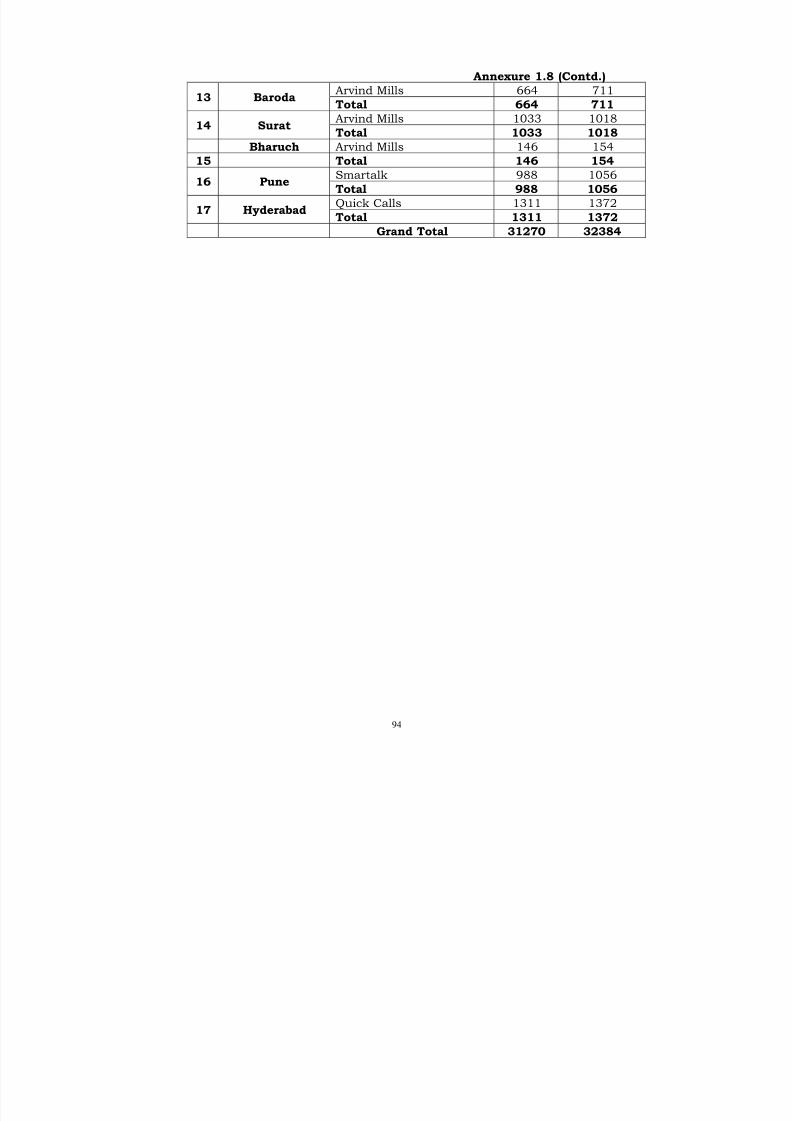
8/9/2019 Indicator Report Apr 10
http://slidepdf.com/reader/full/indicator-report-apr-10 108/150
94
Annexure 1.8 (Contd.)
Arvind Mills 664 71113 Baroda
Total 664 711
Arvind Mills 1033 101814 Surat
Total 1033 1018
Bharuch Arvind Mills 146 15415 Total 146 154
Smartalk 988 105616 Pune
Total 988 1056
Quick Calls 1311 137217 Hyderabad
Total 1311 1372
Grand Total 31270 32384
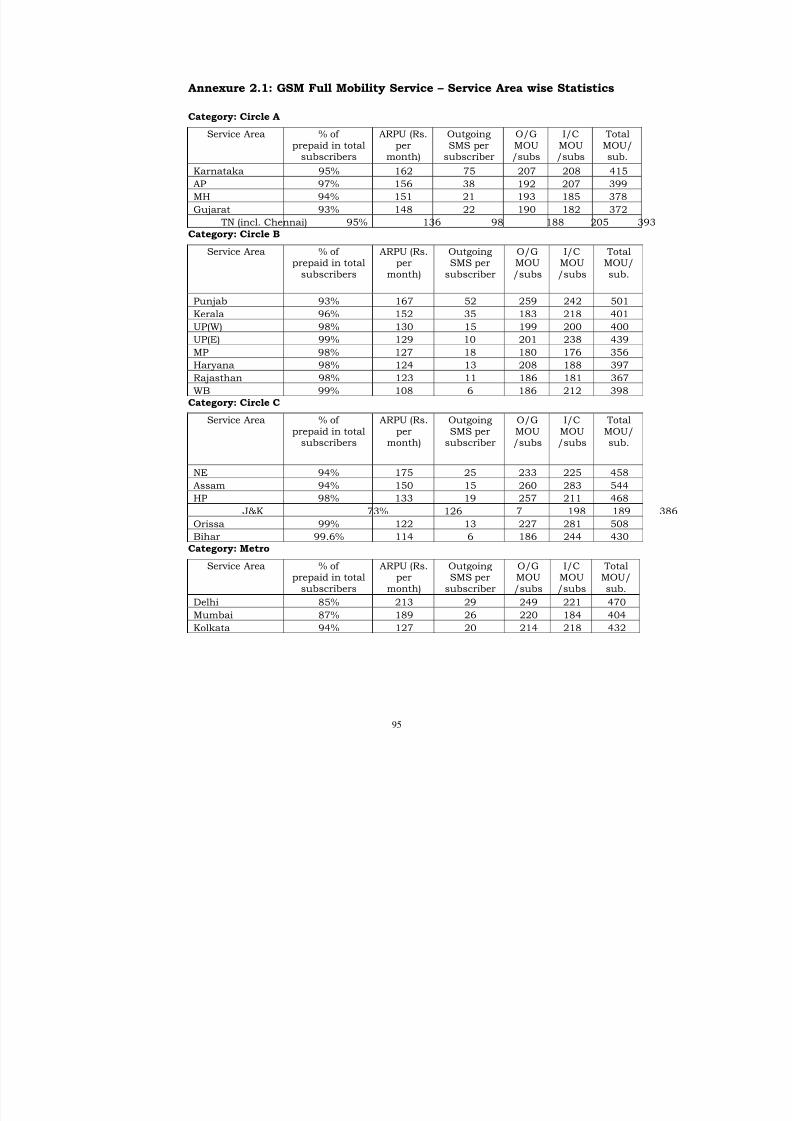
8/9/2019 Indicator Report Apr 10
http://slidepdf.com/reader/full/indicator-report-apr-10 109/150
95
Annexure 2.1: GSM Full Mobility Service – Service Area wise Statistics
Category: Circle A
Service Area % of
prepaid in totalsubscribers
ARPU (Rs.
permonth)
Outgoing
SMS persubscriber
O/G
MOU/subs
I/C
MOU/subs
Total
MOU/sub.
Karnataka 95% 162 75 207 208 415
AP 97% 156 38 192 207 399
MH 94% 151 21 193 185 378
Gujarat 93% 148 22 190 182 372
TN (incl. Chennai) 95% 136 98 188 205 393
Category: Circle B
Service Area % of prepaid in total
subscribers
ARPU (Rs.per
month)
OutgoingSMS per
subscriber
O/GMOU/subs
I/CMOU/subs
TotalMOU/sub.
Punjab 93% 167 52 259 242 501
Kerala 96% 152 35 183 218 401
UP(W) 98% 130 15 199 200 400
UP(E) 99% 129 10 201 238 439
MP 98% 127 18 180 176 356
Haryana 98% 124 13 208 188 397
Rajasthan 98% 123 11 186 181 367
WB 99% 108 6 186 212 398
Category: Circle C
Service Area % of prepaid in total
subscribers
ARPU (Rs.per
month)
OutgoingSMS per
subscriber
O/GMOU
/subs
I/CMOU
/subs
TotalMOU/
sub.
NE 94% 175 25 233 225 458
Assam 94% 150 15 260 283 544
HP 98% 133 19 257 211 468
J&K 73% 126 7 198 189
Orissa 99% 122 13 227 281 508
Bihar 99.6% 114 6 186 244 430
Category: Metro
Service Area % of prepaid in total
subscribers
ARPU (Rs.per
month)
OutgoingSMS per
subscriber
O/GMOU
/subs
I/CMOU
/subs
TotalMOU/
sub.Delhi 85% 213 29 249 221 470
Mumbai 87% 189 26 220 184 404
Kolkata 94% 127 20 214 218 432
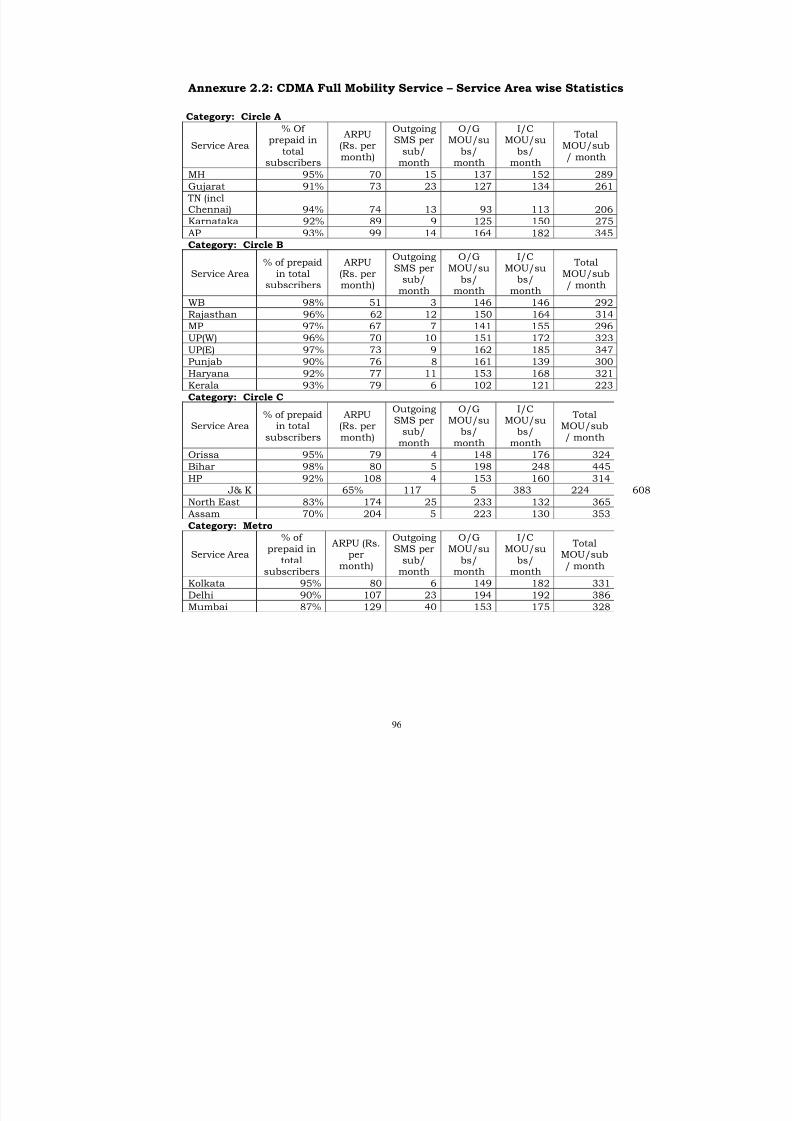
8/9/2019 Indicator Report Apr 10
http://slidepdf.com/reader/full/indicator-report-apr-10 110/150
96
Annexure 2.2: CDMA Full Mobility Service – Service Area wise Statistics
Category: Circle A
Category: Circle B
Service Area% of prepaid
in totalsubscribers
ARPU(Rs. permonth)
OutgoingSMS per
sub/
month
O/GMOU/su
bs/
month
I/CMOU/su
bs/
month
TotalMOU/sub/ month
WB 98% 51 3 146 146 292
Rajasthan 96% 62 12 150 164 314
MP 97% 67 7 141 155 296
UP(W) 96% 70 10 151 172 323
UP(E) 97% 73 9 162 185 347
Punjab 90% 76 8 161 139 300
Haryana 92% 77 11 153 168 321
Kerala 93% 79 6 102 121 223
Category: Circle C
Service Area% of prepaid
in total
subscribers
ARPU(Rs. per
month)
OutgoingSMS per
sub/
month
O/GMOU/su
bs/
month
I/CMOU/su
bs/
month
TotalMOU/sub
/ monthOrissa 95% 79 4 148 176 324
Bihar 98% 80 5 198 248 445
HP 92% 108 4 153 160 314
J& K 65% 117 5 383 224 608
North East 83% 174 25 233 132 365
Assam 70% 204 5 223 130 353
Category: Metro
Service Area
% of prepaid in
totalsubscribers
ARPU (Rs.per
month)
OutgoingSMS per
sub/month
O/GMOU/su
bs/month
I/CMOU/su
bs/month
TotalMOU/sub/ month
Kolkata 95% 80 6 149 182 331
Delhi 90% 107 23 194 192 386
Mumbai 87% 129 40 153 175 328
Service Area
% Of prepaid in
totalsubscribers
ARPU
(Rs. permonth)
OutgoingSMS per
sub/month
O/GMOU/su
bs/month
I/CMOU/su
bs/month
Total
MOU/sub/ month
MH 95% 70 15 137 152 289
Gujarat 91% 73 23 127 134 261
TN (inclChennai) 94% 74 13 93 113 206
Karnataka 92% 89 9 125 150 275
AP 93% 99 14 164 182 345
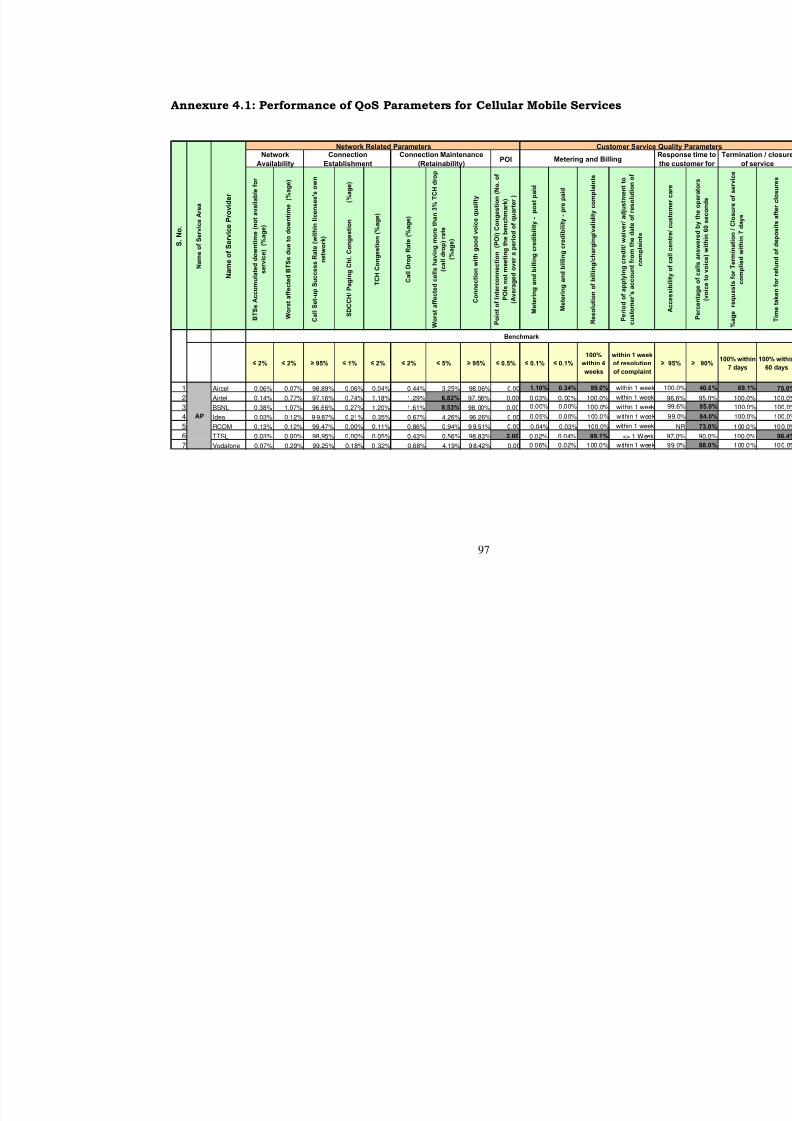
8/9/2019 Indicator Report Apr 10
http://slidepdf.com/reader/full/indicator-report-apr-10 111/150
97
Annexure 4.1: Performance of QoS Parameters for Cellular Mobile Services
POI
B T S s A c c
u m u l a t e d d o w n t i m e ( n o t a v a i l a b l e f o r
s e r v i c e ) ( % a g e )
W o r s t a f f e c t e d B T S s d u e t o d o w n t i m e ( % a g e )
C a l l S e t - u p S u c c e s s R a t e ( w i t h i n l i c e n s e e ' s o w n
n e t w o r k )
S D C C H /
P a g i n g C h l . C o n g e s t i o n
( % a g e )
T C H C o n g e s t i o n ( % a g e )
C a l l D r o p R a t e ( % a g e )
W o r s t a f f e c t e d c e l l s h a v i n g m o r e t h a n 3 % T C H d r o p
( c a l l d r o p ) r a t e
( % a g e )
C o n
n e c t i o n w i t h g o o d v o i c e q u a l i t y
P o i n t o f I n t
e r c o n n e c t i o n ( P O I ) C o n g e s t i o n ( N o . o f
P O
I s n o t m e e t i n g t h e b e n c h m a r k )
( A v e r a g e d o v e r a p e r i o d o f q u a r t e r )
M e t e r i n
g a n d b i l l i n g c r e d i b i l i t y - p o s t p a i d
M e t e r i
n g a n d b i l l i n g c r e d i b i l i t y - p r e p a i d
R e s o l u t i o n
o f b i l l i n g / c h a r g i n g / v a l i d i t y c o m p l a i n t s
P e r i o d o f
a p p l y i n g c r e d i t / w a i v e r / a d j u s t m e n t t o
c u s t o m e r ’ s
a c c o u n t f r o m t h e d a t e o f r e s o l u t i o n o f
c o m p l a i n t s
≤ 2% ≤ 2% ≥ 95% ≤ 1% ≤ 2% ≤ 2% ≤ 5% ≥ 95% ≤ 0.5% ≤ 0.1% ≤ 0.1%
100%
within 4
weeks
within 1 week
of resolution
of complaint
1 Aircel 0.06% 0.07% 98.89% 0.06% 0.04% 0.44% 3.25% 98.06% 0.00 1.10% 0.34% 99.0% within 1 week
2 Airtel 0.14% 0.77% 97.16% 0.74% 1.18% 1.29% 6.82% 97.56% 0.00 0.03% 0.00% 100.0% within 1 week
3 BSNL 0.38% 1.07% 96.66% 0.27% 1.20% 1.61% 8.53% 98.00% 0.00 0.00% 0.00% 100.0% within 1 week
4 Idea 0.03% 0.12% 9 9.87% 0.21% 0.35% 0.67% 4.26% 96.26% 0.00 0.05% 0.00% 100.0% within 1 week
5 RCOM 0.13% 0.12% 99.47% 0.00% 0.11% 0.86% 0.94% 9 9.51% 0.00 0.04% 0.03% 100.0% within 1 week
6 TTSL 0.03% 0.00% 98.95% 0.00% 0.05% 0.43% 0.56% 98.83% 2.00 0.02% 0.04% 89.1% <= 1 Week
7 Vodafone 0.07% 0.29% 99.25% 0.18% 0 .32% 0.68% 4.19% 98.42% 0.00 0.06% 0.02% 100.0% within 1 week
Benchmark
AP
S .
N o .
N a m e o f S e r v i c e A r e a
N a m e o f S e r v i c e P r o v i d e r
Network Related Parameters Customer ServiceNetwork
Availability
Connection
Establishment
Connection Maintenance
(Retainability)Metering and Billing
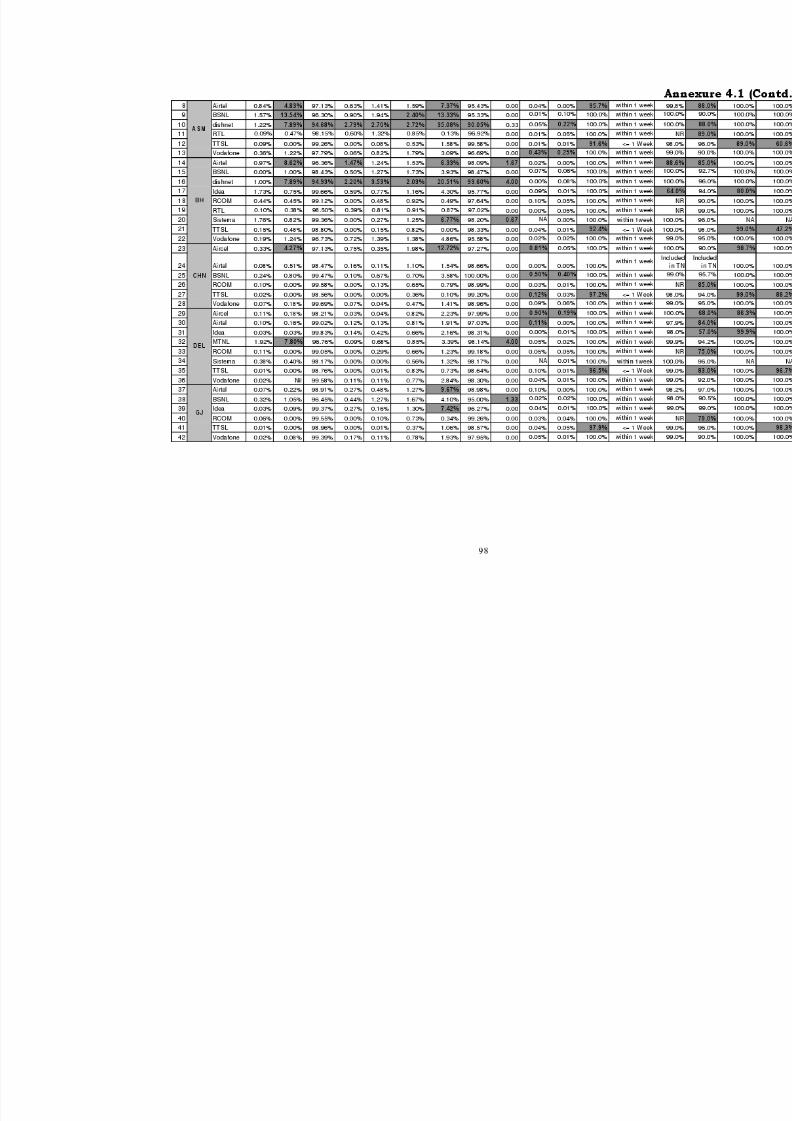
8/9/2019 Indicator Report Apr 10
http://slidepdf.com/reader/full/indicator-report-apr-10 112/150
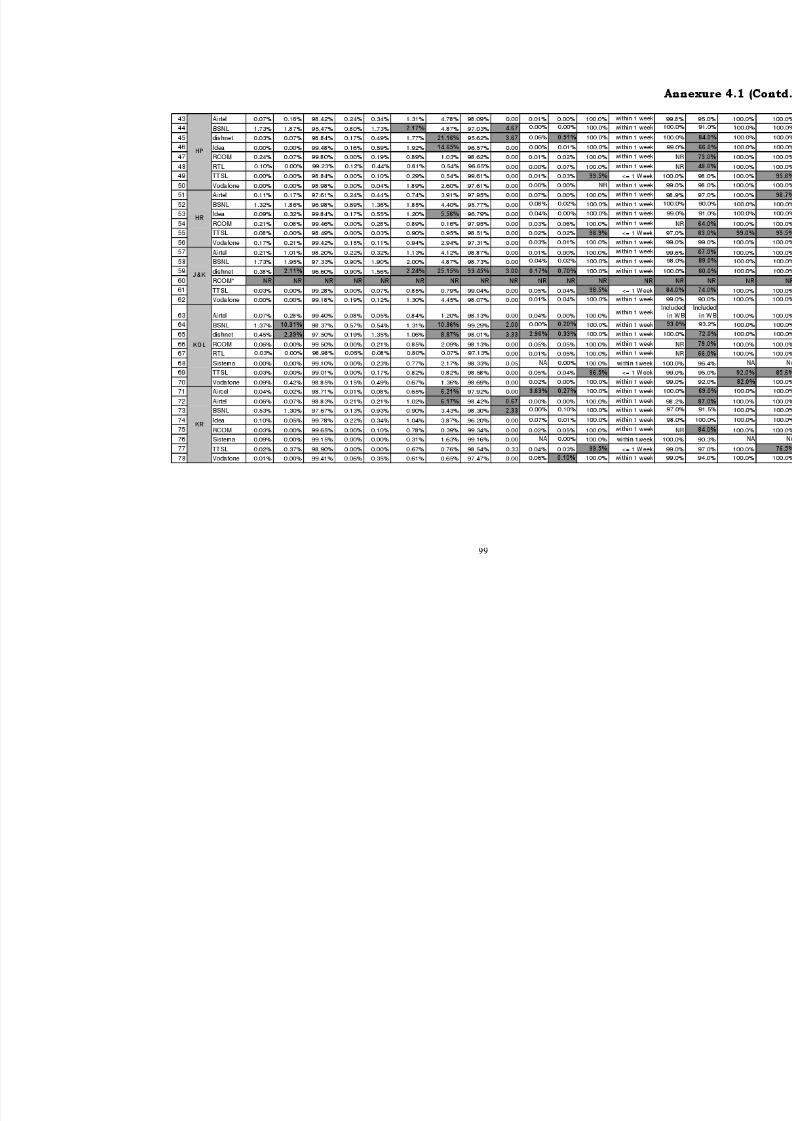
8/9/2019 Indicator Report Apr 10
http://slidepdf.com/reader/full/indicator-report-apr-10 113/150
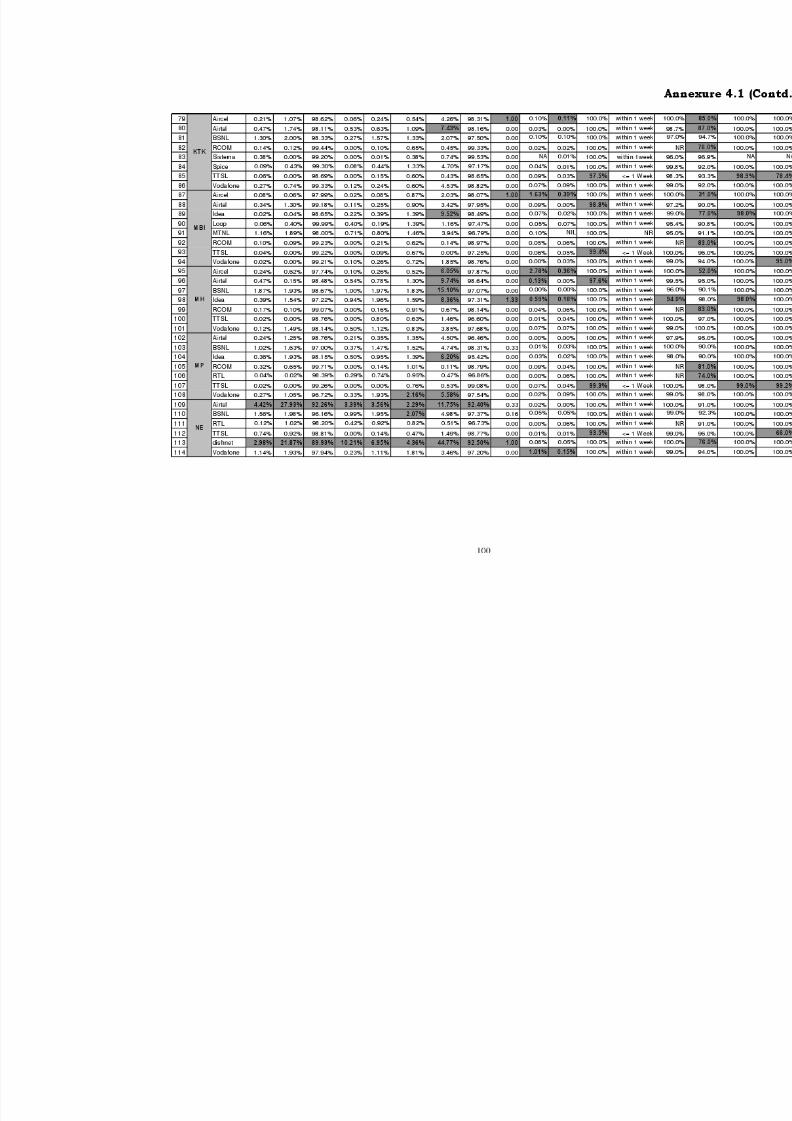
8/9/2019 Indicator Report Apr 10
http://slidepdf.com/reader/full/indicator-report-apr-10 114/150
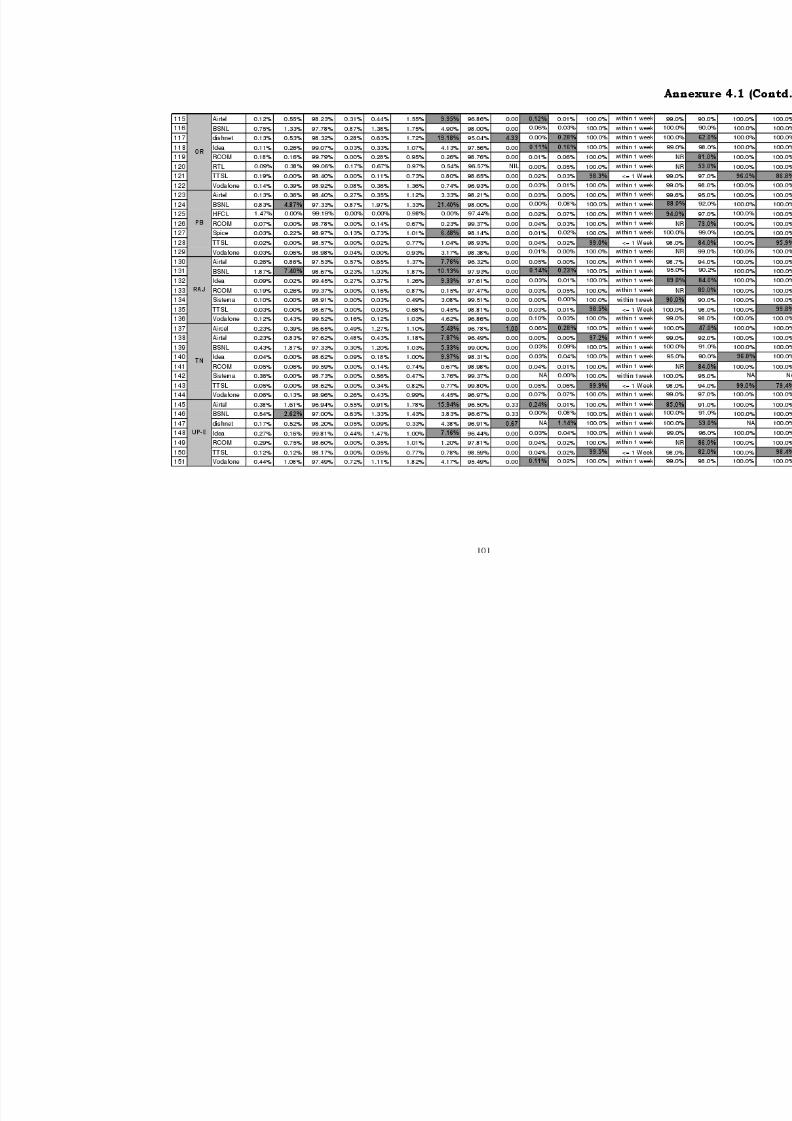
8/9/2019 Indicator Report Apr 10
http://slidepdf.com/reader/full/indicator-report-apr-10 115/150

8/9/2019 Indicator Report Apr 10
http://slidepdf.com/reader/full/indicator-report-apr-10 116/150
102
152 Airtel 0.23% 0.43% 96.78% 0.71% 1.56% 1.15% 4.39% 96.77% 0.00 0.20% 0.00% 100.0% within 1 week
153 BSNL 0.37% 1.87% 98.45% 0.88% 1.58% 1.04% 4.64% 97.67% 1.00 0.01% 0.48% 100.0% within 1 week
154 dishnet 0.18% 0.20% 98.23% 0.31% 0.14% 0.77% 4.31% 96.72% 0.00 NA 0.54% 100.0% within 1 week
155 Idea 0.18% 0.72% 99.76% 0.60% 1.38% 1.02% 6.18% 99.49% 0.00 0.05% 0.00% 100.0% within 1 week
156 RCOM 0.42% 0.86% 98.58% 0.00% 0.37% 0.98% 0.66% 98.23% 0.00 0.03% 0.06% 100.0% within 1 week
157 TTSL 0.07% 0.03% 98.60% 0.00% 0.09% 0.87% 0.54% 99.60% 0.00 0.02% 0.02% 99.0% <= 1 Week
158 Vodafone 0.39% 1.46% 97.47% 0.68% 1.42% 1.36% 3.53% 95.85% 0.00 0.01% 0.00% 100.0% within 1 week
159 Airtel 0.15% 0.56% 98.26% 0.57% 0.92% 1.62% 9.20% 97.37% 0.00 0.01% 0.00% 100.0% within 1 week
160 BSNL 0.83% 1.83% 98.00% 0.90% 1.13% 1.03% 4.60% 96.23% 0.00 0.02% 0.08% 100.0% within 1 week
161 dishnet 0.59% 3.94% 94.41% 1.03% 4.54% 2.24% 25.29% 93.91% 4.67 0.15% 0.17% 100.0% within 1 week
162 RCOM 0.24% 0.66% 99.29% 0.00% 0.24% 1.07% 0.32% 97.76% 0.00 0.04% 0.04% 100.0% within 1 week
163 RTL 0.06% 0.24% 99.16% 0.14% 0.53% 0.91% 0.30% 98.09% 0.00 0.00% 0.05% 100.0% within 1 week
164 Sistema 0.64% 1.52% 99.18% 0.00% 0.10% 0.90% 4.72% 97.83% 0.00 NA 0.00% 100.0% within 1week
165 TTSL 0.10% 0.26% 98.32% 0.00% 0.06% 0.84% 0.98% 98.64% 0.00 0.04% 0.02% 98.6% <= 1 Week
166 Vodafone 0.24% 1.25% 96.72% 0.86% 1.49% 1.55% 3.07% 96.28% 0.00 0.05% 0.00% 100.0% within 1 week
NR - Data Not Reported NA - Not Applicable
NOTE : * M/s RCOM has not reported the data for CDMA service in J&K service area
Benchmark not met
WB
UP-W
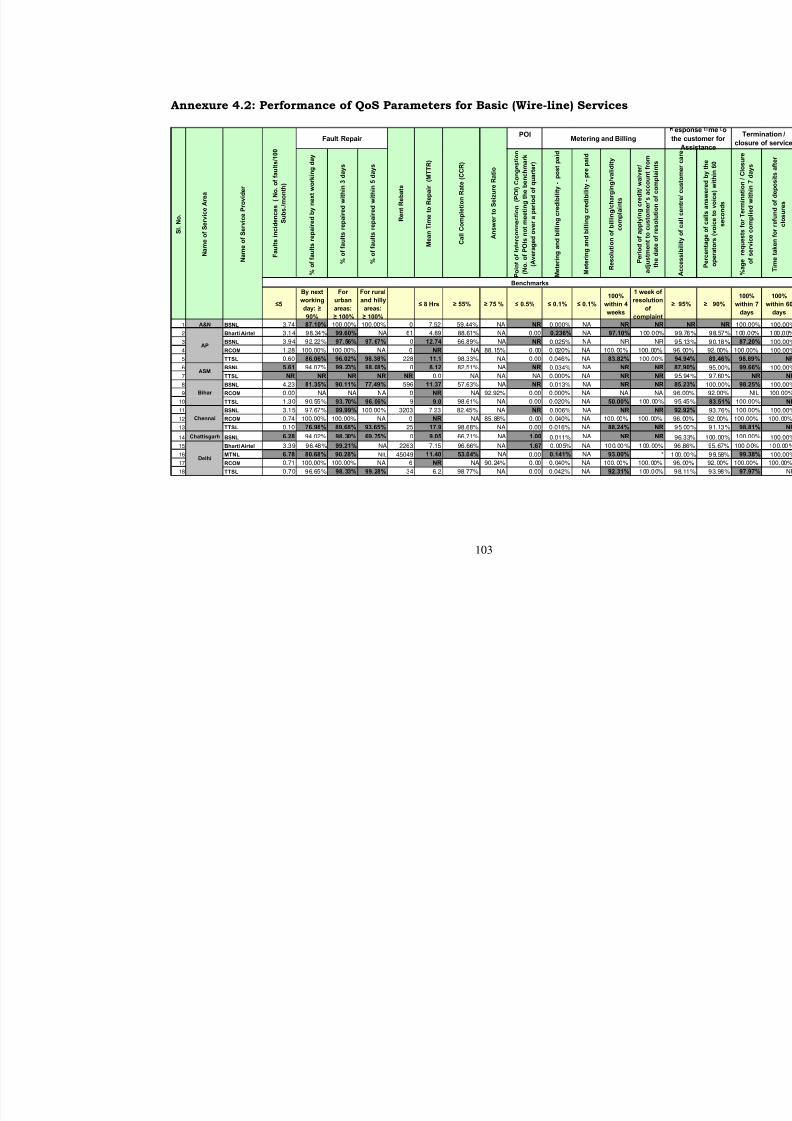
8/9/2019 Indicator Report Apr 10
http://slidepdf.com/reader/full/indicator-report-apr-10 117/150
103
Annexure 4.2: Performance of QoS Parameters for Basic (Wire-line) Services
POI
% o
f f a u l t s r e p a i r e d b y n e x t w o r k i n g d a y
% o
f f a u l t s r e p a i r e d w i t h i n 3 d a y s
% o
f f a u l t s r e p a i r e d w i t h i n 5 d a y s
P o i n t o f I n t e r c o n n e c t i o n
( P O I ) C o n g e s t i o n
( N o . o f P O I s n o t m e e t i n g t h e b e n c h m a r k
( A v e r a g e d o v e r a p e r i o d o f q u a r t e r )
M e t e r i n g a n d b i l l i n g c r e d i b i l i t y - p o s t p a i d
M e t e r i n g a n d b i l l i n g c r e d i b i l i t y - p r e p a i d
R e s o l u t i o n o f b i l l i n g / c h a r g i n g / v a l i d i t y
c o m p l a i n t s
P e r i o d o f a p p l y i n g c r e d i t / w a i v e r /
a d j u s t m e n t t o c u s t o m e r ’ s a c c o u n t f r o m
t h e d a t e o f r e s o l u t i o n o f c o m p l a i n t s
≤5
By nextworking
day: ≥
90%
For urban
areas:
≥ 100%
For ruraland hilly
areas:
≥ 100%
≤ 8 Hrs ≥ 55% ≥ 75 % ≤ 0.5% ≤ 0.1% ≤ 0.1%
100%
within 4
weeks
1 week resoluti
of
compla
1 A&N BSNL 3.74 87.10% 100.00% 100.00% 0 7.52 59.44% NA NR 0.000% NA NR
2 Bharti Airtel 3 .1 4 9 8. 34 % 99.60% NA 61 4.89 88.61% NA 0.00 0.236% NA 97.10% 1 00 .0
3 BSNL 3 .9 4 9 2. 22 % 97.56% 97.67% 0 12.74 66.89% NA NR 0.025% NA NR
4 RCOM 1.28 100.00% 100.00% NA 0 NR NA 88. 15% 0. 00 0. 020% NA 100. 00% 100. 0
5 TTSL 0.60 86.06% 96.02% 98.38% 228 11.1 98.33% NA 0.00 0.046% NA 83.82% 100.0
6 BSNL 5.61 94.07% 99.23% 98.08% 0 8.12 82.51% NA NR 0.034% NA NR
7 TTSL NR NR NR NR NR 0.0 NA NA NA 0.000% NA NR
8 BSNL 4.23 81.35% 90.11% 77.49% 596 11.37 57.63% NA NR 0.013% NA NR
9 RCOM 0.00 NA NA NA 0 NR NA 92.92% 0.00 0.000% NA NA
10 TTSL 1 .3 0 9 0. 55 % 93.70% 96.06% 9 9.0 98.61% NA 0.00 0.020% NA 50.00% 100.0
11 BSNL 3 .1 5 9 7. 67 % 99.99% 100.00% 3203 7.23 82.45% NA NR 0.006% NA NR
12 RCOM 0.74 100.00% 100.00% NA 0 NR NA 85. 88% 0. 00 0. 040% NA 100. 00% 100. 0
13 TTSL 0.10 76.98% 89.68% 93.65% 25 17.9 98.68% NA 0.00 0.016% NA 88.24%
14 Chattisgarh BSNL 6.28 94.02% 98.30% 69.75% 0 9.05 66.71% NA 1.00 0.011% NA NR
15 Bharti Airtel 3 .3 9 9 6. 48 % 99.21% NA 2263 7.15 96.66% NA 1.67 0. 00 5% NA 10 0. 00 % 1 00. 0
16 MTNL 6.78 80.68% 90.28% NIL 45049 11.40 53.04% NA 0.00 0.141% NA 93.00%
17 RCOM 0.71 100.00% 100.00% NA 6 NR NA 90. 24% 0. 00 0. 040% NA 100. 00% 100. 0
18 TTSL 0 .7 0 9 6. 65 % 98.33% 99.28% 34 6.2 98.77% NA 0.00 0.042% NA 92.31% 1 00 .0
Delhi
AP
ASM
Bihar
Chennai
Metering and Billing
Benchmarks
S l . N o .
N a m e o f S e r v i c e A r e a
N a m e o f S e r v i c e P r o v i d e r
F a u l t s i n c i d e n c e s
( N o . o f f a u l t s / 1 0 0
S u b s . / m o n t h )
Fault Repair
R e n t R e b a t e
M e a n T i m e t o R e p a i r ( M T T R )
C a l l C o m p l e t i o n R a t e ( C C R )
A n s w e r t o S e i z u r e R a t i o
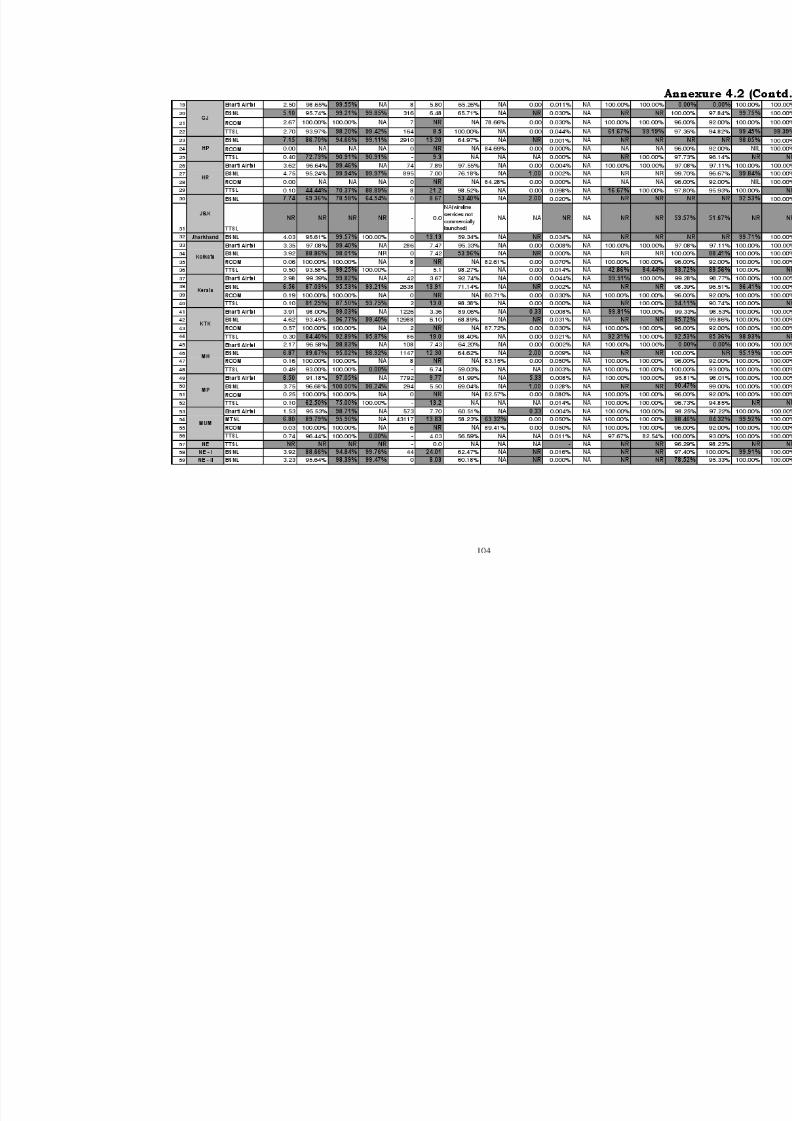
8/9/2019 Indicator Report Apr 10
http://slidepdf.com/reader/full/indicator-report-apr-10 118/150
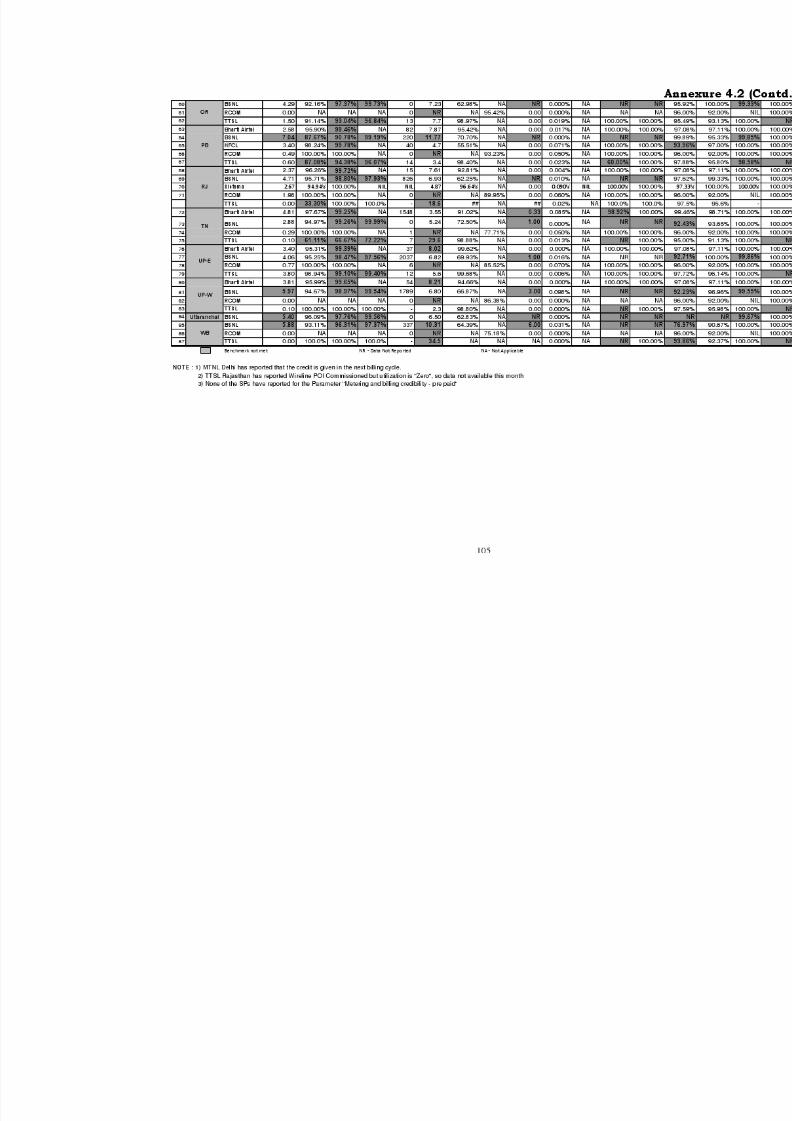
8/9/2019 Indicator Report Apr 10
http://slidepdf.com/reader/full/indicator-report-apr-10 119/150
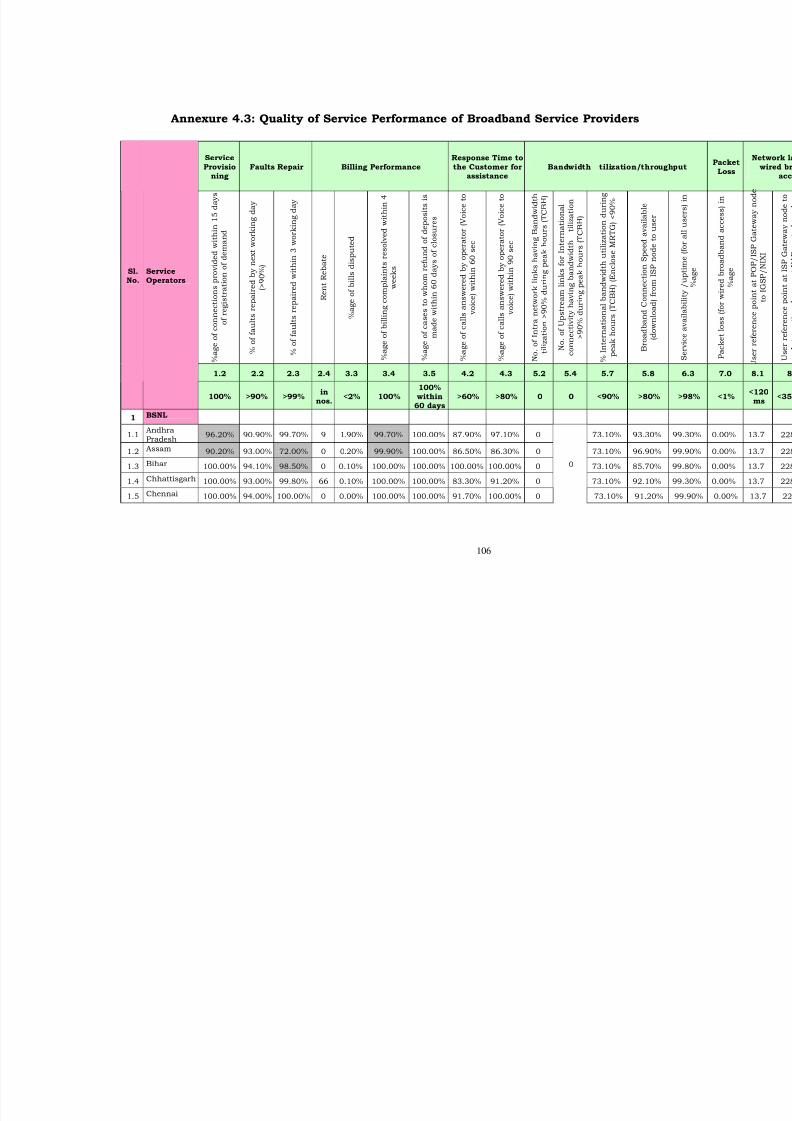
8/9/2019 Indicator Report Apr 10
http://slidepdf.com/reader/full/indicator-report-apr-10 120/150
106
Annexure 4.3: Quality of Service Performance of Broadband Service Providers
Service
Provisioning
Faults Repair Billing Performance
Response Time to
the Customer forassistance
Bandwidth tilization/thro
% a g e o f c o n n e c t i o n
s p r o v i d e d w i t h i n 1 5 d a y s
o f r e g i s t r
a t i o n o f d e m a n d
%
o f f a u l t s r e p a i r e d b y n e x t w o r k i n g d a y
( > 9 0 % )
%
o f f a u l t s r e p a i r e d w i t h i n 3 w o r k i n g d a y
R e
n t R e b a t e
% a g e o f b i l l s d i s p u t e d
% a g e o f b i l l i n g c o m
p l a i n t s r e s o l v e d w i t h i n 4
w e e k s
% a g e o f c a s e s t o w
h o m r e f u n d o f d e p o s i t s i s
m a d e w i t h i n
6 0 d a y s o f c l o s u r e s
% a g e o f c a l l s a n s w
e r e d b y o p e r a t o r ( V o i c e t o
v o i c e )
w i t h i n 6 0 s e c
% a g e o f c a l l s a n s w
e r e d b y o p e r a t o r ( V o i c e t o
v o i c e )
w i t h i n 9 0 s e c
N o . o f I n t r a n e t w o r
k l i n k s h a v i n g B a n d w i d t h
t i l i z a t i o n > 9 0 % d
u r i n g p e a k h o u r s ( T C B H )
N o . o f U p s t r e a m
l i n k s f o r I n t e r n a t i o n a l
c o n n e c t i v i t y h a v i n g b a n d w i d t h
t i l i z a t i o n
> 9 0 %
d u r i n g
p e a k h o u r s ( T C B H )
%
I n t e r n a t i o n a l b a
n d w i d t h u t i l i z a t i o n d u r i n g
p e a k h o u r s ( T C B H ) ( E n c l o s e M R T G ) < 9 0 %
B r o a d b a n d C o n n e c t i o n S p e e d a v a i l a b l e
( d o w n l o a d ) f r
o m
I S P n o d e t o u s e r
1.2 2.2 2.3 2.4 3.3 3.4 3.5 4.2 4.3 5.2 5.4 5.7 5.8
Sl.No.
ServiceOperators
100% >90% >99%in
nos.<2% 100%
100%within
60 days>60% >80% 0 0 <90% >80%
1 BSNL
1.1Andhra
Pradesh
96.20% 90.90% 99.70% 9 1.90% 99.70% 100.00% 87.90% 97.10% 0 73.10% 93.30
1.2 Assam 90.20% 93.00% 72.00% 0 0.20% 99.90% 100.00% 86.50% 86.30% 0 73.10% 96.90
1.3 Bihar 100.00% 94.10% 98.50% 0 0.10% 100.00% 100.00% 100.00% 100.00% 0 73.10% 85.70
1.4 Chhattisgarh 100.00% 93.00% 99.80% 66 0.10% 100.00% 100.00% 83.30% 91.20% 0 73.10% 92.10
1.5 Chennai 100.00% 94.00% 100.00% 0 0.00% 100.00% 100.00% 91.70% 100.00% 0
0
73.10% 91.20
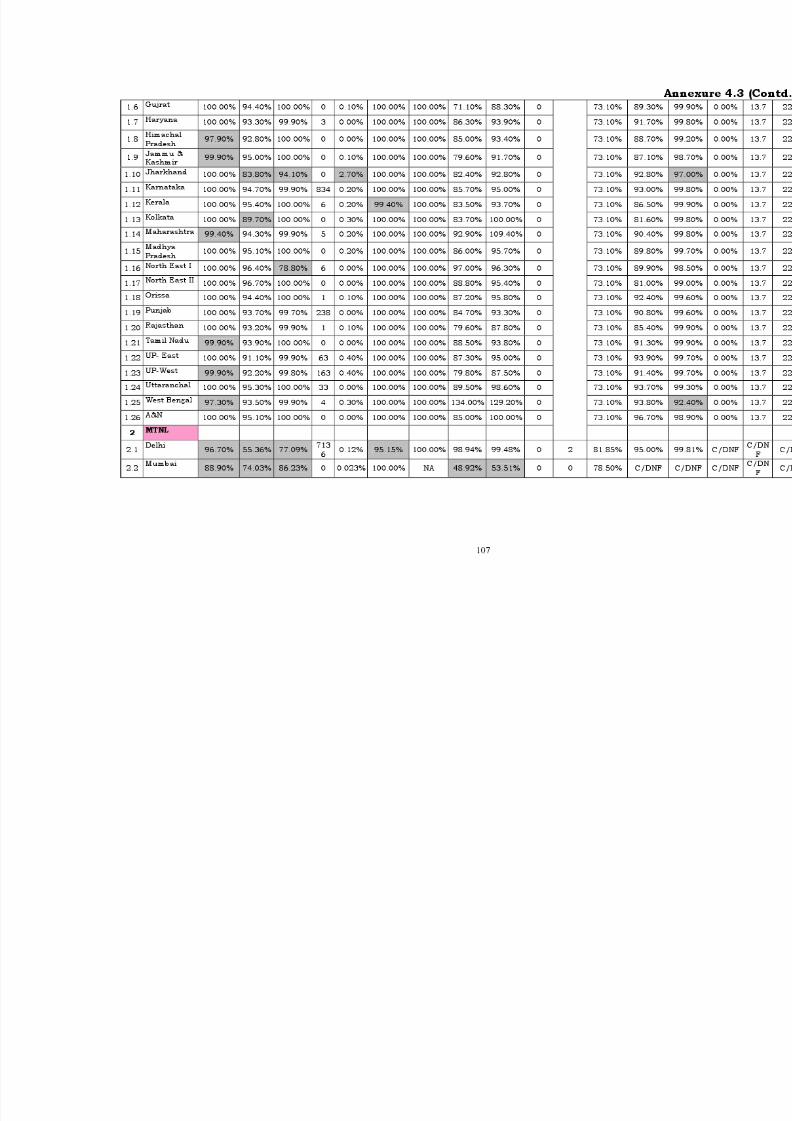
8/9/2019 Indicator Report Apr 10
http://slidepdf.com/reader/full/indicator-report-apr-10 121/150
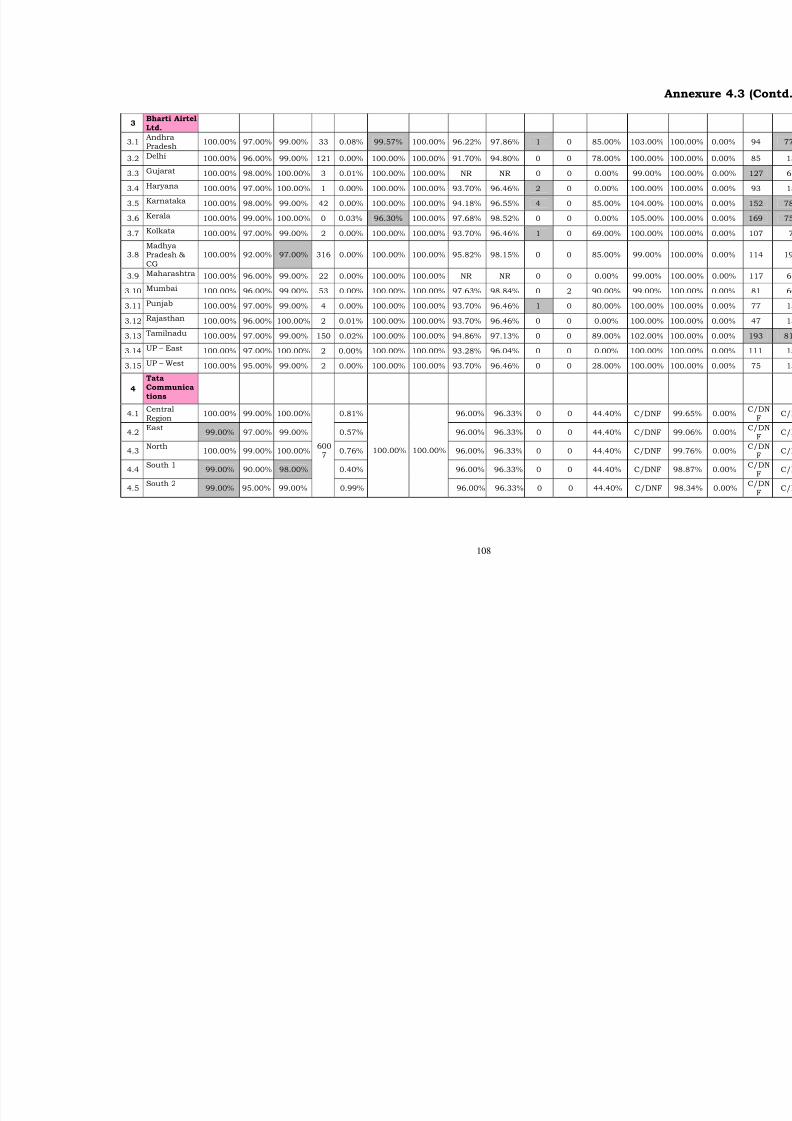
8/9/2019 Indicator Report Apr 10
http://slidepdf.com/reader/full/indicator-report-apr-10 122/150
108
3Bharti Airtel
Ltd.
3.1Andhra
Pradesh100.00% 97.00% 99.00% 33 0.08% 99.57% 100.00% 96.22% 97.86% 1 0 85.00% 103.0
3.2 Delhi 100.00% 96.00% 99.00% 121 0.00% 100.00% 100.00% 91.70% 94.80% 0 0 78.00% 100.0
3.3 Gujarat 100.00% 98.00% 100.00% 3 0.01% 100.00% 100.00% NR NR 0 0 0.00% 99.00
3.4 Haryana 100.00% 97.00% 100.00% 1 0.00% 100.00% 100.00% 93.70% 96.46% 2 0 0.00% 100.0
3.5 Karnataka 100.00% 98.00% 99.00% 42 0.00% 100.00% 100.00% 94.18% 96.55% 4 0 85.00% 104.0
3.6 Kerala 100.00% 99.00% 100.00% 0 0.03% 96.30% 100.00% 97.68% 98.52% 0 0 0.00% 105.0
3.7 Kolkata 100.00% 97.00% 99.00% 2 0.00% 100.00% 100.00% 93.70% 96.46% 1 0 69.00% 100.0
3.8MadhyaPradesh &
CG
100.00% 92.00% 97.00% 316 0.00% 100.00% 100.00% 95.82% 98.15% 0 0 85.00% 99.00
3.9 Maharashtra 100.00% 96.00% 99.00% 22 0.00% 100.00% 100.00% NR NR 0 0 0.00% 99.00
3.10Mumbai
100.00% 96.00% 99.00% 53 0.00% 100.00% 100.00% 97.63% 98.84% 0 2 90.00% 99.003.11 Punjab 100.00% 97.00% 99.00% 4 0.00% 100.00% 100.00% 93.70% 96.46% 1 0 80.00% 100.0
3.12 Rajasthan 100.00% 96.00% 100.00% 2 0.01% 100.00% 100.00% 93.70% 96.46% 0 0 0.00% 100.0
3.13 Tamilnadu 100.00% 97.00% 99.00% 150 0.02% 100.00% 100.00% 94.86% 97.13% 0 0 89.00% 102.0
3.14 UP – East 100.00% 97.00% 100.00% 2 0.00% 100.00% 100.00% 93.28% 96.04% 0 0 0.00% 100.0
3.15 UP – West 100.00% 95.00% 99.00% 2 0.00% 100.00% 100.00% 93.70% 96.46% 0 0 28.00% 100.0
4
TataCommunications
4.1CentralRegion
100.00% 99.00% 100.00% 0.81% 96.00% 96.33% 0 0 44.40% C/DN
4.2East
99.00% 97.00% 99.00% 0.57% 96.00% 96.33% 0 0 44.40% C/DN
4.3North
100.00% 99.00% 100.00% 0.76% 96.00% 96.33% 0 0 44.40% C/DN
4.4South 1
99.00% 90.00% 98.00% 0.40% 96.00% 96.33% 0 0 44.40% C/DN
4.5South 2
99.00% 95.00% 99.00%
6007
0.99%
100.00% 100.00%
96.00% 96.33% 0 0 44.40% C/DN
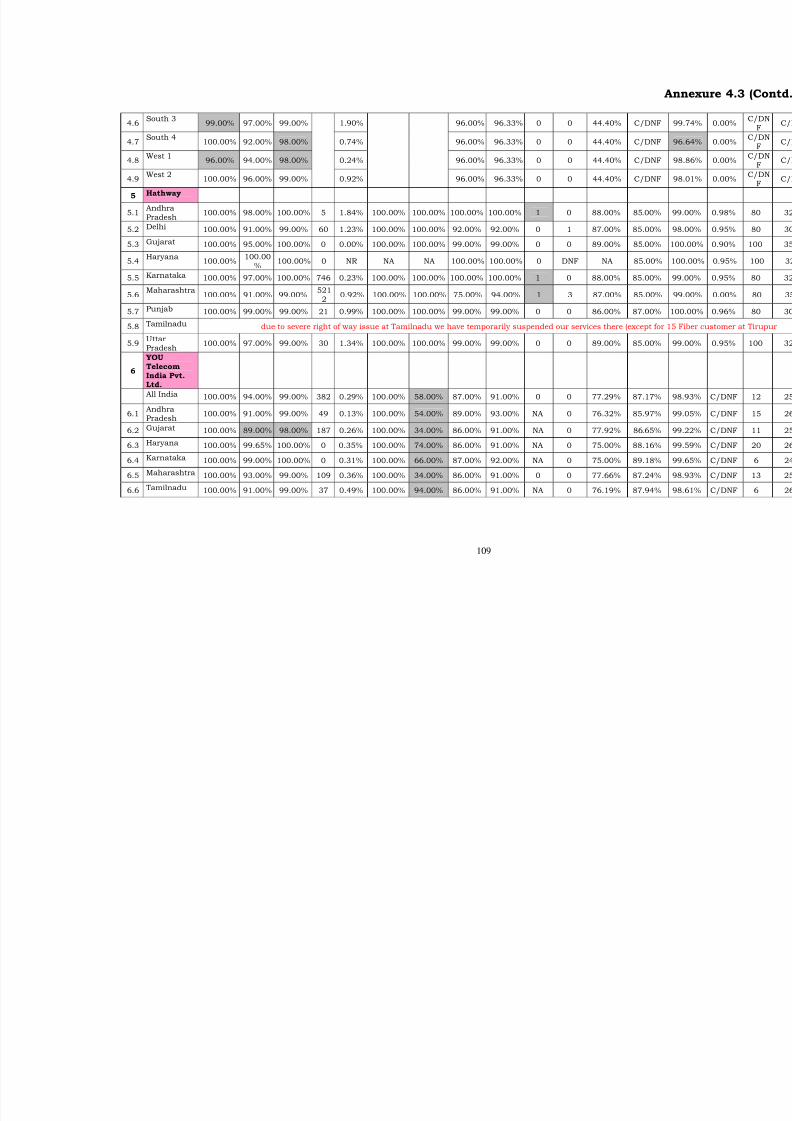
8/9/2019 Indicator Report Apr 10
http://slidepdf.com/reader/full/indicator-report-apr-10 123/150
109
4.6South 3
99.00% 97.00% 99.00% 1.90% 96.00% 96.33% 0 0 44.40% C/DN
4.7South 4
100.00% 92.00% 98.00% 0.74% 96.00% 96.33% 0 0 44.40% C/DN
4.8West 1
96.00% 94.00% 98.00% 0.24% 96.00% 96.33% 0 0 44.40% C/DN
4.9West 2
100.00% 96.00% 99.00% 0.92% 96.00% 96.33% 0 0 44.40% C/DN
5 Hathway
5.1Andhra
Pradesh100.00% 98.00% 100.00% 5 1.84% 100.00% 100.00% 100.00% 100.00% 1 0 88.00% 85.00
5.2 Delhi 100.00% 91.00% 99.00% 60 1.23% 100.00% 100.00% 92.00% 92.00% 0 1 87.00% 85.00
5.3 Gujarat 100.00% 95.00% 100.00% 0 0.00% 100.00% 100.00% 99.00% 99.00% 0 0 89.00% 85.00
5.4Haryana
100.00%100.00
%100.00% 0 NR NA NA 100.00% 100.00% 0 DNF NA 85.00
5.5 Karnataka 100.00% 97.00% 100.00% 746 0.23% 100.00% 100.00% 100.00% 100.00% 1 0 88.00% 85.00
5.6 Maharashtra 100.00% 91.00% 99.00% 5212 0.92% 100.00% 100.00% 75.00% 94.00% 1 3 87.00% 85.00
5.7 Punjab 100.00% 99.00% 99.00% 21 0.99% 100.00% 100.00% 99.00% 99.00% 0 0 86.00% 87.00
5.8 Tamilnadu due to severe right of way issue at Tamilnadu we have temporarily suspended our services there (except
5.9UttarPradesh
100.00% 97.00% 99.00% 30 1.34% 100.00% 100.00% 99.00% 99.00% 0 0 89.00% 85.00
6
YOUTelecomIndia Pvt.Ltd.
All India 100.00% 94.00% 99.00% 382 0.29% 100.00% 58.00% 87.00% 91.00% 0 0 77.29% 87.17
6.1AndhraPradesh
100.00% 91.00% 99.00% 49 0.13% 100.00% 54.00% 89.00% 93.00% NA 0 76.32% 85.97
6.2 Gujarat 100.00% 89.00% 98.00% 187 0.26% 100.00% 34.00% 86.00% 91.00% NA 0 77.92% 86.65
6.3 Haryana 100.00% 99.65% 100.00% 0 0.35% 100.00% 74.00% 86.00% 91.00% NA 0 75.00% 88.16
6.4 Karnataka 100.00% 99.00% 100.00% 0 0.31% 100.00% 66.00% 87.00% 92.00% NA 0 75.00% 89.18
6.5 Maharashtra 100.00% 93.00% 99.00% 109 0.36% 100.00% 34.00% 86.00% 91.00% 0 0 77.66% 87.24
6.6 Tamilnadu 100.00% 91.00% 99.00% 37 0.49% 100.00% 94.00% 86.00% 91.00% NA 0 76.19% 87.94
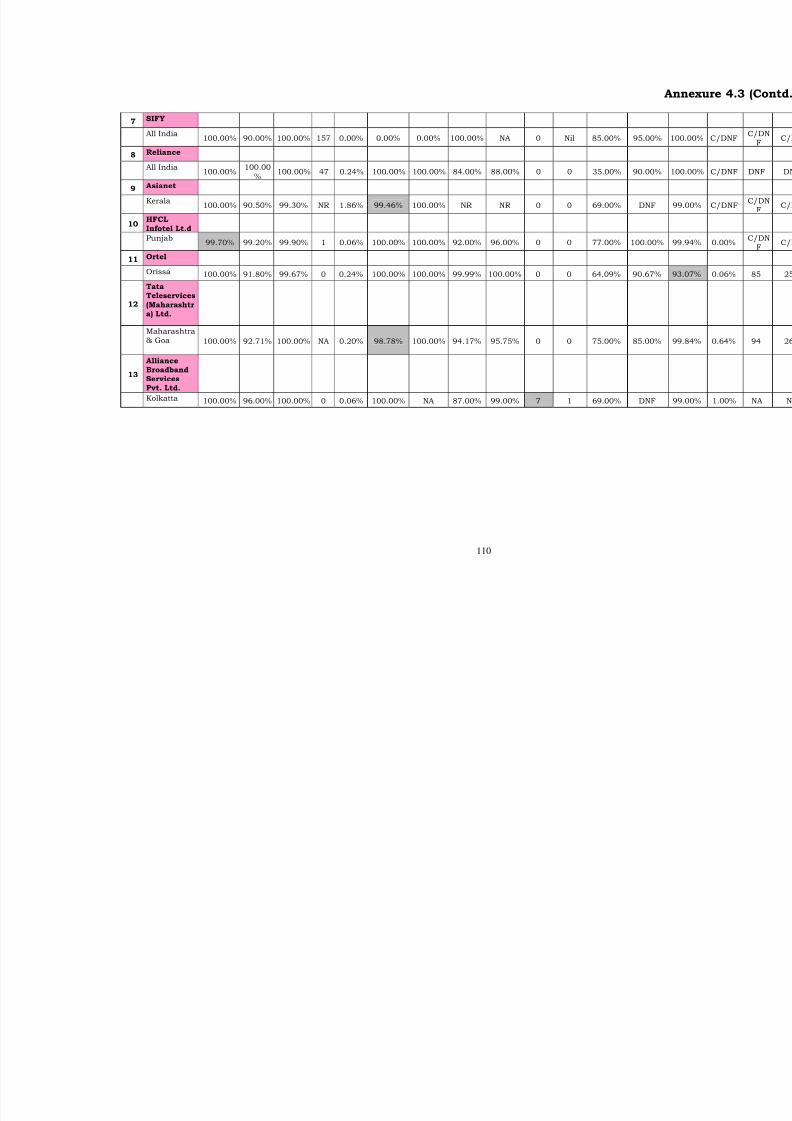
8/9/2019 Indicator Report Apr 10
http://slidepdf.com/reader/full/indicator-report-apr-10 124/150
110
7 SIFY
All India100.00% 90.00% 100.00% 157 0.00% 0.00% 0.00% 100.00% NA 0 Nil 85.00% 95.00
8 Reliance
All India100.00%
100.00
%100.00% 47 0.24% 100.00% 100.00% 84.00% 88.00% 0 0 35.00% 90.00
9 Asianet
Kerala100.00% 90.50% 99.30% NR 1.86% 99.46% 100.00% NR NR 0 0 69.00% DNF
10HFCL
Infotel Lt.d
Punjab99.70% 99.20% 99.90% 1 0.06% 100.00% 100.00% 92.00% 96.00% 0 0 77.00% 100.0
11 Ortel
Orissa 100.00% 91.80% 99.67% 0 0.24% 100.00% 100.00% 99.99% 100.00% 0 0 64.09% 90.67
12
Tata
Teleservices(Maharashtra) Ltd.
Maharashtra& Goa 100.00% 92.71% 100.00% NA 0.20% 98.78% 100.00% 94.17% 95.75% 0 0 75.00% 85.00
13
AllianceBroadbandServicesPvt. Ltd.
Kolkatta 100.00% 96.00% 100.00% 0 0.06% 100.00% NA 87.00% 99.00% 7 1 69.00% DNF

8/9/2019 Indicator Report Apr 10
http://slidepdf.com/reader/full/indicator-report-apr-10 125/150
111
14 Spectra Net
All India
(Delhi,Banglore &Mumbai)
98.60% 100.00% 100.00% 0 0.00% NA NA 100.00% 100.00% 0 0 87.00% C/DN
15 Beam Cables
Hyderabad100.00% DNF DNF
1196
1.66% NA NA C/DNF C/DNF 0 0 94.00% C/DN
Abbreviation DNF= Data not as per Format NR= Data not reported by the Service Provider NA
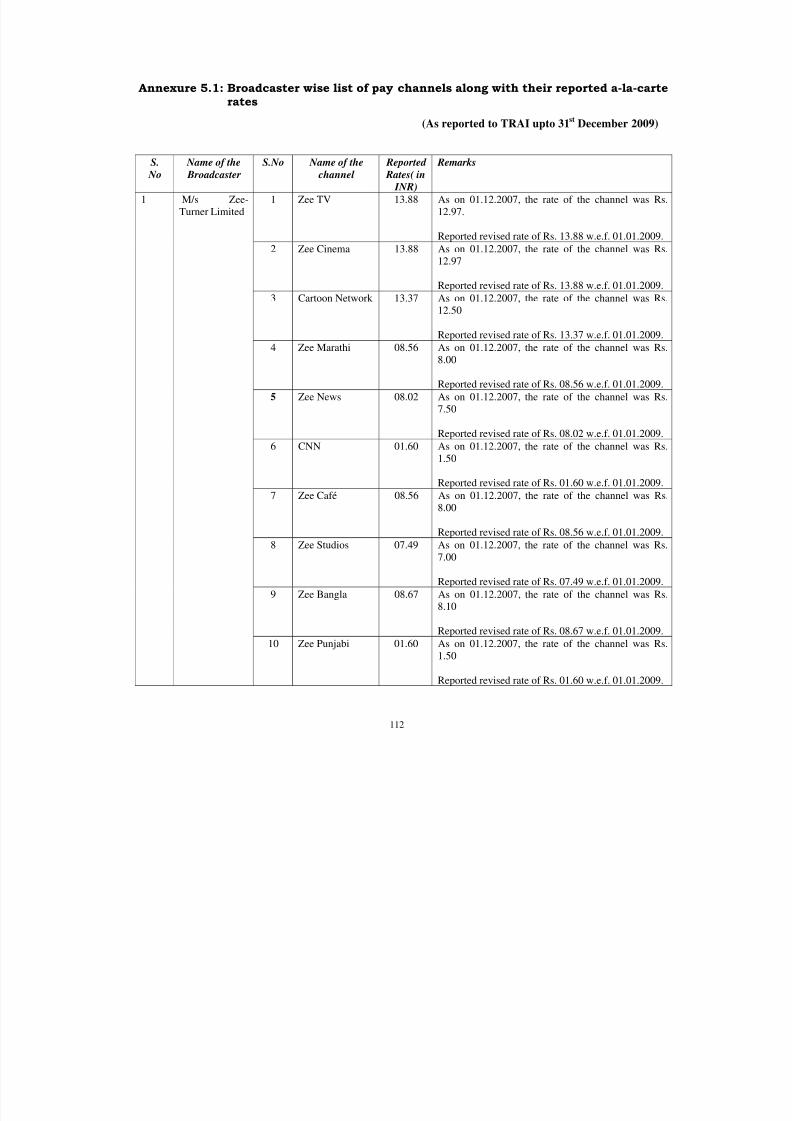
8/9/2019 Indicator Report Apr 10
http://slidepdf.com/reader/full/indicator-report-apr-10 126/150
112
Annexure 5.1: Broadcaster wise list of pay channels along with their reported a-la-carrates
(As reported to TRAI upto 31st
December 2009)
S.
No
Name of the
Broadcaster
S.No Name of the
channel
Reported
Rates( in
INR)
Remarks
1 Zee TV 13.88 As on 01.12.2007, the rate of the channel was R
12.97.
Reported revised rate of Rs. 13.88 w.e.f. 01.01.200
2 Zee Cinema 13.88 As on 01.12.2007, the rate of the channel was R
12.97
Reported revised rate of Rs. 13.88 w.e.f. 01.01.200
3 Cartoon Network 13.37 As on 01.12.2007, the rate of the channel was R12.50
Reported revised rate of Rs. 13.37 w.e.f. 01.01.200
4 Zee Marathi 08.56 As on 01.12.2007, the rate of the channel was R
8.00
Reported revised rate of Rs. 08.56 w.e.f. 01.01.200
5 Zee News 08.02 As on 01.12.2007, the rate of the channel was R
7.50
Reported revised rate of Rs. 08.02 w.e.f. 01.01.200
6 CNN 01.60 As on 01.12.2007, the rate of the channel was R1.50
Reported revised rate of Rs. 01.60 w.e.f. 01.01.200
7 Zee Café 08.56 As on 01.12.2007, the rate of the channel was R
8.00
Reported revised rate of Rs. 08.56 w.e.f. 01.01.200
8 Zee Studios 07.49 As on 01.12.2007, the rate of the channel was R
7.00
Reported revised rate of Rs. 07.49 w.e.f. 01.01.200
9 Zee Bangla 08.67 As on 01.12.2007, the rate of the channel was R8.10
Reported revised rate of Rs. 08.67 w.e.f. 01.01.200
1 M/s Zee-
Turner Limited
10 Zee Punjabi 01.60 As on 01.12.2007, the rate of the channel was R
1.50
Reported revised rate of Rs. 01.60 w.e.f. 01.01.200
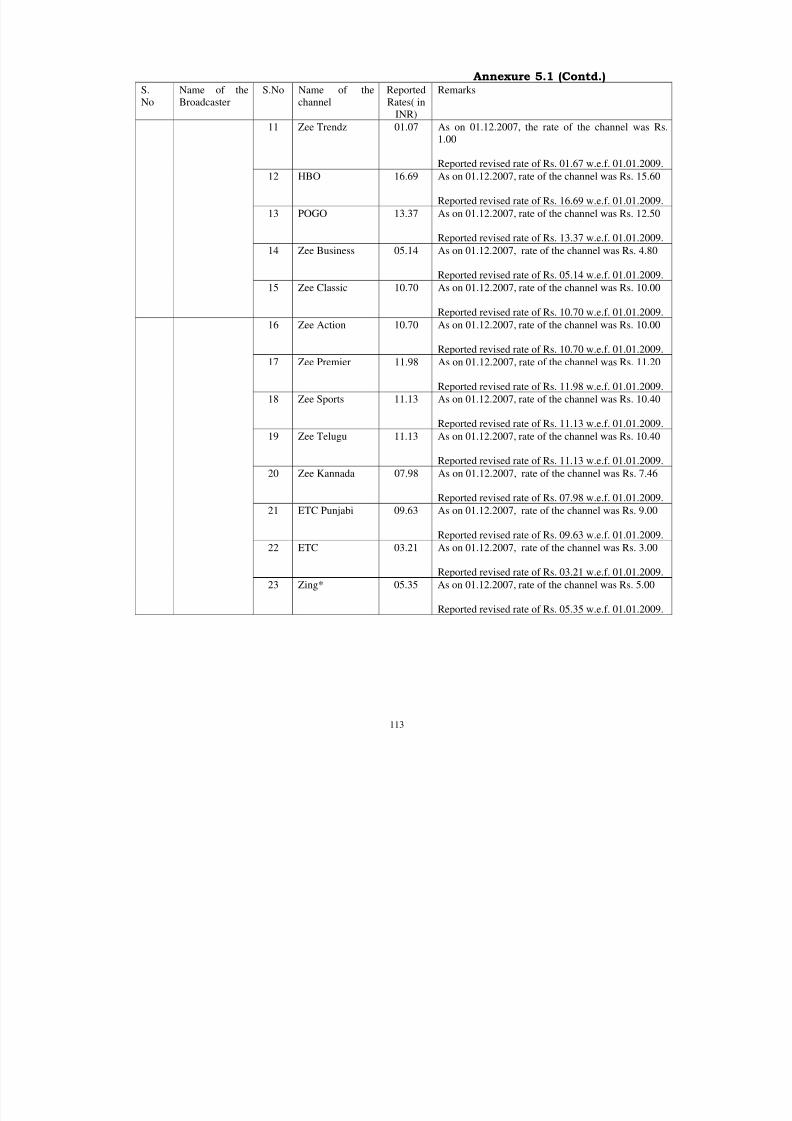
8/9/2019 Indicator Report Apr 10
http://slidepdf.com/reader/full/indicator-report-apr-10 127/150
113
Annexure 5.1 (Contd.)S.
No
Name of the
Broadcaster
S.No Name of the
channel
Reported
Rates( in
INR)
Remarks
11 Zee Trendz 01.07 As on 01.12.2007, the rate of the channel was R
1.00
Reported revised rate of Rs. 01.67 w.e.f. 01.01.200
12 HBO 16.69 As on 01.12.2007, rate of the channel was Rs. 15.6
Reported revised rate of Rs. 16.69 w.e.f. 01.01.200
13 POGO 13.37 As on 01.12.2007, rate of the channel was Rs. 12.50
Reported revised rate of Rs. 13.37 w.e.f. 01.01.200
14 Zee Business 05.14 As on 01.12.2007, rate of the channel was Rs. 4.80
Reported revised rate of Rs. 05.14 w.e.f. 01.01.200
15 Zee Classic 10.70 As on 01.12.2007, rate of the channel was Rs. 10.0
Reported revised rate of Rs. 10.70 w.e.f. 01.01.200
16 Zee Action 10.70 As on 01.12.2007, rate of the channel was Rs. 10.0
Reported revised rate of Rs. 10.70 w.e.f. 01.01.200
17 Zee Premier 11.98 As on 01.12.2007, rate of the channel was Rs. 11.2
Reported revised rate of Rs. 11.98 w.e.f. 01.01.200
18 Zee Sports 11.13 As on 01.12.2007, rate of the channel was Rs. 10.4
Reported revised rate of Rs. 11.13 w.e.f. 01.01.200
19 Zee Telugu 11.13 As on 01.12.2007, rate of the channel was Rs. 10.40
Reported revised rate of Rs. 11.13 w.e.f. 01.01.200
20 Zee Kannada 07.98 As on 01.12.2007, rate of the channel was Rs. 7.46
Reported revised rate of Rs. 07.98 w.e.f. 01.01.200
21 ETC Punjabi 09.63 As on 01.12.2007, rate of the channel was Rs. 9.00
Reported revised rate of Rs. 09.63 w.e.f. 01.01.200
22 ETC 03.21 As on 01.12.2007, rate of the channel was Rs. 3.00
Reported revised rate of Rs. 03.21 w.e.f. 01.01.200
23 Zing* 05.35 As on 01.12.2007, rate of the channel was Rs. 5.00
Reported revised rate of Rs. 05.35 w.e.f. 01.01.200
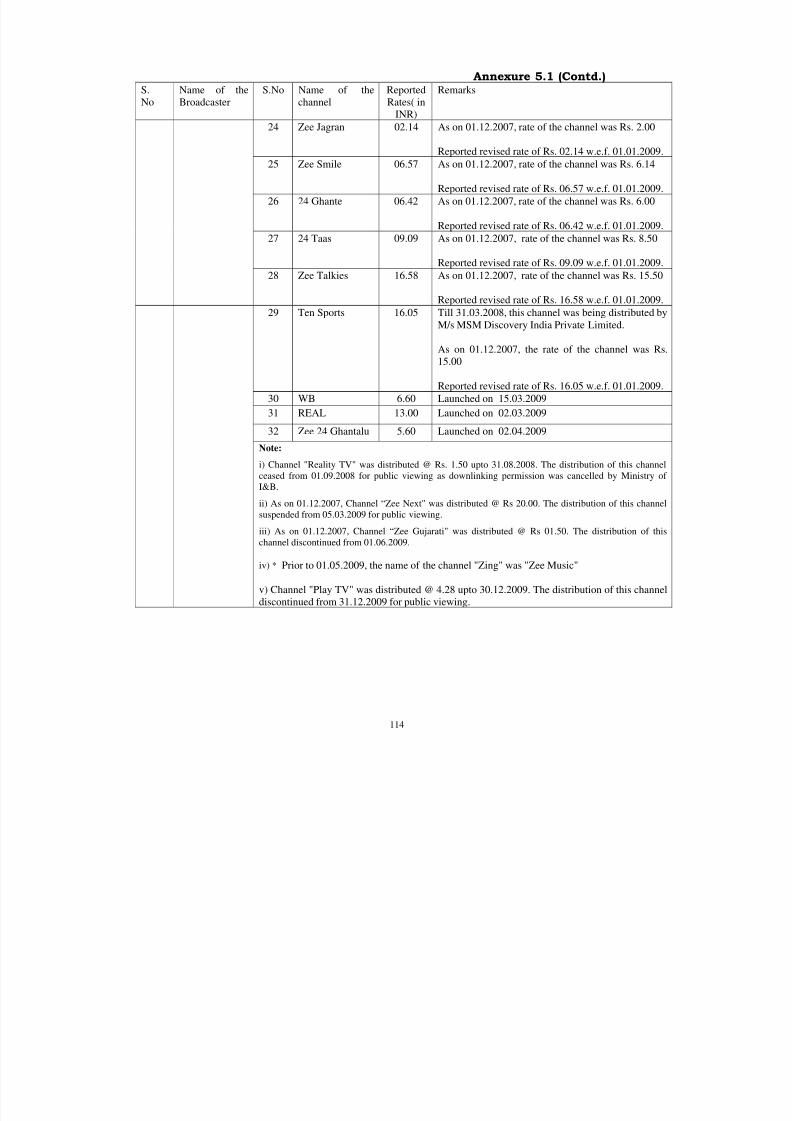
8/9/2019 Indicator Report Apr 10
http://slidepdf.com/reader/full/indicator-report-apr-10 128/150
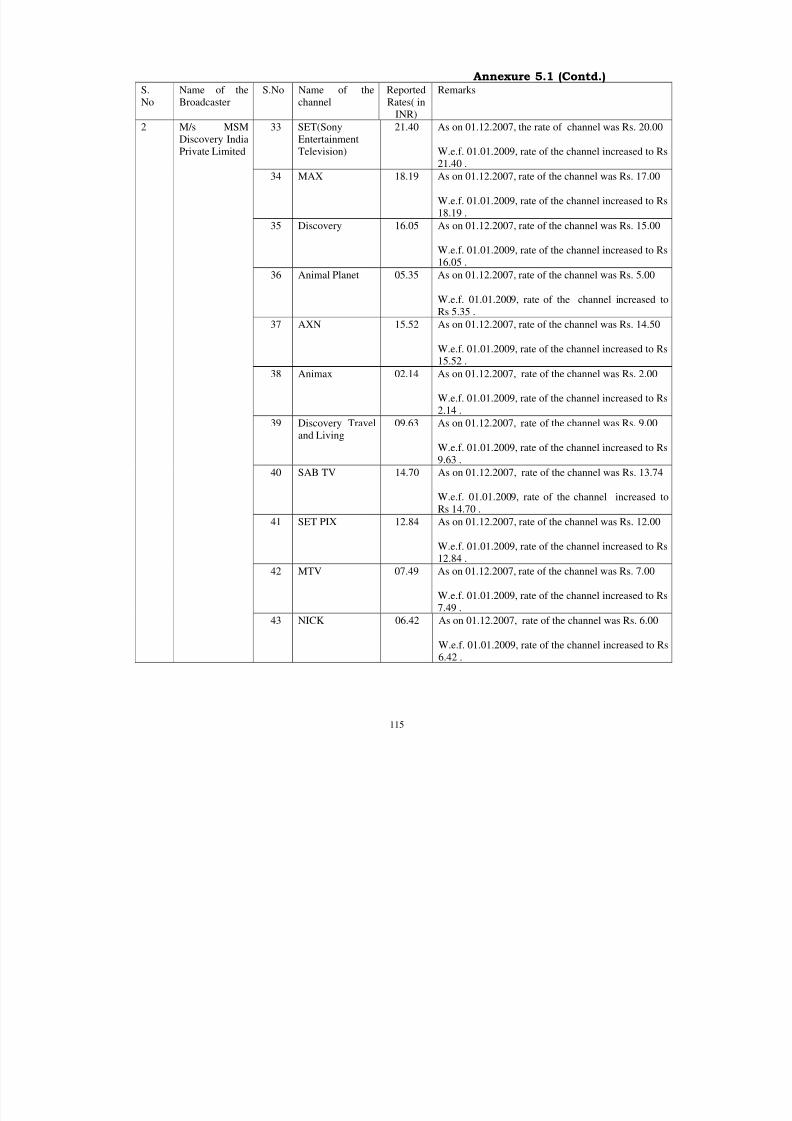
8/9/2019 Indicator Report Apr 10
http://slidepdf.com/reader/full/indicator-report-apr-10 129/150
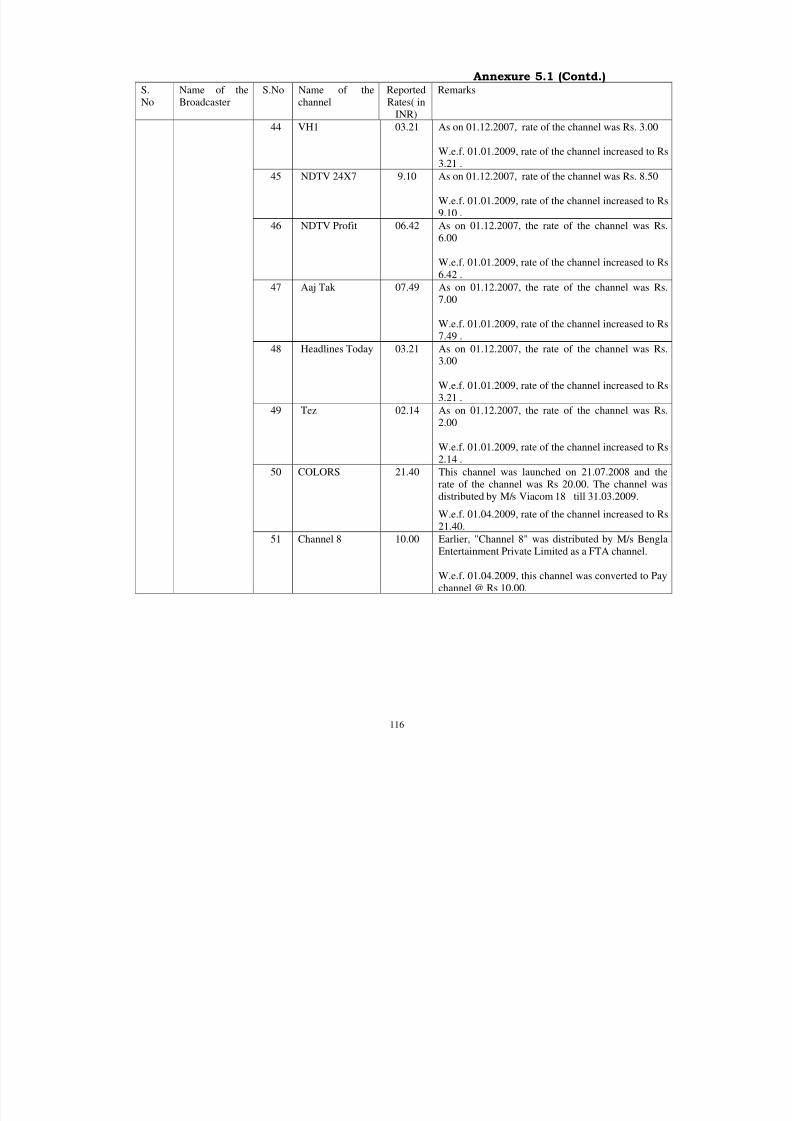
8/9/2019 Indicator Report Apr 10
http://slidepdf.com/reader/full/indicator-report-apr-10 130/150
116
Annexure 5.1 (Contd.)S.
No
Name of the
Broadcaster
S.No Name of the
channel
Reported
Rates( in
INR)
Remarks
44 VH1 03.21 As on 01.12.2007, rate of the channel was Rs. 3.00
W.e.f. 01.01.2009, rate of the channel increased to
3.21 .
45 NDTV 24X7 9.10 As on 01.12.2007, rate of the channel was Rs. 8.50
W.e.f. 01.01.2009, rate of the channel increased to
9.10 .
46 NDTV Profit 06.42 As on 01.12.2007, the rate of the channel was R
6.00
W.e.f. 01.01.2009, rate of the channel increased to
6.42 .
47 Aaj Tak 07.49 As on 01.12.2007, the rate of the channel was R
7.00
W.e.f. 01.01.2009, rate of the channel increased to
7.49 .
48 Headlines Today 03.21 As on 01.12.2007, the rate of the channel was R3.00
W.e.f. 01.01.2009, rate of the channel increased to
3.21 .
49 Tez 02.14 As on 01.12.2007, the rate of the channel was R
2.00
W.e.f. 01.01.2009, rate of the channel increased to
2.14 .
50 COLORS 21.40 This channel was launched on 21.07.2008 and
rate of the channel was Rs 20.00. The channel w
distributed by M/s Viacom 18 till 31.03.2009.
W.e.f. 01.04.2009, rate of the channel increased to
21.40.
51 Channel 8 10.00 Earlier, "Channel 8" was distributed by M/s Ben
Entertainment Private Limited as a FTA channel.
W.e.f. 01.04.2009, this channel was converted to P
channel @ Rs 10.00.
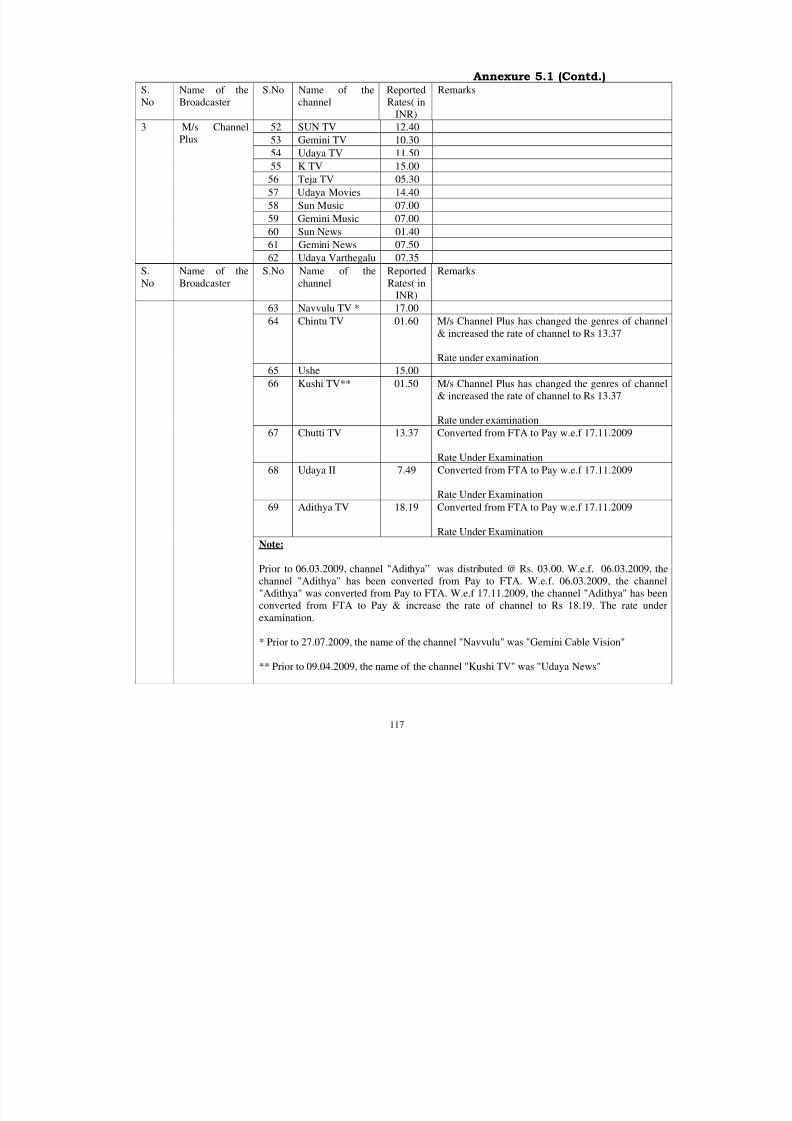
8/9/2019 Indicator Report Apr 10
http://slidepdf.com/reader/full/indicator-report-apr-10 131/150
117
Annexure 5.1 (Contd.)S.
No
Name of the
Broadcaster
S.No Name of the
channel
Reported
Rates( in
INR)
Remarks
52 SUN TV 12.40
53 Gemini TV 10.30
54 Udaya TV 11.50
55 K TV 15.00
56 Teja TV 05.30
57 Udaya Movies 14.40
58 Sun Music 07.00
59 Gemini Music 07.00
60 Sun News 01.40
61 Gemini News 07.50
3 M/s Channel
Plus
62 Udaya Varthegalu 07.35
S.
No
Name of the
Broadcaster
S.No Name of the
channel
Reported
Rates( in
INR)
Remarks
63 Navvulu TV * 17.00
64 Chintu TV 01.60 M/s Channel Plus has changed the genres of chan
& increased the rate of channel to Rs 13.37
Rate under examination
65 Ushe 15.00
66 Kushi TV** 01.50 M/s Channel Plus has changed the genres of chan
& increased the rate of channel to Rs 13.37
Rate under examination
67 Chutti TV 13.37 Converted from FTA to Pay w.e.f 17.11.2009
Rate Under Examination
68 Udaya II 7.49 Converted from FTA to Pay w.e.f 17.11.2009
Rate Under Examination
69 Adithya TV 18.19 Converted from FTA to Pay w.e.f 17.11.2009
Rate Under Examination
Note:
Prior to 06.03.2009, channel "Adithya” was distributed @ Rs. 03.00. W.e.f. 06.03.2009,
channel "Adithya" has been converted from Pay to FTA. W.e.f. 06.03.2009, the chann
"Adithya" was converted from Pay to FTA. W.e.f 17.11.2009, the channel "Adithya" has beconverted from FTA to Pay & increase the rate of channel to Rs 18.19. The rate und
examination.
* Prior to 27.07.2009, the name of the channel "Navvulu" was "Gemini Cable Vision"
** Prior to 09.04.2009, the name of the channel "Kushi TV" was "Udaya News"
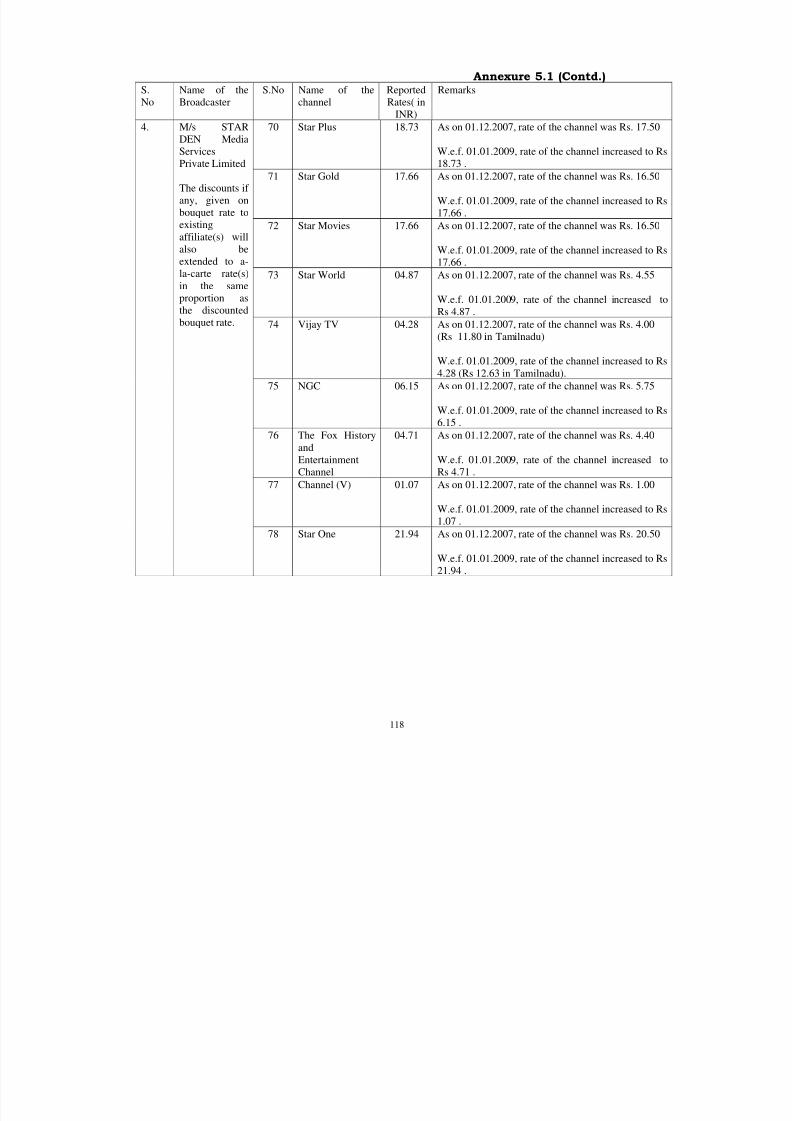
8/9/2019 Indicator Report Apr 10
http://slidepdf.com/reader/full/indicator-report-apr-10 132/150
118
Annexure 5.1 (Contd.)S.
No
Name of the
Broadcaster
S.No Name of the
channel
Reported
Rates( in
INR)
Remarks
70 Star Plus 18.73 As on 01.12.2007, rate of the channel was Rs. 17.50
W.e.f. 01.01.2009, rate of the channel increased to
18.73 .
71 Star Gold 17.66 As on 01.12.2007, rate of the channel was Rs. 16.50
W.e.f. 01.01.2009, rate of the channel increased to
17.66 .
72 Star Movies 17.66 As on 01.12.2007, rate of the channel was Rs. 16.50
W.e.f. 01.01.2009, rate of the channel increased to
17.66 .
73 Star World 04.87 As on 01.12.2007, rate of the channel was Rs. 4.55
W.e.f. 01.01.2009, rate of the channel increased
Rs 4.87 .
74 Vijay TV 04.28 As on 01.12.2007, rate of the channel was Rs. 4.00
(Rs 11.80 in Tamilnadu)
W.e.f. 01.01.2009, rate of the channel increased to
4.28 (Rs 12.63 in Tamilnadu).
75 NGC 06.15 As on 01.12.2007, rate of the channel was Rs. 5.75
W.e.f. 01.01.2009, rate of the channel increased to
6.15 .
76 The Fox History
and
Entertainment
Channel
04.71 As on 01.12.2007, rate of the channel was Rs. 4.40
W.e.f. 01.01.2009, rate of the channel increased
Rs 4.71 .
77 Channel (V) 01.07 As on 01.12.2007, rate of the channel was Rs. 1.00
W.e.f. 01.01.2009, rate of the channel increased to
1.07 .
4. M/s STAR
DEN Media
Services
Private Limited
The discounts if
any, given on
bouquet rate to
existing
affiliate(s) will
also be
extended to a-
la-carte rate(s)
in the same
proportion asthe discounted
bouquet rate.
78 Star One 21.94 As on 01.12.2007, rate of the channel was Rs. 20.50
W.e.f. 01.01.2009, rate of the channel increased to
21.94 .
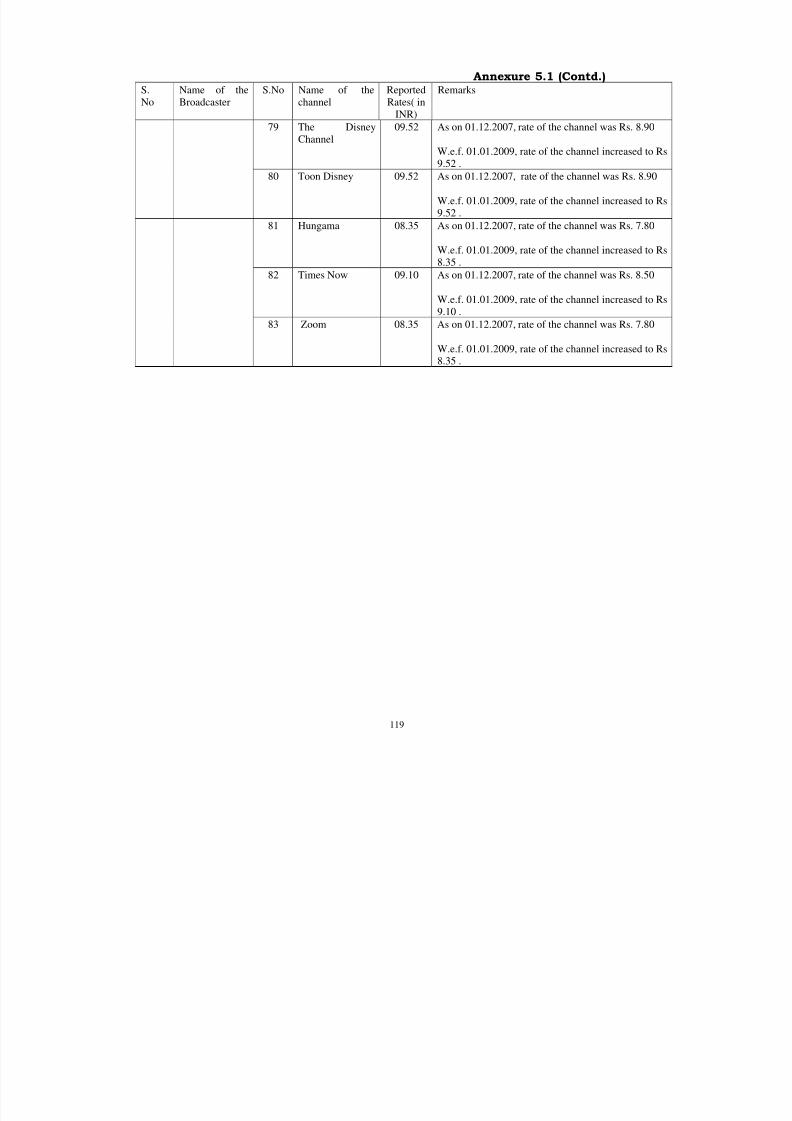
8/9/2019 Indicator Report Apr 10
http://slidepdf.com/reader/full/indicator-report-apr-10 133/150
119
Annexure 5.1 (Contd.)S.
No
Name of the
Broadcaster
S.No Name of the
channel
Reported
Rates( in
INR)
Remarks
79 The Disney
Channel
09.52 As on 01.12.2007, rate of the channel was Rs. 8.90
W.e.f. 01.01.2009, rate of the channel increased to
9.52 .
80 Toon Disney 09.52 As on 01.12.2007, rate of the channel was Rs. 8.90
W.e.f. 01.01.2009, rate of the channel increased to
9.52 .
81 Hungama 08.35 As on 01.12.2007, rate of the channel was Rs. 7.80
W.e.f. 01.01.2009, rate of the channel increased to
8.35 .
82 Times Now 09.10 As on 01.12.2007, rate of the channel was Rs. 8.50
W.e.f. 01.01.2009, rate of the channel increased to
9.10 .
83 Zoom 08.35 As on 01.12.2007, rate of the channel was Rs. 7.80
W.e.f. 01.01.2009, rate of the channel increased to 8.35 .
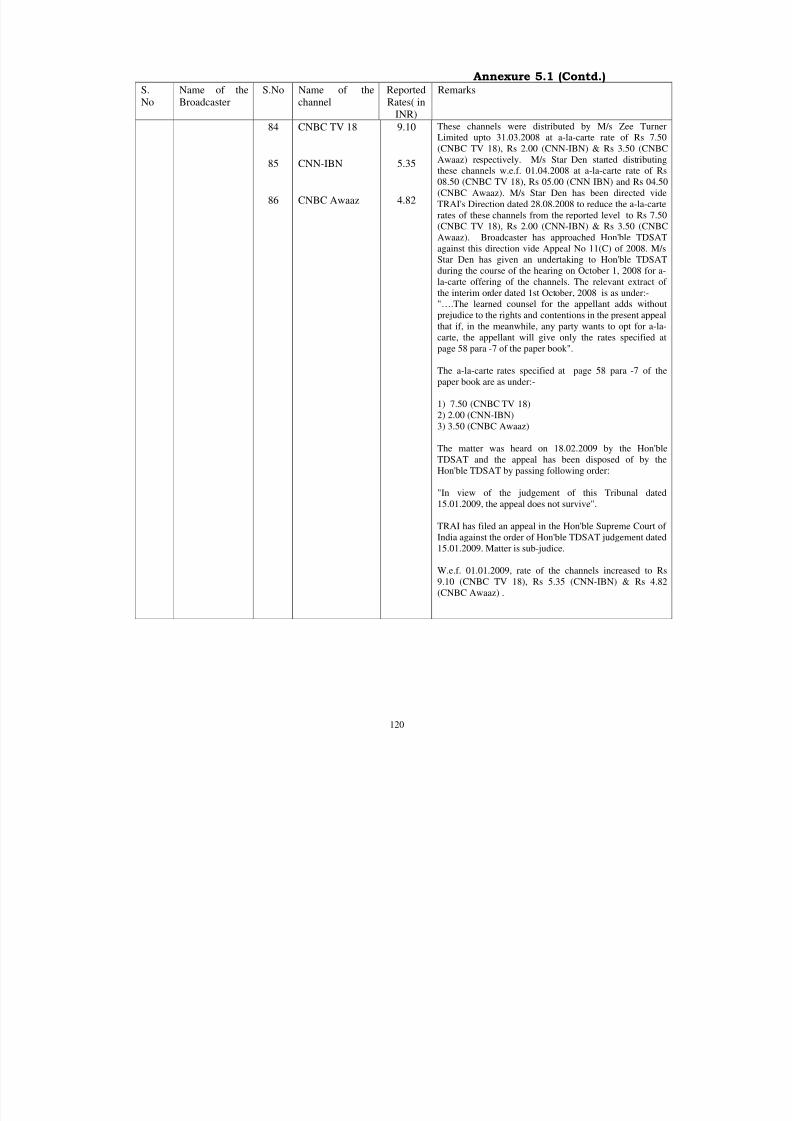
8/9/2019 Indicator Report Apr 10
http://slidepdf.com/reader/full/indicator-report-apr-10 134/150
120
Annexure 5.1 (Contd.)S.
No
Name of the
Broadcaster
S.No Name of the
channel
Reported
Rates( in
INR)
Remarks
84
85
86
CNBC TV 18
CNN-IBN
CNBC Awaaz
9.10
5.35
4.82
These channels were distributed by M/s Zee Tur
Limited upto 31.03.2008 at a-la-carte rate of Rs 7
(CNBC TV 18), Rs 2.00 (CNN-IBN) & Rs 3.50 (CNAwaaz) respectively. M/s Star Den started distribut
these channels w.e.f. 01.04.2008 at a-la-carte rate of
08.50 (CNBC TV 18), Rs 05.00 (CNN IBN) and Rs 04
(CNBC Awaaz). M/s Star Den has been directed v
TRAI's Direction dated 28.08.2008 to reduce the a-la-ca
rates of these channels from the reported level to Rs 7
(CNBC TV 18), Rs 2.00 (CNN-IBN) & Rs 3.50 (CN
Awaaz). Broadcaster has approached Hon'ble TDS
against this direction vide Appeal No 11(C) of 2008. M
Star Den has given an undertaking to Hon'ble TDSA
during the course of the hearing on October 1, 2008 for
la-carte offering of the channels. The relevant extract
the interim order dated 1st October, 2008 is as under:-"….The learned counsel for the appellant adds with
prejudice to the rights and contentions in the present app
that if, in the meanwhile, any party wants to opt for a-
carte, the appellant will give only the rates specified
page 58 para -7 of the paper book".
The a-la-carte rates specified at page 58 para -7 of
paper book are as under:-
1) 7.50 (CNBC TV 18)
2) 2.00 (CNN-IBN)
3) 3.50 (CNBC Awaaz)
The matter was heard on 18.02.2009 by the Hon'
TDSAT and the appeal has been disposed of by
Hon'ble TDSAT by passing following order:
"In view of the judgement of this Tribunal da
15.01.2009, the appeal does not survive".
TRAI has filed an appeal in the Hon'ble Supreme Court
India against the order of Hon'ble TDSAT judgement da
15.01.2009. Matter is sub-judice.
W.e.f. 01.01.2009, rate of the channels increased to
9.10 (CNBC TV 18), Rs 5.35 (CNN-IBN) & Rs 4
(CNBC Awaaz) .
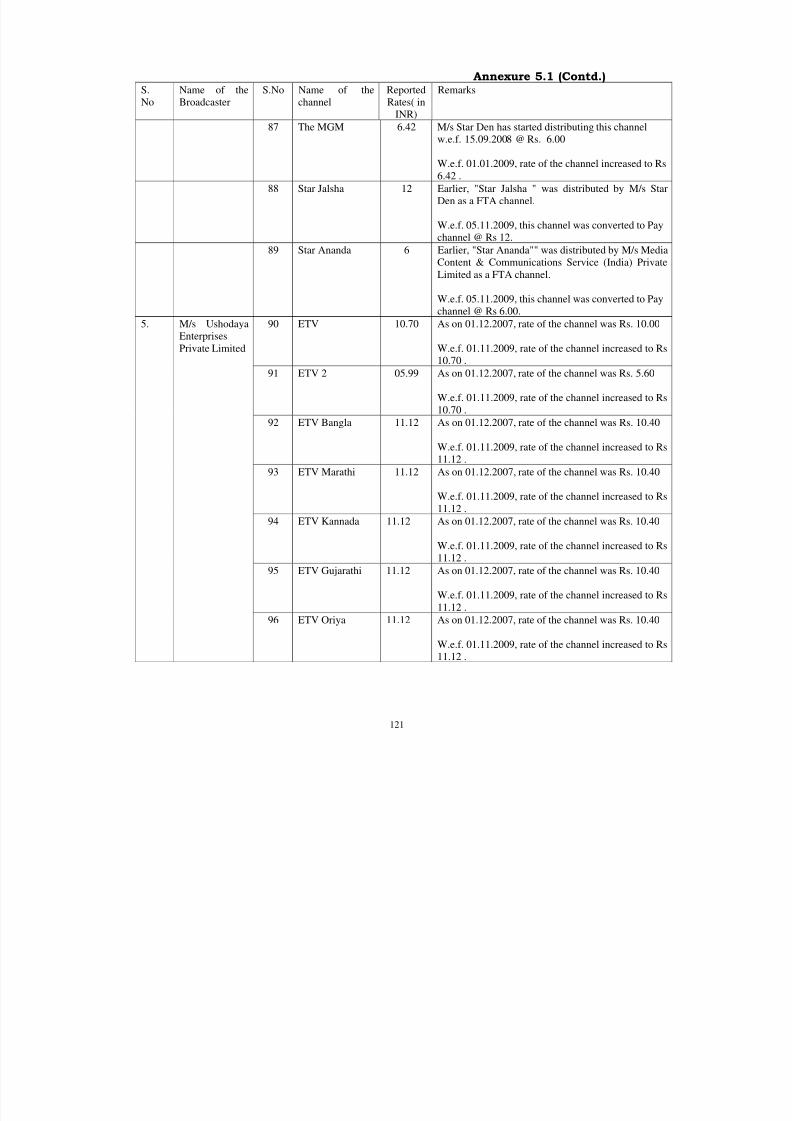
8/9/2019 Indicator Report Apr 10
http://slidepdf.com/reader/full/indicator-report-apr-10 135/150
121
Annexure 5.1 (Contd.)S.
No
Name of the
Broadcaster
S.No Name of the
channel
Reported
Rates( in
INR)
Remarks
87 The MGM 6.42 M/s Star Den has started distributing this channel
w.e.f. 15.09.2008 @ Rs. 6.00
W.e.f. 01.01.2009, rate of the channel increased to R
6.42 .
88 Star Jalsha 12 Earlier, "Star Jalsha " was distributed by M/s S
Den as a FTA channel.
W.e.f. 05.11.2009, this channel was converted to Pa
channel @ Rs 12.
89 Star Ananda 6 Earlier, "Star Ananda"" was distributed by M/s Me
Content & Communications Service (India) Priv
Limited as a FTA channel.
W.e.f. 05.11.2009, this channel was converted to Pa
channel @ Rs 6.00.
90 ETV 10.70 As on 01.12.2007, rate of the channel was Rs. 10.00
W.e.f. 01.11.2009, rate of the channel increased to
10.70 .
91 ETV 2 05.99 As on 01.12.2007, rate of the channel was Rs. 5.60
W.e.f. 01.11.2009, rate of the channel increased to
10.70 .
92 ETV Bangla 11.12 As on 01.12.2007, rate of the channel was Rs. 10.40
W.e.f. 01.11.2009, rate of the channel increased to
11.12 .
93 ETV Marathi 11.12 As on 01.12.2007, rate of the channel was Rs. 10.40
W.e.f. 01.11.2009, rate of the channel increased to
11.12 .
94 ETV Kannada 11.12 As on 01.12.2007, rate of the channel was Rs. 10.40
W.e.f. 01.11.2009, rate of the channel increased to
11.12 .
95 ETV Gujarathi 11.12 As on 01.12.2007, rate of the channel was Rs. 10.40
W.e.f. 01.11.2009, rate of the channel increased to
11.12 .
5. M/s Ushodaya
Enterprises
Private Limited
96 ETV Oriya 11.12 As on 01.12.2007, rate of the channel was Rs. 10.40
W.e.f. 01.11.2009, rate of the channel increased to
11.12 .
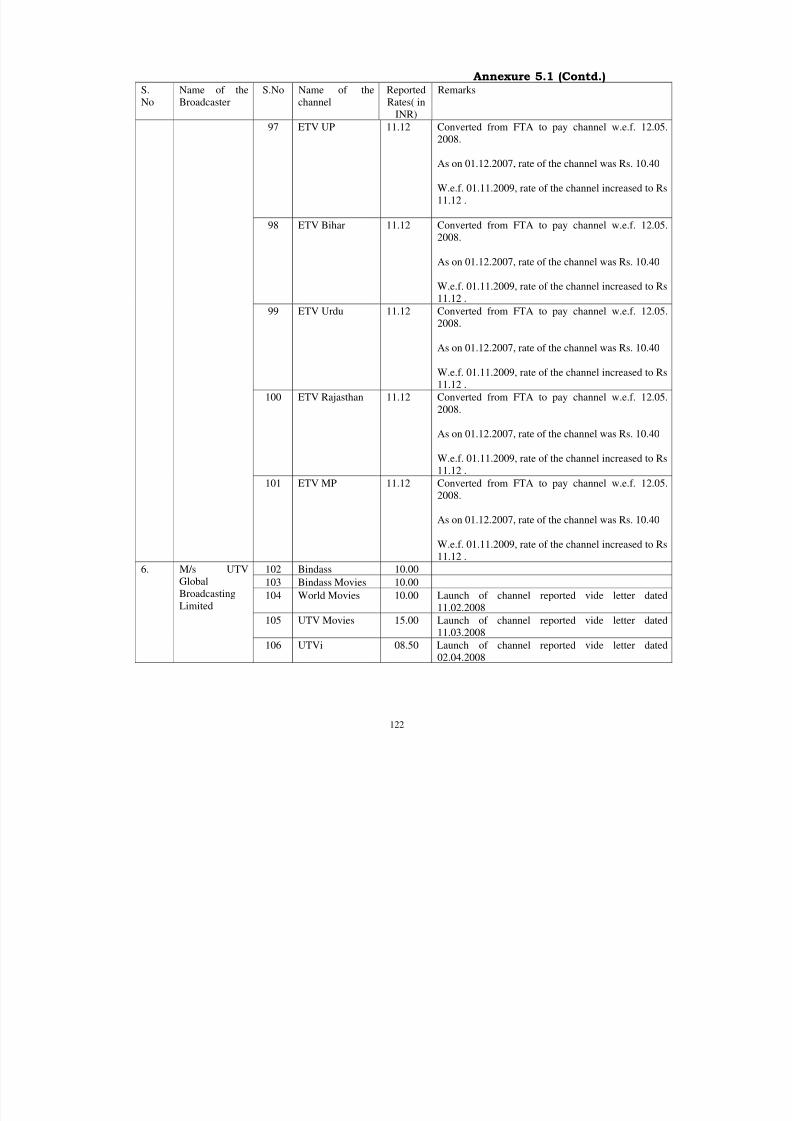
8/9/2019 Indicator Report Apr 10
http://slidepdf.com/reader/full/indicator-report-apr-10 136/150
122
Annexure 5.1 (Contd.)S.
No
Name of the
Broadcaster
S.No Name of the
channel
Reported
Rates( in
INR)
Remarks
97 ETV UP 11.12 Converted from FTA to pay channel w.e.f. 12.0
2008.
As on 01.12.2007, rate of the channel was Rs. 10.40
W.e.f. 01.11.2009, rate of the channel increased to
11.12 .
98 ETV Bihar 11.12 Converted from FTA to pay channel w.e.f. 12.0
2008.
As on 01.12.2007, rate of the channel was Rs. 10.40
W.e.f. 01.11.2009, rate of the channel increased to
11.12 .
99 ETV Urdu 11.12 Converted from FTA to pay channel w.e.f. 12.0
2008.
As on 01.12.2007, rate of the channel was Rs. 10.40
W.e.f. 01.11.2009, rate of the channel increased to
11.12 .
100 ETV Rajasthan 11.12 Converted from FTA to pay channel w.e.f. 12.0
2008.
As on 01.12.2007, rate of the channel was Rs. 10.40
W.e.f. 01.11.2009, rate of the channel increased to
11.12 .
101 ETV MP 11.12 Converted from FTA to pay channel w.e.f. 12.0
2008.
As on 01.12.2007, rate of the channel was Rs. 10.40
W.e.f. 01.11.2009, rate of the channel increased to
11.12 .
102 Bindass 10.00
103 Bindass Movies 10.00
104 World Movies 10.00 Launch of channel reported vide letter da
11.02.2008
105 UTV Movies 15.00 Launch of channel reported vide letter da
11.03.2008
6. M/s UTV
Global
BroadcastingLimited
106 UTVi 08.50 Launch of channel reported vide letter da
02.04.2008
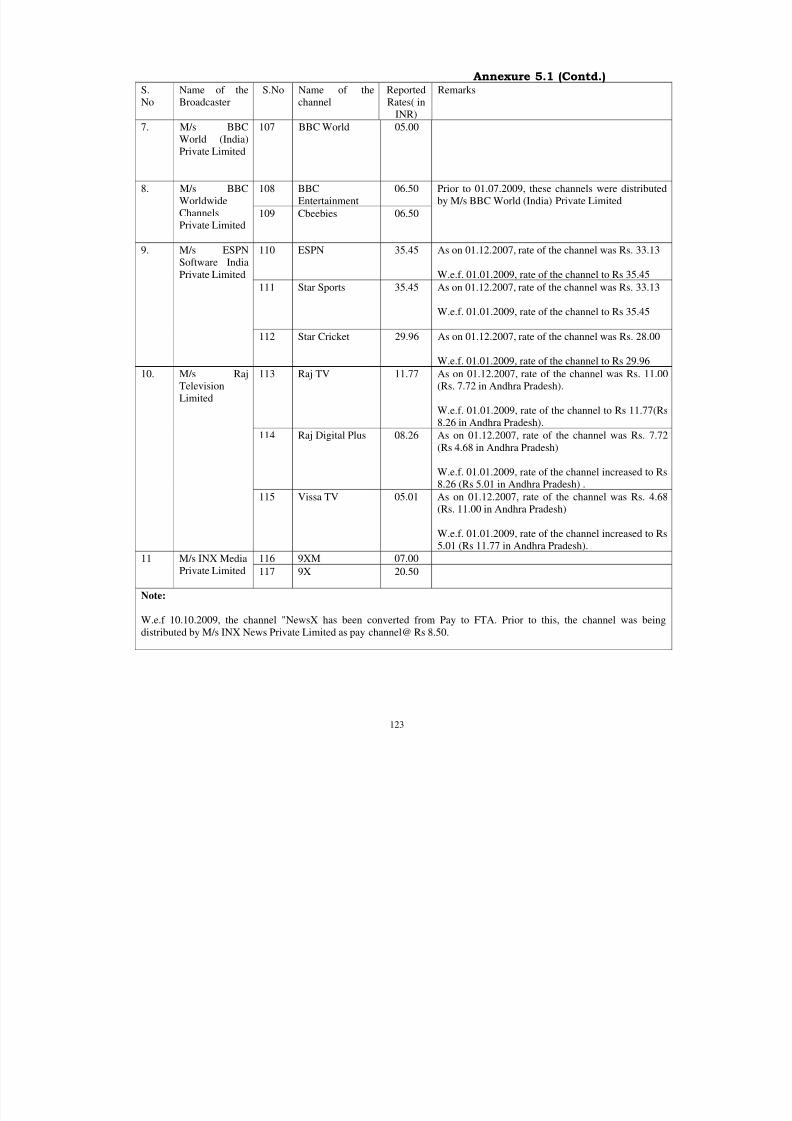
8/9/2019 Indicator Report Apr 10
http://slidepdf.com/reader/full/indicator-report-apr-10 137/150
123
Annexure 5.1 (Contd.)S.
No
Name of the
Broadcaster
S.No Name of the
channel
Reported
Rates( in
INR)
Remarks
7. M/s BBC
World (India)
Private Limited
107 BBC World 05.00
108 BBC
Entertainment
06.508. M/s BBC
Worldwide
Channels
Private Limited109 Cbeebies 06.50
Prior to 01.07.2009, these channels were distribut
by M/s BBC World (India) Private Limited
110 ESPN 35.45 As on 01.12.2007, rate of the channel was Rs. 33.13
W.e.f. 01.01.2009, rate of the channel to Rs 35.45
111 Star Sports 35.45 As on 01.12.2007, rate of the channel was Rs. 33.13
W.e.f. 01.01.2009, rate of the channel to Rs 35.45
9. M/s ESPN
Software India
Private Limited
112 Star Cricket 29.96 As on 01.12.2007, rate of the channel was Rs. 28.00
W.e.f. 01.01.2009, rate of the channel to Rs 29.96
113 Raj TV 11.77 As on 01.12.2007, rate of the channel was Rs. 11
(Rs. 7.72 in Andhra Pradesh).
W.e.f. 01.01.2009, rate of the channel to Rs 11.77(
8.26 in Andhra Pradesh).
114 Raj Digital Plus 08.26 As on 01.12.2007, rate of the channel was Rs. 7
(Rs 4.68 in Andhra Pradesh)
W.e.f. 01.01.2009, rate of the channel increased to
8.26 (Rs 5.01 in Andhra Pradesh) .
10. M/s Raj
Television
Limited
115 Vissa TV 05.01 As on 01.12.2007, rate of the channel was Rs. 4
(Rs. 11.00 in Andhra Pradesh)
W.e.f. 01.01.2009, rate of the channel increased to
5.01 (Rs 11.77 in Andhra Pradesh).
116 9XM 07.0011 M/s INX Media
Private Limited 117 9X 20.50
Note:
W.e.f 10.10.2009, the channel "NewsX has been converted from Pay to FTA. Prior to this, the channel was bein
distributed by M/s INX News Private Limited as pay channel@ Rs 8.50.
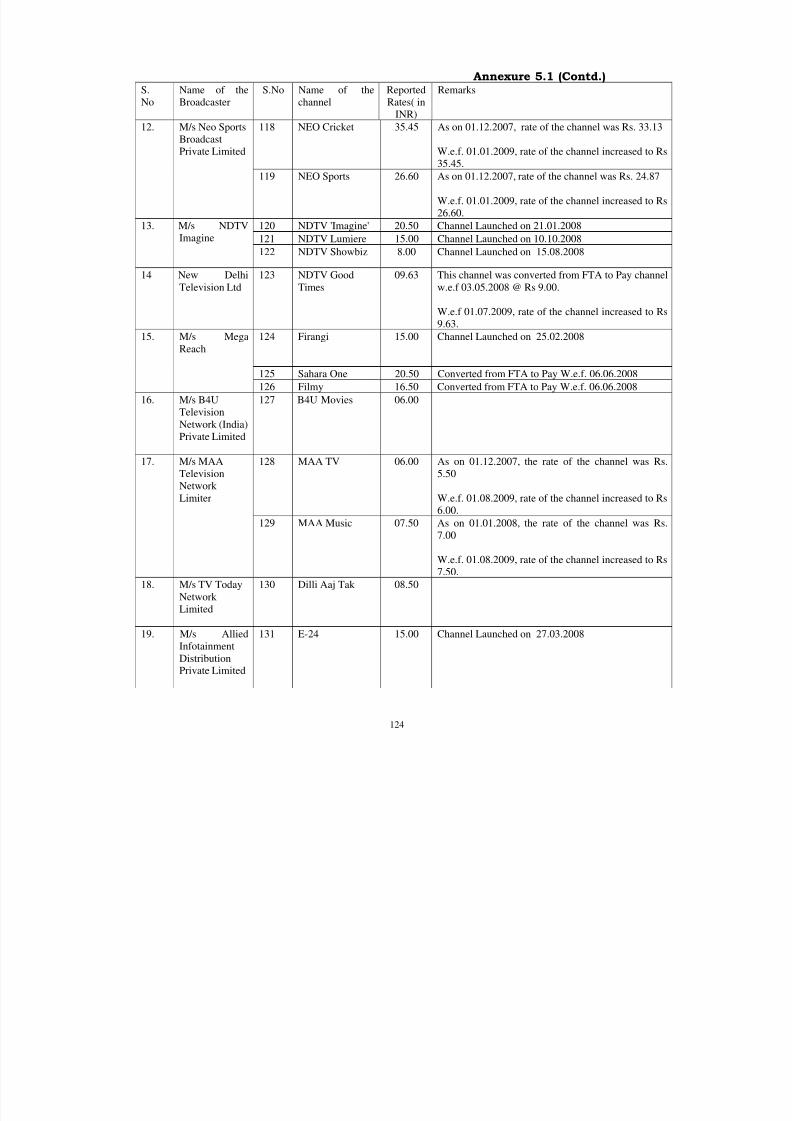
8/9/2019 Indicator Report Apr 10
http://slidepdf.com/reader/full/indicator-report-apr-10 138/150
124
Annexure 5.1 (Contd.)S.
No
Name of the
Broadcaster
S.No Name of the
channel
Reported
Rates( in
INR)
Remarks
118 NEO Cricket 35.45 As on 01.12.2007, rate of the channel was Rs. 33.1
W.e.f. 01.01.2009, rate of the channel increased to
35.45.
12. M/s Neo Sports
Broadcast
Private Limited
119 NEO Sports 26.60 As on 01.12.2007, rate of the channel was Rs. 24.87
W.e.f. 01.01.2009, rate of the channel increased to
26.60.
120 NDTV 'Imagine' 20.50 Channel Launched on 21.01.2008
121 NDTV Lumiere 15.00 Channel Launched on 10.10.2008
13. M/s NDTV
Imagine
122 NDTV Showbiz 8.00 Channel Launched on 15.08.2008
14 New Delhi
Television Ltd
123 NDTV Good
Times
09.63 This channel was converted from FTA to Pay chan
w.e.f 03.05.2008 @ Rs 9.00.
W.e.f 01.07.2009, rate of the channel increased to
9.63.
124 Firangi 15.00 Channel Launched on 25.02.2008
125 Sahara One 20.50 Converted from FTA to Pay W.e.f. 06.06.2008
15. M/s Mega
Reach
126 Filmy 16.50 Converted from FTA to Pay W.e.f. 06.06.2008
16. M/s B4U
Television
Network (India)
Private Limited
127 B4U Movies 06.00
128 MAA TV 06.00 As on 01.12.2007, the rate of the channel was R
5.50
W.e.f. 01.08.2009, rate of the channel increased to
6.00.
17. M/s MAA
Television
Network
Limiter
129 MAA Music 07.50 As on 01.01.2008, the rate of the channel was R
7.00
W.e.f. 01.08.2009, rate of the channel increased to
7.50.
18. M/s TV TodayNetwork
Limited
130 Dilli Aaj Tak 08.50
19. M/s Allied
Infotainment
DistributionPrivate Limited
131 E-24 15.00 Channel Launched on 27.03.2008
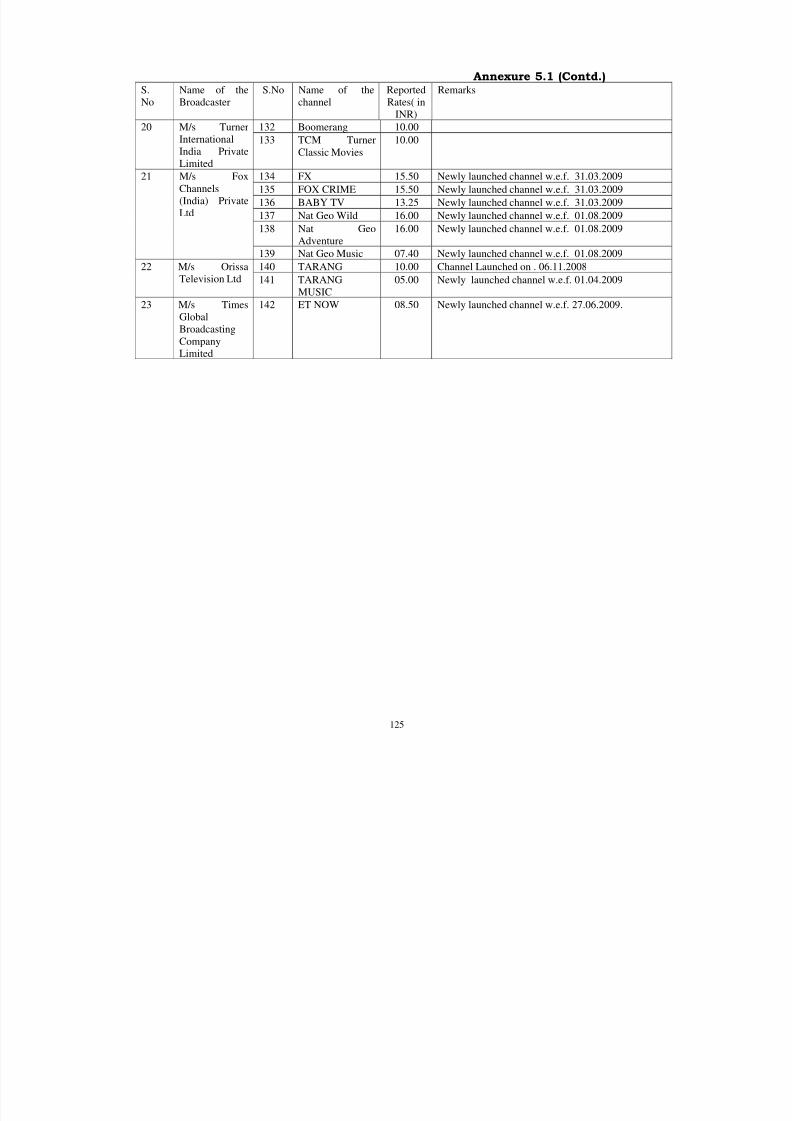
8/9/2019 Indicator Report Apr 10
http://slidepdf.com/reader/full/indicator-report-apr-10 139/150
125
Annexure 5.1 (Contd.)S.
No
Name of the
Broadcaster
S.No Name of the
channel
Reported
Rates( in
INR)
Remarks
132 Boomerang 10.0020 M/s Turner
International
India Private
Limited
133 TCM Turner
Classic Movies
10.00
134 FX 15.50 Newly launched channel w.e.f. 31.03.2009 135 FOX CRIME 15.50 Newly launched channel w.e.f. 31.03.2009 136 BABY TV 13.25 Newly launched channel w.e.f. 31.03.2009 137 Nat Geo Wild 16.00 Newly launched channel w.e.f. 01.08.2009 138 Nat Geo
Adventure
16.00 Newly launched channel w.e.f. 01.08.2009
21 M/s Fox
Channels
(India) Private
Ltd
139 Nat Geo Music 07.40 Newly launched channel w.e.f. 01.08.2009 140 TARANG 10.00 Channel Launched on . 06.11.200822 M/s Orissa
Television Ltd 141 TARANG
MUSIC
05.00 Newly launched channel w.e.f. 01.04.2009
23 M/s Times
Global
Broadcasting
CompanyLimited
142 ET NOW 08.50 Newly launched channel w.e.f. 27.06.2009.
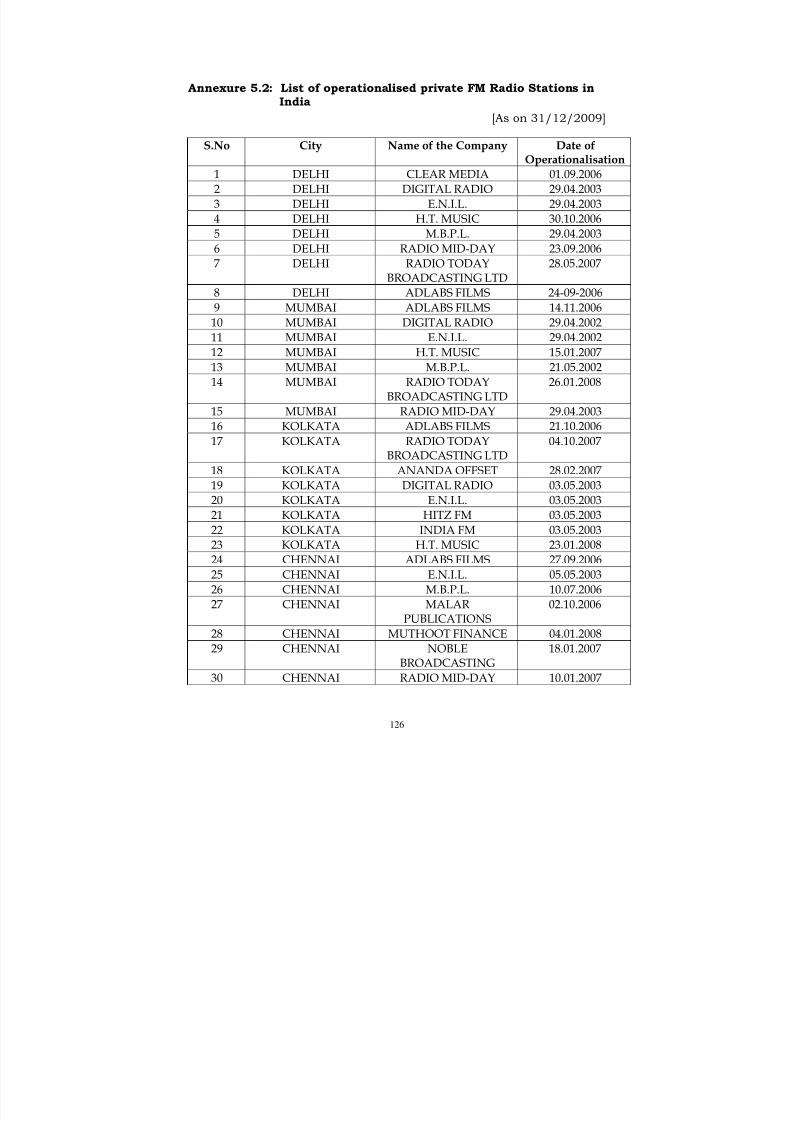
8/9/2019 Indicator Report Apr 10
http://slidepdf.com/reader/full/indicator-report-apr-10 140/150
126
Annexure 5.2: List of operationalised private FM Radio Stations inIndia
[As on 31/12/2009]
S.No City Name of the Company Date ofOperationalisation
1 DELHI CLEAR MEDIA 01.09.2006
2 DELHI DIGITAL RADIO 29.04.2003
3 DELHI E.N.I.L. 29.04.2003
4 DELHI H.T. MUSIC 30.10.2006
5 DELHI M.B.P.L. 29.04.2003
6 DELHI RADIO MID-DAY 23.09.2006
7 DELHI RADIO TODAYBROADCASTING LTD
28.05.2007
8 DELHI ADLABS FILMS 24-09-20069 MUMBAI ADLABS FILMS 14.11.2006
10 MUMBAI DIGITAL RADIO 29.04.2002
11 MUMBAI E.N.I.L. 29.04.2002
12 MUMBAI H.T. MUSIC 15.01.2007
13 MUMBAI M.B.P.L. 21.05.2002
14 MUMBAI RADIO TODAYBROADCASTING LTD
26.01.2008
15 MUMBAI RADIO MID-DAY 29.04.2003
16 KOLKATA ADLABS FILMS 21.10.2006
17 KOLKATA RADIO TODAYBROADCASTING LTD
04.10.2007
18 KOLKATA ANANDA OFFSET 28.02.2007
19 KOLKATA DIGITAL RADIO 03.05.2003
20 KOLKATA E.N.I.L. 03.05.2003
21 KOLKATA HITZ FM 03.05.2003
22 KOLKATA INDIA FM 03.05.2003
23 KOLKATA H.T. MUSIC 23.01.2008
24 CHENNAI ADLABS FILMS 27.09.2006
25 CHENNAI E.N.I.L. 05.05.2003
26 CHENNAI M.B.P.L. 10.07.200627 CHENNAI MALAR
PUBLICATIONS02.10.2006
28 CHENNAI MUTHOOT FINANCE 04.01.2008
29 CHENNAI NOBLEBROADCASTING
18.01.2007
30 CHENNAI RADIO MID-DAY 10.01.2007
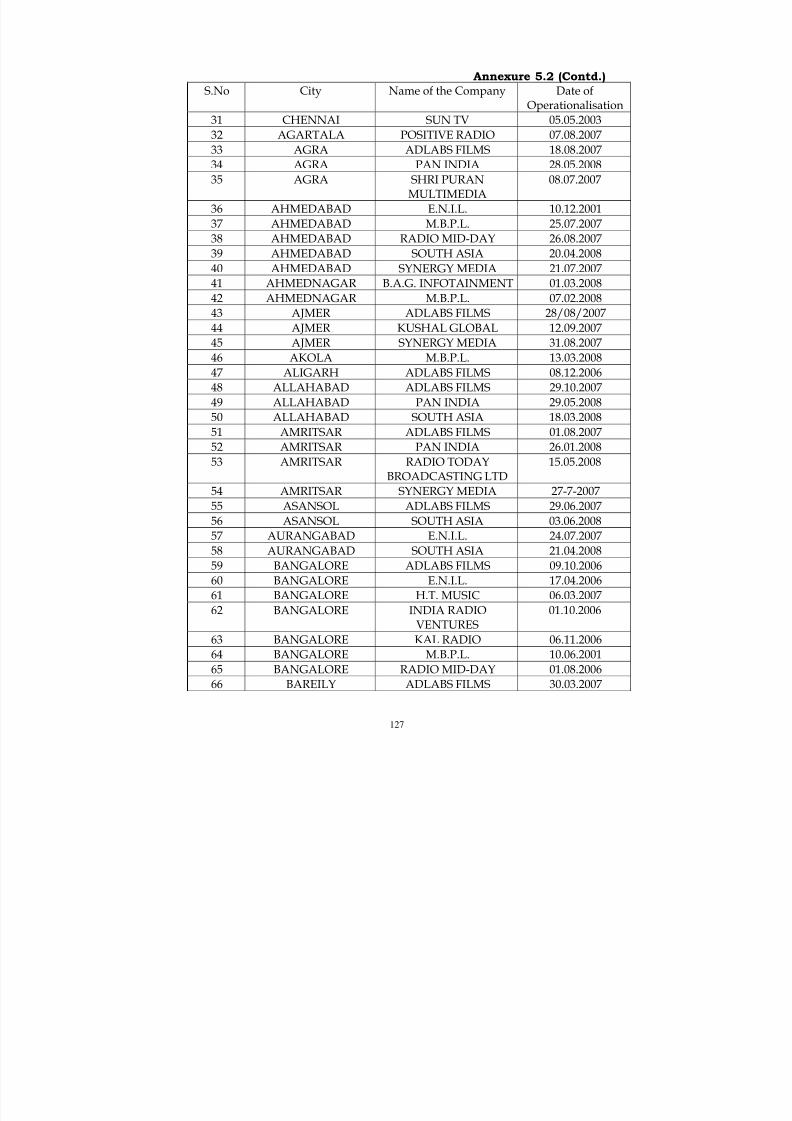
8/9/2019 Indicator Report Apr 10
http://slidepdf.com/reader/full/indicator-report-apr-10 141/150
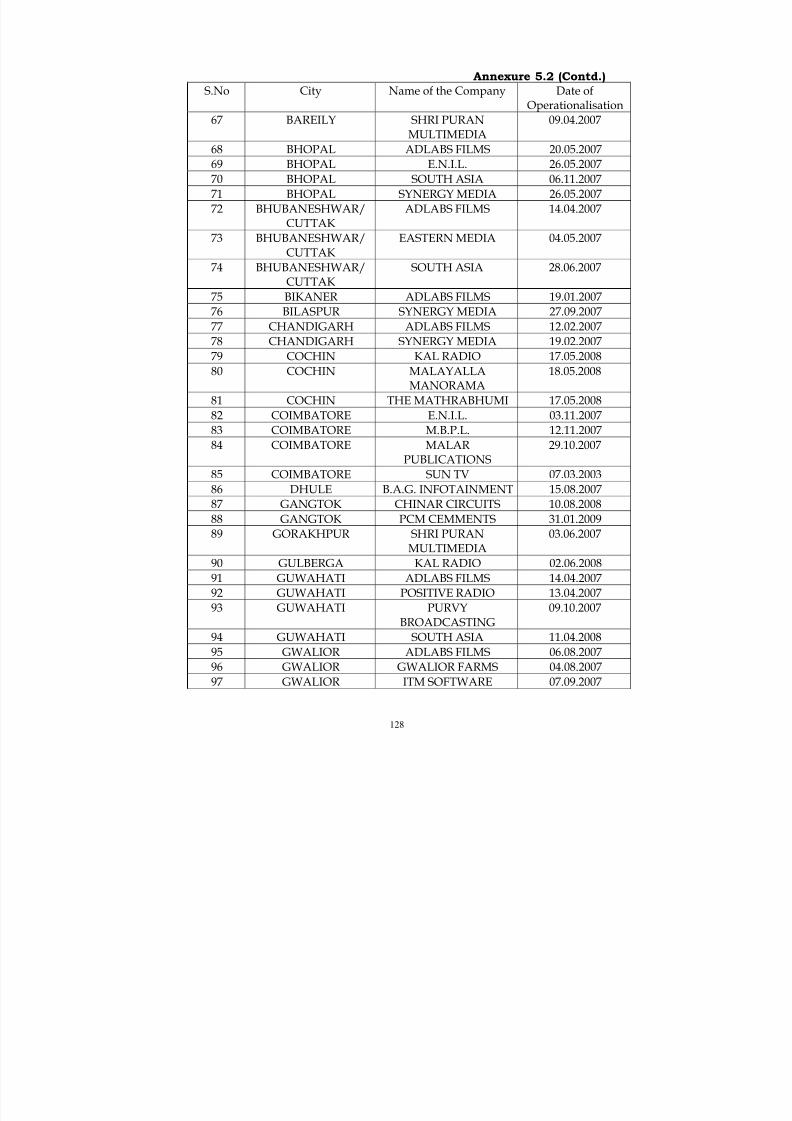
8/9/2019 Indicator Report Apr 10
http://slidepdf.com/reader/full/indicator-report-apr-10 142/150
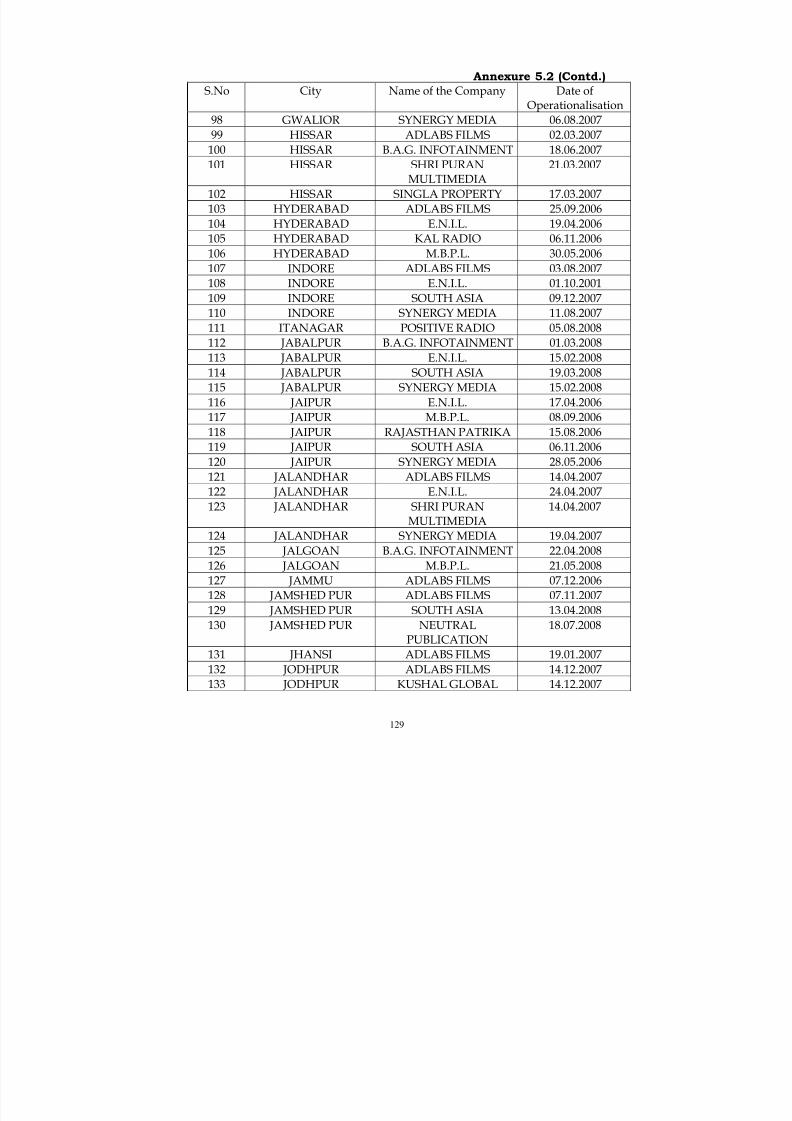
8/9/2019 Indicator Report Apr 10
http://slidepdf.com/reader/full/indicator-report-apr-10 143/150
129
Annexure 5.2 (Contd.)
S.No City Name of the Company Date ofOperationalisation
98 GWALIOR SYNERGY MEDIA 06.08.2007
99 HISSAR ADLABS FILMS 02.03.2007
100 HISSAR B.A.G. INFOTAINMENT 18.06.2007101 HISSAR SHRI PURAN
MULTIMEDIA21.03.2007
102 HISSAR SINGLA PROPERTY 17.03.2007
103 HYDERABAD ADLABS FILMS 25.09.2006
104 HYDERABAD E.N.I.L. 19.04.2006
105 HYDERABAD KAL RADIO 06.11.2006
106 HYDERABAD M.B.P.L. 30.05.2006
107 INDORE ADLABS FILMS 03.08.2007
108 INDORE E.N.I.L. 01.10.2001
109 INDORE SOUTH ASIA 09.12.2007110 INDORE SYNERGY MEDIA 11.08.2007
111 ITANAGAR POSITIVE RADIO 05.08.2008
112 JABALPUR B.A.G. INFOTAINMENT 01.03.2008
113 JABALPUR E.N.I.L. 15.02.2008
114 JABALPUR SOUTH ASIA 19.03.2008
115 JABALPUR SYNERGY MEDIA 15.02.2008
116 JAIPUR E.N.I.L. 17.04.2006
117 JAIPUR M.B.P.L. 08.09.2006
118 JAIPUR RAJASTHAN PATRIKA 15.08.2006
119 JAIPUR SOUTH ASIA 06.11.2006120 JAIPUR SYNERGY MEDIA 28.05.2006
121 JALANDHAR ADLABS FILMS 14.04.2007
122 JALANDHAR E.N.I.L. 24.04.2007
123 JALANDHAR SHRI PURANMULTIMEDIA
14.04.2007
124 JALANDHAR SYNERGY MEDIA 19.04.2007
125 JALGOAN B.A.G. INFOTAINMENT 22.04.2008
126 JALGOAN M.B.P.L. 21.05.2008
127 JAMMU ADLABS FILMS 07.12.2006
128 JAMSHED PUR ADLABS FILMS 07.11.2007
129 JAMSHED PUR SOUTH ASIA 13.04.2008
130 JAMSHED PUR NEUTRALPUBLICATION
18.07.2008
131 JHANSI ADLABS FILMS 19.01.2007
132 JODHPUR ADLABS FILMS 14.12.2007
133 JODHPUR KUSHAL GLOBAL 14.12.2007
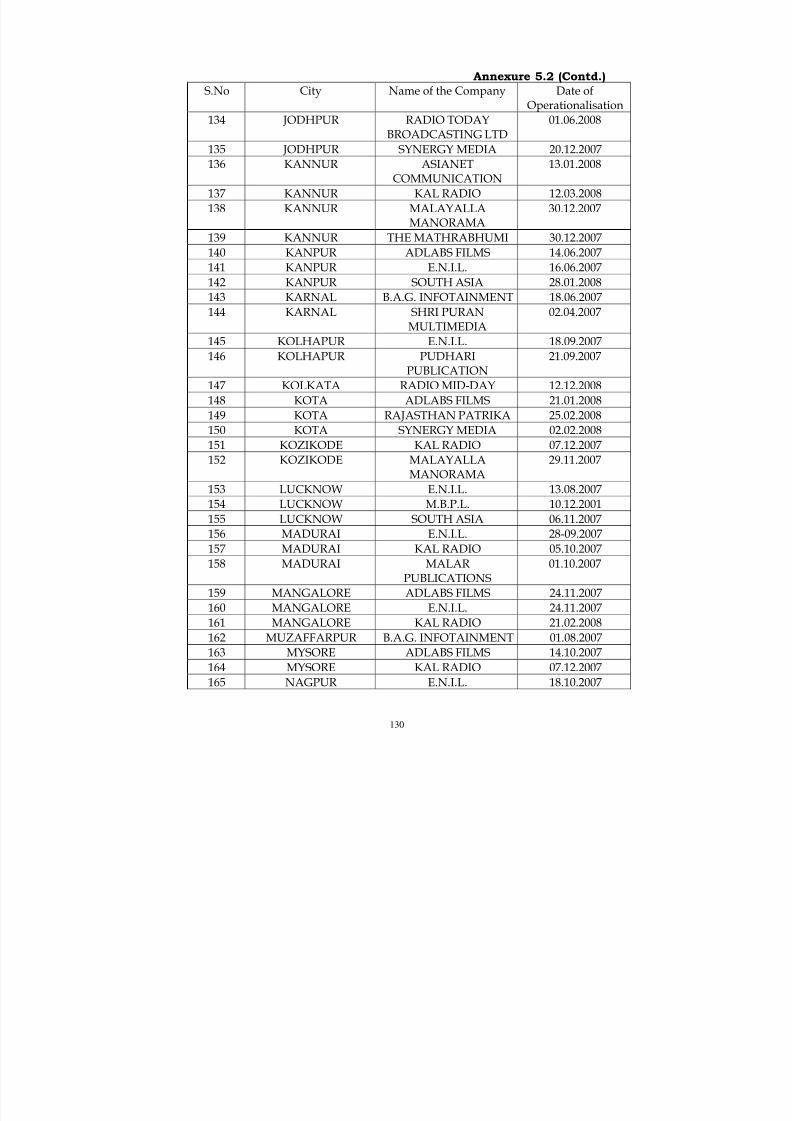
8/9/2019 Indicator Report Apr 10
http://slidepdf.com/reader/full/indicator-report-apr-10 144/150
130
Annexure 5.2 (Contd.)
S.No City Name of the Company Date ofOperationalisation
134 JODHPUR RADIO TODAYBROADCASTING LTD
01.06.2008
135 JODHPUR SYNERGY MEDIA 20.12.2007136 KANNUR ASIANET
COMMUNICATION13.01.2008
137 KANNUR KAL RADIO 12.03.2008
138 KANNUR MALAYALLAMANORAMA
30.12.2007
139 KANNUR THE MATHRABHUMI 30.12.2007
140 KANPUR ADLABS FILMS 14.06.2007
141 KANPUR E.N.I.L. 16.06.2007
142 KANPUR SOUTH ASIA 28.01.2008
143 KARNAL B.A.G. INFOTAINMENT 18.06.2007144 KARNAL SHRI PURAN
MULTIMEDIA02.04.2007
145 KOLHAPUR E.N.I.L. 18.09.2007
146 KOLHAPUR PUDHARIPUBLICATION
21.09.2007
147 KOLKATA RADIO MID-DAY 12.12.2008
148 KOTA ADLABS FILMS 21.01.2008
149 KOTA RAJASTHAN PATRIKA 25.02.2008
150 KOTA SYNERGY MEDIA 02.02.2008
151 KOZIKODE KAL RADIO 07.12.2007152 KOZIKODE MALAYALLA
MANORAMA29.11.2007
153 LUCKNOW E.N.I.L. 13.08.2007
154 LUCKNOW M.B.P.L. 10.12.2001
155 LUCKNOW SOUTH ASIA 06.11.2007
156 MADURAI E.N.I.L. 28-09.2007
157 MADURAI KAL RADIO 05.10.2007
158 MADURAI MALARPUBLICATIONS
01.10.2007
159 MANGALORE ADLABS FILMS 24.11.2007160 MANGALORE E.N.I.L. 24.11.2007
161 MANGALORE KAL RADIO 21.02.2008
162 MUZAFFARPUR B.A.G. INFOTAINMENT 01.08.2007
163 MYSORE ADLABS FILMS 14.10.2007
164 MYSORE KAL RADIO 07.12.2007
165 NAGPUR E.N.I.L. 18.10.2007
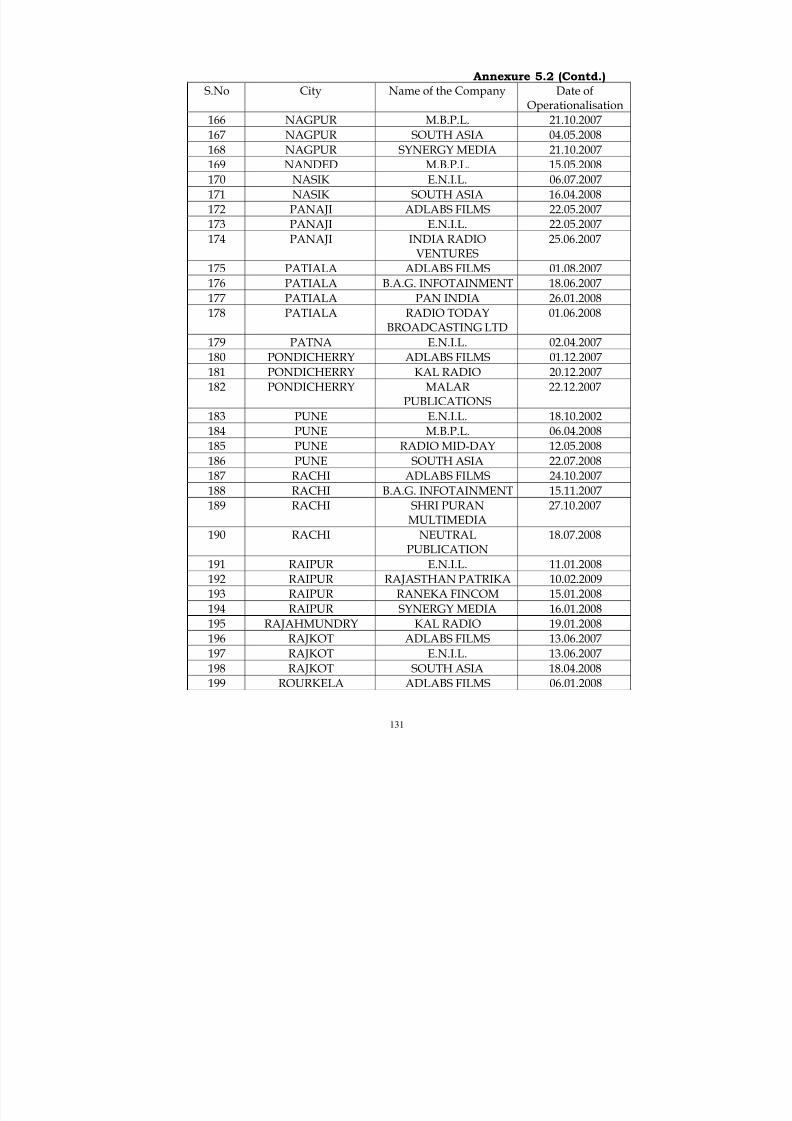
8/9/2019 Indicator Report Apr 10
http://slidepdf.com/reader/full/indicator-report-apr-10 145/150
131
Annexure 5.2 (Contd.)
S.No City Name of the Company Date ofOperationalisation
166 NAGPUR M.B.P.L. 21.10.2007
167 NAGPUR SOUTH ASIA 04.05.2008
168 NAGPUR SYNERGY MEDIA 21.10.2007169 NANDED M.B.P.L. 15.05.2008
170 NASIK E.N.I.L. 06.07.2007
171 NASIK SOUTH ASIA 16.04.2008
172 PANAJI ADLABS FILMS 22.05.2007
173 PANAJI E.N.I.L. 22.05.2007
174 PANAJI INDIA RADIOVENTURES
25.06.2007
175 PATIALA ADLABS FILMS 01.08.2007
176 PATIALA B.A.G. INFOTAINMENT 18.06.2007
177 PATIALA PAN INDIA 26.01.2008178 PATIALA RADIO TODAY
BROADCASTING LTD01.06.2008
179 PATNA E.N.I.L. 02.04.2007
180 PONDICHERRY ADLABS FILMS 01.12.2007
181 PONDICHERRY KAL RADIO 20.12.2007
182 PONDICHERRY MALARPUBLICATIONS
22.12.2007
183 PUNE E.N.I.L. 18.10.2002
184 PUNE M.B.P.L. 06.04.2008
185 PUNE RADIO MID-DAY 12.05.2008186 PUNE SOUTH ASIA 22.07.2008
187 RACHI ADLABS FILMS 24.10.2007
188 RACHI B.A.G. INFOTAINMENT 15.11.2007
189 RACHI SHRI PURANMULTIMEDIA
27.10.2007
190 RACHI NEUTRALPUBLICATION
18.07.2008
191 RAIPUR E.N.I.L. 11.01.2008
192 RAIPUR RAJASTHAN PATRIKA 10.02.2009
193 RAIPUR RANEKA FINCOM 15.01.2008194 RAIPUR SYNERGY MEDIA 16.01.2008
195 RAJAHMUNDRY KAL RADIO 19.01.2008
196 RAJKOT ADLABS FILMS 13.06.2007
197 RAJKOT E.N.I.L. 13.06.2007
198 RAJKOT SOUTH ASIA 18.04.2008
199 ROURKELA ADLABS FILMS 06.01.2008
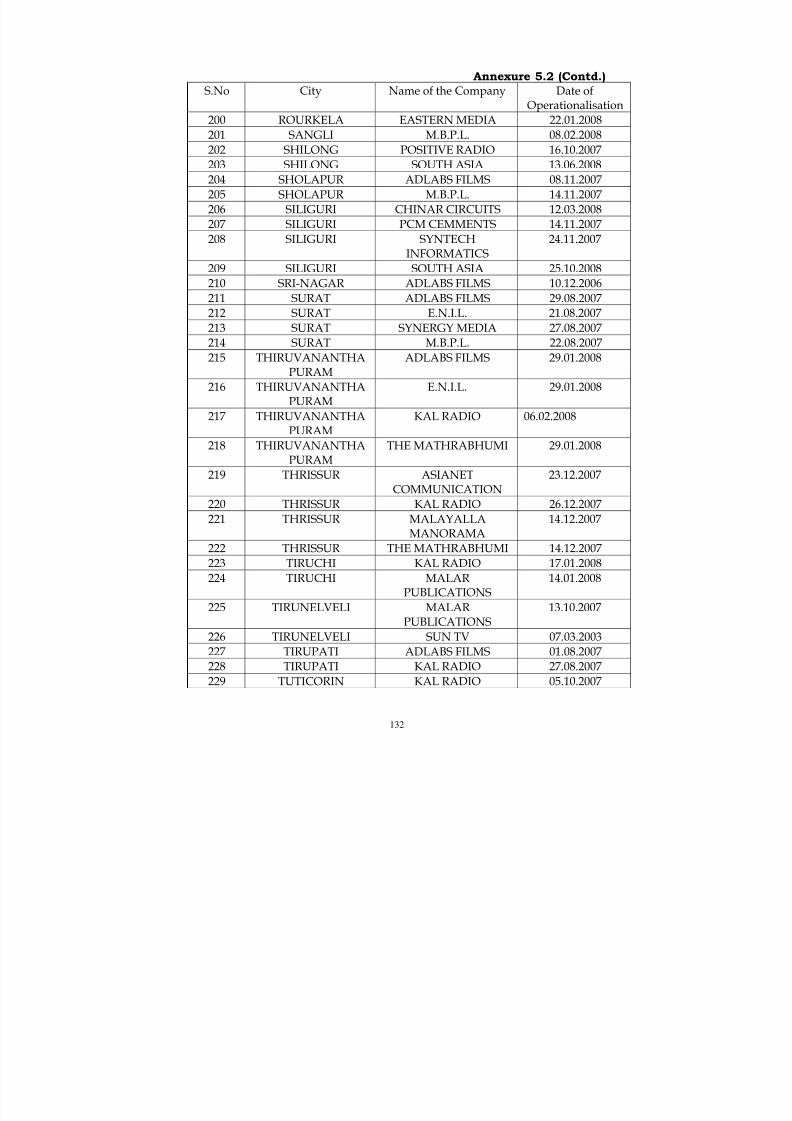
8/9/2019 Indicator Report Apr 10
http://slidepdf.com/reader/full/indicator-report-apr-10 146/150
132
Annexure 5.2 (Contd.)
S.No City Name of the Company Date ofOperationalisation
200 ROURKELA EASTERN MEDIA 22.01.2008
201 SANGLI M.B.P.L. 08.02.2008
202 SHILONG POSITIVE RADIO 16.10.2007203 SHILONG SOUTH ASIA 13.06.2008
204 SHOLAPUR ADLABS FILMS 08.11.2007
205 SHOLAPUR M.B.P.L. 14.11.2007
206 SILIGURI CHINAR CIRCUITS 12.03.2008
207 SILIGURI PCM CEMMENTS 14.11.2007
208 SILIGURI SYNTECHINFORMATICS
24.11.2007
209 SILIGURI SOUTH ASIA 25.10.2008
210 SRI-NAGAR ADLABS FILMS 10.12.2006
211 SURAT ADLABS FILMS 29.08.2007212 SURAT E.N.I.L. 21.08.2007
213 SURAT SYNERGY MEDIA 27.08.2007
214 SURAT M.B.P.L. 22.08.2007
215 THIRUVANANTHAPURAM
ADLABS FILMS 29.01.2008
216 THIRUVANANTHAPURAM
E.N.I.L. 29.01.2008
217 THIRUVANANTHAPURAM
KAL RADIO 06.02.2008
218 THIRUVANANTHAPURAM
THE MATHRABHUMI 29.01.2008
219 THRISSUR ASIANETCOMMUNICATION
23.12.2007
220 THRISSUR KAL RADIO 26.12.2007
221 THRISSUR MALAYALLAMANORAMA
14.12.2007
222 THRISSUR THE MATHRABHUMI 14.12.2007
223 TIRUCHI KAL RADIO 17.01.2008
224 TIRUCHI MALAR
PUBLICATIONS
14.01.2008
225 TIRUNELVELI MALARPUBLICATIONS
13.10.2007
226 TIRUNELVELI SUN TV 07.03.2003
227 TIRUPATI ADLABS FILMS 01.08.2007
228 TIRUPATI KAL RADIO 27.08.2007
229 TUTICORIN KAL RADIO 05.10.2007
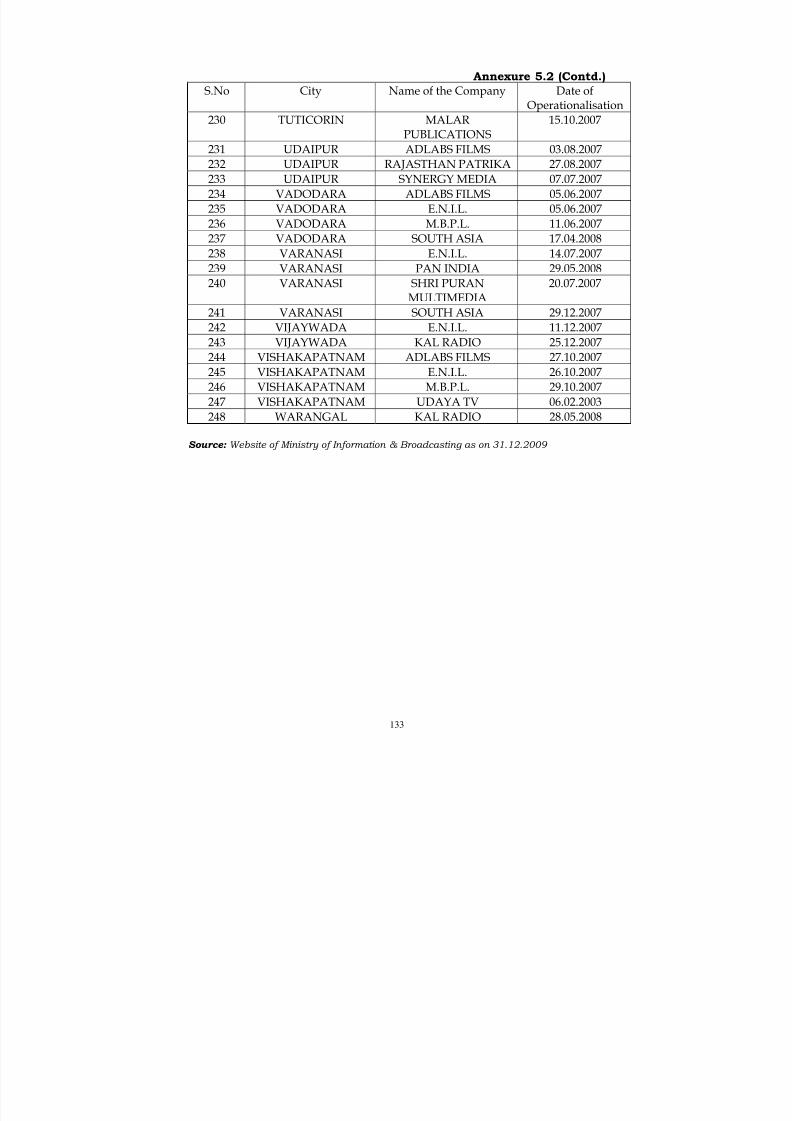
8/9/2019 Indicator Report Apr 10
http://slidepdf.com/reader/full/indicator-report-apr-10 147/150
133
Annexure 5.2 (Contd.)
S.No City Name of the Company Date ofOperationalisation
230 TUTICORIN MALARPUBLICATIONS
15.10.2007
231 UDAIPUR ADLABS FILMS 03.08.2007232 UDAIPUR RAJASTHAN PATRIKA 27.08.2007
233 UDAIPUR SYNERGY MEDIA 07.07.2007
234 VADODARA ADLABS FILMS 05.06.2007
235 VADODARA E.N.I.L. 05.06.2007
236 VADODARA M.B.P.L. 11.06.2007
237 VADODARA SOUTH ASIA 17.04.2008
238 VARANASI E.N.I.L. 14.07.2007
239 VARANASI PAN INDIA 29.05.2008
240 VARANASI SHRI PURAN
MULTIMEDIA
20.07.2007
241 VARANASI SOUTH ASIA 29.12.2007
242 VIJAYWADA E.N.I.L. 11.12.2007
243 VIJAYWADA KAL RADIO 25.12.2007
244 VISHAKAPATNAM ADLABS FILMS 27.10.2007
245 VISHAKAPATNAM E.N.I.L. 26.10.2007
246 VISHAKAPATNAM M.B.P.L. 29.10.2007
247 VISHAKAPATNAM UDAYA TV 06.02.2003
248 WARANGAL KAL RADIO 28.05.2008
Source: Website of Ministry of Information & Broadcasting as on 31.12.2009
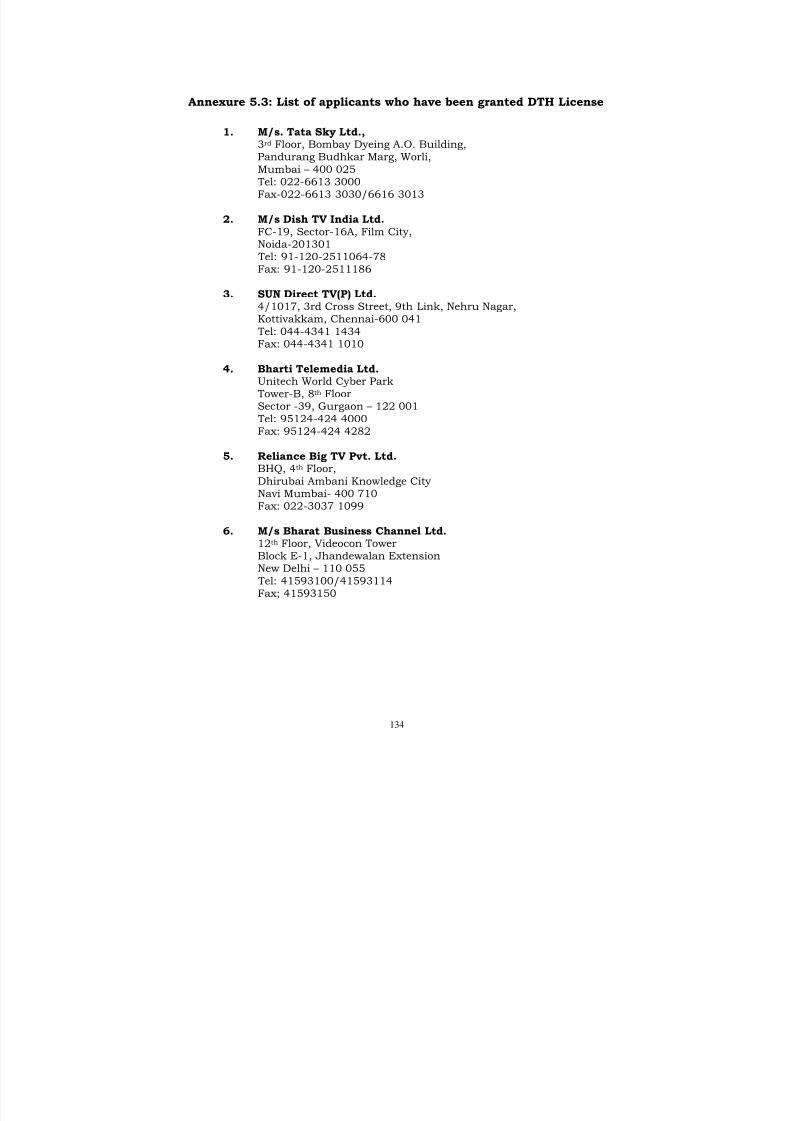
8/9/2019 Indicator Report Apr 10
http://slidepdf.com/reader/full/indicator-report-apr-10 148/150
134
Annexure 5.3: List of applicants who have been granted DTH License
1. M/s. Tata Sky Ltd.,
3rd
Floor, Bombay Dyeing A.O. Building,Pandurang Budhkar Marg, Worli,Mumbai – 400 025
Tel: 022-6613 3000Fax-022-6613 3030/6616 3013
2. M/s Dish TV India Ltd.FC-19, Sector-16A, Film City,Noida-201301
Tel: 91-120-2511064-78Fax: 91-120-2511186
3. SUN Direct TV(P) Ltd.4/1017, 3rd Cross Street, 9th Link, Nehru Nagar,Kottivakkam, Chennai-600 041
Tel: 044-4341 1434Fax: 044-4341 1010
4. Bharti Telemedia Ltd.Unitech World Cyber Park
Tower-B, 8th FloorSector -39, Gurgaon – 122 001
Tel: 95124-424 4000Fax: 95124-424 4282
5. Reliance Big TV Pvt. Ltd.BHQ, 4th Floor,Dhirubai Ambani Knowledge CityNavi Mumbai- 400 710Fax: 022-3037 1099
6. M/s Bharat Business Channel Ltd.12th Floor, Videocon TowerBlock E-1, Jhandewalan ExtensionNew Delhi – 110 055
Tel: 41593100/41593114
Fax; 41593150
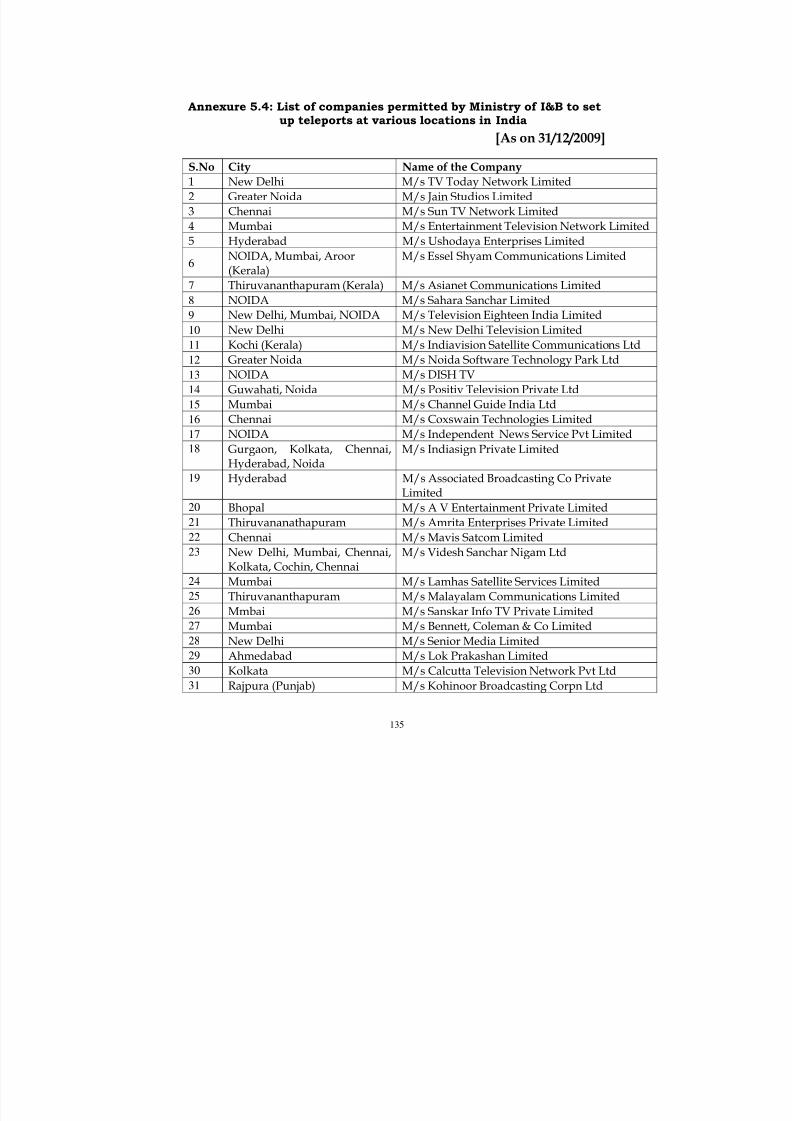
8/9/2019 Indicator Report Apr 10
http://slidepdf.com/reader/full/indicator-report-apr-10 149/150
135
Annexure 5.4: List of companies permitted by Ministry of I&B to setup teleports at various locations in India
[As on 31/12/2009]
S.No City Name of the Company
1 New Delhi M/s TV Today Network Limited
2 Greater Noida M/s Jain Studios Limited
3 Chennai M/s Sun TV Network Limited
4 Mumbai M/s Entertainment Television Network Limited
5 Hyderabad M/s Ushodaya Enterprises Limited
6NOIDA, Mumbai, Aroor(Kerala)
M/s Essel Shyam Communications Limited
7 Thiruvananthapuram (Kerala) M/s Asianet Communications Limited
8 NOIDA M/s Sahara Sanchar Limited
9 New Delhi, Mumbai, NOIDA M/s Television Eighteen India Limited
10 New Delhi M/s New Delhi Television Limited
11 Kochi (Kerala) M/s Indiavision Satellite Communications Ltd
12 Greater Noida M/s Noida Software Technology Park Ltd
13 NOIDA M/s DISH TV
14 Guwahati, Noida M/s Positiv Television Private Ltd
15 Mumbai M/s Channel Guide India Ltd
16 Chennai M/s Coxswain Technologies Limited
17 NOIDA M/s Independent News Service Pvt Limited18 Gurgaon, Kolkata, Chennai,
Hyderabad, NoidaM/s Indiasign Private Limited
19 Hyderabad M/s Associated Broadcasting Co PrivateLimited
20 Bhopal M/s A V Entertainment Private Limited21 Thiruvananathapuram M/s Amrita Enterprises Private Limited22 Chennai M/s Mavis Satcom Limited23 New Delhi, Mumbai, Chennai,
Kolkata, Cochin, ChennaiM/s Videsh Sanchar Nigam Ltd
24 Mumbai M/s Lamhas Satellite Services Limited25 Thiruvananthapuram M/s Malayalam Communications Limited26 Mmbai M/s Sanskar Info TV Private Limited27 Mumbai M/s Bennett, Coleman & Co Limited28 New Delhi M/s Senior Media Limited29 Ahmedabad M/s Lok Prakashan Limited30 Kolkata M/s Calcutta Television Network Pvt Ltd31 Rajpura (Punjab) M/s Kohinoor Broadcasting Corpn Ltd

8/9/2019 Indicator Report Apr 10
http://slidepdf.com/reader/full/indicator-report-apr-10 150/150
Annexure 5.4 (Contd.)
S.No City Name of the Company32 Bhubaneshwar M/s Kamyab TV Private Limited33 Bangalore M/s Kasthuri Media's Private Limited34 Kolkata M/s SST Media Private Limited
35 Alapuzza M/s MM TV Limited36 Hyderabad M/s IN Cablenet (Andhra) Limited37 Hyderabad M/s Indira Television Limited38 New Delhi M/s Tata Sky Limited39 NOIDA M/s Media Content & Communications Services
(India) Private Limited40 Bangalore M/s Satish Sugars Limited41 Delhi M/s MH One TV Network Limited42 New Delhi M/s S TV Enterprises Limited43 Surat M/s AIRR X Media Limited
44 New Delhi M/s Broadcast Equipment (India) Private Ltd45 Hyderabad M/s Winning Edge Communications Limited46 Hyderabad M/s Rachna Television Private Limited47 Bhubneshwar M/s Ortel Communications Limited48 Hyderabad M/s Sowbhagya Exports Limited49 NOIDA M/s Pragya Vision Private Limited50 Guwahati M/s Brahmaputra Tele-Productions Pvt Limited51 New Delhi M/s G-Next Media Private Limited