induced tumor necrosis factorproduction in rabbit macroph
TRANSCRIPT

Adaptation to Bacterial Lipopolysaccharide Controls Lipopolysaccharide-induced Tumor Necrosis Factor Production in Rabbit MacrophagesJ. C. Mathison, G. D. Virca, E. Wolfson, P. S. Tobias, K. Glaser,* and R. J. UlevitchDepartment ofImmunology, Research Institute ofScripps Clinic, La Jolla, California 92037; and*Department ofChemistry, University ofCalifornia, San Diego, La Jolla, California 92037
Abstract
These experiments provide an explanation for the observationthat two intravenous injections of lipopolysaccharide (LPS)spaced 5 h apart in rabbits cause tumor necrosis factor/ca-chectin (TNF) levels to rise in the blood only after the firstLPS injection. Herein we show that treatment of elicited peri-toneal exudate rabbit macrophages (PEM) with two doses ofLPS given 9 h apart results in a marked reduction in TNFproduction by the second LPS exposure. This state of hypore-sponsiveness is a result of adaptation to LPS, is induced byLPS concentrations that are 1,000-fold less than required toinduce TNF production (picograms vs. nanograms), is charac-terized by a decrease in LPS-induced TNF mRNA without anychange in TNF mRNA half-life, is not changed by includingindomethacin in cultures, and is specific for LPS since LPS-adapted cells display a TNF response to heat-killed Staphylo-coccus aureus that is at least as good as that observed in controlPEM. (J. Clin. Invest. 1990. 85:1108-1118.) endotoxemia-monokines - septicemia * shock * tolerance
Introduction
The importance of the cytokine tumor necrosis factor-alpha/cachectin (TNF)I as a mediator of host defense and inflamma-tory responses is now well documented (1). A key role for TNFhas been established in models of shock induced by endotoxin(lipopolysaccharide, LPS) and gram-negative bacteria (1-3).LPS is a potent inducer ofTNF's being active in the picomolarrange (3). However, induction of TNF by LPS is under tightcontrol as documented in a recent study from our laboratorywhere we showed that sequential intravenous injections ofLPS results in TNF release into blood after only the initial LPSinjection and not with the second LPS dose (3). The mecha-nism responsible for acquired hyporesponsiveness had notbeen defined although it could not be induced by infusion of
This is Department of Immunology Publication No. 5972-IMM.Address reprint requests to Dr. Ulevitch, Department of Immunol-
ogy, Research Institute of Scripps Clinic, 10666 North Torrey PinesRoad, La Jolla, CA 92037.
Received for publication 3 August 1989 and in revised form 10November 1989.
1. Abbreviations used in this paper: DEP, diethyl pyrocarbonate;GAPDH, glyceraldehyde-3-phosphate dehydrogenase; PEM, elicitedperitoneal exudate macrophages; R-, rough-form LPS; S-, smooth-form LPS; TNF, tumor necrosis factor/cachetin.
recombinant TNF alone eliminating mechanisms involvingnegative feedback by TNF or TNF-inducible cell products (3).
The diminished TNF response in vivo is most likely a re-sult of decreased response to LPS by cells of the monocyte/macrophage lineage, the cell type that is the major source ofLPS-induced TNF in vivo (1). This change in sensitivity toLPS might be explained by a process known as adaptation (4).
Tolerance or acquired hyporesponsiveness to the toxic ef-fects of LPS has been recognized for many years although themechanisms that control this are not well understood (re-viewed in Johnston and Greisman [5]). Two distinct phases ofendotoxin tolerance have been recognized: early-phase toler-ance that is a lipid A-dependent phenomenon and protectsagainst challenge with any LPS and late-phase tolerance thathas O-antigen specificity and is dependent upon specific anti-LPS antibodies in the circulation. It is our hypothesis thatadaptation to LPS at the level of the macrophage is an impor-tant feature ofearly-phase tolerance to the toxic effects of LPS.In this regard a recent report from this laboratory using themurine macrophage-like cell line RAW 264.7 cells establishesthat LPS induces hyporesponsiveness to its own effects (6).
Studies described here with rabbits and with elicited rabbitperitoneal exudate macrophages (PEM) investigate the mecha-nism of acquired hyporesponsiveness to LPS measuring TNFproduction at the mRNA and protein level. We show thathyporesponsiveness to LPS is induced 6-9 h after exposure totrace amounts of LPS and is characterized by specific adapta-tion to LPS. Compared with control cells, LPS-adapted PEMrequire up to 1,000-fold more LPS to induce TNF althoughLPS-adapted PEM, in contrast, display dose-response curvesfor Staphylococcus aureus-induced TNF production that arevery similar to control (nonadapted) PEM.
MethodsAnimals. Outbred New Zealand white rabbits (male, 1.8-2.2 kg) wereobtained from White's Rabbit Ranch, Vista, CA and maintained on astandard pelleted diet for 7-14 d before use.
In vivo studies. LPS-induced hyporesponsiveness was studied inNew Zealand white rabbits which were fasted overnight and cannu-lated (femoral artery) under local anesthesia using 1% procaine asdescribed previously (3). The rabbits were placed in restraining suits,which permitted the animals to stand or recline in the prone positionwithout disrupting experimental procedures, and injections of LPS insterile saline were made through the marginal ear vein. Blood samplescollected using the femoral artery catheter were clotted in sterile glasstubes, and serum was stored at -20°C pending TNF assay.
Macrophage activators and inhibitors. Salmonella minnesotaRe595 LPS was extracted from late log-phase growth cultures using thephenol chloroform petroleum ether method as described previously (3,7). An additional rough strain (Re) LPS, Escherichia coli K 12 D3 I m4and the following smooth strain LPS, E. coli 0111 :B4, S. minnesota(wild type) and Salmonella typhimurium were obtained from List Bio-logical Laboratories, Inc., Campbell, CA. Stock solutions of LPS were
prepared by suspending 10 mg of LPS in 2 ml of 20 mM EDTA and
1108 Mathison et al.
J. Clin. Invest.© The American Society for Clinical Investigation, Inc.0021-9738/90/04/1108/11 $2.00Volume 85, April 1990, 1108-1118

sonicating until clarified (3-5 20-s bursts at maximum intensity using aW375 sonicator with a No. 419 microtip (Heat Systems-Ultrasonics,Farmingdale, NY). Aliquots of the LPS stocks (200 ,d) were stored at-20'C, and when thawed for use were sonicated for 15 s using amicrosonicator (Kontes Co., Vineland, NJ). LPS working dilutionswere prepared in 10mM Hepes saline which was formulated using I MHepes stock (Gibco Laboratories, Grand Island, NY) and sterile, non-pyrogenic saline (0.9% sodium chloride irrigation, USP, Travenol Lab-oratories, Deerfield, IL). Serial dilutions were made using sterile poly-propylene pipettes and tubes, and each solution was vigorously vor-texed for 15 s before transfer. Heat-killed S. aureus, a gift from Dr.Theo N. Kirkland, Veterans Administration Hospital, San Diego, CA,was a clinical isolate that was grown overnight in trypticase soy broth,washed in saline, and boiled for 2 h. The final stock concentration wasI X 10" cells/ml.A 10 mM stock of indomethacin was prepared in 95% ethanol and
diluted in serum-free RPMI 1640 immediately before use. Actinomy-cin D (I mg/ml stock solution) was prepared in 10 mM Hepes saline.
Establishment of LPS-adapted peritoneal exudate macrophages.Media and solutions used for macrophage culture were prepared usingsterile, tissue culture-grade plasticware. Glassware employed in mediapreparation was acid-cleaned and baked overnight at 200C to inacti-vate endotoxin. RPMI 1640 was obtained as powered cell culturemedium (Gibco Laboratories) and dissolved in sterile nonpyrogenicwater (Travenol Laboratories) and supplemented with 2 mM L-gluta-mine, 1 mM sodium pyruvate, and 10 mM Hepes as described pre-viously (3).
PEM were obtained by lavage 3 d after intraperitoneal injection ofmineral oil in rabbits as described previously (3). The PEM werewashed and cultured in serum-free RPMI 1640 in six-well clusters(3.5-cm wells, 5 X 10⁶ PEM per well, 3 ml of medium) or 150-cm2flasks (8 X I07 PEM per flask, 40 ml of serum-free medium) followedby washing to remove nonadherent cells and replenishment of serum-free medium (1.25 ml per well, 20 ml per flask). In studies ofadaptiveresponses, freshly prepared adherent PEM were exposed to primarydoses (0.001-3,000 pg ofLPS/ml) for 3-18 h followed by collection ofconditioned medium, washing, replenishment of medium, and stimu-lation with a challenge dose of LPS (1-100 ng/ml). The conditionedmedium was harvested 0-12 h after challenge, and cell viability wasdetermined by phase-contrast fluorescence microscopy of cultureswhich had been incubated 15 m at 37°C, 5% CO with serum-freemedium containing 1 gg/ml fluorescein diacetate (8). In some cases thePEM were lysed by addition of guanidinium thiocyanate for prepara-tion of total cellular RNA.
Cytolytic assayfor TNF. TNF was measured using a cytolytic assaywith actinomycin D (1 Mg/ml)-treated L929 cells as described pre-viously (3, 9). Each plate included TNF standard (conditioned me-dium from LPS-treated RAW 264.7 cells, 5 X I04 U/ml), which wascalibrated using human recombinant TNF standard obtained from theNational Institute for Biological Standards and Control, Hertfordshire,England. The coefficient of variation (SD/mean) for the assay was0. 1-0. 15. Experiments with PEM were performed and assayed in du-plicate; thus the experimental results represent the mean of four datapoints.
Prostaglandin assay. Prostaglandin E2 levels in PEM-conditionedmedium were measured using a radioimmunoassay as previously de-scribed (10).
Reagents and stock solutions for RNA preparation. All reagentsused were analytical reagent grade. Cesium chloride and redistilled,crystalline phenol were obtained from Bethesda Research Laborato-ries, Gaithersburg, MD. Guanidinium thiocyanate and diethylpyro-carbonate (DEP) were obtained from Fluka BioChemika, Ronkon-koma, NY. Chelex 100 (200-400 mesh, sodium form) was obtainedfrom Bio-Rad Laboratories, Richmond, CA. All glassware was acid-cleaned and heated at 180°C for 18 h before use. DEP-treated waterwas prepared by adding DEP (0.1% final concentration) to sterile dis-tilled water, shaking vigorously, standing at room temperature over-
night, and autoclaving at 121 'C for 60 min. The following stock solu-
tions were prepared, chelex-adsorbed, DEP-treated, and autoclaved asdescribed above: 4 M sodium chloride; 3 M sodium acetate, pH 6; 0.5M EDTA, pH 8; 1 M sodium phosphate buffer, pH 7; 0.5 M Pipes, pH6.8. The following solutions were prepared in sterile distilled waterfollowed by chelex treatment and autoclaving (121'C, 20 min): 2 MTris, pH 7.5; 1 M Tris, pH 8.
Tris-EDTA stock (20X) contained 10 ml of 2 M Tris, pH 7.5, and 4ml of0.5 M EDTA, pH 8, brought to 100 ml with DEP-water. Cesiumchloride (5.7 M stock in IX Tris-EDTA) was prepared using DEP-treated water, filtered (0.45 Mum), and autoclaved. SDS (10% stock insterile distilled water) was chelex-treated, followed by addition ofDEP(0.1% final) and heating overnight at 60'C. Sodium hydroxide (1OMstock) was prepared using sterile distilled water. 20X SSC (3 M sodiumchloride and 0.3 M trisodium citrate) was chelex- and DEP-treated andautoclaved as described above. Phenol was melted at 650C, 8-hy-droxyquinoline (0.1I% final) was added, and three washes were per-formed using equal volumes of I M Tris, pH 8. The washed phenol wasstored under nitrogen at 40C and, when used for RNA extractions, wasfurther equilibrated with sodium acetate buffer (0.01 M, pH 6) con-taining 0.1 M sodium chloride and 1 mM EDTA.
Lysis buffer (4 M guanidine thiocyanate, 25 mM trisodium citrate,0.5% sodium lauroyl sarcosine, and 10mM EDTA) was prepared usingDEP-water, chelex resin (- 100 mg/500 ml) was added with gentlestirring, and after standing for 60 min, the solution was filtered (I 1).Before use 2-mercaptoethanol and antifoam A were added to the lysisbuffer at 0.7% and 0.33% final concentrations, respectively.
RNA preparation and Northern blotting analysis. After removal ofmedium, adherent PEM in 150-cm2 flasks were lysed by addition of 4M guanidinium thiocyanate. DNA was sheared by passing the lysatethrough a 21-gauge needle, and the lysate was transferred to a 16X 76-mm polyallomer tube, underlaid with 2.5 ml of 5.7 M CsCI usinga spinal needle, and centrifuged 12 h at 40,000 rpm in a model 50 Tirotor (Beckman Instruments, Inc., Palo Alto, CA) (12). The superna-tant was aspirated and discarded and the RNA pellet was solubilized in400 Ml of IX TE and extracted twice with 500 Ml ofphenol-chloroform(1:1) and once with 1 ml chloroform-isopentyl alcohol (95:5) followedby precipitation, wash, and reprecipitation in 70% ethanol in the pres-ence of 0.3 M sodium acetate.
RNA was denatured using 1 M glyoxal and 50% dimethyl sulfoxidein 10mM phosphate, pH 7, for 1 h at 50°C (13). Loadingbuffer (2.5 ,l,containing 2.9 M sucrose, 2 mM EDTA, 20 mM Tris, and 0.3%bromphenol blue was added per 2O-Mul sample (15 Mg of RNA), andelectrophoresis was performed in 1.2% agarose for 18 h at I V/cm withrecirculation of the 10 mM phosphate, pH 7, running buffer. The gelwas stained for 15 min at room temperature in 0.01% acridine orangein 10 mM phosphate, pH 7, followed by several washes in phosphatebuffer over 2 h and examination under ultraviolet (UV) illumination.The RNA was transferred to nylon membranes using 20X SSC over-
night, and the membranes were then UV-treated for 2 min and heatedat 80°C for 2 h to fix the RNA to the filters (14).
Probes for TNF and glyceraldehyde-3-phosphate dehydrogenase(GAPDH) mRNA were prepared from synthetic oligonucleotides syn-thesized by Research Genetics, Huntsville, AL, based on the publishednucleotide sequence of rabbit TNF and GAPDH as shown below (15,16):
TNF coding strand corresponding to amino acid residues 67-86:
5'-TGCCGCTCCTACGTGCTCCTCACTCACACTGTCAGCCGCTTCGCCGTCTCCTACCCGAAC-3'
TNF antisense strand corresponding to amino acid residues 83-102:
5'-GGTCTCCCGGTGGCAGGGCTCTTGATGGCAGAGAGGAGGTTGACCTTGTTCGGGTAGGA-3'
GAPDH coding strand corresponding to amino acid residues 43-62:
5'-ATGTTCCAGTATGATTCCACCCACGGCAAGTrCCACGGCACGGTCAAGOCrGAGAACGGG-3'
Lipopolysaccharide-induced Adaptation to Its Own Effects 1109

GAPDH antisense strand corresponding to amino acid residues 59-78:
5'-ATCTCGCTCCTGGAAGATGGTGATGGCCTTCCCGTTGATGACCAGCTTCCCGTTCTCAGC-3'
Probes radiolabeled with 32P for use in Northern blot hybridiza-tions were synthesized as follows. Coding strand and antisense strand(100 ng each in 0.5 !d) were pipetted into a 1.5-ml conical polypropyl-ene tube containing 20 A1 of water, boiled for 2 min, and cooled toroom temperature for 10 min, and the following additions were madein a total volume of 60 ul: 150 ACi dATP (3,000 Ci/mmol) unlabeleddCTP, dGTP dTTP (25 ,M final), Klenow buffer (7 mM sodiumchloride, 7 mM Tris (pH 7.5), 7 mM MgCl, 5 mM dithiothreitol),Klenow fragment ofDNA polymerase 1 (7 U, Promega Biotec, Madi-son, WI). After 1 h at room temperature, the probe was separated fromthe reaction mixture by phenol-chloroform extraction (using phenolequilibrated with lX TE containing 100 mM sodium chloride and0.02% SDS) and gel filtration.
Nylon membranes containing RNA samples were prehybridized 6h in 60'C, pH 7, 50 mM Pipes, 100 mM NaCl, 50 mM sodiumphosphate, 0.1 mM EDTA, 5% SDS containing 200 g of yeast RNAand 50 Ag of salmon sperm DNA per milliliter. The hybridizationbuffer was discarded and replenished with higher concentrations ofRNA (750 ,g/ml) and DNA (275 ,ug/ml), and freshly made 32p oligo-nucleotide probe (1 X 10⁷ cpm per filter), denatured using 50% form-amide at 100°C immediately followed by equilibration on ice for 10min, was diluted in buffer and added to the hybridization mixture.After 18 h at 60°C the hybridization buffer was discarded, and the filterwas washed twice for 5 min in I X SSC followed by one 1 5-min wash at55°C. Autoradiography was performed using X-OMAT AR film(Eastman Kodak Co., Rochester, NY), which gave suitable exposuresafter 4-18 h. In some experiments the amount of 32p probe hybridizedon the Northern blots was quantitated using an Ambis Beta ScanningSystem (Automated Microbiology Systems, Inc., San Diego, CA).
Inclusion of a 0.24-9.5-kb RNA ladder (Bethesda Research Labo-ratories) in glyoxal gels and visualization of the bands with acridineorange staining under UV illumination indicated that TNF andGAPDH mRNA were present as single species migrating at 1.8 and 1.4kb, respectively.
4
3
2
E
x
I-.4
_
C._act
Ew
C,,C/)
2
3
2
00 100 200 300 400 500
Time (minutes)Figure 1. Induction of LPS hyporesponsiveness in rabbits. Femoralartery catheters were placed using local anesthesia, and the animalswere maintained in restraining suits for the duration of the monitor-ing period. LPS injections were made through the marginal ear vein,and blood was collected using the femoral artery catheter. Primaryinjections of LPS (10, 2, 0.2, or 0.02 ,g) were followed 300 min laterby 10-,Ag LPS challenge. Mean±SE (n = 4).
10
Results
In vivo induction of hyporesponsive state. Previously we re-ported that in rabbits injection of 10 ,gg of Re595 LPS pro-duced a rapid, but transient increase in blood levels of TNFand that injection of the same dose of LPS 5 h later producedmarkedly reduced or no detectable intravascular TNF (3).Here we describe additional dose-response studies in rabbitsinjecting varying doses ofRe595 LPS at t = 0 and 10 ,ug ofLPSat t = 300 min. These are referred to as the primary andchallenge LPS dose, respectively. The primary dose ofLPS wasvaried between 0.02 and 10 ,ug of LPS/ml and blood sampleswere withdrawn for analysis ofTNF levels in blood over an 8-hperiod. The results of this experiment shown in Fig. 1 indicatethat a primary LPS dose of as little as 0.2 ,g of LPS produces amarked reduction in TNF in blood induced by 10 ,g of LPSadministered 5 h later.
TNF production in PEM: induction ofhyporesponsiveness.The first step towards determining the mechanisms at the cel-lular level that result in the hyporesponsive state is to establishthe dose dependency for LPS-induced TNF production in elic-ited PEM comparing several different rough (R)- and smooth(S)-form isolates of LPS. (For definitions ofR and S forms, seebelow.) Varying concentrations of LPS were added to PEMand after 12 h cell-free supernatants were removed and assayedfor TNF. The results shown in Fig. 2, a (S-LPS) and b (R-LPS),
5
E
x, 10U-z
5
a.- O-JO S. Minnesota--& F Cli niII-R4_--- C. Tvph rI'E
- 'bF ... S. Typhimulrium /
-~~ ~~~~~~~~~IXb.- o-o Re595
* D31m4
f s
It$ EII . I
-10 -9 -8 -7 -6 -5
LPS (log g/ml)
Figure 2. Induction ofTNF by rough and smooth form LPS in rab-
bit PEM. PEM were cultured as described in Methods, and smoothform LPS (E. coli 0 1 1 :B4, S. minnesota wild type, or S. typhimur-ium) or rough form LPS (S. minnesota Re595 or E. coli K12D3 1 m4) were added to the cultures, and 18-h conditioned mediumwas harvested for TNF assay.
1110 Mathison et al.
If
1
1

Table I. LPS-induced Adaptation to Its Own Effects:Time Dependencyfor Establishment ofAdapted Cells
Exposure time to primary LPS dose
hPrimaryLPS dose 3 6 9 18
pg/ml TNF U/ml (% expected response)*
0 91 101 92 70100 102 32 17 18300 107 22 19 13
See Methods for details of experimental protocol.* TNF activity induced by challenge dose of 100 ng/ml for 12 h.
demonstrate that both forms of LPS induce TNF to about thesame extent (5,000-10,000 U/ml), but that R-LPS is maxi-mally active at concentrations 1-2 logs less than S-LPS. Theapparent inhibition of TNF production by S-LPS concentra-tions > 1 gg/ml is not caused by decreased cell viability asdetermined by fluorescein diacetate staining of the cells. Thisinhibition is never observed with R-form LPS. In data notshown here, we established that TNF production by either R-or S-LPS is maximal 12 h after stimulation. For the remainderof the experiments described here, we used LPS from S. min-nesota Re595 (R-form) and E. coli 0 11 :B4 (S-form).
To establish that LPS would induce a hyporesponsive statewith PEM and to determine the time dependency, the follow-ing experiment was performed. PEM were cultured with 0, 0.1,or 0.3 ng/ml Re595 LPS for varying times up to 18 h, theprimary LPS dose was removed by washing the cell mono-layer, and the cells were exposed to a challenge dose of 100ng/ml Re595 LPS for 12 h. Measurements ofTNF in cell-freesupernatants shown in Table I provide evidence that the LPS-induced hyporesponsive state occurs within 6 h and is maxi-mally expressed after 9 h ofexposure to the primary LPS dose.
Table II. TNF Production by the Primary LPS Dose
Primary LPS [LPS] [TNF]
pg/ml U/ml
Re595 <500.01 <500.3 <5010 <50
100 4003000 12,000
0lll:B4 <300.001 <30
0.1 <3010 <30
1000 40
PEM were maintained for 9 h at 37°C, 5% Co2 in the presence ofthe primary LPS dose and the aspirated medium was assayed forTNF with the L929 assay. Data ofTNF production after addition ofthe challenge LPS dose are shown in Figs. 3 and 4.
'or
5
E
x
I-
-Primary LPS-Dose (pg/mlu.0-0 .0-0-s 0.001.A- 0.1.A-A 100-0 1000
-10 -9 -8 -7 -6 -5
Challenge LPS (log gIml)
Figure 3. 01 11 :B4 LPS induction of hyporesponsiveness to LPS inPEM. Primary doses of 0 1 1 :B4 LPS (0-1,000 pg/ml) were added toPEM for 9 h, the conditioned medium was harvested and replen-ished, and the cells were restimulated with challenge doses of0111 :B4 LPS ranging from 0.1 ng to 10 gg/ml. Conditioned mediumwas harvested 12 h after challenge for TNF assay.
The next experiments compared different primary doses ofRe595 and 01 1 1:B4 LPS in establishing hyporesponsivenessand determined the effect of varying the challenge LPS dose.The results of this experiment are in Table II showing TNFproduction induced by the primary LPS dose and in Fig. 3(O111:B4 LPS) and 4 (Re595 LPS) displaying LPS dose-re-sponse curves for TNF production after the LPS challengedose. These data show that induction of hyporesponsivenessby the primary LPS dose occurs in the absence of detectableTNF, that both S- and R-form LPS induce hyporesponsive-ness, and that, depending upon the concentration of the pri-mary LPS dose, hyporesponsiveness can be partially reversedby increasing the LPS concentration in the challenge dose.Thus the PEM response to the challenge dose of LPS has thecharacteristics of an adaptive change (4) and will be referred toas such in the remainder of this report.
The previous experiments utilized the same LPS in theprimary and challenge treatments and demonstrated qualita-tively similar results. We next sought to establish if R-formLPS could induce adaptation hyporesponsiveness to S-formLPS and vice versa. The PEM were exposed to the R- andS-form LPS in the primary dose and the alternative LPS formused for the challenge dose. The results of this experiment in
" 10
x
I-L.L 5
-10 -9 -8
Challenge LPS (log g/ml)-7
Figure 4. Re595 LPS induction of hyporesponsiveness to LPS inPEM. Primary doses of Re595 LPS (0-3,000 pg/ml) were added toPEM for 9 h, the conditioned medium was harvested and replen-ished, and the cells were restimulated with challenge doses of Re595LPS ranging from 0.1 to 100 ng/ml. Conditioned medium was har-vested 12 h after challenge for TNF assay.
Lipopolysaccharide-induced Adaptation to Its Own Effects 1111

Table III demonstrate that regardless ofthe form of the LPS inthe primary or the challenge dose the PEM are adapted to LPS.
In experiments not shown we established that there are noinhibitors of the TNF bioassay released by the PEM at anytime during the experiment and that nothing present in cell-free supernatants ofadapted PEM inhibits TNF production byLPS when this supernatant is transferred to new cell cultures.
No TNF activity was detected in lysates of LPS-adaptedcells and, when these lysates were mixed with a known amountof recombinant TNF, full activity of the added TNF was re-covered. When PEM were biosynthetically labeled (100 ,tCi of[35S]cysteine, 5 X 10⁶ PEM, 1 ml of cysteine-deficient me-dium) immunoprecipitable 35S-labeled TNF (migrating at 18kD in SDS-PAGE) was readily detected in the conditionedmedium of Re595 LPS-stimulated (1 ng/ml) cells. In contrast,[35S]TNF was not detected in conditioned medium of PEMthat had been exposed to 100 pg of Re595 LPS 9 h beforechallenge with 1 ng of LPS/ml. Control experiments alsoshowed that conditioned medium of LPS-adapted macro-phages did not inhibit immunoprecipitation or detection of[35S]TNF.
Effect ofindomethacin on LPS-induced adaptation. Prosta-glandins have been shown to inhibit LPS-induced TNF pro-duction by macrophages (17). To evaluate the role of arachi-donate-derived mediators in the induction of the hyporespon-siveness, we used the cyclooxygenase inhibitor, indomethacin,added to PEM together with the primary LPS dose and washedout of the cultures before the challenge dose of LPS. Datashown in Table IV. demonstrate that indomethacin inhibitsPGE2 production > 95% but has no effect on adaptation ofthePEM induced by the primary LPS dose. The TNF response to100 ng/ml of Re595 LPS was increased approximately four-fold in the presence of 100 ,uM indomethacin; this is consistentwith other published reports demonstrating enhancement ofLPS-induced monokine production by indomethacin (18, 19).
Investigation ofpossible mechanisms for LPS-induced ad-aptation to its own effects. Potential mechanisms to accountfor LPS-induction of hyporesponsiveness to its own effectsinclude the induction of intracellular products that have aglobal effect on transcription or translation of the TNF gene,an increase in the rate of degradation of TNF mRNA, or adefect in the ability of cells treated with a primary LPS dose to
Table III. Crossed Adaptation ofTNF Response Inducedby Smooth and Rough Form LPS
[LPS]
Primary Challenge
01 I:B4 Re595 01 I:B4 Re595 [TNFJ
ng/ml U/mi
100 6,6003 100 470
1 5,9003 1 1,600
PEM were maintained for 9 h at 37°C, 5% CO2 in the presence orabsence of LPS (primary dose) followed by washing and incubationfor 12 h in the presence of LPS (challenge dose). TNF activity in thesupernatants of the PEM was measured using the L929 assay.
Table IV. Effect ofIndomethacin on LPS-induced Adaptation
[Indomethacin] [Primary LPS dose] [TNFJ [PGE2]
MM ng/ml U/mi nM
13,000 180.1 3,600 15
- 3 510 12
1 37,000 0.481 0.1 5,600 0.621 3 550 0.45
Indomethacin and primary Re595 LPS doses were added to PEM.After 9 h at 370C, 5% C02, the cells were washed and challengedwith 100 ng of LPS/ml for 12 h in the absence of indomethacin.
recognize LPS and properly initiate the signal transductionprocess. Experiments described below address some of thesepoints.
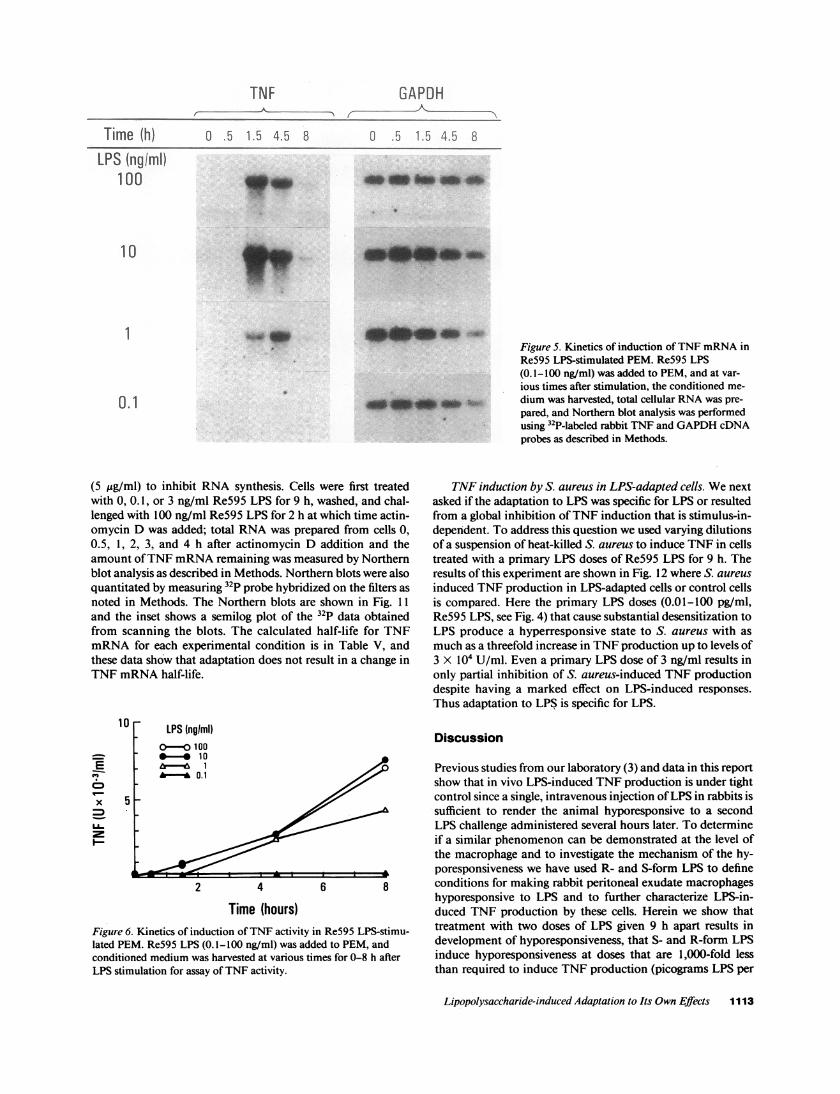
It was first necessary to quantitate the LPS concentrationdependence and kinetics ofTNF mRNA production by PEM.Re595 LPS (0.1-100 ng/ml) was added to cells and at 0.5, 1.5,4.5, and 8 h, supernatants were removed for TNF assay andtotal RNA was prepared for Northern blot analysis as de-scribed in Methods. The results of this experiment are shownin Figs. 5 and 6. To establish that comparable amounts oftotalRNA are present in each sample analyzed for TNF mRNA wealso used a probe for GAPDH mRNA. These data show thatthe rate of TNF mRNA accumulation and the rate of TNFprotein release is dependent upon the amount of LPS added.Typically we find no constitutive expression ofTNF mRNA incells before the addition of LPS. Comparable studies with01 11:B4 revealed similar findings except that as predictedfrom the LPS dose response of Fig. 2 a 0 1 1 :B4 LPS requires10-100 higher concentrations that Re595 LPS to achieve simi-lar TNF induction (data not shown).
The effect of adaptation on TNF mRNA induction andTNF release was next studied with 01 1 1:B4 or Re595 LPS.Studies with Re595 LPS were performed as follows; macro-phages were given a primary LPS dose of0, 100 or 3,000 pg/mlfor 9 h, the supernatant was removed, and the cells washedbefore addition of challenge LPS dose of 1 or 100 ng/ml. Sam-ples of supernatant were removed for TNF assay and totalRNA isolated from the cells at 1.5, 4.5, and 8 h after additionof the challenge LPS dose. The results of this experimentshown in Fig. 7 demonstrate that the primary LPS dose causesa marked reduction in the amount ofTNF mRNA induced bya challenge with 1 ng/ml Re595 LPS. In contrast, challengewith 100 ng/ml Re595 LPS results in TNF mRNA inductionand release of TNF. Results of measuring TNF in the PEMsupernatant are shown in Fig. 8. A similar experiment wasperformed with 01 1 1:B4 LPS except that the challenge LPSdose was 10 ng/ml; data from this experiment are shown inFigs. 9 (Northern blots) and 10 (TNF measurements).
Several different reports have provided evidence for post-transcriptional control of LPS-induced TNF mRNA expres-sion (20-23). The reduction in steady state TNF mRNA accu-mulation observed in LPS-adapted cells could occur if the rateof degradation of TNF mRNA was increased. Therefore wemeasured the half-life of TNF mRNA using actinomycin D
1112 Mathison et al.
Tieh)c 5
Time (h) 0 .5 1.5 4.5 8 0 .5 1.5 4.5 8
LPS (ngiml)100
10
TNF GAPDH
Ia_
INM~lw. s
idm
Figure 5. Kinetics of induction ofTNF mRNA inRe595 LPS-stimulated PEM. Re595 LPS(0.1- I00 ng/ml) was added to PEM, and at var-ious times after stimulation, the conditioned me-dium was harvested, total cellular RNA was pre-pared, and Northern blot analysis was performedusing 32P-labeled rabbit TNF and GAPDH cDNAprobes as described in Methods.
(5 ug/ml) to inhibit RNA synthesis. Cells were first treatedwith 0, 0.1, or 3 ng/ml Re595 LPS for 9 h, washed,-and chal-lenged with 100 ng/ml Re595 LPS for 2 h at which time actin-omycin D was added; total RNA was prepared from cells 0,0.5, 1, 2, 3, and 4 h after actinomycin D addition and theamount ofTNF mRNA remaining was measured by Northernblot analysis as described in Methods. Northern blots were alsoquantitated by measuring 32p probe hybridized on the filters asnoted in Methods. The Northern blots are shown in Fig. 11
and the inset shows a semilog plot of the 32P data obtainedfrom scanning the blots. The calculated half-life for TNFmRNA for each experimental condition is in Table V, andthese data show that adaptation does not result in a change inTNF mRNA half-life.
10
EC?
x
U-
LPS (nglml)0-O 100**-@ 10
r---96 1hr---.9L 0.1
2 4
Time (hours)Figure 6. Kinetics of induction ofTNF activity in Re595 LPS-stimu-lated PEM. Re595 LPS (0.1-100 ng/ml) was added to PEM, andconditioned medium was harvested at various times for 0-8 h afterLPS stimulation for assay ofTNF activity.
TNF induction by S. aureus in LPS-adapted cells. We nextasked if the adaptation to LPS was specific for LPS or resultedfrom a global inhibition ofTNF induction that is stimulus-in-dependent. To address this question we used varying dilutionsof a suspension of heat-killed S. aureus to induce TNF in cellstreated with a primary LPS doses of Re595 LPS for 9 h. Theresults of this experiment are shown in Fig. 12 where S. aureus
induced TNF production in LPS-adapted cells or control cellsis compared. Here the primary LPS doses (0.01-100 pg/ml,Re595 LPS, see Fig. 4) that cause substantial desensitization toLPS produce a hyperresponsive state to S. aureus with as
much as a threefold increase in TNF production up to levels of3 X 104 U/ml. Even a primary LPS dose of 3 ng/ml results inonly partial inhibition of S. aureus-induced TNF productiondespite having a marked effect on LPS-induced responses.
Thus adaptation to LPS is specific for LPS.
Discussion
Previous studies from our laboratory (3) and data in this reportshow that in vivo LPS-induced TNF production is under tightcontrol since a single, intravenous injection ofLPS in rabbits issufficient to render the animal hyporesponsive to a secondLPS challenge administered several hours later. To determineif a similar phenomenon can be demonstrated at the level ofthe macrophage and to investigate the mechanism of the hy-poresponsiveness we have used R- and S-form LPS to defineconditions for making rabbit peritoneal exudate macrophageshyporesponsive to LPS and to further characterize LPS-in-duced TNF production by these cells. Herein we show thattreatment with two doses of LPS given 9 h apart results indevelopment of hyporesponsiveness, that S- and R-form LPSinduce hyporesponsiveness at doses that are 1,000-fold lessthan required to induce TNF production (picograms LPS per
Lipopolysaccharide-induced Adaptation to Its Own Effects 1113
1
0.1
4m. 4w AM .40
lilli.
PPIRINW.

Primary LPS-A
100 pg/ml 3ng/ml
Time (h) 0 1.5 4.5 8 0 1.5 4.5 8 0 1.5 4.5 8
ITNF
GAPDH *
TNF i.a
GAPDH ***i*~~~~~~~~~~~~~~~~~~~~~~:_.la,_ -i_!AU Nid
Challenge*LPS
1 nglml
ChallengeLPS100 ngjml
Figure 7. Kinetics of TNF mRNA response to Re595 LPS challenge (I ng or 100 ng/ml) in control PEM or LPS-adapted PEM (exposure for 9h to primary LPS doses of 100 or 3,000 pg/ml of Re595 LPS). Conditioned medium was harvested 0-8 h after challenge, total cellular RNAwas prepared, and Northern blot analysis was performed using 32P-labeled rabbit TNF and GAPDH cDNA probes as described in Methods.
10
5
10
E
x
aLL
5
Primary LPS Dose:(pghlm
0-00A*_-. 100
--.A 3000
1 ng LPSImlChallenge
-
Primary LPS Dose:(pglmlv
*h-so0.-.0 100 (100 lng /PSIm
*.-. 3000 /zChalenge
2 4 6 8
Time Post-Challenge (hours)
Figure 8. Kinetics ofTNF response to Re595 LPS challenge (I or
100 ng/ml) in control PEM or LPS-adapted PEM (exposure for 9 hto primary LPS doses of 100 or 3,000 pg/ml of Re595 LPS). Condi-tioned medium was harvested 0-8 h after addition of the challengeLPS dose for assay ofTNF activity.
milliliter vs. nanograms LPS per milliliter), that hyporespon-siveness is a result of adaptation (4) to LPS, that adaptation ischaracterized by decreased accumulation of TNF mRNAwithout a change in the half-life of the TNF mRNA, thateicosanoids do not participate in induction of the hypore-sponsive state, and that the LPS-adapted cells are stimulatedby heat-killed S. aureus, to produce TNF levels that are equalto or greater than that of control cells.
LPS-induced TNF production by elicited peritoneal exu-
date macrophages. Elicited rabbit peritoneal exudate macro-
phages provide an excellent system to study LPS-induced TNFproduction since these cells can be obtained in large numbersand respond to both R- and S-form LPS preparations. S-formLPS isolates are maximally active at concentrations of 10-100ng/ml, but are inhibitory between 1 and 10 jg/ml (see Fig. 2a). In contrast, R-form LPS isolates such as Re595 LPS maxi-mally induce TNF at concentrations of 1 ng/ml and show no
inhibition even when added at 10 Ag/ml. The mechanism ofthe inhibitory limb of the S-form LPS dose-response curve isunknown, although it is not a result of decreased cell viability.
We also describe the concentration dependence and ki-netics of LPS-induced increases in steady-state levels of TNFmRNA using a oligonucleotide probe based on the cDNAsequence for rabbit TNF (15). Both the rate and extent ofincrease in steady-state levels of TNF mRNA are dependenton the amount of LPS added initially. These changes in TNFmRNA are qualitatively similar to changes reported by others
1114 Mathison et al.
-0-
40 gm
AAW 40 wl., k4b

Primary LPS
*O0 100 pgIml 3 ng/ml
Time (h) 0 1.5 4.5 8 0 1.5 4.5 8 0 1.5 4.5 8
Iwlqw wllt''lw' I M .- ww4
Figure 9. Kinetics ofTNFmRNA response to 011 1:B4LPS challenge (10 ng/ml) incontrol PEM or PEMadapted by preexposure for 9h to primary doses of 100 or3,000 pg/ml of 01 1 1:B4 LPS.Conditioned medium washarvested 0-8 h after chal-lenge, total cellular RNA wasprepared, and Northern blotanalysis was performed using32P-labeled rabbit TNF andGAPDH cDNA probes asdescribed in Methods.
using primary cultures of monocytes/macrophages stimulatedwith LPS (17, 20, 21, 24, 25). However, the concentrations ofLPS used here to produce maximal stimulation ofTNF are as
much as 1,000-fold lower than used by other investigators, andin the case of Re595 LPS are in the same range that we used tomaximally stimulate TNF production in vivo (3) and similarto doses reported to maximally induce TNF in whole blood ex
vivo (26).Characteristics of LPS-induced adaptation to its own ef-
fects. We established that the sensitivity of PEM to LPS mea-
sured by TNF production can be modulated by exposure ofcells to LPS (primary dose) for 6-9 h before a second LPSexposure (challenge dose). Desensitization to LPS is inducedby S- and R-form LPS with as little as 0.1 pg/ml of LPS beingactive in the primary dose. The biologically active domain ofLPS is lipid A (27) and the induction of early-phase tolerancein animal models and cellular tolerance to LPS at the level ofthe macrophage has been shown to be lipid A-dependent (re-viewed in Johnston and Greisman [5]). Our data show thatR-form LPS induces hyporesponsiveness for S-form LPS andvice versa. This result is expected if adaptation to LPS de-scribed here is a lipid A-dependent event.
Studies of Nathan and his colleagues (28, 29) and Pabst etal. (30) have documented changes in macrophage phenotypethat occur with LPS concentrations of < 1 ng/ml; the results
0.5 Primary LPS Dose
lpg/m~l
o-0o0o l ng LPSlml
0 3000 Challenge0.3 -
R 0.2
-0.1
2 4 6 8
Time Post-Challenge (hours)
Figure 10. Kinetics of TNF response to 01 11:B4 LPS challenge (10ng/ml) in control PEM or PEM adapted by preexposure for 9 h toprimary doses of 100 or 3,000 pg/ml of 0 1 1 :B4 LPS. Conditionedmedium was harvested 0-8 h after addition of the challenge LPSdose for assay of TNF activity.
reported here display a sensitivity to LPS significantly belowthese levels. Despite different experimental systems all of theserecently reported effects of trace amounts of LPS on macro-
phage phenotype may reflect programmed responses that serve
to limit host cell injury while maintaining bacterial killingmechanisms during gram-negative septicemia. The potentialimportance of these phenomena is highlighted by the recentreport of Rothstein and Schreiber (31) showing the devastatingeffects of simultaneous injection of LPS and TNF.
The present studies have been limited to induction ofTNFby LPS. Whether adaptation to LPS effects the expression ofother LPS-induced monokines is not established at this time.Ultimately it will be important to understanding how mono-
kines such as interleukin- (IL- 1) or interleukin-6 (IL-6) are
affected by adaptation. Recent studies have shown that IL- 1and TNF production may be differentially regulated in cells ofthe monocyte/macrophage lineage (32). Moreover, the recentreport of Loppnow et al. (33) studying LPS structure/functionrelationship for IL-I expression in human mononuclear cellsdemonstrated the predominance of lipid A-dependent induc-tion although weak IL- 1 inducing activity was reported forcore oligosaccharides of LPS. Finally, several cytokines in-cluding TNF have been shown to induce or amplify expressionof other monokines including IL- 1 and IL-6 (34).
Mechanism ofLPS-induced adaptation its own effects. Sev-eral different mechanisms need to be considered to explainLPS-induced adaptation to its own action including inhibitionof TNF gene transcription or translation independent of thestimulus, an increase the rate of degradation of TNF mRNA,or a change in the recognition of LPS by the PEM resulting indiminished initiation of signal transduction pathways for TNFexpression.
The result of treating PEM with the primary LPS dose is todecrease sensitivity to LPS. In contrast, when heat-killed S.aureus is used to stimulate LPS-adapted cells the amounts ofTNF produced are either greater than or equal to TNF produc-tion by control (no prima'y LPS dose) cells. These findingssupport the contention that adaptation does not result fromproduction of inhibitors ofTNF gene transcription or transla-tion that are stimulus-independent.
Here we also show that the marked change in sensitivity ofLPS induced by the primary LPS dosage does not appear todepend upon TNF synthesis during the 9-h period when theprimary LPS dose is present. Thus TNF or products induced
Lipopolysaccharide-induced Adaptation to Its Own Effects 1115
TNF
GAPDH
/1,
i.,.. &."f,,Hill
" R-:,:.-:..l.--
I
.. .. .: ...

GAPDHk --
Time (h) 0 0.5 1 2 3 4 0 0.5 1 2 3 4
Primary LPS(ng/ml)
0 .0 a
__ _ _i
:M~~~~:'Ab'do~~~~~usMX_ .4.031 I ng
3
1000
C-,
ELL-
1001
lo0
1 I I I I I0 1 2 3 4
Time (hours)by TNF are not likely to be acting as feedback inhibitors of cellfunction.
Eicosanoids, most notably compounds of the PGE series,have been shown to both inhibit (18, 19) and enhance (24, 35)LPS-induced macrophage responses. Experiments with thecyclooxygenase inhibitor indomethacin used at concentrations
Table V. TNF mRNA Half-life in LPS-adapted PEM
mRNA t,/2
Primary LPS dose (ng/ml) .........0.. 0.1 3
h
Experiment 1 1.3 1.3 1.0Experiment 2 1.4 1.3 1.8
PEM were incubated 9 h (37°C, 5% C02) in the presence or absenceof Re595 LPS (primary dose) followed by washing and challengewith 100 ng of LPS/ml. Actinomycin D was added to the cultures 2h after challenge, and macrophages were harvested at various times2-6 h after challenge for quantitation ofTNF mRNA.
Figure 11. Determination ofTNF mRNAhalf-life in PEM that were adapted to Re595LPS. PEM were exposed to 0 (o), 0.1 (A), or 3(o) ng of Re595 LPS/ml for 9 h, washed, andchallenged with 100 ng of Re595 LPS/ml. Ac-tinomycin D (5 ,g/ml) was added 2 h afterchallenge, and at various times (0-4 h) afteraddition of actinomycin D, the conditionedmedium was harvested, total cellular RNAwas prepared, and Northern blot analysis wasperformed using 32P-labeled rabbit TNF andGAPDH cDNA probes as described inMethods. The amounts of mRNA present on
the blots were quantitated using a radioactiv-ity scanner, and plotted as shown to determinethe TNF mRNA half-life.
that inhibited PGE2 production > 95% showed no effect on
the induction of adaptation to LPS. This result rules out a
significant contribution by prostanoids in adaptation.
3
2
x
LA
M-
-5 -4 -3 -2
S. aureus Challenge (log dilution)
Figure 12. Induction ofTNF by S. aureus in Re595 LPS-adaptedPEM. PEM were exposed to various doses of Re595 LPS (0-3,000pg/ml) for 9 h, washed, and challenged with various dilutions ofheat-killed S. aureus. Maximal induction ofTNF in control macro-
phages (o) was observed with 1,000-fold diluted S. aureus, corre-
sponding to - 50 bacterial cells per macrophage.
1116 Mathison et al.
Q
TNF
AMMM.,

The presence of the AUUUA sequence motif in the 3'-un-translated region ofthe TNF gene provides sequences that maycontrol mRNA stability (36); for example, a ribonuclease rec-ognizing this motif has been suggested to be of importance inregulating TNF mRNA stability (22). The primary LPS dosecould either induce or increase the activity ofsuch nucleases orother intracellular proteins that recognize the AUUUA motifand shorten the half-life of TNF mRNA. The role that in-creased degradation ofTNF mRNA plays in adaptation can betested directly using the inhibitor of RNA synthesis, actino-mycin D, comparing TNF mRNA half-life in LPS adapted andcontrol PEM. The data that we show here obtained from ac-tinomycin D experiments argues against a shortening ofTNFmRNA half-life being an important feature of LPS-adaptedcells.
While several previous reports (6, 37-40) have describedthe phenomenon of LPS-induced hyporesponsiveness or toler-ance to its own effects in macrophages, limited information isavailable about the mechanisms. An exception to this is thework of Larsen and Sullivan (41) where measurement of col-ony stimulating factor production by human monocytes wasused to better characterize LPS-induced hyporesponsivenessto its own effects. These investigators suggested that the hy-poresponsiveness observed in their system resulted from re-duced binding and/or impaired processing of LPS. Recogni-tion of LPS implies that macrophages have a specific receptorfor LPS that is involved in signal transduction. Although littleis known about the identity of a plasma membrane receptorfor LPS, several candidates have been identified using cross-linking and ligand-blotting techniques with radiolabeled LPS(42, 43). Current studies are being directed toward more fullydefining relationships between LPS-induced adaptation andbinding of LPS to macrophages.
Acknowledgments
This work was supported by National Institutes of Health grantsAl- 15136, GM-28485, AI-25563, and GM-08172.
References
1. Sherry, B., and A. Cerami. 1988. Cachectin/tumor necrosis fac-tor exerts endocrine, paracrine and autocrine control of inflammatoryresponses. J. Cell Biol. 107:1269-1277.
2. Tracey, K. J., Y. Fong, D. G. Hesse, K. R. Manogue, A. T. Lee,G. C. Kuo, S. F. Lowry, and A. Cerami. 1987. Anti-cachectin TNFmonoclonal antibodies prevent septic shock during lethal bacteraemia.Nature (Lond.). 330:662-664.
3. Mathison, J. C., E. Wolfson, and R. J. Ulevitch. 1988. Participa-tion of tumor necrosis factor in the mediation ofgram negative bacte-rial lipopolysaccharide-induced injury in rabbits. J. Clin. Invest.81:1925-1937.
4. Koshland, D. E. Jr., A. Goldbeter, and J. B. Stock. 1982. Ampli-fication and adaptation in regulatory and sensory systems. Science(Wash. DC). 217:220-225.
5. Johnston, C. A., and S. E. Greisman. 1985. Mechanisms ofendotoxin tolerance. In Pathophysiology of Endotoxin. R. A. Proctorand L. B. Hinshaw, editors. Handb. Endotoxin. 2:359-401.
6. Virca, G. D., S. Y. Kim, K. B. Glaser, and R. J. Ulevitch. 1989.Lipopolysaccharide induces hyporesponsiveness to its own action inRAW 264.7 cells. J. Biol. Chem. 264:21951-21956.
7. Galanos, C., 0. Luderitz, and 0. Westphal. 1969. A new methodfor the extraction of R lipopolysaccharides. Eur. J. Biochem. 9:245-249.
8. Rotman, B., and B. W. Papermaster. 1966. Membrane proper-ties of living mammalian cells as studied by enzymatic hydrolysis offluorogenic esters. Proc. Nat/. Acad. Sci. USA. 55:134-141.
9. Ruff, M. R., and G. E. Gifford. 1981. Tumor necrosis factor.Lymphokines. 2:235-272.
10. Lister, M. D., K. B. Glaser, R. J. Ulevitch, and E. A. Dennis.1989. Inhibition studies on the membrane-associated phospholipaseA2 in vitro and prostaglandin E2 production in vivo of the macro-phage-like P388D1 cell: effects of manoalide, 7,7-dimethyl-5,8 eicosa-dienoic acid, and p-bromophenacyl bromide. J. Biol. Chem.264:8520-8528.
11. Chirgwin, J. M., A. E. Przybyla, R. J. MacDonald, and W. J.Rutter. 1979. Isolation of biologically active ribonucleic acid fromsources enriched in ribonuclease. Biochemistry. 18:5294-5299.
12. Glisin, V., R. Crkvenjakov, and C. Byus. 1974. Ribonucleicacid isolated by cesium chloride centrifugation. Biochemistry.13:2633-2637.
13. Carmicheal, G. G., and G. K. McMaster. 1980. The analysis ofnucleic acids in gels using glyoxal and acridine orange. Methods Enzy-mol. 65:380-39 1.
14. Thomas, P. S. 1980. Hybridization of denatured RNA andsmall DNA fragments transferred to nitrocellulose. Proc. NatL. Acad.Sci. USA. 77:5201-5205.
15. Ito, H., S. Yamamoto, S. Kuroda, H. Sakamoto, J. Kajihara, T.Kiyota, H. Hayashi, M. Kato, and M. Seko. 1986. Molecular cloningand expression in Escherichia coli of the cDNA coding for rabbittumor necrosis factor. DNA (NY). 5:149-156.
16. Putney, S. D., W. C. Herlihy, and P. Schimmel. 1983. A newtroponin T and cDNA clones for 13 different muscle proteins, foundby shotgun sequencing. Nature (Lond.). 302:718-721.
17. Kunkel, S. L., M. Spengler, M. A. May, R. Spengler, J. Larrick,and D. Remick. 1988. Prostaglandin E2 regulates macrophage-derivedtumor necrosis factor gene expression. J. Biol. Chem. 263:5380-5384.
18. Kunkel, S. L., S. W. Chensue, and S. H. Phan. 1986. Prosta-glandins as endogenous mediators of interleukin 1 production. J. Im-munol. 136:186-192.
19. Knudsen, P. J., C. A. Dinarello, and T. B. Strom. 1986. Prosta-glandins posttranscriptionally inhibit monocyte expression of inter-leukin I activity by increasing intracellular cyclic adenosine mono-phosphate. J. Immunol. 137:3189-3194.
20. Beutler, B., V. Tkacenko, I. Milsark, N. Krochin, and A. Ce-rami. 1986. Effect of gamma interferon on cachectin expression bymononuclear phagocytes. J. Exp. Med. 164:1791-1796.
21. Beutler, B., N. Krochin, I. W. Milsark, C. Luedke, and A.Cerami. 1986. Control of cachectin (tumor necrosis factor) synthesis:mechanisms of endotoxin resistance. Science (Wash. DC). 232:977-980.
22. Beutler, B., P. Thompson, J. Keyes, K. Hagerty, and D. Craw-ford. 1988. Assay of a ribonuclease that preferentially hydrolysesmRNAs containing cytokine-derived UA-rich instability sequences.Biochem. Biophys. Res. Commun. 152:973-980.
23. Sariban, E., K. Imamura, R. Luebbers, and D. Kufe. 1988.Transcriptional and posttranscriptional regulation of tumor necrosisfactor gene expression in human monocytes. J. Clin. Invest. 81:1506-1510.
24. Spengler, R. N., M. L. Spengler, R. M. Strieter, D. G. Remick,J. W. Larrick, and S. L. Kunkel. 1989. Modulation of tumor necrosisfactor-alpha gene expression: desensitization of prostaglandin E2-in-duced suppression. J. Immunol. 142:4346-4350.
25. Mannel, D. N., and W. Falk. 1989. Optimal induction oftumornecrosis factor production in human monocytes requires completeS-form lipopolysaccharide. Infect. Immun. 57:1953-1958.
26. Desch, C. E., N. L. Kovach, W. Present, C. Broyles, and J. M.Harlan. 1989. Production ofhuman tumor necrosis factor from wholeblood ex vivo. Lymphokine Res. 8:141-146.
27. Rietschel, E. T., H. W. Wollenweber, H. Brade, U. Zahringer,B. Lindner, U. Seydel, H. Bradaczek, G. Barnickel, H. Labischinski,and P. Giesbrecht. 1984. Structure and conformation of the lipid A
Lipopolysaccharide-induced Adaptation to Its Own Effects 1117

component of lipopolysaccharides. In Chemistry of Endotoxin. R. A.Proctor and E. T. Rietschel, editors. Handb. Endotoxin. 1: 187-220.
28. Ding, A. H., and C. F. Nathan. 1987. Trace levels of bacteriallipopolysaccharide prevent interferon-gamma or tumor necrosis fac-tor-alpha from enhancing mouse peritoneal macrophage respiratoryburst capacity. J. Immunol. 139:1971-1977.
29. Ding, A. H., E. Sanchez, S. Srimal, and C. F. Nathan. 1989.Macrophages rapidly internalize their tumor necrosis factor receptorsin response to bacterial lipopolysaccharide. J. Biol. Chem. 264:3924-3929.
30. Pabst, M. J., H. B. Hedegaard, and R. B. Johnston, Jr. 1982.Cultured human monocytes require exposure to bacterial products tomaintain an optimal oxygen radical response. J. Immunol. 128:123-128.
31. Rothstein, J. L., and H. Schreiber. 1988. Synergy betweentumor necrosis factor and bacterial products causes hemorrhagic ne-crosis and lethal shock in normal mice. Proc. Natl. Acad. Sci. USA.85:607-611.
32. Burchett, S. K., W. M. Weaver, J. A. Westall, A. Larsen, S.Kronheim, and C. B. Wilson. 1988. Regulation of tumor necrosisfactor/cachectin and IL-I secretion in human mononuclear phago-cytes. J. ImmunoL. 140:3473-3481.
33. Loppnow, H., H. Brade, I. Durrbaum, C. A. Dinarello, S.Kusumoto, E. T. Rietschel, and H. D. Flad. 1989. IL-I induction-ca-pacity of defined lipopolysaccharide partial structures. J. Immunol.142:3229-3238.
34. McIntosh, J. K., D. M. Jablons, J. J. Mule, R. P. Nordan, S.Rudikoff, M. T. Lotze, and S. A. Rosenberg. 1989. In vivo induction ofIL-6 by administration of exogenous cytokines and detection of denovo serum levels of IL-6 in tumor-bearing mice. J. Immunol.143:162-167.
35. Renz, H., J. H. Gong, A. Schmidt, M. Nain, and D. Gemsa.
1988. Release of tumor necrosis factor-alpha from macrophages: en-hancement and suppression are dose-dependently regulated by prosta-glandin E2 and cyclic nucleotides. J. Immunol. 141:2388-2393.
36. Shaw, G., and R. Kamen. 1986. A conserved Au sequence fromthe 3'-untranslated region of GM-CSF mRNA mediates selectivemRNA degradation. Cell. 46:659-667.
37. Haas, J. G., C. Thiel, K. Blomer, E. H. Weiss, G. Riethmuller,and H. W. Loms Ziegler-Heitbrock. 1989. Downregulation of tumornecrosis factor expression in the human mono-mac-6 cell line by lipo-polysaccharide. J. Leukocyte Biol. 46:11-14.
38. Freudenberg, M. A., and C. Galanos. 1988. Induction of toler-ance to lipopolysaccharide (LPS)-D-Galactosamine lethality by pre-treatment with LPS is mediated by macrophages. Infect. Immun.56:1352-1357.
39. Fraker, D. L., M. C. Stovroff, M. J. Merino, and J. A. Norton.1988. Tolerance to tumor necrosis factor in rats and the relationship toendotoxin tolerance and toxicity. J. Exp. Med. 168:95-105.
40. Hasiberger, A., T. Sayers, H. Reiter, J. Chung, and E. Schutze.1988. Reduced release ofTNF and PCA from macrophages of tolerantmice. Circ. Shock. 26:185-192.
41. Larsen, N. E., and R. Sullivan. 1984. Interaction between en-dotoxin and human monocytes: characteristics of the binding of 3H-labeled lipopolysaccharide and 5'Cr-labeled lipid A before and after theinduction of endotoxin tolerance. Proc. Natl. Acad. Sci. USA.81:3491-3495.
42. Hampton, R. Y., D. T. Golenbock, and C. R. H. Raetz. 1988.Lipid A binding sites in membranes of macrophage tumor cells. J.Biol. Chem. 263:14802-14807.
43. Lei, M.-G., and D. C. Morrison. 1988. Specific endotoxic lipo-polysaccharide-binding proteins on murine splenocytes. J. Immunol.141:996-1005.
1118 Mathison et al.