industrial and ecological cumulative exergy consumption of the united states via the 1997...
TRANSCRIPT

ARTICLE IN PRESS
0360-5442/$ - se
doi:10.1016/j.en
�CorrespondE-mail addr
Energy 32 (2007) 1560–1592
www.elsevier.com/locate/energy
Industrial and ecological cumulative exergy consumption ofthe United States via the 1997 input–output benchmark model
Nandan U. Ukidwea, Bhavik R. Bakshib,�
aSolutia Inc.,730 Worcester Street, Springfield, MA 01151, USAbDepartment of Chemical and Biomolecular Engineering, The Ohio State University, Columbus, OH 43210, USA
Received 16 May 2006
Abstract
This paper develops a thermodynamic input–output (TIO) model of the 1997 United States economy that accounts for the flow of
cumulative exergy in the 488-sector benchmark economic input–output model in two different ways. Industrial cumulative exergy
consumption (ICEC) captures the exergy of all natural resources consumed directly and indirectly by each economic sector, while
ecological cumulative exergy consumption (ECEC) also accounts for the exergy consumed in ecological systems for producing each
natural resource. Information about exergy consumed in nature is obtained from the thermodynamics of biogeochemical cycles. As used
in this work, ECEC is analogous to the concept of emergy, but does not rely on any of its controversial claims. The TIO model can also
account for emissions from each sector and their impact and the role of labor. The use of consistent exergetic units permits the
combination of various streams to define aggregate metrics that may provide insight into aspects related to the impact of economic
sectors on the environment. Accounting for the contribution of natural capital by ECEC has been claimed to permit better representation
of the quality of ecosystem goods and services than ICEC. The results of this work are expected to permit evaluation of these claims.
If validated, this work is expected to lay the foundation for thermodynamic life cycle assessment, particularly of emerging technologies
and with limited information.
r 2006 Elsevier Ltd. All rights reserved.
Keywords: Exergy; Cumulative exergy; Emergy; Ecosystem goods and services; Input–output models; US economy
1. Introduction
Knowledge about the flow and transformation of exergyis proving to be useful for evaluating and understandingthe behavior of industrial and ecological systems. The mostcommon use of exergy analysis has been for the identifica-tion and reduction of sources of inefficiency in manufac-turing processes and equipment [1], and in evaluating thetrade-off between exergy consumption and capital cost[2,3]. More recent efforts have attempted to quantify theimpact of emissions via exergy analysis. This includesexploration of the relationship between the exergy ofemissions to their impact [4,5], calculating the exergy ofabatement for different pollutants [6], and converting theresults of life cycle impact assessment into exergetic terms
e front matter r 2006 Elsevier Ltd. All rights reserved.
ergy.2006.11.005
ing author. Tel.: +1614 292 4904; fax: +1 614 292 3769.
ess: [email protected] (B.R. Bakshi).
[7]. Exergy analysis and other thermodynamic methodshave also been popular for the modeling and assessment ofecological systems [8].Thermodynamic methods have also been developed to
consider systems at scales larger than individual equipmentor process. Cumulative exergy consumption (CEC), con-siders the exergy consumed in industrial processes in thesupply chain all the way to natural resources [1]. Exergeticlife cycle assessment (LCA) combines cumulative exergyconsumption and LCA by also considering exergy con-sumption in the demand chain [9]. Extended exergyanalysis (EEA) quantifies the contribution of labor via acorresponding ratio of cumulative exergy to money [10].Emergy analysis quantifies the contribution of ecosystemgoods and services by representing global energetic inputsin terms of solar equivalents, and calculating theircontribution to different natural products and services[11]. Like EEA, emergy also accounts for the contribution

ARTICLE IN PRESSN.U. Ukidwe, B.R. Bakshi / Energy 32 (2007) 1560–1592 1561
of labor and economic resources via an emergy to moneyratio. The relationship between many of these methods hasbeen described via the concepts of industrial cumulativeexergy consumption (ICEC) and ecological cumulativeexergy consumption (ECEC) [12]. ICEC is analogous toSzargut’s cumulative exergy consumption and only focuseson exergy consumption in industrial systems. In contrast,ECEC also accounts for exergy consumption in labor andcapital, like Sciubba’s EEA, exergy loss due to impact ofemissions, and exergy consumed in ecosystems for creatingthe ecosystem goods and services consumed by industrialactivities.
Each of these approaches is usually applied to a fewselected processes in the value chain or life cycle. Such anapproach has also been standardized in ISO 14000 for‘‘Process LCA’’. Since the life cycle is usually a large andcomplicated network of processes, including only the mostimportant ones can entail a large truncation error [13].Instead of selecting processes in a narrow boundary, manystudies have analyzed sectors in an entire nationaleconomy. These sectors lack the detail of individualprocesses, due to aggregation of constituent processes.Thermodynamic analysis of nations has been popular dueto its potential for providing useful insight about theefficiency of different countries, constituent economicsectors and specific technologies. Early efforts such as netenergy analysis focused on the use of energy resources[14–16], but ignored material streams and the second law.Subsequent efforts accounted for material and energy usealong with the second law via exergy analysis [17–21].A recent analysis of the Norwegian economy accounts forselected emissions and labor by using Sciubba’s EEAapproach [22]. Many of these efforts have resulted in exergyefficiencies of specific economic sectors based on accountingfor the direct and indirect cumulative exergy consumptionand the exergy of products. Most of the existing efforts fornational thermodynamic accounting focus mainly on theconsumption of natural resources, their flow througheconomic sectors and the resulting products. Nevertheless,most efforts focus on a small number of economic sectorssuch as energy, transportation, waste, manufacturing, etc.and lack the extent of detail commonly available ineconomic models. Input–output analysis permits the con-sideration of direct and indirect effects in a complicatednetwork and has been popular for monetary as well asthermodynamic analysis at the scale of economic sectors.Data about natural resource consumption of sectors areusually available in government statistics and can be used tocalculate the exergy consumed by each sector. However,information about the exergy of products from each sectoris often more challenging to find, particularly for sectorsthat are further along the economic chain such as advancedmanufacturing and service industry. Other shortcomings ofmany thermodynamic analyses at the national scale are thatthey ignore aspects such as the emission of pollutants andtheir impact, contribution of human labor and capital, andof ecological goods and services.
Ignoring the contribution of ecosystem goods andservices, or Natural Capital, can be a significant short-coming for methods that aim to encourage environmen-tally conscious or sustainable decision making. This isbecause ecological resources constitute the basic supportsystem for all activity on earth. These resources includeproducts such as air, water, minerals and crude oil andservices such as carbon sequestration and pollutiondissipation [11,23–25]. However, traditional methods inengineering and economics often fail to account for thecontribution of ecosystems despite their obvious impor-tance. The focus of these methods tends to be on short-term economic objectives, while long-term sustainabilityissues get shortchanged. Even techniques from industrialecology such as LCA ignore ecosystems. Such ignorance ofecosystems is widely believed to be one of the primarycauses behind a significant and alarming deterioration ofglobal ecological resources [26–29].Thermodynamic methods have been used for quantify-
ing the contribution of natural capital to economic activity.Costanza and Herendeen [30] considered the contributionof sunlight to agrarian and forestry sectors in proportion totheir land area, but ignored material inputs and the secondlaw. Hannon [16] presents a framework for including thecontribution of ecosystems in an economic input–outputmodel in mixed units. However, application to a specificnational or regional system is missing. Among biophysicalmethods for quantifying natural capital, emergy analysisstands out as being the most comprehensive approach thatincorporates knowledge about the contribution of globalbiogeochemical cycles to natural resources. A benefit ofconsidering the exergetic contribution of natural capital isclaimed to be its superior ability to capture the quality andversatility of different natural resources. However, the datafor evaluating this claim have not been available as yet.Emergy analysis is often misunderstood, faces quantitativeand algebraic challenges, and its broad claims aboutecological and economic systems have been controversial[31–34]. Besides, emergy analysis is usually applied for themost important processes in a short supply chain, withcontribution of inputs from the economy captured via acoarse economy-wide emergy to money ratio.This paper presents the thermodynamic input–output
analysis (TIOA) of the 1997 US economy via the economicinput–output benchmark model. This analysis is performedin the following two ways: without considering thecontribution of natural capital, and with the contributionof natural capital. In both cases, the use of input–outputalgebra permits consideration of direct and indirect exergyconsumption. The first approach only considers industrialprocesses and corresponds to ICEC analysis [12]. Thecontribution of ecosystem goods and services is consideredby expanding ICEC to include ecological processes, whichresults in ECEC analysis [12]. ECEC analysis extendsICEC analysis to include exergy losses in the industrial aswell as ecological stages of a production chain. Hau andBakshi have shown that under certain conditions, ECEC

ARTICLE IN PRESSN.U. Ukidwe, B.R. Bakshi / Energy 32 (2007) 1560–15921562
becomes equivalent to emergy. In addition, ECEC does not
rely on the controversial aspects of emergy such as the useof prehistorical emergy, maximum empower principle andclaims about emergy being a substitute for economicvaluation since it only relies on the thermodynamics ofdirect inputs from ecosystems to economic sectors and onlyon flow of current energy. The partitioning or allocation ofemergy between multiple outputs is another challengingaspect of emergy. ECEC takes a different view of allocationfrom emergy analysis and like LCA, treats it as a subjectivedecision. As described in more detail by Hau and Bakshi,this view sheds new light on the allocation approach ofemergy analysis and connects it with the standardizedapproach in LCA.
TIOA builds upon ECEC analysis by providing it with aformal algorithm to evaluate flows in linear static net-works. TIOA combines existing approaches from lifecycle analysis, exergy engineering, emergy analysis, andeconomic input–output analysis to formulate such analgorithm. TIOA has many unique features that distinguishit from other contemporary thermodynamic methodsand their application to nations. Some of these are listedbelow.
�
TIOA combines exergy analysis of industrial systemswith the ability of emergy analysis and systems ecologyto account for ecosystems, and input–output analysis toconsider direct and indirect effects in networks. � TIOA acknowledges the economic network and pro-vides industry-specific results. Such results are moreaccurate in appreciating the differences between indus-try sectors than a single aggregate metric for the entireeconomy like that of Odum [11] and Sciubba [35].
� TIOA can accommodate a wide variety of ecologicalproducts and services, human resources and impact ofemissions, making it a holistic approach. This approachis used for ICEC and ECEC analysis in this article, butcan be readily modified to other methods such as netenergy analysis and EEA.
In the past, TIOA has been applied to study contributionof ecological resources to a 91-sector 1992 US economy [7].Such analysis, though better than a completely aggregateanalysis of the entire economy, can still be improved byusing more detailed models of the US economic system.For instance, whereas the 91-sector 1992 model aggregatesall agricultural activity into a single sector, namely thesector of other agricultural products (SIC 2), the 1997benchmark model separates agricultural activity into 10sub-sectors (NAICS 1111A0-1119B0). Naturally the 1997benchmark model is more detailed than the 91-sector 1992model, and likely to provide more accurate results. 1997US industry benchmark model is the most recent repre-sentation of the US economic system at that level ofdisaggregation yet available. More recent benchmarkmodels are being compiled by the Bureau of EconomicAnalysis, but are not yet available for public use.
The results of TIOA include total ICEC and ECECrequirements of industry sectors. Total ECEC requirementcaptures the thermodynamic basis of industrial operationsand is analogous to the concept of ecological cost. Theanalysis also calculates ECEC/money ratio to juxtaposethermodynamic basis of an industrial operation withcorresponding monetary activity, and captures the dis-crepancy between thermodynamic work and the willingnessof people to pay for a good or service. Such discrepancyis believed to be the root cause behind lack of internaliza-tion of ecological resources into classical economics [36,37].Industry-specific ECEC/money ratios quantify the magni-tude of such discrepancy and may be useful for macro-economic policy decisions such as determination ofpro-ecological taxes. However, this work does not aim toconnect thermodynamics with economic value. Further-more, the TIO model may be useful for evaluating theclaim made by emergy analysts that using an analysisboundary that includes ecosystems is better at capturingdifferences in quality of resources such as their scarcity andrenewability.The rest of the paper is organized as follows: Section 2
discusses the background and methodological aspects ofTIOA. Section 3 discusses data requirements and sources forapplying TIOA to 488-sector 1997 benchmark model of theUS economy. Section 4 presents selected direct and indirectICEC and ECEC values of individual streams, while Section5 presents aggregate results and metrics including totalECEC requirements and ECEC/money ratios for individualindustry sectors. Applications based on this model aredescribed in Ukidwe and Bakshi [38] and Ukidwe [39].
2. Background: cumulative exergy and input–output analysis
2.1. Industrial and ECEC
While exergy analysis successfully captures qualitydifferences between material and energy streams, it focusesonly on the process under investigation while ignoring itsproduction chain. This hinders its use for environmentallyconscious decision making that requires consideration ofthe entire life cycle. Cumulative Exergy ConsumptionAnalysis [1] overcomes this shortcoming by consideringexergy requirements in the process as well as its supplychain. Hau and Bakshi [12] refer to this as IndustrialCumulative Exergy Consumption (ICEC) to convey itsemphasis on industrial processes. Extensions such asExergetic LCA [9] and Extended Exergy Accounting [10]incorporate the exergy consumption in the demand chainand due to labor in ICEC. However, ICEC analysiscompletely ignores exergy consumption in the ecologicalstages of the production chain and, consequently, cannotdistinguish quality differences between ecological productsand services. This shortcoming is addressed in ECECanalysis.ECEC was developed by expanding the boundary of
ICEC analysis to include the contribution of ecological

ARTICLE IN PRESSN.U. Ukidwe, B.R. Bakshi / Energy 32 (2007) 1560–1592 1563
goods and services [12]. Ecological functions may be in theform of natural resources such as coal, petroleum, timberand water that are used as raw materials by industrialprocesses or ecosystem services that are responsible forpollution dissipation, climate regulation etc. Knowledgeabout the exergy consumed in ecological and naturalprocesses is available from a variety of sources and hasbeen compiled by Szargut [40], Chen [41], Odum [42],Hermann [43] and others. Such analysis extends the supplychain all the way to the three main fundamental sources ofenergy, namely sunlight, geothermal heat and gravitationforces. Hau and Bakshi prove that ECEC can becomeequivalent to emergy if the following are identical for bothmethods: (i) analysis boundary, (ii) approach for combin-ing global energy inputs, and (iii) allocation method.Furthermore, if the approach suggested in emergy synth-esis is used for the above three items, transformity [11] isproved to be equivalent to the reciprocal of the cumulativedegree of perfection (CDP) [1]. The second and third itemshave been sources of confusion, since emergy analysis hasunique approaches for combining global energy inputs andfor partitioning the emergy of inputs between multipleoutputs. These approaches aim to account for qualitydifferences between solar, crustal and tidal energy, andbetween multiple products from a system. Similar chal-lenges are commonly encountered in LCA, and methodssuch as sensitivity analysis are recommended to evaluatethe effect of different approaches. The relationship betweenECEC and emergy shows that the most controversialclaims of emergy such as, the emergy theory of value,
Sun GeothermalEnergy
TidalEnerg
Litho. Atmos.
Bio. Hydro.
NaturalrawEcosystems
Human R
Emissions(CO2 in
respiration)
Consumption ofnatural resources
(O2 inair)
Ecosystemimpactdue to
anthropogenicemissions
Ecosystemfor diss
ecosystem
Fig. 1. Integrated economic-ecological-human resource system. ECEC analysis
in ecosystems (bounded by dashed box). Solid connecting lines represent tangib
as a consequence of emissions.
reliance on unknowable prehistoric energy flows, andmaximum empower principle that have hindered wideruse of emergy analysis, are not essential for using theinformation about biogeochemical cycles compiled byecologists and natural scientists. Consequently ECECanalysis has a sound and established basis in engineeringthermodynamics. Additional details are available in Hauand Bakshi [12,32].
2.2. Methodology for thermodynamic input–output analysis
TIOA recognizes the network structure of the integratedeconomic-ecological-social (EES) system shown in Fig. 1. Itcombines models of each subsystem and connects them viathe common currency of exergy flow. The economy isrepresented via an input–output model, which representsthe flow of money between a variety of economic sectors[44,45]. Such models are available for many countries.This information is used in allocating cumulative exergyflows between industry sectors. The ecological system isrepresented via four conceptual ecospheres that encompassland (lithosphere), water (hydrosphere), air (atmosphere)and living flora and fauna (biosphere). Such classificationassists categorization of vast number of ecological re-sources into smaller groups, and is by no means critical tothe applicability of TIOA. Any other user-defined classifi-cation scheme would also work as long as renewable andnon-renewable resources are distinguished. Informationabout the contribution of human resources and emissionsfrom various sectors is available from government data.
y
Resources as materials Economy
esources
FinalDemand Value
Added
servicesipation impact,
Impactof emissiononhuman health
considers all subsystems, while ICEC analysis ignores exergy consumption
le interactions and dotted lines represent intangible interactions occurring
ARTICLE IN PRESSN.U. Ukidwe, B.R. Bakshi / Energy 32 (2007) 1560–15921564
Conversion of the impact of emissions in exergetic terms isaccomplished via methods developed for life cycle impactassessment. Details about sources of data used in this workfor the US are provided in Section 3.
Fig. 1 also shows the interactions between economic,ecological and societal systems. Interactions represented bysolid lines arise on account of resource consumption andemissions, whereas those represented by dotted lines areintangible interactions indicating impact of emissions onhuman and ecosystem health. For instance, the dottedarrow between the economy and ecosystems representsecological services required for dissipating industrialemissions and their impact on ecosystem health. The solidarrow from ecosystems to the economy, on the contrary,represents tangible interactions that include consumptionof ecological resources as raw materials by the economicactivity. If interactions between ecospheres and theirconversion of solar, crustal and tidal energy are ignored,then Fig. 1 represents ICEC analysis. These processes areshown within the dashed region and represent the keydifference between the systems considered in ICEC andECEC. In this case, the contribution from ecosystems isrepresented via the exergy content of the natural resource,and exergy consumption for producing that resource inecological systems is ignored.
The approach used for partitioning the cumulativeexergy of inputs among multiple products is as follows[12]. If the structure of the network and its products areknown, then allocation is done in proportion to the exergycontent or monetary value of the output streams, depend-ing on which information is available. For the economicinput–output model, only monetary information is avail-able. For this allocation method, the cumulative exergy ofdifferent streams is additive. Streams representing cumula-tive exergy at vastly different time periods are also additive.In contrast, if the structure of the network and its productsare not known, then allocation is avoided by assigning theentire cumulative exergy of inputs to each output. Whensuch streams are combined, they cannot be added to avoiddouble counting, and only the maximum value of thestreams is used. Such streams are non-additive. This isanalogous to the approach used in emergy analysis forallocation among coproducts. In this work, for ICECanalysis, all streams are additive, while for ECEC analysis,renewable resources are non-additive, and non-renewableresources are additive. Thus, if there are r1 non-additiveresources and r2 additive resources, throughput vectorsfor each resource can be written using the followingequations:
CR1;i ¼ ðI� cTÞ�1 � CR1;in ; 8i ¼ 1; . . . ; r1, (1)
CR2;j ¼ ðI� cTÞ�1 � CR2;jn ; 8j ¼ 1; . . . ; r2. (2)
Here CR1;in and CR2;j
n are direct input vectors for the ith non-additive resource and the jth additive resource respectivelyand c is the allocation matrix, which in the case of TIOA, isthe monetary inter-industry transaction matrix. The
separately calculated cumulative exergy consumptionvalues are combined for each stream according to whetherthey are additive or not. In general, the maximumcontribution from non-additive resources is added to thesum of contributions from all additive resources as
CtotalðkÞ ¼ max CR1;i ðkÞ
� �i¼1;...r1
þXr2
j¼1
CR2;j ðkÞ 8k ¼ 1; . . . ; n.
(3)
Here n represents the number of industry sectors. Thedetailed algorithm for ECEC analysis is available in [12].The algorithm of TIOA can be summarized as the
following three tasks. Details about the sources of data andmethods are in Section 3.
1.
Identify and quantify ecological and human resourceinputs to the economic system. Ecological inputs includeecosystem products such as crude oil and ecosystemservices such as wind and fertile soil. Human resourcesinclude employment of labor for economic activities.Emissions and their impact on human and ecosystemhealth may also be included.
2.
Calculate CEC of direct ecological inputs using transfor-mity values from systems ecology for ECEC or exergyof inputs (unit transformities) for ICEC. For ECEC,these inputs are classified as additive or non-additive tobe consistent with the network algebra rules used inemergy analysis [11,12]. In general, non-renewableresources are additive, while renewable resources arenon-additive.3.
Allocate direct inputs to economic sectors using input–output data and the network algebra of ECEC analysis
[45]. The network algebra of ECEC analysis is based ona static input–output representation of the economicsystem. Dynamic versions of input–output analysis thatconsider temporal changes in the economic network arealso available, and are currently being explored. Also,use of monetary data for allocation is not a limitation ofthe approach, but is rather caused by a lack ofcomprehensive material or energy accounts of inter-industry interactions. ECEC analysis as used in thiswork does not rely on the track-summing algorithm tocalculate ECEC flows in the economic network [11], butrather on simultaneous solution of a system of linearequations establishing cumulative exergy balance oneach system component as well as the overall system.The effect of different allocation methods on the resultsis currently under investigation.
2.3. Illustrative example
The following example illustrates the TIOA methodol-ogy discussed in the previous section. The system underconsideration resembles a hypothetical economy compris-ing three sectors. Fig. 2 shows the economic input–output structure for this network and Table 1 shows

ARTICLE IN PRESS
NR Ra
1
3
2
0.067
0.06250.5
0.2
0.133
0.1
0.25
0.50.2
NR1
Ra1
Rb2
HR3
IM2Economy
Environment
Human Resources
Rb
E2
Fig. 3. Augmented system showing ecological and human resource inputs
to economic sectors.
Table 1
Allocation matrix for hypothetical 3-sector economy shown in Fig. 2
To 1 2 3 FD/HR To
From
1 0.5 0.1 0.2 0.2 1
2 0.25 0.0625 0.5 0.1875 1
3 0.133 0.2 0.067 0.6 1
VA/HR 0.08 0.28 0.64 1
N.U. Ukidwe, B.R. Bakshi / Energy 32 (2007) 1560–1592 1565
the corresponding inter-industry transaction coefficientmatrix, c.
c ¼
0:5 0:1 0:2
0:25 0:0625 0:5
0:133 0:2 0:067
264
375. (4)
This matrix is derived by normalizing the output fromsector i to sector j by the total output from sector i.
The next step is identification and quantification ofnatural and human resource inputs to the economicsystem. This is shown in Fig. 3. Two different renewableresources, Ra1 and Rb2, one non-renewable resource, NR1,human resource, HR3, emission, E2, and impact ofemission on human health, IM2, have been considered inthis hypothetical example. In each case, the subscriptrepresents the sector that gets the direct input of thatparticular resource.
The flows depicted in Fig. 3 are subsequently convertedinto a consistent thermodynamic unit of ICEC or ECEC,as shown in Table 2. Calculation of ICEC of direct inputsassumes a uniform transformity of unity and does notinclude human resources or impact of emission on humanhealth. Additional methodological details about howecological and human resource inputs and emissions andtheir impact can be converted into ECEC and ICEC termscan be found in Ukidwe [39]. To determine total ECECand ICEC throughputs of the three sectors, the directinputs need to be allocated through the economic networkaccording to the allocation approach and equationsdescribed in Section 2.2. This is done by first calculatingthe throughput vectors, CNR1
y ;CRa1y ;CRb2
y ;CHR3y ;CIM2
y forindividual resources as per Eqs. (1) and (2). ICEC analysistraditionally ignores human resources and impact ofemissions on human health and only considers NR1, Ra1,Rb2, whereas ECEC analysis does not ignore humanresources and impact of emissions on human health and
Fig. 2. Network representation of the hypothetical 3-sector economy.
considers NR1, Ra1, Rb2, HR3 and IM2. Subsequently, todetermine total ECEC throughput vector, Ctotal
ECEC, through-put vectors for individual resources are added accordingto Eq. (3).Figs. 4(a) and (b) depict direct and indirect ECEC and
ICEC throughput vectors for individual resources as wellas the total throughput vectors in graphical form. A similarconceptual methodology has been used in deriving theresults for 488-sector 1997 US economic system in Section4 of this paper. Based on the results presented in Fig. 4several performance metrics can be evaluated. Theseperformance metrics are listed in Table 3 along with theirdefinitions, which do not rely on knowledge of the exergycontent of the outputs from each sector, since suchinformation is not readily available via the input–outputmodel. Yield ratio indicates the proportion of the totalECEC requirement of a process or product that is derivedfrom the economy. A process that derives a larger portion

ARTICLE IN PRESS
Table 2
Ecological and human resource inputs in Fig. 3 and corresponding ECEC flows
Stream number Type Physical data Transformity (sej/J) Direct ECEC Direct ICEC
Input (sej/d) Input (J/d)
NR1 Non-renewable 10 J/d 100.000 1,000,000 10
Ra1 Renewable 50 J/d 20.000 1,000,000 50
Rb2 Renewable 10 J/d 10.000 100,000 10
HR3a Human resource 50 h/d 5.000 250,000 —
E2 Emission 2 kg/d — — —
IM2b Impact on human health 2 kg/d 1.000 1,752,000 —
aMan hours employed, hi ¼ 50 h/d, average annual payroll for selected sector, Pi ¼ $80/d, minimum average annual payroll, Pmin ¼ $16/d,
Transformity of unskilled labor, tunskilled ¼ 1000 sej/h, C ¼ hi. (Pi/Pmin). tunskilled
¼ 250,000 sej/d.bMass flow rate of emission, m ¼ 2 kg/d, Disability Adjusted Life Year, DALY ¼ 0.1 yr/kg, t ¼ 1000 sej/h C ¼ m. DALY. (365 day/yr). (24 h/day).
t ¼ 1,752,000 sej/d.
N.U. Ukidwe, B.R. Bakshi / Energy 32 (2007) 1560–15921566
of its inputs directly from ecosystems has a higher yieldratio and vice-versa. Loading ratio (LR) indicates therelative reliance of a process or product on non-renewableresources. The ratio of YR to LR, called yield-to-loadingratio, is defined in emergy analysis as the index ofsustainability. According to this ratio, a process that relieson ecosystems but has lower reliance on non-renewableresources is considered to be more sustainable. Further-more, impact per value added indicates the ratio of humanhealth impact of emissions to some measure of valueadded, such as profitability or productivity. These perfor-mance metrics are easy to calculate and provide usefulinsight into the environmental implications of industrialproducts and processes. These metrics are similar to thoseused in emergy analysis [11,46]. The main difference is inthe way resources are categorized. For instance, unlikeemergy analysis, the analysis presented in this paper doesnot have to distinguish between purchased inputs anddirect ecological inputs. Since the TIOA can consider theentire economic network, ecological inputs embodied inpurchased inputs can also be quantified. Accordingly,direct ecological inputs in emergy analysis correspond todirect ECEC inputs in TIOA and purchased inputs inemergy analysis correspond to indirect ECEC inputs inTIOA. The performance metrics for the illustrativeexample shown in Fig. 3 are calculated in Table 4.
3. Data sources for 1997 US industry benchmark model
This section describes the resources considered in thisanalysis, along with their data sources. All required datahave been obtained from non-proprietary public-domaindatabases.
3.1. Transformities
ICEC and ECEC values of direct ecological inputs andhuman resources are determined via their transformityvalues [11,47,48]. Transformities can also be viewed asreciprocals of global exergetic efficiencies of ecologicalresources. Since ICEC analysis does not consider ecologicalstages of a production chain, it implicitly assumes
cumulative exergy of direct natural resource inputs to beequal to their standard exergy values. This is tantamountto using a uniform transformity or thermodynamicefficiency of unity for all natural resources.For ECEC calculation, as discussed in Section 2,
transformities, as used in this analysis, are not subject tothe controversial aspects of Odum’s work such asmaximum empower principle, emergy theory of value orenergy consumption over geological time scales. Thenumbers used in this analysis correspond to the 1996 baseof 9.44� 1024 sej/yr [11]. Furthermore TIOA only usestransformities of direct inputs from nature and derivedtransformities of economic goods and services are notrequired. The transformities used in this work are listed inTables 5 and 6.
3.2. Ecosystem products
Ecosystem products refer to the natural raw materialsconsumed for economic activities. These raw materials areextracted by basic infrastructure activities such as mineralmining, coal mining, petroleum and natural gas extraction,and logging and timber tract harvesting. Table 5 lists theecosystem products considered in this analysis, their flowsin the 1997 US economic model, the industry sectors thatreceive their direct inputs and corresponding data sources.These data sources were also used for the TIOA of the91-sector 1992 US economy [7]. Furthermore, the analysispresented in this paper expands the scope of the previousanalysis of 1992 US economy by incorporating data aboutgold mining and natural gas consumption. The inputs toagricultural activities were adjusted using data aboutnumber of farms and their average size during 1992 and1997. Currently work is underway to expand the scopefurther by including material and energy flow informationabout additional ecosystem products.
3.3. Ecosystem services
This paper focuses only on supply-based services as theircontribution can be quantified independent of humanvaluation. Supply-based services are always accompanied

ARTICLE IN PRESS
1 2 30
1
2
3x 10⁶
NR1
1 2 30
1
2
3x 10⁶
Ra1
1 2 30
5
10
15x 105
Rb2
1 2 30
1
2
3
4x 10⁵
HR3
1 2 30
1
2
3x 10⁶
IM2
1 2 30
2
4
6
8x 10⁶
Total
1 2 30
5
10
15
20
25NR1
1 2 30
20406080
100120140
Ra1
1 2 302468
101214
Rb2
1 2 30
50
100
150
200Total
b
a
Fig. 4. Throughput vectors for individual resources and total throughput vector for the network in shown in Fig. 3 (a) ECEC analysis (b) ICEC analysis.
(X-axis: sector number, Y-axis: ECEC flow in sej/d or ICEC flow in J/d; black region is the direct input, white region is indirect input).
Table 3
Performance metrics using thermodynamic input–output analysis and
their definitions
Metric Definition
Yield ratio (YR) Total throughput/input from economy
Loading ratio (LR) Throughput from non-renewable
resources/throughput from renewable
resources
Yield-to-loading ratio (YLR) Yield ratio/loading ratio
Impact per value added Impact of emissions on human health/
value added
N.U. Ukidwe, B.R. Bakshi / Energy 32 (2007) 1560–1592 1567
by concomitant material and energy flows, and hence canbe readily included in TIOA. This analysis considerssunlight for 24-h photosynthesis, fertile soil and wind,geopotential and hydropotential for electricity generation.Other ecosystem services such as the geological cycle andwater cycle are considered in the transformity calculationsfor mineral resources and water, respectively, as shown inTable 5. Additional supply-based services such as thoseinvolved in pollination, carbon sequestration and dissi-pation of pollutant streams can also be included in TIOA,but would entail a more thorough understanding of their

ARTICLE IN PRESS
Table 4
Performance metrics for illustrative example shown in Fig. 3
Sectors
1 2 3
ECEC Analysis
Yield ratio 1.44 2.77 1.07
Loading ratio 1 0.3 0.79
YLR 1.44 9.23 1.35
Impact per value added 1.63� 104 6.83� 103 2.04� 103
ICEC Analysis
Yield ratio 1.64 1.35 1
Loading ratio 0.19 0.12 0.16
YLR 8.84 11.23 6.26
N.U. Ukidwe, B.R. Bakshi / Energy 32 (2007) 1560–15921568
geo-bio-chemical mechanisms. Unlike supply-based ser-vices, the value-based services cannot be measured usingbiophysical principles only. Examples of value-based servi-ces include those for recreational and cultural purposes.They depend on how people perceive them, and are dealtwith in the environmental economics literature [25,49].
3.4. Human resources
Industry sectors consume human resources in the formof labor. Amount of human resources consumed is afunction of number of individuals employed and their skill-level. In this paper, average annual payroll is chosen as ameasure of the quality of labor. Data about number ofpeople employed and their average annual payroll areavailable from US Department of Labor’s Bureau of LaborStatistics [50]. In this analysis, human resources areconsidered to be exogenous to the economic modelrepresenting inter-industry interactions. Therefore, in theabsence of a single input–output model integratingindustry sectors and societal sectors, interactions betweeneconomy and human resources need to be consideredindependently. This approach is an approximation andmay be improved via more integrated accounting of humanconsumption and economic sectors. Contribution of hu-man resources is determined via the transformity ofunskilled labor, obtained from Odum [11], and calculatedas the ratio of the total emergy budget to the totalpopulation of the US. Odum assumes that the total emergyinput to the US economy is passed on to human resourcesvia final demand which represents sale of economic goodsand services to consumers, and consumers, in turn, feed theemergy flow back to the economy via value added whichincludes employment of labor. Hence, human resourcesincorporate natural capital flows between economy andhuman resources. Moreover, the per capita emergy budgetof the US can be used to represent unskilled labor as onlyhalf the US population was employed in 1997. Theremaining half comprised of minors, retirees and unem-ployed people. This approach may also be used to includethe contribution of human resources while ignoring
ecosystems via the ICEC to money ratio, which makes itsimilar to Extended Exergy Accounting [10]. Relevantcalculations are in Section 4.2.
3.5. Impact of emission on human health
Industrial emissions affect human health in myriad ways.The actual impact depends on the fate of a pollutant in thenatural environment and its effect on human well being.The fate itself depends on numerous physico-chemicalphenomena such as dispersion, diffusion and atmosphericchemistry. There are several established procedures forcalculating the impact of emissions on human health. Theapproach employed in this analysis represents the impactof several common pollutants on human health in terms ofdisability adjusted life years (DALY). This is an end-pointimpact assessment methodology that considers severalimpact categories including respiratory disorders, photo-chemical smog formation, ozone layer depletion, climatechange and carcinogenicity [51,52]. Table 7 lists pollutantsconsidered in this work, the impact categories they belongto and corresponding DALY values per kg of emission.Emissions data were gathered from the US EnvironmentalProtection Agency’s Toxics Release Inventory (TRI) [53].The approach for converting DALYs to ECEC has beendiscussed in Ukidwe and Bakshi [7]. Currently worktowards including more pollutants in this analysis is inprogress. Relationship between DALY and ECEC is linear,and 1 DALY/day of human health impact corresponds to9.35� 1013 sej/day of impact in ECEC terms. Furthermore,conversion of DALY into ECEC is necessary only if it isdesired to have a single numeraire for comparing diverseflows of ecosystem goods and services, human resourcesand emissions and their impact on human health. If a singlemetric is not required, it may be better not to convertDALY into ECEC giving rise to multiple streams indisparate units that would have to be considered in amultiobjective framework. The analysis presented in thispaper does not consider ecosystem impact of emissions, butthe general approach could be applied for it if exergy lossdue to ecosystem impact could be quantified. A similarapproach could be used to represent the impact ofemissions in terms of ICEC, but is not considered in thiswork.
3.6. Allocation matrix for inter-industry interactions
This analysis uses a monetary, inter-industry transactioncoefficient matrix to represent the US economic system.Such a matrix is compiled periodically by the USDepartment of Commerce’s Bureau of Economic Analysis.More specifically, results presented in Section 4 are basedon the 488-sector 1997 US inter-industry benchmark model[54]. Similar results have been published in the past for the91-sector 1992 model which is a more concise andaggregated representation of the US economy [7]. Anallocation matrix based on material or energy interactions

ARTICLE IN PRESSN.U. Ukidwe, B.R. Bakshi / Energy 32 (2007) 1560–1592 1569
between industry sectors may be more accurate than amonetary transaction matrix, but is not availableat present. The ‘‘materials count’’ initiative undertakenby National Research Council [55] is an example ofefforts that strive to compile a biophysical transactionmatrix for the US economy. If this initiative materializes,more accurate data could be used for inter-industryallocation.
4. Results for individual inputs and outputs
The TIOA methodology can be applied to determinedirect and indirect ECEC and ICEC requirements ofindividual industry sectors. The following subsectionsfocus mainly on ECEC requirements of individual sectors.Similar ICEC plots may be readily generated, but most ofthem are not shown in the interest of brevity. Section 5presents aggregate results based on both ICEC and ECEC.
sej/yr
-2.5E+24
-2.0E+24
-1.5E+24
-1.0E+24
-5.0E+23
0.0E+00
5.0E+23
1.0E+24
1.5E+24
2.0E+24
2.5E+24
1 36 71 106 141 176 21
Petrole(NAICS
Oil & Gas Extraction(NAICS 211000)
-4.0E+22
-2.0E+22
0.0E+00
2.0E+22
4.0E+22
6.0E+22
8.0E+22
1
sej/yr
Gr
(N
2 3
Fig. 5. ECEC Contribution from Lithosphere to US economic sectors; y-axis
sector serial number (black part of each bar represents direct inputs and whit
4.1. Ecosystem products
Figs. 5–7 show the total contribution of ecologicalproducts listed in Table 5 to the industry sectors in 1997US industry benchmark model. Figs. 5 and 6 showlithosphere resources calculated as Industrial and Ecologi-cal CEC, while Fig. 7 shows the rest of the inputs as ECEC.These figures also show direct and indirect inputs to eachindustry sector. The sector names, NAICS codes and serialnumbers of the economic sectors are shown in Appendix Aof the Supporting Information. These results are in generalagreement with those obtained from the analysis of the91-sector 1992 US economy. The differences between the twoanalyses are noted at appropriate locations in this section.
4.1.1. Lithosphere
Fig. 5 shows ECEC requirements of industry sectorsfrom the lithosphere. Sectors of stone mining and quarrying
LITHOSPHERE
1 246 281 316 351 386 421 456
Industry Sectors
um Refineries 324110)
4 5 6 7 9 10
Agricultural Sectors
ain Farming
AICS 1111B0)
All Other
Crop Farming
(NAICS 1119B0)
Greenhouse & Nursery
Production (NAICS 111400)
8
is annual flows of ECEC in solar equivalent joules (sej/yr), and x-axis is
e part represents indirect inputs).

ARTICLE IN PRESSTable
5
Data
forecosystem
product
inputs
to1997USeconomy
Resourceconsidered
inthisanalysis
Industry
sectorreceivingdirectinputandits
NAIC
Scode
Materialorenergy
flow
(F)
Data
source
for
F
ICEC
flow
(J/yr)
Transform
ity
(t)
Data
source
fort
ECEC
flow,
c¼
tF(sej/yr)
Lit
hosp
her
e
Crudepetroleum
fieldproduction
OilandGasExtraction(N
AIC
S211000)
1.06�1019J/yra
[68]
1.06�1019
53000sej/J
[11]
5.61�1023
Naturalgas
OilandGasExtraction(N
AIC
S211000)
18.9MMCuF/yr
[69]
1.99�1019
48000sej/J
[11]
9.58�1023
Iron-ore
mining
Ironore
mining(N
AIC
S212210)
202MMT/yr
[70]
2.08�1016b
1�109sej/g
[11]
2.02�1023
Copper
mining
Copper,nickel,leadandzincmining(N
AIC
S
212230)
342MMT/yrc
[70]
2.80�1016d
1�109sej/g
[11]
3.42�1023
Gold
mining
Gold,silver
andother
metalmining(N
AIC
S
2122A0)
217MMT/yre
[70]
5.63�1016f
1�109sej/g
[11]
2.17�1023
Crushed
stone
Stoneminingandquarrying(N
AIC
S212310)
1390MMT/yr
[70]
1.83�1017g
1�109sej/g
[11]
1.39�1024
Sand
Sand,gravel,clayandrefractory
mining(N
AIC
S
212310)
961MMT/yr
[70]
1.27�1017h
1�109sej/g
[11]
9.61�1023
Raw
coalexcludingoverburden
Coalmining(SIC
212100)
988MMT/yr
[70]
5.73�1019i
1�109sej/g
[11]
9.88�1023
Nitrogen
from
mineralization
Agriculturalsectors
(NAIC
S1111A0-1119B0)
2.96MMT/yrj
[71]
1.15�1015k
4.19�109sej/
g
[11]
1.24�1022
Phosphorousfrom
Mineralization
Agriculturalsectors
(NAIC
S1111A0-1119B0)
1.97MMT/yrl
[71]
9.75�1014m
2�109sej/gn
[11]
3.94�1021
N-D
epositionfrom
atm
osphereo
Agriculturalsectors
(NAIC
S1111A0-1119B0)
1.97MMT/yrp
[71]
7.76�1014q
4.19�109sej/
g
[11]
8.25�1021
Return
ofdecomposingdetritusto
agriculturalsoil
Agriculturalsectors
(NAIC
S1111A0-1119B0)
�433MMT/yrr
[71]
�8.77�1018s
2.24�108sej/
gofresiduet
[11]
�9.70�1022
Bio
sph
ere
Woodproduction
Logging(N
AIC
S113300)
520MMT/yrof
roundwood
[71]
8.27�1018u
5.55�108sej/
gv
[11])
2.90�1023
Pasture
Grazing
Cattle
RanchingandFarm
ing(N
AIC
S112100)
200MMT/yrof
wet
grass
[71]
1.67�1018w
5.83�1019
sej/MMTof
wet
grass
x
[11]
1.17�1022
Hy
dro
sph
ere
Waterconsumption
Water,sewageandother
system
s(N
AIC
S
221300)
1.47�1014
gallons/yr
[72]
2.73�1018y
7.67�108sej/
gallonz
[48]
1.13�1023
Atm
osp
her
e
CO
2in
24-h
net
photosynthesis
Agriculturalsectors
(NAIC
S1111A0-1119B0)
867MMT/yra
[71]
0b
6.19�107sej/g
CO
2g
[11]
5.37�1022
a(4.803�106barrelson-shore
production/day)�(30days/month)�(12months/yr)�(6.12�109J/barrel)¼
1.06�1019J/yr.
bIronore
mining:mass
flow
rate
(F)¼
202MMT/yr;exergyofFe 2O
3(b)¼
103J/g[1];IC
EC
Flow¼
F�
b¼
2.08�1016J/yr.
cCopper
Mining:(2.07MMT/yr1997mineproduction)�(297MMT/yr1993domesticoresinput)/(1.79MMT/yr1993mineproduction)¼
(342MMT/yr1997domesticoresinput);assumingflotation,
concentration,sm
eltingandrefiningtechnologiesandratioofdomesticto
imported
concentratesunchanged
between1993and1997.
dCopper
mining:342MMT/yrdomesticoresinput(F);exergyofCuO
(b)¼
82J/g[1];IC
EC
flow¼
F�
b¼
2.80�1016J/yr.
eGold
Mining:(325tons/yr
1997
gold
production)�(221MMT/yr
1993
domestic
gangue)/(331tons/yr
1993
gold
production)¼
(217MMT/yr
1997
domestic
gangue);assuming
flotation,
concentration,sm
eltingandrefiningtechnologiesandratioofdomesticto
imported
concentratesunchanged
between1993and1997.
f Gold
Mining:217MMT/yrdomesticoresinput(F);exergyofAu2O
3(b)¼
(114.7KJ/mol)/(441.93g/m
olofAu2O
3)[1];IC
EC
flow¼
F�
b¼
5.63�1016J/yr.
gCrushed
Stone:
Mass
Flow
Rate
(F)¼
1390MMT/yr;exergyofSiO
2(b)¼
132J/g[1];IC
EC
Flow¼
F�
b¼
1.83�1017J/yr.
hSand:Mass
Flow
Rate
(F)¼
961MMT/yr;exergyofSiO
2(b)¼
132J/g[1];IC
EC
Flow¼
F�
b¼
1.27�1017J/yr.
i Raw
CoalExcludingOverburden:Mass
Flow
Rate
(F)¼
878MMT/yr;exergyofcoal(b)¼
29000J/g[1];IC
EC
Flow¼
F�
b¼
2.56�1019J/yr.
N.U. Ukidwe, B.R. Bakshi / Energy 32 (2007) 1560–15921570

ARTICLE IN PRESSj N
itrogen
from
mineralization:(3MMT/yr1993Nitrogen
fluxfrom
mineralization)�(1.91�106farm
sin
1997)�(487acres
averagesize
offarm
in1997)/(1.93�106farm
sin
1993)/(491acres
average
size
offarm
in1993)¼
2.96MMT/yr1997Nitrogen
fluxfrom
mineralization.
kNitrogen
from
mineralization:Mass
Flow
Rate
(F)¼
2.96MMT/yr;exergyofMg(N
O3) 2
(b)¼
387J/g[1];IC
EC
Flow¼
F�
b¼
1.15�1015J/yr.
l Phosphorousfrom
mineralization:(2MMT/yr1993phosphorousfluxfrom
mineralization)�(1.91�106farm
sin
1997)�(487acres
averagesize
offarm
in1997)/(1.93�106farm
sin
1993)/(491acres
averagesize
offarm
in1993)¼
1.97MMT/yr1997Phosphorousfluxfrom
mineralization.
mPhosphorousfrom
mineralization:Mass
Flow
Rate
(F)¼
1.97MMT/yr;exergyofMg3(PO
4) 2
(b)¼
495J/g[1];IC
EC
Flow¼
F�
b¼
9.75�1014J/yr.
n(4.6�108sej/gofP2O
5)�(1gofP2O
5/0.23gofP)¼
2�109sej/gofP.
oN-depositionfrom
Atm
osphereisconsidered
isaninputfrom
lithospheresince
Nitrogenoussaltsenterplants
throughsoil.
pN-depositionfrom
Atm
osphere:(2MMT/yr1993N-depositionflux)�(1.91�106farm
sin
1997)�(487acres
averagesize
offarm
in1997)/(1.93�106farm
sin
1993)/(491acres
averagesize
offarm
in
1993)¼
1.97MMT/yr1997N-depositionflux.
qN-depositionfrom
Atm
osphere:
mass
flow
rate
(F)¼
1.97MMT/yr;exergyofMg(N
O3) 2
(b)¼
387J/g[1];IC
EC
Flow¼
F�
b¼
7.62�1014J/yr.
r Return
ofdetritalmatter:(440MMT/yr1993
flux)�(1.91�106farm
sin
1997)�(487acres
average
size
offarm
in1997)/(1.93�106farm
sin
1993)/(491acres
average
size
offarm
in
1993)¼
433.4MMT/yr1997flux,Negativesignindicatesflow
from
industry
sectorto
Lithosphere.
s Return
ofdetritalmatter:(433MMT/yrofreturned
detritusresidue)�(0.44gC/g
ofresidue)�(11kcal/gC)�(4186J/kcal)¼
8.77�1018J/yr[11].
t (0.44gC/g
ofresidue)�(11kcal/gC)�(4186J/kcal)�(11068sej/JTransform
ityofdetritusproduction)¼
2.24�108sej/gresidue.
uWoodProduction:520MMT/yrroundwood�3.8kcal/groundwood�4186J/kcal¼
8.27�1018J/yr[11].
v(3.8kcal/groundwood)�(4186J/kcal)�(34900sej/J)¼
5.55�108sej/gofroundwood.
wPasture
Grazing:
440MMT/yr
of
wet
grass�0.5
MMT
of
dry
grass/M
MT
of
wet
grass�1012
g/M
MT�1.86�1011J/ha/yr
of
pasture
evapotranspiration�9�10�4
m2/g�10�4
ha/m
2¼
5.83�1019sej/MMT
ofwet
grass
[11].
x(0.5
MMT
ofdry
grass/M
MT
ofwet
grass)�(1012g/M
MT)�(1.86�1011J/ha/yrofpasture
evapotranspiration)�(6962sej/J)�(9�10�4m
2/g)�(10�4ha/m
2)¼
5.83�1019sej/MMT
ofwet
grass.
yWaterConsumption:1.47�1014gallons/yr�3785cm
3/gallonofwater�1gofwater/cm
3ofwater�4.94J/gofwater¼
2.73�1018J/yr[11].
z(3785cm
3/gallonofwater)�(1gofwater/cm
3ofwater)�(4.94J/gofwater)�(4.1�104sej/J)¼
7.67�108sej/gallonofwater.
aCO
2in
24-h
photosynthesis:(880MMT/yr1993CO
2flux)�(1.91�106farm
sin
1997)�(487acres
averagesize
offarm
in1997)/(1.93�106farm
sin
1993)/(491acres
averagesize
offarm
in
1993)¼
866.8MMT/yr1997CO
2flux.
bAtm
ospheric
Gasesbeingatreference
state
are
ignoredin
ICEC
analysis.
g(12gC/44gCO
2)�(8kcal/gC)�(4186J/kcal)�(6780sej/J)¼
6.19�107sej/gCO
2.
N.U. Ukidwe, B.R. Bakshi / Energy 32 (2007) 1560–1592 1571

ARTICLE IN PRESS
Table 7
Pollutants, immediate destination of emission and impact category
Pollutant Immediate destination of
emission
Impact category
considered
DALY/kg of emissiona ECEC/kg of emission (sej/kg)
SO2 Air Respiratory disorders 5.46� 10�5 1.86� 1012b
NO2 Air Respiratory disorders 8.87� 10�5 3.03� 1012
PM10 Air Respiratory disorders 3.75� 10�4 1.28� 1013
CO2 Air Climate changec 2.1� 10�7 7.17� 109
Methanol Air Respiratory disorders 2.81� 10�7 9.59� 109
Ammonia Air Respiratory disorders 8.5� 10�5 2.90� 1012
Toluene Air Respiratory disorders 1.36� 10�6 4.64� 1010
1,1,1-TCE Air Ozone layer depletion 1.26� 10�4 4.30� 1012
Styrene Air Carcinogenic effect 2.44� 10�8 8.33� 108
Styrene Water Carcinogenic effect 1.22� 10�6 4.16� 1010
Styrene Soil Carcinogenic effect 2.09� 10�8 7.13� 108
aDALY Values are based on Hierarchist Perspective.bHuman Health Impact of emission per kg of SO2 emission ¼ (5.46� 10�5DALY/kg of SO2 emission)� (365 days/yr) � (9.35� 1013sej emergy
associated with unskilled labor/workday) ¼ 1.86� 1012 sej/kg; Emergy of unskilled labor is obtained from emergy literature [11], and is obtained by
dividing total emergy budget of the US (7.85� 1024 sej/yr) by the total population of the US (230� 106 people).cImpacts are potential impacts in future [52].
Table 6
Data for ecosystem service inputs to 1997 US economy
Ecosystem Service Sector receiving direct
input and corresponding
NAICS code
Energy or material
flow (F)
Data
source
for F
ICEC Flow Transformity (t) Data
Source
for t
ECEC flow
(J/yr) (sej/J) (C ¼ F.t)(sej/yr)
Sunlight for
photosynthesis
Agricultural sectors
(NAICS 1111A0-1119B0)
2.23� 1022 J/yra [56,57] 2.23� 1022 1 [11] 2.23� 1022
Forest nurseries, forest
products and timber tracts
(NAICS 113A00)
1.19� 1022 J/yr [56,57] 1.19� 1022 1 [11] 1.19� 1022
Hydropotential for
power generation
Power generation and
supply (NAICS 221100)
1.28� 1018 J/yr [69] 1.28� 1018 27764 [11] 3.55� 1022
Geothermal heat
for power
generation
Power generation and
supply (NAICS 221100)
5.3� 1016 J/yr [69] 5.3� 1016 6055 [11] 3.21� 1020
Wind energy for
power generation
Power generation and
supply (NAICS 221100)
1.18� 1016 J/yr [69] 1.18� 1016 1496 [11] 1.77� 1019
Soil erosion Agricultural sectors
(NAICS 1111A0-1119B0)
34.49� 108 ton/yr [73,74] 3.12� 1018 4.43� 104 [47] 1.38� 1023b
Construction sectors
(NAICS 230110-230250)
35.65� 108 ton/yr [73,74] 3.22� 1018 4.43� 104 [47] 1.43� 1023
aSunlight for photosynthesis: (2.26� 1022J/yr 1993 flux)� (1.91� 106 farms in 1997)� (487acres average size of farm in 1997)/(1.93� 106 farms in
1993)/(491acres average size of farm in 1993) ¼ 2.23� 1022J/yr 1997 flux.b(34.49� 108 ton/yr topsoil loss)� (4% organics in soil)� (5.4 kcal/g energy content of organic soil)� (4186 J/kcal)� (4.43� 104
sej/J) ¼ 1.38� 1023 sej/yr; transformity adjusted to 1996 base of 9.44� 1024 sej/yr.
N.U. Ukidwe, B.R. Bakshi / Energy 32 (2007) 1560–15921572
(NAICS 212310), coal mining (NAICS 212100), sand,gravel, clay and refractory mining (NAICS 212320) andoil and gas extraction (NAICS 211000) have prominentpeaks on account of direct inputs from lithosphere. Sectorsof power generation and supply (NAICS 221100), petro-leum refineries (NAICS 324110), iron and steel mills(NAICS 332111) and automobile and light truck manu-facturing (NAICS 336110) also have prominent peaks onaccount of indirect consumption of lithospheric resources.
Unlike mining sectors that extract resources from litho-sphere, the agricultural sectors (NAICS 1111A0-1119B0)add to lithosphere on account of return of detrital matter toagricultural soil. Consequently, these sectors have negative
direct ECEC requirements from lithosphere. This is shownwith the aid of the embedded graph in Fig. 5. Theagricultural sectors, like other sectors in the economy, stillhave positive indirect ECEC requirements on account ofconsumption of fuels and electricity. Furthermore, the

ARTICLE IN PRESS
-1.0E+19
0.0E+00
1.0E+19
2.0E+19
3.0E+19
4.0E+19
5.0E+19
6.0E+19
7.0E+19
1 36 71 106 141 176 211 246 281 316 351 386 421 456
Industry Sectors
J/y
rCoal Mining(NAICS 212100)
Power Generation&Supply (NAICS 221100)
Petroleum Refineries(NAICS 324110)
Fig. 6. ICEC Contribution from Lithosphere to US economic sectors; y-axis is annual flows of ICEC in J/yr, and x-axis is sector serial number (black part
of each bar represents direct inputs and white part represents indirect inputs).
N.U. Ukidwe, B.R. Bakshi / Energy 32 (2007) 1560–1592 1573
indirect requirements exceed the direct requirements mak-ing the agricultural sectors net consumers of lithosphericresources. Sector of greenhouse and nursery production(NAICS 111400) is found to be the only exception wheredirect requirements exceed indirect requirements, making ita net donor to the lithosphere.
Fig. 6 shows ICEC requirements of industry sectors fromlithosphere. Coal mining (NAICS 212100), power genera-tion and supply (NAICS 221100), petroleum refineries(NAICS 324191) and oil and gas extraction (NAICS211000) have prominent peaks on account of direct inputsfrom lithosphere. However, comparison with Fig. 5 showsthat coal mining and power generation and supply sectorshave replaced petroleum refineries and oil and gasextraction as the two most significant sectors in Fig. 6.This is also supported by the data presented in Table 5wherein the total ICEC and ECEC inputs to the sectors ofoil and gas extraction are 3.05� 1019 J/yr and 1.52�1024 sej/yr respectively and those for coal mining sectorare 5.73� 1019 J/yr and 9.88� 1023 sej/yr respectively. Thisdifference can be attributed to different transformities ofcoal (34,482 sej/J), natural gas (48,000 sej/J) and petroleum(53,000 sej/J) [39]. As discussed in Section 2, ICEC analysisassumes a uniform transformity of 1 J/J for all the three,and in the process suppresses the ecological consumptionof exergy in natural gas and petroleum.
4.1.2. Biosphere
Fig. 7(a) shows ECEC requirements from the biosphere.Sectors of logging (NAICS 113300) and cattle ranchingand agricultural (NAICS 112100) get direct inputs from thebiosphere on account of timber harvesting and pasturegrazing respectively. Sectors of sawmills (NAICS 321113),paper and paperboard mills (NAICS 3221A0), veneer andplywood manufacturing (NAICS 32121A) and new resi-dential 1-unit structures (non-farm) (NAICS 230110) alsohave prominent peaks on account of indirect consumption.Sectors of all other petroleum and coal products manu-
facturing (NAICS 324199), military armored vehicles andtank part manufacturing (NAICS 336992) and ground ortreated minerals and earths manufacturing (NAICS327992) have the lowest ECEC inputs from the biosphere.
4.1.3. Atmosphere
Fig. 7(b) shows ECEC from the atmosphere. Theagricultural sectors (NAICS 1111A0-1119B0) get directinputs from atmosphere on account of CO2 consumptionduring 24-h photosynthesis. As a result, Fig. 7(b) showsprominent peaks for the agricultural sectors as well forthose sectors that directly rely on agricultural sectors fortheir operations. This includes food and fabric manufac-turing sectors (NAICS 311111-313240) and the sector offood services and drinking places (NAICS 722000). Sectorsof industrial pattern manufacturing (NAICS 332997),military armored vehicles and tank part manufacturing(NAICS 336992) and saw blade and handsaw manufactur-ing (NAICS 332213) have the lowest requirements fromatmosphere. As mentioned in Table 5, only CO2 consumedduring 24-h photosynthesis has been considered in thisanalysis. Oxygen and nitrogen have not been consideredbecause their transformity values are unresolved in emergyanalysis [7]. Calculation of transformities of O2 and N2 is anon-trivial task as it entails a thorough understanding ofthe interwoven carbon, nitrogen, and sulfur cycles.
4.1.4. Hydrosphere
Fig. 7(c) shows ECEC requirements from the hydro-sphere. Only the sector of water, sewage and other systems(NAICS 221300) that uptakes water from rivers andlakes is assumed to have a direct input from hydrosphere.Other sectors with prominent peaks in Fig. 7(c) arereal estate (NAICS 531000), retail trade (NAICS 4A0000)and wholesale trade (NAICS 420000). Sectors of softwarereproducing (NAICS 334611), industrial pattern manufac-turing (NAICS 332997) and secondary processingof copper (NAICS 331423) have the lowest ECEC

ARTICLE IN PRESS
0.0E+00
5.0E+22
1.0E+23
1.5E+23
2.0E+23
2.5E+23
3.0E+23
3.5E+23
4.0E+23
1 36 71 106 141 176 211 246 281 316 351 386 421 456
Industry Sectors
sej/yr
Paper & PaperboardMills (NAICS 3221A0)
Logging(NAICS 113300)
Sawmills(NAICS 321113)
BIOSPHERE
0
2E+21
4E+21
6E+21
8E+21
1E+22
1.2E+22
1.4E+22
1.6E+22
1.8E+22
1 36 71 106 141 1 211 246 281 316 351 386 421 456
Industry Sectors
sej/yr
Food Services andDrinking Places(NAICS 722000)
Cattle Ranching andFarming (NAICS 112100)
Grain Farming(NAICS 1111B0)
Food ProductsManufacturing
ATMOSPHERE
0
2E+22
4E+22
6E+22
8E+22
1E+23
1.2E+23
1 36 71 106 141 176 211 246 281 316 351 386 421 456
Industry Sectors
sej/yr
Real Estate(NAICS 531000)
Water Sewage andOther Systems(NAICS 221300)
HYDROSPHERE
a
b
c
Fig. 7. Contribution of ecological products US economic sectors from (a) biosphere; (b) atmosphere; (c) hydrosphere; y-axis is annual flows of ECEC in
solar equivalent joules (sej/yr), and x-axis is sector serial number (black part of each bar represents direct inputs and white part represents indirect inputs).
N.U. Ukidwe, B.R. Bakshi / Energy 32 (2007) 1560–15921574

ARTICLE IN PRESSN.U. Ukidwe, B.R. Bakshi / Energy 32 (2007) 1560–1592 1575
requirement from hydrosphere. Other functions of hydro-sphere such as climate regulation and cleansing of air havenot been considered in this analysis.
4.2. Ecosystem services
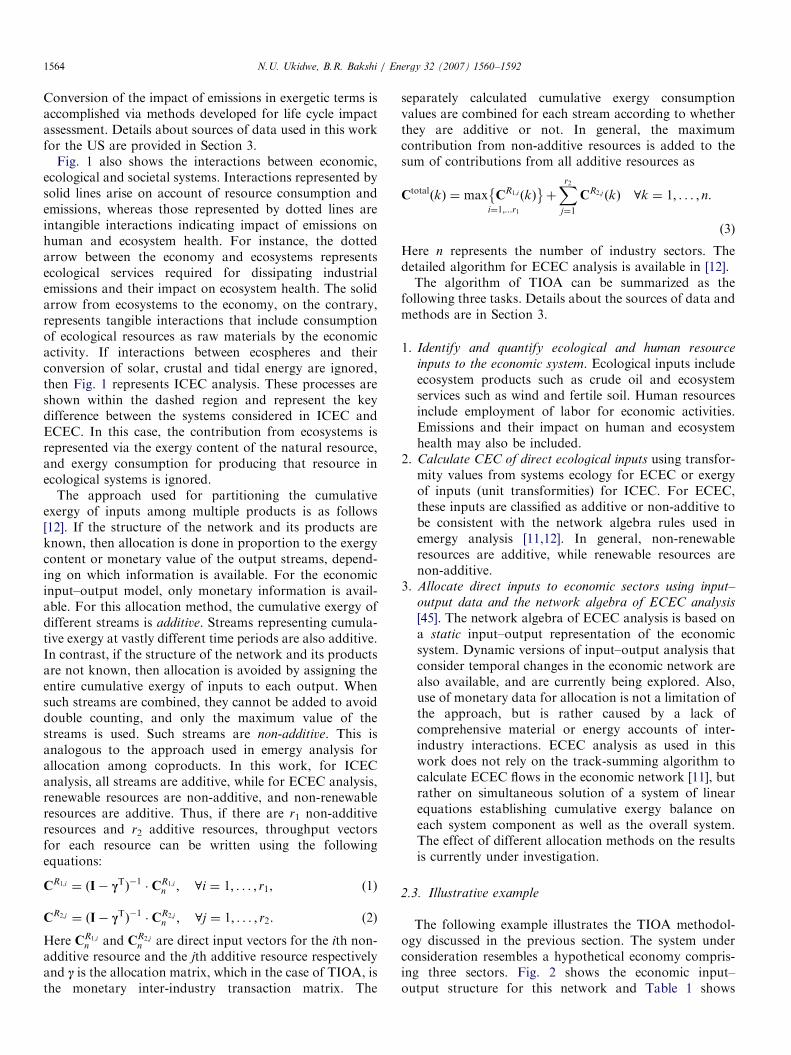
Fig. 8 shows the direct ECEC inputs of ecosystemservices listed in Table 6.
4.2.1. Sunlight
Fig. 8(a) shows the contribution of sunlight. Theagricultural sectors (NAICS 1111A0-1119B0) and thesector of forest nurseries, forest products and timber tracts(NAICS 113A00) are the direct recipients of sunlight.Sectors of sawmills (NAICS 321113) and food services anddrinking places (NAICS 722000) have prominent peaks inFig. 8(a) on account of indirect consumption. In this paper,solar inputs to the group of agricultural sectors and to thesector of forest nurseries, forest products and timber tractsare determined by multiplying average solar flux per unitarea in the continental US by the total land area of the two[56,57]. To allocate solar inputs within the group ofagricultural sectors, economic data were used. If dataabout land areas in individual agricultural sectors wereavailable, it could have been used for allocation as well.Furthermore, the use of transformity values in this analysisensures consideration of indirect routes of solar inputs toindustry sectors. These indirect routes include bio-geo-chemical cycles such as the hydrologic cycle and atmo-spheric circulation that are driven by solar insolation. Inthat regard, the analysis presented in this paper improvesupon Costanza [58] who considered only direct solar inputsto the US economy to calculate energy intensities ofindustry sectors. In this paper, exergy of sunlight isassumed to be equal to its energy. Other approaches thatassume solar radiation to have a composition similar tothat of a black body are also available [40]. Suchapproaches require detailed knowledge about ambienttemperature, level of earth’s surface, sun’s position andthe composition of atmosphere but are unlikely to changethe results presented in this paper significantly.
4.2.2. Fertile soil
Fig. 8(b) shows ECEC content of topsoil lost due toerosion. The agricultural sectors (NAICS 1111A0-1119B0)and the construction sectors (NAICS 230110-230250) aredirectly responsible for the loss of top organic soil. Sectorsof animal, except poultry, slaughtering (NAICS 311611)and food services and drinking places (NAICS 722000) alsohave prominent peaks on account of indirect effects.Contribution of soil erosion is significantly larger thanthat of sunlight because top organic soil is a moreconcentrated form of resource than sunlight. Sectors withthe lowest contribution from fertile soil are industrialpattern manufacturing (NAICS 332997), military armoredvehicles and tank parts manufacturing (NAICS 336992)and saw blade and handsaw manufacturing (NAICS
332213). In this analysis fertile soil is assumed to be arenewable, and hence, non-additive resource. The assump-tion is based on the fact that the carbonaceous content oftop organic soil, as used in this analysis, is regeneratedfrom the dead biomass in a renewable fashion.
4.2.3. Hydropotential
Fig. 8(c) shows the contribution of hydropotential toindustry sectors. Hydropotential refers to the potentialenergy in water streams that is converted to kinetic energyand then to electrical energy in hydroelectric power plants.Naturally, the sector of power generation and supply(NAICS 221100) is the only sector with direct input.Sectors of real estate (NAICS 531000), retail trade (NAICS4A0000) and wholesale trade (NAICS 420000) also haveprominent peaks on account of high electricity consump-tion that can be explained considering their high economicthroughputs. These results also match those obtained forthe 91-sector 1992 US economic system [7]. Sectors ofsoftware reproducing (NAICS 334611), industrial patternmanufacturing (NAICS 332997) and lessors of nonfinan-cial intangible assets (NAICS 533000) have the lowestcontribution from hydropotential. Contributions of windenergy and geothermal energy are also calculated but notshown. Their graphs can be obtained by multiply the y-axisof Fig. 8(c) by 4.99� 10�4 and 9� 10�3, respectively.
4.3. Human resources
Fig. 9 shows ECEC requirements of industry sectors fromhuman resources. Unlike other resources, human resourcesare directly consumed by all industry sectors throughemployment of labor. Service sectors, in particular, havehigher direct inputs than the rest of the economy. Sectors ofother state and local government enterprises (NAICSS00203), retail trade (NAICS 4A0000), wholesale trade(NAICS 420000) and home health care services (NAICS621600) have the highest consumption of human resources.These results also conform to those obtained for 91-sector1992 US economy. Other non-service sectors with prominentpeaks include automobile and light truck manufacturing(NAICS 336110), motor vehicle parts manufacturing(NAICS 336300), new residential 1-unit structures, non-farm (NAICS 230110) and commercial and institutionalbuildings (NAICS 230220). In this analysis, contribution ofhuman resources is determined from economic data thatincludes the number of people employed and their averageannual payrolls, as discussed in Section 3.4.A similar approach based on ICEC analysis can be used
to evaluate industry-specific exergetic intensities of humanlabor in Sciubba’s Extended Exergy Accounting (EEA)[10]. Sciubba defines exergetic intensity of human laboras total exergetic resources into a portion of the societydivided by the number of working hours sustained byit. This ratio can be calculated for the aggregate USeconomy by dividing the ECEC of unskilled labor,9.35� 1013 sej/workday [11], by the average ECEC/ICEC
ARTICLE IN PRESS
0
2E+21
4E+21
6E+21
8E+21
1E+22
1.2E+22
1.4E+22
1 36 71 106 141 176 211 246 281 316 351 386 421 456
Industry Sectors
sej/yr
Food Services andDrinking Places(NAICS 722000)
Forest nurseries, forest products& timber tracts (NAICS 113A00)
Sawmills (NAICS 321113)
SUNLIGHT
0.0E+00
5.0E+21
1.0E+22
1.5E+22
2.0E+22
2.5E+22
3.0E+22
3.5E+22
4.0E+22
4.5E+22
5.0E+22
1 36 71 106 141 176 211 246 281 316 351 386 421 456
Industry Sectors
sej/yr
Food Services andDrinking Placess(NAICS 722000)
Commercial & InstitutionalBuildings (NAICS 230220)
Animal, except poultry,sluagthering(NAICS 311611)
FERTILE SOIL
0.0E+00
5.0E+21
1.0E+22
1.5E+22
2.0E+22
2.5E+22
3.0E+22
3.5E+22
4.0E+22
1 36 71 106 141 176 211 246 281 316 351 386 421 456
Industry Sectors
sej/yr
Real Estate(NAICS 531000)
Power Generation & Supply(NAICS 221100)
Retail Trade(NAICS 4A0000)
HYDROPOTENTIAL
a
b
c
Fig. 8. Contribution of direct ecosystem services. (a) sunlight; (b) fertile soil; (c) hydropotential y-axis is annual flows of ECEC in solar equivalent joules
(sej/yr), and x-axis is sector serial number (black part of each bar represents direct inputs and white part represents indirect inputs).
N.U. Ukidwe, B.R. Bakshi / Energy 32 (2007) 1560–15921576

ARTICLE IN PRESS
0.0E+00
2.0E+23
4.0E+23
6.0E+23
8.0E+23
1.0E+24
1.2E+24
1.4E+24
1.6E+24
1.8E+24
2.0E+24
1 36 71 106 141 176 211 246 281 316 351 386 421 456
Industry Sectors
sej/yr
0.0E+00
5.0E+09
1.0E+10
1.5E+10
2.0E+10
2.5E+10
wo
rkd
ays/y
r
Wholesale Trade(NAICS 420000)
Retail Trade(NAICS 4A0000)
Other State & Local Government Enterprises(NAICS S00203)
New Residential 1-unitstructures non-farm(NAICS 230110) Automobile & Light
Truck Manufacturing(NAICS 336110)
HUMAN RESOURCES
Fig. 9. ECEC requirements from human resources; y-axis are annual ECEC flows in sej/yr and corresponding flows in workdays/yr; x-axis is sector serial
number (black part of each bar represents direct inputs and white part represents indirect inputs).
N.U. Ukidwe, B.R. Bakshi / Energy 32 (2007) 1560–1592 1577
ratio for the 1997 US economy, 2873 sej/J. The latter ratiois discussed further in Section 5.3. This gives a value of3.25� 1010 J/workday that can be used in EEA. In additionindustry-specific values can also be calculated using ECECrequirements of industry sectors from human resourcesfrom Fig. 9, industry-specific ECEC/ICEC ratios fromFig. 14(c) and the number of people employed in eachsector [50].
4.4. Human impact of bulk pollutants
Fig. 10 shows the human health impact of the four bulkpollutants considered in this paper, namely, SO2, NO2,PM10 and CO2. This figure shows human health impact interms of DALY/yr based on a hierarchist perspective aswell as corresponding ECEC values. To convert humanhealth impact from DALY/yr to ECEC/yr, the former ismultiplied by a factor of 3.42� 1016 sej/yr [7,39]. Similarresults can be obtained based on ICEC analysis using theexergetic intensity of human labor from Section 4.3. In suchcase, to convert human health impact from DALY/yr toICEC/yr, the former needs to be multiplied by a factor of1.19� 1013 J/yr. The plots based on ICEC would bequalitatively similar to those shown in the sequel for ECEC.
4.4.1. Sulfur dioxide
Fig. 10(a) shows the impact associated with SO2. Powerplants are the major emitters of SO2. Consequently, thesector of power generation and supply (NAICS 221100)has the most significant peak in Fig. 10(a). Other sectorswith prominent peaks include petroleum refineries (NAICS324110), real estate (NAICS 531000) and retail trade(NAICS 4A0000). Sector of petroleum refineries is one ofthe major suppliers to the sector of power generation andsupply, whereas sectors of real estate and retail trade aremajor consumers of electricity due to their large economicthroughputs.
4.4.2. Nitrogen oxides
Fig. 10(b) shows impact associated with NO2 emissions.Like SO2, power plants are also the major emitters of NO2.Consequently, the sector of power generation and supply(NAICS 221100) has the most significant peak inFig. 10(b). Other major emitters of NO2 include sectorsof natural gas distribution (NAICS 221200) and trucktransportation (NAICS 484000). Sectors of petroleumrefineries (NAICS 324110), retail trade (NAICS 4A0000),wholesale trade (NAICS 420000), food services anddrinking places (NAICS 722000) and oil and gas extraction(NAICS 211000) also have prominent peaks on account ofindirect effects. Some of the agricultural and husbandrysectors, namely sectors of grain agricultural (NAICS1111B0) and cattle ranching and agricultural (NAICS112100), also have noticeable peaks due to high usageof nitrogenous fertilizers whose production is a sourceof NO2.
4.4.3. Carbon dioxide
Fig. 10(c) shows impact associated with CO2 emission.CO2 is emitted in combustion processes such as furnacesand internal combustion engines, and affects humanhealth through climate change and global warming. Sectorsof power generation and supply (NAICS 221100) and oiland gas extraction (NAICS 211000) have the highestCO2 emissions amongst all sectors. Other sectors withprominent peaks include natural gas distribution (NAICS221200), petroleum refineries (NAICS 324110) and retailtrade (NAICS 4A0000). These sectors are either directlyinvolved in extraction and consumption of fossil fuels orare major consumers of electricity. Impact of CO2
emissions, as reported in eco-indicator 99, is thepotential impact in the future [52]. Among the bulkpollutants, impact associated with SO2 and CO2 istwo orders of magnitude higher than that for NO2 andPM10.

ARTICLE IN PRESS
0.0E+00
1.0E+22
2.0E+22
3.0E+22
4.0E+22
5.0E+22
6.0E+22
1 36 71 106 141 176 211 246 281 316 351 386 421 456
Industry Sectors
sej/yr
0.0E+00
2.0E+05
4.0E+05
6.0E+05
8.0E+05
1.0E+06
1.2E+06
1.4E+06
1.6E+06
DA
LY
s/y
r
Real Estate(NAICS 4A0000)
Petroleum Refineries(NAICS 324110)
Power Generation andSupply (NAICS 221100)
SO2
0.0E+00
2.0E+19
4.0E+19
6.0E+19
8.0E+19
1.0E+20
1.2E+20
1 36 71 106 141 176 211 246 281 316 351 386 421 456
Industry Sectors
sej/yr
0.0E+00
5.0E+02
1.0E+03
1.5E+03
2.0E+03
2.5E+03
3.0E+03
3.5E+03
DA
LY
s/y
r
Petroleum Refineries(NAICS 324110)
Power Generation andSupply (NAICS 221100)
TruckTransportation
(NAICS 484000)
NO2
0.0E+00
5.0E+21
1.0E+22
1.5E+22
2.0E+22
2.5E+22
3.0E+22
3.5E+22
4.0E+22
4.5E+22
1 36 71 106 141 176 211 246 281 316 351 386 421 456
Industry Sectors
sej/yr
0.0E+00
2.0E+05
4.0E+05
6.0E+05
8.0E+05
1.0E+06
1.2E+06
1.4E+06
DA
LY
s/y
rRetail Trade
(NAICS 4A0000)
Power Generation andSupply (NAICS 221100)
CO2
0.0E+00
5.0E+18
1.0E+19
1.5E+19
2.0E+19
2.5E+19
3.0E+19
3.5E+19
4.0E+19
4.5E+19
1 36 71 106 141 176 211 246 281 316 351 386 421 456
Industry Sectors
sej/yr
0.0E+00
2.0E+02
4.0E+02
6.0E+02
8.0E+02
1.0E+03
1.2E+03
1.4E+03
DA
LY
s/y
r
Real Estate(NAICS 531000)
Iron & Steel Mills(NAICS 332111)
Maintenance & Repair ofNon-Residential Buildings(NAICS 230320)
PM10
Petroleum Refineries(NAICS 324110)
a
b
c
d
Fig. 10. Human Health Impact of Bulk-Pollutants (a) SO2; (b) NO2; (c) CO2; (d) PM10; y-axis are annual ECEC flows in sej/yr and corresponding impact
in DALYs/yr; x-axis is sector serial number (black part of each bar represents direct inputs and white part represents indirect inputs).
N.U. Ukidwe, B.R. Bakshi / Energy 32 (2007) 1560–15921578

ARTICLE IN PRESSN.U. Ukidwe, B.R. Bakshi / Energy 32 (2007) 1560–1592 1579
4.4.4. Particulate matter
Fig. 10(d) shows impact associated with emission ofPM10. PM10 is primarily responsible for respiratorydisorders. Particulate matter is primarily emitted duringconstruction activities. Sectors of maintenance and repairof nonresidential buildings (NAICS 230320), commercialand institutional buildings (NAICS 230220) and newresidential 1-unit structures, non-farm (NAICS 230110)have prominent peaks in Fig. 10(d) on account of directemission of particulate matter. Other sectors with promi-nent peaks include real estate (NAICS 531000) and ironand steel mills (NAICS 332111).
4.5. Human impact of non-bulk pollutants
Fig. 11 shows the impact associated with selected non-bulk pollutants. Their immediate destinations and parentimpact category are listed in Table 7.
4.5.1. Ammonia
Fig. 11(a) shows impact associated with emission ofammonia. Ammonia is primarily emitted by the sectors ofpaper and paperboard mills (NAICS 3221A0) petroleumrefineries (NAICS 324110) and iron and steel mills (NAICS331111). As a result, these sectors also have the tallestpeaks in Fig. 11(a). Sectors of motor vehicles partmanufacturing (NAICS 336300) and automobile and lighttruck manufacturing (NAICS 336110) also have significantpeaks on account of indirect effects.
4.5.2. Toluene
Fig. 11(b) shows impact associated with emission oftoluene. Sectors of software publishers (NAICS 511200),petroleum refineries (NAICS 324110) and plastic plumbingfixtures and all other plastics products (NAICS 32619A)are the major emitters of toluene. Other sectors withprominent peaks include automobile and light truckmanufacturing (NAICS 336110), newspaper publishers(NAICS 511110) and periodical publishers (NAICS511120).
4.5.3. Methanol
Fig. 11(c) shows impact associated with emission ofmethanol. Sectors of paper and paperboard mills (NAICS3221A0), coated and laminated paper and packagingmaterials (NAICS 32222A) and sanitary paper productmanufacturing (NAICS 322291) are some of the majoremitters of methanol. Other sectors with prominent peaksinclude other paperboard container manufacturing(NAICS 322210), commercial printing (NAICS 32311A)and retail trade (NAICS 4A0000).
4.5.4. 1,1,1-trichloroethane
Fig. 11(d) shows impact associated with 1,1,1-Trichlor-oethane. 1,1,1-TCE is primarily responsible for thedepletion of ozone layer. Sectors of plastic plumbingfixtures and all other plastic products (NAICS 32619A),
automobile and light truck manufacturing (NAICS336110) and plastics packaging materials, film and sheet(NAICS 326110) are some of the major emitters of 1,1,1-TCE. Sectors of commercial and institutional buildings(NAICS 230220), new residential 1-unit structures, non-farm (NAICS 230110), glass and glass products, exceptglass containers (NAICS 32721A) and motor vehicle partmanufacturing (NAICS 336300) also have substantialimpact due to indirect effects.
4.5.5. Styrene
Figs. 11(e–g) show impact associated with emission ofstyrene. Styrene is a carcinogenic substance that is releasedto soil, water and air. Depending on the immediatedestination of styrene emission human health impact couldbe very different. This is demonstrated by Figs. 11(e–g).Impact of styrene emission to air is two orders ofmagnitude higher than that to water or soil. Sectors ofplastic plumbing fixtures and all other plastic products(NAICS 32619A) and plastic packaging materials, film andsheet (NAICS 326110) are the major emitters of styrene toair. Sectors of automobile and light truck manufacturing(NAICS 336110) and motor vehicle parts manufacturing(NAICS 336300) also have significant peaks in Fig. 11(e).Compared to styrene emissions to air, styrene emissions towater is fairly small. Sectors of plastic plumbing fixturesand all other plastic products (NAICS 32619A) and plasticmaterial and resin manufacturing (NAICS 325211) havethe highest emission of styrene to water. Other sectors withsignificant styrene emissions to water include petroleumrefineries (NAICS 324110) and paperboard mills. Sectorswith highest styrene emissions to soil include other basicorganic chemical manufacturing (NAICS 325190) andautomobile and light truck manufacturing (NAICS336110).
5. Aggregate metrics
One of the fortes of exergy analysis is its ability torepresent and combine a variety of streams in a consistentway. This feature permits TIOA to provide aggregatemetrics by combining separate results for each input andoutput category presented in Sections 4.1–4.5. Suchaggregation is facilitated by the fact that all resultsobtained for individual resources in Section 4.1–4.5 areexpressed in a single consistent thermodynamic unit, whileaccounting for differences in their thermodynamic quality.In this regard, TIOA can complement existing techniquessuch as EIOLCA [59,60] that report consumption andemission data in disparate units. It is then left to the user todistill these data into a smaller number of indices that aresufficiently representative and easy to use. In the absenceof a theoretically rigorous technique for combiningdisparate data, arbitrary weighting is often employed.TIOA is useful in this context as it presents the type ofdetails of other methods as well as a systematic way ofaggregating resource consumption and emission data.

ARTICLE IN PRESS
Fig. 11. Impact of non-bulk pollutants. (a) ammonia; (b) toluene; (c) methanol; (d) 1,1,1-trichloroethane (e) styrene emission to air; (f) styrene emission to
water; (g) styrene emission to soil ; y-axis are annual ECEC flows in sej/yr and corresponding impact in DALYs/yr; x-axis is sector serial number (black
part of each bar represents direct inputs and white part represents indirect inputs).
N.U. Ukidwe, B.R. Bakshi / Energy 32 (2007) 1560–15921580

ARTICLE IN PRESS
1 36 71 106 141 176 211 246 281 316 351 386 421 456
Industry Sectors
sej/yr
0.0E+00
1.0E-02
2.0E-02
3.0E-02
4.0E-02
5.0E-02
6.0E-02
7.0E-02
8.0E-02
9.0E-02
1.0E-01
DA
LY
s/y
r
Automobile & LightTruck Manufacturing(NAICS 511200)
Plastic plumbingfixtures & all otherplastics products(NAICS 32619A)
STYRENE (AIR)
1 36 71 106 141 176 211 246 281 316 351 386 421 456
Industry Sectors
sej/yr
0.0E+00
2.0E-05
4.0E-05
6.0E-05
8.0E-05
1.0E-04
1.2E-04
1.4E-04
1.6E-04
1.8E-04
DA
LY
s/y
r
Paper andPaperboard Mills(NAICS 511200)
Plastic plumbingfixtures & all otherplastics products(NAICS 32619A)
STYRENE (WATER)
0.0E+00
5.0E+14
1.0E+15
1.5E+15
2.0E+15
2.5E+15
3.0E+15
3.5E+15
0.0E+00
1.0E+12
2.0E+12
3.0E+12
4.0E+12
5.0E+12
6.0E+12
7.0E+12
0.0E+00
5.0E+12
1.0E+13
1.5E+13
2.0E+13
2.5E+13
3.0E+13
3.5E+13
4.0E+13
1 36 71 106 141 176 211 246 281 316 351 386 421 456
Industry Sectors
sej/yr
0.0E+00
2.0E-04
4.0E-04
6.0E-04
8.0E-04
1.0E-03
1.2E-03
DA
LY
s/y
r
Other BasicOrganic Chemical
Manufacturing(NAICS 325190)
Automobile & LightTruck Manufacturing
(NAICS 336110)
STYRENE (SOIL)
e
f
g
Fig. 11. (Continued)
N.U. Ukidwe, B.R. Bakshi / Energy 32 (2007) 1560–1592 1581
Detailed information is also available and hierarchical metricswith different levels of aggregation may be easily developed[61]. For emerging technologies or at early stages of decisionmaking, information about emissions and their impact may
not even be available. Here, LCA based on the inputs toTIOA may provide a reasonable proxy for full LCA studies.For combining results obtained in Figs. 5 and 7–11, the
algorithm of ICEC and ECEC analysis, explained in

ARTICLE IN PRESSN.U. Ukidwe, B.R. Bakshi / Energy 32 (2007) 1560–15921582
Section 2 has been used. This algorithm avoids across-the-board addition which could lead to double counting,particularly in ECEC by the approach described in Section2.2. To calculate aggregate metrics in this paper, inputsfrom atmosphere, hydrosphere and ecosystem services areconsidered to be non-additive whereas the rest areconsidered to be additive. This is so because in case ofnon-renewable resources such as minerals and fossil fuels,allocation is possible and is typically done in proportion totheir mass fraction in the earth’s sedimentary cycle. In caseof renewable resources, however, such allocation is moredifficult as they are by-products of the same energy input tothe earth system. Since the choice of allocation rules isusually subjective, the sensitivity of the results to differentallocation rules should be evaluated. It may also bepossible to select system boundaries that avoid allocationaltogether [62]. The application of such techniques to theanalysis presented in this paper is a part of the on-goingwork. As mentioned in Section 3.4, labor is consideredto be an exogenous input in TIOA, which is similar toEEA [10]. However, since the inputs to human consump-tion are outputs of the economy, this may not be a fairassumption, and it may be better to treat labor as a non-additive input [31].
5.1. Total ECEC and ICEC
Total ECEC of each industry sector is shown inFig. 12(a–d), which is a semi-log plot that shows relativecontributions of renewable resources, non-renewable re-source, human resources and human health impact ofemissions to the total ECEC of each sector. The sector ofstone mining and quarrying (NAICS 212310) is found tohave the highest ECEC. Other sectors with high ECECvalues are coal mining (NAICS 212100), power generationand supply (NAICS 221100) and sand, gravel, clay andrefractory mining (NAICS 212320). Sectors with thesmallest ECEC are industrial pattern manufacturing(NAICS 332997), malt manufacturing (NAICS 311213)and tortilla manufacturing (NAICS 311830). Sectors withthe smallest ECEC requirements are also among the sectorswith the smallest economic activity.
Total ECEC requirement captures the cumulativeexergy consumption in all the links of the produc-tion network, and in principle, is equivalent to the conceptof ecological cost. Unlike ecological cost that focusesonly on industrial stages of the production network andnon-renewable resources, total ECEC considers renewableresources along with non-renewable resources, andexergy consumed in the ecological links along with theindustrial links of a production network. Fig. 12(a)can be useful in determining industry-specific pro-ecologi-cal tax as proposed by Szargut and others [63]. ECECby itself is of limited use for decision making. A norma-lized metric that compares ecosystem contribution toeconomic activity is more insightful, and is discussed inSection 5.2.
Fig. 13(a–c) shows ICEC inputs to individual industrysectors from renewable and non-renewable resources andtheir total. Agriculture and forestry sectors (NAICS1111A0-113A00) and sectors relying on them for rawmaterials, such as the sector of sawmills (NAICS 321113),have some of the highest peaks in Fig. 13(c). High ICECrequirement of agricultural and forestry sectors can beexplained on account of inputs of sunlight. Furthermorethe sectors involved in extraction and processing of non-renewable resources such as coal mining, oil and gasextraction and petroleum refining do not appear promi-nently in Fig. 13(c). ICEC analysis considers a transformityof 1 sej/J for all the resources and ignores the substantialamount of exergy that needs to be expended by ecologicalprocesses to make fossil fuels and other resources availableto the economic system. Consequently, ICEC analysistends to downplay the contribution from non-renewableresources. The negative bars in Fig. 13(b) are due tothe return of detrital matter to the lithosphere inagricultural sectors (NAICS 1111A0-1119B0), as explainedin Section 4.1. Other sectors that rely on agricultural inputs(NAICS 311111-311310) also have negative ICEC require-ments due to indirect effects.
5.2. Ratios of ECEC/money and ICEC/money
Fig. 14(a) shows the ECEC/money ratio of each of the488 industry sectors on a semi-log plot. It is calculated bydividing total ECEC throughput of each sector shown inFig. 12 by its total economic throughput. The ECEC/money ratio is analogous to the emergy/money ratio usedin emergy analysis, and similar ratios suggested in exergyanalysis [35,63]. However, unlike the single ratio in emergyor exergy analysis for the entire economy, Fig. 14 providesa separate ratio for each sector. Variation in Fig. 14(a)captures the difference between different industry sectors.Fig. 14(a) shows that ECEC/money ratios can vary over 3orders of magnitude with the highest ratio being 2287 timesthe lowest ratio. Such difference is completely ignored inemergy analysis and thermoeconomics that use a singleeconomy-wide average.The ECEC/money ratio is not meant to support or
debunk any theory of value, but may indicate themagnitude of discrepancy between thermodynamic workneeded to produce a product or service and people’swillingness to pay for it. ECEC/money ratios can be usedto quantify ecological cumulative exergy contained inpurchased inputs of industrial processes. Such industry-specific ratios provide a more accurate alternative to thesingle emergy/$ ratio used in emergy analysis, and similarratios used in thermoeconomics. Normalization withrespect to money is possible because monetary outputs ofindustry sectors are well known. However, normalizationwith respect to exergy to determine thermodynamicefficiency (CDP) or transformity values of industry sectorsis more difficult due to lack of information about exergeticoutputs of industry sectors. The ECEC/money ratio is a

ARTICLE IN PRESS
1.0E+20
1.0E+21
1.0E+22
1.0E+23
1.0E+24
1.0E+25
1 36 71 106 141 176 211 246 281 316 351 386 421 456
Industry Sectors
se
j/y
r
Oil & Gas Extraction
(NAICS 211000) Petroleum Refineries
(NAICS 324110)
1.0E+18
1.0E+19
1.0E+20
1.0E+21
1.0E+22
1.0E+23
1.0E+24
1 36 71 106 141 176 211 246 281 316 351 386 421 456
Industry Sectors
se
j/y
r
Water, sewage & other systems
(NAICS 221300)
Food Services &
Drinking Places
(NAICS 722000)
1.0E+18
1.0E+19
1.0E+20
1.0E+21
1.0E+22
1.0E+23
1 36 71 106 141 176 211 246 281 316 351 386 421 456
Industry Sectors
se
j/y
r
Power Generation &
Supply (NAICS 221100)Petroleum Refineries
(NAICS 324110)
1.0E+21
1.0E+22
1.0E+23
1.0E+24
1.0E+25
1 36 71 106 141 176 211 246 281 316 351 386 421 456
Industry Sectors
se
j/y
r
Wholesale Trade
(NAICS 221100)Petroleum Refineries
(NAICS 324110)
a
b
c
d
Fig. 12. ECEC requirements of industry sectors (a) non-renewable resources; (b) renewable resources; (c) human health impact of emissions; (d) total;
y-axis are annual ECEC flows in sej/yr; x-axis is sector serial number.
N.U. Ukidwe, B.R. Bakshi / Energy 32 (2007) 1560–1592 1583

ARTICLE IN PRESS
1.0E+18
1.0E+19
1.0E+20
1.0E+21
1.0E+22
1.0E+23
1 36 71 106 141 176 211 246 281 316 351 386 421 456
Industry Sectors
J/y
r
Forest Nurseries, Forest Products,
and Timber Tracts (NAICS 113A00)Saw mills
(NAICS 321113) Food Services and drinking
places (NAICS 722000)
1.0E+18
1.0E+19
1.0E+20
1.0E+21
1.0E+22
1.0E+23
1 36 71 106 141 176 211 246 281 316 351 386 421 456
Industry Sectors
J/y
r
Agricultrual and Forestry Sectors (NAICS 1111A0-113A00)
Oil and Gas Extraction and Coal Mining (NAICS 1111A0-113A00)
Sawmills (NAICS 321113)
-1.0E+19
0.0E+00
1.0E+19
2.0E+19
3.0E+19
4.0E+19
5.0E+19
6.0E+19
7.0E+19
1 36 71 106 141 176 211 246 281 316 351 386 421 456
Industry Sectors
J/y
r
Coal Mining
(NAICS 212100)
-2.5E+18
-2.0E+18
-1.5E+18
-1.0E+18
-5.0E+17
0.0E+001 3 5 6 9 10
Grain Farming (NAICS 1111B0)
-6.0E+17
-4.0E+17
-2.0E+17
0.0E+0046 48 50 52 54 56
Soybean Processing(NAICS 1111B0)
a
b
c
2 4 7 8
Fig. 13. ICEC requirements of industry sectors (a) renewable resources; (b) non-renewable resources; (c) total; y-axis are annual ICEC flows in J/yr; x-axis
is sector serial number.
N.U. Ukidwe, B.R. Bakshi / Energy 32 (2007) 1560–15921584
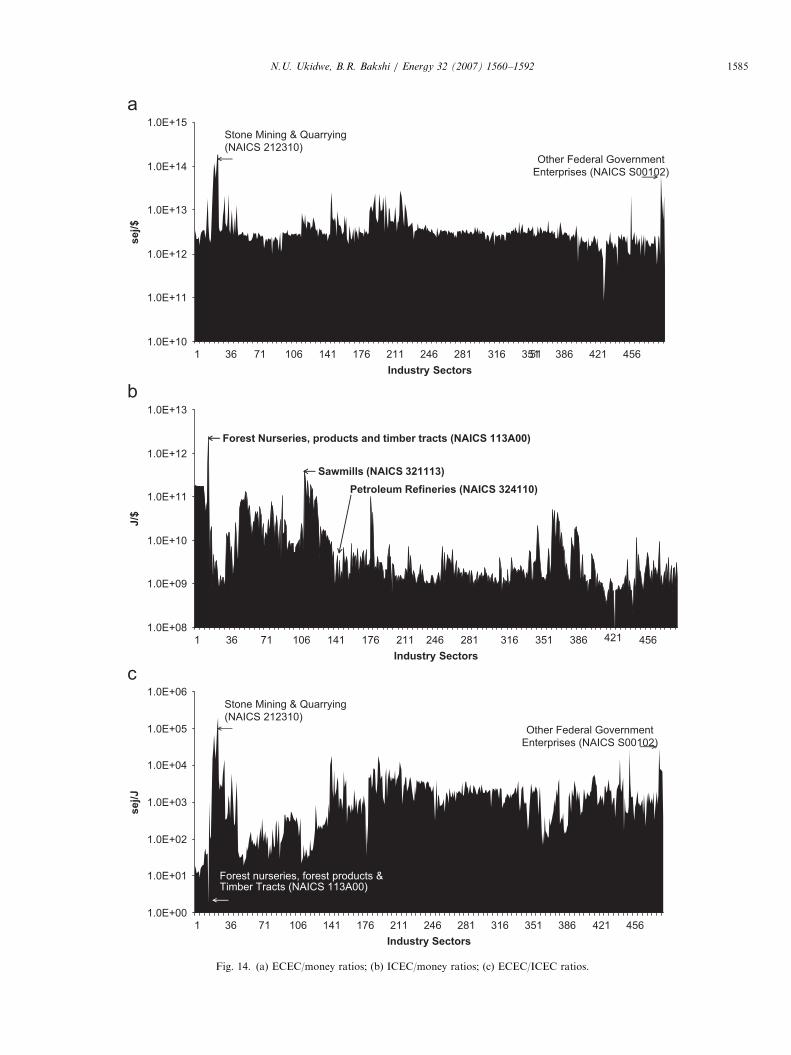
ARTICLE IN PRESS
1.0E+10
1.0E+11
1.0E+12
1.0E+13
1.0E+14
1.0E+15
1 36 71 106 141 176 211 246 281 316 351 386 421 456
Industry Sectors
sej/$
Stone Mining & Quarrying
(NAICS 212310)Other Federal Government
Enterprises (NAICS S00102)
51
1.0E+08
1.0E+09
1.0E+10
1.0E+11
1.0E+12
1.0E+13
1 36 71 106 141 176 211 246 281 316 351 386 421 456
Industry Sectors
J/$
Forest Nurseries, products and timber tracts (NAICS 113A00)
Sawmills (NAICS 321113)
Petroleum Refineries (NAICS 324110)
1.0E+00
1.0E+01
1.0E+02
1.0E+03
1.0E+04
1.0E+05
1.0E+06
1 36 71 106 141 176 211 246 281 316 351 386 421 456
Industry Sectors
sej/J
Stone Mining & Quarrying
(NAICS 212310)
Other Federal Government
Enterprises (NAICS S00102)
Forest nurseries, forest products &Timber Tracts (NAICS 113A00)
a
b
c
Fig. 14. (a) ECEC/money ratios; (b) ICEC/money ratios; (c) ECEC/ICEC ratios.
N.U. Ukidwe, B.R. Bakshi / Energy 32 (2007) 1560–1592 1585

ARTICLE IN PRESSN.U. Ukidwe, B.R. Bakshi / Energy 32 (2007) 1560–15921586
measure of cumulative exergy consumption in the produc-tion chain of an industry sector to generate $1 of economicactivity.
As seen from Fig. 14(a), the mining sectors have thehighest ECEC/money ratios. Sectors of stone mining andquarrying (NAICS 212310), sand, gravel, clay and refrac-tory mining (NAICS 212320) and iron ore mining (NAICS212210) have some of the highest ECEC/money ratios.Sectors with the smallest ECEC/money ratios are servicesectors such as lessors of non-financial intangible assets(NAICS 533000), owner-occupied dwellings (NAICSS00800) and all other miscellaneous professional andtechnical services (NAICS 5419A0). Sectors such asprimary smelting and refining of copper (NAICS 331411)that rely on mining sectors also have high ECEC/moneyratios. In general, more specialized sectors have lowerECEC/money ratios than the basic infrastructure sectors.For instance, the median ECEC/money ratio of finance,insurance, real estate, rental and leasing sectors (NAICS522A00-533000) is approximately 1/10th of that of miningand utilities (NAICS 211000-221300) sectors. Amongstsectors receiving direct inputs from ecosystems, agriculture,forestry, fishing and hunting sectors (NAICS 1111A0-115000) have a median ECEC/money ratio that is 14% ofthat of the mining and utilities (NAICS 211000-221300)sectors. Agriculture, forestry, fishing and hunting sectorsalso depend more on renewable resources than the miningand utilities sectors that are primarily fossil-based.
The variation in ECEC/money ratio indicates thediscord between ecological activity and correspondingeconomic valuation. This may be because market pricesdo not fully reflect the cumulative exergy consumption ofcorresponding sectors and contribution of ecosystems.Since economic value is not inherent in objects but is aproduct of a variety of consumer judgments, the variationin this ratio may also reflect societal preferences withlimited consumer awareness about ecosystem contributiontowards economic activity. Thus, sectors with larger ratiosseem not to appreciate or value ecosystem products andservices as much as those with smaller ratios. This not onlycorroborates the lack of integration of the ‘‘eco-services’’sector with the rest of the economy but also quantifies themagnitude of this discrepancy [36,64].
Furthermore, ECEC/money ratio tends to decreasealong supply chains of industrial processes. Basic infra-structure sectors that lie at the economy-ecosysteminterface and the sectors that rely more heavily on non-renewable resources have higher ECEC/money ratios. Thissuggests that sectors with high ECEC/money ratiosconsume natural capital in a manner that is dispropor-tionate to their contribution to economic capital. Theresultant hierarchical structure of the economy resemblesan ecological food chain wherein basic infrastructureindustries constitute the base and are equivalent tophotosynthetic tissue, whereas value-added service industryconstitutes the top, and is equivalent to carnivores. Theseobservations match other work on the relationship between
environmental impact and economic value along supplychains of industrial processes [65]. These observations alsoprovide a unique insight into sustainability of industrialsupply chains from the standpoints of weak- and strong-sustainability paradigms, and other macro-economic phe-nomena including outsourcing, sustainable internationaltrade and corporate restructuring [38].Fig. 14(b) shows the ICEC/money ratios of individual
industry sectors. Agriculture and forestry sectors (NAICS1111A0-113A00), in general, have high ICEC/moneyratios. Sectors with direct inputs of sunlight such as forestnurseries, forest products, and timber tracts (NAICS113A00), logging (NAICS 113300), and sectors that relyon forest products such as sawmills (NAICS 321113) andveneer and plywood manufacturing (NAICS 32121A) havesome of the highest ICEC/money ratios. These sectors relymainly on renewable resources and are near the peripheryof the economy due to relatively short supply chains. Incontrast, sectors with high ECEC/money ratios rely mainlyon nonrenewable resources, and also have short supplychains. Service industries including employment services(NAICS 561300), insurance (NAICS 524100 and 524200)and monetary authorities (NAICS 52A000) have some ofthe lowest ICEC/money ratios. This observation matcheswith Fig. 14(a) and can be explained based on highereconomic capital generation vis-a-vis natural capitalconsumption of service industries. However, unlike resultsfrom Fig. 14(a), sectors involved in extraction andprocessing of non-renewable resources such as oil and gasextraction (NAICS 211000), ground or treated mineralsand earths manufacturing (NAICS 327992) and natural gasdistribution (NAICS 221200) also have low ICEC/moneyratios. This again can be explained considering theignorance of ecological processes in ICEC analysis andassumption of no exergy consumption in ecosystems.Over the last few decades many researchers have
suggested a relationship between thermodynamic measuresand money [30,31], but none has been found as yet.Recently, it has been conjectured that ‘‘if all the indirectexergy flows are taken into account, the discrepancybetween diamonds and Persian carpets, on one hand, andcoal on the other hand, might not be so great’’ [31]. Thisconjecture implies that cumulative exergy and money maybe strongly correlated. The plots in Figs. 14(a) and (b)indicate that the correlation between ECEC and money ishigher than that between ICEC and money. However, thesmaller variation of the ECEC/money ratio still does notvalidate the conjecture, and sorting the sectors based onthis ratio has some interesting interpretations [38]. Furtheranalysis may lead to greater insight, but is outside the scopeof this paper.The two CEC to money ratios can be particularly
useful in hybrid thermodynamic life cycle analysis ofindustrial systems. A hybrid analysis integrates processmodels or product systems with economy-scale input–out-put models, and in the process, combines accurate, process-specific data with more uncertain economy-scale data [66].

ARTICLE IN PRESSN.U. Ukidwe, B.R. Bakshi / Energy 32 (2007) 1560–1592 1587
Consequently, a hybrid analysis is more powerful as itcombines the two critical attributes of an environmentaldecision tool, specificity and a broad system boundary.ECEC/money ratio can come in handy in this context asthe interactions of a product system with the rest of theeconomy are routinely measured in monetary terms innormal accounting procedures. The use of such ratios for91-sector 1992 US economy to account for ecosystemcontribution to industrial activity and the additionalinsight they can provide in comparison with existingthermoeconomic techniques such as exergy and industrialcumulative exergy consumption analyses has been illu-strated in Ukidwe and Bakshi [7] for two electricitygeneration systems. Other uses of these ratios are availablein Ukidwe [39].
5.3. ECEC/ICEC ratio
ECEC is the cumulative exergy consumption in theindustrial as well as ecological stages of a production chain,whereas ICEC only focuses on the industrial stages.Consequently, ECEC/ICEC ratio indicates the extent towhich ICEC analysis underestimates the contribution ofecological resources. Fig. 14(c) depicts ECEC/ICEC ratiosfor industry sectors from the 1997 benchmark model of theUS economy. As seen from this figure, forest nurseries,forest products and timber tracts (NAICS 113A00) havethe lowest, whereas sand, gravel, clay and refractorymining (NAICS 212320) have the highest ECEC/ICECratio amongst all sectors. In general, agricultural andforestry sectors have lower ECEC/ICEC ratios due to theirreliance on renewable resources such as sunlight, whichhave smaller transformity. Mining and extraction sectors,on the contrary have higher ratios due to their reliance onnon-renewable resources. These results conform to thoseobtained for the 1992 US economy [7]. Furthermore, theaverage ECEC/ICEC ratio for the 1997 US economy is2873 sej/J as against a ratio of 1860 sej/J for the 1992 USeconomy. This plausibly indicates that the 1997 economyhad a higher reliance on non-renewable resources than the1992 US economy. The fact that ECEC is 2 to 4 orders ofmagnitude higher than ICEC and variation in ECEC/ICEC ratios across industry sectors indicates that TIOA issuccessful in capturing quality differences between naturalresources such as their renewable and non-renewablenature whereas methods like ICEC analysis and thermo-economics cannot. Therefore TIOA would be more mean-ingful for generating objectives for ecologically consciousdecision making than the contemporary techniques such asICEC analysis, Extended Exergy Accounting and thermo-economics. Illustrations and case studies to back this claimare the subject of future publications.
5.4. Performance metrics
Based on the aggregate metrics obtained in Fig. 12(a–d),various performance metrics can also be calculated. The
metrics defined and calculated in this paper are meant tomainly illustrate the ability of ICEC and ECEC to combinevarious types of input and output streams. More research isrequired on the characteristics of different metrics and theirappropriateness for environmentally conscious decisionmaking.As described in Section 2.3, the metrics in this section
have been defined along the lines of those used in emergyanalysis [11,46]. However, there are some marked differ-ences due the ability of TIOA to provide more compre-hensive results. Yield ratio is defined as the ratio of totalinputs to purchased inputs or, alternatively, the ratio oftotal ECEC requirements to indirect ECEC requirements.It measures the extent to which a process or product relieson economic inputs vis-a-vis direct environmental inputs.Fig. 15(a) shows the yield ratio for the 488 industry sectors.A peripheral sector that derives a large portion of its ECECrequirements directly from ecosystems or a sector thatrelies more on human resources has a higher yield ratio.This is evident from Fig. 15(a) which shows high peaks fornon-metallic mineral mining sectors (NAICS 212310 and212320) and water sewage and other systems sector(NAICS 221300). Other federal government enterprises(NAICS S00102) and home health care services (NAICS621600) also have prominent peaks due to their large anddirect reliance on human resources. Sectors with lowestyield ratios include veterinary services (NAICS 541940),automotive repair and maintenance, except car washes(NAICS 8111A0) and religious organizations (NAICS813100). These are service industries that are embeddedin the economic network and have relatively lower directreliance on ecological or human resources.Loading ratio is defined as ratio of inputs from non-
renewable resources to those from renewable resources.Fig. 15(b) shows environmental loading ratio for the 488industry sectors. As seen from Fig. 15(b), sectors of stonemining and quarrying (NAICS 212310), asphalt pavingmixture and block manufacturing (NAICS 324121) and cutstone and stone product manufacturing (NAICS 327991)have some of the tallest peaks. These are the sectors thatare involved either in mining of non-metallic minerals or intheir downstream processing. Sectors with the lowestenvironmental loading ratios are water, sewage and othersystems (NAICS 221300), forest nurseries, forest productsand timber tracts (NAICS 113A00), vegetable and melonfarming (NAICS 111200), tree nut farming (NAICS111335) and oilseed farming (NAICS 1111A0). Thesesectors along with other agricultural sectors have environ-mental loading ratios of less than unity indicating that theyrely on renewable resources more than nonrenewableresources. All other sectors in the economy have environ-mental loading ratios of higher than unity due to heavyreliance on metallic and non-metallic minerals and fossilenergy sources.Fig. 15(c) shows the yield-to-loading (YLR) ratios for
the 488 sectors. YLR is called the index of sustainability inemergy analysis, though it only represents the resource

ARTICLE IN PRESS
1.0E+00
1.0E+01
1.0E+02
1 36 71 106 141 176 211 246 281 316 351 386 421 456
Industry Sectors
sej/sej
Water Sewage and Other
Systems (NAICS 221300)
Other Federal Government
Enterprises (NAICS S00102)Nonmetallic Minerals Mining
(NAICS 212310, 212320)
Home Health Care Services
(NAICS 621600)
1.0E-02
1.0E-01
1.0E+00
1.0E+01
1.0E+02
1.0E+03
1.0E+04
1.0E+05
1 36 71 106 141 176 211 246 281 316 351 386 421 456
Industry Sectors
sej/sej
Asphalt Paving Mixture and Block
Manufacturing (NAICS 324121)
Stone Mining and
Quarrying (NAICS 212310)
Cut Stone & Stone Product
Manufacturing (NAICS 327991)
Water, sewage and other systems (NAICS 221300)
Forest nurseries, forest products, and timber tracts (NAICS 113A00)
Agricultural sectors (NAICS 1111A0-111920)
1.0E-04
1.0E-03
1.0E-02
1.0E-01
1.0E+00
1.0E+01
1.0E+02
1.0E+03
1 36 71 106 141 176 211 246 281 316 351 386 421 456
Industry Sectors
Water, Sewage & Other
Systems (NAICS 221300)
Other Federal Government
Enterprises (NAICS S00102)
Natural Gas Distribution (NAICS 221200)
Federal Electric Utilities(NAICS S00101)
a
b
c
Fig. 15. Performance metrics of industry sectors (a) yield ratio; (b) environmental loading ratio; and (c) yield-to-loading ratio.
N.U. Ukidwe, B.R. Bakshi / Energy 32 (2007) 1560–15921588

ARTICLE IN PRESSN.U. Ukidwe, B.R. Bakshi / Energy 32 (2007) 1560–1592 1589
consumption side of the sustainability riddle. YLR is lessthan unity for all sectors of the economy except theagricultural sectors (NAICS 1111A0–1119A0), forestnurseries, forest products and timber tracts (NAICS113A00), water sewage and other systems (NAICS221300), soybean processing (NAICS 311222), other oil-seed processing (NAICS 311223) and other federalgovernment enterprises. Sectors with the lowest YLR areclay refractory and other structural clay products (NAICS32712A), ready-mix concrete manufacturing (NAICS327320) and cut stone and stone product manufacturing(NAICS 327991). Thus sectors relying on nonmetallicminerals, in general, have some the lowest YLR values.
6. Discussion
This paper has focused mainly on the development of theTIOA model and calculation of various ratios based onICEC and ECEC. It does not aim to connect thermo-dynamics with economic value. Application of TIOA to the1997 US economic model yields unique insight into thebehavior of the economy. However, a natural question atthis point is about the usefulness of this model, andparticularly whether accounting for ecosystem goods andservices, as in ECEC has any benefits over ICEC. Thissection attempts to answer this question by discussing someof the applications of TIOA in greater detail.
�
This paper presents total ECEC requirements ofindustry sectors from non-renewable and renewableecological resources, human resources and humanhealth impact of emissions. Total ICEC and ECECrequirements define the thermodynamic basis of opera-tions of various industry sectors, and are similar to theconcept of ecological cost [1] and thermo-ecological cost[75]. Thermo-ecological cost is theoretically defined asthe total consumption of non-renewable exergy appear-ing in all the links of the domestic technological networkdue to the fabrication of the considered final product,but practically focuses only on selected links of theproduction chain. As a result it is prone to narrowsystem scope and large truncation errors. Total ICECrequirement addresses this shortcoming by consideringthe entire economic network. Furthermore total ECECrequirement strengthens thermo-ecological cost by con-sidering exergy losses in the ecological links of theproduction network. � The analysis also presents industry-specific ECEC andICEC to money ratios. These ratios describe the discordbetween thermodynamic work required for an economicsector and willingness of people to pay for it. The ratiospresented in this paper could prove useful in betterinternalization of ecological resources into economicpolicies and in formulating pro-ecological taxes. Thesignificance of pro-ecological tax has been discussedquite extensively by various authors [63,76] and use ofICEC has been suggested as a guideline in this regard.
The results presented in this paper may be directly usedto determine such taxes at the level of industry sectors.Furthermore, ECEC analysis would allow us to considerexergy consumption in the ecological network and mayprovide a more meaningful eco-centric guideline for pro-ecological taxes.
� ECEC/money ratios are fundamentally identical toemergy/$ ratios used in systems ecology. However,unlike a single emergy/$ ratio for the entire economythat is commonly used, this analysis determines aseparate ratio for each industry sector. Consequently,ECEC/money ratios are not only readily applicablewherever emergy/$ are used in emergy analysis, but alsoprovide a more accurate and disaggregate alternative tothe latter. Such ratios are also expected to be useful forother approaches that wish to consider the contributionof inputs such as labor and capital in exergetic termssuch as Sciubba’s extended exergy accounting.
� Even though this paper is not exploring or proposingany relationship between exergy and money, such arelationship has been suggested by many researchersover the last few decades. The relevance of this work tosuch conjectures is discussed in Section 5.2. Rigorousstatistical analysis may lead to important insight.
� Significance of techniques such as emergy analysis andextended exergy accounting has been covered exten-sively in literature. These techniques allow joint analysisof economic and environmental objectives of industrialsystems. Methods such as Optimum LCA Performance(OLCAP) [78] and Material Intensity Per Service unit(MIPS) [79] are based on multi-criteria analysis ofeconomic and environmental objectives. Economicfactors have also been combined with exergy analysisvia thermoeconomics and multiobjective optimization[80,81]. These methods use environmental objectivesthat suffer from the same shortcomings listed in theintroductory paragraphs of this paper, that is narrowsystem boundary, large truncation errors, ignorance ofecological processes and non-compliance with basisbiophysical principles amongst others. Use of ICEC/money and ECEC/money ratios would allow us todefine these objectives more accurately, representativelyand rigorously. Analysis and results presented in thispaper can be used in constructing improved environ-mental objectives that would ultimately lead to moreaccurate and environmentally conscious decisions [77].
� ECEC/money ratios also provide a unique insight intonatural and economic capital flows in industrial supplynetworks [38]. Such insight permits greater appreciationand conservation of vital ecological goods and services.These results have been studied from the standpoints ofweak and strong sustainability paradigms, and theirimplications to corporate restructuring, green supplychain management and sustainable international tradehave been discussed by Ukidwe and Bakshi [38]. TIOAcan also be modified to perform net energy and materialflow analyses by considering only fuel sources for the

ARTICLE IN PRESSN.U. Ukidwe, B.R. Bakshi / Energy 32 (2007) 1560–15921590
former and material sources for the latter analysis.Research is also underway to strengthen the resultsby incorporating additional ecological resources andimpact categories.
� ICEC/money and ECEC/money ratios can be useful forperforming thermodynamic LCA at the economy andecosystem scales, and hybrid LCA that combines theeconomy scale data with more detailed information atfiner scales. It can also enable the application of differentmethods based on energy, exergy, emergy and cost, whichcan provide valuable information for life cycle improve-ment [67]. Such thermodynamic LCA can provide anapproximate idea about the impact of emissions based onmaterial and energy inputs, without requiring detailedknowledge about process emissions and their toxicologicalaspects, and can be especially useful in evaluatingemerging technologies [82]. ICEC/money and ECEC/money ratios can also be used in constructing hierarchicalthermodynamic metrics of sustainability as demonstratedby Yi et al. [61] that are easy-to-calculate, robust,stackable, communicable to diverse audiences and pro-tective of proprietary information.
7. Conclusions and future work
This paper develops a Thermodynamic Input–outputmodel to quantify the direct and indirect, industrial andECEC of the 488-sector 1997 US economy. The underlyingeconomic input–output benchmark model is the mostrecent representation of the US economy at that level ofdetail. Hence the results obtained in this paper are moreaccurate and current than those presented by Ukidwe andBakshi [7] for 91-sector 1992 representation of USeconomy. This paper presents data about inputs ofecosystem products and services to industry sectors definedaccording to their North American Industrial Classifica-tion System (NAICS) codes. Data about selected bulk- andnon-bulk pollutants and their impact on human health arealso presented. Calculations for determining Industrial andECECs associated with these flows are presented in detailalong with the underlying assumptions at appropriateplaces in this analysis.
TIOA synthesizes concepts from systems ecology,engineering thermodynamics, and economic input–outputanalysis to evaluate direct and indirect reliance of industrysectors on ecological resources and impact of emissionsfrom them. It treats the economic-ecological system as anetwork of energy flows with exergy as the commoncurrency. Though TIOA uses knowledge from systemsecology, it is free of the controversial aspects of emergyanalysis such as maximum empower principle, emergytheory of value and reliance on prehistoric energy. It alsoonly considers the direct ecological inputs, thus avoidingthe use of derived transformity values for human-madeproducts. Thus, the model and data presented in this papercan provide the foundation for many applications and
encourage the development of sustainable engineering. Asdiscussed in Section 6, TIOA can help in calculatingindustry-specific ecological costs and pro-ecological taxesallowing development of environmentally consciousmacroeconomic policies. TIOA can also help in juxtaposi-tion of economic and natural capital flows in industrialsupply networks shedding valuable insight into greensupply chain management, and sustainable internationaltrade. At the micro-scale, industry specific ICEC/moneyand ECEC/money ratios can be used in constructinghierarchical thermodynamic metrics of sustainability andalso in conducting thermodynamic LCA to evaluateexisting and emerging technologies. ICEC/money andECEC/money ratios can be readily used to replace similarbut aggregate metrics that are currently being used inemergy analysis and thermoeconomics as well.There are many avenues to continue this work. Informa-
tion about additional ecosystem products and services andemissions can be easily incorporated in TIOA to make itmore comprehensive. Challenges pertaining to data andmodel uncertainty and different allocation approachesremain. Transformity values of oxygen to include combus-tion related activities, transformities of wind and waterstreams that address turbulent mixing and diffusion and notjust shaft work to include ecosystem services required forpollution dissipation, transformities of human labor that notonly consider material and energy inputs from the economybut also value addition via intellectual capital and averagetransformities to evaluate impact of emissions on ecosystemhealth are some of the areas where inputs from systemsecology would be very helpful. Finally, implementation ofthis approach and data in user-friendly software is essentialfor wider dissemination.
Acknowledgements
The authors acknowledge financial support from theNational Science Foundation grant no. BES-9985554 andThe Ohio State University Presidential Fellowship Program.
References
[1] Szargut J, Morris DR, Steward FR. Exergy Analysis of Thermal,
Chemical and Metallurgical Processes. New York: Hemisphere Pubs;
1988.
[2] Tsatsaronis G, Moran MJ. Exergy-aided Cost Minimization. Energy
Conv Mgmt 1997;38(15–17):1535–42.
[3] Bejan A, Tsatsaronis G, Moran M. Thermal Design and Optimiza-
tion. New York, NY: Wiley; 1996.
[4] Rosen MA, Dincer I. On Exergy and environmental impact. Int J
Energy Res 1997;21(7):643–54.
[5] Seager TP, Theis TL. A uniform definition and quantitative basis for
industrial ecology. J Cleaner Prod 2002;10(3):225–35.
[6] DeWulf J, Van Langenhove H, Dirckx J. Exergy analysis in the
assessment of the sustainability of waste gas treatment systems. Sci
Total Environ 2001;273(1–3):41–52.
[7] Ukidwe NU, Bakshi BR. Thermodynamic accounting of ecosystem
contribution to economic sectors with application to 1992 US
economy. Env Sci Tech 2004;38(18):4810–27.
ARTICLE IN PRESSN.U. Ukidwe, B.R. Bakshi / Energy 32 (2007) 1560–1592 1591
[8] Jorgensen SE. Integration of ecosystem theories: a pattern. Boston:
Kluwer Academic Publishers; 1997.
[9] Cornelissen RL, Hirs GG. Exergetic optimization of a heat
exchanger. Energy Conver Mgmt 1997;38(15–17):1567–76.
[10] Sciubba E. Beyond thermoeconomics? The concept of extended
exergy accounting and its application to the analysis and design of
thermal systems. Exergy Int J 2001;1(2):68–84.
[11] Odum HT. Environmental accounting: Emergy and environmental
decision making. New York: Wiley; 1996.
[12] Hau JL, Bakshi BR. Expanding exergy analysis to account for
ecosystem products and services. Env Sci Tech 2004;38(13):3768–77.
[13] Lenzen M. Errors in conventional and input–output-based life-cycle
inventories. J Ind Ecol 2000;4(4):127–48.
[14] Spreng DT. Net-energy analysis and the energy requirements of
energy systems. New York: Praeger Publishers; 1988.
[15] Cumberland JH. A regional inter-industry model for analysis of
development objectives. Reg Sci Ass Papers 1966;17:65–94.
[16] Hannon B. Ecological pricing and economic efficiency. Ecol Econ
2001;36(1):19–30.
[17] Reistad GM. Available energy conversion and utilization in the
United States. J Eng Power 1975;97:429–34.
[18] Wall G, Sciubba E, Naso V. Exergy use in Italian society. Energy
1994;19(12):1267–74.
[19] Ertesvag IS. Society exergy analysis: a comparison of different
societies. Energy 2001;26(3):253–70.
[20] Hammond GP, Stapleton AJ. Exergy analysis of the United
Kingdom energy system. Proc Inst Mech Eng A—J Power Energy
2001;215(A2):141–62.
[21] Hepbasli A. Modeling of sectoral energy and exergy utilization.
Energy Sources 2005;27(10):903–12.
[22] Ertesvag IS. Energy, exergy, and extended-exergy analysis of the
Norwegian society 2000. Energy 2005;30(5):649–75.
[23] Daily GC. Nature’s services: societal dependence on natural
ecosystems, ecosystem services and their importance. Washington,
DC: Island Press; 1997.
[24] Tilman D, Cassman KG, Matson PA, Naylor R, Polasky S.
Agricultural sustainability and intensive production practices. Nature
2002;418(6898):671–7.
[25] Costanza R, d’Agre R, de Groot R, Farber S, Grasso M, Hannon B,
et al. The value of the world’s ecosystem services and natural capital.
Nature 1997;387(6630):253–60.
[26] World Resource Institute. World Resource 2000–2001: People and
ecosystems: the fraying web of life. Washington, DC: World
Resource Institute, 2000. See also: /http://www.wri.org/wr2000S(accessed April 2006).
[27] WWF. Living planet Report 2000. World Wildlife Federation,
2000. See also: /http://www.panda.org/news_facts/publications/key_
publications/living_planet_report/lpr00/index.cfmS (accessed April
2006).
[28] UNEP. Global environmental outlook 3: past, present and future
perspectives. sterling, Virginia: United Nation’s Environmental
Program, Earthscan Pubs. Ltd.; 2002. See also: /http://www.unep.
org/geo3S (accessed April 2006).
[29] Millennium Assessment. Living beyond our means-natural assets and
human well-being. millennium ecosystem assessment, 2005. See also:
/http://www.millenniumassessment.org/en/index.aspxS (accessed
April 2006).
[30] Costanza R, Herendeen R. Embodied energy and economic value in
the United States economy—1963, 1967 and 1972. Resour Energy
1984;6(2):129–63.
[31] Ayres RU. On the life cycle metaphor: where ecology and economics
diverge. Ecol Econ 2004;48(4):425–38.
[32] Hau JL, Bakshi BR. Promise and problems of emergy analysis. Ecol
Model 2004;178(1–2):215–25.
[33] Herendeen R. Energy analysis and EMERGY analysis-a comparison.
Ecol Model 2004;178(1–2):227–37.
[34] Sciubba E, Ulgiati S. Emergy and exergy analysis: complementary
methods or irreducible ideological options. Energy 2005;30(10):1953–88.
[35] Sciubba E. Cost analysis of energy conversion systems via a novel
resource-based quantifier. Energy 2003;28(5):457–77.
[36] Ayres RU. The price-value paradox. Ecol Econ 1998;25(1):17–9.
[37] Arrow K, Daily G, Dasgupta P, Levin S, Maler KG, Maskin E,
et al. Managing ecosystem resources. Env Sci Tech 2000;34(8):
1401–6.
[38] Ukidwe NU, Bakshi BR. Flow of natural versus economic capital in
industrial supply networks and its Implications to sustainability. Env
Sci Tech 2005;39(24):9759–69.
[39] Ukidwe NU. Thermodynamic input–output analysis of economic and
ecological systems for sustainable engineering. Columbus: The Ohio
State University, PhD thesis, 2005.
[40] Szargut JT. Anthropogenic and natural exergy losses (exergy balance
of the earth’s surface and atmosphere). Energy 2003;28(11):
1047–54.
[41] Chen GQ. Exergy consumption of the earth. Ecol Model 2005;
184(2–4):363–80.
[42] Odum HT. Handbook of emergy evaluation folio 2: emergy of global
processes. Gainesville, Florida: Center for Environmental Policy,
University of Florida; 2000.
[43] Hermann WA. Quantifying global exergy resources. Energy 2006;
31(12):1685–702.
[44] Miller RE, Blair PD. Input–output analysis: foundations and
extensions. Englewood Cliffs, New Jersey: Prentice-Hall; 1985.
[45] Leontief WW. Input–output economics. New York: Oxford Uni-
versity Press; 1936.
[46] Ulgiati S, Brown MT, Bastianoni S, Marchettini N. Emergy-based
indices and ratios to evaluate the sustainable use of resources. Ecol
Eng 1995;5(4):519–31.
[47] Brandt-Williams SL. Handbook of emergy evaluation: Folio 4;
Emergy of Florida agriculture. Gainesville, FL: Systems Ecology
Center, University of Florida; 2002. See also: /http://www.emergy
systems.org/downloads/Folios/Folio_4.pdfS (accessed April 2006).
[48] Brown MT, Bardi E. Handbook of emergy evaluation: Folio 3;
Emergy of ecosystems. Gainesville, Florida: Systems Ecology Center,
University of Florida; 2001. See also: /http://www.emergysystems.
org/downloads/Folios/Folio_3.pdfS (accessed April 2006).
[49] Balmford A, Bruner A, Cooper P, Costanza R, Farber S, Green RE,
et al. Ecology—Economic reasons for conserving wild nature. Science
2002;297(5583):950–3.
[50] Bureau of Labor Statistics. 2000 National Industry-Specific Occupa-
tional Employment and Wage Estimates. Washington, DC: Division
of Occupational Employment Statistics. US Department of
Labor; 2004. See also: /http://stats.bls.gov/oes/2000/oesi2_90.htmS(accessed April 2006).
[51] Hofstetter P. Perspectives in life cycle impact assessment: a structured
approach to combine models of the technosphere, ecosphere, and
valuesphere. Boston: Kluwer Academic Publishers; 1998.
[52] GoedkoopM, Spriensma R. The Eco-indicator 99: a damage oriented
method for life cycle impact assessment, methodology report. B. V.,
Plotterweg 12, 3821 BB. Amersfoort, The Netherlands: PRe
Consultants; 1999.
[53] USEPA. 1999 Toxics Release Inventory: Public Data Release. US
Environmental Protection Agency, 1999. See also: /http://www.
epa.gov/tri/tridata/tri99/state/index.htmS (accessed April 2006).
[54] BEA. Inter-Industry Transaction Tables. US Department of Com-
merce, Bureau of Economic Analysis, 2004. See also: /http://
www.bea.doc.gov/bea/pn/ndn0180.exeS (accessed May 2004).
[55] N.R.C. Materials count, the case for material flow analysis.
Washington DC: National Research Council, National Academies
Press; 2004.
[56] NASA, NASA Surface meteorology and solar energy, 2004. See also:
/http://eosweb.larc.nasa.gov/sseS (accessed April 2006).
[57] USDOA, US Department of Agriculture, 2004. See also: /http://
www.nass.usda.gov/census/census97/atlas97/summary1.htmS (accessed
April 2006).
[58] Costanza R. Embodied energy and economic valuation. Science
1980;210(12):1219–24.

ARTICLE IN PRESSN.U. Ukidwe, B.R. Bakshi / Energy 32 (2007) 1560–15921592
[59] Lave LB, Cobas-Flores E, Hendrickson CT, McMichael FC. Using
input–output-analysis to estimate economy-wide discharges. Env Sci
Tech 1995;29(9):A420–6.
[60] EIOLCA. Economic Input–output Analysis. Pittsburg, Pennsylvania:
Green Design Initiative, Carnegie Mellon University, 2006. See also:
/http://www.eiolca.netS (accessed April 2006).
[61] Yi HS, Hau JL, Ukidwe NU, Bakshi BR. Hierarchical thermo-
dynamic metrics for evaluating the sustainability of industrial
processes. Environ Prog 2004;23(4):302–14.
[62] Weidema B. Avoiding co-product allocation in life-cycle assessment.
J Ind Ecol 2001;4(3):11–33.
[63] Szargut J. Application of exergy for the determination of the pro-
ecological tax replacing the actual personal taxes. Energy 2002;
27(4):379–89.
[64] Ayres RU. Eco-thermodynamics: economics and the second law.
Ecol Econ 1998;26(2):189–209.
[65] Clift R, Wright L. Relationships between environmental impacts and
added value along the supply chain. Tech Forecast Soc Change
2000;65:281–95.
[66] Suh S, Lenzen M, Treloar GJ, Hondo H, Horvath A, Huppes G,
et al. System boundary selection in life-cycle inventories using hybrid
approaches. Env Sci Tech 2004;38(3):657–64.
[67] Tonon S, Brown MT, Luchi F, Mirandola A, Stoppato A, Ulgiati S.
An integrated assessment of energy conversion processes by means of
thermodynamic, economic and environmental parameters. Energy
2006;31(1):149–63.
[68] USDOE. US Department of Energy, 2004. See also: /http://
tonto.eia.doe.gov/dnav/pet/pet_cons_top.aspS (accessed April 2006).
[69] USDOE. US Department of Energy, 2004. See also: /http://
www.eia.doe.gov/emeu/mer/pdf/pages/sec7_5.pdfS (accessed April
2006).
[70] USGS. US Geological Survey, 2004. See also: /http://minerals.usgs.
gov/minerals/pubs/commodity/S (accessed April 2006).
[71] Ayres RU, Ayres LW. Accounting for resources I: economy wide
applications of mass balance principles to materials and waste.
Northampton, MA: Edward Elgar Pubs; 1998.
[72] USGS, US Geological Survey, 2004. See also: /http://water.usgs.
gov/watuse/S (accessed April 2006).
[73] Adriaanse A, Bringezu S, Hammond A, Moriguchi Y, Rodenburg E,
Rogich D, et al. Resource flows: the material basis of industrial
economies. Washington, DC: World Resource Institute; 1997.
[74] Matthews E, Amann C, Bringezu S, Fischer-Kowalski M, Huttler W,
Kleijn R, et al. The weight of nations: material outflows from
industrial economies. Washington, DC: World Resource Institute;
2000.
[75] Szargut JT. Optimization of the design parameters aiming at the
minimization of the depletion of non-renewable resources. Energy
2004;29:2161–9.
[76] Repetto R, Dover RC, Jenkins R, Geoghegan, J. Green fees: how a
tax shift can work for the environment and the economy.
Washington, DC: World Resource Institute; 1992.
[77] Hau JL. Toward environmentally conscious process systems en-
gineering via joint thermodynamic accounting of industrial and
ecological systems. Columbus: The Ohio State University, PhD
thesis, 2005.
[78] Azapagic A, Clift R. The application of life cycle assessment to
process optimization. Comp Chem Eng 1999;23(10):1509–26.
[79] Hoffman VH, Hungerbuhler K, McRae GJ. Multiobjective screening
and evaluation of chemical process technologies. Ind Eng Chem Res
2001;40(21):4513–24.
[80] Heinzel E, Weirich D, Brogli F, Hoffman VH, Koller G, Verduyn
MA, et al. Ecological and economic objective functions for screening
in integrated development of fine chemical processes. 1. Flexible and
expandable framework using indices. Ind Eng Chem Res 1998;37(8):
3395–407.
[81] Lazzaretto A, Toffolo A. Energy, economy, and environment as
objectives in multi-criterion optimization of thermal systems design.
Energy 2004;29:1139–57.
[82] Bakshi BR, Ukidwe NU. The role of thermodynamics in life cycle
assessment of existing and emerging technologies. In:Proceedings of
the 2006 IEEE international symposium on electronics and the
environment, 2006. p. 15–20.