industrial and financial systems, ifs ab
TRANSCRIPT

INDUS TRIAL AND FINANCIAL SYS TEMS, IFS AB
ANNUAL REPORT
2007
Global Reports LLC

TABLE OF CONTENTS
2
TABLE OF CONTENTS 4 Highlights
5 5-year summary
5 Financial targets
6 Message from the president
8 IFS and IFS Applications
10 The IFS stock
12 Table of contents of the annual report
13 Annual report
66 Board of directors
67 Senior management and auditors
68 Financial trend 2003–2007
70 Definitions and glossary
71 Addresses
FINANCIAL REPORTS Quarterly report January–March April 22, 2008 Quarterly report April–June July 18, 2008 Quarterly report July–September October 21, 2008 Preliminary report on 2008 operations February 2009
ANNUAL GENERAL MEETING The annual general meeting (AGM) will be held on Thursday April 3, 2008 in Solna, Sweden.
Global Reports LLC

3
Global Reports LLC

H IGHL IGHTS
4
HIGHLIGHTS
• Product revenue during the year increased by 12% organically, continuing the positive trend from the previous year, when product revenue increased by 13%. The main reason for this positive trend is that IFS focused on, strengthened its position among, and successfully sold to companies and industries for which logistics, asset management, and service management, as well as certain types of manufacturing, are central processes.
• The 10 largest license agreements during the year had an aggregate value of SKr 103 million. The corresponding figure for 2006 was SKr 95 million. A total of 23 license agreements valued at more than US $ 0.5 million each were signed. In all, 177 (188) new customers were added, and 778 (593) customers either upgraded or expanded their existing solutions.
• The new version of IFS’ enterprise applications, IFS Applications 7.5, and the new user interface, Aurora, were launched. IFS Applications 7.5 is the result of more than 600, 000 development hours and offers, among other things, enhanced support for global operations, including the ability to use one code base for all the major markets in the world and additional functionality for project-based companies. The first customers have already gone live with IFS Applications 7.5 and have been running it since January 2008. Aurora is a completely new experience in which an ergonomic design, a built-in search engine and multi-media functionality simplify the use of business applications and increase productivity.
• In July, Information Science Consultants Ltd (iSC), a U.K.-based company, was acquired for cash by IFS Defence Ltd, a joint-venture company owned by BAE Systems and IFS AB. iSC specializes in naval maintenance management systems and services. The company’s biggest customer is the U.K. Royal Navy.
• Net revenue reached SKr 2,356 million (2,209). License revenue increased to SKr 478 million (433), whereas maintenance and support revenue amounted to SKr 659 million (600). Consulting revenue reached SKr 1,194 million (1,140).
• EBIT amounted to SKr 141 million (120), with earnings before tax of SKr 129 million (75). Profit after tax was SKr 122 million (246). Profit in 2006 was positively affected by a revaluation of activated deferred tax claims of SKr 184 million compared with SKr 58 million in 2007.
• Cash flow from current operations amounted to SKr 174 million (252). Cash flow after investment operations totaled SKr 20 million (86).
Global Reports LLC

5 -YEAR SUMMARY
5
5-YEAR SUMMARY
2003 2004 2005 2006 2007
Net revenue SKr, million 2 335 2 178 2 149 2 209 2 356
of which license revenue SKr, million 513 451 383 433 478
of which maintenance and support revenue SKr, million 406 470 528 600 659
of which consulting revenue SKr, million 1 302 1 174 1 175 1 140 1 194
Net revenue outside Sweden % 75% 77% 79% 80% 78%
EBIT SKr, million -29 -128 97 120 141
EBIT margin % 0% -6% 5% 5% 6%
Profit/loss before tax SKr, million -139 -204 67 75 129
Profit margin % -5% -9% 3% 3% 5%
License margin % -12% -15% -13% -9% -4%
Maintenance and support margin % 60% 61% 58% 63% 64%
Consulting margin % 21% 22% 21% 17% 16%
Product development expenditure/net revenue % 12% 14% 10% 9% 9%
Administration expenses/net revenue % 11% 11% 10% 9% 10%
Return on capital employed % neg. neg. 11% 10% 11%
Equity/assets ratio, after full conversion % 30% 37% 38% 45% 50%
Net debt SKr, million 634 363 294 166 3
Interest coverage rate times neg. neg. 2.1 2.5 6.1
Cash flow after investment operations SKr, million -169 -76 28 86 20
Acc rec (avg 12 month)/Net revenue (rolling 12 month) % 24 22 22 23 23
Average number of employees 2 846 2 661 2 453 2 644 2 646
Number of employees at year-end 2 684 2 583 2 600 2 630 2 627 As of fiscal year 2005, the IFRS accounting principles have been applied; fiscal years 2003 and 2004 have been restated accordingly.
For further information, see “Accounting principles”; for definitions, see page 70.
FINANCIAL TARGETS During the coming five-year period (2008-2012) IFS’ goal is to double product revenue. This will be achieved through organic growth and the acquisition of application product companies that have customers in industries in which IFS has a strong market position. Moreover, during the five-year period, IFS aims to: • achieve an EBIT margin of 15% and a return of 25% on average operating capital, • over time distribute 50% of earnings after tax as dividends. In addition to dividends, surplus capital, i.e. capital not needed for investments, expansion and other needs relating to the financial position of the Group, will be transferred to shareholders by means of share repurchase.
Global Reports LLC

MESSAGE FROM THE PRES IDENT
6
MESSAGE FROM THE PRESIDENT A continued solid performance sees IFS delivering to strategy and executing on its vision of providing a real alternative for customers and the market. Strategic View
IFS saw a third year of profitable growth in 2007, with profits before tax increasing by 72% and net debt reduced to almost zero. This positive result is due to the successful execution of our strategy over the last two years, where our focus has been to grow revenue without increasing the cost structure.
Product revenue (licences, maintenance and support) continued to increase and is very much the priority for the business as IFS is increasingly positioning itself as a software product company. This focus will continue to generate better margins, more predictable recurring revenue and improved cooperation with partners.
Starting in 2008, IFS has embarked on a five-year strategy with the goal of doubling product revenue through continued organic growth and by acquiring application product companies. The Board of IFS has communicated clear long-term financial targets for this growth strategy which cover the coming five-year period (2008-2012). During this time, IFS plans to achieve an EBIT margin of 15% and increase dividends to 50% of earnings after tax. Additional surplus capital, not required for investments, expansion and other needs relating to the financial position of the group, will be used for repurchasing shares.
This signifies a major evolution in the strategy of IFS. As a first step on this new route the Board proposes to pay out a dividend in 2008 of SKr 0.10 /share. IFS—the REAL alternative and the intelligent choice
The enterprise software market is continuing to evolve and is driven by both technology advances and the demands of a rapidly changing world market. I strongly believe that IFS is the real alternative for discerning customers in an ever-consolidating IT sector. IFS will be increasingly attractive to organizations in our target markets because we will continue to provide deepening, truly needed functionality, delivered on a future-proof technology platform, and implemented in the step-by-step manner best suited to our customers. The first sight of Aurora
IFS’ new user interface ‘Aurora’ debuted to universal acclaim at the IFS World Conference in Berlin in October. Over 1,000 attendees, including customers, prospects, partners and the media from 44 countries, saw IFS bring the concepts of good design to the world of business software with Aurora. This visually attractive and functionally rich front-end to IFS Applications will deliver increased usability and user produc-tivity for our customers. Aurora was developed and launched
two years ahead of the original planned date. This is a power-ful demonstration of the new agility we have fostered in our Product Organization, which now works in closer coopera-tion with IFS country operations to drive increased sales. The outlook for 2008
The indicators show that 2008 is likely to be more turbulent and challenging for the global economy. Fortunately IFS’ strategic focus is on industries and markets that are somewhat buffered from downturns in consumer confidence—for example, the defense markets, infrastructure, utilities and oil sector businesses, which are influenced by different business drivers.
IFS begins 2008 in a stronger position with a clear vision to provide a real alternative for the market. We have an articulated strategic direction for growth, and we are in a financially stronger position to execute on this. Aurora will deliver a technologically advanced refresh to our product set to enhance its competitiveness. IFS is ready to face the opportunities of the coming year. Alastair Sorbie President and CEO
Global Reports LLC

MESSAGE FROM THE PRES IDENT
7
Global Reports LLC

I FS AND I FS APPL ICAT IONS
8
IFS – THE GLOBAL ENTERPRISE APPLICATIONS COMPANY Today IFS stands as a growing independent provider of component-based business software to a select number of industry verticals worldwide. IFS' solution, IFS Applications, helps organizations be more agile in an increasingly turbulent global business environment.
IFS' technology innovations make IFS Applications easier to implement and upgrade. IFS' customer orientation, evident from the origins of the company, makes IFS a true collaborative business partner.
Together these factors make IFS the REAL alternative in an ever consolidating IT sector. IFS – Snapshot
IFS is an organization with a truly global reach, with 79 IFS offices and over 40 distributors around the world. IFS Applications is available in 54 countries and in more than 22 languages. IFS has over 2,000 customers and more than 600,000 end users of IFS Applications.
IFS has around 2,600 employees worldwide. With a major development center in Asia since 1997, IFS was among the first to realize the advantages of globalizing its operations. IFS' long-held values are simplicity, commitment & profession-alism. These values form the basis of how the company works—and guide the way it interacts with customers, partners, the market, and colleagues. IFS – gets closer to customers
IFS was founded in 1983 by five engineers from the University of Linköping, Sweden. They dreamt of starting a company that was different—somewhere people really wanted to work, that was a distinctive business partner for clients. When IFS landed its first customer, the young entrepreneurs literally pitched a tent and camped outside the organization’s plant, working double shifts until the job was done. This desire to be closer to customers is still at the heart of how IFS continues to do business—with a direct involvement in most customer projects and an ongoing program of joint software develop-ment together with clients. And the first customer still uses IFS’ solutions today. IFS Applications – The solution for the agile enterprise
IFS Applications is a functionally rich extended ERP solution which powers the business processes of organizations of all sizes. IFS focuses on 7 broad industry segments: • Aerospace & Defense, • Automotive, • Construction, Contracting & Service Management, • Manufacturing, • Process Industries, • Retail & Wholesale, • Utilities and Telecom.
This specialization makes IFS able to deliver industry-specific functionality to give customers the competitive edge in their own markets.
In the past few years IFS has seen increased demand for ‘project-centric’ capabilities across a number of our targeted verticals. IFS has responded quickly to provide enhanced software components to better manage risk, cost, cash, time and resources in real-time. This enables a business to manage with an eye on the future rather than with historical information alone.
IFS Applications’ ‘project-centric’ capabilities let a company take informed business decisions looking across their global value chain. When the success of products, services, projects and even brand-reputation increasingly rely on elements provided by partners, suppliers and sub-contractors, traditional ways of working and traditional ERP systems are not enough. With IFS, information is assigned to a project which can be reviewed minute-by-minute. The need for these capabilities are seen not only in the traditional project-related industries such as construction, but also in sectors like manufacturing, where organizations need to add the capability to manage risk, complex contracts and sub-contractor rela-tionships as more production is outsourced and off-shored.
IFS Applications was always strong in such areas, but IFS has rapidly enhanced these business components to meet the new challenges. IFS – 25 years of technology innovation
IFS has two distinct advantages over competitors: the single integrated product line in IFS Applications and the fact that it has been component- based for over a decade. This means IFS is uniquely placed to supply business components that take advantage of today’s service-oriented architectures (SOA) and the company has been able to focus its technology investments on the next wave of innovations—rather than having to componentize and integrate disparate systems.
IFS continued to drive innovation in 2007 with the debut of the new user interface, Aurora, at the company’s successful world conference in Berlin in October. With Aurora, IFS brings the world of good design to business software. Visually appealing elements, ergonomic design and collaboration features will make customer employees more productive.
Global Reports LLC

I FS AND I FS APPL ICAT IONS
9
Global Reports LLC

STOCK
10
STOCK IFS Series B stock is listed since April 28, 1998 on the Stockholm stock exchange and is traded on the OMX Nordic Exchange, Stockholm Mid-Cap list (sector: information technology). The Company’s Series A stock has been on the same list since June 18, 1998.
As of December 31, 2007, IFS’ capital stock amounted to SKr 526,933,314, represented by 263,466,657 shares, before dilution, with a nominal value of SKr 2 per share. These comprised 13,916,638 Series A shares and 249,550,019 Series B shares. After full dilution, the number of shares amounts to 270,093,660.
Each Series A share carries the right to one vote, and each Series B share carries the right to one tenth of a vote. All shares carry equal rights to dividends.
During the year, a total of 8.1 million Series A shares and 213.7 million Series B shares were traded. The trading thereby amounted to 87% of the average total number of listed shares. The principal owner is Gustaf Douglas with associated companies, who controlled 18.9% of the capital and 17.5% of the voting rights on December 31, 2007.
Terms and conditions for convertible debentures/bonds issued are detailed in note 35 of the annual report.
Stockholders
Stockholder
Number of
series A shares
Number of
series B shares
Share of
capital
Share of
voting rights
Gustaf Douglas and associated companies 2 028 000 47 883 000 18.9% 17.5%
Bengt Nilsson and associated companies 3 973 213 1 413 235 2.0% 10.6%
Anders Böös and associated companies 3 950 000 89 349 1.5% 10.2%
NEC Corporation 1 100 000 6 790 000 3.0% 4.6%
Catella funds - 17 450 820 6.6% 4.5%
DnB NOR funds - 11 204 456 4.3% 2.9%
Skandia Liv - 8 276 252 3.1% 2.1%
Fourth Swedish National Pension Fund - 7 720 400 2.9% 2.0%
Sif - 7 623 273 2.9% 2.0%
AMF Pension funds - 6 386 000 2.4% 1.6%
Skandia funds - 6 127 020 2.3% 1.6%
HQ Bank AB 2 000 5 878 841 2.2% 1.5%
Lannebo funds - 5 456 000 2.1% 1.4%
DnB/Carlson funds - 3 486 700 1.3% 0.9%
SEB - 3 428 577 1.3% 0.9%
Other stockholders 2 863 425 110 336 096 43.2% 35.8%
Total 13 916 638 249 550 019 100.0% 100.0%
Source: SIS Ägarservice, December 28, 2007
Share category
Number of
shares
Number of
voting rights
Share of
capital
Share of
voting rights
Series A shares 13 916 638 13 916 638 5.3% 35.8%
Series B shares 249 550 019 24 955 002 94.7% 64.2%
Total 263 466 657 38 871 640 100.0% 100.0%
Source: SIS Ägarservice, December 28, 2007
Distribution of stockholders Share of
capital
Share of
voting rights
Swedish individuals 37.5% 53.6%
Swedish mutual funds 18.9% 12.8%
Swedish institutional owners 15.4% 10.4%
Swedish owners 71.8% 76.8%
International owners 28.2% 23.2%
Total 100.0% 100.0%
Source: SIS Ägarservice, December 28, 2007
Global Reports LLC

STOCK
11
Stockholder statistics
Number of shares held
Number of
stockholders
Proportion of
stockholders
Number of
shares
Share of
capital
Share of
voting rights
1–1 000 6 346 60.8% 2 325 198 0.9% 0.8%
1 001–2 000 1 438 13.8% 2 449 111 0.9% 0.7%
2 001–5 000 1 214 11.6% 4 276 121 1.6% 1.2%
5 001–10 000 673 6.4% 5 236 374 2.0% 1.4%
10 001–50 000 551 5.3% 12 266 519 4.7% 3.5%
50 001–100 000 83 0.8% 6 091 802 2.3% 2.4%
100 001– 141 1.3% 230 821 532 87.6% 90.0%
Summa 10 446 100.0% 263 466 657 100.0% 100.0%
Source: SIS Ägarservice, December 28, 2007 IFS Series B share price development and trade volume
January 1, 2007–December 31, 2007
2003–2007
Shares and convertible debentures/bonds
Series A shares Series B shares KV5B
Nominal amount, SKr million 35
Conversion price, SKr 5.25
Maturity date 2008-03-31
No of shares after dilution 13 916 638 249 550 019 6 627 003
Global Reports LLC

TABLE OF CONTENTS OF THE ANNUAL REPORT
12
TABLE OF CONTENTS OF THE ANNUAL REPORT 13 Board of directors’ report
21 Consolidated income statement
22 Consolidated balance sheet – assets
23 Consolidated balance sheet – equity and liabilities
24 Consolidated capital account
25 Consolidated statement of cash flows
26 Income statement of the parent company
27 Balance sheet of the parent company– assets
28 Balance sheet of the parent company– equity and liabilities
29 Capital account of the parent company
30 Statement of cash flows of the parent company
31 Notes to the financial statements
Note 1 Accounting principles 31
Note 2 Segment reporting 40
Note 3 License revenue 42
Note 4 Maintenance and support revenue 42
Note 5 Other revenue 42
Note 6 License expenses 42
Note 7 Other operating income 43
Note 8 Other operating expenses 43
Note 9 Development expenditure 43
Note 10 Transactions between subsidiaries 43
Note 11 Operating expenses per type of cost 43
Note 12 Auditors’ fees 43
Note 13 Salaries, other remunerations, and social costs 44
Note 14 Remunerations paid to senior executives 45
Note 15 Transactions with related parties 46
Note 16 Average number of employees per country 46
Note 17 Results from participations in subsidiaries 47
Note 18 Results from participations in associated companies 47
Note 19 Financial income 47
Note 20 Financial costs 47
Note 21 Taxes 47
Note 22 Profit and dividend per share 48
Note 23 Intangible fixed assets 48
Note 24 Tangible fixed assets 50
Note 25 Operating lease agreements 51
Note 26 Participations in subsidiaries 52
Note 27 Participations in associated companies 53
Note 28 Receivables in subsidiaries 54
Note 29 Deferred tax claims and tax liabilities 54
Note 30 Other long-term receivables 55
Note 31 Accounts receivable 55
Note 32 Other receivables 55
Note 33 Liquid assets 55
Note 34 Stockholders’ Equity 55
Note 35 Convertible debentures/bonds 56
Note 36 Liabilities to credit institutions 58
Note 37 Risk structure pertaining to interest and financing 58
Note 38 Pension commitments 59
Note 39 Other provisions and other liabilities 60
Note 40 Other liabilities 60
Note 41 Accrued expenses and prepaid income 60
Note 42 Pledged assets 61
Note 43 Contingent liabilities 61
Note 44 Adjustments for items not included in cash flow 61
Note 45 Acquisition of subsidiaries/operations 61
Note 46 Acquisition of joint ventures consolidated using the
proportional method 62
Note 47 External sale of subsidiaries/operations 62
Note 48 Acquisition of tangible fixed assets 62
Note 49 Financial risk management and derivatives 62
Note 50 Conversion rates 64
Note 51 Information about the Parent company 64
65 Audit report
Global Reports LLC

BOARD OF D IRECTORS ’ REPORT
Industrial and Financial Systems, IFS AB (publ) – Corporate identity number 556122-0996 13
BOARD OF DIRECTORS’ REPORT General
The board of directors and president of Industrial and Financial Systems, IFS AB (publ), corporate identity number 556122-0996, herewith submit the annual accounts and consolidated accounts for the fiscal year 2007. Unless otherwise stated, all amounts are in SKr million. Information in parentheses refers to the preceding fiscal year. The terms “IFS”, “Group”, and “Company” all refer to the parent company, Industrial and Financial Systems, IFS AB, and its subsidiaries. Summary
The overall objective for 2007 was to grow product revenue, improve profitability and strengthen cash flow. Product revenue increased during the year by 12% organically and earnings before tax by 72%. The main reason for the positive trend was that IFS focused on, consolidated its strong position among, and successfully sold to companies and industries for which logistics, asset management and service, as well as certain types of manufacturing, are central processes. Expenses increased somewhat more than expected, mainly because of inflationary pressure in certain markets. In addition, variable costs increased. The target of improved cash flow was not achieved, primarily due to the postponement of customer payments until after the turn of the year. The financial position is good, however, and the company is free of net debt.
Net revenue amounted to SKr 2,356 (2,209) million, EBIT improved to SKr 141 (120) million, and cash flow after investments totaled SKr 20 (86) million. Operations
IFS is a leading provider of component-based business software developed using open standards and based on service-oriented architecture. The solutions enable organizations to respond quickly to market changes and use resources in a more agile way to achieve better business performance and competitive advantage.
Founded in 1983, IFS has 2,600 employees worldwide. With IFS Applications™, now in its seventh generation, IFS has pioneered component-based ERP software. The component architecture provides solutions that are easier to implement, run and upgrade. IFS Applications is available in 54 countries in 22 languages.
IFS has over 600,000 users across seven key vertical sectors: aerospace & defense; automotive; manufacturing; process industries; construction, contracting & service management; retail & wholesale distribution and utilities & telecom. IFS Applications provide extended ERP functionality, including
CRM, SCM, PLM, CPM, enterprise asset management, and MRO capabilities.
IFS is today represented in 50 countries through wholly and jointly owned subsidiaries, joint ventures, and partners. Operations are divided into three regions, EMEA, Americas, and Rest of the World, which have the operational responsibil-ity for sales and delivery to customers. Product development and support are included in corporate functions. The Market
Globalization has led to increased pressure from competitors and more complex supply chains. To meet these challenges, many companies are investing in new, improved enterprise applications with the aim of streamlining operations and simplifying collaboration with suppliers, customers and partners. Moreover, an increasing number of companies are operating internationally, using partly new business models. Legislation and regulations are becoming more extensive, mergers and acquisitions are more frequent, and many companies are moving from traditional manufacturing/ distribution to more project- and service-based business models.
Although these drivers, which have led to increased growth in the ERP market in recent years, remain, there is increasing uncertainty as to the effects of economic trends. Analysts such as Gartner and AMR expected the total market to grow by 8–10% up to 2010. Surveys of IT budgets for 2008 indicate an increase of 5–12%. IFS expects that growth in the market will slow down but that the weaker economic trend will primarily impact the consumer market and have limited effect on industries such as defense, construction and energy, in which IFS does much of its business.
The situation with respect to competition remained unchanged during 2007 and is expected to remain unchanged in the coming years. After the consolidation of recent years, SAP and Oracle continue to be the main competitors in the industries in which IFS operates. Structural Changes
In July, Information Science Consultants Ltd (iSC), a U.K.-based company, was acquired for cash by IFS Defence Ltd, a joint-venture company owned by BAE Systems and IFS AB. iSC specializes in naval maintenance management systems and services. The company’s biggest customer is the U.K. Royal Navy.
In Asia Pacific, actions were taken to reduce costs by streamlining organizational structures and increasing representation via partners. Anthony Lorge assumed responsibility for Asia Pacific.
Global Reports LLC

BOARD OF D IRECTORS ’ REPORT
14 Industrial and Financial Systems, IFS AB (publ) – Corporate identity number 556122-0996
Net Revenue
SKr, million
2007
actual
Translation
effect
Structural
changes
2007
adjusted
2006
actual
Organic
change
Reported
change
License revenue 478 8 0 486 433 12% 10%
Maintenance and support revenue 659 11 -2 668 600 11% 10%
Total product revenue 1 137 19 -2 1 154 1 033 12% 10%
Consulting revenue 1 194 19 -6 1 207 1 140 6% 5%
Net revenue (including other revenue) 2 356 38 -8 2 386 2 209 8% 7% Product revenue continued to develop positively compared with previous years, with an organic improvement of 12% compared with 2006. The increase in license revenue is the result of strong positions in capital-intensive industries such as the defense, energy, communications, construction, and process industries. Common to these is the fact that logistics, service, asset management and certain types of project-based manufacturing are central processes. Moreover, IFS has a modern, competitive product with deep functionality, strong references and many partners in these industries.
During the year, the 10 largest license agreements had a total value of SKr 103 million. The corresponding figure for 2006 was SKr 95 million. A total of 23 license agreements exceeding US $ 0.5 million in value were sold during the year. License agreements were signed with 177 (188) new customers, and 778 (593) customers upgraded or expanded their existing solutions. EMEA accounted for 68% (58) of license revenue, Americas for 15% (22), and Rest of the World for 17% (20).
The growth in maintenance and support revenue is attributable to a continued increase in the customer base and
number of users per customer and the fact that fewer customers have terminated their maintenance contracts. The higher amount of maintenance and support revenue also enables greater predictability and stability with respect to revenue and cash flow. The regional shares of the total maintenance and support revenue were stable. EMEA contributed 71% (72), the Americas 16% (17) and Rest of the World 13% (11).
Utilization of consultants, however, was uneven within the Group. EMEA reported strong sales and high levels of utilization, whereas other regions were reported low levels of utilization at times. Uneven utilization, combined with staff turnover and inflationary pressure, had a negative effect on the consulting margin, which was 16% (17) in 2007. Toward the end of the year, improved utilization and a higher billing rate, combined with a reduction in the effect of staff turnover, improved the consulting margin to 21% (16) during the fourth quarter. EMEA generated 77% (75) of the Group’s consulting revenue, Americas 14% (16), and Rest of the World 9% (8).
Costs and Expenses
SKr, million
2007
actual
Translation
effect
Structural
changes
2007
adjusted
2006
actual
Organic
change
Reported
change
Operating expenses 2 215 35 -5 2 245 2 089 7% 6%
Capital gains/losses 3 - - 3 3 n/a n/a
Exchange rate gains/losses -13 - - -13 -11 n/a n/a
Restructuring costs/redundancy costs -3 - - -3 -13 n/a n/a
Depreciation and net capitalization of product development -52 -1 - -53 -43 n/a n/a
Adjusted operating expenses 2 150 34 -5 2 179 2 025 8% 6% Variable expenses, such as costs related to third-party suppliers and partners, and subcontracted consultants amounted to SKr 264 (240) million, an increase of 10% at current exchange rates, primarily as a result of higher volumes. Other operating expenses amounted to SKr 1,951 (1,849) million, an increase of 5% at current exchange rates, mainly due to increased payroll expenses. These amounted to SKr 1,420 (1,350) million, an increase of 5% at current exchange rates, of which fixed salary increases accounted for 3%. The remainder of the increase pertains to an increase in variable remuneration, a change in personnel mix, and other personnel-related expenses. In the fourth quarter, other expenses increased by SKr 10 million related to provisions made to cover ongoing disputes with suppliers.
Product development expenditure
Product development expenditure for the year amounted to SKr 187 million (190). Capitalized product development reached SKr 122 million (125), whereas amortization of previously capitalized product development amounted to SKr 146 million (139). Personnel numbers and efficiency
The average number of employees was generally unchanged, amounting to 2,646. The headcount for product development at the end of the year was 481 (502), of whom 329 (321) worked at the development center in Sri Lanka.
Net revenue per employee increased by 7% during 2007 to SKr 890,000 (835,000). Personnel-related expenses per employee amounted to SKr 537,000 (511,000), an increase of 5%.
The number of employees at year-end was 2,627 (2,630).
Global Reports LLC

BOARD OF D IRECTORS ’ REPORT
Industrial and Financial Systems, IFS AB (publ) – Corporate identity number 556122-0996 15
EBIT
EBIT amounted to SKr 141 million, an improvement of 18% compared with 2006. Provisions of SKr 10 million related to two disputes had a negative impact on EBIT. EBIT before amortization and depreciation but after reversal of capitalized development expenditure and adjusted for one-time items consisting of severance costs and capital gains and losses, i.e. adjusted EBITDA, reached SKr 206 million, corresponding to a margin of 9%. Profit for the Year
Net financial items improved by SKr 33 million to SKr -12 (-45) million. Adjusted for exchange rate effects, the underlying net financial items amount to SKr -17 (-37) million. The conversion and maturity of convertible debentures/bonds during 2007 reduced financial costs related to the convertible debentures/bonds by SKr 18 million.
With IFS recording three consecutive years with positive pre-tax results each quarter, activated deferred tax claims have been re-evaluated. The total net effect on profit for the year is SKr 58 (184) million, mainly as a result of deficit deduction. Profit before tax improved to SKr 129 (75) million, with profit for the year decreasing to SKr 122 (246) million. EMEA SKr, million 2007 2006 Change
License revenue 325 247 32%
Maintenance and support revenue 467 432 8%
Consulting revenue 921 858 7%
Net revenue 1 723 1 556 11%
EBIT 449 420 7%
Number of employees at the end of the period 1 241 1 124 10% The region, accounting for 73% of IFS net revenue in 2006, consists of operations in Europe (excluding Eastern Europe), the Middle East, India and Africa, as well as consulting operations in Sri Lanka, and is represented in 20 countries, of which independently owned partners account for 5. The joint venture company, IFS Defence Ltd, owned 50/50 with BAE Systems, is also included in the region.
The region consists of mature markets, e.g. operations in Scandinavia, as well as markets showing high growth and/or growth potential, e.g. in the Middle East, India, and IFS Defence.
EMEA increased its revenue by 11% compared with 2006, primarily as a result of increasing product revenue. License revenue increased substantially in Benelux, France and the U.K. Operations in the Nordic region also displayed positive trends as a consequence of higher consulting revenue toward the end of the year. Operations in the Middle East reported lower net revenue, but comparison with 2006 is affected by the number of very large contracts signed in that year. License sales in IFS Defence did not meet expectations because license contracts were delayed. However, the volume of ongoing sales
continues to be large, and IFS Defence is the preferred vendor in a number of major defense projects.
Consulting operations were strengthened considerably toward the end of the year, with higher levels of invoicing and better margins driven by strong license sales and an increase in utilization and billing rates. The negative effects of problem-atic projects in the Nordic region and the high staff turnover decreased during the latter part of the year.
A total of 77 new customers were added, and 468 customers upgraded or expanded their existing solutions. New customers in 2007 include Neste Oil in Finland, Saab Microwave Systems in Sweden within aerospace and defense, Heerema Fabrication Group in Holland and Wellstream in the U.K. within construction, contracting and service management in the oil and gas industry, and the National Hydroelectric Power Corporation, a significant breakthrough in the energy and utilities industry in India. Americas SKr, million 2007 2006 Change
License revenue 72 97 -26%
Maintenance and support revenue 107 103 4%
Consulting revenue 161 186 -13%
Net revenue 340 388 -12%
EBIT 109 104 5%
Number of employees at the end of the period 209 224 -7% The region, which accounted for 15% of IFS net revenue in 2007, consists of operations in the U.S.A., Canada and Latin America and is represented in five countries, of which independently owned partners account for three. The vast majority of the outcome in the region relates to the US market.
Operations in Americas have undergone a substantial improvement in recent years, although net revenue for 2007 was lower, mainly because of contract postponements in the defense industry. The volume of ongoing sales in the defense sector has increased considerably, however, due in part to the increase in publicity related to ongoing implementation projects for the US Air Force. The increased activity in the defense industry has led to a growing interest in collaborating with IFS, and new alliances were established with corporations such as CSC, Booz Allen Hamilton and SAIC.
Revenue was negatively affected by exchange rate effects. The organic decrease in net revenue was 5%. As a result of successful cost containment, however, earnings improved, increasing by 13% adjusted for exchange rate effects.
A total of 37 customers were added and 189 customers either upgraded or expanded their existing solutions. New customers in 2007 include Clancy Group and Tindall Corporation within constructing, contracting and service management, Hecla Mining in the process industry, and Sevens Seas Water and Horizon Utilities. The latter contract is IFS’ first energy and utilities customer in the U.S.A.
Global Reports LLC

BOARD OF D IRECTORS ’ REPORT
16 Industrial and Financial Systems, IFS AB (publ) – Corporate identity number 556122-0996
Rest of the World SKr, million 2007 2006 Change
License revenue 80 87 -8%
Maintenance and support revenue 83 64 30%
Consulting revenue 110 95 16%
Net revenue 282 251 12%
EBIT 5 -8 n/a
Number of employees at the end of the period 387 463 -16% The region, which accounted for 12% of IFS net revenue in 2007, consists of operations in Asia Pacific and Eastern Europe, with representation in 25 countries, of which independently owned partners account for 10.
Net revenue in the region increased during the year as a result of an increase in maintenance, support and consulting revenue in Eastern Europe, primarily in Poland, Russia, and the Czech Republic. During the year actions were taken in Asia Pacific to simplify organizational structures and reduce cost levels. These actions had a negative impact on earnings for the year. Despite this, earnings in Rest of the World improved thanks to positive developments mainly in Poland and Russia.
In all, 64 customers were added in the region, and 121 customers either upgraded or expanded their existing solutions. New customers included Varz-400 from Russia in the aerospace and defense industry, AB Equipment from New Zealand and Transsystems SA from Poland in the engineering industry, KVK from Turkey in the retail and wholesale industry, and Hornonitrianske bane Prievidza from Slovakia in the process industry. Product Development
The Group’s product development is carried out mainly in its development centers in Sri Lanka and Sweden. During the fall, the new version of IFS Applications and an entirely new user interface, Aurora, were launched at the IFS World Conference for customers, business analysts, and partners. The World Conference was held in Berlin October 14–17 and attracted more than 1,000 attendees. The new version, IFS Applications 7.5, is the result of more than 600, 000 development hours and offers enhanced support for global operations, including the ability to use one code base for all the major markets in the world and additional functionality for project-based companies.
Aurora is a new innovative user interface for enterprise applications that adapts itself to what users need and the way they work. Aurora is a completely new experience in which an ergonomic design, a built-in search engine and multi-media functionality simplify the use of enterprise applications and increase productivity. The new technology is the result of IFS’ long-term development work that aims to make business software easier and more efficient to use in order to increase customer benefits. The first customers have already been running IFS Applications 7.5 since January 2008, and deliveries of Aurora will commence in the second half of 2008.
Partners
In 2007, efforts increased to establish new partnerships and enhance collaboration with existing partners. The aim was to increase the agility of the consulting operations and widen the network of partners in order to improve IFS’ presence in various markets and add complementary products and technologies. Marketing and consulting collaboration with Logica/VM-data was expanded in Scandinavia, and an alliance was formed with Tata consultancy Services in asset manage-ment and service management. Product collaboration was initiated with Savi Technology in logistics and with Profit Base in business intelligence. In addition, a product and marketing collaboration was established with Centric to supply enter-prise applications to European retailers. This partnership will enable IFS to reach a large new market without major invest-ments in product development. Moreover, an alliance was entered into with Ides to deliver enhanced lifecycle manage-ment to organizations in the energy and utilities industry, and product collaboration was begun with ClickBase in respect of business intelligence and with Pagero for e-invoicing. The partnership with Pagero is an example of IFS’ efforts to help customers reduce their environmental impact. In the U.S.A., new and deeper collaboration was established with companies such as CSC, Booz Allen Hamilton and SAIC in the aerospace and defense industry. Cash Flow, Liquidity, and Financial Position
Cash flow from current operations before change in working capital amounted to SKr 283 (227) million. Tied working capital increased by SKr 109 million compared with the closing position in 2006, which is primarily attributable to delays in customer payments in certain projects. As a result, outstanding receivables were higher than normal at year-end. Days of sales outstanding (DSO) at year-end was 94 (84) days. DSO calculated on the monthly receivables positions during the year was 69 (67) days.
Investments totaled SKr 154 (166) million. Product development expenditure was capitalized in an amount of SKr 122 (125) million. Cash flow after investments amounted to SKr 20 (86) million. Cash flow from financing operations amounted to SKr -140 (-16) million. Loans from credit institutions decreased by SKr 126 million during the year.
Liquid funds on December 31, 2007, totaled SKr 254 (372) million. The decrease reflects the amortization of loans.
The financial position strengthened, with a net cash position at year-end of SKr 75 (67) million, excluding convertible bonds and pension liabilities. Cash and unutilized lines of credit amounted to SKr 479 (405) million. External financing totaled SKr 213 (478) million, of which a booked liability for convertible bonds constituted SKr 34 (173) million.
During the year, convertible debentures/bonds correspond-ing to a nominal value of SKr 154 (47) million were converted to shares. In addition, SKr 3 million was repaid when the KV3B and KV4B convertibles debentures matured. The total
Global Reports LLC

BOARD OF D IRECTORS ’ REPORT
Industrial and Financial Systems, IFS AB (publ) – Corporate identity number 556122-0996 17
nominal value of outstanding convertible bonds at year-end was SKr 35 (192) million.
At the end of the year, the Parent Company entered into a new financial agreement with a duration of 2.5 years. CORPORATE GOVERNANCE
IFS Stock
The Parent Company is listed on the OMX Nordic Exchange, Stockholm Mid-Cap list. The number of stockholders on December 31, 2007 was 10,439. The number of outstanding shares on December 31, 2007 was 263,466,657, of which 13,916,638 were Series A shares, carrying the right to 1.0 votes per share, and 249,550,019 Series B shares, which carry the right to 0.1 votes per share. The company has an outstanding convertible bond program which on full conversion will entail an increase in the number of shares of 6,627,003 Series B shares. The conversion price is SKr 5.25.
There is no limit to the number of votes a stockholder may cast at the AGM. The company is not aware of any agreements between stockholders that limit the right to transfer shares.
Three stockholders in the company, through direct or indirect holdings in the company, represent at least one tenth of the voting rights of the total number of shares. They are Gustaf Douglas and family, and associated companies, Bengt Nilsson, and associated companies, and Anders Böös, and associated companies.
The company’s pension trust does not exercise direct ownership of company stock.
The company is party to agreements that may be affected if a change in the control of the company occurs. Annual General Meeting of Stockholders
The annual general meeting of stockholders (AGM) shall elect the members of the board. Changes in the articles of association can be adopted by the AGM or an extraordinary meeting of stockholders.
The Annual General Meeting of Stockholders (AGM) held on March 28, 2007 resolved to re-elect all members of the board.
The AGM for 2008 will be held on April 3, in Solna. The nominations committee was announced in a press release on October 30, 2007, and comprises Gustaf Douglas, representing the Douglas family and associated companies, Caroline av Ugglas, representing Skandia, Ulf Strömsten, representing Catella Fonder, Bengt Nilsson, representing the founders, and Anders Böös in his capacity as chairman of the board.
The nominations committee’s proposals for the AGM for 2008 will be announced in connection with the official notice convening the AGM. Board and Management
Since the AGM of 2007, the board of directors of IFS has consisted of Anders Böös, Gregory Gorman, Ulrika Hagdahl, Bengt Nilsson, Jacob Palmstierna, Alastair Sorbie, and
Christina Stercken. Anders Böös is chairman of the board; Bengt Nilsson is deputy chairman.
Since March 10, 2006, Alastair Sorbie has been president and chief executive officer. Alastair Sorbie was previously responsible for the EMEA region and has been employed by IFS since 1997. The Board of Directors’ Work
IFS is not formally part of the group of companies included in the initial introduction of the Swedish Code of Corporate Governance. However, its ambition is to fulfill applicable parts of the code and its guidelines.
The work of the board of directors is conducted in accordance with the requirements of the Swedish Companies Act, the listing agreement of the Stockholm Stock Exchange, other rules and regulations relevant to the company, and operating procedures adopted by the board. A specific instruction regulates the division of tasks between the board and the president, the forms of financial reporting, and the president’s assignments and right to make decisions. Furthermore, the board establishes a finance policy that regulates risk related to financing, interest, liquidity, credit, and currency. It also determines an information policy that regulates the way in which IFS disseminates information. The operating procedures of the board, related instructions and the information policy are reviewed annually. Other instructions and principles are reviewed as required.
In accordance with the current operating procedures, the board shall meet at least six times per year (in addition to the constitutory meeting held after the AGM). Each ordinary meeting treats issues related to business and market development, adherence to the business plan and earnings, cash flow and financing, the current outlook, and acquisitions, divestment and pledged guarantees. One board meeting is dedicated mainly to strategic issues, and one is dedicated to the business plan and budget. Auditors participate in two board meetings per year. Furthermore, the board is regularly informed by the president concerning developments in IFS.
In 2007, the board met 10 times (2 of which were by correspondence) in addition to the constitutory meeting after the AGM. The work of the board in 2007 focused on managing IFS’ profitability issues, organizational structure, strategic position, and outlook. During the year, regional managers and other senior executives, according to a rolling schedule, have presented and discussed their areas of responsi-bility with the board.
The work of the board in 2007 was evaluated at a plenary session on the basis of an agenda established in advance. No external evaluation of the board was conducted during the year. Committee Work
The board has decided not to appoint separate compensation and audit committees.
Remuneration of the president is determined by the board as are the principles and earnings targets for variable
Global Reports LLC

BOARD OF D IRECTORS ’ REPORT
18 Industrial and Financial Systems, IFS AB (publ) – Corporate identity number 556122-0996
remuneration of the president and senior executives reporting to the president. Other remuneration of senior executives reporting to the president is determined in consultation with the chairman of the board, and information is subsequently provided to the other members of the board.
Audit issues are treated by the entire board. Normally, the board and IFS’ external auditors meet two times a year, in connection with the board meeting in September and at the year-end closing meeting in January. The meeting in September deals with specific items that are to be scrutinized, and the January meeting follows up the completed audit.
Förvaltnings AB Wasatornet, the principal owners of IFS, convenes the nominations committee, which, in addition to the chairman of the board, shall consist of a representative of the principal owners, a representative of each of the two largest institutional owners, and a representative of the other stockholders, who is elected from among the founders. Prior to an AGM that shall elect a board member and/or the chairman of the board and/or an auditor and/or resolve pertaining to remuneration of a board member and/or an auditor, the nominations committee shall prepare a resolution for the AGM in respect of such decisions. The nominations committee shall also propose a chairperson for the AGM.
In accordance with the present financial policy, IFS shall have a finance committee that ensures compliance with regulations and guidelines for handling financial risks in line with the finance policy adopted by the board. During the year, changes continued to be made and work was carried out to successively implement the finance policy. For this reason, no finance committee was appointed. External Audit
The auditors elected at the AGM in 2007 for a period of four years are Öhrlings Pricewaterhouse Coopers, represented by Lars Wennberg, as principal auditor and Nicklas Kullberg as co-responsible auditor.
Fees paid to Öhrlings Pricewaterhouse Coopers and other auditors for 2007 amounted to SKr 8 (11) million, of which SKr 1 (3) million pertains to other assignments. In addition to the external audit, the auditors have been engaged for certain advisory and analysis assignments. Guidelines for Remuneration of Members of the Board, the President, and Senior Executives
The chairman and members of the board are remunerated in accordance with the resolution adopted by the AGM. For 2007/2008, members of the board were paid SKr 2 million, of which the chairman received SKr 750,000, and the president, SKr 0.
Remuneration of the president and other senior executives consists of a basic salary, variable remuneration, other benefits, and pension contributions.
In 2007 the president had an annual basic salary of £210,000 and a premium-based pension with a premium corresponding to 15% of the basic salary. Variable remuneration shall not exceed 50% of the basic salary. The variable remuneration for 2007 was linked to the Group’s EBIT margin. As the targets
for 2007 were not met, no variable remuneration will be paid. For further information, please see Note 14. Resolution Concerning Guidelines for Remuneration of Senior Executives
The proposal of the board of directors, for adoption at the 2008 AGM, in respect of guidelines for remuneration of senior executives is the following.
The board of directors proposes that guidelines for remuneration of senior executives applied in previous years continue to apply, with the amendments and additions given below.
The board of directors proposes that variable remuneration of senior executives, including the president, be amended to enable it to comprise a maximum of 75% of basic salary. Variable remuneration for senior executives is not expected to exceed SKr 5,564 thousand for fiscal 2008.
At the 2008 AGM, the board of directors also intends to submit a proposal in respect of a subscription warrant plan that will enable senior executives in the Group to acquire subscription warrants. The acquisition of a subscription warrant at market price entitles to holder to obtain one subscription warrant without any consideration being paid. For employees outside Sweden, adjustments might be required to ensure compliance with particular regulations or market conditions. Compared with the current guidelines for remuneration of senior executives, it is proposed that the proposal concerning the guidelines, for adoption at the 2008 AGM, be amended to enable the above subscription warrant plan to be implemented. The total cost to the company (including social security fees) for warrants that are not acquired at market price is expected to amount to approxi-mately SKr 1 million. Stock Market Information, etc.
IFS issues information in accordance with the information policy established by the board.
The annual and quarterly reports are published in Swedish and English. Press conferences for analysts, brokers, and journalists were held in connection with the quarterly reports. In addition, information sessions and meetings are held regularly during the year with the media and the finance market.
Corporate governance information, the annual and quarterly reports, and press releases are available at www.ifsworld.com, where information can be ordered or subscribed for. The annual report for 2007 will not be distributed in printed form.
The board, management, and certain other senior executives who are registered as insiders may trade in shares according to current market praxis. No additional internal regulations exist. Financial Risk Management
In the course of its business, the Group is exposed to risk related to currency, financing and interest rates. Such risks and their management are described in Note 49 and in the section covering Risks and Uncertainties below.
Global Reports LLC

BOARD OF D IRECTORS ’ REPORT
Industrial and Financial Systems, IFS AB (publ) – Corporate identity number 556122-0996 19
Accounting Principles
The Group applies the IFRS accounting principles approved by the European Commission. No changes in accounting principles have been made during 2007 compared with those prevailing during the previous year. Risk and Uncertainties
In its operations IFS is confronted with certain risk elements that can to a greater or lesser extent have an impact on operational outcome. One such risk is the rapid technological development in the industry, which can create the need for more substantial technology changes at high cost. A further cause of uncertainty is the ability to attract and retain critical personnel resources, especially in a labor market in which the demand for and cost of attractive personnel are increasing. In addition to the above risks, IFS in its business is exposed to other operational risks and uncertainties e.g. in customer projects, dependence on certain suppliers and partners, and currency exposure.
IFS, through its use of component technology and by establishing internal processes and routines, considers that it has addressed such risks and taken measures to reduce and control them. As the Parent Company does not engage in operational activities, its risk is limited to foreign currency and liquidity. Outlook
The objective of IFS’ strategy is to maximize return on investment in an agile product, a global presence and cost-effective development resources. Economies of scale are achieved through industry alliances and partnerships in combination with its own sales efforts with the aim of building strong market positions within a limited number of industries with long-term, stable growth.
Financial stability and increased profitability will be achieved through an increase in the amount of recurring revenue and more flexible cost structures.
IFS believes that weaker economic trends will impact growth in the market for enterprise applications, which has been approximately 10% in recent years. The slower trends, however, will primarily affect the consumer market and have less of an impact on industries such as defense, contracting and service management, construction, and energy, in which IFS has much of its sales. In these industries, logistics, asset management, service management, and certain types of manufacturing are central processes. IFS has a strong position, a modern, competitive product with deep functionality, strong references and a large number of partners in these industries.
The conditions for continuing to increase product revenue with limited cost increases are deemed to be good. The target of the board of directors for 2008 is to increase EBIT and significantly improve cash flow. Additional Information
IFS is the subject of a number of disputes and claims that can be considered normal given the nature of its operations. In
addition to such disputes, two disputes exist that cannot be considered a normal aspect of the Group’s operations.
In Sri Lanka, IFS Sri Lanka and the members of its board of directors were sued by partners in a jointly owned company in 2002, who claim that breach of the articles of association and stockholders’ agreement has been committed. They also claim that IFS owes liabilities to IFS Sri Lanka, without stating a definite amount. IFS have disputed the claims, which they consider unfounded.
IFS has a special insurance policy for employees in the Nordic area who are temporarily stationed abroad to secure such individuals’ local Nordic pensions while they are abroad. This insurance policy was purchased via a Swedish insurance broker. According to IFS, this purchase is in breach of the stipulations made by IFS, as a result of which breach IFS was liable for payments for the pension plans of a number of individuals for a longer period than was intended. IFS considers the insurance broker to have acted in a negligent manner, thereby causing IFS damage as a consequence of increased payment liabilities. In December 2005, IFS initiated litigation against the insurance broker. Furthermore, in France and in the UK disputes with two customers have been brought to court proceedings. The Company assesses provisions made to be sufficient, but Company liquidity can be affected by the outcome of such claims. Parent Company
Parent Company, IFS AB, operations include certain corpo-rate management and finance functions as well as the manage-ment of stockholdings in subsidiaries and associated compa-nies. In 2007, net revenue amounted to SKr 18 (15) million, with earnings before tax of SKr 335 (-48) million. The figure includes a dividend of SKr 371 million (-) from a subsidiary, of which SKr 300 million is an anticipated dividend.
Net investments in stocks and shares amounted to SKr 48 (0) million, which consisted of a stockholders’ contribution of SKr 47 (7) million and a supplementary consideration of SKr 3 (-) million pertaining to previous acquisitions. Stock in IFS Central & Eastern Europe was divested internally to IFS Europe AB at a book value of SKr 2 million. Investments in machinery and equipment amounted to SKr 0 (0) million. On December 31, 2007, Parent Company liquid funds, including unutilized lines of credit, totaled SKr 248 (116) million, whereas Parent Company debt was SKr 141 (378) million, of which SKr 107 (144) million was to credit institutions, SKr 34 (173) million pertained to convertible bonds, and SKr 0 (61) million was related to intra-Group borrowing.
Stockholders’ equity in the Parent Company increased by SKr 509 million to SKr 1,607 million, of which unrestricted stockholders’ equity accounted for SKr 507 (59) million. The increase is chiefly attributable to the above-mentioned dividend from a subsidiary and the conversion of convertible debentures/bonds in an amount of SKr 144 million net, which increased capital stock by SKr 60 million and the share premium reserve under unrestricted equity by SKr 84 million.
At year-end, the Parent Company had 5 employees (5).
Global Reports LLC

BOARD OF D IRECTORS ’ REPORT
20 Industrial and Financial Systems, IFS AB (publ) – Corporate identity number 556122-0996
Proposed Disposition of Profits
The board of directors and the president propose the following funds, SKr 507 million, which are available for disposition, be allocated as follows: Dividend of SKr 0.10 per share to stockholders SKr 26 347 thousand Carried forward SKr 480 689 thousand Accumulated profit SKr 507 036 thousand Statement by the board of directors concerning the proposed dividend
The board presents the following reasons to demonstrate why the proposed dividend is in accordance with the provisions of Chapter 17 §3, sections 2 and 3 of the Swedish Companies Act.
The business conducted by the company does not entail risks over and above those that arise or can be expected to arise in the industry or the risks generally associated with doing business. Significant events are reported in the Board of Directors’ Report. Over and above these, no other events have occurred that affect the company’s ability to issue a dividend.
The financial position of the company and group as of December 31, 2007 is presented in the following balance sheets. The annual report also presents the principles applied when valuing assets, provisions, and liabilities.
The board proposes a dividend of SKr 0.10 per share, corresponding to a total amount of approximately SKr 26 million. The proposed dividend constitutes 1.6 percent of Parent Company stockholders’ equity and 2.3 percent of Group stockholders’ equity. Unrestricted equity in the Parent
Company amounted to SKr 507 million at the end of fiscal 2007. The board proposes that the record day for the dividend by Wednesday, April 11, 2008.
The Group asset/equity ratio is 48 percent. The proposed dividend does not jeopardize the completion of investments that have been deemed necessary.
The company’s financial position does not indicate any assessment other than that the company can continue to do business and that the company can be expected to fulfill its short-term and long-term commitments.
In view of the above and based on what the board is otherwise aware of, the board considers that a comprehensive assessment of the financial position of the company and Group justifies a dividend in accordance with Chapter 17, §3, sections 2 and 3 of the Swedish Companies Act, i.e. taking into consideration the requirements imposed by the nature, extent, and risks associated with doing business on the equity of the company and Group and considering the need of the company and Group to strengthen its balance sheet, liquidity and financial position in general. The financial reports were approved for issuance by the board of directors of the Parent Company on March 3, 2008.
Additional information on Group and Parent Company results and general position is available in the accompanying income statements, balance sheets, cash flow statement, and notes to the financial statements.
Global Reports LLC

F INANC IAL STATEMENTS
Industrial and Financial Systems, IFS AB (publ) – Corporate identity number 556122-0996 21
Consolidated income statement SKr, million Note 2007 2006
License revenue 3 478 433
Maintenance and support revenue 4 659 600
Consulting revenue 1 194 1 140
Other revenue 5 25 36
Net revenue 2 2 356 2 209
License expenses 6 -495 -472
Maintenance and support expenses -236 -223
Consulting expenses -1 008 -949
Other expenses -15 -29
Direct expenses -1 754 -1 673
Gross earnings 602 536
Development expenditure 9 -214 -208
Administration expenses -236 -204
Other operating revenue 7 12 19
Other operating expenses 8 -23 -23
Indirect expenses, net -461 -416
EBIT 11, 12, 13, 14, 15, 16 141 120
Result from participation in associated companies 18 1 1
Financial revenue 19 12 5
Financial expenses 20 -25 -51
Financial net -12 -45
Profit/loss before tax 129 75
Taxes 21 -7 171
Profit/loss for the year 22 122 246
Profit/loss for the year is allocated as follows:
Parent Company stockholders (SKr million) 122 246
Minority interest (SKr million) 0 0
Profit/loss per share pertaining to Parent Company stockholders, before dilution (SKr) 22 0.48 1.07
Profit/loss per share pertaining to Parent Company stockholders, after dilution (SKr) 22
Number of shares (thousands)
On December 31 263 467 233 366
On December 31, after full dilution 270 094 270 709
Average for the period 253 919 229 622
Average for the period, after full dilution 270 337 270 709
Global Reports LLC

F INANC IAL STATEMENTS
22 Industrial and Financial Systems, IFS AB (publ) – Corporate identity number 556122-0996
Consolidated balance sheet – assets SKr, million Note Dec 31, 2007 Dec 31, 2006
Capitalized expenditure for product development 476 497
Goodwill 232 219
Other intangible fixed assets 14 12
Intangible fixed assets 23 722 728
Tangible fixed assets 24, 25 79 83
Participations in associated companies 27 2 7
Participations in other companies 1 2
Deferred tax receivables 29 306 291
Other long-term receivables 30 30 14
Financial fixed assets 339 314
Fixed assets 1 140 1 125
Inventories 0 0
Accounts receivable 31 759 633
Current tax receivable 19 15
Other receivables 32 139 160
Liquid assets 33 254 372
Current assets 1 171 1 180
Assets 2 311 2 305
Global Reports LLC

F INANC IAL STATEMENTS
Industrial and Financial Systems, IFS AB (publ) – Corporate identity number 556122-0996 23
Consolidated balance sheet – equity and liabilities SKr, million Note Dec 31, 2007 Dec 31, 2006
Capital stock 527 467
Other capital contributed 677 593
Reserves -29 -14
Accumulated loss, including profit/loss for the year -58 -180
Stockholders' equity pertaining to Parent Company stockholders 1 117 866
Minority interest 0 0
Stockholders' equity 34 1 117 866
Convertible debentures/bonds 35, 37 - 108
Liabilities to credit institutions 36, 37 33 151
Pension obligations 38 44 60
Deferred tax liabilities 29 7 5
Other provisions and other liabilities 39 23 14
Long-term liabilities 107 338
Accounts payable 131 151
Current tax liabilities 15 11
Convertible debentures/bonds 35, 37 34 65
Liabilities to credit institutions 36, 37 146 154
Current portion of restructuring reserve 39 2 4
Other liabilities 40 759 716
Current liabilities 1 087 1 101
Liabilities 1 194 1 439
Stockholders' equity and liabilities 2 311 2 305
Information of pledged assets and contingent liabilities, see note 42 and 43.
Global Reports LLC

F INANC IAL STATEMENTS
24 Industrial and Financial Systems, IFS AB (publ) – Corporate identity number 556122-0996
Consolidated capital account
SKr, million Note
34
Capital
stock
Other
contributed
capital Reserves
Accumulated
loss, incl.
profit/loss for
the year
Equity
pertaining to
shareholders
of the parent
company
Minority
interest
Total
stockholders'
equity
Amount on January 1, 2006 448 572 20 -426 614 1 615
Change in translation difference - - -34 - -34 - -34
Net income/expense recognised directly in equity - - -34 - -34 - -34
Profit/loss for the year - - - 246 246 0 246
Total recognised income/expense for 2006 - - -34 246 212 0 212
Change in minority interest - - - - - -1 -1
Rights issue—Premature redemption of conv. deb. 18 29 - - 47 - 47
Ongoing rights issue—Premature redemption of conv. deb. 1 0 - - 1 - 1
Issue expenses - -8 - - -8 - -8
Amount on December 31, 2006 467 593 -14 -180 866 0 866
Change in translation difference - - -15 - -15 - -15
Net income/expense recognised directly in equity - - -15 - -15 - -15
Profit/loss for the year - - - 122 122 - 122
Total recognised income/expense for 2007 - - -15 122 107 - 107
Change in minority interest - - - - - 0 0
Rights issue—Premature redemption conv. deb., gross 60 93 - - 153 - 153
Issue expenses - -9 - - -9 - -9
Rights issue—Premature redemption conv. deb., net 60 84 - - 144 - 144
Amount on December 31, 2007 527 677 -29 -58 1 117 0 1 117
Global Reports LLC

F INANC IAL STATEMENTS
Industrial and Financial Systems, IFS AB (publ) – Corporate identity number 556122-0996 25
Consolidated statement of cash flows SKr, million Note 2007 2006
CURRENT OPERATIONS
Profit/loss after net financial items 129 75
Adjustments for items not included in the cash flow, etc. 44 172 160
Income tax paid -18 -8
Cash flow from operations before change in working capital 283 227
CHANGE IN WORKING CAPITAL
Change in inventory 0 1
Change in current receivables -134 -73
Change in current non-interest-bearing liabilities 25 97
Change in working capital -109 25
Cash flow from current operations 174 252
INVESTMENT OPERATIONS
Acquisition of subsidiaries 45, 46 -14 -5
External sale of subsidiaries/operations 47 11 0
Acquisition of intangible fixed assets -127 -138
Divestment of intangible fixed assets - 0
Acquisition of tangible fixed assets 48 -18 -23
Divestment of tangible fixed assets - 2
Change in long-term receivables -6 -2
Cash flow from investment operations -154 -166
Cash flow after investment operations 20 86
FINANCING OPERATIONS
Redemption of convertible debenture 35 -3 -
Raising of loans from credit institutions, net 36 73 21
Amortization of liability to credit institutions 36 -203 -47
Deposit -6 -
Change in other long-term liabilities -1 10
Cash flow from financing operations -140 -16
Cash flow for the year -120 70
LIQUID FUNDS
Liquid funds on January 1 372 319
Exchange rate differences in liquid funds 2 -17
Liquid funds on December 31 33 254 372
Global Reports LLC

F INANC IAL STATEMENTS
26 Industrial and Financial Systems, IFS AB (publ) – Corporate identity number 556122-0996
Income statement of the parent company SKr, million Note 2007 2006
Net revenue 5 18 15
Administration expenses -35 -28
Other operating revenue 7 0 -
Other operating expenses 8 0 0
EBIT 10, 12, 13, 14, 15, 16 -17 -13
Result from participation in subsidiaries 17 375 0
Result from participation in associated companies 18 - 1
Financial revenue 19 77 109
Financial expenses 20 -100 -145
Profit/loss before tax 335 -48
Tax on profit/loss for the year 21 8 8
Profit/loss for the year 343 -40
Global Reports LLC

F INANC IAL STATEMENTS
Industrial and Financial Systems, IFS AB (publ) – Corporate identity number 556122-0996 27
Balance sheet of the parent company – assets SKr, million Note Dec 31, 2007 Dec 31, 2006
FIXED ASSETS
Intangible fixed assets 23 0 0
Tangible fixed assets 24 0 0
Participations in subsidiaries 26 978 930
Receivables in subsidiaries 28 40 39
Participations in associated companies 27 - 5
Other securites held as fixed assets 1 1
Deferred tax receivables 29 92 93
Other long-term receivables 30 5 2
Financial fixed assets 1 116 1 070
Fixed assets 1 116 1 070
CURRENT ASSETS
CURRENT RECEIVABLES
Receivables in subsidiaries 698 503
Other receivables 0 1
Prepaid expenses and accrued revenue 7 9
Current receivables 705 513
Cash and bank balances 33 29 116
Current assets 734 629
Assets 1 850 1 699
Global Reports LLC

F INANC IAL STATEMENTS
28 Industrial and Financial Systems, IFS AB (publ) – Corporate identity number 556122-0996
Balance sheet of the parent company – equity and liabilities SKr, million Note Dec 31, 2007 Dec 31, 2006
STOCKHOLDERS' EQUITY
RESTRICTED STOCKHOLDERS' EQUITY
Capital stock 527 467
Restricted reserves 573 572
Restricted stockholders' equity 1 100 1 039
UNRESTRICTED STOCKHOLDERS' EQUITY
Share premium reserve 104 20
Retained earnings/accumulated loss 60 79
Profit/loss for the year 343 -40
Unrestricted stockholders' equity 507 59
Stockholders' equity 34 1 607 1 098
PROVISIONS
Provisions for pensions and similar commitments 37 1 1
Provisions 1 1
LONG-TERM LIABILITIES
Convertible debentures/bonds 35, 37 - 108
Liabilities to credit institutions 36, 37 26 133
Long-term liabilities 26 241
CURRENT LIABILITIES
Convertible debentures/bonds 35, 37 34 65
Liabilities to credit institutions 36, 37 81 11
Accounts payable 10 12
Laibilities to subsidiaries 79 258
Other current liabilities 2 1
Accrued expenses and prepaid revenue 41 10 12
Current liabilities 216 359
Stockholders' equity and liabilities 1 850 1 699
MEMORANDUM ITEMS
Pledged assets 42 972 800
Contingent liabilities 43 107 94
Global Reports LLC

F INANC IAL STATEMENTS
Industrial and Financial Systems, IFS AB (publ) – Corporate identity number 556122-0996 29
Capital account of the parent company
SKr, million Note 34
Capital
stock
Reserve
fund Total
Premium
fund
Earnings
carried
forward Total
Total
stockholders'
equity
Amount on Jan 1, 2006 according to adopted balance sheet 448 572 1 020 0 60 60 1 080
Profit/loss for the year - - - - -40 -40 -40
Group contributions received - - - - 35 35 35
Group contributions given - - - - -8 -8 -8
Decrease in tax receivable carried fwd relating to Group contribution - - - - -8 -8 -8
Rights issue—Premature redemption of conv. debentures 18 - 18 20 - 20 38
Rights issue—Premature redemption of conv. debentures, ongoing 1 - 1 0 - 0 1
Amount on December 31, 2006 467 572 1 039 20 39 59 1 098
Profit/loss for the year - - - - 343 343 343
Group contributions received - - - - 30 30 30
Transfer to statutory reserve - 1 1 - -1 -1 0
Decrease in tax receivable carried fwd relating to Group contribution - - - - -8 -8 -8
Rights issue—Premature redemption of conv. debentures, gross 60 - 60 93 - 93 153
Issue expenses - - - -9 - -9 -9
Rights issue—Premature redemption of conv. debentures, net 60 - 60 84 - 84 144
Amount on December 31, 2007 527 573 1 100 104 403 507 1 607
RESTRICTED EQUITY UNRESTRICTED EQUITY
Global Reports LLC

F INANC IAL STATEMENTS
30 Industrial and Financial Systems, IFS AB (publ) – Corporate identity number 556122-0996
Statement of cash flows of the parent company SKr, million Note 2007 2006
CURRENT OPERATIONS
Profit/loss after net financial items 335 -48
Adjustments for items not included in the cash flow, etc. 44 -366 27
Cash flow from operations before change in working capital -31 -21
CHANGES IN WORKING CAPITAL
Change in current receivables -19 -7
Change in current non-interest-bearing liabilities -2 -9
Change in working capital -21 -16
Cash flow from current operations -52 -37
INVESTMENT OPERATIONS
Acquisition of tangible fixed assets 48 0 0
Divestment of tangible fixed assets - 0
Change in net receivables in subsidiary 63 7
Change in long-term receivables -43 -3
Cash flow from investment operations 20 4
Cash flow after investment operations -32 -33
FINANCING OPERATIONS
Redemption of convertible debenture 35 -3 -
Raising of loans from credit institutions 36 68 15
Amortization of liability to credit institutions 36 -108 -22
Change in other long-term liabilities -12 -10
Cash flow from financing operations -55 -17
Cash flow for the year -87 -50
LIQUID FUNDS
Liquid funds on January 1 116 166
Liquid funds on December 31 33 29 116
Global Reports LLC

NOTES TO THE F INANC IAL STATEMENTS
Industrial and Financial Systems, IFS AB (publ) – Corporate identity number 556122-0996 31
Notes to the financial statements NOTE 1 – ACCOUNTING PRINCIPLES
GROUP ACCOUNTING PRINCIPLES
Registered Office, etc
Industrial and Financial Systems, IFS AB (publ), corporate identity number 556122–0996, has its registered office in Linköping, Sweden, which is also corporate headquarters. The address of the head office is Teknikringen 5, 583 30 Linköping, Sweden.
IFS is a leading supplier of component-based enterprise applications developed using open standards and service-oriented architecture (SOA). By offering agile business solutions IFS improves its customers’ ability to make correct decisions and more efficiently manage their business. Conformity with Norms and Legislation
The consolidated accounts have been prepared in accordance with the International Financial Reporting Standards (IFRS) issued by the International Accounting Standards Board (IASB), and the interpretations issued by the International Financial Reporting Interpretations Committee (IFRIC) as approved by the European Commission for application within the European Union. Moreover, the Swedish Annual Report Act and Recommendation RR 30:06, Supplementary Accounting Principles for Companies, of the Swedish Financial Accounting Standards Council have been applied.
The Parent Company has prepared its annual report in accordance with the Swedish Annual Report Act and Recommendation RR 32:06 of the Swedish Financial Accounting Standards Council.
The Parent Company applies the same accounting principles as the Group, except in the cases detailed below in the section entitled ‘Parent Company Accounting Principles’. The variations existing between Parent Company and Group accounting principles are due to the limitations to applying the IFRS in the Parent Company as a result of the Swedish Annual Report Act and the Swedish Act on Safeguarding of Pension Commitments, and in certain cases for tax reasons.
The annual report and the consolidated accounts were approved for release by the board of directors on March 3, 2008. The consolidated income statement and balance sheet and the Parent Company income statement and balance sheet will be presented for adoption by the annual general meeting of stockholders on April 3, 2008. Functional Currency and Presentation Currency
The functional currency is the currency in the primary financial environments in which Group subsidiaries conduct their business. The companies included in the Group are the Parent Company, subsidiaries, associated companies, and joint venture companies.
The Parent Company’s functional currency is the Swedish krona (SKr), which is also the presentation currency for the Parent Company and the Group. Therefore the financial reports are presented in Swedish krona. All amounts, unless otherwise stated, are rounded off to the nearest million. Estimates and Critical Assumptions in the Financial Reports
To present the financial reports in accordance with the IFRS, the management and board of IFS must make certain estimates and assumptions that affect the application of the accounting principles and the reported amounts pertaining to assets and liabilities, revenue and expenses. Actuals may differ from the estimates.
The estimates and assumptions are regularly reviewed. Changes in estimates are reported in the period in which the change is made if the change affects only that period, or in the period in which the change is made and future periods if the change affects both the current and future periods. Assessments made by the management related to the application of the IFRS that have a significant impact on the financial reports and estimates that may entail significant adjustments in the financial reports of subsequent years pertain to the following areas: • Revenue recognition • Valuation of unsecured receivables • Valuation of goodwill and capitalized expenditure for
product development • Valuation of deferred tax claims • Restructuring measures • Valuation of convertible debentures/bonds • Provisions for pensions, taxes, legal disputes, and
contingent liabilities
Changes in Accounting Principles
The Group accounting principles listed below have been consistently applied to all periods presented in the Group’s financial reports, unless otherwise stated. Group accounting principles have been consistently applied to the accounts and consolidation of the Parent Company, subsidiaries, associated companies, and joint venture companies.
New standards, recommendations and interpretations have been published and have been mandatory as of 2007. The following new standards have been applied when preparing the financial statements for 2007: • IFRS 7, Financial Instruments: Disclosures and the related
changes to IAS 1, Presentation of Financial Reports, require extensive information on the significance of financial instruments for a company’s financial position and performance as well as qualitative and quantitative information about the character and extent of risks. IFRS 7 and the related changes to IAS 1 have resulted in additional
Global Reports LLC

NOTES TO THE F INANC IAL STATEMENTS
32 Industrial and Financial Systems, IFS AB (publ) – Corporate identity number 556122-0996
information in the Group’s financial statements for 2007 with respect to the Group’s financial targets and cash management. The standard has not entailed a change in accounting principles, merely certain changes in information requirements in respect of financial instruments.
• IFRIC 7, Applying the Restatement Approach under IAS 29 Financial Reporting in Hyperinflationary Economies. The interpretation is mandatory as of fiscal 2007 and has been deemed not to have any effect on the Group’s financial statements as the Group is not currently conducting business in countries in which the transition to financial reporting in hyperinflationary economies is necessary.
• IFRIC 8, Scope of IFRS 2. IFRIC 8 will be applied retroactively to the Group’s financial statements for 2007. According to IFRIC 8, the regulations in IFRS 2 cover goods and services obtained in exchange for equity instruments even if some or all of such goods or services cannot be specifically identified. The interpretation does not apply to the Group as such transactions are not carried out.
• IFRIC 9 Reassessment of Embedded Derivatives determines that an assessment of whether embedded derivatives shall be separated from the host contract can only be made if the terms of the host contract are changed. IFRIC 9 shall be applied as of fiscal 2007, but is not expected to substantially impact the Group’s financial reports.
• IFRIC 10 Interim Financial Reporting and Impairment prohibits the reversal of an impairment loss recognized in a previous interim report in respect of goodwill, an investment in an equity instrument or in a financial asset carried at cost. IFRIC 10 will be applied in the Group’s financial reports in 2007. The interpretation will be applied prospectively from the point at which the Group began to apply the impairment regulations in IAS 36 and the fair value regulations in IAS 39 viz., January 1, 2004 in respect of goodwill, and January 1, 2005, in respect of financial instruments. As no such reverses were made, the interpretation will not impact the Group’s financial reports.
• Amendment to IAS 23, Borrowing Costs, stipulates the capitalization of borrowing costs that are directly attributable to the acquisition, construction or production of assets that require a substantial period of time to prepare for their intended use or sale. The amendment is to be applied during fiscal years that commence on January 1, 2009 or later. Earlier application is permissible. The amendment does not affect the Group as this principle has been applied for many years.
New IFRS and Interpretations not yet Applied
A number of new standards, amendments to standards and interpretations will not come into force until fiscal 2008 or later and have not been applied to the preparation of these financial reports:
• IFRS 8, Operating Segments. The standard is mandatory for annual financial statements for periods beginning on or after January 1, 2009. The standard applies to the separation of a company’s business into different segments. The standard requires a company to identify reportable segments by taking its starting point in its internal reports. The Group’s preliminary assessment is that additional segments will be presented in the annual report for 2009.
• IFRIC 11 – IFRS 2, Group and Treasury Shares Transactions. The interpretation came into force on March 1, 2007, and is mandatory for annual financial statements beginning after that date. The interpretation provides guidance on the classification of share-based payments in circumstances in which a company buys its own equity to settle its obligations and on how to report stock options programs in subsidiaries applying the IFRS. The Group will apply IFRIC as of January 1, 2008, but this is not expected to affect the Group’s financial statements.
• IFRIC 12, Service Concession Arrangements. The interpretation applies to all fiscal years beginning on January 1, 2008 or later. The interpretation addresses the issue of how service concession operators should report assets as well as the obligations and right resulting from the arrangement. The interpretation will not affect the Group’s financial statements.
• IFRIC 13, Customer Loyalty Programs addresses the manner in which a company accounts for and values its obligation to provide free or discounted goods to customers who redeem award credits. The interpretation is mandatory for fiscal years beginning on July 1, 2008 or later. The interpretation is not expected to have a significant effect on the Group’s financial statements.
• IFRIC 14, IAS 19, The Limit on a Defined Benefit Asset, Minimum Funding Requirements and their Interaction. The interpretation provides guidance on how minimum funding requirements interact with the IAS 19 limit on a defined benefit asset. The interpretation is mandatory for fiscal years beginning on January 1, 2008 or later. The interpretation is not expected to affect the Group’s financial statements.
Segment Reporting
A segment may consist of geographic areas that offer products and services in an economic environment that is exposed to risks and opportunities that differ from those that apply to other geographical regions.
A segment may also be a business area, which is a group of assets and operations that provides products or which is exposed to risks and opportunities that differ from those in other business areas.
Geographic areas constitute the Group’s primary segment. The Group does not report secondary segments as there is
only one line of business, the sale and implementation of IFS Applications.
Global Reports LLC

NOTES TO THE F INANC IAL STATEMENTS
Industrial and Financial Systems, IFS AB (publ) – Corporate identity number 556122-0996 33
Classifications, etc.
Tangible assets and long-term liabilities in the Parent Company and Group consist in essence of sums that are expected to be recovered or paid later than 12 months after the balance sheet date.
Current assets and current liabilities in the Parent Company and Group consist in essence of sums that are expected to be recovered or paid within 12 months of the balance sheet data. Consolidated Accounting Principles
Subsidiaries
Subsidiaries are companies in which the Parent Company has a controlling interest. A controlling interest entails a direct or indirect right to form a company’s financial and operational strategies for the purpose of gaining financial benefits. When assessing whether a controlling interest exists, potential shares with voting rights that can be utilized without delay shall be taken into account.
The purchase method is used to report on Group subsidiaries. According to this method, the acquisition of a subsidiary is considered a transaction through which the Group indirectly acquires the subsidiary’s assets and assumes its liabilities and contingent liabilities. Initially, the valuation is set at the fair value on the acquisition day regardless of the extent of minority interest that may exist. The consolidated acquisition value is established by means of an acquisition analysis in connection with the acquisition of the business. The analysis establishes the acquisition value of the shares or business, and the fair value of acquired identifiable assets and assumed liabilities and contingent liabilities. The difference between the acquisition value of shares in subsidiaries and the fair value of acquired assets, assumed liabilities and contingent liabilities constitutes the consolidated goodwill. If the acquisition value is less than the fair value of the acquired company’s net assets, the difference is reported directly in the income statement.
The financial reports of subsidiaries are included in the consolidated accounts as of the day the controlling interest is transferred to the Group, i.e. on acquisition. They are excluded from the consolidated accounts as of the day the controlling interest no longer exists. Associated companies
Associated companies are those in which the Group has a significant, but not controlling, interest in the operational and financial management, generally through a holding of 20–50% of the voting rights. From the point in time at which the significant interest is acquired, the interest in the associated company is reported in the consolidated accounts pursuant to the equity method. According to this method, the value of the shares in the associated companies reported in the consolidated accounts corresponds to the Group’s interest in the associated companies’ stockholders’ equity, the consolidated goodwill, and other residual values that might exist in the consolidated fair value adjustments. In the Group
income statement, the Group’s share in the associated companies’ net earnings after tax and minority interest adjusted for depreciation, write-downs and resolution of acquired fair value adjustments is reported under ‘Participations in associated companies’. Dividends obtained from the associated company reduce the reported value of the investment.
On acquisition, any differences between the acquisition value of the holding and the owner’s share of the net fair value of the associated company’s identifiable assets, liabilities and contingent liabilities are reported in accordance with IFRS 3, Business combinations.
When the Group’s share of reported losses in the associated company exceeds the reported value of the shares in the Group, the value of the shares is reduced to zero. Deductions for losses are also made against unsecured long-term financial transactions, which in their economic substance constitute part of the owning company’s net investment in the associated company. Further losses are not reported unless the Group has undertaken to cover losses arising in the associated company. The equity method is applied until the significant interest ceases to exist. Joint ventures
For accounting purposes, joint ventures are companies in which the Group has entered into collaboration agreements with one or several parties to share a controlling interest in their operational and financial management. In the consolidated accounts, holdings in joint ventures are reported according to the principle of proportional consolidation, whereby the Group’s share of the joint venture’s assets, liabilities, revenue and expenses, is reported in the Group’s balance sheet and income statement. To do so, the joint owner’s share of assets, liabilities, revenue and expenses in a joint venture is combined item by item with corresponding items in the joint owners’ consolidated accounts. Only stockholders’ equity accruing after acquisition is reported in the Group’s stockholders’ equity. The proportional consolidation principle is applied from the point in time at which the joint controlling interest is obtained until it ceases to exist. Transactions to be eliminated on consolidation
Intra-Group receivables and payables, revenue or expenses, and unrealized profits or losses arising from intra-Group transactions between subsidiaries are eliminated in their entirety when the consolidated accounts are prepared.
Unrealized profits arising from transactions with associated companies and jointly controlled companies are eliminated to an extent corresponding to the Group’s share of the ownership of the company. Unrealized losses are eliminated in a similar fashion to unrealized profits, but only if there is no indication that a write-down is required.
Global Reports LLC

NOTES TO THE F INANC IAL STATEMENTS
34 Industrial and Financial Systems, IFS AB (publ) – Corporate identity number 556122-0996
Foreign Currency
Transactions in foreign currencies
Foreign currency transactions are translated to the functional currency at the exchange rate applying on the transaction day. Monetary assets and liabilities in foreign currency are translated to the functional currency at the rate prevailing on the balance sheet day. Exchange rate differences resulting from translations are reported in the income statement.
Exchange rate gains/losses on current assets/liabilities are reported under other revenue/expenses, and exchange rate gains/losses on financial assets and liabilities are reported under financial revenue/expenses. Non-monetary assets and liabilities reported at their historical acquisition value are translated at the exchange rate applying on the transaction day. Non-monetary assets and liabilities reported at fair value are translated to the functional currency at the rate applying at the time the fair value was established.
Exchange rate fluctuations are reported in the same fashion as other changes in value in respect of assets or liabilities. Financial reports in foreign entities
Assets and liabilities in foreign entities, including goodwill and other corporate fair value adjustments, are translated to Swedish currency at the rate applying on the balance sheet day. Revenue and expenses in foreign entities are translated to Swedish currency at the average rate that constitutes an approximation of the rates applying when the transaction occurred. Differences that arise when translating currency in foreign entities are reported immediately in stockholders’ equity as a translation reserve. Net investments in a foreign entity
The differences that occur in connection with translating a foreign net investment are reported directly in the translation reserve in stockholders’ equity. On disposal of a foreign entity, the cumulative translation difference relating to the entity, after deductions for currency hedges, where applicable, is realized in the Group’s income statement. The cumulative translation differences for foreign entities are presented as a separate capital category and include the translation differences accumulated as of January 1, 2004. The Group has decided to consider translation differences accumulated before January 1, 2004, as zero on transition to IFRS. Revenue Accounting
All Group revenue is reported at fair value after deductions for discounts, value-added tax (VAT), etc. License agreements for standard IFS software and third-party licenses are recognized as revenue when all of the following requirements are fulfilled: • The license agreement, without termination clauses, has
been signed and delivery has been made. • Price and payment terms are established, and there are no
other commitments apart from the license delivery. • Payment is likely and is due within six months.
License agreements that include undelivered components that are required for the functionality of the software are recognized in their entirety when the components have been delivered.
IFS software licenses sold via partners and distributors are recognized as income when sold to the final customer. The exception is sales to partners where IFS Applications is included as part of the partner’s total product offering and where IFS can be considered a supplier.
Maintenance revenue is the fees IFS customers pay for the right to upgrade software to new versions of IFS Applications and fees for customer support. These fees do not include consulting expenses for installation of updated software. Maintenance revenue is reported straight-line over the lifetime of the contract.
Consulting services and training related to implementation are reported separately from license revenue and are recognized as income as the services are supplied. The stage of completion of such services is determined by calculating time consumed. If services, such as extensive customization, are a requirement for the functionality of the software, and if the services are part of the total delivery, license revenue and revenue from services are recognized as income successively as delivery is made.
Consulting services are mainly carried out on account, whereby income is reported as the work is performed. Non-invoiced work is reported as a current asset under ‘Other receivables’ in the balance sheet. Work at fixed price is also reported as the work is performed, after reservation for loss risks.
Revenue from hardware sales is reported on delivery. Transfer Pricing
Fees due from sales companies to the product development company are based on a transfer pricing model applied for most subsidiaries in the Group based on the principle that the sales companies achieve a predetermined profit margin that is normal for comparable companies in the market. The method, called the Transactional Net Margin Method (TNMM), is a generally accepted model for transfer pricing. A profit margin of 4% for 2007 has been set for all subsidiaries. This principle is based on the fact that the product development company is the entrepreneur and has the highest risk exposure in the company. The following principles were applied to subsidiaries in Central and Eastern Europe: • License fee of 40% of revenue from the sale of application
licenses, after direct sales expenses. • Maintenance fee of 50% of application maintenance
revenue. • A general fee of 3% of revenue, after direct sales expenses
and other fees paid to the product development entity, to cover corporate expenses
Global Reports LLC

NOTES TO THE F INANC IAL STATEMENTS
Industrial and Financial Systems, IFS AB (publ) – Corporate identity number 556122-0996 35
In addition to the product development company in Sweden, there are several permanent product development centers, in Norway and Sri Lanka, among others. The product development company covers their actual expenses plus a general supplement of 10%. In certain projects, subsidiaries exchange consulting services with each other. These services are usually priced at a level slightly below the ordinary price a customer would pay the sales company. In addition to the transfer pricing described, cost of capital is invoiced on intra-Group transactions. Each subsidiary receives/pays interest from/to the Parent Company based on the respective country’s interest rate, with a supplement of 2.5 percentage points. Operating Expenses, and Financial Revenue and Expenses
Fees pertaining to operating leases
Fees pertaining to operating leases are reported in the income statement on a straight-line basis over the period of the lease. Benefits obtained on signing a lease are reported in the income statement as a reduction of the leasing fees on a straight-line basis over the term of the leasing agreement. Fees pertaining to finance leases
Minimum lease payments are allocated to interest expenses and amortization of the outstanding liability. Interest expenses are distributed over the period of the lease so that each accounting period is charged with an amount corresponding to a fixed rate of interest for the liability reported in the respective period. Financial revenue and expenses
Financial revenue and expenses include interest revenue from bank assets, receivables and interest-bearing securities, interest expenses related to loans, exchange rate gains and losses on financial assets and liabilities, unrealized and realized gains on financial investments, and derivative instruments used in financial operations.
Interest revenue from receivables and interest expenses related to liabilities are estimated using the effective interest method. The effective interest is the rate that ensures that the present value of all future receipts or payments during the fixed rate term is the same as the reported value of the receivable or payable. The interest element of financial leasing payments is reported in the income statement by using the effective interest method. Interest revenue includes annualized amounts of transaction expenses and discounts, where applicable, premiums and other variations between the original value of the receivable and the amount received on maturity.
Issue expenses and similar direct transaction expenses related to borrowing are annualized over the term of the loan. If loans include an options element, transaction expenses are reported against stockholders’ equity. Borrowing expenses
Borrowing expenses directly pertaining to the purchase, design, or manufacture of an asset which requires considerable
time to complete for its intended use or sale are included in the acquisition value of the asset. Borrowing expenses are capitalized on condition that they are likely to entail future economic benefits and expenses can be measured in a reliable manner. Capitalized product development expenditure includes interest. Write-downs related to capitalized interest costs are reported as operating profit or loss in a similar fashion to other write-downs of tangible assets. Other borrowing expenses are expensed and charged to earnings for the period to which they pertain. Taxes
Taxes consist of current tax and deferred tax. Taxes are reported in the income statement except when the underlying transaction is reported directly against stockholders’ equity, in which case the related tax effect is reported in stockholders’ equity.
Current tax is tax that is to be paid or received for the current year by applying the tax rates that are determined, or in practice determined, on the balance sheet day. This also includes adjustment of current tax pertaining to previous periods.
Deferred tax is calculated according to the balance sheet method based on temporary differences between reported and taxable values of assets and liabilities. The following temporary differences are not taken into account: • Temporary differences arising when goodwill is first
reported. • Temporary differences pertaining to shares in subsidiaries
and associated companies that are not expected to be reversed in the foreseeable future.
The valuation of deferred tax is based on how reported values of assets and liabilities are expected to be realized or paid. Deferred tax is calculated by applying the tax rates and tax legislation that has been determined, or in practice determined, on the balance sheet day.
Deferred tax is reported with current tax in the Group’s income statement. Deferred tax receivables are reported as financial fixed assets, whereas deferred tax liabilities are reported as long-term liabilities.
Deferred tax receivables that pertain to temporary differences and deficit deduction are reported as an asset if it is likely that the deficit deductions can be set off in coming years.
The Group reports losses carried forward pertaining as an asset as the restructuring and streamlining of operations implemented in recent years have resulted in taxable profits in recent years and because of expected taxable gains in the future.
The value of the deferred tax receivables is based on assessments of future taxable gains and the related expectations concerning future use of loss carry-forward.
A tax rate of 28% is applied in Swedish companies. The current tax rate in each country is applied for the Group’s foreign entities.
Global Reports LLC

NOTES TO THE F INANC IAL STATEMENTS
36 Industrial and Financial Systems, IFS AB (publ) – Corporate identity number 556122-0996
Financial Instruments
Financial instruments reported as assets in the balance sheet include the following balance sheet items: shares in other companies, other long-term receivables, accounts receivable, other receivables, and liquid assets (including current investments). Liabilities include the following balance sheet items: convertible debentures/bonds, liabilities to credit institutions, accounts payable, and other liabilities. Recognition and derecognition in the balance sheet
A financial asset or liability is recognized in the balance sheet when the Company becomes a party to it in accordance with the contractual terms of the instrument. Accounts receivable are recognized in the balance sheet when an invoice is issued. Liabilities are recognized when a counterpart has delivered and a contractual obligation to pay exists, even if no invoice has been received. Accounts payable are recognized when an invoice has been received.
A financial asset is derecognized when the entitlements in the contract are realized, mature, or fall outside the control of the Company. A financial liability is derecognized when the obligations in the contract are complied with or are extinguished in another manner.
Financial assets and liabilities are set off and recognized as the net amount in the balance sheet only when the legal right exists to set off the amounts and if it is intended to settle the items with the net amount or simultaneously realize the asset and settle the liability.
The acquisition and divestment of financial assets are reported on the trade date, which is the date on which the company commits itself to acquiring or divesting the asset. Classification and valuation
Financial instruments that are not derivatives are recognized initially at the fair value of the instrument plus transaction expenses for all financial instruments except those categorized as financials assets recognized at fair value through the income statement, which are recognized at fair value excluding transaction expenses. Financial assets valued at fair value through the income statement
This category has two subgroups: financial assets held for trading and other financial assets that the Company initially chose to include in this category. A financial asset is classified as being held for trading if it was acquired for the purpose of being sold in the short term. Stand-alone derivatives, such as embedded derivatives, are classified as being held for trading except when used for hedge accounting. Assets in this category are valued continuously at fair value, with changes in value being reported in the income statement.
Financial investments are either financial fixed assets or current investments depending on why they are held. If the term or the expected period for which they are held is longer than one year, they are financial fixed assets; if they are to be held for less than one year, they are current investments.
Financial investments consisting of shares belong either to the category of financial assets valued at fair value through the income statement or available-for-sale financial assets.
On fair value valuation through the income statement, the change in value is reported in net financial items. Loans and receivables
Loans and receivable are non-derivative financial assets with fixed payments or determinable payments, which are not quoted on an active market. Receivables occur when companies provide money, goods or services directly to the borrower without intent to trade in receivables. The category also includes acquired receivables. Assets in this category are initially valued at fair value and subsequently at the accrued acquisition value, which is determined based on the effective rate of interest calculated on acquisition. Hence, fair value adjustments and direct transaction costs are annualized over the term of the instrument.
Long-term receivables and other receivables are valued at the accrued acquisition value. If they are expected to be held for longer than one year, they are deemed long-term receivables.
Accounts receivable are reported when the risk has been completed and the benefit transferred to the customer, and an invoice has been sent. Accounts receivable are reported initially at fair value and subsequently at the accrued acquisition value using the effective interest method. As the term of customer receivables is short, their value is reported at its nominal amount without discount. Write-downs of accounts receivable are conducted after individual testing of each customer and are reported in operating expenses. Financial liabilities at fair value through the income statement
This category consists of financial liabilities held for trade and derivatives not used for hedge accounting. Liabilities in the category are valued continuously at fair value, with changes in value being reported in the income statement.
Other financial liabilities
Loans (convertible debentures/bonds and liabilities to credit institutions), accounts payable, and other liabilities are included in this category. Financial liabilities not held for trading are valued at their accrued acquisition value. Accounts payable have a short expected term and are valued without discount at nominal value. Other liabilities are classified as other financial liabilities, which means that they are initially reported at fair value and subsequently at the accrued acquisition value using the effective interest method. Liquid assets
Liquid assets are cash, immediately available credit in banks and similar institutions, and current liquid investments with a term of less than three months from the time of acquisition and which are subject to a low risk of fluctuations in value.
Global Reports LLC

NOTES TO THE F INANC IAL STATEMENTS
Industrial and Financial Systems, IFS AB (publ) – Corporate identity number 556122-0996 37
Convertible debentures/bonds
Convertible debentures/bonds can be converted to shares when holders exercise their option to convert receivables to shares. These are reported as a compound financial instrument with a liability and equity component. The fair values of the liability and equity components are determined when the debentures/bonds are issued. The fair value of the liability component, included in long-term and current liabilities, is calculated by using market interest rates for the corresponding nonconvertible debentures/bonds. The residual amount, representing the value of the equity component, is included in stockholders’ equity.
Direct expenses related to issuing the convertible debentures/bonds are reported as a deduction related to the loan. The reported debt is indexed successively over the term of the loan with interest and issue expenses. The equity component, determined on issuance of the convertible debentures/bonds, is not changed over subsequent periods. Derivatives valued at fair value via the income statement
Currency futures are used to hedge assets, liabilities or forecast flows against exchange rate risks. Derivative instruments are reported in the balance sheet as of the contract day and are valued at their fair value, both initially and on subsequent revaluation.
Derivative instruments held by the Group do not fulfill the criteria for hedge reporting. Changes in their fair value, therefore, are reported in the income statement.
All derivative instruments held by the Group are included in the respective balance sheet items Other receivables and Other liabilities. In the income statement, derivative instruments are included in Other revenue, Other expenses, and Financial items. Tangible fixed assets
Owned assets
Tangible fixed assets are reported as assets in the balance sheet if it is likely that future financial benefits shall accrue to the Company and the acquisition value of the asset can be calculated in a reliable manner.
Properties in the Group are business premises used for its own operations and are amortized over their period of use. The acquisition value includes the purchase price and expenses directly pertaining to the asset, such as the cost of delivery and handling, installation, title deeds, consulting services, and legal services. Leased assets
Most of the lease agreements are considered to be operating leasing as risks and benefits remain with the lessor, which means that leasing fees are expensed straight-line during the leasing period. When leasing contracts are considered to be finance leases, they are reported as acquisition of tangible fixed assets and as liabilities. Depreciation is applied in the same manner as if the company owned the assets. In finance leases,
current leasing fees are divided into an interest portion, which is expensed, and an amortization portion. Principles for depreciation
Tangible fixed assets are reported at acquisition value after deductions for accumulated depreciation and write-downs. Assets are depreciated straight-line across the estimated utilization period of the assets and based on the acquisition value of the fixed assets. Leased assets are also depreciated across the estimated utilization period or, if shorter, across the leasing period. The Group applies component depreciation, whereby the estimated utilization period of the individual components form the basis for depreciation. The residual value of the assets and the utilization are tested on each balance sheet day, and assets are written down, when required, to their recovery value. The estimated periods of depreciation are: • Buildings 50 years • Certain components for buildings 5–10 years • Equipment 5 years • Servers 5 years • Computers 3 years Intangible Fixed Assets
Goodwill
Goodwill represents the difference between the acquisition value of a business acquisition and the fair value of the acquired assets, assumed liabilities and contingent liabilities pertaining to acquired subsidiaries.
In respect of goodwill in acquisitions occurring before January 1, 2004, the Group did not apply the IFRS retroactively on transition to the IFRS. Instead, the reported value in the future will be the acquisition value for the Group, after amortization requirements are assessed. See Note 54. Goodwill is valued at the acquisition value less any accumulated write-downs. Goodwill is reassessed annually and is amortized if the recoverable value is less than the book value. Amortization requirements related to goodwill were assessed on transition to the IFRS although there was no indication that amortization was required.
Goodwill arising from acquiring associated companies is included in the reported value of participations in associated companies.
In respect of business acquisitions in which the acquisition expenses are less than the net value of the acquired assets, assumed liabilities and contingent liabilities, the difference is reported directly in the income statement. Research and development
The Group expenses research expenditure. IFS capitalizes product development expenditure when the following criteria are fulfilled: • It shall be technically feasible to turn the development
project into a marketable or internally usable product.
Global Reports LLC

NOTES TO THE F INANC IAL STATEMENTS
38 Industrial and Financial Systems, IFS AB (publ) – Corporate identity number 556122-0996
• The resources required to complete the project are available.
• The project is likely to entail financial benefits for IFS, either in the market where the product is to be sold or via internal savings.
• It is possible to calculate development expenditure in a reliable manner.
It must also have been decided that the development project is to be part of an IFS Applications release or will be used to streamline internal processes. This means that expenses related to research and support are not capitalized.
The Group works continuously with a number of product development projects, most of which focus on standard versions of IFS Applications. The acquisition value of product development expenditure mainly consists of personnel-related expenses. In addition, there are expenses for premises, travel, and office overheads. Borrowing expenses directly related to product development are included in the asset’s acquisition value as the Group deems that the asset requires a substantial amount of time to complete.
Indirect expenses do not include amortization of capitalized product development expenditure or administration expenses.
Capitalized development expenditure is amortized after the estimated lifetime of each product. This may not exceed five years. Continuous assessments are made to determine whether previous expenditure was validly capitalized and if required, a corresponding depreciation will be applied. Other intangible fixed assets
Other intangible fixed assets mainly include customer lists, and acquired product rights and software licenses. These assets are reported at acquisition value less accumulated depreciation. Principles for depreciation
Intangible fixed assets are reported at acquisition value after deductions for accumulated depreciation and write-downs.
Depreciation is reported in the income statement on a straight-line basis across the estimated utilization period and are based on the acquisition value of the fixed asset.
The need to depreciate goodwill with an indeterminable utilization period is assessed annually or as soon as it is indicate that the value of the asset in question has been reduced.
Depreciable intangible assets are depreciated as of the date on which they become available for use. The estimated utilization periods are: • Capitalized development expenditure 5 years • Acquired product rights 5–10 years • Software 5 years • Customer lists and oth. intangible fixed assets 2–3 years
Write-Downs
Impairment test for tangible and intangible assets
The reported value of Group assets is tested on every balance sheet date to determine whether a write-down is indicated. An impairment test is used, which is based on expected future growth and margins. This test is mandatory even if there is no indication that a write-down is indicated. If there is an indication at the end of the fiscal year that a tangible or intangible fixed asset has decreased in value, the residual value of the asset is estimated, i.e. the higher of the net realizable value of the asset and its value in use. When estimating value in use, future cash flows are discounted using a discount factor that considers the risk-free interest and the risk associated with the specific asset. If the estimated residual value is less than the reported value, the asset is written down to its residual value.
Where goodwill pertains to a group of assets for which a write-down is required, the amount to be written down is first allocated to goodwill and subsequently to other assets in proportion to their reported value. Depending on the asset that is to be written down, the relevant item in the income statement is charged.
A write-down of an asset is reversed when there is a change in the assumptions used to establish the residual value of the asset. The reversed amount increases the reported value of the asset to a maximum of the value the asset would have had (after deductions for normal write-downs) if no write-downs had been made.
Write-down of goodwill, however, is never reversed. On assessing the need to write down an asset, the
calculation is based on the affected cash-generating unit. A cash-generating unit is the smallest group of assets for which it is possible to establish regular payments that are largely independent of other assets or groups of assets.
The primary purpose of Group assets and investments is to provide and implement IFS Applications, which: • Is developed by a central product development
organization; • Is sold on the global market, through sales companies in
various countries that collaborate in sales to customers with multinational operations;
• Is supported by a central support organization. As all payment flows in the Group are connected to those assets that are to be tested for write-down, the Group is considered to be the smallest cash-generating unit. Impairment testing of financial assets
On each reporting date, the Group evaluates whether there is objective evidence of impairment for a financial asset. Objective evidence consists of observable events that have occurred and that have a negative impact on the ability to recover the acquisition value. Provisions
Group provisions consist primarily pension obligations and provisions for restructuring. Defined-benefits pension plans
Global Reports LLC

NOTES TO THE F INANC IAL STATEMENTS
Industrial and Financial Systems, IFS AB (publ) – Corporate identity number 556122-0996 39
are reported in the consolidated accounts according to common principles and calculation methods.
Provisions are reported when the following criteria are fulfilled: • The Group has a legal or constructive obligation as a result
of a past event. • It is more likely than not that an outflow of resources will
be required to settle an obligation. • A reliable estimate can be made of the amount. Provisions for restructuring are made when a detailed formal plan for these exists and a valid expectation has been created on the part of those affected. Provisions are not made for future losses. Residual provisions for restructuring pertain primarily to rental costs All provisions are valued at present value. Inventories
Inventories is valued at the lower of acquisition cost and net sale value, as assessed by the value in use, which means that the obsolescence risk has been taken into account.
The acquisition value is calculated according to the ‘first in, first out’ principle and includes expenses that result from the acquisition of inventories and transporting them to their current location and condition. Stockholders’ Equity
Transaction expenses directly pertaining to the issuance of new shares or options are reported net after tax in stockholders’ equity as a deduction from the proceeds of the issue. Employee Benefits—Pension Obligations
Defined-contribution plans
Defined-contribution plans are those to which the Company’s obligations are limited to the contributions the Company has committed itself to pay. In such cases, the size of an employee’s pension is determined by the contributions made by the Company to the plan and the return on capital produced by the contributions. Consequently, the employee carries the actuarial and investment risks. Group earnings are charged with expenses as the benefits accrue. Defined-benefit plans
The Group’s net obligation in respect of defined-benefit plans is calculated separately for each plan by estimating the future payment accrued by employees though their employment in both current and previous periods.
Several defined-contribution and defined-benefit pension plans exist within the Group. In Sweden, Norway, France, and the U.K., all employees are covered by defined-benefit pension plans. In other countries, the employees are covered by defined-contribution pension plans. Both defined-contribution and defined-benefit pension plans exist in Sweden and the U.K.
In defined-benefits plans, employees and former employees receive benefits based on their salary on retirement and years of service. The Group undertakes to ensure that benefits are paid.
The defined-benefit pension plans are both funded and unfunded. Where the plans are funded, the assets have been placed primarily in pension funds.
In the balance sheet, the net sum of the estimated present value of the obligations and the fair value of the plan assets is reported as a provision.
Concerning defined-benefit plans, pension expenses and pension obligations are estimated according to the Projected Unit Credit Method. The method distributes the pension expenses at the rate employees perform services for the company that increase their entitlement to future benefits. The estimates are made annually by independent actuaries. The Company’s obligations are valued as the present value of expected future payments using a discount rate corresponding to the interest rate for first-class corporate bonds or government bonds with a term corresponding to the obligations in question. The most important actuarial assumptions are given in Note 37.
When determining the present value of the obligations and the fair value of the plan assets, actuarial profits and losses may arise, either because the real outcome deviates from the assumptions made or because the obligation changes. The corridor rule is applied, whereby the portion of the accumulated actuarial profits and losses at the end of the previous year that exceed 10% of the highest of the obligation’s present value and the plan asset’s fair value is reported in the earnings over the employee’s average remaining period of service.
Interest expense less the expected dividend on plan assets is classified as a financial expense. Other expense items in pension expenses are charged to operating earnings. Cash Flow Analysis
Cash flow is analyzed according to the indirect method. Reported cash flow comprises only transactions that entail payments and receipts. PARENT COMPANY ACCOUNTING PRINCIPLES
The Parent Company accounting principles below have been consistently applied in all periods presented in the Parent Company’s financial reports. Conformity with Norms and Legislation
The Parent Company accounts have been prepared in accordance with the Swedish Annual Report Act and Recommendation RR 32:06, Accounting for Legal Entities, of the Swedish Financial Accounting Standards Council. Directives issued by the Emerging Issues Task Force of the Swedish Financial Accounting Standards Council related to listed companies have also been applied. Pursuant to RR 32:06, the Parent Company in preparing the annual accounts for the
Global Reports LLC

NOTES TO THE F INANC IAL STATEMENTS
40 Industrial and Financial Systems, IFS AB (publ) – Corporate identity number 556122-0996
legal entity shall apply all IFRS and statements approved by the European Union as far as possible within the framework of the Swedish Annual Report Act and taking into account the relationship between reporting and taxation. The recommendation states the exceptions and supplements that shall be made with respect to the IFRS. Differences between Group and Parent Company Accounting Principles
The differences between Group and Parent Company accounting principles are outlined below. The Parent Company accounting principles below have been consistently applied in all periods presented in the Parent Company’s financial reports. Participations in subsidiaries
Participations in subsidiaries are reported in the Parent Company according to the acquisition value method. Only dividends received are reported as revenue o condition that they derive from profits earned after acquisition. Dividends that exceed such earned profits are considered to be repayment of investment and reduce the recognized value of the participation. Participations in Associated Companies
Parent Company participations in associated companies constitute interests in limited partnership companies. The capital invested is reported as the acquisition value. The book value is changed annually in relation to the share of the limited partnership company’s net earnings and the withdrawals and contributions made during the year. Participations are therefore reported in accordance with the equity method. Financial Instruments, Derivatives and Hedge Accounting
As of 2006, the Parent Company essentially applies the same accounting principles as the Group (see above). Anticipated Dividends
Anticipated dividends from subsidiaries are reported in cases in which the Parent Company alone is entitled to determine the size of the dividend and the Parent Company has determined the size of the dividend before the Parent Company publishes its financial reports. Tangible Fixed Assets
Owned assets
The Parent Company reports tangible fixed assets at acquisition value, less deductions for accumulated depreciation and write-down, where applicable, in the same manner as in the Group, but with the addition of revaluation, where applicable. Leased assets
The Parent Company reports all lease agreements as operating lease agreements.
Borrowing Expenses
Borrowing expenses are charged to earnings for the period to which they pertain in the Parent Company. Employee Benefits—Pension obligations
The Parent Company applies different grounds for calculating defined-benefit plans than those given in IAS 19. The Parent Company follows the stipulations of the Swedish Act on Safeguarding of Pension Commitments and the directions of the Swedish Financial Supervisory Authority as this is a requirement for being eligible to make tax deductions. The most significant differences compared with the regulations in IAS 19 are the way in which the discount interest is determined, that the defined-benefit obligation is estimated based on current salary levels without assumptions of future salary increments, and that actuarial gains and losses are reported in the income statement when they occur. Group Contributions and Stockholder Contribution
Group contributions received and paid are reported directly against stockholders’ equity and thus do not affect Parent Company earnings. Deferred tax on Group contributions has been reported against stockholders’ equity.
Stockholder contributions in the Parent Company are reported as an increase in ‘Participations in subsidiaries’ in the balance sheet. To the extent that stockholder contributions pertain to loss coverage, an assessment is made concerning whether or not the value of the stock should be written down. NOTE 2 – SEGMENT REPORTING
Primary segment reports are prepared for the Group’s geographical areas. The Group’s internal accounting system is based on following up returns from Group operations in various countries or geographical areas. Therefore, geographical areas are the primary basis for classification. IFS has identified three primary segments based on geographical areas.
Group expenses are not distributed across the segments as it was deemed that such a distribution could not be made based on reliable, consistent key ratios. Neither is goodwill distributed across the segments. The value of Group goodwill has primarily accrued in connection with the international expansion that occurred during 1996–1999. An international presence was a prerequisite for attracting international customers in the long term, even in the local markets in which IFS operates. Therefore, goodwill is deemed to be a Group asset and does not pertain to the individual markets in which it originated. Moreover, because of the nature of international business, sales are often referred from one country to another and cross-flows occur that are difficult to distribute among the individual segments.
Secondary segments are not reported as IFS has only one line of business: to develop, sell and implement IFS Applications, which: • is developed by a central product development
organization;
Global Reports LLC

NOTES TO THE F INANC IAL STATEMENTS
Industrial and Financial Systems, IFS AB (publ) – Corporate identity number 556122-0996 41
• is sold on the global market, through sales companies in various countries that collaborate in sales to customers with multinational operations;
• is supported by a central support organization. The Group’s sales companies are organized in the following three regions based on where assets and investments are located: EMEA, America, and Rest of the World. EMEA consists of Europe, (excluding Eastern Europe), the Middle East, Africa, and India. IFS has sales offices in Sweden, Norway, Denmark, Finland, Germany, France, The Netherlands, Italy, Spain, England, the United Arab Emirates, South Africa, India, and Sri Lanka. In other countries in EMEA, IFS is represented by partners, jointly owned subsidiaries, or IFS offices in neighboring countries. In America, IFS has sales offices in the U.S.A., Canada and Latin America. Rest of the World includes Asia, Australia, and Eastern Europe. IFS has wholly or jointly owned subsidiaries in The Philippines, P.R. China, Malaysia, Singapore, Thailand, Australia, Poland, the Czech Republic, Slovakia, Hungary, Greece, Turkey, and Russia. In other countries in the region, IFS is represented by partners or IFS offices in neighboring countries.
Undistributed corporate revenue, expenses, assets and liabilities include the Group’s product development organization, and the corporate management, financial, and marketing functions. Product development is carried out at permanent development centers in Sri Lanka, the U.S.A.,
Norway, and Sweden. Corporate management, financial and marketing functions are mainly located in Sweden.
Sales and other transactions take place between the segments. Transfer pricing for services between the various Group segments is market-based. Fees for most of the sales companies are determined by applying a generally accepted model for transfer pricing—the Transactional Net Margin Method—which is based on the principle that the sales companies achieve a predetermined profit margin. For further information on transfer pricing, see Accounting Principles, Note 1.
The segments’ earnings, expenses, assets, and liabilities include directly referable items that can be distributed across the segments in a reasonable, reliable manner.
Undistributed revenue and expenses include all the corporate functions above, interest and dividend revenue, gains from divesting financial investments, interest expenses, losses on divesting financial investments, the Group’s portion of losses in associated companies and joint ventures consolidated according to the equity method, and tax liabilities.
Undistributed assets and liabilities include goodwill, activated product development expenditure, deferred tax receivables and liabilities, corporate liquidity, corporate financing and all corporate functions.
The segments’ investments in tangible and intangible fixed assets include all investments except investments in expendable equipment and equipment of minor value. Assets, liabilities and investments are reported where such items exist.
Income statement
EMEA Americas Rest of the World
Undistributed
Corporate items GROUP
SKr, million 2007 2006 2007 2006 2007 2006 2007 2006 2007 2006
License revenue 325 247 72 97 80 87 1 2 478 433
Maintenance and support revenue 467 432 107 103 83 64 2 1 659 600
Consulting revenue 921 858 161 186 110 95 2 1 1 194 1 140
Other revenue 10 19 0 2 9 5 6 10 25 36
Total external revenue 1 723 1 556 340 388 282 251 11 14 2 356 2 209
Internal revenue 56 64 31 36 21 16 -108 -116 0 0
Total revenue 1 779 1 620 371 424 303 267 -97 -102 2 356 2 209
External operating expenses -1 241 -1 128 -250 -299 -286 -276 -427 -381 -2 204 -2 084
Internal operating expenses -91 -68 -14 -29 -5 -3 110 100 0 0
Other operating items, net 2 -4 2 8 -7 4 -8 -13 -11 -5
Operating expenses -1 330 -1 200 -262 -320 -298 -275 -325 -294 -2 215 -2 089
EBIT 449 420 109 104 5 -8 -422 -396 141 120
Result from participation in associated companies - - - - 1 1 - 0 1 1
Other interest income and similar items 12 5
Interest expenses and similar items -25 -51
Profit/loss before tax 129 75
Tax on profit/loss for the year -7 171
Profit/loss for the year 122 246
Global Reports LLC

NOTES TO THE F INANC IAL STATEMENTS
42 Industrial and Financial Systems, IFS AB (publ) – Corporate identity number 556122-0996
Other informationEMEA Americas Rest of the World
Undistributed
Corporate items GROUP
SKr, million 2007 2006 2007 2006 2007 2006 2007 2006 2007 2006
External assets 743 580 92 91 128 165 1 346 1 462 2 309 2 298
Participations in associated companies - - - - - - 2 7 2 7
Total assets 743 580 92 91 128 165 1 348 1 469 2 311 2 305
Liabilities 626 544 129 131 74 147 365 617 1 194 1 439
Investments in fixed assets 41 12 5 7 2 13 126 132 174 164
Depreciation and write-downs 16 16 4 3 10 14 144 136 174 169
Average number of employees 1 219 1 124 221 227 407 473 799 820 2 646 2 644
Number of employees at year end 1 241 1 124 209 224 387 463 790 819 2 627 2 630 The primary segmentation of geographical areas is based on the location of Group assets. The external sales revenue based on where customers are located is outlined in the table below:
GROUP
SKr, million 2007 2006
Europe 1 804 1 577
Americas 345 394
Rest of the World 207 238
Total 2 356 2 209 NOTE 3 – LICENSE REVENUE
GROUP
SKr, million 2007 2006
License revenue, IFS 449 404
Third-party license revenue 29 29
Total 478 433 Third-party license revenue includes revenue that accrues when IFS sells software licenses from third-party suppliers such as Oracle.
From time to time, IFS is party to customer agreements that are signed by agents who bear the related sales costs, which are subsequently covered by commission from IFS. As IFS does not bear any risk related to the sales and as the risk related to the conclusion of such agreements is limited, the commissions are recognized at net against the revenue IFS received. In 2007 no such agreements were signed requiring net recognition. In 2006, however, such customer agreements existed. If they had been recognized at gross instead, revenue and cost would have increased by SKr 90 million, of which SKr 85 million pertained to license revenue and SKr 5 million to consulting revenue.
NOTE 4 – MAINTENANCE AND SUPPORT REVENUE
GROUP
SKr, million 2007 2006
Maintenance and support revenue 625 564
Third-party maintenance and support revenue 34 36
Total 659 600 Third-party revenue refers to revenue that accrues when IFS sells maintenance and support from third-party suppliers such as Oracle. NOTE 5 – OTHER REVENUE
GROUP PARENT COMPANY
SKr, million 2007 2006 2007 2006
Hardware 13 16 - -
Parent Company fees - - 18 15
Hosting services 0 2 - -
Miscellaneous 12 18 - -
Total 25 36 18 15 NOTE 6 – LICENSE EXPENSES
GROUP
SKr, million 2007 2006
License costs to partners and third-party suppliers -49 -42
Externally bought sales and marketing expenses -55 -58
Corporate sales and marketing expenses -49 -44
Local sales and marketing expenses -342 -328
Total sales and marketing expenses -446 -430
Total -495 -472
Global Reports LLC

NOTES TO THE F INANC IAL STATEMENTS
Industrial and Financial Systems, IFS AB (publ) – Corporate identity number 556122-0996 43
NOTE 7 – OTHER OPERATING INCOME
GROUP PARENT COMPANY
SKr, million 2007 2006 2007 2006
Gain on divestment of real estate 3 - - -
Additional consideration on divestment
of operations in previous years - 4 - -
Reversal of unused restructuring
reserve 1 - - -
Exchange rate gains, net - - 0 -
Rental income 4 8 - -
Miscellaneous 4 7 0 -
Total 12 19 0 - NOTE 8 – OTHER OPERATING EXPENSES
GROUP PARENT COMPANY
SKr, million 2007 2006 2007 2006
Exchange rate losses, net -13 -11 - -
Restructuring costs -5 -5 - -
Loss on divestment of operations 0 -1 0 -
Miscellaneous -5 -6 0 0
Total -23 -23 0 0 NOTE 9 – DEVELOPMENT EXPENDITURE
GROUP
SKr, million 2007 2006
Product development expenditure -187 -190
Amortization of capitalized product development -146 -139
Other amortization -3 -4
Capitalized product development expenditure for own use 122 125
Total -214 -208 NOTE 10 – TRANSACTIONS BETWEEN SUBSIDIARIES
In the Parent Company, SKr 18 (15) million, or 100% (100), of sales and SKr 0 (0) million, or 0% (0) of the purchases for the year pertain to subsidiaries in IFS Group.
NOTE 11 – OPERATING EXPENSES PER TYPE OF COST
GROUP
SKr, million 2007 2006
Direct costs of goods and services sold -264 -240
Capitalized development cost 122 125
Personnel costs -1 420 -1 350
Travel expenses -109 -99
Costs for rented premises and other property costs -119 -122
External services -83 -79
Marketing and selling expenses -53 -53
Amortization, depreciation, and write-downs -174 -169
Other indirect expenses -104 -98
Other operating income 12 19
Other operating expenses -23 -23
Total -2 215 -2 089 NOTE 12 – AUDITORS’ FEES
GROUP PARENT COMPANY
SKr, million 2007 2006 2007 2006
Öhrlings PricewaterhouseCoopers
Audit -6 -7 -3 -2
Others services -1 -2 0 -1
Total -7 -9 -3 -3
Other auditors
Audit -1 -1 - -
Others sevices 0 -1 - -
Total -1 -2 - -
Total fees -8 -11 -3 -3 “Audit” refers to the examination of the annual accounts, the accounting records and the administration by the Board of Directors and the President. It also includes other duties that are incumbent on the company’s auditors, as well as advisory services and other types of support as a result of observations made through such an examination. All other tasks are classified as “Other services”.
Global Reports LLC

NOTES TO THE F INANC IAL STATEMENTS
44 Industrial and Financial Systems, IFS AB (publ) – Corporate identity number 556122-0996
NOTE 13 – SALARIES, OTHER REMUNERATIONS, AND SOCIAL COSTS
GROUP PARENT COMPANY
SKr, million 2007 2006 2007 2006
Salaries and other remunerations -1 073 -1 032 -11 -8
Social costs -220 -202 -4 -3
Pension costs, defined benefit plans
(see Note 37) -23 -24 -1 -1
Pension costs, defined contribution
plans (see Note 37) -48 -43 -2 -2
Other personnel costs -56 -49 -2 0
Total -1 420 -1 350 -20 -14
Pension expenses reported as financial
expenses 2 -1 - -
Total -1 418 -1 351 -20 -14 Of the Parent Company’s pension expenses, SKr 420,000 (411,000) pertain to the board of directors and CEO. The corresponding amount for the Group was SKr 2 (2) million.
Salaries and other remunerations by country
Costs are reported in positive figures. 2007 2006
SKr, million
Board,
CEO, and
mgmt* Others Total
Board,
CEO, and
mgmt* Others Total
SWEDEN
Parent company 8 3 11 5 3 8
Subsidiaries 6 250 256 6 235 241
Sweden, total 14 253 267 11 238 249
SUBSIDIARIES ABROAD
Australia 5 6 11 2 5 7
Canada - 9 9 - 10 10
China 1 8 9 1 8 9
Czech Republic 2 7 9 2 6 8
Denmark 2 15 17 1 15 16
Finland 4 34 38 4 26 30
France 3 16 19 3 15 18
Germany 7 66 73 6 68 74
Greece - 3 3 - 5 5
Hungary 2 4 6 2 4 6
India 1 13 14 1 10 11
Italy - 2 2 - 2 2
Japan 2 4 6 3 4 7
Malaysia 0 3 3 0 3 3
Netherlands 2 22 24 1 20 21
New Zealand - 1 1 - 1 1
Norway 6 124 130 7 112 119
Philippines - 0 0 - 0 0
Poland 12 46 58 10 43 53
Russia - 7 7 0 3 3
Singapore 2 3 5 2 4 6
Slovakia 0 2 2 0 1 1
South Africa 1 10 11 2 25 27
Spain 1 6 7 2 4 6
Sri Lanka 2 33 35 1 31 32
Thailand 3 1 4 0 2 2
United Arab Emirates 5 8 13 5 7 12
United Kingdom
(excl. joint venture) 9 99 108 7 88 95
United States 12 126 138 12 148 160
Subsidiaries
abroad, total 84 678 762 74 670 744
Joint venture in the
United Kingdom 3 41 44 4 35 39
Group, total 101 972 1 073 89 943 1 032
* Management: other executives Other senior executives are those who report to the president and local managing directors. The definition is new for 2007, and the comparative figures for 2006 have been changed accordingly. (See also Note 16).
Global Reports LLC
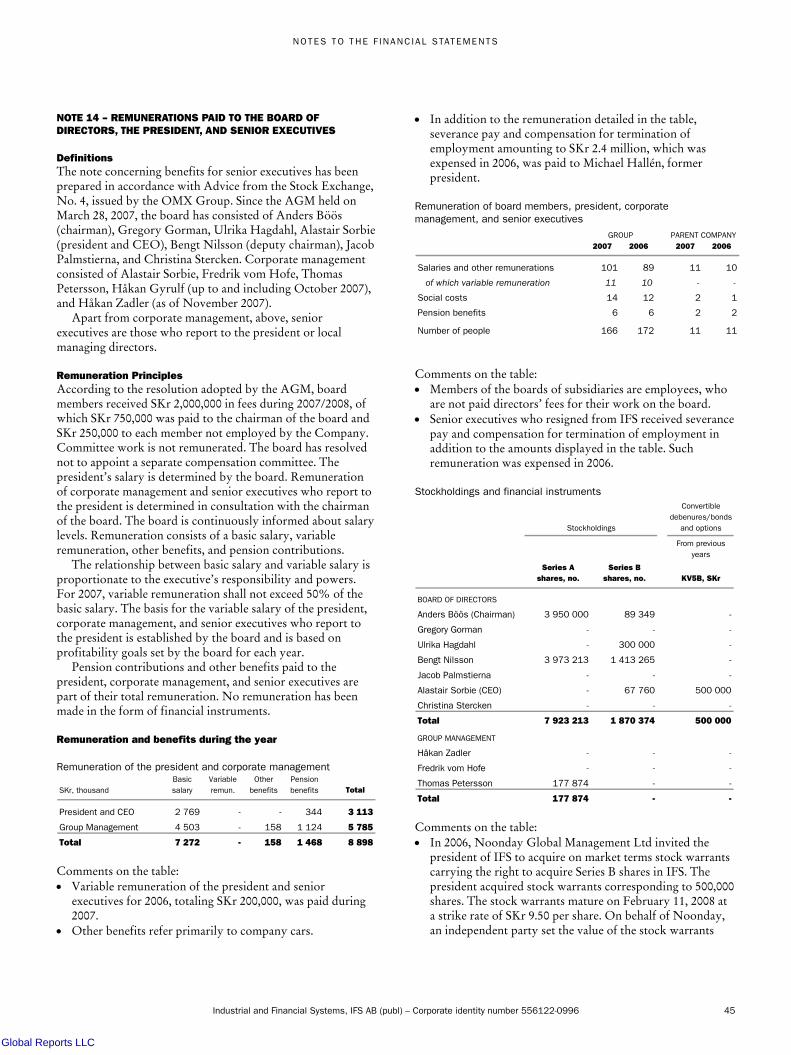
NOTES TO THE F INANC IAL STATEMENTS
Industrial and Financial Systems, IFS AB (publ) – Corporate identity number 556122-0996 45
NOTE 14 – REMUNERATIONS PAID TO THE BOARD OF DIRECTORS, THE PRESIDENT, AND SENIOR EXECUTIVES
Definitions
The note concerning benefits for senior executives has been prepared in accordance with Advice from the Stock Exchange, No. 4, issued by the OMX Group. Since the AGM held on March 28, 2007, the board has consisted of Anders Böös (chairman), Gregory Gorman, Ulrika Hagdahl, Alastair Sorbie (president and CEO), Bengt Nilsson (deputy chairman), Jacob Palmstierna, and Christina Stercken. Corporate management consisted of Alastair Sorbie, Fredrik vom Hofe, Thomas Petersson, Håkan Gyrulf (up to and including October 2007), and Håkan Zadler (as of November 2007).
Apart from corporate management, above, senior executives are those who report to the president or local managing directors. Remuneration Principles
According to the resolution adopted by the AGM, board members received SKr 2,000,000 in fees during 2007/2008, of which SKr 750,000 was paid to the chairman of the board and SKr 250,000 to each member not employed by the Company. Committee work is not remunerated. The board has resolved not to appoint a separate compensation committee. The president’s salary is determined by the board. Remuneration of corporate management and senior executives who report to the president is determined in consultation with the chairman of the board. The board is continuously informed about salary levels. Remuneration consists of a basic salary, variable remuneration, other benefits, and pension contributions.
The relationship between basic salary and variable salary is proportionate to the executive’s responsibility and powers. For 2007, variable remuneration shall not exceed 50% of the basic salary. The basis for the variable salary of the president, corporate management, and senior executives who report to the president is established by the board and is based on profitability goals set by the board for each year.
Pension contributions and other benefits paid to the president, corporate management, and senior executives are part of their total remuneration. No remuneration has been made in the form of financial instruments. Remuneration and benefits during the year
Remuneration of the president and corporate management
SKr, thousand
Basic
salary
Variable
remun.
Other
benefits
Pension
benefits Total
President and CEO 2 769 - - 344 3 113
Group Management 4 503 - 158 1 124 5 785
Total 7 272 - 158 1 468 8 898 Comments on the table: • Variable remuneration of the president and senior
executives for 2006, totaling SKr 200,000, was paid during 2007.
• Other benefits refer primarily to company cars.
• In addition to the remuneration detailed in the table, severance pay and compensation for termination of employment amounting to SKr 2.4 million, which was expensed in 2006, was paid to Michael Hallén, former president.
Remuneration of board members, president, corporate management, and senior executives
GROUP PARENT COMPANY
2007 2006 2007 2006
Salaries and other remunerations 101 89 11 10
of which variable remuneration 11 10 - -
Social costs 14 12 2 1
Pension benefits 6 6 2 2
Number of people 166 172 11 11
Comments on the table: • Members of the boards of subsidiaries are employees, who
are not paid directors’ fees for their work on the board. • Senior executives who resigned from IFS received severance
pay and compensation for termination of employment in addition to the amounts displayed in the table. Such remuneration was expensed in 2006.
Stockholdings and financial instruments
Stockholdings
Convertible
debenures/bonds
and options
From previous
years
Series A
shares, no.
Series B
shares, no. KV5B, SKr
BOARD OF DIRECTORS
Anders Böös (Chairman) 3 950 000 89 349 -
Gregory Gorman - - -
Ulrika Hagdahl - 300 000 -
Bengt Nilsson 3 973 213 1 413 265 -
Jacob Palmstierna - - -
Alastair Sorbie (CEO) - 67 760 500 000
Christina Stercken - - -
Total 7 923 213 1 870 374 500 000
GROUP MANAGEMENT
Håkan Zadler - - -
Fredrik vom Hofe - - -
Thomas Petersson 177 874 - -
Total 177 874 - - Comments on the table: • In 2006, Noonday Global Management Ltd invited the
president of IFS to acquire on market terms stock warrants carrying the right to acquire Series B shares in IFS. The president acquired stock warrants corresponding to 500,000 shares. The stock warrants mature on February 11, 2008 at a strike rate of SKr 9.50 per share. On behalf of Noonday, an independent party set the value of the stock warrants
Global Reports LLC

NOTES TO THE F INANC IAL STATEMENTS
46 Industrial and Financial Systems, IFS AB (publ) – Corporate identity number 556122-0996
based on the market value according to the Black-Scholes formula. The price per warrant was SKr 0.85 plus SKr 0.05 in transaction fees. The stock warrants do not entail dilution of the IFS share.
• No warrants have been issued by IFS. • Holdings of stock and warrants are reported net after
acquisitions and divestments for the year. • Holding including family and associated companies. • Stock, convertible debentures, and warrants held as of
December 31, 2007. Period of notice and severance pay
If the company terminates the employment, the president is to receive 12 months’ notice; if the president terminates the employment, the company is to receive 12 months’ notice. In addition, the president shall receive 12 months’ severance pay. For corporate management and senior executives, the notification period is between 12 months from the company and 3 to 6 months from the senior executive. Pensions
The president is entitled to a premium-based pension, with a premium corresponding to 15% of the basic salary. The retirement age for the president is 65. Senior executives are included in IFS’ premium-based special pension plan. The retirement age for other senior executives is 65. NOTE 15 – TRANSACTIONS WITH RELATED PARTIES
Separate notes contain information about: • Other revenue Note 5 • Transactions between subsidiaries Note 10 • Remuneration of the board and CEO Note 14 • Shares in subsidiaries Note 26 • Participations in associated companies Note 27 • Receivables from subsidiaries Note 28 • Other liabilities Note 40 • Pledged assets Note 42 • Contingent liabilities Note 43 Other than those contained in the above, no transactions exist with related parties.
NOTE 16 – AVERAGE NUMBER OF EMPLOYEES PER COUNTRY
GROUP PARENT COMPANY
2007 2006 2007 2006
Sweden 566 569 5 3
of whom, women 175 179 2 1
Australia 13 13 - -
Canada 14 14 - -
China 54 53 - -
Czech Republic 36 37 - -
Denmark 21 21 - -
Finland 71 63 - -
France 39 40 - -
Germany 123 121 - -
Greece 5 18 - -
Hungary 24 28 - -
India 123 102 - -
Italy 6 5 - -
Japan 8 8 - -
Malaysia 13 14 - -
Netherlands 32 31 - -
New Zealand 2 2 - -
Norway 182 182 - -
Philippines 2 2 - -
Poland 169 167 - -
Russia 42 42 - -
Singapore 12 14 - -
Slovakia 9 9 - -
South Africa 29 65 - -
Spain 17 12 - -
Sri Lanka 594 567 - -
Thailand 18 23 - -
United Arab Emirates 19 16 - -
United Kingdom (excl. joint venture) 132 129 - -
United States 216 230 - -
Total, subsidiaries abroad 2 025 2 028 - -
of whom, women 572 575 - -
Joint venture in the United Kingdom 55 47 - -
of whom, women 6 6 - -
Total 2 646 2 644 5 3
of whom, women 753 760 2 1 Board members and senior executives
GROUP PARENT COMPANY
On December 31 2007 2006 2007 2006
Board members 68 66 7 7
of whom, women 11 9 2 2
President and other senior executives 98 106 5 5
of whom, women 21 24 2 2 Other senior executives are those who report to the president and local managing directors. The definition is new for 2007, and the comparative figures for 2006 have been changed in accordingly. (See also Note 13).
Sickness absence is not reported as the Parent Company has fewer than 10 employees.
Global Reports LLC
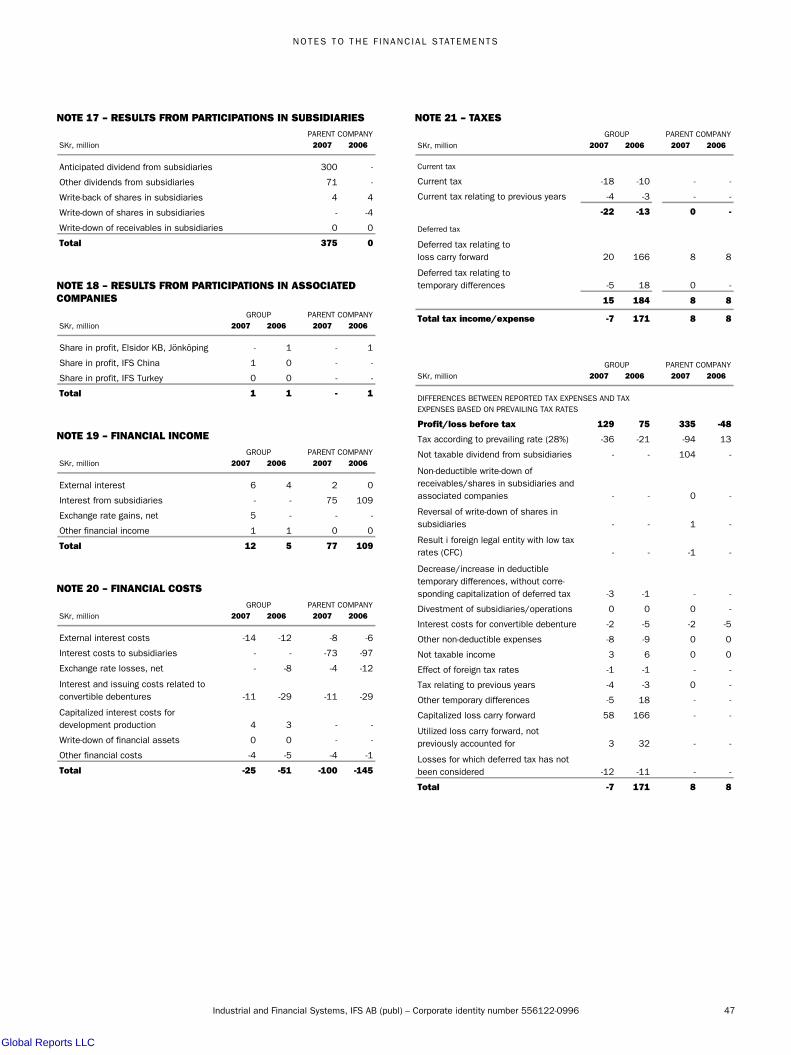
NOTES TO THE F INANC IAL STATEMENTS
Industrial and Financial Systems, IFS AB (publ) – Corporate identity number 556122-0996 47
NOTE 17 – RESULTS FROM PARTICIPATIONS IN SUBSIDIARIES
PARENT COMPANY
SKr, million 2007 2006
Anticipated dividend from subsidiaries 300 -
Other dividends from subsidiaries 71 -
Write-back of shares in subsidiaries 4 4
Write-down of shares in subsidiaries - -4
Write-down of receivables in subsidiaries 0 0
Total 375 0 NOTE 18 – RESULTS FROM PARTICIPATIONS IN ASSOCIATED COMPANIES
GROUP PARENT COMPANY
SKr, million 2007 2006 2007 2006
Share in profit, Elsidor KB, Jönköping - 1 - 1
Share in profit, IFS China 1 0 - -
Share in profit, IFS Turkey 0 0 - -
Total 1 1 - 1 NOTE 19 – FINANCIAL INCOME
GROUP PARENT COMPANY
SKr, million 2007 2006 2007 2006
External interest 6 4 2 0
Interest from subsidiaries - - 75 109
Exchange rate gains, net 5 - - -
Other financial income 1 1 0 0
Total 12 5 77 109 NOTE 20 – FINANCIAL COSTS
GROUP PARENT COMPANY
SKr, million 2007 2006 2007 2006
External interest costs -14 -12 -8 -6
Interest costs to subsidiaries - - -73 -97
Exchange rate losses, net - -8 -4 -12
Interest and issuing costs related to
convertible debentures -11 -29 -11 -29
Capitalized interest costs for
development production 4 3 - -
Write-down of financial assets 0 0 - -
Other financial costs -4 -5 -4 -1
Total -25 -51 -100 -145
NOTE 21 – TAXES
GROUP PARENT COMPANY
SKr, million 2007 2006 2007 2006
Current tax
Current tax -18 -10 - -
Current tax relating to previous years -4 -3 - -
-22 -13 0 -
Deferred tax
Deferred tax relating to
loss carry forward 20 166 8 8
Deferred tax relating to
temporary differences -5 18 0 -
15 184 8 8
Total tax income/expense -7 171 8 8
GROUP PARENT COMPANY
SKr, million 2007 2006 2007 2006
Profit/loss before tax 129 75 335 -48
Tax according to prevailing rate (28%) -36 -21 -94 13
Not taxable dividend from subsidiaries - - 104 -
Non-deductible write-down of
receivables/shares in subsidiaries and
associated companies - - 0 -
Reversal of write-down of shares in
subsidiaries - - 1 -
Result i foreign legal entity with low tax
rates (CFC) - - -1 -
Decrease/increase in deductible
temporary differences, without corre-
sponding capitalization of deferred tax -3 -1 - -
Divestment of subsidiaries/operations 0 0 0 -
Interest costs for convertible debenture -2 -5 -2 -5
Other non-deductible expenses -8 -9 0 0
Not taxable income 3 6 0 0
Effect of foreign tax rates -1 -1 - -
Tax relating to previous years -4 -3 0 -
Other temporary differences -5 18 - -
Capitalized loss carry forward 58 166 - -
Utilized loss carry forward, not
previously accounted for 3 32 - -
Losses for which deferred tax has not
been considered -12 -11 - -
Total -7 171 8 8
DIFFERENCES BETWEEN REPORTED TAX EXPENSES AND TAX
EXPENSES BASED ON PREVAILING TAX RATES
Global Reports LLC

NOTES TO THE F INANC IAL STATEMENTS
48 Industrial and Financial Systems, IFS AB (publ) – Corporate identity number 556122-0996
NOTE 22 – PROFIT AND DIVIDEND PER SHARE
Earnings per share before dilution
2007 2006
Profit for the year, SKr million 122 246
Average no. of shares during the period, thousands 253 919 229 622
Profit/loss per share before full dilution, SKr 0.48 1.07
GROUP
Earnings per share after dilution
To calculate earnings per share after dilution, the weighted average number of outstanding shares is adjusted for the dilution effect of the total number of potential shares on full conversion of the outstanding convertible debentures/bonds. The convertible debentures/bonds are presumed to have been converted to Series B shares, and the net gain is adjusted to eliminate interest expenses minus tax.
2007 2006
Profit for the year, SKr million 122 246
Interest and issue expenses, after tax, for convertible
debentures/bonds, SKr million 8 21
Adjusted profit/loss, SKr million 130 267
Average no. of shares during the period after full
dilution, thousands 270 337 270 709
Profit/loss per share after full dilution, SKr 0.48 0.99
GROUP
Dividend per shareSKr 2007 2006
Dividend accounted for during the year - -
GROUP
NOTE 23 – INTANGIBLE FIXED ASSETS
GROUP INTERNAL DEVELOPMENT PURCHASED
SKr, million
Capitalized
expenditure for
R&D
Capitalized
interest costs
Total
capitalized
expenditure
for R&D Goodwill
Other
intangible fixed
assets Total
ACCUMULATED ACQUISITION VALUE
Opening balance 1 226 20 1 246 235 153 1 634
Purchases 125 3 128 7 9 144
Sales/disposals 0 - 0 0 0 0
Reclassification 1 - 1 - 0 1
Exchange differences during the year -6 - -6 -23 -3 -32
Closing balance Dec 31, 2006 1 346 23 1 369 219 159 1 747
ACCUMULATED DEPRECIATION
Opening balance -713 -11 -724 - -111 -835
Depreciation during the year -135 -4 -139 - -9 -148
Sales/disposals - - 0 - 0 0
Reclassification -1 - -1 - -1 -2
Exchange differences during the year 4 - 4 - 2 6
Closing balance Dec 31, 2006 -845 -15 -860 - -119 -979
Book value Dec 31, 2006 501 8 509 219 40 768
ACCUMULATED WRITE-DOWNS
Opening balance -13 - -13 - -28 -41
Exchange differences during the year 1 - 1 - - 1
Closing balance Dec 31, 2006 -12 - -12 - -28 -40
Book value Dec 31, 2006 489 8 497 219 12 728
Global Reports LLC

NOTES TO THE F INANC IAL STATEMENTS
Industrial and Financial Systems, IFS AB (publ) – Corporate identity number 556122-0996 49
GROUP INTERNAL DEVELOPMENT PURCHASED
SKr, million
Capitalized
expenditure for
R&D
Capitalized
interest costs
Total
capitalized
expenditure
for R&D Goodwill
Other
intangible fixed
assets Total
ACCUMULATED ACQUISITION VALUE
Opening balance 1 346 23 1 369 219 159 1 747
Purchases 122 4 126 19 9 154
Sales/disposals -5 - -5 - -1 -6
Reclassification - - - - - -
Exchange differences during the year 4 - 4 -6 - -2
Closing balance Dec 31, 2007 1 467 27 1 494 232 167 1 893
ACCUMULATED DEPRECIATION
Opening balance -845 -15 -860 - -119 -979
Depreciation during the year -146 0 -146 - -8 -154
Sales/disposals 5 0 5 - 2 7
Reclassification 4 -4 0 - 0 0
Exchange differences during the year -3 - -3 - 0 -3
Closing balance Dec 31, 2007 -985 -19 -1 004 - -125 -1 129
Book value Dec 31, 2007 482 8 490 232 42 764
ACCUMULATED WRITE-DOWNS
Opening balance -12 - -12 - -28 -40
Write-downs during the year -1 - -1 - - -1
Exchange differences during the year -1 - -1 - - -1
Closing balance Dec 31, 2007 -14 - -14 - -28 -42
Book value Dec 31, 2007 468 8 476 232 14 722 PARENT COMPANY INTERNAL DEVELOPMENT PURCHASED
SKr, million
Capitalized
expenditure for
R&D
Capitalized
interest costs
Total
capitalized
expenditure
for R&D Goodwill
Other
intangible fixed
assets Total
ACCUMULATED ACQUISITION VALUE
Opening balance - - - 2 - 2
Closing balance Dec 31, 2006 - - - 2 - 2
ACCUMULATED DEPRECIATION
Opening balance - - - -2 - -2
Depreciation during the year - - - 0 - 0
Closing balance Dec 31, 2006 - - - -2 - -2
Book value Dec 31, 2006 - - - 0 - 0
ACCUMULATED ACQUISITION VALUE
Opening balance - - - 2 - 2
Closing balance Dec 31, 2007 - - - 2 - 2
ACCUMULATED DEPRECIATION
Opening balance - - - -2 - -2
Depreciation during the year 0 0 - 0 - 0
Closing balance Dec 31, 2007 - - - -2 - -2
Book value Dec 31, 2007 - - - 0 - 0
Global Reports LLC

NOTES TO THE F INANC IAL STATEMENTS
50 Industrial and Financial Systems, IFS AB (publ) – Corporate identity number 556122-0996
Depreciation included in the income statement, per function
GROUP PARENT COMPANY
SKr, million 2007 2006 2007 2006
License costs -2 -2 - -
Maintenance and support costs 0 0 - -
Consulting costs -2 -1 - -
Research and development expenditure -146 -141 - -
Administration costs -4 -4 - 0
Total -154 -148 - 0 NOTE 24 – TANGIBLE FIXED ASSETS GROUPSKr, million
Buildings
and land
Leasing,
inventories Computers
Office
equipment
Other
inventories Total
ACCUMULATED ACQUISITION VALUE
Opening balance Jan 1, 2006 88 60 177 123 2 450
Purchases 4 4 9 3 0 20
Sales/disposals -4 -4 -5 -7 0 -20
Reclassifications 0 -2 2 0 0 0
Exchange differences during the year -10 -2 -10 -9 0 -31
Closing balance Dec 31, 2006 78 56 173 110 2 419
ACCUMULATED DEPRECIATION
Opening balance Jan 1, 2006 -29 -56 -155 -114 -1 -355
Depreciation during the year -4 -2 -11 -4 0 -21
Sales/disposals 4 4 5 7 0 20
Reclassifications 0 1 -2 0 0 -1
Exchange differences during the year 3 2 8 8 0 21
Closing balance Dec 31, 2006 -26 -51 -155 -103 -1 -336
Book value Dec 31, 2006 52 5 18 7 1 83 GROUPSKr, million
Buildings
and land
Leasing,
inventories Computers
Office
equipment
Other
inventories Total
ACCUMULATED ACQUISITION VALUE
Opening balance Jan 1, 2007 78 56 173 110 2 419
Acquisition of subsidiary - - 1 0 - 1
Purchases 1 5 9 4 0 19
Sales/disposals -7 -30 -54 -6 0 -97
Reclassifications 0 -5 5 0 0 0
Exchange differences during the year 0 0 1 1 0 2
Closing balance Dec 31, 2007 72 26 135 109 2 344
ACCUMULATED DEPRECIATION
Opening balance Jan 1, 2007 -26 -51 -155 -103 -1 -336
Depreciation during the year -3 -2 -10 -4 0 -19
Sales/disposals 4 29 53 7 0 93
Reclassifications 0 5 -5 0 0 0
Exchange differences during the year 0 -1 -1 -1 0 -3
Closing balance Dec 31, 2007 -25 -20 -118 -101 -1 -265
Book value Dec 31, 2007 47 6 17 8 1 79
Global Reports LLC

NOTES TO THE F INANC IAL STATEMENTS
Industrial and Financial Systems, IFS AB (publ) – Corporate identity number 556122-0996 51
PARENT COMPANYSKr, million
Buildings
and land
Leasing,
inventories Computers
Office
equipment
Other
inventories Total
ACCUMULATED ACQUISITION VALUE
Opening balance Jan 1, 2006 - - 1 1 - 2
Closing balance Dec 31, 2006 - - 1 1 - 2
ACCUMULATED DEPRECIATION
Opening balance Jan 1, 2006 - - -1 -1 - -2
Depreciation during the year - - 0 - - 0
Closing balance Dec 31, 2006 - - -1 -1 - -2
Book value Dec 31, 2006 - - 0 0 - 0
ACCUMULATED ACQUISITION VALUE
Opening balance Jan 1, 2007 - - 1 1 - 2
Closing balance Dec 31, 2007 - - 1 1 - 2
ACCUMULATED DEPRECIATION
Opening balance Jan 1, 2007 - - -1 -1 - -2
Depreciation during the year - - 0 - - 0
Closing balance Dec 31, 2007 - - -1 -1 - -2
Book value Dec 31, 2007 - - 0 0 - 0 Tangible fixed assets do not include capitalized interest expenses. Depreciation included in the income statement, per function
GROUP PARENT COMPANY
SKr, million 2007 2006 2007 2006
License costs -2 -1 - -
Maintenance and support costs -1 -1 - -
Consulting costs -6 -6 - -
Development expenditure -2 -2 - -
Administration costs -8 -11 0 0
Total -19 -21 0 0 Tangible fixed assets do not include any write-downs, either in the Group or in the Parent Company. Financial leasing agreements
The Group’s tangible assets include leased items held under the terms of financial leasing agreements as follows:
SKr, million
Acquisition
value
Accumulated
depreciation Book value
Office equipment 0 0 0
Computers 10 -3 7
Other 0 0 0
Total 10 -3 7 Future minimum leasing payments fall due as follows:
SKr, million
Nominal
value
Current
value
Within one year 2 2
Later than one year but within five years 2 2
Later than five years 0 0
Total 4 4 The current value of the future minimum leasing payments is reported as a liability to credit institutions, partly as a current liability and partly as a long-term liability. NOTE 25 – OPERATING LEASE AGREEMENTS
The nominal value of future minimum leasing agreements with respect to non-terminable leasing agreements is distributed as follows:
GROUP PARENT COMPANY
SKr million 2007 2006 2007 2006
Due for payment within one year 24 20 0 0
Due for payment later than one year but
within five years 19 16 0 0
Due for payment later than five years - - - -
Total 43 36 0 0 No objects are subleased.
Global Reports LLC

NOTES TO THE F INANC IAL STATEMENTS
52 Industrial and Financial Systems, IFS AB (publ) – Corporate identity number 556122-0996
NOTE 26 – PARTICIPATIONS IN SUBSIDIARIES
Organization no. Registered office
Share of
capital/votes
Number of
shares
Book value,
SKr million, 2007
Book value,
SKr million, 2006
IFS Americas, Inc. United States 100% 100 104 104
IFS North America, Inc. United States 100% - -
IFS Industrial & Financial Systems Canada, Inc. Canada 100% - -
IFS Middle East FZ-LLC United Arab Emirates 100% 100 0 0
IFS Europe AB 556139-5541 Linköping, Sweden 100% 7 500 136 89
IFS Central & Eastern Europe Sp. z o.o Poland 100% 0 - 2
IFS Slovakia s.r.o. Slovakia 100% - -
IFS Czech s.r.o. Czech Republic 100% - -
IFS Hungary kft Hungary 100% - -
IFS Poland Sp. z o.o Poland 100% - -
Corporate Financial Systems ZAO Russia 50% - -
IFS Hellas SA Greece 90% - -
IFS Systems (Cyprus) Ltd Cyprus 90% - -
IFS Applications Iberica, S.A. Spain 100% - -
IFS Benelux BV Netherlands 100% - -
IFS Belgium BVBA (in liquidation) Belgium 100% - -
IFS Netherlands BV (in liquidation) Netherlands 100% - -
IFS Verwaltungsgesellschaft mbH Germany 100% - -
IFS Beteiligungsgesellschaft mbH Germany 100% - -
IFS Deutschland GmbH & Co KG Germany 100% - -
IFS France SA France 100% - -
SCI Le Château France 100% - -
IFS Italia Srl Italy 100% - -
Industrial and Financial Systems, IFS UK Ltd United Kingdom 100% - -
Application Software IFS South Africa (Pty) Ltd South Africa 100% - -
Motswedi IFS (Pty) Ltd South Africa 100% - -
Application Software IFS Consulting Services (Pty) Ltd South Africa 74% - -
Infiseuro, Serviços Informáticos Lda (in liquidation) Portugal 100% - -
IFS World Operations AB 556040-6042 Linköping, Sweden 100% 2 400 587 587
RDLS i Linköping AB 556209-6528 Linköping, Sweden 100% - -
IFS R&D International (Private) Ltd Sri Lanka 100% - -
IFS Japan Inc. Japan 100% 16 200 0 0
IFS Nordic AB 556248-4856 Linköping, Sweden 100% 1 000 136 136
At IFS AB 556221-7835 Linköping, Sweden 100% - -
IFS Danmark A/S Denmark 100% - -
IFS Norge AS Norway 100% - -
IFS Sverige AB 556211-7720 Linköping, Sweden 100% - -
Oy IFS Industrial Systems Finland AB Finland 100% - -
IFS R&D Asia Pacific Sdn Bhd Malaysia 100% 2 0 0
IFS R&D Ltd Sri Lanka 100% 300 000 0 0
IFS Research and Development (Private) Limited Sri Lanka 100% - -
IFS Solutions Asia Pacific Pte Ltd Singapore 100% 300 000 0 0
IFS (Beijing) Ltd People's Rep. of China 100% - -
IFS Philippines Inc. Philippines 100% - -
IFS Solutions (Thailand) Ltd Thailand 100% - -
IFS Systems (Thailand) Co. Ltd (in liquidation) Thailand 100% - -
IFS Australia Pty Australia 100% - -
IFS New Zealand New Zealand 100% - -
IFS Solution India Pvt Ltd India 100% - -
IFS Solutions (Singapore) Pte Ltd Singapore 100% 1 0 0
IFS Solutions Malaysia Sdn. Bhd Malaysia 100% - -
IFS Solutions (Shanghai) Co. Ltd People's Rep. of China 100% - -
IFS Solutions Thai Ltd Thailand 100% - -
IFS Sri Lanka Ltd Sri Lanka 50% 149 998 0 0
IFS Svensk Idéutveckling AB 556150-5735 Linköping, Sweden 100% 1 000 0 0
IFS Softwind AB 556279-8370 Värnamo, Sweden 100% - -
Torron System AB 556457-8960 Linköping, Sweden 100% 20 0 0
Vendimo Business Solutions AB 556400-2946 Gothenburg, Sweden 100% 1 754 383 15 12
Total book value in the Parent Company 978 930
Global Reports LLC

NOTES TO THE F INANC IAL STATEMENTS
Industrial and Financial Systems, IFS AB (publ) – Corporate identity number 556122-0996 53
PARENT COMPANY
SKr, million 2007 2006
ACCUMULATED ACQUISITION VALUE
Opening balance 2 457 2 450
Stockholders' contribution/share issue 88 7
Additional purchase price regarding acquisition previous year 3 -
Inter-company sale of subsidiaries -142 -
Adjustment for external divestments in previous years -162 -
Closing balance 2 244 2 457
ACCUMULATED DEPRECIATION
Opening balance -1 527 -1 527
Depreciation of stock in subsidiaries during the year - -4
Reversal of write-downs of shares in subsidiaries 4 4
Inter-company sale of subsidiaries 95 -
Adjustment for external divestments in previous years 162 -
Closing balance -1 266 -1 527
Book value 978 930 NOTE 27 – PARTICIPATIONS IN ASSOCIATED COMPANIES AND JOINT VENTURES
GROUP PARENT
SKr, million 2007 2006 2007 2006
Opening balance 7 6 5 4
Divestment of associated company -5 - -5 -
Share in earnings of associated
companies 1 1 - 1
Exchange differences -1 - - -
Closing balance 2 7 - 5
Registered office Net revenue
Earnings
before tax Assets Liabilities Equity
Share of
capital/votes
2007
INDIRECTLY OWNED
IFS Defence (pty) Ltd.* United Kingdom 109 14 117 74 43 50%
Beijing IFS UFIDA Co., Ltd People's Rep. of China 6 0 3 3 0 25%
Unitec Kurumsal Bilgi Sistemleri Yazlim Ve Danismanlika A.S Turkey 4 0 2 1 1 25%
2006
DIRECTLY OWNED
Elsidor KB, 916523-2126 Sweden 2 1 19 17 2 33%
INDIRECTLY OWNED
IFS Defence (pty) Ltd.* United Kingdom 104 12 97 70 27 50%
Beijing IFS UFIDA Co., Ltd People's Rep. of China 6 0 3 3 0 25%
Unitec Kurumsal Bilgi Sistemleri Yazlim Ve Danismanlika A.S Turkey 3 0 1 1 0 25%
* Accounted for according to the Proportional Method. See below.
Global Reports LLC
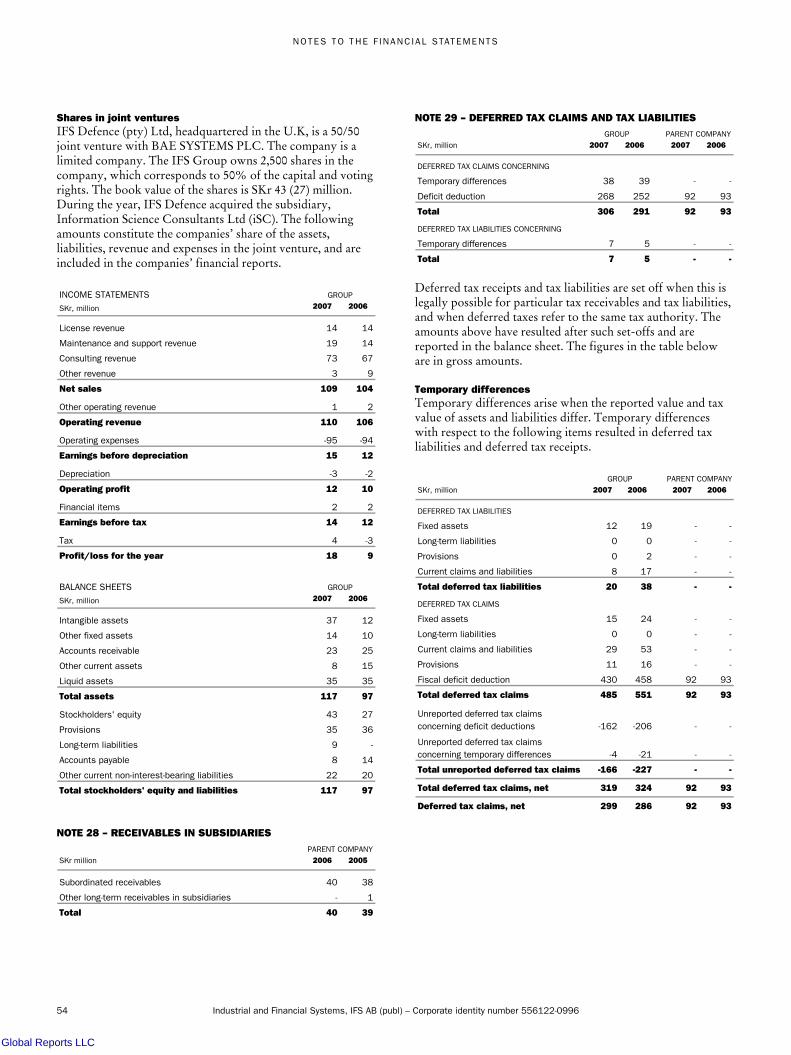
NOTES TO THE F INANC IAL STATEMENTS
54 Industrial and Financial Systems, IFS AB (publ) – Corporate identity number 556122-0996
Shares in joint ventures
IFS Defence (pty) Ltd, headquartered in the U.K, is a 50/50 joint venture with BAE SYSTEMS PLC. The company is a limited company. The IFS Group owns 2,500 shares in the company, which corresponds to 50% of the capital and voting rights. The book value of the shares is SKr 43 (27) million. During the year, IFS Defence acquired the subsidiary, Information Science Consultants Ltd (iSC). The following amounts constitute the companies’ share of the assets, liabilities, revenue and expenses in the joint venture, and are included in the companies’ financial reports. INCOME STATEMENTS GROUP
SKr, million 2007 2006
License revenue 14 14
Maintenance and support revenue 19 14
Consulting revenue 73 67
Other revenue 3 9
Net sales 109 104
Other operating revenue 1 2
Operating revenue 110 106
Operating expenses -95 -94
Earnings before depreciation 15 12
Depreciation -3 -2
Operating profit 12 10
Financial items 2 2
Earnings before tax 14 12
Tax 4 -3
Profit/loss for the year 18 9 BALANCE SHEETS GROUP
SKr, million 2007 2006
Intangible assets 37 12
Other fixed assets 14 10
Accounts receivable 23 25
Other current assets 8 15
Liquid assets 35 35
Total assets 117 97
Stockholders' equity 43 27
Provisions 35 36
Long-term liabilities 9 -
Accounts payable 8 14
Other current non-interest-bearing liabilities 22 20
Total stockholders' equity and liabilities 117 97 NOTE 28 – RECEIVABLES IN SUBSIDIARIES
PARENT COMPANY
SKr million 2006 2005
Subordinated receivables 40 38
Other long-term receivables in subsidiaries - 1
Total 40 39
NOTE 29 – DEFERRED TAX CLAIMS AND TAX LIABILITIES
GROUP PARENT COMPANY
SKr, million 2007 2006 2007 2006
DEFERRED TAX CLAIMS CONCERNING
Temporary differences 38 39 - -
Deficit deduction 268 252 92 93
Total 306 291 92 93
DEFERRED TAX LIABILITIES CONCERNING
Temporary differences 7 5 - -
Total 7 5 - - Deferred tax receipts and tax liabilities are set off when this is legally possible for particular tax receivables and tax liabilities, and when deferred taxes refer to the same tax authority. The amounts above have resulted after such set-offs and are reported in the balance sheet. The figures in the table below are in gross amounts. Temporary differences
Temporary differences arise when the reported value and tax value of assets and liabilities differ. Temporary differences with respect to the following items resulted in deferred tax liabilities and deferred tax receipts.
GROUP PARENT COMPANY
SKr, million 2007 2006 2007 2006
DEFERRED TAX LIABILITIES
Fixed assets 12 19 - -
Long-term liabilities 0 0 - -
Provisions 0 2 - -
Current claims and liabilities 8 17 - -
Total deferred tax liabilities 20 38 - -
DEFERRED TAX CLAIMS
Fixed assets 15 24 - -
Long-term liabilities 0 0 - -
Current claims and liabilities 29 53 - -
Provisions 11 16 - -
Fiscal deficit deduction 430 458 92 93
Total deferred tax claims 485 551 92 93
Unreported deferred tax claims
concerning deficit deductions -162 -206 - -
Unreported deferred tax claims
concerning temporary differences -4 -21 - -
Total unreported deferred tax claims -166 -227 - -
Total deferred tax claims, net 319 324 92 93
Deferred tax claims, net 299 286 92 93
Global Reports LLC

NOTES TO THE F INANC IAL STATEMENTS
Industrial and Financial Systems, IFS AB (publ) – Corporate identity number 556122-0996 55
Deficit deduction
The total value of the deficit deductions on the balance sheet day can be utilized no later than during the following years:
GROUP PARENT COMPANY
SKr, million 2007 2006 2007 2006
2008 (2007) 3 1 - -
2009 (2008) 12 2 - -
2010 (2009) 13 5 - -
2011 (2010) 12 7 - -
2012 (2011) 5 13 - -
Later 158 166 - -
No time limit 227 264 92 93
Total 430 458 92 93 NOTE 30 – OTHER LONG-TERM RECEIVABLES
SKr, million Deposits
Other
financial
assets Total
GROUP
Opening balance, Jan 1, 2006 10 5 15
Changes during the year 3 -4 -1
Closing balance, Dec 31, 2006 13 1 14
Changes during the year 12 4 16
Closing balance, Dec 31, 2007 25 5 30
PARENT COMPANY
Opening balance, Jan 1, 2006 2 - 2
Changes during the year - 0 0
Closing balance, Dec 31, 2006 2 0 2
Changes during the year 2 1 3
Closing balance, Dec 31, 2007 4 1 5 NOTE 31 – ACCOUNTS RECEIVABLE
Within the Group the following subsidiaries pledge part of their accounts receivable: IFS Sverige AB, IFS Norge AS, IFS Denmark A/S, IFS North America Inc., and IFS Hellas SA. See Notes 36 and 42. Write-downs of accounts receivable amounted to SKr 13 (18) million net.
GROUP
Mkr 2007 2006
Accounts receivable, gross 805 677
Provision for doubtful receivables -46 -44
Accounts receivable, net 759 633
AGE ANALYSIS
Accounts receivable, not due 523 437
Due 1–30 days 101 87
Due 31–90 days 39 41
Due >90 days 96 68
Total 759 633
NOTE 32 – OTHER RECEIVABLES
GROUP
SKr, million 2007 2006
Receivables, associated companies 4 3
Ongoing assignments 49 37
Accrued license revenue 2 37
Derivatives held for hedging of currencies 0 0
Other prepaid expenses 55 49
Other accrued income 5 13
Other receivables 24 21
Total 139 160 NOTE 33 – LIQUID ASSETS
The effective interest rate for current investments during the year was 5%. The current investments had an average duration of 10 days. Investments have been classified as liquid assets based on the assumption that: • the risk of value fluctuation is negligible, • they can easily be converted to cash, • they have a duration of not more than three months from
the time of acquisition.
GROUP PARENT COMPANY
SKr, million 2007 2006 2007 2006
Cash and bank 245 364 29 116
Current investment 9 8 - -
Total 254 372 29 116 NOTE 34 – STOCKHOLDERS’ EQUITY
Definition of items in the Group equity statement
GROUP
Capital stock Refers to the Parent Company’s capital stock. Other directly contributed capital Refers to stockholders’ equity that is contributed by the owners. This includes share premium reserves transferred to statutory reserves as of December 31, 2005. Provisions made to the share premium reserve from January 1, 2006 and in the future are reported as directly contributed capital. Reserves
This item consists solely of all exchange rate differences arising on translating financial reports from foreign entities that have prepared their financial reports in a currency other than that used by the Group for its financial reports. The Parent Company and Group present their financial reports in Swedish krona.
Global Reports LLC

NOTES TO THE F INANC IAL STATEMENTS
56 Industrial and Financial Systems, IFS AB (publ) – Corporate identity number 556122-0996
Accumulated loss The accumulated loss includes earnings for the year and profits carried forward/accumulated losses in the Parent Company and its subsidiaries, associated companies, and joint ventures. Previous provisions made to statutory reserves are included in this equity item. PARENT COMPANY
Restricted stockholders’ equity
Capital stock
Refers to the Parent Company’s capital stock. Reserve fund
Consists solely of amounts transferred to the premium fund before January 1, 2006. Unrestricted stockholders’ equity
Premium fund
When shares are issued at a premium, i.e. when the price paid for shares exceeds their listed price, an amount corresponding to the amount paid in excess of the listed price shall be transferred to the premium fund. Amounts transferred to the premium fund as of January 1, 2006, are included in unrestricted capital. Retained earnings
Consist of the previous year’s unrestricted stockholders’ equity after dividends, if any, have been paid. With earnings for the year and the premium fund, they constitute the total amount of unrestricted stockholders’ equity, i.e. the amount available for dividends to stockholders.
Change in number of shares Number Series A shares Series B shares Total
Shares on Jan 1, 2006 13 916 638 209 845 387 223 762 025
Conversion of convertible
debenture loan KV3B 1 770 846 1 770 846
322 697 322 697
Conversion of convertible
debenture loan KV4B 630 424 630 424
Conversion of convertible
debenture loan KV5B 6 879 942 6 879 942
473 473
Conversion of Series A to
Series B shares - - 0
Shares on Dec 31, 2006 13 916 638 219 449 769 233 366 407
Conversion of convertible
debenture loan KV3B 7 441 829 7 441 829
Conversion of convertible
debenture loan KV4B 5 749 941 5 749 941
Conversion of convertible
debenture loan KV5B 16 908 480 16 908 480
Conversion of Series A to
Series B shares - - 0
Shares on Dec 31, 2007 13 916 638 249 550 019 263 466 657
Quota value per share, SKr 2.00
Stockholders' equity at end of period, SKr 526 933 314
Ongoing conversion of
convertible debenture loan KV3B
Ongoing conversion of
convertible debenture loan KV5B
Three convertible/debentures/bonds remained in the company at the beginning of the year.
The KV3B convertible debenture was issued in 2003, the KV4B convertible debenture was issued in 2004, and the KV5B convertible bond was issued in 2004. On issue, KV3B carried the right to convert the debentures to 43,092,366 Series B shares between May 1, 2003 and February 20, 2007. KV4B carried the right to convert the debentures to 4,602,500 Series B shares between January 1, 2005 and July 15, 2007. KV5B carried the right to convert the bonds to 30,476,190 Series B shares between January 2, 2005 and March 18, 2008.
During the year, KV3B was converted in an amount of SKr 25.3 million, KV4B in an amount of SKr 39.6 million, and KV5B in an amount of SKr 88.8 million. KV3B and KV4B matured during 2007, on which KV3B was repaid in an amount of SKr 1.1 million, and KV4B in an amount of SKr 2.0 million. Number of shares Thousands 2007 2006
At end of period 263 467 233 366
At end of period, after full dilution 270 094 270 709
Average during the period 253 919 229 622
Average during the period, after full dilution 270 337 270 709
Global Reports LLC

NOTES TO THE F INANC IAL STATEMENTS
Industrial and Financial Systems, IFS AB (publ) – Corporate identity number 556122-0996 57
Share options
IFS has no outstanding share options program. Noonday Global Management Ltd have issued call options on market terms to the president (see Note 14). The call options entitle holders to acquire Series B shares. Changes in the number of outstanding share options and their weighted average strike price are as follows:
2007 2006
Average
strike price
Options,
thousands
Average
strike price
Options,
thousands
On January 1 7.35 2 900 5.49 5 109
Issued - - 9.50 500
Used 6.90 -2 400 4.25 -2 709
Matured - - - -
On December 31 9.50 500 7.35 2 900 Outstanding share options at year-end have the following year of maturity and strike prices:
Shares, thousands
Maturity, coming years Strike price 2007 2006
2008 9.50 500 500
Total 500 500
NOTE 35 – CONVERTIBLE DEBENTURES/BONDS
In 2003, the convertible debenture loan, KV3B, in a nominal amount of SKr 215 million, was subscribed for in a pre-emptive rights issue and by Förvaltnings AB Wasatornet at a subscription price of five (5) Swedish krona. The annual interest rate on the loan was 5% as of March 15, 2003. Interest was paid retroactively on an annual basis commencing on March 14, 2004, and falling due for payment on March 14 in subsequent years. The loan matured on March 14, 2007 insofar as it had not been converted prior to this date. On conversion, the right to interest lapsed for the period from the immediately preceding due date. The conversion rate was originally five (5) Swedish krona, but in connection with a stock issue in 2004 it was recalculated to SKr 3.40. During the year, SKr 25.3 million was converted. On the maturity date, the remaining nominal liability of SKr 1.1 million was paid.
A convertible debenture loan, KV4B, at a nominal amount of SKr 46 million, was raised in 2004. The loan was directed to holders of KV1B, who were invited to replace their convertible debentures with new debentures in KV4B, of which IFS Svensk Idéutveckling, an IFS subsidiary, subscribed for an amount of SKr 20 million. IFS Svensk Idéutveckling divested its holding in KV4B in 2005. The annual interest rate on the loan corresponded to SEB Basic Interest Rate, currently 4.00%, plus 1.5 percentage points. Interest was paid annually in arrears, falling due on January 15, 2005–2007, June 30, 2007, and on maturity, on August 30, 2007. The original conversion price was SKr 10.00, but in connection with a new stock issue in 2004 was recalculated to SKr 6.90. During 2007, SKr 39.7
million was converted. When the loan matured, the remaining nominal liability of SKr 2.0 million was paid.
The KV5B convertible bond loan, at a nominal value of SKr 16 0million, was raised during 2004. Förvaltnings AB Wasatornet and Skandinaviska Enskilda Banken AB (publ) (SEB) subscribed for the loan and paid for the issue by setting it off against receivables. Wasatornet acquired SEB’s share of the loan and offered the convertible bonds for subscription in connection with the rights issue implemented in the fall of 2004. KV5B is secured thought secondary pledge. The security assets are primarily pledged to IFS’ lending bank. The secondary pledge can be exercised to the extent that the value of the security is not required by IFS’ lending bank. The annual interest rate is 5% and is paid annually in arrears, falling due for payment on March 15, 2006, March 15, 2007, March 15, 2008, and on maturity, on March 31, 2008. The conversion price is SKr 5.25. Full conversion of the loan entails a dilution of 6.6 million Series B shares, corresponding to 2.5% of the capital and 1.7% of the voting rights. The KV5B convertible bond is listed on the OMX Nordic Exchange. At the end of December, KV5B was listed at a rate of 115%.
At the end of the year, the KV5B convertible bond remained. Convertible
debenture/bond Directed to Issue price
Conversion
price Interest
KV3B Stockholders 5.00 3.40 5.00%
KV4B Holders of KV1B 10.00 6.90 5.50%
KV5B Stockholders 5.25 5.25 5.00% Convertible
debenture/bond Duration Period for conversion
KV3B 2003-02-03 – 2007-03-14 2003-05-01 – 2007-02-20
KV4B 2004-08-16 – 2007-08-15 2005-01-01 – 2007-07-15
KV5B 2004-12-23 – 2008-03-31 2005-01-02 – 2008-03-18
Convertible
debenture/bond
Additional number of
shares if conversion
at time of issue
Additional number of
shares if conversion
by end of period
Price in
December
KV3B 43 092 366 - -
KV4B 4 602 500 - -
KV5B 30 476 190 6 627 003 115%
Global Reports LLC

NOTES TO THE F INANC IAL STATEMENTS
58 Industrial and Financial Systems, IFS AB (publ) – Corporate identity number 556122-0996
Change in booked debt PARENT COMPANY
SKr, million KV3B KV4B KV5B Total
Opening balance Jan 1, 2006 29 40 124 193
Conversions -7 -4 -36 -47
Interest cost 2 3 13 18
Issuing cost 0 0 1 1
Adjustment of stockholders' equity,
premature redemption 1 1 6 8
Adjustment of issuing cost, premature
redemption 0 0 0 0
Booked debt Dec 31, 2006 25 40 108 173
Nominal debt Dec 31, 2006 26 42 124 192
Conversions -25 -40 -89 -154
Interest cost 1 1 5 7
Issuing cost 0 0 1 1
Adjustment of stockholders' equity,
premature redemption 0 1 8 9
Adjustment of issuing cost, premature
redemption 0 0 1 1
Repayment -1 -2 - -3
Booked debt Dec 31, 2007 - - 34 34
Nominal debt Dec 31, 2007 - - 35 35
NOTE 36 – LIABILITIES TO CREDIT INSTITUTIONS
GROUP PARENT COMPANY
SKr, million 2007 2006 2007 2006
LONG-TERM LIABILITIES
Overdraft facility - 108 - 97
Bank loan 31 42 26 36
Financial leasing liabilities 2 1 - -
CURRENT LIABILITIES
Factoring 57 134 - -
Current portion of bank loan 87 17 81 11
Current portion of financial leasing
liabilities 2 3 - -
Total 179 305 107 144
Liabilities falling due later than five
years after the balance sheet day - - - -
Granted overdraft facility, bank loan,
and factoring 400 334 326 144
Unused overdraft facility, bank loan, and
factoring 225 33 219 - For external financing, agreements exist entailing financial obligations in respect of cash flow, the ratio of interest-bearing liabilities to earnings and the ratio of liabilities to credit institutions to receivables. With the signing of a new financing agreement at the end of the year, local financing of working capital in subsidiaries will be repaid and terminated.
NOTE 37 – RISK STRUCTURE PERTAINING TO INTEREST AND FINANCING
GROUP
Change of interest in the interval
0–6 MONTHS 7–12 MONTHS 13–60 MONTHS MORE THAN 60 MONTHS TOTAL
Nominal amount 2007 2006 2007 2006 2007 2006 2007 2006 2007 2006
Bank overdraft facilities - 108 - - - - - - - 108
Factoring 57 134 - - - - - - 57 134
Bank loan 118 60 - - - - - - 118 60
Financial leasing liabilities 3 3 0 0 1 0 - - 4 3
Convertible debenture/bond KV3B - 26 - - - - - - - 26
Convertible debenture/bond KV4B - 42 - - - - - - - 42
Convertible debenture/bond KV5B 35 - - - - 124 - - 35 124
Other external loans 0 1 - - - - - - 0 1
Total 213 374 0 0 1 124 - - 214 498
Global Reports LLC

NOTES TO THE F INANC IAL STATEMENTS
Industrial and Financial Systems, IFS AB (publ) – Corporate identity number 556122-0996 59
Loan and credit maturity in the interval
0–6 MONTHS 7–12 MONTHS 13–60 MONTHS MORE THAN 60 MONTHS TOTAL
Nominal amount 2007 2006 2007 2006 2007 2006 2007 2006 2007 2006
Bank overdraft facilities 7 73 - 48 - - - - 7 121
Factoring 57 80 - - - 74 - - 57 154
Bank loan 100 11 26 6 191 43 19 0 336 60
Financial leasing liabilities 1 1 1 1 2 1 - - 4 3
Convertible debenture/bond KV3B - 26 - - - - - - - 26
Convertible debenture/bond KV4B - - - 42 - - - - - 42
Convertible debenture/bond KV5B 35 - - - - 124 - - 35 124
Other external loans 0 1 - - - - - - 0 1
Total 200 192 27 97 193 242 19 0 439 531
Includes unused bank overdraft and bank loan. See Note 35 for the complete terms and conditions of the convertible debentures/bonds. NOTE 38 – PENSION COMMITMENTS
Provisions for defined-benefit pension plans
GROUP
SKr, million 2007 2006
Sweden 8 20
Norway 0 3
United Kingdom 33 36
Other countries 2 1
Total 43 60
Provisions for social security costs 1 0
Total provisions for pensions 44 60 The Group has a small number of defined-benefit pension plans, according to which employees are entitled to benefits on resignation based on their final salary and years of service. The largest plans are in Sweden, Norway, and the United Kingdom. Most pension plans held by the Groups are premium-based. Defined-benefit pension plans, 2007
The amounts reported in the consolidated balance sheet have been calculated according to the following:
SKr, million Sweden Norway
United
Kingdom
Other
countries Total
Present value of funded
obligations 233 56 208 - 497
Real value of plan assets -221 -48 -168 - -437
Total 12 8 40 0 60
Present value of unfunded
obligations - - - 2 2
Unrecognized actuarial gains
(+) and losses (-) -4 -8 -7 - -19
Total 8 0 33 2 43
Pension costs
The total pension costs reported in the consolidated income statement are the following: SKr, million 2007 2006
Service costs during the present year 23 22
Actuarial losses 0 2
Interest expenses 23 21
Expected return on plan assets -25 -20
Total costs for defined-benefit plans 21 25
Total costs for defined-contribution plans 48 43
Total pension costs 69 68 Defined-benefit pension plans
The items in the income statement are reported under the following headings: SKr, million 2007 2006
Personnel-related costs 23 24
Financial expenses -2 1
Total 21 25 Defined-benefit pension plans, 2007
Specification of the changes in net liabilities reported in the consolidated balance sheet:
SKr, million Sweden Norway
United
Kingdom
Other
countries Total
Net liability at beginning of year 20 3 36 1 60
Net cost reported in income
statement 12 4 4 1 21
Funds contributed by employer
to funded plans -24 -7 -6 - -37
Exchange rate differences in
international plans - 0 -1 0 -1
Net liability at end of year 8 0 33 2 43
Global Reports LLC

NOTES TO THE F INANC IAL STATEMENTS
60 Industrial and Financial Systems, IFS AB (publ) – Corporate identity number 556122-0996
Key actuarial assumptions 2007 2006
Discount rate 5.1% 4.5%
Expected return on plan assets 6.2% 5.8%
Future annual salary increases 3.5% 2.9%
Increase in Swedish price base amount 3.0% 2.5%
Future annual pension increases 2.3% 2.3%
Personnel turnover 6.4% 5.5% For Sweden, the current value of the commitment amounted to SKr 233 million. If the discount rate had been one percentage point higher, the liability would have decreased by SKr 55 million; if it had been one percentage point lower, the liability would have increased by SKr 76 million. Plan assets
Plan assets consist of the following: 2007 2006
Equities 55% 56%
Fixed-interest bonds 36% 29%
Other assets 9% 15%
Total 100% 100% Provisions for defined-benefit pension plans
PARENT COMPANY
SKr, million 2007 2006
Provisions according to the Swedish Act on Income Security 1 1 NOTE 39 – OTHER PROVISIONS AND OTHER LIABILITIES
GROUP
SKr, million 2007 2006
Restructuring reserve 9 11
Other provisions 1 0
Other long-term liabilities 13 3
Total 23 14
Restructuring reserve
SKr, million Group
Opening balance Dec 31, 2006 41
Reversal, restructuring reserve 0
Provision, restructuring reserve 5
Use of restructuring reserve -28
Effects of exchange rate fluctuations -3
Closing balance Dec 31, 2006 15
Less current portion -4
Restructuring reserve, long term 2006 11
Reversal, restructuring reserve -1
Provision, restructuring reserve 3
Use of restructuring reserve -6
Effects of exchange rate fluctuations 0
Closing balance Dec 31, 2007 11
Less current portion -2
Restructuring reserve, long term 2007 9 NOTE 40 – OTHER LIABILITIES
GROUP
SKr, million 2007 2006
Deferred maintenance revenue 276 258
Deferred license- and consulting revenue 46 21
Accrued consulting expenses 5 10
Advances from customers 2 5
VAT liabilities 73 75
Accrued payroll expenses 140 118
Accured pension cost, defined contribution plans 7 6
Accrued social security contributions 53 51
Retained preliminary tax for employees 29 24
Liabilities to employees 17 17
Accrued expenses, third-party suppliers 17 52
Accrued interest expenses 2 7
Liabilities to associated companies 0 0
Derivatives held for hedging of currencies 1 0
Miscellaneous other liabilities 8 20
Other accrued expenses 82 50
Other prepaid revenue 1 2
Total 759 716 NOTE 41 – ACCRUED EXPENSES AND PREPAID INCOME
PARENT COMPANY
SKr, million 2007 2006
Accrued interest expenses 2 6
Accrued social security contributions 2 1
Accrued payroll expenses 2 1
Other accrued expenses 4 4
Total 10 12
Global Reports LLC

NOTES TO THE F INANC IAL STATEMENTS
Industrial and Financial Systems, IFS AB (publ) – Corporate identity number 556122-0996 61
NOTE 42 – PLEDGED ASSETS
GROUP PARENT COMPANY
SKr, million 2007 2006 2007 2006
Real estate mortgages 17 41 - -
Chattel mortgages 137 137 4 4
Equipment utilized according to
operating leasing agreements 43 36 0 0
Accounts receivable (factoring) 333 298 - -
Participations in limited partnerships - 5 - 5
Blocked bank accounts 3 6 3 2
Shares in subsidiaries - - 963 789
Net assets in subsidiaries 501 580 - -
Other 229 247 2 -
Total 1 263 1 350 972 800 IFS has issued warrants as security for credit that entitle the lender to acquire all of the stock in IFS R&D International Pte Ltd for one (1) Swedish krona unless the Company fulfills agreed commitments in respect of future interest rate and amortization transactions.
Mortgages, receivables and shares in subsidiaries have been pledged as security for check credits, factoring and loans. Liabilities to credit institutions are detailed in Note 36.
Pledged assets pertaining to shares in subsidiaries are recognized at amounts corresponding to the corporate net assets. NOTE 43 – CONTINGENT LIABILITIES
GROUP PARENT COMPANY
SKr, million 2007 2006 2007 2006
Sureties, external 2 2 - 0
General surety for subsidiaries - - 24 17
Parent Company guarantees - - 83 77
Total 2 2 107 94
NOTE 44 – ADJUSTMENTS FOR ITEMS NOT INCLUDED IN CASH FLOW
GROUP PARENT COMPANY
SKr, million 2007 2006 2007 2006
Depreciation 174 169 0 0
Restructuring costs, net -3 -24 - -
Provisions for pensions -14 -28 0 0
Bad debts 13 18 - -
Profit on disposals -3 -4 0 0
Loss on disposals - 0 - -
Exchange rate gains/losses, net 7 19 5 11
Write-down of financial assets 0 - -4 0
Dividend received - - -371 -
Interest costs for the year 24 43 22 36
Interest paid -29 -49 -27 -41
Interest income for the year -6 -5 -2 0
Interest received 6 5 2 0
Interest and issue expenses,
convertible loan 8 19 8 19
Other adjustments -5 -3 1 2
Total 172 160 -366 27 NOTE 45 – ACQUISITION OF SUBSIDIARIES/OPERATIONS
During the year, the following shares in subsidiaries were acquired and affected Group liquid assets as given below:
GROUP
2007 2006
IFS Benelux BV May 2006 5% - -3
IFS Australia Pty Oct 2006 49% - -5
Information Science Consultants Ltd July 2007 50% -35 -
Total purchase sum -35 -8
Portion of purchase sum not paid 9 6
Liquid assets in the acquired companies 17 -
-9 -2
Payment of purchase price related to past acquisitions -2 -1
-3 -2
-14 -5
Company
SKr, million
Date of
acquisition
Acquired
share in
equity and
votes
Total cash flow pertaining to investments in
subsidiaries
Effect of the year's acquisitions on the
Group's liquid assets
Payment of supplementary consideration price related to
past acquisitions
During the year Information Science Consultants Ltd (iSC) was acquired by IFS Defence Ltd, which is a joint venture with BAE Systems Ltd. The purchase price, including transaction costs, was SKr 70 million, of which SKr 52 million was paid during 2007. The remainder of the purchase price will be paid during 2008 and 2009. Of the amount above, SKr 35 million of the purchase price and SKr 26 million of the amount paid pertain to IFS’ share of the acquisition.
A consideration of SKr 2 million concerning last year’s acquisition of IFS Australia Pty was paid. The remainder will be paid during 2008. A supplementary consideration of SKr 3 million has been paid in respect of the acquisition of Vendimo Business Solutions AB in previous years.
Global Reports LLC

NOTES TO THE F INANC IAL STATEMENTS
62 Industrial and Financial Systems, IFS AB (publ) – Corporate identity number 556122-0996
NOTE 46 – ACQUISITION OF JOINT VENTURES CONSOLIDATED USING THE PROPORTIONAL METHOD
Acquisition analysis
GROUP
MKr
Reported value
in acquired
company before
acquisition
Real value
reported in
Group
Tangible fixed assets 0 0
Intangible fixed assets 0 10
Accounts receivable and other receivables 2 2
Cash and cash equivalents 17 17
Accounts payable and other liabilities -8 -11
Net identifiable assets and liabilities 11 18
Group goodwill 17
Consideration -35
Minus: liability to vendors 9
Paid consideration -26
Minus: cash and cash equivalents in acquired operations 17
Effect on cash and cash equivalents -9 Cash-flow analysis
GROUP
SKr, million 2007 2006
Cash flow from current operations 9 9
Cash flow from investment operations -11 -5
Cash flow after investment operations -2 4
Cash flow from financing operations 3 -3
Cash flow for the year 1 1
LIQUID FUNDS 0 0
Liquid funds on January 1 35 36
Exchange rate differences in liquid funds -1 -2
Liquid funds on December 31 35 35 NOTE 47 – EXTERNAL SALE OF SUBSIDIARIES/OPERATIONS
The total value of divested assets and liabilities, purchase prices and their effect on Group liquid assets was as follows:
GROUP
SKr, million 2007 2006
Fixed assets 8 -
Profit/loss on sale 3 0
Total purchase price 11 0
Opening balance, purchase price not yet received 2 0
Supplementary consideration - 3
Reduction of claims in respect of divested subsidiaries - -
Exchange rate difference on receivable 0 -
Supplementary consideration, portion not yet received -2 -3
Total cash flow pertaining to divestment of
subsidiaries 11 0
NOTE 48 – NET ACQUISITION OF TANGIBLE FIXED ASSETS
GROUP PARENT COMPANY
SKr, million 2007 2006 2007 2006
Payments for investments in previous
years -1 -3 - -
Investments for the year, net -17 -20 0 0
Total -18 -23 0 0 Net investments for the year have been adjusted by SKr 2 million in respect of cash flow to account for the sale of real estate in France under Note 47, External sale of subsidiaries/operations. NOTE 49 – FINANCIAL RISK MANAGEMENT AND DERIVATIVES
Via its business operations, the Group is exposed to a number of financial risks, including fluctuations in earnings, balance sheet, and cash flow resulting from changes in exchange rates, rates of interest, and risks related to refinancing and credit. Group financial policy for risk management has been determined by the board and forms a framework of guidelines and regulations in the form of risk mandates and limits for financial operations.
The board has the overall responsibility for financial risks, which is delegated to the CEO, the CFO, and a member of the board. The IFS Group has centralized financial management, which means that the chief responsibility for financial management resides with the Parent Company. The overall objective for the finance department is to minimize the negative effects of market fluctuations on Group earnings and stockholders’ equity and to provide cost-effective financing.
Risk is managed by a central finance department (Group Finances) according to principles approved by the board. Group Finances shall identify, evaluate, and hedge against financial risks in close collaboration with operational units within the Group. The board establishes a financial policy for overall risk management and for specific areas that include risks related to exchange rates, interest rates, credit on investment in financial instruments, financing, and liquidity. The Group can use derivatives such as currency futures and interest rate swaps to reduce exposure to risk. Exchange rate risks
As it operates internationally, the Group is exposed to transaction risks related to future business transactions and reported assets and liabilities. Exposure to exchange rate fluctuations refers primarily to the Euro (€), the Pound Sterling (£), the Norwegian krone (NKr), the Polish zloty (PLN), and the U.S. dollar ($). Group financial policy stipulates that subsidiaries make and receive payments in the local currency whenever possible. Group Finances is responsible for reducing the net position in each currency by utilizing currency loans and currency futures.
The Parent Company has a number of holdings in foreign companies whose net assets are exposed to currency translation risks. Currency exposure of net assets in
Global Reports LLC

NOTES TO THE F INANC IAL STATEMENTS
Industrial and Financial Systems, IFS AB (publ) – Corporate identity number 556122-0996 63
subsidiaries can be managed by borrowing in the respective foreign currency, for example.
The Group’s risk management policy is to hedge the position reported that pertains to assets and liabilities. See Note 50 for sensitivity analysis. Interest rate risks
Group revenue, expenses and cash flow from operations are essentially independent of changes in interest levels in the market. The Group has no significant interest-bearing assets. Group policy stipulates a duration of 6–18 months exposure in interest rates. As the Group’s debt portfolio has decreased through lower utilization of operating capital facilities, major conversions of the convertible debenture loan programs, and the fact that the Group now has a positive net liquidity, existing interest-bearing liabilities are of short duration. In respect of structure of the Group’s existing debt portfolio, the present duration is between 1 and 2 months. The Group can borrow at a floating interest rate and use interest rate swaps to secure cash flow pertaining to future interest payments. The financial effect of this is that it converts borrowing from floating to fixed interest rates. On the balance sheet day, the Group had no holdings in interest derivatives. Credit risk related to investment in financial instruments
The Group has no substantial concentration of credit risks. If investments are made in financial instruments, this is done only in securities issued by institutions with a high credit rating. The Group applies principles that limit the amount of credit exposure to individual financial institutions. Financing risks
The Group shall avoid having too much credit due for payment in the same 12-month period. The Group shall strive to ensure that a maximum of 25% of contracted loans and credit limits falls due in the same 12-month period. At the end of the year, the Group entered into a new financing agreement with a duration of 2½ years. The new financing agreement covers a higher volume than the former agreement. Under the terms of the agreement, local operating capital facilities shall be repaid and terminated. At year-end, the average term of contracted loans and credit facilities was 23 months; 22% of the loan portfolio matures within 12 months. Of this, 37% pertain to the KV5B convertible bonds, and 7% are credit facilities that normally have a 12-month term of contract. Liquidity risk
Managing liquidity risks is characterized by a cautious approach, which entails retaining sufficient liquid assets and accessible financing via agreed credit facilities. Fair-value hedge
The current portfolio of currency futures corresponds to a value of SKr 519 (485) million, distributed as follows (corresponding value in SKr million): € 69, PLN 171, $44, £ 48, NKr 51, and AED 77, whereas other currencies account
for a value corresponding to SKr 59 million. The derivatives have a term of less than 3 months and are fair-value hedges. Fair value estimation
Financial assets
Financial assets consist primarily of deferred tax receivables, minority interests in the Group and shares in subsidiaries held by the Parent Company. The fair value of the assets is calculated through the income statement. Accounts receivable, other receivables, accounts payable and other liabilities
For receivables and payables with a residual term of less than one year, the reported value is considered to reflect the fair value. Other receivables and payables are estimated at present value with a discount rate corresponding to that used to estimate interest-bearing liabilities. There are no significant differences between fair value and reported value. Currency forward contracts
The fair value of financial instruments traded on an active market is based on the quoted market rates on the balance sheet day. Currency forward contracts are valued at prevailing market rates by deducting the prevailing spot rate from the quoted market rate. The difference between fair value and the reported value is SKr 0 million. Liabilities to credit institutions
The fair value is based on discounted future cash flows in respect of the principal and interest. There are no significant differences between fair value and reported value. Convertible debentures/bonds
The fair value of the liability element and the warrant element was determined when the convertible debentures/bonds were issued. There is no substantial difference between the fair value and the reported value in the liability element. Warrant issued
IFS has issued warrants as security for credit that entitle the lender to acquire all of the stock in IFS R&D International Pte Ltd for one (1) Swedish krona unless the Company fulfils agreed commitments in respect of future interest rate and amortization transactions. The difference between fair value and reported value is SKr 0 million.
Global Reports LLC

NOTES TO THE F INANC IAL STATEMENTS
64 Industrial and Financial Systems, IFS AB (publ) – Corporate identity number 556122-0996
NOTE 50 – CONVERSION RATES
Rate at year end Average rate
2007 2006 2007 2006
EUR 9.45 8.97 9.25 9.26
GBP 12.97 13.35 13.53 13.58
NOK 1.18 1.10 1.15 1.15
PLN 2.62 2.35 2.44 2.38
USD 6.52 6.80 6.76 7.38 If the Group’s most important currencies were to change by one percentage point, revenue for 2007 would be affected in an amount of SKr 14 million, and the Group’s EBIT by SKr 0 million. See Note 49.
NOTE 51 – INFORMATION ABOUT THE PARENT COMPANY
Industrial and Financial Systems, IFS AB, is a Swedish registered company headquartered in Linköping, Sweden. The company is listed on the OMX Nordic Exchange, Stockholm Mid-Cap list. The visiting address of the head office is Teknikringen 5, Linköping, Sweden; its postal address is Box 1545, SE-581 15 Linköping, Sweden.
The consolidated accounts for 2007 are reported for the Parent Company and its subsidiaries, which together comprise the Group. The Group also includes shares owned in associated companies and a joint venture company.
The consolidated accounts and the annual report have been prepared in accordance with the international accounting standards referred to in Regulation (EC) No. 1606/2002 of the European Parliament and Council of July 19, 2002, on the application of international accounting standards and generally accepted accounting principles. They give a true and fair view of the financial position and results of the Group and Parent Company. The board of directors’ report for the Group and Parent Company gives a true and fair view of Group and Parent Company operations and financial position, and describes the essential risks and uncertainties to which the Group and Parent Company are exposed.
Linköping, March 3, 2008
Anders Böös CHAIRMAN OF THE BOARD
Gregory Gorman Ulrika Hagdahl Bengt Nilsson VICE CHAIRMAN
Jakob Palmstierna Alastair Sorbie Christina Stercken PRESIDENT & CEO
As indicated above, the annual report and the consolidated accounts were approved for publication by the board of directors on March 3, 2008. The consolidated income statement and balance sheet and the income statement and balance sheet for the Parent Company will be the subject of adoption at the Annual General Meeting on April 3, 2008.
Our audit report was submitted on March 3, 2008
Öhrlings PricewaterhouseCoopers AB
Lars Wennberg Nicklas Kullberg AUTHORIZED PUBLIC ACCOUNTANT AUTHORIZED PUBLIC ACCOUNTANT PRINCIPAL AUDITOR
Global Reports LLC

AUD IT REPORT
Industrial and Financial Systems, IFS AB (publ) – Corporate identity number 556122-0996 65
AUDIT REPORT To the annual meeting of the shareholders of Industrial and Financial Systems, IFS AB (publ) Corporate identity number 556122-0996 We have audited the annual accounts, the consolidated accounts, the accounting records and the administration of the board of directors and the managing director of Industrial and Financial Systems, IFS AB (publ) for the year 2007. The annual report of the company is included in the printed version of this document on pages 13–64. The board of directors and the managing director are responsible for these accounts and the administration of the company as well as for the application of the Annual Accounts Act when preparing the annual accounts and the application of international financial reporting standards IFRSs as adopted by the EU and the Annual Accounts Act when preparing the consolidated accounts. Our responsibility is to express an opinion on the annual accounts, the consolidated accounts and the administration based on our audit.
We conducted our audit in accordance with generally accepted auditing standards in Sweden. Those standards require that we plan and perform the audit to obtain reasonable assurance that the annual accounts and the consolidated accounts are free of material misstatement. An audit includes examining, on a test basis, evidence supporting the amounts and disclosures in the accounts. An audit also includes assessing the accounting principles used and their application by the board of directors and the managing director and significant estimates made by the board of directors and the managing director when preparing the annual accounts and consolidated accounts as well as evaluating the overall presentation of information in the
annual accounts and the consolidated accounts. As a basis for our opinion concerning discharge from liability, we examined significant decisions, actions taken and circumstances of the company in order to be able to determine the liability, if any, to the company of any board member or the managing director. We also examined whether any board member or the managing director has, in any other way, acted in contra-vention of the Companies Act, the Annual Accounts Act or the Articles of Association. We believe that our audit provides a reasonable basis for our opinion set out below.
The annual accounts have been prepared in accordance with the Annual Accounts Act and give a true and fair view of the company’s financial position and results of operations in accordance with generally accepted accounting principles in Sweden. The consolidated accounts have been prepared in accordance with international financial reporting standards IFRSs as adopted by the EU and the Annual Accounts Act and give a true and fair view of the group’s financial position and results of operations. The statutory administration report is consistent with the other parts of the annual accounts and the consolidated accounts.
We recommend to the annual meeting of shareholders that the income statements and balance sheets of the parent company and the group be adopted, that the profit of the parent company be dealt with in accordance with the proposal in the administration report and that the members of the board of directors and the managing director be discharged from liability for the financial year.
Stockholm, March 3, 2008
Öhrlings PricewaterhouseCoopers AB
Lars Wennberg Nicklas Kullberg AUTHORIZED PUBLIC ACCOUNTANT AUTHORIZED PUBLIC ACCOUNTANT AUDITOR IN CHARGE
Global Reports LLC

BOARD OF D IRECTORS
66
BOARD OF DIRECTORS ANDERS BÖÖS
Chairman of the board Stockholm, Sweden. Born 1964. Member of the board since 2003. Principal occupation: Board memberships. Other assignments: Chairman of the board of Cision AB. Member of the board of Investment AB Latour, CLS Holdings Plc, Haldex AB, Securitas Systems AB, and Avec Property Fund-Baltic States AB. BENGT NILSSON
Deputy chairman of the board Gothenburg, Sweden. Born 1955. Member of the board since 1983. Principal occupation: Board memberships and consulting assignments. Other assignments: Member of the board of BoNil AB, Pagero AB, e-cactus AB, Greenfield AB, GreenTrade AB, Hikka Group AB, Hikkadua Investments AB, Homes and Villas Ltd, Ides AB, Norelia AB, IQ Object AB, and Pointer AB. GREGORY GORMAN
Tokyo, Japan. Born 1972. Member of the board since 2005. Principal occupation: Chief Manager, Corporate Strategy Office, Nidec Corporation. Other assignments: – ULRIKA HAGDAHL
Stockholm, Sweden. Born 1962. Member of the board since 2003. Principal occupation: Investment manager, Cancale Förvaltning. Other assignments: Member of the board of Beijer Electronics AB and Kopylovskoye AB. JACOB PALMSTIERNA
Stockholm, Sweden. Born 1934. Member of the board since 2004. Principal occupation: Board memberships. Other assignments: Member of the board of Easy Park A/S. ALASTAIR SORBIE
Bishop Stratford, Herts, United Kingdom. Born 1953. Member of the board since 2006. Principal occupation: President and CEO of IFS AB. Other assignments: – CHRISTINA STERCKEN
Munich, Germany. Born 1959. Member of the board since 2004. Principal occupation: Partner, EAC Euro Asia Consulting PartG. Other assignments: –
Global Reports LLC

SEN IOR MANAGEMENT AND AUD I TORS
67
SENIOR MANAGEMENT ALASTAIR SORBIE
President and CEO Born 1953. Employed by IFS since 1997. HÅKAN ZADLER
Chief Financial Officer Born 1960. Employed by IFS since 2007. FREDRIK VOM HOFE
Vice President, Business Development Born 1966. Employed by IFS since 2003. THOMAS PETERSSON
Head of Products & Marketing Born 1959. First employed by IFS 1985. Number of shares after full dilution held by members of the board and senior management
Series A Series B
Anders Böös (Chairman of the board) 3 950 000 89 349
Bengt Nilsson 3 973 213 1 413 265
Ulrika Hagdahl - 300 000
Alastair Sorbie - 567 760
Thomas Petersson 177 874 -
Total 8 101 087 2 370 374
Convertible debentures/bonds and options held on December 31, 2007 are
expressed as shares to enable comparison.
AUDITORS Öhrlings PricewaterhouseCoopers AB Auditor since 2001. LARS WENNBERG
Authorized public accountant and Auditor in charge Born 1957. NICKLAS KULLBERG
Authorized public accountant Born 1970.
For information concerning stock, options, and convertible debentures/bonds held by members of the board and senior management, see note 14.
Photographs of the members of the board and senior management of the company are available at www.ifsworld.com.
Global Reports LLC

F INANC IAL TREND
68
FINANCIAL TREND As of fiscal year 2005, the IFRS accounting principles have been applied; fiscal years 2003 and 2004 have been restated accordingly.
For further information, see “Accounting principles”.
FROM THE INCOME STATEMENTS SKr, million 2003 2004 2005 2006 2007
License revenue 513 451 383 433 478
Maintenance & support revenue 406 470 528 600 659
Consulting revenue 1 302 1 174 1 175 1 140 1 194
Other revenue 115 83 63 36 25
Net revenue 2 335 2 178 2 149 2 209 2 356
Capitalized work for own use 173 153 121 125 122
Operating expenses -2 293 -2 149 -2 001 -2 041 -2 152
EBITDA before other operating items 215 182 269 293 326
Other operating revenue 16 80 36 19 12
Other operating expenses -7 -126 -16 -23 -23
EBITDA 224 136 289 289 315
Depreciation, amortization, and write-downs -226 -264 -192 -169 -174
EBIT -2 -128 97 120 141
Financial revenue 5 8 31 6 13
Financial expenses -115 -84 -61 -51 -25
Profit/loss before tax -112 -204 67 75 129
Taxes -17 -25 -17 171 -7
Profit/loss for the year -129 -229 50 246 122
FROM THE BALANCE SHEETS SKr, million Dec 31, 2003 Dec 31, 2004 Dec 31, 2005 Dec 31, 2006 Dec 31, 2007
Intangible fixed assets 854 765 758 728 722
Other fixed assets 299 252 230 397 418
Accounts receivable 599 565 615 633 759
Other current assets 187 146 183 175 158
Liquid assets 137 152 319 372 254
Total assets 2 076 1 880 2 105 2 305 2 311
Stockholders' equity including minority interest 329 488 615 866 1 117
Long-term liabilitiies 496 403 468 338 107
Accounts payable 163 153 146 151 131
Current interest-bearing liabilities 328 161 167 219 180
Other current liabilities 760 675 709 731 776
Total stockholders' equity and liabilities 2 076 1 880 2 105 2 305 2 311
FROM THE CASH FLOW STATEMENTS SKr, million 2003 2004 2005 2006 2007
Cash flow from operations before change in working capital 72 94 189 227 283
Change in working capital -2 -94 -32 25 -109
Cash flow from current operations 70 0 157 252 174
Cash flow from investment operations -239 -76 -129 -166 -154
Cash flow after investment operations -169 -76 28 86 20
Cash flow from financing operations 213 97 126 -16 -140
Cash flow for the year 44 21 154 70 -120
Liquid funds on January 1 106 137 152 319 372
Exchange rate differences in liquid funds -13 -6 13 -17 2
Liquid funds at end of period 137 152 319 372 254
Global Reports LLC

F INANC IAL TREND
69
KEY FIGURES1 2003 2004 2005 2006 2007
Revenue indicatorNet revenue growth % -14% -7% -1% 3% 7%
Net revenue outside Sweden % 75% 77% 79% 80% 78%
Net revenue per employee SKr, '000 820 818 876 835 890
Expense and expenditure indicatorTotal development SKr, million 269 256 183 190 187
of which, capitalized SKr, million 173 153 121 125 122
Development expenditure/net revenue % 12% 12% 9% 9% 8%
Development expenditure/license revenue % 52% 57% 48% 44% 39%
Product development expenses/net revenue % 12% 14% 10% 9% 9%
Administration expenses/net revenue % 11% 11% 10% 9% 10%
Personnel expenses per employee SKr, '000 533 523 535 511 537
Margin indicatorsGross margin % 21% 22% 24% 24% 26%
License margin % -12% -15% -13% -9% -4%
Maintenance & support margin % 60% 61% 58% 63% 64%
Consulting margin % 21% 22% 21% 17% 16%
Operating margin % 0% -6% 5% 5% 6%
Profit margin % -5% -9% 3% 3% 5%
Capital indicatorsReturn on capital employed % neg. neg. 11% 10% 11%
Return on stockholders' equity % neg. neg. 9% 33% 12%
Equity/assets ratio % 16% 26% 29% 38% 48%
Equity/assets ratio II % 30% 37% 38% 45% 50%
Interest coverage ratio times neg. neg. 2.1 2.5 6.2
Working capital SKr, million -137 -117 -57 -74 10
Accounts receivable (avg 12 mth)/Net revenue (rolling 12 mth) % 24 22 22 23 23
Liquidity indicatorsNet liquidity SKr, million -406 -16 -12 67 75
Debt/equity ratio times 2.3 1.1 1.0 0.6 0.2
Net debt SKr, million 634 363 294 166 3
Net debt, excluding convertible debentures/bonds SKr, million 415 118 101 -7 -31
EmployeesAverage number of employees 2 846 2 661 2 453 2 644 2 646
Number of employees at the end of the period 2 684 2 583 2 600 2 630 2 627
StockAverage number of shares million 71.9 99.8 219.4 229.6 253.9
Number of shars at the end of the period million 73.1 205.7 223.8 233.4 263.5
Key data per share2
Profit/loss, before dilution SKr -1.80 -2.29 0.23 1.07 0.48
Stockholders' equity SKr 4.50 2.37 2.75 3.71 4.24
Cash flow after investment operations SKr -2.35 -0.76 0.13 0.37 0.08
Market price at end of accounting period SKr 8.65 5.05 9.48 10.35 6.20
Market price/stockholders' equity times 1.9 2.1 3.4 2.8 1.5
Net turnover SKr 32.45 21.82 9.80 9.62 9.28
Market price/net turnover times 0.3 0.2 1.0 1.1 0.7
Dividend SKr - - - - -1 For definitions of key ratios see page 70.2 Data per share is reported regardless of the effect of the redemption of outstanding convertible debentures/bonds. In accordance with IAS 33, dilution is not
estimated when it improves earnings. For information on outstanding convertible debentures/bonds, see note 35.
Global Reports LLC

DEF IN IT IONS AND GLOSSARY
70
DEFINITIONS Average number of shares Average of the number of shares outstanding during the year.
Cash flow per share Cash flow in relation to the average number of shares.
Consulting margin Consulting revenue minus consulting expenses in relation to consulting revenue.
Days of Sales Outstanding (DSO) Accounts receivables, adjusted for value added tax, in relation to net revenue.
Debt/equity ratio Interest-bearing provisions and liabilities, including convertible debentures/bonds, at year-end in relation to stockholders’ equity.
Earnings per share Net profit/loss for the year in relation to the average number of shares.
Equity/assets ratio before conversions Stockholders’ equity and minority interest at year-end in relation to total assets.
Equity/assets ratio after conversions Stockholders’ equity and minority interest at year-end, including convertible debenture and bond programs and full exercise of the offset issue, in relation to total assets.
Gross margin Gross earnings in relation to net revenue.
Interest coverage ratio Profit/loss before tax plus interest expense in relation to interest expense.
License margin License revenue minus license, sales and marketing expenses,in relation to licenses revenue.
Maintenance and support margin Maintenance and support revenue minus maintenance and support expenses in relation to maintenance and support revenue.
Market price The market price of the shares has been established in relation to the number of outstanding Series A and Series B shares, respectively, and the share price of these shares at year-end.
Market price/net revenue per share The market price in relation to net revenue per share.
Market price/stockholders’ equity per share The market price in relation to stockholders’ equity per share.
Net debt Interest-bearing provisions and liabilities, including convertible debentures/bonds, at year-end, less liquid assets.
Net liquidity Liquid assets less liabilities to credit institutions at year-end.
Net revenue growth Net revenue for the year minus net revenue for the previous year in relation to net revenue for the previous year.
Net revenue outside of Sweden Net revenue minus net revenue in Sweden, in relation to net revenue.
Net revenue per share Net revenue in relation to the average number of shares.
Net revenue per employee Net revenue in relation to the average number of employees.
Operating equity Total assets minus non interest-bearing liabilities, liquid assets, and other interest-bearing assets.
Operating margin EBIT in relation to net revenue.
Profit margin Profit/loss before tax in relation to net revenue.
Return on capital employed Profit before tax plus financial expenses in relation to average capital employed. Capital employed refers to total assets less non-interest-bearing liabilities and deferred tax liability.
Return on stockholders’ equity Profit/loss for the year in relation to average stockholders’ equity.
Stockholders’ equity per share Stockholders’ equity, including minority interest, in relation to the number of outstanding shares at year-end.
Working capital Accounts receivable and other current receivables, excluding liquid assets, less accounts payable and other short-term, non-interest-bearing liabilities.
GLOSSARY Application A program that helps a user deal with a specific task, e.g. purchasing, employee development or accounting.
Architecture Architecture describes the manner in which the hardware, system software and applications software integrate to achieve a desired result.
Business Applications A set of applications that covers all internal as well as external business processes a company is involved in.
Component-based Architecture Refers to the design of any system composed of separate components that can be connected together. The benefit of component-based architecture is that you can replace or add any one component without affecting the rest of the system. The opposite of a component-based architecture is an integrated architecture, in which no clear divisions exist between components.
Enterprise Asset Management (EAM) A concept in the software industry to describe one or several applications designed to improve/optimize how a company utilizes its business processes and facilities. The designation is common in the asset-intensive industry.
Enterprise Resource Planning (ERP) A method of planning that originally comprised all internal business processes, such as financials, manufacturing and distribution, but which has been extended to cover a range of other functions from contact with suppliers to maintenance of delivered products.
Maintenance, Repair and Overhaul (MRO) A concept used in the software industry to describe software used in the maintenance of a company’s equipment and facilities so as to maximize availability and efficiency.
Outsourcing The procuring of services or products from an outside supplier or manufacturer.
Platform Component-based products or services require a platform that defines valid interfaces and common services to ensure maximum flexibility and configurability for the product/service without sacrificing economies of scale or recycling capabilities. This is necessary for managing internal dependencies and complexity in the product development of component-based products/services.
Utility An organization of company that provides some form of infrastructure in a society, such as heating, electricity, or water.
Global Reports LLC

ADDRESSES
71
ADDRESSES IFS
ARGENT INA, Buenos Aires Tel +54 11 4343 8600
AUSTRAL IA , Melbourne Tel +61 3 9854 9600
BELG IUM, Eindhoven Tel +31 40 292 3292
CANADA, Waterloo, Ontario Tel +1 519 489 4070
CENTRAL AND EASTERN EUROPE Tel +48 22 577 45 00
CH INA, PEOPLE’S REP. , Shanghai Tel +86 21 6448 3398
CZECH REPUBL IC , Prague Tel +420 2340 66 800
DENMARK, Copenhagen Tel +45 43 28 89 00
F INLAND, Helsinki Tel +358 9 8563 4100
FRANCE, Mulhouse Tel +33 3 89 50 72 72
GERMANY, Erlangen Tel +49 9131 77 34 0
GREECE, Athens Tel +30 210 748 65 90
HUNGARY, Budapest Tel +36 1 236 3700
INDIA , Noida Tel +91 120 241 1858
INDONESIA , Jakarta Tel +62 21 5794 1919
I TALY , Milan Tel +39 02 2906 2264
JAPAN, Tokyo Tel +81 3 5419 7900
MALAYSIA , Selangor Tel +60 3 7880 4020
NETHERLANDS, Eindhoven Tel +31 40 292 3292
NORWAY, Asker Tel +47 66 90 73 00
PH IL IPP INES, Makati City Tel +63 2 830 8690
POLAND, Warsaw Tel +48 22 577 46 00
RUSSIA , Moscow Tel +7 495 797 8148
S INGAPORE, Singapore Tel +65 6333 3300
SLOVAKIA , Bratislava Tel +421 2 5063 3323
SOUTH AFR ICA, Centurion Tel +27 12 663 5350
SPA IN , Madrid Tel +34 91 806 23 45
SR I LANKA, Colombo Tel +94 11 236 4400
SWEDEN, Linköping Tel +46 13 460 40 00
THA ILAND, Bangkok Tel +66 2 233 2112
TURKEY, Kosuyolu-Istanbul Tel +90 216 545 96 96
UN ITED ARAB EMIRATES, Dubai Tel +9714 390 0888
UN ITED K INGDOM, London Tel +44 149 4428 900 IFS Defence Ltd Tel +44 208 329 5600
UN ITED STATES, Chicago IL Tel +1 847 592 0200 Toll Free Information Tel +1 888 437 4968
Business partners
BANGLADESH
ICE Technologies and Services Ltd Tel +880 2 8822 100
BRAZ IL
Alliance Tel +55 21 2516 0007
GPSul Soluções Empresariais Tel +55 51 3333 8265
Freedom Solutions S/C Ltda Tel +55 12 3923 1791
Inachis Io Tel +55 41 342 8370
Latin IFS Tel +55 11 2187 0600
ESTONIA
ABUsesoft Tel +372 630 5105
HONG KONG
Enterprise Consulting Limited Tel +852 3110 3315
INDIA
Escosoft Technologies Tel +91 11 695 9981
IRAQ
Irak Data System (PVT) Tel +9821 222 29 54
IRELAND
Clarion Consulting Ltd Tel +353 1 802 5182
JAPAN
IBM Japan, Ltd Tel +81 3 3808 8657
NEC Corporation Tel +81 3 3456 6355
Nihon Unisys, Ltd Tel +81 3 5546 4111
Toyo Engineering Corporation Tel +81 4 7451 1111
MOROCCO
Omnidata Tel +212 22 98 70 70
PORTUGAL
Ponto.C – Sistemas de Informação Tel +351 234 386 641
SAUDI ARABIA
Industrial & Financial Systems Arabia (Jeddah) Tel +966 2 606 2468
Industrial & Financial Systems Arabia (Riyadh) Tel +966 1 460 1372
TA IWAN
Eurotak Corporation Tel +886 2 2708 2247
Vatrend Inc. Tel +886 2 3393 7025
UN ITED STATES
brij Connecting Tel +1 336 808 3400
Corning Data Services, Inc Tel +1 607 797 0523
MSS Technologies Tel +1 602 387 2100
THIS DOCUMENT MAY CONTAIN STATEMENTS OF POSSIBLE FUTURE FUNCTIONALITY FOR IFS’ SOFTWARE PRODUCTS AND TECHNOLOGY. SUCH STATEMENTS OF FUTURE FUNCTIONALITY ARE FOR INFORMATION PURPOSES ONLY AND SHOULD NOT BE INTERPRETED AS ANY COMMITMENT OR REPRESENTATION. IFS AND ALL IFS PRODUCT NAMES ARE TRADEMARKS OF IFS. THE
NAMES OF ACTUAL COMPANIES AND PRODUCTS MENTIONED HEREIN MAY BE THE TRADEMARKS OF THEIR RESPECTIVE OWNERS.
©2008 IFS AB
Eng0
000-0
Pro
duct
ion:
IFS
Glo
bal M
ark
eting,
Febru
ary
20
08
.
Global Reports LLC

www.IFSWORLD.com
IFS—THE GLOBAL ENTERPRISE APPLICATIONS COMPANY IFS (OMX STO: IFS), the global enterprise applications company, provides ERP solutions which enable organizations to respond quickly to market changes. The solutions allow resources to be used in a more agile way to achieve better business performance and competitive advantage.
Founded in 1983, IFS has 2,600 employees worldwide. With IFS Applications™, now in its seventh generation, IFS has pioneered component-based ERP software. The component architecture provides solutions that are easier to implement, run, and upgrade. IFS Applications is available in 54 countries in 22 languages.
IFS has over 600,000 users across seven key vertical sectors: aerospace & defense; automotive; manufacturing; process industries; construction, contracting & service management; retail & wholesale distribution, and utilities & telecom. IFS Applications provide extended ERP functionality, including CRM, SCM, PLM, CPM, enterprise asset management, and MRO capabilities.
Global Reports LLC