industrial growth and environmental degradation: … · industrial growth and environmental ......
TRANSCRIPT
Industrial Growth And EnvironmentalIndustrial Growth And EnvironmentalIndustrial Growth And EnvironmentalIndustrial Growth And EnvironmentalIndustrial Growth And EnvironmentalDegradation:Degradation:Degradation:Degradation:Degradation:
A Case Study Of Tiruppur Textile ClusterA Case Study Of Tiruppur Textile ClusterA Case Study Of Tiruppur Textile ClusterA Case Study Of Tiruppur Textile ClusterA Case Study Of Tiruppur Textile Cluster
Prakash NelliyatResearch Associate
Madras School of EconomicsGandhi Mandapam RoadChennai – 600 025, India
Tel: +91-44-2235 2157, 22300304 / 7Fax: 91-44-2235 2155, 22354847
E.mail: [email protected]
WORKING PAPER 17/2007 MADRAS SCHOOL OF ECONOMICSGandhi Mandapam Road
June 2007 Chennai 600 025India
Phone: 2230 0304/ 2230 0307/2235 2157Price: Rs.35 Fax : 2235 4847 /2235 2155
Email : [email protected]: www.mse.ac.in
Industrial Growth and Environmental Degradation:
A Case Study of Tiruppur Textile Cluster
Prakash Nelliyat
Abstract
The rapid economic growth achieved after globalization by most of thedeveloping countries, has imposed considerable social costs and hasbecome a major threat to sustainable development. However it is alsoextremely important for developing countries to achieve a high level ofeconomic growth to mitigate their socio-economic problems. But themajor challenge here is to ensure development in a sustainable mannerby achieving a proper trade-off between environment and development.This paper attempts to operationalize sustainable developmentstrategies using a case study of Tiruppur, a major textile cluster inIndia. The textile industrial growth in Tiruppur is discussed in the contextof global diversification of textile manufacturing and trade with emphasison employment, income and foreign exchange in regional economyperspective. Since the environmental issues of textile industries areassociated with bleaching and dyeing, an inventory of all processingunits was prepared for analysis include water consumption and effluentdischarge. The existing pollution management efforts through IETPsand CETPs and economics of production and pollution control costswere estimated for different size of units for understanding the burdenof pollution abatement. Environmental impacts of pollution wereanalyzed with the help of physical data on ground water, surface waterand soil quality. The economic value of the damage (social cost) wasestimated for different sectors like agriculture, fisheries, domestic andindustrial water supply. Different economic and environmental indicatorsof Tiruppur industry over the period 1980-2000 and the reasons for theenvironmentally unsustainable industrial growth of Tiruppur areprovided. The paper concludes with some policy recommendations andrecent development in Tiruppur.
1
Acknowledgement
The paper has been prepared based on my Ph.D dissertationentitled “Industrial Growth and Environmental Degradation: A CaseStudy of Industrial Pollution in Tiruppur” which I submitted to theUniversity of Madras. I pursued my research work under the supervisionof Prof. Paul P Appasamy, Member Secretary, Centre of Excellence inEnvironmental Economics, Madras School of Economics. I am gratefulto Prof. Paul P Appasamy, for his encouragement and suggestions incompleting this paper.
Introduction
The rapid economic growth achieved by most of the developing
countries after globalization has adversely affected the quality of the
environment, imposed considerable social costs and livelihood impacts,
and has become a major threat to sustainable development1. Since the
citizens of poor countries may not demand a high level of environmental
quality, these countries take up export oriented manufacturing which
is sometimes pollution intensive. It is extremely important for developing
countries to achieve a critical level of economic growth to mitigate
their unemployment and poverty. But the major challenge is to ensure
development in an environmentally sustainable manner, so far to achieve
a proper trade-off between environment and development. Normally
developing countries may have reasonably good growth policies and
strategies for agriculture, industry and infrastructure development, but
not have a sound environmental management policy.
The global diversification and shift of textile manufacturing and
exports to developing countries has had significant implications for the
Indian textile sector. The textile industrial growth and export in India
has been appreciable during the last two decades. Since most of the
textile centres have developed as small-scale clusters, pollution
management and enforcement is not at a satisfactory level. Hence in
many places the pollution load discharged into the environment has
exceeded the assimilative capacity and caused severe degradation of
the quality of the environment, and ultimately affected different sectors
like agriculture, domestic water supply, fisheries, public health and
biodiversity. Even though these types of tradeoffs between development
and environment are common in many countries, most of the research
2 3
has emphasized either the development aspect or the environmental
aspect, but not from a sustainable development perspective. The doctoral
thesis is an attempt towards the operationalization of sustainable
development strategies through a case study of Tiruppur, a major textile
cluster in Tamil Nadu. The thesis includes the following aspects:
(a) Industrial growth and socio-economic contribution of the textile
industry to the regional economy of tiruppur,
(b) Pollution abatement cost of the textile wet processing units
which cause pollution,
(c) Environmental damage caused by textile effluents to different
sectors in the Noyyal river basin, and
(d) Appropriate policy options for achieving sustainable industrial
development of Tiruppur through various institutional and
technological options.
Impact of Diversification of the Global Textile Industry
During the last few decades, substantial global shifts have occurred in
textile production and export. Before 1980, countries like Germany,
Italy, France, UK, The Netherlands, and USA played a vital role in world
textile and clothing exports. But by 1995, the dominance of these
countries had substantially reduced and the share of developing nations,
especially the Asian countries like China, Korea, Taiwan, India, Pakistan
and Thailand had increased (Dicken, 1998). The main factor attributed
to this shift is the cheap labour costs in developing nations compared
to the western countries (Vijayabaskar, 2001). The environmental
policies, which are relatively less stringent in developing nations might
also have contributed to the shift in the location of textile manufacturing.
During the post liberalization period of the Indian economy, the cotton
textile and garment industries grew rapidly due to the availability of
cheap labour and raw materials. The country has more than 9 million
hectares of area under cotton cultivation and annual production of
around 3 million tones of cotton (Compendium of Textile Statistics,
1999). These industries generate substantial employment, income, and
foreign exchange. The percentage of textiles in the total exports from
India doubled from 17 per cent (1981-82) to 31.6 per cent (1998-
1999). At present the textile industry accounts for about 14 per cent of
the national industrial production and about 4 per cent of GDP. It provides
employment opportunities to 35 million people, particularly in the rural
and remote areas of the country. Around 10 per cent of the excise
revenue is obtained from the textile sector (Compendium of Textile
Statistics, 1999; Ministry of Textiles, 1999). The Indian textile sector
has been experiencing structural transformation through the reduction
in the role of the organized mill sector and an increase of the small
scale and cottage sectors (handlooms, power loom, knitwear and
garment making units). These sectors are developing in a highly
decentralized and flexible industrial networking manner as clusters. To
some extent, the industrial policy adopted by the Government of India
which emphasized the growth of small-scale industries (SSIs)2 has also
favoured the growth of textile industries as clusters. Institutions like
the South India Textile Research Associations (SITRA), Apparel Export
Promotion Council (AEPC) and Textile Committee (TC) have promoted
the growth and development of the textile industry.
However, the wet processing (bleaching and dyeing) segment
of the textile industry has caused severe environmental damage. The
textile processing units use huge quantities of water and different
4 5
chemicals. The effluents discharged by the units are generally hot,
alkaline, strong smelling and coloured. Some of the chemicals which
are discharged are toxic too. Unfortunately, the majority of the textile
units especially the smaller ones are not treating their effluents properly
and the untreated or partially treated effluents are discharged into
water bodies or on land and sometimes the effluent is used for irrigation
(Mukherjee and Nelliyat, 2006). In many clusters around the country,
textile effluents have caused serious environmental impacts at the
regional level. The technological development in the wet processing
segment of the textile industry is not at a satisfactory level. Most of the
small units are using traditional processing technology, which are not
environment friendly. Cleaner Production technology like soft flow
machines has a lot of scope in textile processing.
Textile consumers in Europe and US have become more
concerned about environmentally sound products with eco-labels.
Consequently, the market for products produced in a environmentally
friendly way is growing. After realizing the seriousness of the above
issue, the Government of India and the textile industry took certain
measures to meet the eco-labeling requirements. For eco-specification,
twelve eco-testing laboratories were set up in various textile centres.
Generally, the eco-mark schemes specified that “the products should
be manufactured in an environmentally friendly way”. It means the
product or its manufacturing activities should not create any
environmental consequences for both the consumers of the product as
well as the public through waste disposal. Unfortunately, in the Indian
textile industry eco-labeling criteria are applied only to the product
quality and not to the manufacturing related pollution or process aspects.
Growth of the Textile Industry in Tiruppur
Tiruppur is a major knitwear centre in India with more than 9000 small-
scale units. Industrial growth started in Tiruppur in 1930. The
electrification of the town during the late 1930’s, the removal of the
ban on import of new machines in 1952, the shifts from farm to factories
during 1960s, the industrial unrest which existed in West Bengal in
1968, the growth of ancillary units during 1970s, and the encouragement
provided by government towards export in the early 1980s, are
important landmarks in the history of the growth of the hosiery industry
in Tiruppur (Swaminathan and Jeyaranjan, 1995; Vijayabaskar, 2001).
The transformation of Tiruppur from a village agrarian economy to the
‘knitwear capital of India’ occurred within a very short period of three
to four decades. The hot climate and good quality of water, easy
availability of raw material (cotton), skilled labour, good infrastructure
facilities, industrial networking, institutional support, and export culture,
are some of the reasons for the rapid industrial growth of Tiruppur
(Nelliyat, 1995; Nelliyat, 2005). The city contributes 56 per cent of the
total cotton knitwear export from India.
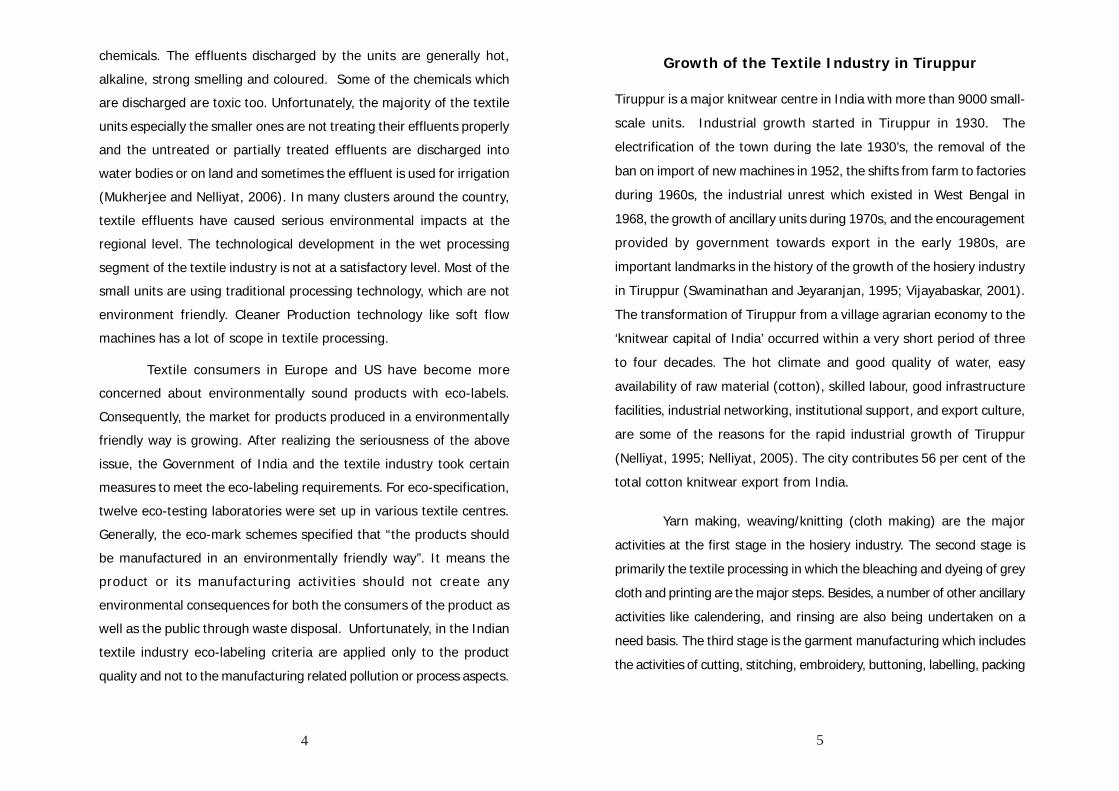
Yarn making, weaving/knitting (cloth making) are the major
activities at the first stage in the hosiery industry. The second stage is
primarily the textile processing in which the bleaching and dyeing of grey
cloth and printing are the major steps. Besides, a number of other ancillary
activities like calendering, and rinsing are also being undertaken on a
need basis. The third stage is the garment manufacturing which includes
the activities of cutting, stitching, embroidery, buttoning, labelling, packing
6 7
and dispatching/exporting (Figure 1). A few entrepreneurs who are mainly
the direct exporters have all the above-mentioned activities in their own
factory premises. They feel that vertical integration is an advantage in
the export business, in order to guarantee quality and timely delivery.
Figure - 1
MAJOR ACTIVITIES IN TIRUPPUR HOSIERY INDUSTRY
RAW COTTON
YARN MAKING
WEAVING / KNITTING
GREY CLOTH
BLEACHING
DYEING
DYED YARN / FABRIC
PRINTING
CALENDERING
CUTTING AND STITCHING
EMBROIDERY AND LABELLING
PACKING
DESPATCH
Source: Nelliyat, P (2005)
Unlike other clusters, Tiruppur has demonstrated the ability to move up
the value chain, albeit in a limited manner. Its product range has diversified,
with a marginal increase in unit value addition.
Contribution to the Regional Economy
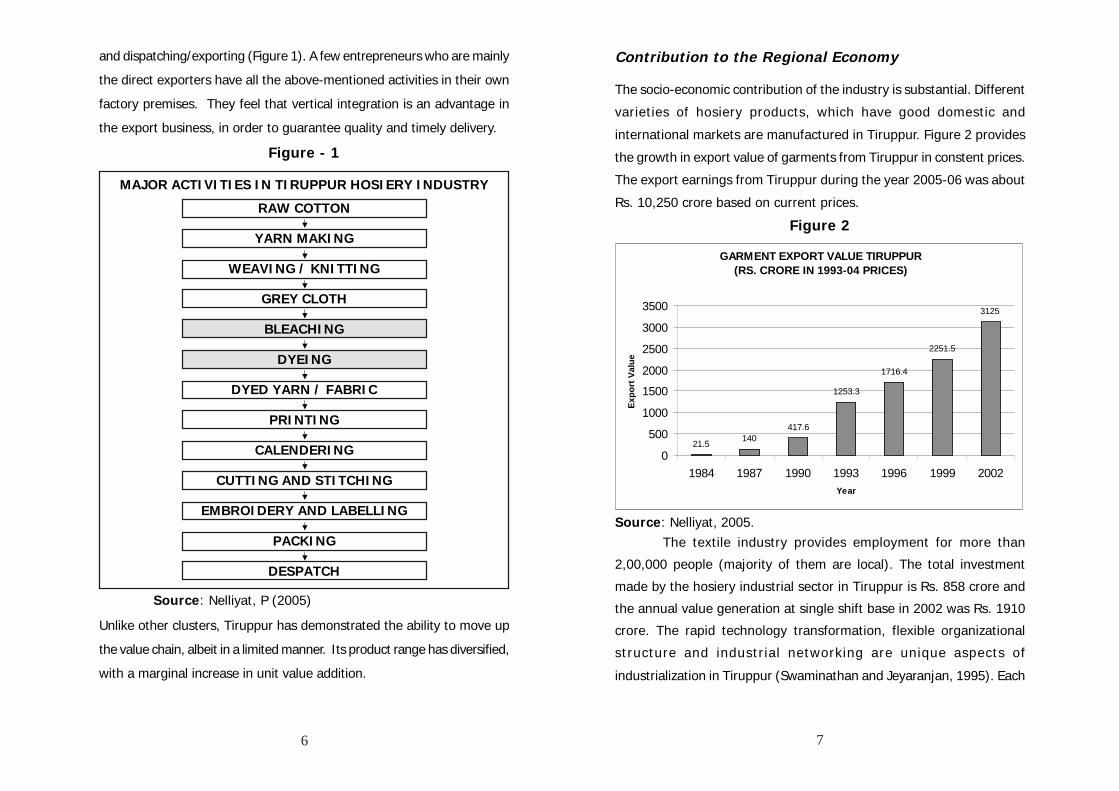
The socio-economic contribution of the industry is substantial. Different
varieties of hosiery products, which have good domestic and
international markets are manufactured in Tiruppur. Figure 2 provides
the growth in export value of garments from Tiruppur in constent prices.
The export earnings from Tiruppur during the year 2005-06 was about
Rs. 10,250 crore based on current prices.
Figure 2
Source: Nelliyat, 2005.The textile industry provides employment for more than
2,00,000 people (majority of them are local). The total investment
made by the hosiery industrial sector in Tiruppur is Rs. 858 crore and
the annual value generation at single shift base in 2002 was Rs. 1910
crore. The rapid technology transformation, flexible organizational
structure and industrial networking are unique aspects of
industrialization in Tiruppur (Swaminathan and Jeyaranjan, 1995). Each
GARMENT EXPORT VALUE TIRUPPUR(RS. CRORE IN 1993-04 PRICES)
21.5 140417.6
1253.3
1716.4
2251.5
3125
0
500
1000
1500
2000
2500
3000
3500
1984 1987 1990 1993 1996 1999 2002Year
Expo
rt V
alue
8 9
segment of the industry has its own association which has played an
important role in the industrial development of Tiruppur. Among these
the role of Tiruppur Exporters Association (TEA) is significant. SITRA,
AEPC and TC have their offices in Tiruppur for providing direct services
to hosiery manufacturers and exporters.
The Indian textile industry faced a challenge with the WTO
Agreement on Textile and Clothing and the dismantling of the quota
regime. From 1st January 2005 onwards all textile and clothing products
would be treated equally without quota restrictions. The dismantling of
the quota regime represents both an opportunity as well as a threat.
An opportunity because the market will no longer be restricted: a threat
because markets will no longer be guaranteed by quotas. Tiruppur
industry has a great ability to face any challenge and it is well prepared
for the new WTO Agreement on Textiles and Clothing. For continuing
the business performance from Tiruppur during the post 2005 era, the
Tiruppur Exporters Association has charted their goal and chalked out
a number of initiatives. The role of the hosiery industry in the regional
economy of Tiruppur is substantial and most people in this region in
one way or other depend on this industry for their livelihood.
Wet Processing and Water Demand in Tiruppur
Wet processing (bleaching and dyeing) is a sub-sector of the hosiery
industry. After the export boom started in the 1980s, the number of
wet processing units rapidly increased in the Tiruppur cluster. In 1981,
there were only 26 bleaching and dyeing units in Tiruppur. But the
number had increased to 324 in 1991 and 702 in 2001. The majority of
the units are small in size and function as job workers for the hosiery
industry. Out of the 702 wet processing units, 125 are located in Tiruppur
municipality and the remaining 577 are spread out in the peripheral
villages. Most of the units are located on both sides of the Noyyal river
which is convenient to discharge the effluent. Low investment, bright
future of colouring in clothing industry, good profit margins and prior
experience in textile processing, are some of the factors which
encouraged the entrepreneurs to select textile processing from other
segments of the hosiery industry. The quantity of cloth processed by
these units is around 15,000 tonnes per month. For processing, various
chemicals such as soda ash, dyes and bleaching agents are used and
their consumption rate has increased over time in proportion to the
quantum of cloth processed. Much of the chemicals and acids used for
processing are not retained in the cloth but discharged as waste material,
which ultimately leads to high pollution load in the effluents.
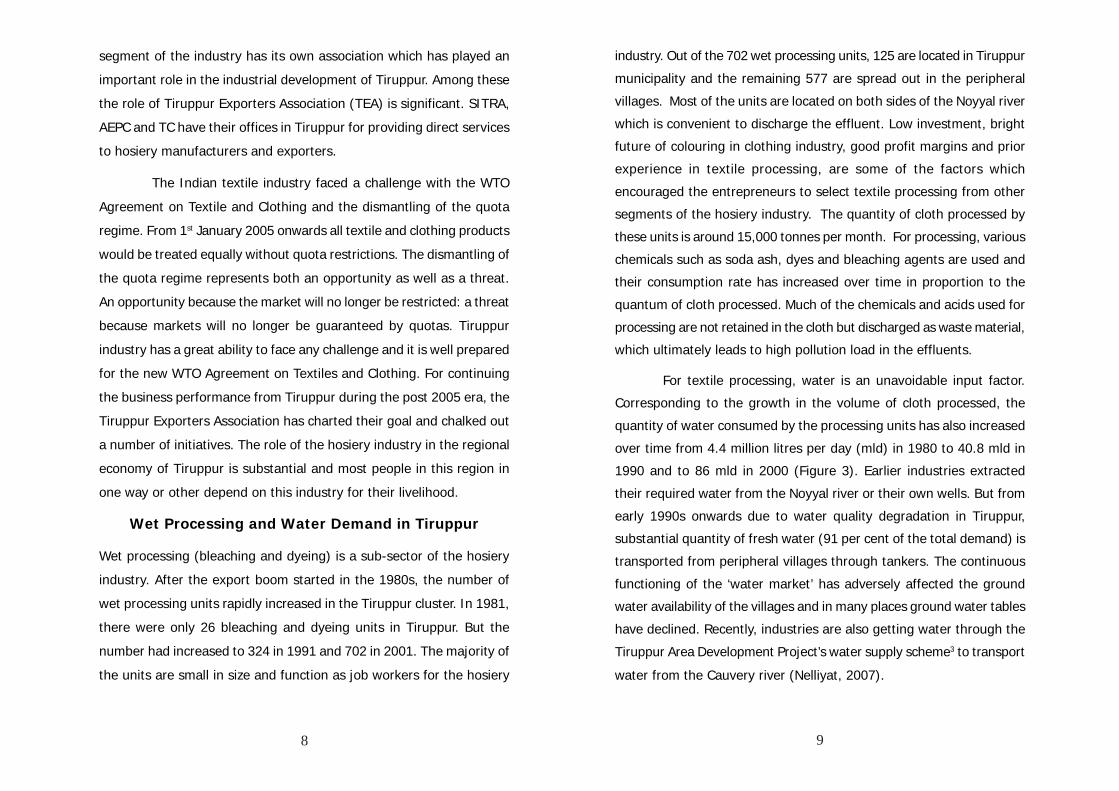
For textile processing, water is an unavoidable input factor.
Corresponding to the growth in the volume of cloth processed, the
quantity of water consumed by the processing units has also increased
over time from 4.4 million litres per day (mld) in 1980 to 40.8 mld in
1990 and to 86 mld in 2000 (Figure 3). Earlier industries extracted
their required water from the Noyyal river or their own wells. But from
early 1990s onwards due to water quality degradation in Tiruppur,
substantial quantity of fresh water (91 per cent of the total demand) is
transported from peripheral villages through tankers. The continuous
functioning of the ‘water market’ has adversely affected the ground
water availability of the villages and in many places ground water tables
have declined. Recently, industries are also getting water through the
Tiruppur Area Development Project’s water supply scheme3 to transport
water from the Cauvery river (Nelliyat, 2007).
10 11
Figure 3
Source: Nelliyat (2005)
The water requirement per kilogram of cloth processed has
shown a declining trend from 226.5 litres per kg in 1980 to 144.8 litres
per kg in 2000. Low availability of good quality water in the Tiruppur
area, increase in the cost of water transportation, and the technology
improvements in processing are some of the reasons attributed to the
reduction in water usage per kilogram of cloth processed. The average
water requirement for dyeing one kilogram of cloth is 175 litres in
small and medium level units, but only 120 litres per kg in larger units.
Processing technology is the major determinant factor in water
requirement. Generally, smaller units exclusively depend on winches,
while larger units depend on soft machines, which use less water for
processing.
Environmental Management and Costs ofPollution Abatement
The processing units in Tiruppur generate/discharge around 83 mld of
effluents. The effluents carry considerable volume of chemicals used
in different processing stages in the units. Due to the continuous
discharge of effluents for over a decade, the magnitude of pollution
has increased in the Tiruppur area resulting in environmental
degradation. In 1991, the Tiruppur Dyers’ Association formed a company,
the Tiruppur Effluent Treatment Company (P) Ltd and initiated certain
attempts towards the construction of effluent treatment plants.
Unfortunately, progress towards the effluent treatment programme was
negligible till 1996. Subsequently in 1997, following the Order of the
High Court industries which did not have effluent treatment facilities
had to close and the remaining units decided to construct effluent
treatment plants. At present, the units are treating their effluents either
through Individual Effluent Treatment Plants (IETPs) or Common Effluent
Treatment Plants (CETPs). Of the 702 units, 278 units are treating
their effluents through eight CETPs while 424 units have individual
effluent treatment plants. Due to scale economies, CETPs should be
preferable to smaller units. But, size has not been the major factor in
the choice of common versus individual effluent treatment plants.
The majority of the units who prefer IETPs were not familiar
with the advantages of CETPs at the time of their decision. But some
of the units who were familiar with the merits of CETPs preferred IETPs,
mainly because the CETPs were located far away from their premises
and due to less faith in collective action. On the other hand, some of
the units which preferred CETPs were well aware of the economies of
CETPs including the subsidy factor. Besides, they felt that if they provided
WATER REQUIREMENTS FOR TEXTILE PROCESSING IN TIRUPPUR
4.4 11.4
40.8
101.886.4
0
20
40
60
80
100
120
1980 1985 1990 1995 2000
Year
Wat
er (M
LD)
12 13
the initial equity and monthly subscription to CETP they would be free
from their responsibility regarding effluent treatment. A few units
functioning on leased land or in congested areas were compelled to
join CETPs since they did not have their own land for constructing
individual treatment plants. Ideally CETPs are preferable in a small
scale industrial clusters like Tiruppur for many reasons including
economies of scale in treatment, easy monitoring and enforcement,
and better scope for implementing advanced treatment methods like
Reverse Osmosis (RO)4. Unfortunately, in Tiruppur out of 702 textile
processing units only 278 units joined the eight CETPs.
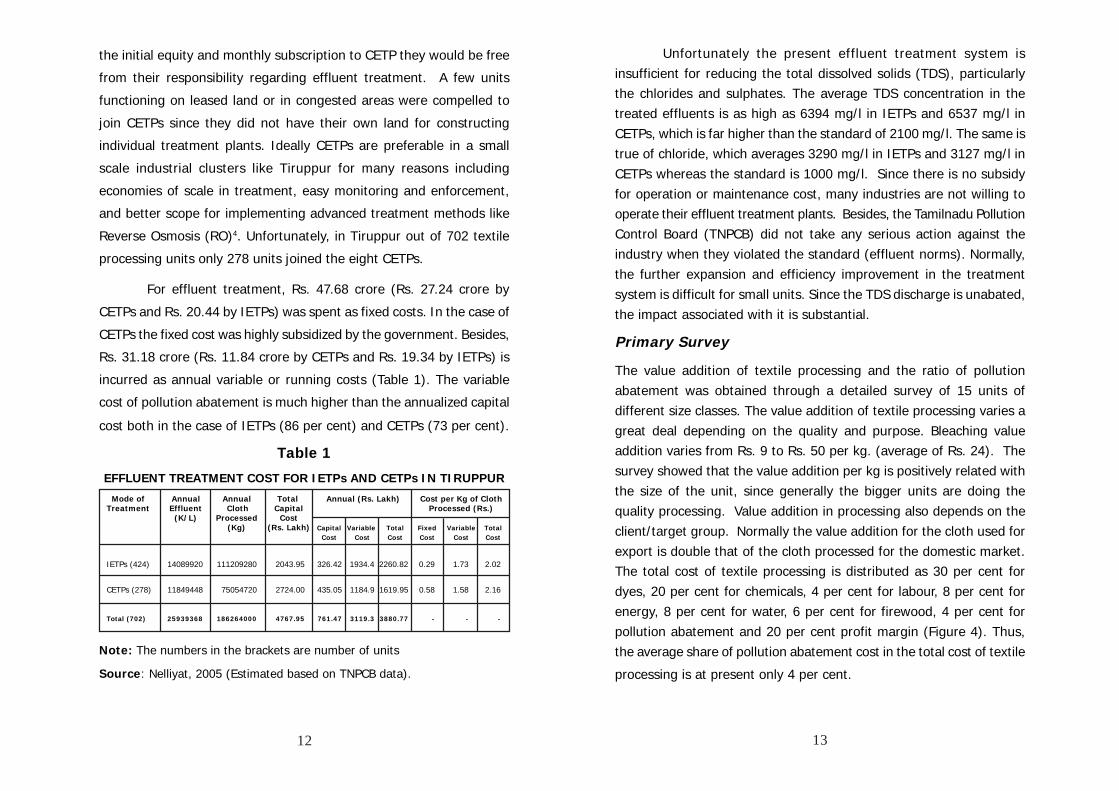
For effluent treatment, Rs. 47.68 crore (Rs. 27.24 crore by
CETPs and Rs. 20.44 by IETPs) was spent as fixed costs. In the case of
CETPs the fixed cost was highly subsidized by the government. Besides,
Rs. 31.18 crore (Rs. 11.84 crore by CETPs and Rs. 19.34 by IETPs) is
incurred as annual variable or running costs (Table 1). The variable
cost of pollution abatement is much higher than the annualized capital
cost both in the case of IETPs (86 per cent) and CETPs (73 per cent).
Table 1
EFFLUENT TREATMENT COST FOR IETPs AND CETPs IN TIRUPPUR
Mode of Annual Annual Total Annual (Rs. Lakh) Cost per Kg of ClothTreatment Effluent Cloth Capital Processed (Rs.)
(K/L) Processed Cost(Kg) (Rs. Lakh) Capital Variable Total Fixed Variable Total
Cost Cost Cost Cost Cost Cost
IETPs (424) 14089920 111209280 2043.95 326.42 1934.4 2260.82 0.29 1.73 2.02
CETPs (278) 11849448 75054720 2724.00 435.05 1184.9 1619.95 0.58 1.58 2.16
Total (702) 25939368 186264000 4767.95 761.47 3119.3 3880.77 - - -
Note: The numbers in the brackets are number of units
Source: Nelliyat, 2005 (Estimated based on TNPCB data).
Unfortunately the present effluent treatment system isinsufficient for reducing the total dissolved solids (TDS), particularlythe chlorides and sulphates. The average TDS concentration in thetreated effluents is as high as 6394 mg/l in IETPs and 6537 mg/l inCETPs, which is far higher than the standard of 2100 mg/l. The same istrue of chloride, which averages 3290 mg/l in IETPs and 3127 mg/l inCETPs whereas the standard is 1000 mg/l. Since there is no subsidyfor operation or maintenance cost, many industries are not willing tooperate their effluent treatment plants. Besides, the Tamilnadu PollutionControl Board (TNPCB) did not take any serious action against theindustry when they violated the standard (effluent norms). Normally,the further expansion and efficiency improvement in the treatmentsystem is difficult for small units. Since the TDS discharge is unabated,the impact associated with it is substantial.
Primary Survey
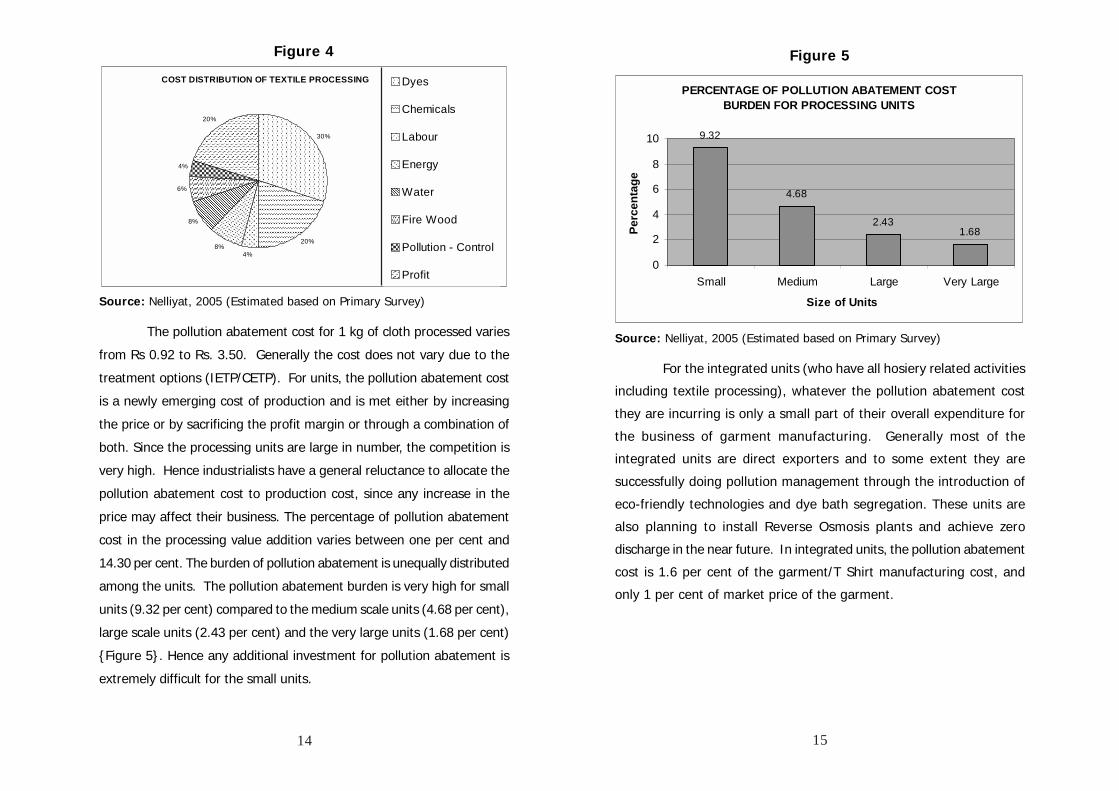
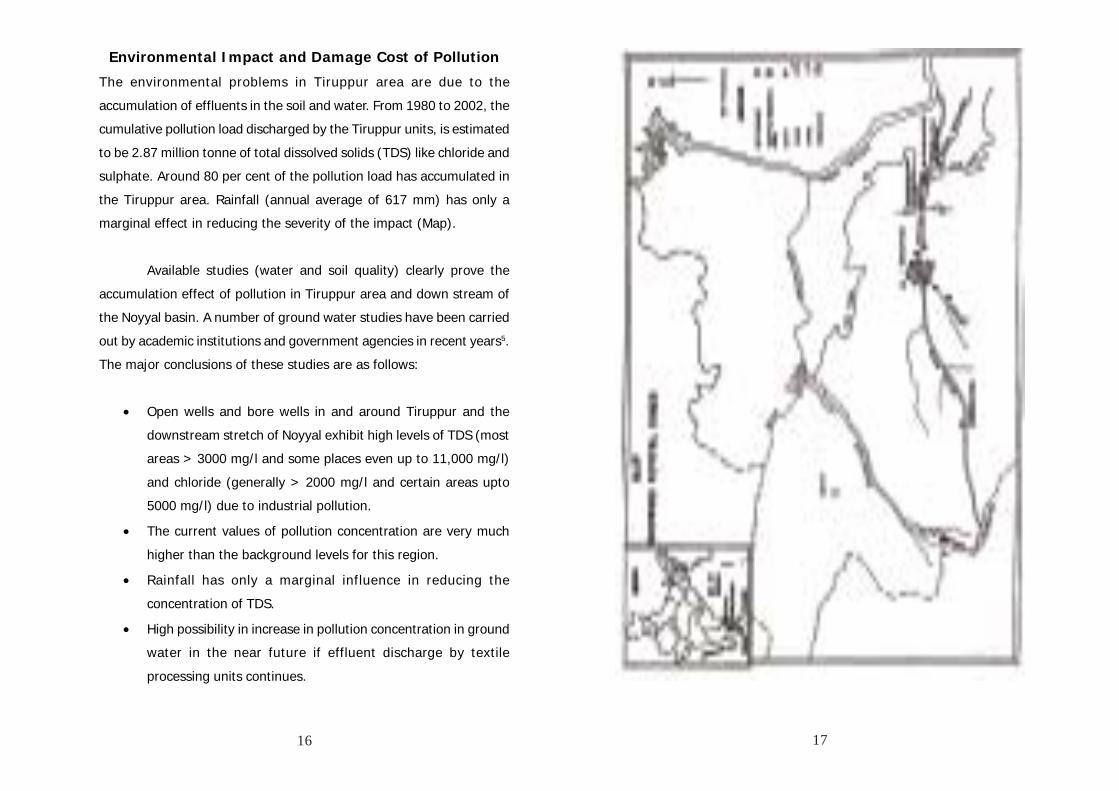
The value addition of textile processing and the ratio of pollutionabatement was obtained through a detailed survey of 15 units ofdifferent size classes. The value addition of textile processing varies agreat deal depending on the quality and purpose. Bleaching valueaddition varies from Rs. 9 to Rs. 50 per kg. (average of Rs. 24). Thesurvey showed that the value addition per kg is positively related withthe size of the unit, since generally the bigger units are doing thequality processing. Value addition in processing also depends on theclient/target group. Normally the value addition for the cloth used forexport is double that of the cloth processed for the domestic market.The total cost of textile processing is distributed as 30 per cent fordyes, 20 per cent for chemicals, 4 per cent for labour, 8 per cent forenergy, 8 per cent for water, 6 per cent for firewood, 4 per cent forpollution abatement and 20 per cent profit margin (Figure 4). Thus,the average share of pollution abatement cost in the total cost of textile
processing is at present only 4 per cent.
14 15
Figure 4
Source: Nelliyat, 2005 (Estimated based on Primary Survey)
The pollution abatement cost for 1 kg of cloth processed varies
from Rs 0.92 to Rs. 3.50. Generally the cost does not vary due to the
treatment options (IETP/CETP). For units, the pollution abatement cost
is a newly emerging cost of production and is met either by increasing
the price or by sacrificing the profit margin or through a combination of
both. Since the processing units are large in number, the competition is
very high. Hence industrialists have a general reluctance to allocate the
pollution abatement cost to production cost, since any increase in the
price may affect their business. The percentage of pollution abatement
cost in the processing value addition varies between one per cent and
14.30 per cent. The burden of pollution abatement is unequally distributed
among the units. The pollution abatement burden is very high for small
units (9.32 per cent) compared to the medium scale units (4.68 per cent),
large scale units (2.43 per cent) and the very large units (1.68 per cent)
{Figure 5}. Hence any additional investment for pollution abatement is
extremely difficult for the small units.
Figure 5
Source: Nelliyat, 2005 (Estimated based on Primary Survey)
For the integrated units (who have all hosiery related activities
including textile processing), whatever the pollution abatement cost
they are incurring is only a small part of their overall expenditure for
the business of garment manufacturing. Generally most of the
integrated units are direct exporters and to some extent they are
successfully doing pollution management through the introduction of
eco-friendly technologies and dye bath segregation. These units are
also planning to install Reverse Osmosis plants and achieve zero
discharge in the near future. In integrated units, the pollution abatement
cost is 1.6 per cent of the garment/T Shirt manufacturing cost, and
only 1 per cent of market price of the garment.
������������������������������������������������������������������������������������������������������������������������������������������������������������������������������������������������������������������������������������������������������������������������������������������������������������������������������������
������������������������������������������������
����������������������������������������������������������������������������������������������������
������������������������������������������������������������������������������������������������������������
��������������������������������������������������������
��������������������������������������������������������
���������������������������������������������������������������������������������������������������������������������������������������
COST DISTRIBUTION OF TEXTILE PROCESSING
30%
20%
4%8%
8%
6%
4%
20%
��������Dyes��������Chemicals����
Labour����
Energy����
Water��������Fire Wood ��������Pollution - Control����
Profit
PERCENTAGE OF POLLUTION ABATEMENT COST BURDEN FOR PROCESSING UNITS
9.32
4.68
2.431.68
0
2
4
6
8
10
Small Medium Large Very Large
Size of Units
Perc
enta
ge
16 17
Environmental Impact and Damage Cost of Pollution
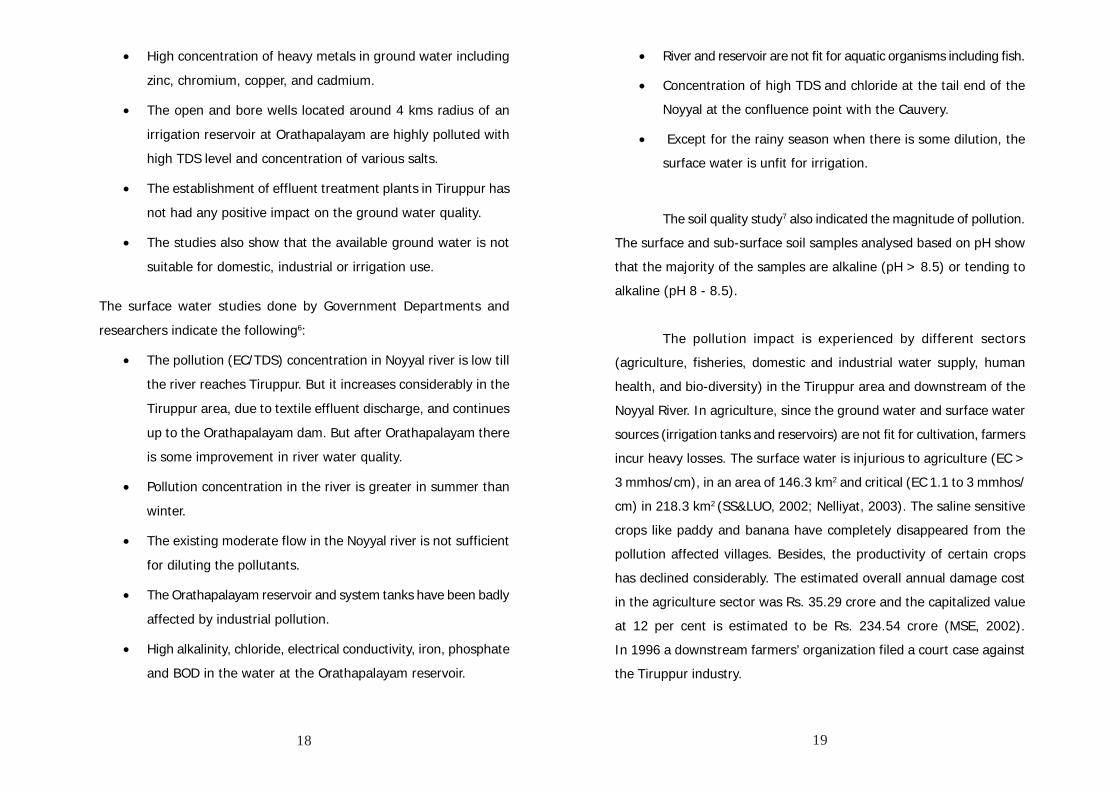
The environmental problems in Tiruppur area are due to the
accumulation of effluents in the soil and water. From 1980 to 2002, the
cumulative pollution load discharged by the Tiruppur units, is estimated
to be 2.87 million tonne of total dissolved solids (TDS) like chloride and
sulphate. Around 80 per cent of the pollution load has accumulated in
the Tiruppur area. Rainfall (annual average of 617 mm) has only a
marginal effect in reducing the severity of the impact (Map).
Available studies (water and soil quality) clearly prove the
accumulation effect of pollution in Tiruppur area and down stream of
the Noyyal basin. A number of ground water studies have been carried
out by academic institutions and government agencies in recent years5.
The major conclusions of these studies are as follows:
• Open wells and bore wells in and around Tiruppur and the
downstream stretch of Noyyal exhibit high levels of TDS (most
areas > 3000 mg/l and some places even up to 11,000 mg/l)
and chloride (generally > 2000 mg/l and certain areas upto
5000 mg/l) due to industrial pollution.
• The current values of pollution concentration are very much
higher than the background levels for this region.
• Rainfall has only a marginal influence in reducing the
concentration of TDS.
• High possibility in increase in pollution concentration in ground
water in the near future if effluent discharge by textile
processing units continues.
18 19
• High concentration of heavy metals in ground water including
zinc, chromium, copper, and cadmium.
• The open and bore wells located around 4 kms radius of an
irrigation reservoir at Orathapalayam are highly polluted with
high TDS level and concentration of various salts.
• The establishment of effluent treatment plants in Tiruppur has
not had any positive impact on the ground water quality.
• The studies also show that the available ground water is not
suitable for domestic, industrial or irrigation use.
The surface water studies done by Government Departments and
researchers indicate the following6:
• The pollution (EC/TDS) concentration in Noyyal river is low till
the river reaches Tiruppur. But it increases considerably in the
Tiruppur area, due to textile effluent discharge, and continues
up to the Orathapalayam dam. But after Orathapalayam there
is some improvement in river water quality.
• Pollution concentration in the river is greater in summer than
winter.
• The existing moderate flow in the Noyyal river is not sufficient
for diluting the pollutants.
• The Orathapalayam reservoir and system tanks have been badly
affected by industrial pollution.
• High alkalinity, chloride, electrical conductivity, iron, phosphate
and BOD in the water at the Orathapalayam reservoir.
• River and reservoir are not fit for aquatic organisms including fish.
• Concentration of high TDS and chloride at the tail end of the
Noyyal at the confluence point with the Cauvery.
• Except for the rainy season when there is some dilution, the
surface water is unfit for irrigation.
The soil quality study7 also indicated the magnitude of pollution.
The surface and sub-surface soil samples analysed based on pH show
that the majority of the samples are alkaline (pH > 8.5) or tending to
alkaline (pH 8 - 8.5).
The pollution impact is experienced by different sectors
(agriculture, fisheries, domestic and industrial water supply, human
health, and bio-diversity) in the Tiruppur area and downstream of the
Noyyal River. In agriculture, since the ground water and surface water
sources (irrigation tanks and reservoirs) are not fit for cultivation, farmers
incur heavy losses. The surface water is injurious to agriculture (EC >
3 mmhos/cm), in an area of 146.3 km2 and critical (EC 1.1 to 3 mmhos/
cm) in 218.3 km2 (SS&LUO, 2002; Nelliyat, 2003). The saline sensitive
crops like paddy and banana have completely disappeared from the
pollution affected villages. Besides, the productivity of certain crops
has declined considerably. The estimated overall annual damage cost
in the agriculture sector was Rs. 35.29 crore and the capitalized value
at 12 per cent is estimated to be Rs. 234.54 crore (MSE, 2002).
In 1996 a downstream farmers’ organization filed a court case against
the Tiruppur industry.
20 21
The fisheries activities in the Noyyal river, system tanks and
reservoir have been affected. The recent fish mortality at Orthapalayam
reservoir compelled the Fisheries Department to stop the fish culture.
The annual loss of value (Productivity Loss) in the fishery sector was
Rs. 0.15 crore and the capitalized value at 12 per cent is approximately
Rs. 1.25 crore (MSE, 2002). Besides, the possibilities of toxicity effect
in the available fish are also high and their consumption may lead to
serious health problems.
Due to the drinking water scarcity in Tiruppur town, the
Municipality is bringing 32 mld of water from the neighbouring (Bhavani)
basin for drinking water supply. In the affected villages, the Tamilnadu
Water Supply and Drainage Board has introduced special water supply
schemes. Besides, villagers fetch freshwater from distant places
(unaffected wells). The total damage cost in the drinking water sector
was estimated to be about Rs. 15.05 crore per annum and the capitalized
value at 12 per cent is Rs. 109.03 crore (MSE, 2002).
The industries in Tiruppur themselves are affected by pollution.
Since the industrial wells have only ‘coloured water’ they are
transporting the major share of their water requirement (90 per cent),
through tankers from peripheral villages located 25 - 30 km away from
Tiruppur. The overall cost incurred by the industry for purchasing water
is Rs. 89.10 crore per annum. Besides, the continuous functioning of
the ‘water market’ has led to the depletion of water in villages, which
has affected the livelihood of the rural poor. The estimated value
foregone by agriculture is Rs. 11.7 lakhs (Palanisamy, 1995).
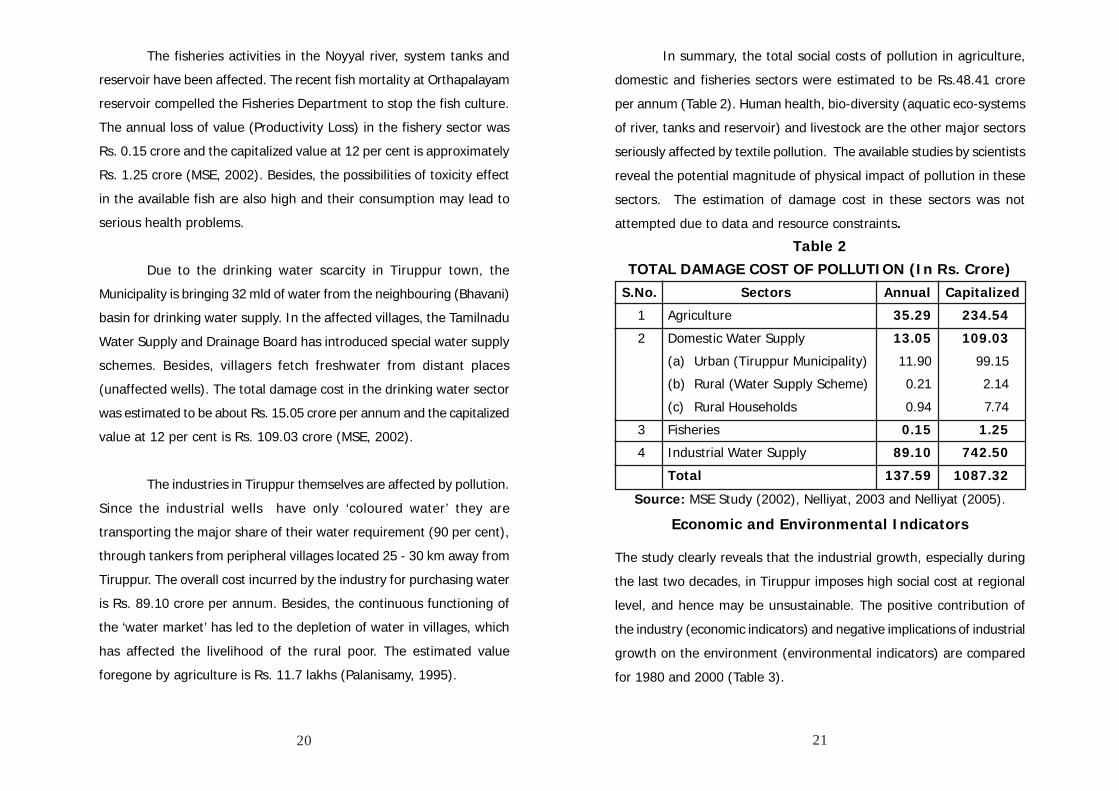
In summary, the total social costs of pollution in agriculture,
domestic and fisheries sectors were estimated to be Rs.48.41 crore
per annum (Table 2). Human health, bio-diversity (aquatic eco-systems
of river, tanks and reservoir) and livestock are the other major sectors
seriously affected by textile pollution. The available studies by scientists
reveal the potential magnitude of physical impact of pollution in these
sectors. The estimation of damage cost in these sectors was not
attempted due to data and resource constraints.
Table 2TOTAL DAMAGE COST OF POLLUTION (In Rs. Crore)
S.No. Sectors Annual Capitalized
1 Agriculture 35.29 234.54
2 Domestic Water Supply 13.05 109.03
(a) Urban (Tiruppur Municipality) 11.90 99.15
(b) Rural (Water Supply Scheme) 0.21 2.14
(c) Rural Households 0.94 7.74
3 Fisheries 0.15 1.25
4 Industrial Water Supply 89.10 742.50
Total 137.59 1087.32
Source: MSE Study (2002), Nelliyat, 2003 and Nelliyat (2005).
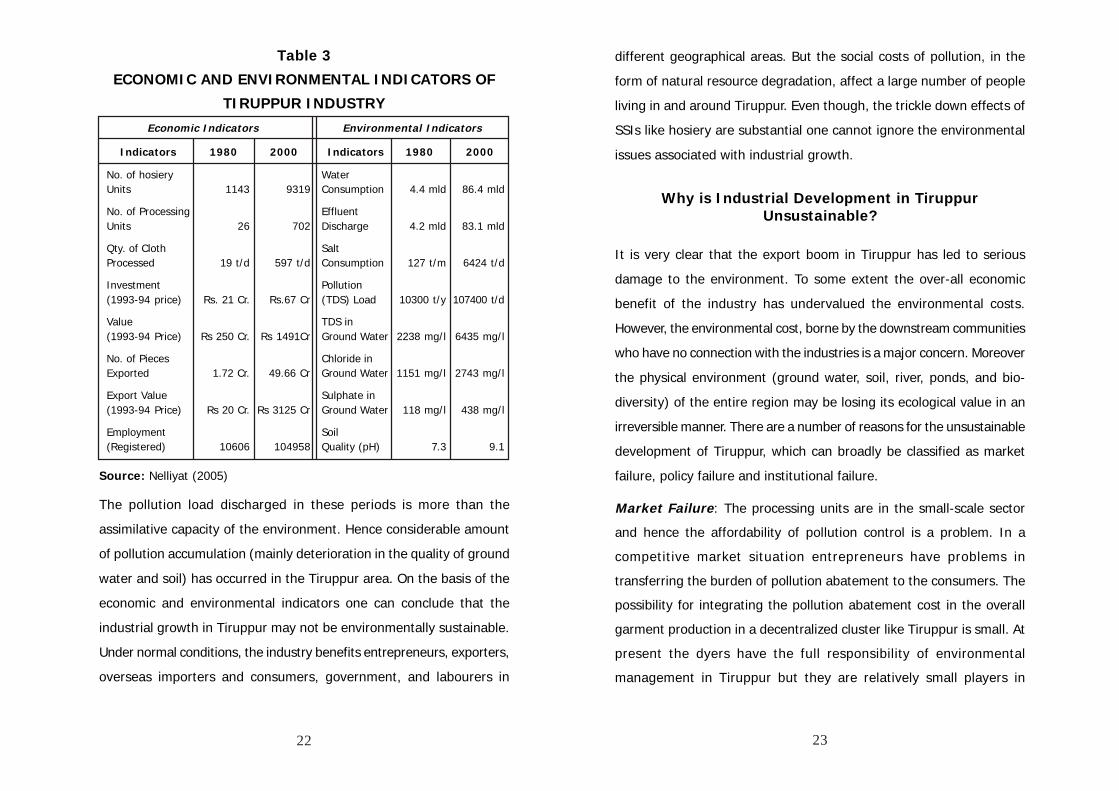
Economic and Environmental Indicators
The study clearly reveals that the industrial growth, especially during
the last two decades, in Tiruppur imposes high social cost at regional
level, and hence may be unsustainable. The positive contribution of
the industry (economic indicators) and negative implications of industrial
growth on the environment (environmental indicators) are compared
for 1980 and 2000 (Table 3).
22 23
Table 3
ECONOMIC AND ENVIRONMENTAL INDICATORS OF
TIRUPPUR INDUSTRY
Economic Indicators Environmental Indicators
Indicators 1980 2000 Indicators 1980 2000
No. of hosiery WaterUnits 1143 9319 Consumption 4.4 mld 86.4 mld
No. of Processing EffluentUnits 26 702 Discharge 4.2 mld 83.1 mld
Qty. of Cloth SaltProcessed 19 t/d 597 t/d Consumption 127 t/m 6424 t/d
Investment Pollution(1993-94 price) Rs. 21 Cr. Rs.67 Cr (TDS) Load 10300 t/y 107400 t/d
Value TDS in(1993-94 Price) Rs 250 Cr. Rs 1491Cr Ground Water 2238 mg/l 6435 mg/l
No. of Pieces Chloride inExported 1.72 Cr. 49.66 Cr Ground Water 1151 mg/l 2743 mg/l
Export Value Sulphate in(1993-94 Price) Rs 20 Cr. Rs 3125 Cr Ground Water 118 mg/l 438 mg/l
Employment Soil(Registered) 10606 104958 Quality (pH) 7.3 9.1
Source: Nelliyat (2005)
The pollution load discharged in these periods is more than the
assimilative capacity of the environment. Hence considerable amount
of pollution accumulation (mainly deterioration in the quality of ground
water and soil) has occurred in the Tiruppur area. On the basis of the
economic and environmental indicators one can conclude that the
industrial growth in Tiruppur may not be environmentally sustainable.
Under normal conditions, the industry benefits entrepreneurs, exporters,
overseas importers and consumers, government, and labourers in
different geographical areas. But the social costs of pollution, in the
form of natural resource degradation, affect a large number of people
living in and around Tiruppur. Even though, the trickle down effects of
SSIs like hosiery are substantial one cannot ignore the environmental
issues associated with industrial growth.
Why is Industrial Development in TiruppurUnsustainable?
It is very clear that the export boom in Tiruppur has led to serious
damage to the environment. To some extent the over-all economic
benefit of the industry has undervalued the environmental costs.
However, the environmental cost, borne by the downstream communities
who have no connection with the industries is a major concern. Moreover
the physical environment (ground water, soil, river, ponds, and bio-
diversity) of the entire region may be losing its ecological value in an
irreversible manner. There are a number of reasons for the unsustainable
development of Tiruppur, which can broadly be classified as market
failure, policy failure and institutional failure.
Market Failure: The processing units are in the small-scale sector
and hence the affordability of pollution control is a problem. In a
competitive market situation entrepreneurs have problems in
transferring the burden of pollution abatement to the consumers. The
possibility for integrating the pollution abatement cost in the overall
garment production in a decentralized cluster like Tiruppur is small. At
present the dyers have the full responsibility of environmental
management in Tiruppur but they are relatively small players in
24 25
comparison to the garment manufacturers or the exporters. Thus, it
has not been possible to internalize the external cost of pollution - a
classic case of market failure.
Market failure at the international level has also failed to provide
a “premium” for eco-friendly production which would have been an
incentive to the industry. The concept of ‘green production/business’
has not influenced the Tiruppur industry. Eco-labeling considers only
the product quality and not about the environmental aspects related to
manufacturing. The overseas importers and consumers are aware about
the environmental problems related to hosiery production, but their
primary consideration is the market price. Presently they are not willing
to pay more for the products, which are manufactured in an eco-friendly
manner with proper pollution management.
Policy Failure: The liberalization policy and the subsequent expansion
in international trade did not take into account the potential impact on
the environment. It was anticipated that trade liberalization would provide
significant gains to developing countries. Since most of the developing
countries do not have sound environmental policies, trade liberalization
often results in natural resource degradation and pollution problems.
Many of the industrial units which achieved substantial progress after
trade liberalization are in the cottage and small scale sectors.
This has take place also as part of national industrial policies,
which provide reservation of industries, like hosiery under SSIs. Since
SSIs do not have clean technologies as well as modern pollution
management, they are facing serious difficulties in complying with
domestic environmental regulations. In the Tiruppur case, exports which
enhanced the economic activities have also increased pollution.
Industrial policies do not taken into account environmental
repercussions. In Tiruppur, textile industrial growth is the key factor
responsible for water pollution. But industrial policies rarely consider
the pollution/environmental aspects.
The policy decision of the Pollution Control Board (PCB) to
permit the units to put up their own individual effluent treatment plants
has added to the workload of the Board. In a small scale cluster all/
majority of the units should have joined with CETPs. But in Tiruppur
out of 702 units only 278 units are with CETPs. The PCB established a
separate District Environmental Engineer’s office at Tiruppur in 1996.
Besides, a District Environmental Laboratory was also established. Even,
with the existing staff and infrastructure facilities it is extremely difficult
for them to monitor the 702 processing units in an effective manner.
Institutional Failure: The environmental management history of
Tiruppur reveals the difficulties faced by the different institutions/actors
like the State Pollution Control Board, Industrial Organizations, NGOs,
Local Government, and the Water Resources Organizations, in finding a
solution for the problem. Otherwise the environmental impacts may not
have reached this level. At present with the existing effluent treatment
facilities are not meeting the TDS standard. Tiruppur Exporters’
Association (TEA), South India Textile Research Association (SITRA),
Apparel Export Promotion Council (AEPC), Textile Committee (TC) South
India Hosiery Manufacture Association (SIHMA), and the Tiruppur Dyers
Association (TDA) are the major facilitators for hosiery industrial
development in Tiruppur. The TDA is doing the best in terms of pollution
management. Unfortunately, so far no serious attempt has come from
26 27
the powerful organizations like TEA. They feel that pollution management
is essentially the dyers’ problem and exporters do not have any direct
responsibility. The processing units depend on the services of SITRA
and TC for quality checking. But SITRA has not done much collaborative
work with Tiruppur industry in regard to pollution management. Their
full concentration has been on garment quality improvement.
The efforts from government departments to deal with the
impact of pollution has also not taken place in the case of Tiruppur.
The Departments of Agriculture, Public Works, Fisheries and Water
Supply which are the major state agencies affected by textile pollution
have not registered their protest. Another disappointing aspect is the
weak efforts of local NGOs and households. Generally local people who
depend on the industry are short sighted and feel that any agitation
against pollution might be a threat to industry. Since industrial activities
are the source of income and livelihood for most of the residents of
Tiruppur raising any negative views like pollution may be counter
productive. A collaborative pollution management effort from industrial
organizations or promotion agencies, the line department and local
NGOs is very much lacking in Tiruppur.
The role of the New Tiruppur Area Development Corporation
Limited (NTADCL) in environmental management of Tiruppur could have
been important. Unfortunately, NTADCL did not incorporate the industrial
waste treatment and disposal in their infrastructure development agenda
even though it was under consideration in the original plan. The decision
by the Court and the subsequent action taken by the TNPCB compelled
the industries to construct treatment plants by mid-1998. Since effluent
treatment plants were under construction, NTADCL did not include
industrial waste treatment as part of their infrastructure project.
Most of the processing units are using the traditional method
of processing (winch) which consume more water and chemical as well
as generate more effluent. But the introduction of Cleaner Production
(CP) technology in the manufacturing process has a lot of scope. The
application of CP in textile industry might include some combination of
soft flow machines, low salt dyes and membrane filtration. In soft flow
dyeing, the salt and water requirement per kilogram of fabric processed
can be reduced up to 50 per cent. With the combined use of low material
liquor ratio and low salt reactive dyes, the total dissolved solids (TDS)
level of the effluents can be reduced by about 40 per cent (Joseph and
Narain, 2000). But the soft flow machine is ten times costlier than the
traditional winch.
Generally the large number of small units cannot afford such
technology. In the integrated and the large processing units (which are
fewer in number), apart from the installation of soft flow machines,
certain steps towards CP technology have already been started.
But the majority of the smaller units do not have a clear idea about CP.
In the present circumstance, CP is only a dream for them since it requires
large investment as well as a scientific approach. At present, the
industrialists are considering soft flow machines as a business option
rather than a resource (water) conservation or a pollution management
strategy, because of the higher quality of the final product.
28 29
Policy Recommendations
The thesis examined both the development and environment aspects
of the Tiruppur hosiery industry in a sustainable development framework.
Generally developing countries need to achieve a high rate of economic
growth, particularly for solving their poverty and unemployment. Hence
in an industrial region like Tiruppur rapid growth is desirable. But when
it leads to serious impacts on the environment and imposes large social
costs to the society, economic development may become unsustainable.
Environment and development are not necessarily in conflict. But serious
efforts have to be made to integrate environmental concerns into the
decision making process to ensure that development is sustainable.
Environmentally sustainable industrial development is important
to preserve the long term interest of the communities who depend on
the industry as well as the communities whose livelihood are affected
because of pollution. Moreover it can also help to preserve the physical
environmental quality (a precious natural asset) of the Tiruppur region.
Overseas importers and consumers have also become more concerned
about the environmental aspects of manufacturing of the products which
they are importing or using. It is very urgent to frame some strategies
towards achieving the sustainable development in Tiruppur. This could
be possible only through considerable changes/ modifications through
policy and institutional initiatives in various areas related to industry
and environment. Following are some policy suggestions to achieve
environmentally sustainable industrial development of Tiruppur.
• Integrated Production Approach: - The dereservation of hosiery
from SSIs and manufacture in the large-scale integrated units
is an ideal solution for manufacturing high quality garments at
minimum cost. Moreover through vertical integration, the units
can adopt effective environmental management steps to meet
the standards. In an integrated unit, the pollution abatement
cost has become a part of its overall textile manufacturing cost
and therefore the burden is less. Moreover an integrated unit
has to think about social accountability and image building.
• Cleaner Production (CP) Technologies: The introduction of CP
technology in the manufacturing process may be the only
effective long range solution for reducing the pollution problems
of textile industries and achieve sustainable development. Even
though soft flow machines are capital intensive, they are
economical in the long run and also environment friendly.
Adequate efforts from the concerned agencies are required
towards the widespread application of CP in textile processing.
• Extend Pollution Abatement Cost in to the Full Textile Value Chain:
- The responsibility for pollution management, should be shared
by the full textile value chain. The present practice of imposing
the full cost of pollution management on the Dyers’ Association
should be changed. Textile processing management should
become the collective responsibility of the full hosiery industry.
The other textile industry associations need to cooperate with
the Dyers Association and provide adequate technical guidelines
and financial support towards pollution management.
• Strict Enforcement: - The role of the Pollution Control Board is
critical in pollution management and it should strictly enforce
30 31
all the pollution control regulations. The TDS standard should
be enforced with respect to all the textile processing units after
considering the cost of the damage that they may cause.
• Economic Instruments: - Since industries are not meeting the
effluent standard for TDS the introduction of economic instruments
like effluent taxes, fines or compensation to the affected parties
could act as an important incentive towards pollution
management. The burden of treatment cost, particularly the
variable costs, is more for the smaller units. Hence the introduction
of subsidies to small units for treatment will serve as an incentive
towards the proper functioning of the plants.
• Integrated Stakeholders Efforts: - All Government departments
who have a link with hosiery industrial development and
environmental aspects should come forward and work together to
solve the environmental problems of Tiruppur. Moreover the local
administration and NGOs need to create more awareness about
the seriousness of environmental damage in the Tiruppur area.
• Public-Private-Partnership Project for Industrial Waste
Management: - Since the existing institutions for pollution
management are facing serious problems, the further possibility
of incorporating the industrial waste (both liquid and solid)
management issues in the Tiruppur Area Development Project
should be reexamined.
• Role of Importers:- Since Tiruppur is a major export centre the
role of overseas buyers and consumers in pollution management
is important. If they boycott the products, which generate
environmental problems in the manufacturing countries, it will
create pressure on the industrialists and exporters. Foreign
consumers in future may demand ‘eco-friendly’ products with
‘green labels’ which carry a premium. The green labels should
consider the process related environmental aspects along with
the product quality.
• Applications of Natural Dyes:- Natural dyes are an eco-friendly
substitute of synthetic dyes, and are less harmful. Adequate
research is needed towards the economical application of
natural dyes in the processing of different textiles.
Recent Developments
In response to a writ petition failed by the Noyyal River Ayacutars
Protection Association on 2003, the Madras High Court constituted an
Expert Committee on May, 2005 to go into the question formulated by
the court. The major task for the six member committee is to suggest
the action plan for remediation of Noyyal river and Orathapalayam
reservoir and to inspect the Tiruppur industrial cluster and suggest
ways and means for preventing the discharge of polluted trade effluent
directly or indirectly to the Noyyal river.
Recently, the court insisted that all the IETPs and CETPs should
follow ‘zero discharge’ for protecting the environment and accordingly
most of the units started the preparations for installing the reverse
osmosis (RO) plants. Sanker (2001) estimated the capital cost of RO
treatment per KL of wastewater treated varies from Rs. 8.74 for the
largest CETP to Rs. 31.11 for the smallest CETP. The corresponding
32
variation in gross operating cost is from Rs. 10 to Rs. 12 per KL. The
major advantage of the RO plant is that 80 per cent of the water can
be recovered and re-used. Since the average cost of RO treatment
(Rs. 21.4/KL) is less than the cost of the fresh water which industries
are paying (Rs.30/ KL) it is economical. But financing the initial
investment, are major constrains. Subsequently, in August, 2005 the
Madras High Court also formed a monitoring committee basically to
evaluate the progress in installation of RO plants by Tiruppur units and
its efficiency in achieving zero discharge.
Another agency set up by the Supreme Court, the Loss of
Ecology Authority (LEA) calculated the compensation to the pollution
affected farmers in the downstream of Noyyal basin on the basis of
productivity loss of different crops as well as the average level of pollution
in the villages. The Authority estimated the damage cost as Rs. 24.8
crore for the period 2002-04 to a total of 28,596 farmers located in 68
villages in 7 taluks in Noyyal river basin. The industries as well as the
farmers have challenged the award on various grounds, and the case
is currently being heard in the Madras High Court.
End Notes
1. Sustainable Development defined as “development that meets
the need of the present generation without compromising the
ability of future generations to meets their needs” (WCED,
1987). It aims for equitably meet development and
environmental needs of present and future generations.
2. Small Scale Industries (SSIs) are units whose investment on
plants and machinery is not more than Rs. 100 lakhs. In the
present study all the textile processing units which come under
the small scale sector do not necessarily meet the official
definition of SSI. The majority of the units (around 90 per cent)
would fall in the tiny (investment on plants and machinery of
not more than Rs. 25 lakhs) classification of the government.
We use the term “small scale” in the generic sense of the word,
and not in terms of the official definition.
3. The Tiruppur Area Development Project (TADP) is a mega water
supply and sewage treatment project and implemented through
the New Tiruppur Area Development Corporation Limited
(NTADCL), a group of public and private entities. The project
bringing 185 mld of water from the Cauvery river (55 km. away)
to Tiruppur for industries and households. Out of the 185 mld
water, 115 mld has been allotted for industries with a tariff of
Rs. 45 per kilolitre. Unfortunately due to the lack of demand
for the TADP water, the agency reduced the tariff by around 50
per cent. The total cost of the project is Rs. 1023 crore.
33
4. Reverse Osmosis is a membrane filtration system which is
effective in removing the total dissolved solids. The main
advantage of RO is that the final effluent is clean water which
can be recycled. The rejects from the RO have to be put through
an evaporator if zero discharge is to be achieved.
5. Ground Water Pollution studies carried out by Government
Departments include Central Ground Water Board 1983, 1993,
and 1999, Tamil Nadu Water Supply and Drainage Board 1999,
2001, and 1995-2001 and the Public Works Department 2002-
03. Jayakumar et al. 1978, Jacob 1998, Rajaguru and Subburam
2000, Senthilnathan and Azeez 1999, CES 1996, Azeez 2001,
Ramasamy and Rajaguru 1991, Jacks et al. 1995, Furn 2004,
and Berglund and Nina 2004 are studies by researchers and
academic institutions.
6. Surface Water Pollution studies done by Government
Departments include Public Works Department - Environmental
Cell - 2001, Tamil Nadu Pollution Control Board 1997-99,
Hydrology Research Station – Fisheries Department - 1995,
Soil Testing Laboratory 2000-01, Central Water Commission
2000-01. Palanivel and Rajaguru 1999, Jacob 1998 are studies
by researchers.
7. The soil quality study in Noyyal river basin was carried by the
Soil Survey and Land Use Organization (SS&LUO), Department
of Agriculture, Government of Tamil Nadu during 2002. Around
660 surface and sub-surface soil samples from the basin were
tested.
References
Azeez, P. A. (2001), “Environmental Implications of Untreated Effluents
from Bleaching and Dyeing”, in Eco-friendly Technology for Waste
Minimisationin in Textile Industry, Centre for Environment
Education, Tiruppur and Public Works Department Water
Resources Organisation, Coimbatore.
Berglund, Per and Nina Johansson. (2004) “A Ground Water Quality
Assessment in Tiruppur”, Masters Thesis, KTH Sweden.
Central Ground Water Board (1983), “Ground Water Resources of
Noyyal, Ponnani and Vattamalai Karai Basin”, Central Ground
Water Board, Chennai.
_________ (1993), “Ground Water Resources and Development Prospect
in Ciombatore District, Tamilnadu”, Central Ground Water Board,
CGWB Southern Division, Hyderabad.
_________ (1999), “A Note on Groundwater Pollution in Tiruppur Block”,
Central Ground Water Board, Chennai.
Central Water Commission (2000-01), “River Water Quality for Noyyal
River”, Central Water Commission, Coimbatore.
Centre for Environmental Studies (1996), “Tiruppur Area Development
Project; Environmental and Social Assessment”, Centre for
Environmental Studies, Anna University, Chennai.
Compendium of Textile Statistics (1999), Office of Textile Commissioner,
Government of India, Mumbai.
Dicken, Peter (1998), “Global Shift Transforming the World Economy”, Third
Edition, The Guilford Press.
34 35
Fun, Kristina (2004), “Effect of Dyeing and Bleaching Industries on the
Area Around the Orthapalayam Dam in South India”, Master
Thesis, Uppsala University, Sweden.
Hydrology Research Station (1996), “Pollution Studies in Noyyal -
Orthapalayam Reservoir Project”, Final Report, Department of
Fisheries, Chennai.
Jacks, Gunnar, M. Kilhage, C. Magnusson and A. Selvaseelan (1995),
“The Environmental Cost of T-Shirts”, Report of the First Policy
Advisory Committee Meeting on Sharing Common Water
Resources, SIDA, Madras Institute of Development Studies,
Chennai.
Jacob, Thomson (1998), “Impact of Industries on the Ground Water
Quality of Tiruppur and its Ethical Implications”, Unpublished Ph.D.
Thesis, University of Madras, Chennai.
Jayakumar, S. C, Loganathan P. and Sivanappan R.K (1978), “A Study of
Ground Water Pollution Due to Human Agency Around Coimbatore
and Tiruppur”, Madras Agriculture Journal, 65 (5): 329-333.
Joseph, Kurian and Jayaprakash Narain (2000), “Cleaner Production
Approach for Water Management in Hosiery Textile Industry”, in
Proceedings of National Workshop on Environmental Planning
Framework for Water Resources Management in Tamilnadu, 23 - 24
November, 2000, Public Works Department, Chennai.
Madras School of Economics (2002), “Environmental Impact of Industrial
Effluents in Noyyal River Basin”, Project Report, Madras School
of Economics, Chennai.
Ministry of Textiles (1999), “Report of the Expert Committees on Textile
Policy”, Government of India, Udyog Bhavan, New Delhi.
Mukherjee Sachidananda and Nelliyat Prakash (2006), “Ground Water
Pollution and Emerging Environmental Challenges: A Case Study
of Mettupalayam Taluk, Tamilnadu”, Working Paper 7/2006,
Madras School of Economics, Chennai
Nelliyat, Prakash (1995), “Environmental Aspects of Bleaching and Dyeing
Industries in Tiruppur”, in Proceedings of the Seminar on
Environmental Aspects of Water Resources Management and
Development, Centre for Water Resources Development and
Management, Calicut.
___ (2003), “Industrial Growth and Water Pollution in Noyyal
River Basin: India”, in Abstract Volume of The Thirteenth
Stockholm Water Symposium, August 11-14, 2003, pp. 365-368.
___________ (2005), “Industrial Growth and Environmental Degradation:
A Case Study of Industrial Pollution in Tiruppur”, Unpublished Ph D
Thesis, University of Madras, Chennai.
___________ (2007), “Public-Private Partnership in Urban Water
Management: The Case of Tiruppur”, in Barun Mitra, Kendra
Okonski and Mohit Satyanand (Ed.) (2007) ‘Keeping the Water
Flowing: Understanding the Role of Institutions, Incentives,
Economics and Entrepreneurship in Ensuring Access and
Optimising Utilization of Water’, Academic Foundation, New Delhi.
Palanivel, M. and P. Raja Guru (1999), “The Present Status of the River
Noyyal” in Proceedings of the Workshop on Environmental Status
of Rivers in Tamil Nadu, Bharathiyar University, Coimbatore.
36 37
Public Works Department (2001), “Environmental Status Report of the
River Noyyal Basin”, PWD Environment Cell, WRO Pollachi Region,
Coimbatore.
_________ (2002), “Ground Water Prospective: A Profile of Erode District”,
State Ground and Surface Water Resources Data Centre, Water
Resources Organisation, Chennai.
_________ (2003), “Ground Water Prospective: A Profile of Coimbatore
District”, State Ground and Surface Water Resources Data Centre,
Water Resources Organisation, Chennai.
Rajaguru, P. and V. Subbaram (2000), “Ground Water Quality in Tiruppur”
in Environmental Awareness on Quality Management of Irrigation
Water, (eds.) Lakshmanaperumalsamy and Krishnaraj, Department
of Environmental Sciences, Bharathiyar University, Coimbatore.
Ramasamy, V. and D. Rajagopal (1991), “Ground Water Quality in Tiruppur”,
Indian Journal of Environmental Health, 33 (2):187-191.
Sankar, U. (2001), “Economic Analysis of Environmental Problems in
Tanneries and Textile Bleaching Dyeing Units and Suggestions for
Policy Action”, Allied Publication Limited. New Delhi.
Senthilnathan, S and P. A. Azeez (1999), “Water Quality of Effluents from
Dyeing and Bleaching Industry in Tiruppur, Tamilnadu India”, Journal
of Industrial Pollution Control 15(1): 79-88.
Soil Survey and Land Use Organisation (2002), “Quality of Soil and Water
for Agriculture in Noyyal River Basin, Tamilnadu” Special Report –
98, SS&LUO, Coimbatore.
38
Soil Testing Laboratory (2000 - 2001), “Water Quality Data for
Orthapalayam Reservoir”, Department of Agriculture, Erode.
Swaminathan, Padmini and J. Jeyaranjan (1995), “The Knitwear Cluster in
Tiruppur: An Indian Industrial District in the Making”, Working Paper
No. 126, Madras Institute of Development Studies (MIDS), Chennai.
Tamilnadu Pollution Control Board (1997-99), “Water Quality Data for
Orthapalayam Reservoir”, TNPCB Office, Tiruppur.
Tamilnadu Water Supply and Drainage Board (1999), “Ground Water Quality
Data for Tiruppur Region”, TWAD Board, Coimbatore.
_________ (2001), “Hand Pump and Power Pump Water Quality Data for
Tiruppur Block”, TWAD Board Database, Chennai.
_________ (1995-2001), “Regular Observation Well Water Quality Data “,
TWAD Board, Chennai.
Vijayabaskar (2001), “Industrial Formation Under Conditions of Flexible
Accumulation, The Case of a Global Knitwear Node in South India”,
Unpublished Ph.D Thesis (Submitted to the Jawaharlal Nehru
University, New Delhi), Centre for Development Studies (CDS),
Thiruvananthapuram.
World Commission on Environment and Development (1987), “Our
Common Future”, Oxford University Press, Oxford, UK.
39