industrial space across the world 2008
TRANSCRIPT
INDUSTRIAL SPACE ACROSS THE WORLD
2008
CUSHMAN & WAKEF IELD RESEARCH

1
Cushman & Wakefield is committed to providing the highestquality of service to their business space clients through thecontinuous monitoring of office and industrial trends andpractices.This edition of Industrial Space Across the Worldprovides a detailed analysis of prime industrial propertyrental performance and occupancy costs across the globe inthe twelve months to December 2007.
The information and data provided in this report are basedon a comprehensive survey of Cushman & Wakefield’s inter-national offices and the editors are extremely grateful tothem for their time, effort and assistance.
Our international representation is designed to facilitate therapid flow of information across borders and is supportedby a comprehensive database of market information and reg-ular liaison meetings. This allows for the exchange of localmarket knowledge and expertise and for the co-ordinationof strategy for international investment and locational deci-sion-making.
Information on the markets has been provided by Cushman& Wakefield, Cushman & Wakefield Semco, its alliance part-ners and its associate offices listed in the table below:
AUSTRIA Inter-pool/FaciCon
THE BALTICS Latio InReal
BULGARIA Forton International
DENMARK RED - Property Advisers
IRELAND Lisney
ISRAEL Inter Israel Real Estate Agency
LEBANON Michael Dunn & Co SAL
MALAYSIA YY Property Solutions
NEW ZEALAND Bayleys
NORWAY Mork & Partners
SOUTH AFRICA Pace Property Group (pty) Ltd
SWITZERLAND SPG Intercity
TAIWAN REPro International
THAILAND Nexus Property Consultants Ltd
TURKEY P&D Real Estate Consultants
CONTENTS
Industrial Property Overview 2
Most Expensive Locations 8
Country Summaries
Argentina 10Australia 10Austria 10Belgium 10Brazil 10Bulgaria 10Canada 10Chile 10China 10Colombia 10Croatia 11Czech Republic 11Denmark 11Estonia 11Finland 11France 11Germany 11Greece 11Hong Kong 11Hungary 11India 12Indonesia 12Ireland 12Israel 12Italy 12Japan 12Latvia 12Lithuania 12Malaysia 12Mexico 12Netherlands 13New Zealand 13Norway 13Poland 13Portugal 13Romania 13Russia 13Singapore 13Slovakia 13South Africa 13Spain 14Sweden 14Switzerland 14Taiwan 14Thailand 14Turkey 14Ukraine 14UK 14USA 14Uruguay 14Venezuela 15Vietnam 15
Rental Tables 15
Research Services 18
Research Publications 19
INTRODUCTION
I N D U S T R I A L S PAC E AC RO S S T H E WO R L D 2 0 0 8
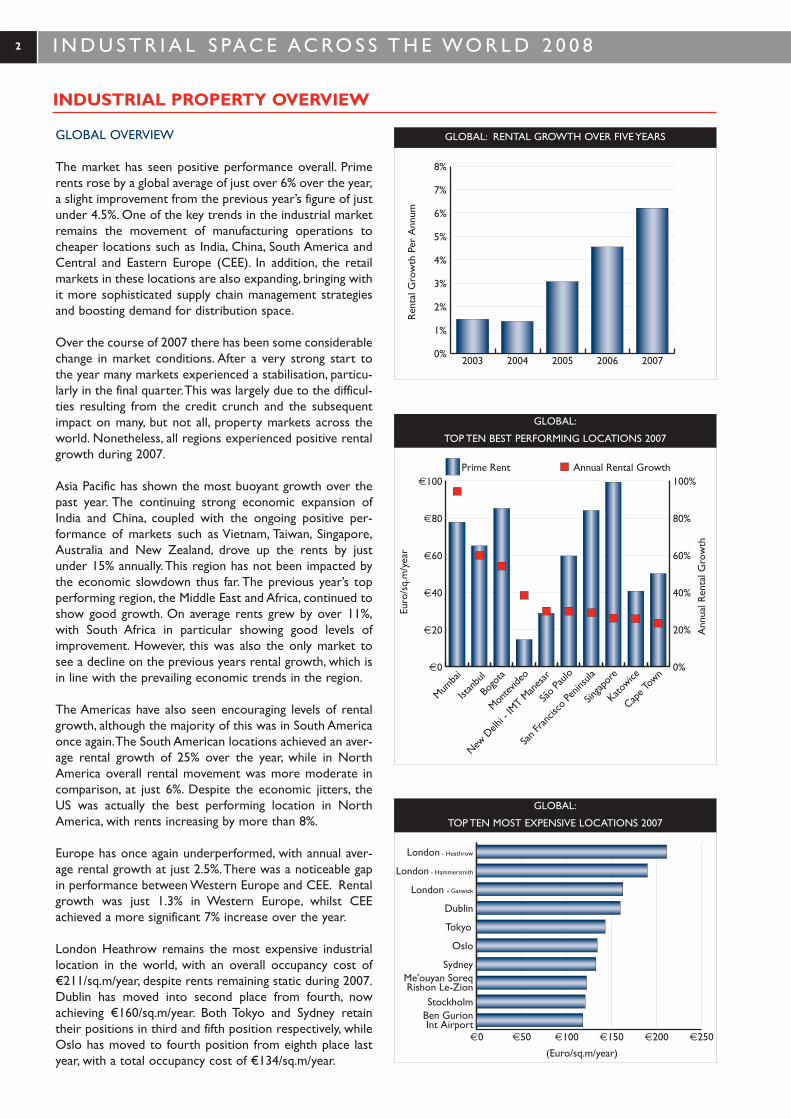
GLOBAL OVERVIEW
The market has seen positive performance overall. Primerents rose by a global average of just over 6% over the year,a slight improvement from the previous year’s figure of justunder 4.5%. One of the key trends in the industrial marketremains the movement of manufacturing operations tocheaper locations such as India, China, South America andCentral and Eastern Europe (CEE). In addition, the retailmarkets in these locations are also expanding, bringing withit more sophisticated supply chain management strategiesand boosting demand for distribution space.
Over the course of 2007 there has been some considerablechange in market conditions. After a very strong start tothe year many markets experienced a stabilisation, particu-larly in the final quarter.This was largely due to the difficul-ties resulting from the credit crunch and the subsequentimpact on many, but not all, property markets across theworld. Nonetheless, all regions experienced positive rentalgrowth during 2007.
Asia Pacific has shown the most buoyant growth over thepast year. The continuing strong economic expansion ofIndia and China, coupled with the ongoing positive per-formance of markets such as Vietnam, Taiwan, Singapore,Australia and New Zealand, drove up the rents by justunder 15% annually.This region has not been impacted bythe economic slowdown thus far. The previous year’s topperforming region, the Middle East and Africa, continued toshow good growth. On average rents grew by over 11%,with South Africa in particular showing good levels ofimprovement. However, this was also the only market tosee a decline on the previous years rental growth, which isin line with the prevailing economic trends in the region.
The Americas have also seen encouraging levels of rentalgrowth, although the majority of this was in South Americaonce again.The South American locations achieved an aver-age rental growth of 25% over the year, while in NorthAmerica overall rental movement was more moderate incomparison, at just 6%. Despite the economic jitters, theUS was actually the best performing location in NorthAmerica, with rents increasing by more than 8%.
Europe has once again underperformed, with annual aver-age rental growth at just 2.5%.There was a noticeable gapin performance between Western Europe and CEE. Rentalgrowth was just 1.3% in Western Europe, whilst CEEachieved a more significant 7% increase over the year.
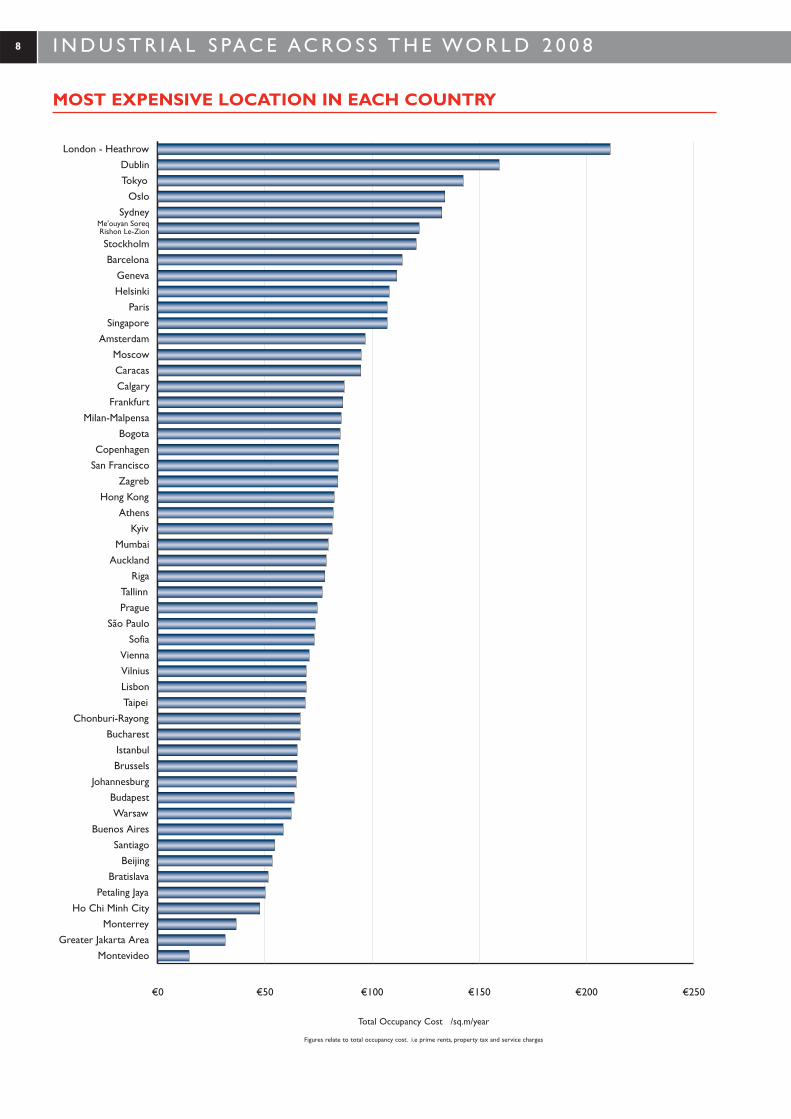
London Heathrow remains the most expensive industriallocation in the world, with an overall occupancy cost of€211/sq.m/year, despite rents remaining static during 2007.Dublin has moved into second place from fourth, nowachieving €160/sq.m/year. Both Tokyo and Sydney retaintheir positions in third and fifth position respectively, whileOslo has moved to fourth position from eighth place lastyear, with a total occupancy cost of €134/sq.m/year.
INDUSTRIAL PROPERTY OVERVIEW
2
Ren
tal G
row
th P
er A
nnum
0%
1%
2%
3%
4%
5%
6%
7%
8%
20072006200520042003
€0
€20
€40
€60
€80
€100Prime Rent
Cape T
own
Katowice
Singap
ore
San F
rancis
co Pe
ninsu
la
São P
aulo
New D
elhi -
IMT M
anes
ar
Montev
ideo
Bogo
ta
Istan
bul
Mumba
i 0%
20%
40%
60%
80%
100%Annual Rental Growth
Euro
/sq.
m/y
ear
Ann
ual R
enta
l Gro
wth
€0 €50 €100 €150 €200 €250
Ben GurionInt Airport
Stockholm
Me'ouyan SoreqRishon Le-Zion
Sydney
Oslo
Tokyo
Dublin
London - Gatwick
London - Hammersmith
London - Heathrow
(Euro/sq.m/year)
GLOBAL: RENTAL GROWTH OVER FIVE YEARS
GLOBAL:
TOP TEN BEST PERFORMING LOCATIONS 2007
GLOBAL:
TOP TEN MOST EXPENSIVE LOCATIONS 2007
AMERICAS OVERVIEW
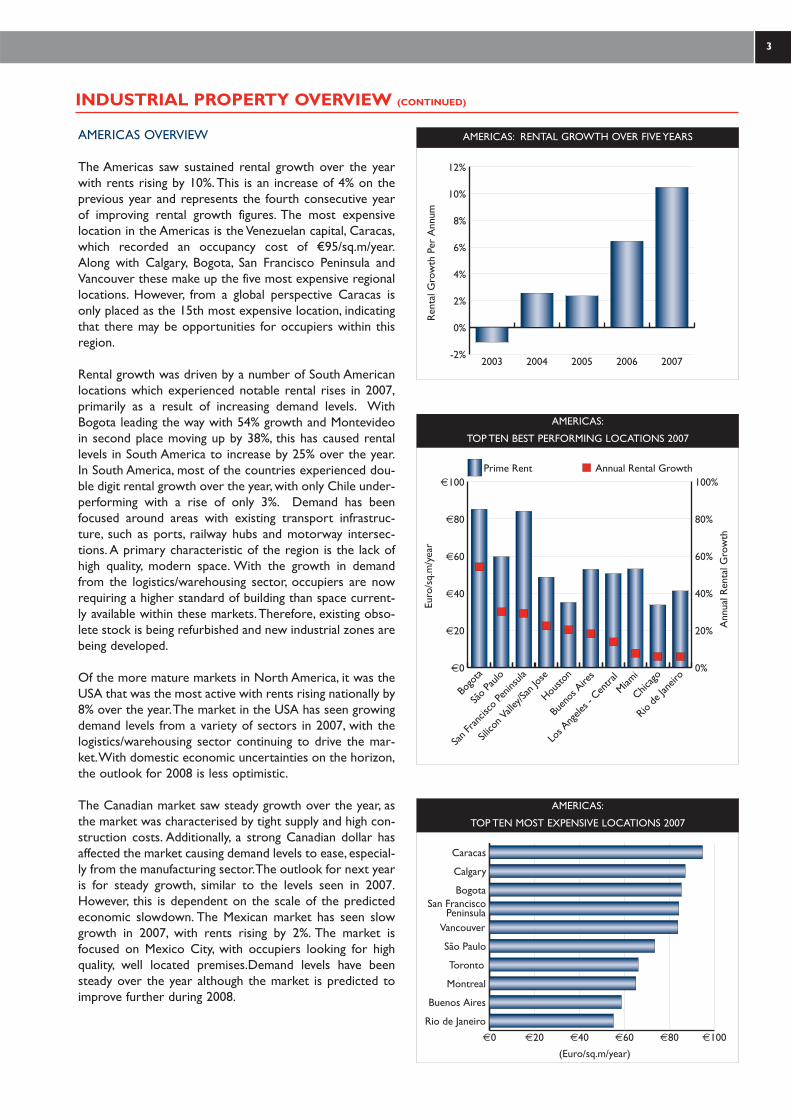
The Americas saw sustained rental growth over the yearwith rents rising by 10%.This is an increase of 4% on theprevious year and represents the fourth consecutive yearof improving rental growth figures. The most expensivelocation in the Americas is the Venezuelan capital, Caracas,which recorded an occupancy cost of €95/sq.m/year.Along with Calgary, Bogota, San Francisco Peninsula andVancouver these make up the five most expensive regionallocations. However, from a global perspective Caracas isonly placed as the 15th most expensive location, indicatingthat there may be opportunities for occupiers within thisregion.
Rental growth was driven by a number of South Americanlocations which experienced notable rental rises in 2007,primarily as a result of increasing demand levels. WithBogota leading the way with 54% growth and Montevideoin second place moving up by 38%, this has caused rentallevels in South America to increase by 25% over the year.In South America, most of the countries experienced dou-ble digit rental growth over the year, with only Chile under-performing with a rise of only 3%. Demand has beenfocused around areas with existing transport infrastruc-ture, such as ports, railway hubs and motorway intersec-tions. A primary characteristic of the region is the lack ofhigh quality, modern space. With the growth in demandfrom the logistics/warehousing sector, occupiers are nowrequiring a higher standard of building than space current-ly available within these markets.Therefore, existing obso-lete stock is being refurbished and new industrial zones arebeing developed.
Of the more mature markets in North America, it was theUSA that was the most active with rents rising nationally by8% over the year.The market in the USA has seen growingdemand levels from a variety of sectors in 2007, with thelogistics/warehousing sector continuing to drive the mar-ket.With domestic economic uncertainties on the horizon,the outlook for 2008 is less optimistic.
The Canadian market saw steady growth over the year, asthe market was characterised by tight supply and high con-struction costs. Additionally, a strong Canadian dollar hasaffected the market causing demand levels to ease, especial-ly from the manufacturing sector.The outlook for next yearis for steady growth, similar to the levels seen in 2007.However, this is dependent on the scale of the predictedeconomic slowdown. The Mexican market has seen slowgrowth in 2007, with rents rising by 2%. The market isfocused on Mexico City, with occupiers looking for highquality, well located premises.Demand levels have beensteady over the year although the market is predicted toimprove further during 2008.
INDUSTRIAL PROPERTY OVERVIEW (CONTINUED)
Ren
tal G
row
th P
er A
nnum
-2%
0%
2%
4%
6%
8%
10%
12%
20072006200520042003
€0
€20
€40
€60
€80
€100Prime Rent
Rio de
Jane
iro
Chicago
Miami
Los A
ngele
s - C
entra
l
Buen
os A
ires
Housto
n
Silico
n Vall
ey/Sa
n Jos
e
San F
rancis
co Pe
ninsu
la
São P
aulo
Bogo
ta0%
20%
40%
60%
80%
100%Annual Rental Growth
Euro
/sq.
m/y
ear
Ann
ual R
enta
l Gro
wth
€0 €20 €40 €60 €80 €100
Rio de Janeiro
Buenos Aires
Montreal
Toronto
São Paulo
Vancouver
San FranciscoPeninsula
Bogota
Calgary
Caracas
(Euro/sq.m/year)
AMERICAS: RENTAL GROWTH OVER FIVE YEARS
AMERICAS:
TOP TEN BEST PERFORMING LOCATIONS 2007
AMERICAS:
TOP TEN MOST EXPENSIVE LOCATIONS 2007
3
I N D U S T R I A L S PAC E AC RO S S T H E WO R L D 2 0 0 8
EUROPE
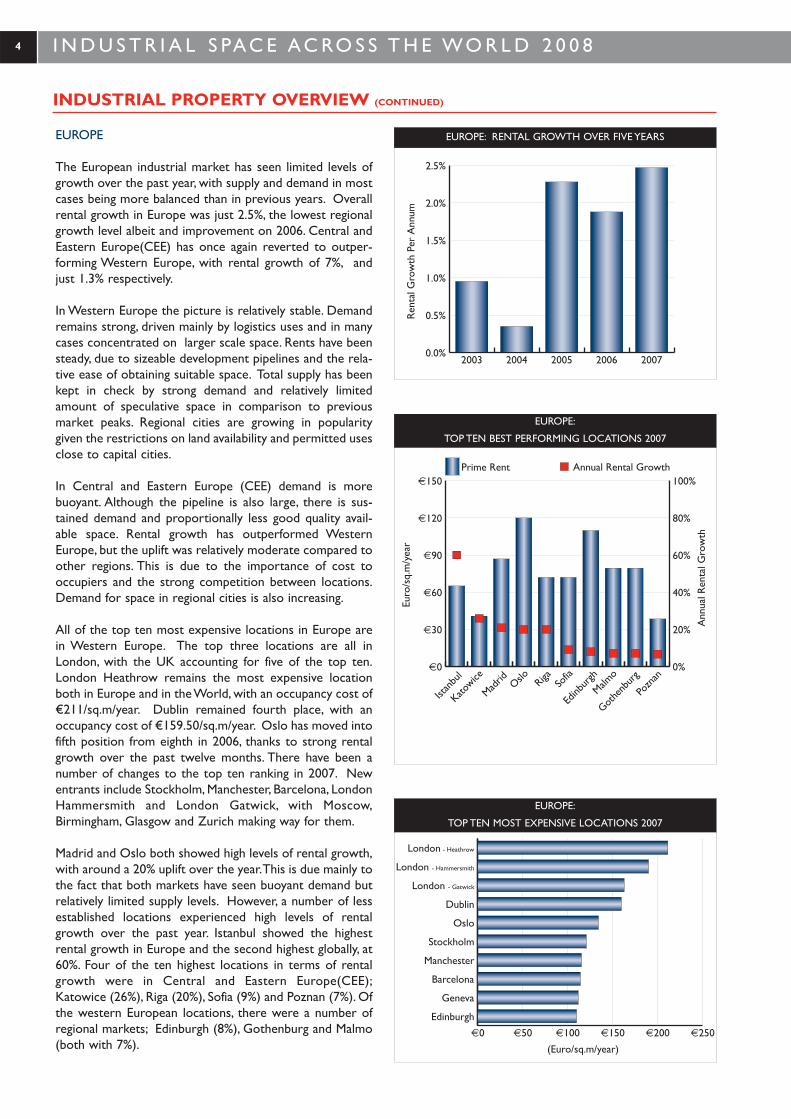
The European industrial market has seen limited levels ofgrowth over the past year, with supply and demand in mostcases being more balanced than in previous years. Overallrental growth in Europe was just 2.5%, the lowest regionalgrowth level albeit and improvement on 2006. Central andEastern Europe(CEE) has once again reverted to outper-forming Western Europe, with rental growth of 7%, andjust 1.3% respectively.
In Western Europe the picture is relatively stable. Demandremains strong, driven mainly by logistics uses and in manycases concentrated on larger scale space. Rents have beensteady, due to sizeable development pipelines and the rela-tive ease of obtaining suitable space. Total supply has beenkept in check by strong demand and relatively limitedamount of speculative space in comparison to previousmarket peaks. Regional cities are growing in popularitygiven the restrictions on land availability and permitted usesclose to capital cities.
In Central and Eastern Europe (CEE) demand is morebuoyant. Although the pipeline is also large, there is sus-tained demand and proportionally less good quality avail-able space. Rental growth has outperformed WesternEurope, but the uplift was relatively moderate compared toother regions. This is due to the importance of cost tooccupiers and the strong competition between locations.Demand for space in regional cities is also increasing.
All of the top ten most expensive locations in Europe arein Western Europe. The top three locations are all inLondon, with the UK accounting for five of the top ten.London Heathrow remains the most expensive locationboth in Europe and in the World, with an occupancy cost of€211/sq.m/year. Dublin remained fourth place, with anoccupancy cost of €159.50/sq.m/year. Oslo has moved intofifth position from eighth in 2006, thanks to strong rentalgrowth over the past twelve months. There have been anumber of changes to the top ten ranking in 2007. Newentrants include Stockholm, Manchester, Barcelona, LondonHammersmith and London Gatwick, with Moscow,Birmingham, Glasgow and Zurich making way for them.
Madrid and Oslo both showed high levels of rental growth,with around a 20% uplift over the year.This is due mainly tothe fact that both markets have seen buoyant demand butrelatively limited supply levels. However, a number of lessestablished locations experienced high levels of rentalgrowth over the past year. Istanbul showed the highestrental growth in Europe and the second highest globally, at60%. Four of the ten highest locations in terms of rentalgrowth were in Central and Eastern Europe(CEE);Katowice (26%), Riga (20%), Sofia (9%) and Poznan (7%). Ofthe western European locations, there were a number ofregional markets; Edinburgh (8%), Gothenburg and Malmo(both with 7%).
INDUSTRIAL PROPERTY OVERVIEW (CONTINUED)
4
Ren
tal G
row
th P
er A
nnum
0.0%
0.5%
1.0%
1.5%
2.0%
2.5%
20072006200520042003
€0
€30
€60
€90
€120
€150Prime Rent
Pozn
an
Gothe
nbur
g
Malmo
Edinb
urgh
Sofia
RigaOslo
Madrid
Katowice
Istan
bul
0%
20%
40%
60%
80%
100%Annual Rental Growth
Euro
/sq.
m/y
ear
Ann
ual R
enta
l Gro
wth
€0 €50 €100 €150 €200 €250
Edinburgh
Geneva
Barcelona
Manchester
Stockholm
Oslo
Dublin
London - Gatwick
London - Hammersmith
London - Heathrow
(Euro/sq.m/year)
EUROPE: RENTAL GROWTH OVER FIVE YEARS
EUROPE:
TOP TEN BEST PERFORMING LOCATIONS 2007
EUROPE:
TOP TEN MOST EXPENSIVE LOCATIONS 2007
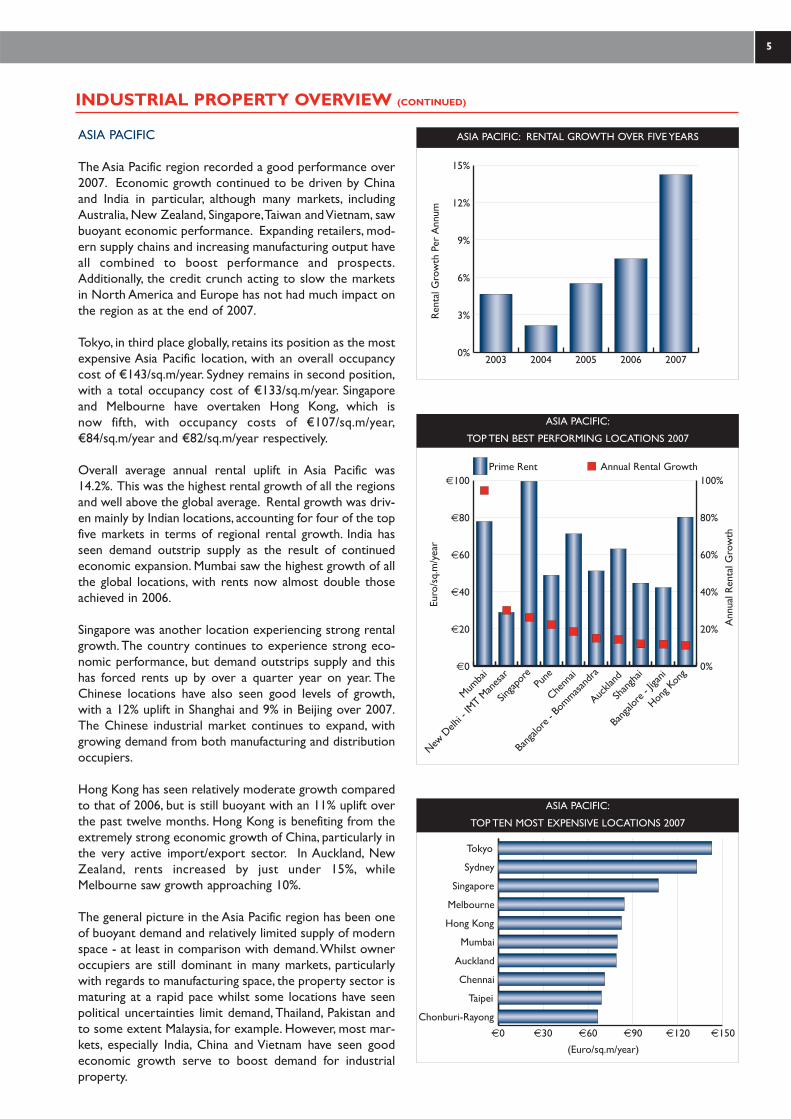
ASIA PACIFIC
The Asia Pacific region recorded a good performance over2007. Economic growth continued to be driven by Chinaand India in particular, although many markets, includingAustralia, New Zealand, Singapore,Taiwan and Vietnam, sawbuoyant economic performance. Expanding retailers, mod-ern supply chains and increasing manufacturing output haveall combined to boost performance and prospects.Additionally, the credit crunch acting to slow the marketsin North America and Europe has not had much impact onthe region as at the end of 2007.
Tokyo, in third place globally, retains its position as the mostexpensive Asia Pacific location, with an overall occupancycost of €143/sq.m/year. Sydney remains in second position,with a total occupancy cost of €133/sq.m/year. Singaporeand Melbourne have overtaken Hong Kong, which isnow fifth, with occupancy costs of €107/sq.m/year,€84/sq.m/year and €82/sq.m/year respectively.
Overall average annual rental uplift in Asia Pacific was14.2%. This was the highest rental growth of all the regionsand well above the global average. Rental growth was driv-en mainly by Indian locations, accounting for four of the topfive markets in terms of regional rental growth. India hasseen demand outstrip supply as the result of continuedeconomic expansion. Mumbai saw the highest growth of allthe global locations, with rents now almost double thoseachieved in 2006.
Singapore was another location experiencing strong rentalgrowth. The country continues to experience strong eco-nomic performance, but demand outstrips supply and thishas forced rents up by over a quarter year on year. TheChinese locations have also seen good levels of growth,with a 12% uplift in Shanghai and 9% in Beijing over 2007.The Chinese industrial market continues to expand, withgrowing demand from both manufacturing and distributionoccupiers.
Hong Kong has seen relatively moderate growth comparedto that of 2006, but is still buoyant with an 11% uplift overthe past twelve months. Hong Kong is benefiting from theextremely strong economic growth of China, particularly inthe very active import/export sector. In Auckland, NewZealand, rents increased by just under 15%, whileMelbourne saw growth approaching 10%.
The general picture in the Asia Pacific region has been oneof buoyant demand and relatively limited supply of modernspace - at least in comparison with demand.Whilst owneroccupiers are still dominant in many markets, particularlywith regards to manufacturing space, the property sector ismaturing at a rapid pace whilst some locations have seenpolitical uncertainties limit demand, Thailand, Pakistan andto some extent Malaysia, for example. However, most mar-kets, especially India, China and Vietnam have seen goodeconomic growth serve to boost demand for industrialproperty.
INDUSTRIAL PROPERTY OVERVIEW (CONTINUED)
Ren
tal G
row
th P
er A
nnum
0%
3%
6%
9%
12%
15%
20072006200520042003
€0
€20
€40
€60
€80
€100Prime Rent
Hong K
ong
Bang
alore
- Jig
ani
Shan
ghai
Auckla
nd
Bang
alore
- Bo
mmasand
ra
Chenn
aiPu
ne
Singap
ore
New D
elhi -
IMT M
anes
ar
Mumba
i 0%
20%
40%
60%
80%
100%Annual Rental Growth
Euro
/sq.
m/y
ear
Ann
ual R
enta
l Gro
wth
€0 €30 €60 €90 €120 €150
Chonburi-Rayong
Taipei
Chennai
Auckland
Mumbai
Hong Kong
Melbourne
Singapore
Sydney
Tokyo
(Euro/sq.m/year)
ASIA PACIFIC: RENTAL GROWTH OVER FIVE YEARS
ASIA PACIFIC:
TOP TEN BEST PERFORMING LOCATIONS 2007
ASIA PACIFIC:
TOP TEN MOST EXPENSIVE LOCATIONS 2007
5
I N D U S T R I A L S PAC E AC RO S S T H E WO R L D 2 0 0 8
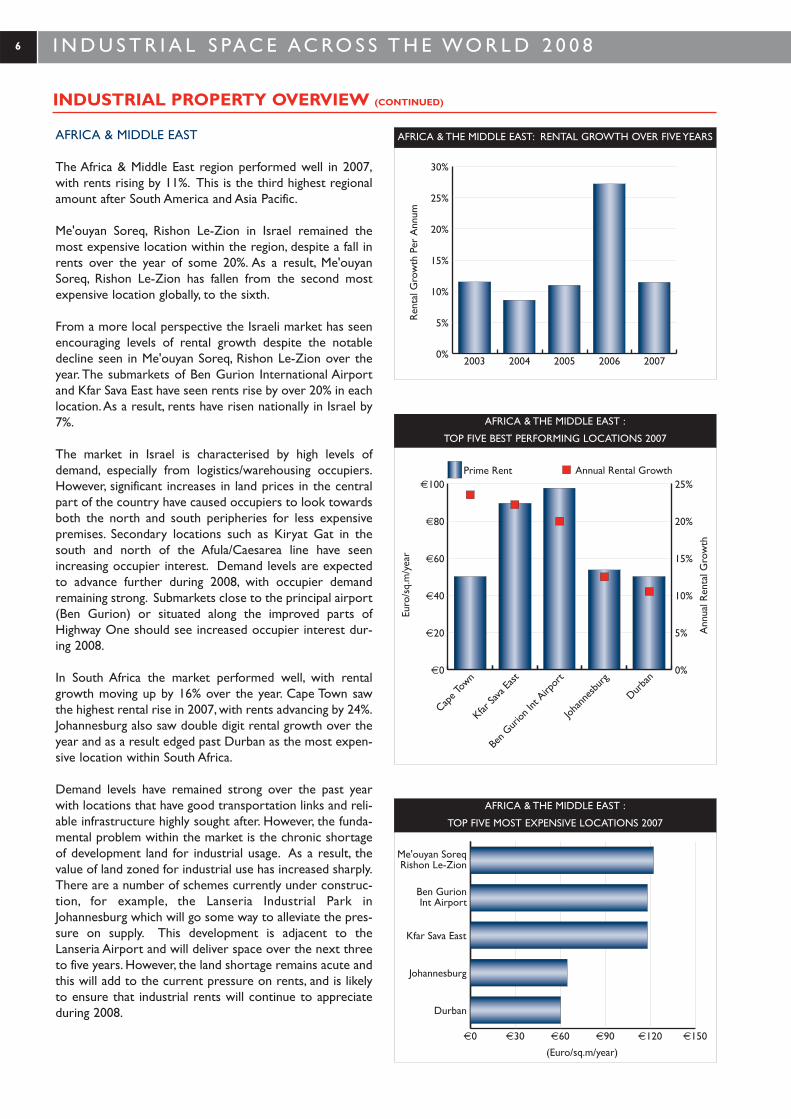
AFRICA & MIDDLE EAST
The Africa & Middle East region performed well in 2007,with rents rising by 11%. This is the third highest regionalamount after South America and Asia Pacific.
Me'ouyan Soreq, Rishon Le-Zion in Israel remained themost expensive location within the region, despite a fall inrents over the year of some 20%. As a result, Me'ouyanSoreq, Rishon Le-Zion has fallen from the second mostexpensive location globally, to the sixth.
From a more local perspective the Israeli market has seenencouraging levels of rental growth despite the notabledecline seen in Me'ouyan Soreq, Rishon Le-Zion over theyear. The submarkets of Ben Gurion International Airportand Kfar Sava East have seen rents rise by over 20% in eachlocation.As a result, rents have risen nationally in Israel by7%.
The market in Israel is characterised by high levels ofdemand, especially from logistics/warehousing occupiers.However, significant increases in land prices in the centralpart of the country have caused occupiers to look towardsboth the north and south peripheries for less expensivepremises. Secondary locations such as Kiryat Gat in thesouth and north of the Afula/Caesarea line have seenincreasing occupier interest. Demand levels are expectedto advance further during 2008, with occupier demandremaining strong. Submarkets close to the principal airport(Ben Gurion) or situated along the improved parts ofHighway One should see increased occupier interest dur-ing 2008.
In South Africa the market performed well, with rentalgrowth moving up by 16% over the year. Cape Town sawthe highest rental rise in 2007, with rents advancing by 24%.Johannesburg also saw double digit rental growth over theyear and as a result edged past Durban as the most expen-sive location within South Africa.
Demand levels have remained strong over the past yearwith locations that have good transportation links and reli-able infrastructure highly sought after. However, the funda-mental problem within the market is the chronic shortageof development land for industrial usage. As a result, thevalue of land zoned for industrial use has increased sharply.There are a number of schemes currently under construc-tion, for example, the Lanseria Industrial Park inJohannesburg which will go some way to alleviate the pres-sure on supply. This development is adjacent to theLanseria Airport and will deliver space over the next threeto five years. However, the land shortage remains acute andthis will add to the current pressure on rents, and is likelyto ensure that industrial rents will continue to appreciateduring 2008.
INDUSTRIAL PROPERTY OVERVIEW (CONTINUED)
6
Ren
tal G
row
th P
er A
nnum
0%
5%
10%
15%
20%
25%
30%
20072006200520042003
€0
€20
€40
€60
€80
€100Prime Rent
Durba
n
Johan
nesb
urg
Ben G
urion
Int A
irpor
t
Kfar Sa
va Ea
st
Cape T
own
0%
5%
10%
15%
20%
25%Annual Rental Growth
Euro
/sq.
m/y
ear
Ann
ual R
enta
l Gro
wth
€0 €30 €60 €90 €120 €150
Durban
Johannesburg
Kfar Sava East
Ben GurionInt Airport
Me'ouyan SoreqRishon Le-Zion
(Euro/sq.m/year)
AFRICA & THE MIDDLE EAST: RENTAL GROWTH OVER FIVE YEARS
AFRICA & THE MIDDLE EAST :
TOP FIVE BEST PERFORMING LOCATIONS 2007
AFRICA & THE MIDDLE EAST :
TOP FIVE MOST EXPENSIVE LOCATIONS 2007
OUTLOOK
The outlook for the global industrial market is positive,although the sector is likely to become increasinglypolarised. A large majority of the global rental growth seenover the year has been driven by emerging markets, princi-pally South America and Asia Pacific.
Western Europe and North America were the slowest per-forming regions in 2007, and this is a trend that is likely tocontinue into 2008. With the current market apprehensionregarding the global economy, occupiers are likely tobecome more selective and price conscious.
The trend for manufacturers moving their operations tolower cost locations will continue for the foreseeablefuture, thus ensuring a demand for manufacturing locations.It is anticipated that, India and China will retain their com-parative advantage in terms of outsourcing/offshoring andmanufacturing respectively, and as a result healthy rentalgrowth is anticipated in these countries in 2008.
Opportunities will continue to exist in less mature mar-kets. Within Europe both manufacturers and warehouseoperators have already taken advantage of using cheaperlocations within Central & Eastern Europe.This trend hascontinued with occupiers looking further eastwards, suchas to the new EU entrants of Romania and Bulgaria, butincreasingly towards Ukraine, Turkey and western Russiafor lower cost locations. As a result, we are likely to seeinterest in these countries grow over the next year.However, occupier interest will only be sustained with therelevant improvements in transportation and infrastructurenetworks.
In western markets that are largely dominated by the logis-tics/warehousing sector, both consumers and occupiers arebecoming increasingly environmentally aware. The primaryaims are to reduce congestion and pollution. It is anticipat-ed that the of carrying more freight by rail or water willbecome an increasing priority.As a result we may see fur-ther growth around ports or rail hubs. However, roadtransport will continue to be the most important elementof the distribution industry, although the development ofmore localised distribution points, rather than one largeregional hub will occur as operators look to reduce costs.
Over the next year it is likely that the more emergentindustrial markets will continue to drive global rentalgrowth. As concerns with the credit crunch slowly impacton the market, the more mature locations may slow furthertowards the end of the year. However, there will beincreasing opportunities for occupiers from both the man-ufacturing and logistics sectors to discover lower cost loca-tions, and this trend will generate rental growth in mostregions in 2008.
INDUSTRIAL PROPERTY OVERVIEW (CONTINUED)
7
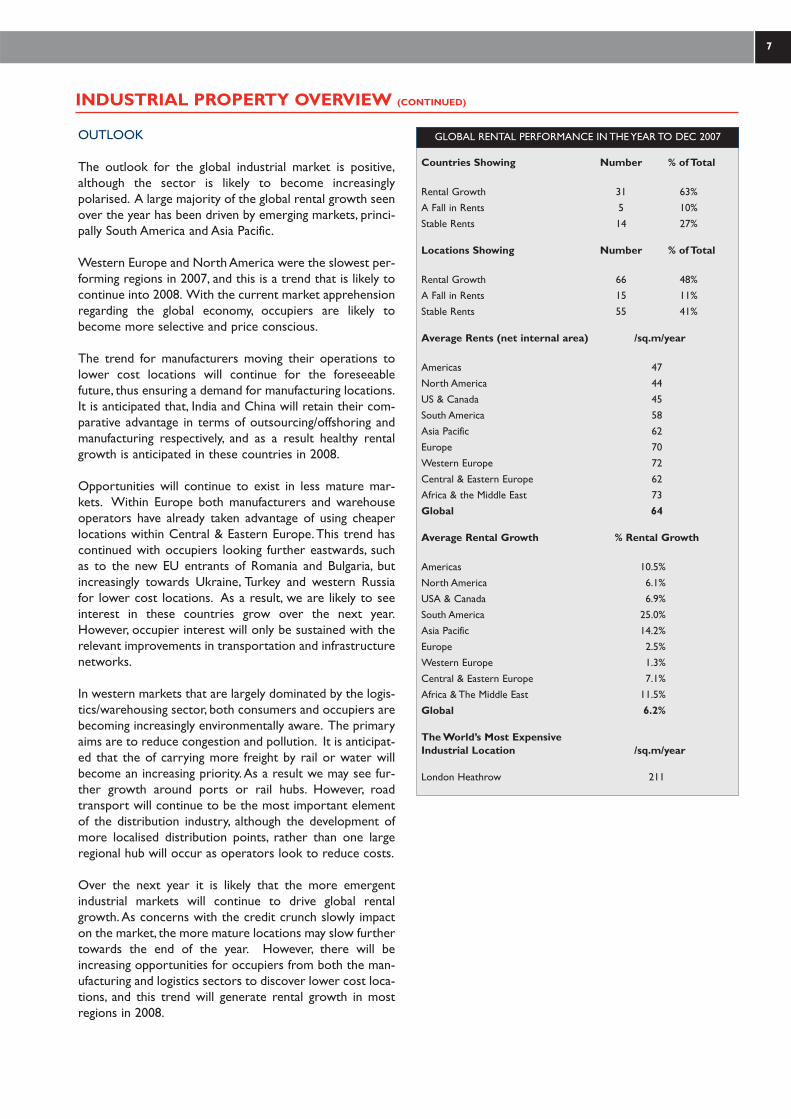
Countries Showing Number % of Total
Rental Growth 31 63%A Fall in Rents 5 10%Stable Rents 14 27%
Locations Showing Number % of Total
Rental Growth 66 48%A Fall in Rents 15 11%Stable Rents 55 41%
Average Rents (net internal area) /sq.m/year
Americas 47North America 44US & Canada 45South America 58Asia Pacific 62Europe 70Western Europe 72Central & Eastern Europe 62Africa & the Middle East 73Global 64
Average Rental Growth % Rental Growth
Americas 10.5%North America 6.1%USA & Canada 6.9%South America 25.0%Asia Pacific 14.2%Europe 2.5%Western Europe 1.3%Central & Eastern Europe 7.1%Africa & The Middle East 11.5%Global 6.2%
The World’s Most Expensive Industrial Location /sq.m/year
London Heathrow 211
GLOBAL RENTAL PERFORMANCE IN THE YEAR TO DEC 2007
I N D U S T R I A L S PAC E AC RO S S T H E WO R L D 2 0 0 8
MOST EXPENSIVE LOCATION IN EACH COUNTRY
8
€0 €50 €100 €150 €200 €250
MontevideoGreater Jakarta Area
MonterreyHo Chi Minh City
Petaling JayaBratislava
BeijingSantiago
Buenos AiresWarsaw
BudapestJohannesburg
BrusselsIstanbul
BucharestChonburi-Rayong
TaipeiLisbonVilniusVienna
SofiaSão Paulo
PragueTallinn
RigaAucklandMumbai
KyivAthens
Hong KongZagreb
San FranciscoCopenhagen
BogotaMilan-Malpensa
FrankfurtCalgaryCaracasMoscow
AmsterdamSingapore
ParisHelsinkiGeneva
BarcelonaStockholm
Me'ouyan SoreqRishon Le-Zion
SydneyOslo
TokyoDublin
London - Heathrow
Total Occupancy Cost /sq.m/year
Figures relate to total occupancy cost. i.e prime rents, property tax and service charges
MOST EXPENSIVE LOCATION IN EACH COUNTRY
9
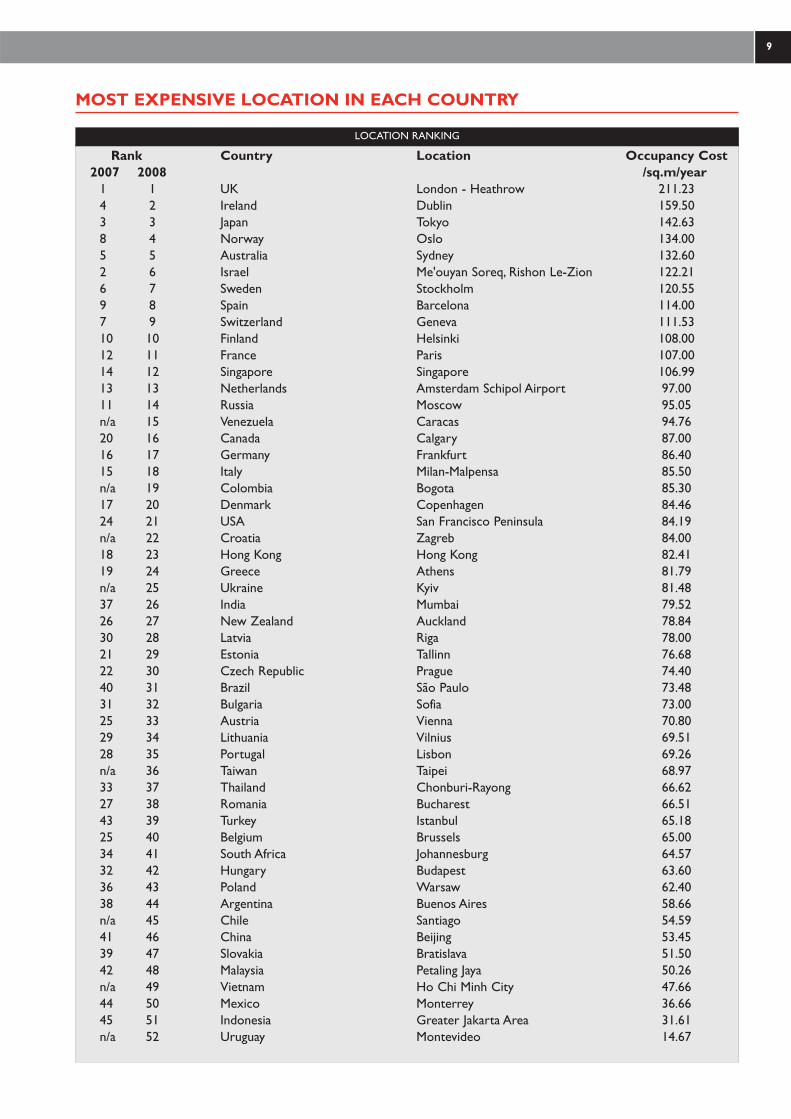
Rank Country Location Occupancy Cost2007 2008 /sq.m/year
1 1 UK London - Heathrow 211.234 2 Ireland Dublin 159.503 3 Japan Tokyo 142.638 4 Norway Oslo 134.005 5 Australia Sydney 132.602 6 Israel Me'ouyan Soreq, Rishon Le-Zion 122.216 7 Sweden Stockholm 120.559 8 Spain Barcelona 114.007 9 Switzerland Geneva 111.5310 10 Finland Helsinki 108.0012 11 France Paris 107.0014 12 Singapore Singapore 106.9913 13 Netherlands Amsterdam Schipol Airport 97.0011 14 Russia Moscow 95.05n/a 15 Venezuela Caracas 94.7620 16 Canada Calgary 87.0016 17 Germany Frankfurt 86.4015 18 Italy Milan-Malpensa 85.50n/a 19 Colombia Bogota 85.3017 20 Denmark Copenhagen 84.4624 21 USA San Francisco Peninsula 84.19n/a 22 Croatia Zagreb 84.0018 23 Hong Kong Hong Kong 82.4119 24 Greece Athens 81.79n/a 25 Ukraine Kyiv 81.4837 26 India Mumbai 79.5226 27 New Zealand Auckland 78.8430 28 Latvia Riga 78.0021 29 Estonia Tallinn 76.6822 30 Czech Republic Prague 74.4040 31 Brazil São Paulo 73.4831 32 Bulgaria Sofia 73.0025 33 Austria Vienna 70.8029 34 Lithuania Vilnius 69.5128 35 Portugal Lisbon 69.26n/a 36 Taiwan Taipei 68.9733 37 Thailand Chonburi-Rayong 66.6227 38 Romania Bucharest 66.5143 39 Turkey Istanbul 65.1825 40 Belgium Brussels 65.0034 41 South Africa Johannesburg 64.5732 42 Hungary Budapest 63.6036 43 Poland Warsaw 62.4038 44 Argentina Buenos Aires 58.66n/a 45 Chile Santiago 54.5941 46 China Beijing 53.4539 47 Slovakia Bratislava 51.5042 48 Malaysia Petaling Jaya 50.26n/a 49 Vietnam Ho Chi Minh City 47.6644 50 Mexico Monterrey 36.6645 51 Indonesia Greater Jakarta Area 31.61n/a 52 Uruguay Montevideo 14.67
LOCATION RANKING
I N D U S T R I A L S PAC E AC RO S S T H E WO R L D 2 0 0 8
COUNTRY SUMMARIES
10
Argentina
Economy
A lack of quality stock characterises the market at presentwith a high level of obsolete space. High quality stockaccounts for only around 20% of the market. Consequently,rental levels have increased over the year by 18%.The mainindustrial facilities are located in the Northern Area inBuenos Aires and include Parque Industrial Pilar andTortuguitas, with logistics operations around thePanamerican Highway, eg. Pilar and Escobar Branch Roads.
Industrial Property
Bulgaria
Economy
The ongoing lack of supply continues to constrain the mar-ket, however, take up levels did rise over the course of theyear. Demand stems from both domestic and internationaloccupiers and is focused on Sofia and surrounding areaswhich have superior transport links. However, Plovdiv, themain traditional industrial area, is also growing in popularity.Owner occupation is high due to the lack of modern stock,but developers are now beginning to build speculatively.
Industrial Property
Australia
Economy
The Australian industrial market recorded strong rentalgrowth over 2007, as demand remained high for prime prop-erties across most industrial centres. Major rental growth inSydney, as a result of brisk leasing activity,was curbed by highlevels of new supply, particularly in the Outer WesternSydney region. Melbourne's industrial market also per-formed well over 2007, with high levels of leasing activity.
Industrial Property
Canada
Economy
The Canadian market saw steady rental growth of 3% overthe year. The market remains characterised by tight supply,high construction costs and a lack of product. Overall vacan-cy rates have increased nationally, but ended the year below5%. Calgary remains the tightest market, although over 3million square feet of space is due to be introduced to themarket over the next five years.
Industrial Property
Austria
Economy
The Austrian industrial market was steady over the pastyear, and rental performance was static. Supply remains rel-atively high, while demand has shown no growth. Interestfrom tenants is mainly focused on Vienna and Graz, butowner occupation remains common. Requirements mainlystem from domestic occupiers, given the proximity of cheap-er locations such as Czech Republic, Hungary and Slovakia.This trend is expected to continue.
Industrial Property
Chile
Economy
The industrial sector in Chile is largely comprised of ware-house space used in the distribution process of goods ratherthan production. Take-up has increased over the past fewyears and a huge part of the existing oversupply has beenoccupied. Over the next year or so, the trend should be acontinuance of increasing take up and largely stable rentalvalues.
Industrial Property
Belgium
Economy
Supply in the main Belgian markets remained relatively tight,particularly in the key markets of Brussels and Antwerp.Take-up was healthy over the course of the year and rentalvalues eased upwards by 6% year-on-year in Brussels as aresult. Demand mainly comes from logistics occupiers andSMEs. Although the Antwerp-Brussels market remains res-olutely the most popular, given the lack of supply, occupiersare increasingly considering locating to secondary locations.
Industrial Property
China
Economy
The Chinese industrial markets delivered solid growth over2007. Shanghai performed well, with annual rental growth of12% while in Beijing prime rental growth remained robust at9%. Owner-occupation continues to dominate and mostindustrial supply is located in government backed industrialzones. Manufacturing remains China's fastest growing sector.However, the logistics market is also growing rapidly withinternational investors expanding across the country.
Industrial Property
Brazil
Economy
The market in Brazil is starting to grow after a long periodof stagnation.With demand from occupiers rising, the levelof speculative development has increased. The logistics sec-tor has been the fastest growing and occupiers are lookingfor well located high quality premises.The industrial markethas started to become increasingly decentralized, althoughthe main focus of the market remains São Paulo where rentshave risen by 30% over the year.
Industrial Property
Colombia
Economy
The market has continued to advance over the last fewyears with the regulation of local development and animprovement in the domestic economy. Rents have risendramatically over the year as a result, increasing by 54%.Thesector is concentrated around Bogota and there have beena number of new developments including new industrialparks.
Industrial Property
COUNTRY SUMMARIES
11
Croatia
Economy
The industrial market in Croatia has seen a decline in rentalvalues over the year, falling by 7%. Although demand hasbeen growing, there is little modern stock within the mar-ket, with the majority being out of date and obsolete. Rentsare likely to rise as a number of speculative schemes areexpected to complete during 2008, thus freeing up theowner occupied market.
Industrial Property
France
Economy
In 2007 the logistics market improved, with total annual let-ting activity at 2.6million sq.m.The Ile-de-France market sawa small decline in take-up year-on-year, whereas the otherkey French cities have seen excellent growth over the year.Supply of modern space is tight, but developments and refur-bishments continue apace, which may alter the picture nextyear. Rents moved down marginally over the year in mostmarkets.
Industrial Property
Czech Republic
Economy
Czech industrial letting activity was strong in 2007, drivenmainly by distribution firms locating in and around Prague.However, other main cities such as Brno and Ostrava arecontinuing to grow in popularity and maturity. Developmentcontinues apace, with a steady increase in speculative con-struction. Supply is rising due to the size of the pipeline,leading in turn to stable rental performance.
Industrial Property
Germany
Economy
German industrial rents remained static in all markets overthe year. However, market fundamentals have seen significantimprovement in 2007. Demand has increased, particularly inthe Frankfurt area. Supply of good quality stock is low inprime markets, forcing occupiers to consider more periph-eral locations. Development activity has improved, althoughspeculative space remains rare. Most developments are forlarger units, which are in relatively short supply.
Industrial Property
Denmark
Economy
The Danish industrial market has one of the lowest vacancyrates in Europe. This has dropped further over the year,although the supply of secondary stock remains sizable.Logistics and freight remain the primary drivers of occupierdemand.Take up remains steady and is focused on the welldeveloped logistics clusters in and around Copenhagen.Rental values have in general shown no movement over theyear as a result of the balanced market.
Industrial Property
Greece
Economy
Good quality industrial space remains in short supply.Development activity has fallen over the year, as developersare increasingly cautious. Occupier interest remains steady,with well located sites in Athens and Thessaloniki the mainfocus of demand. The expansion of the market remainsreliant on the ongoing improvement to the domestic infra-structure. Rental growth was flat in 2007, with no movementin Athens over the course of the year.
Industrial Property
Estonia
Economy
There is a shortage of high quality stock within the market,with virtually all of it under owner occupation. Rental levelshave held firm over the year with a number of industrialparks being developed in the wider Tallinn region. Rental lev-els should increase further in 2008 as demand increases andhigh quality stock continues to remain scarce.
Industrial Property
Hong Kong
Economy
Demand for industrial premises in Hong Kong has remainedhealthy over past 12 months, with rental growth recorded at11% over the year. The market was largely driven by solideconomic growth, supported by trade from mainland China.Increased activity in the import-export sector, in particular,is fuelling strong demand in the logistics market. Due todeclining vacancy, and very low levels of new supply, primerents are expected to increase in 2008.
Industrial Property
Finland
Economy
The industrial market has been stable over the year, withrental values holding firm.The primary focus has been on thelogistics/warehousing sector, with the Lahti highway being ofprincipal interest to occupiers. However, with improvinginfrastructure and the completion of the new port inHelsinki expected in 2008, it is anticipated that rents will riseover the year.
Industrial Property
Hungary
Economy
The Hungarian industrial market has seen solid improve-ment in take up year on year. Demand is strongest for spacearound the capital, primarily located on the motorway net-work, but other cities such as Gyor, Miskolc and Debrecenaccount for a growing share of requirements. Supply hasseen a large rise during 2007 as development levels haverisen over the year. Rents were static as a result.
Industrial Property
I N D U S T R I A L S PAC E AC RO S S T H E WO R L D 2 0 0 8
COUNTRY SUMMARIES
12
India
Economy
The Indian industrial market once again recorded anextremely strong performance. Prime rents rose by a thirdover the year, with particularly sharp rises in Mumbai andNew Delhi. In most cities manufacturing space is largelyowner occupied, but in Mumbai and New Delhi manufactur-ing space is available for rent. In general activity continues toshift to industrial parks on the outskirts of the main cities.Further rental growth is expected next year.
Industrial Property
Japan
Economy
Industrial rents in Japan showed no change over the pasttwelve months.This is in part due to relatively poor domes-tic economic performance, but also to the lack of develop-ment land which restricts supply and therefore take up.Thisis particularly true of Tokyo, where competition from otherland uses coupled with the high cost of sites severely limitsindustrial development potential. Expectations are that themarket will remain stable over the coming year.
Industrial Property
Indonesia
Economy
The industrial market in the Greater Jakarta area has had aquiet year relative to 2006.The automotive and steel relat-ed industries remain the underlying drivers of the market,but take up has been lower this year. Rental movement hasbeen negative, with rents moving back by -1% over the pasttwelve months. Looking forward, interest in larger units isexpected to be limited, but small scale demand will bestronger. Rents are expected to remain static next year.
Industrial Property
Latvia
Economy
The Latvian industrial market has seen encouraging rentalgrowth of 20% over the year.As the industrial sector contin-ues to establish itself within Latvia, demand has risen notice-ably in 2007, with the logistics largely driving the market.Rental growth should continue in 2008, although the rate ofgrowth may ease as a result of prevailing economic condi-tions.
Industrial Property
Ireland
Economy
The industrial property market in Ireland was steady in2007.Take up was healthy, achieving similar levels to those ofthe previous year. Increasingly, requirements are for areasaway from Dublin, as limited supply and rising operationalcosts encourage occupiers to look further afield.Nonetheless, demand for space in the capital remainsstrong, with rental values rising by around 5% over the yearas a result.
Industrial Property
Lithuania
Economy
The Lithuanian industrial market is probably the least devel-oped within the Baltic States. However, rents have risen by5% over the year, with the logistics and distribution sectorsthe main drivers of the market. Demand levels are likely toremain high in 2008 as important hubs such as Klaipeda andVilnius remain attractive to occupiers.
Industrial Property
Israel
Economy
Land prices in central areas have increased noticeably overthe past year and as a result, industrial occupiers are movingtowards the peripheries. Areas such as Kiryat Gat to thesouth and northwards from the Afula/Caesarea line haveseen increased occupier demand. Rental values have risennationally by 7% in 2007, and that trend is likely to continuein 2008.
Industrial Property
Malaysia
Economy
High levels of growth in the export sector underpinned ahealthy performance in the Malaysian industrial market in2007. Prime rents held firm, as letting activity remains con-strained by high levels of owner-occupation. Continuedstrong growth in new development and in the investmentsector is expected to result in more leasing opportunitiesand increased occupier activity over 2008. Prime rents areexpected to come under upward pressure in 2008
Industrial Property
Italy
Economy
Demand for industrial and logistics properties has slowedthrough the year and remains relatively low compared tosupply. Some secondary locations have seen vacancy rise, asnew speculative schemes lead to an oversupply of stock. Incontrast, prime markets still have relatively high demand andlower vacancy rates. Rental values have remained stable,although with some regional differences.The outlook for thefreight sector remains largely positive in prime locations.
Industrial Property
Mexico
Economy
The market has seen steady performance during 2007, withrental values increasing by 2%. In Mexico City, a large major-ity of the prime space is located in the Cuautitlán andToluca-Lerma submarkets. Demand for space remains firm,with occupiers seeking high-quality, well-located premises.There is limited modern supply. With demand levels expect-ed to grow in 2008, new developments and renovations willbe crucial to relieving the shortage of supply.
Industrial Property
COUNTRY SUMMARIES
13
Netherlands
Economy
Demand for larger, accessible logistics property has beenaccelerating.Take up has been strong over the course of theyear, but vacancy remains high in some areas.This is mainlydue to the large proportion of older properties available.Demand is strongest for the Amsterdam and Rotterdamport areas, Amsterdam Schiphol Airport and also theSouthern region of the Netherlands. Only Schiphol has seenany growth in rents, with values rising by 6% year on year.
Industrial Property
Romania
Economy
The Romanian industrial market remains characterised by ahigh level of owner occupation. However, as demandincreases year-on-year, so too has the number of construc-tion starts, which should boost the market in the shortterm. Nonetheless, much of this space is pre-let or built-to-suit space. While demand still outstrips supply, the marketremains resolutely low cost and rents have reduced over theyear in Bucharest as construction activity has picked up.
Industrial Property
New Zealand
Economy
The industrial market in New Zealand registered solid rentalgrowth over 2007. Demand was driven by the increasingimportance of the import sector and the associated needfor high-quality distribution warehouses. Greater Aucklandcontinues to dominate and is set to benefit from significantinvestment in transport infrastructure. Development levelsand land absorption remained high in 2007,but are expect-ed to ease in 2008 as the economy slows.
Industrial Property
Russia
Economy
The industrial property market has seen good levels ofgrowth in 2007, driven by the expansion in the Russianeconomy. Demand is strong and focused on high quality, welllocated logistics space. Supply is tight and there are few con-cessions available for tenants. Although there is a sizeabledevelopment pipeline; completions do not appear to bekeeping up with the pace of demand. Rental values roseslightly over the year in Moscow as a result.
Industrial Property
Norway
Economy
The Norwegian industrial market performed well over thecourse of 2007. The domestic economy has expandedstrongly, helped by high oil prices. Demand continues to out-strip supply, with most interest focused in and around Osloand port cities such as Bergen. Domestic companies domi-nate, but foreign interest is noticable. Rental growth hasbeen extremely strong as a result, moving up by 20% overthe past twelve months.
Industrial Property
Singapore
Economy
Singapore's industrial market saw one of the highest rentalgrowth figures (26%) globally in 2007. Industrial rents roseagainst a background of strong letting activity but relativelylimited supply. Space in business parks is also being targetedby office sector tenants looking for cheaper accommoda-tion, boosting rents further. However, a large pipeline isexpected to deliver significant volumes of prime industrialproduct, potentially limiting rental growth in 2009 and 2010.
Industrial Property
Poland
Economy
Demand for industrial space in Poland has remained strongover the year.Warsaw remains dominant. However, region-al markets such as Upper Silesia, Central Poland andWroclaw are now established industrial areas. Supply ofmodern stock remains tight in most locations, in spite of thelarge volumes of new space being delivered to the market.Indeed in many locations the market is solely driven by thedevelopment pipeline. Rents moved up as a result in most
Industrial Property
Slovakia
Economy
Demand for industrial space in Slovakia is strong, but take upis constrained by the lack of modern supply. Developers arebeginning to increase the amount of speculative space inresponse, although built to suit schemes still dominate themarket. Most interest is focused on the main arterial routesleading to the capital, Bratislava. However, this should moveout to regional cities as the market matures. Rental values inBratislava are expected to remain stable in the short term.
Industrial Property
Portugal
Economy
The year end saw increased demand for logistics space, par-ticularly in the Alverca/Azambuja area,north of Lisbon andfor larger units. Overall industrial performance was lessdynamic than that of logistics but new schemes have begunas a result of Government encouragement and infrastruc-ture improvements. Although rents were stable in 2007, theincreased development pipeline is likely to cause rental fallsin the short term.
Industrial Property
South Africa
Economy
There has been strong tenant demand for high quality, welllocated space across South Africa. With limited speculativedevelopment and a lack of available space, vacancy rates havedecreased, and rental levels have risen by around 16%.Additionally, zoned land values and rising building costs haveincreased the pressure on rents. In 2008 new developmentsshould attract higher rental levels in areas of high demand.
Industrial Property
I N D U S T R I A L S PAC E AC RO S S T H E WO R L D 2 0 0 8
COUNTRY SUMMARIES
14
Spain
Economy
Healthy levels of occupier demand are still evident in boththe Barcelona and Madrid markets.The high demand is notbeing matched by available supply.The availability of modernstock has remained very low in prime locations, with devel-opment focused on secondary locations. Much of the devel-opment pipeline is pre let, so vacancy is not expected to risein the short term. Rental values have edged up in Barcelona,but increased significantly in Madrid over the year.
Industrial Property
Turkey
Economy
Demand remains strong. Logistics and light industrial occu-piers are mainly interested in Istanbul and its surrounds.Traditionally industrial areas in Istanbul have been concen-trated in the European submarkets, such as in the Ayazagaarea, although a number of Asian submarkets, such as Tuzlaand Gebze, have seen significant growth recently. Modernproperty is in short supply, despite the sizeable developmentpipeline. Rents are rising considerably in all submarkets.
Industrial Property
Sweden
Economy
Good quality supply remains limited, while demand is strong.Refurbishment or build-to-suit remain the favoured routesin meeting occupier needs as limited new speculative stockis entering the marketplace. Stockholm remains the mostpopular market, but the cities of Malmö and Gothenburg areincreasingly in demand, with the latter popular for logisticsdue to its strong transport links and strategic location. Rentsedged up across all main markets in 2007.
Industrial Property
Ukraine
Economy
Industrial rents in Kyiv have remained largely stable over thepast twelve months. Despite the rising level of new devel-opment, the market is relatively small, and there is a limitedamount of good quality, modern stock. Demand is increas-ing, focused mainly on the motorway links around Kyiv.However, occupiers are now considering other cities such asOdessa. Looking forward, rents may decrease as greateramounts of new supply are delivered to the market.
Industrial Property
Switzerland
Economy
Demand for industrial space was fair and steady over thecourse of the year in both Zurich and Geneva.The availabil-ity of quality supply remains limited, which is mainly a con-sequence of the lack of available sites that are suitable fornew development and the strict planning regulations.This isunlikely to change in the short to medium term, given thesmall market and the therefore limited scope for demand.There was no movement in rents in either main markets.
Industrial Property
United Kingdom
Economy
The UK industrial market recorded subdued rental growthof just 1% in 2007, with only Glasgow and Edinburgh seeingany uplift.The occupier market remains in good shape, withretailers continuing to drive the market. Available space islimited, but the development pipeline is very large,with a siz-able proportion of it speculative.The outlook for the mar-ket remains largely positive, although rental growth oppor-tunities will be limited due to the volume of new supply.
Industrial Property
Taiwan
Economy
Prime industrial rents in Taiwan registered modest growth of6% over 2007.The rental growth was attributed to low lev-els of new supply and the government's policy of attractingTaiwanese high-tech companies back from lower-cost China.Industrial activity is now increasing and rents are expectedto hold firm at their current levels over the short-term.Growth in the high-tech industry and a potential opening upof trade policy with China could also have positive impact.
Industrial Property
United States
Economy
The market performed well in 2007, with rental growthnationally amounting to 8%. Silicon Valley, the San FranciscoPeninsula, and Houston all recorded rental growth of over20%.Warehouse/distribution product comprises the major-ity of the market and demand is increasingly coming from avariety of sectors including logistics, technology, and trans-portation. The outlook for the market next year is positiveas demand is expected to remain firm.
Industrial Property
Thailand
Economy
Prime industrial rents remained unchanged in Thailand over2007. The market remains characterised by high levels ofowner occupation. However, the sale of Serviced IndustrialLand Plots (SILPs) soared over the year, up by 51% on 2006.Foreign entrants are more confident in the domestic politi-cal situation now that the new Government has been elect-ed. However, rents are expected to remain stable at theircurrent level over the next 12 months.
Industrial Property
Uruguay
Economy
The industrial market within Montevideo Metropolitan dis-trict is widely dispersed. The majority of supply is olderobsolete premises requiring renovation.As a result, rents forwell located, high quality stock have increased significantlyover the year by 38%.The Zona America is currently one ofthe prime warehouse locations, situated alongside theInternational Airport of Carrasco and 30 minutes fromDowntown Montevideo and the Port.
Industrial Property
COUNTRY SUMMARIES
15
Venezuala
Economy
High quality stock remains in short supply within Venezuela.Rents are currently high in Caracas due to the high cost ofland. Activity is currently concentrated on Caracas, butinfrastructure improvements have seen increased interest intowns such as Guatire and Charallave, where real estate andlabour costs are lower. The logistics sector is most activealong the Caracas to Valencia axis, where high quality, welllocated premises are sought after.
Industrial Property
Vietnam
Economy
Vietnam's industrial market saw further positive develop-ments in 2007, with increased interest from diversifyinginternational manufacturers. Rental levels in the popularlocations of Binh Duong and Dong Nai rose by up to 60%,as demand continued to outstrip supply. A number of newindustrial parks launched in 2007 have helped satisfy demandwhile industrial zones have continued to expand across thecountry.
Industrial Property
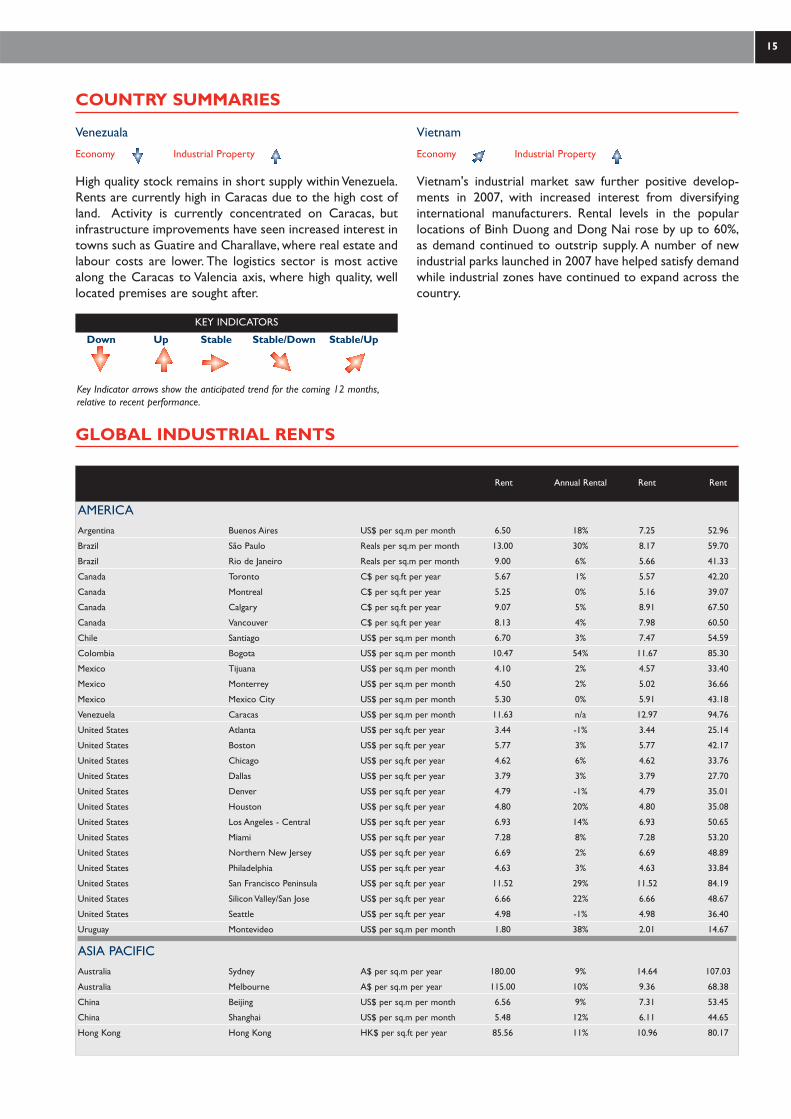
AMERICAArgentina Buenos Aires US$ per sq.m per month 6.50 18% 7.25 52.96
Brazil São Paulo Reals per sq.m per month 13.00 30% 8.17 59.70
Brazil Rio de Janeiro Reals per sq.m per month 9.00 6% 5.66 41.33
Canada Toronto C$ per sq.ft per year 5.67 1% 5.57 42.20
Canada Montreal C$ per sq.ft per year 5.25 0% 5.16 39.07
Canada Calgary C$ per sq.ft per year 9.07 5% 8.91 67.50
Canada Vancouver C$ per sq.ft per year 8.13 4% 7.98 60.50
Chile Santiago US$ per sq.m per month 6.70 3% 7.47 54.59
Colombia Bogota US$ per sq.m per month 10.47 54% 11.67 85.30
Mexico Tijuana US$ per sq.m per month 4.10 2% 4.57 33.40
Mexico Monterrey US$ per sq.m per month 4.50 2% 5.02 36.66
Mexico Mexico City US$ per sq.m per month 5.30 0% 5.91 43.18
Venezuela Caracas US$ per sq.m per month 11.63 n/a 12.97 94.76
United States Atlanta US$ per sq.ft per year 3.44 -1% 3.44 25.14
United States Boston US$ per sq.ft per year 5.77 3% 5.77 42.17
United States Chicago US$ per sq.ft per year 4.62 6% 4.62 33.76
United States Dallas US$ per sq.ft per year 3.79 3% 3.79 27.70
United States Denver US$ per sq.ft per year 4.79 -1% 4.79 35.01
United States Houston US$ per sq.ft per year 4.80 20% 4.80 35.08
United States Los Angeles - Central US$ per sq.ft per year 6.93 14% 6.93 50.65
United States Miami US$ per sq.ft per year 7.28 8% 7.28 53.20
United States Northern New Jersey US$ per sq.ft per year 6.69 2% 6.69 48.89
United States Philadelphia US$ per sq.ft per year 4.63 3% 4.63 33.84
United States San Francisco Peninsula US$ per sq.ft per year 11.52 29% 11.52 84.19
United States Silicon Valley/San Jose US$ per sq.ft per year 6.66 22% 6.66 48.67
United States Seattle US$ per sq.ft per year 4.98 -1% 4.98 36.40
Uruguay Montevideo US$ per sq.m per month 1.80 38% 2.01 14.67
ASIA PACIFICAustralia Sydney A$ per sq.m per year 180.00 9% 14.64 107.03
Australia Melbourne A$ per sq.m per year 115.00 10% 9.36 68.38
China Beijing US$ per sq.m per month 6.56 9% 7.31 53.45
China Shanghai US$ per sq.m per month 5.48 12% 6.11 44.65
Hong Kong Hong Kong HK$ per sq.ft per year 85.56 11% 10.96 80.17
Rent Annual Rental Rent Rent
GLOBAL INDUSTRIAL RENTS
Down Up Stable Stable/Down Stable/Up
KEY INDICATORS
Key Indicator arrows show the anticipated trend for the coming 12 months,relative to recent performance.

I N D U S T R I A L S PAC E AC RO S S T H E WO R L D 2 0 0 8
GLOBAL INDUSTRIAL RENTS
16
India Mumbai RNI per sq.ft. per month 35.00 94% 10.65 77.85
India New Delhi - IMT Manesar RNI per sq.ft. per month 13.00 30% 3.96 28.92
India New Delhi - Greater Noida RNI per sq.ft. per month 8.00 0% 2.43 17.79
India Chennai RNI per sq.ft. per month 32.00 19% 9.74 71.18
India Pune RNI per sq.ft. per month 22.00 22% 6.70 48.93
India Bangalore - Bommasandra RNI per sq.ft. per month 23.00 15% 7.00 51.76
India Bangalore - Peenya RNI per sq.ft. per month 21.00 11% 6.39 46.71
India Bangalore - Jigani RNI per sq.ft. per month 19.00 12% 5.78 42.26
Indonesia Greater Jakarta Area US$ per sq.m per month 3.88 -1% 4.33 31.61
Japan Tokyo Tsubo per month 6500.00 0% 19.51 142.63
Malaysia Petaling Jaya RM per sq.ft per month 1.90 0% 6.88 50.26
New Zealand Auckland $NZ per sq. m year 120.00 14% 8.63 63.08
Singapore Singapore S$ per sq.ft per year 19.68 26% 13.60 99.42
Taiwan Taipei NT$ per ping per month 850.00 6% 8.81 64.42
Thailand Pathum-Ayudhaya Baht per sq.m per month 220.00 0% 8.10 59.22
Thailand Chonburi-Rayong Baht per sq.m per month 220.00 0% 8.10 59.22
Vietnam Ho Chi Minh City US$ per sq.m per month 5.85 0% 7.38 54.00
EUROPEAustria Vienna Euro per sq.m per month 4.50 0% 7.38 54.00
Austria Graz Euro per sq.m per month 3.50 0% 5.74 42.00
Austria Linz Euro per sq.m per month 3.80 0% 6.24 45.60
Austria Salzburg Euro per sq.m per month 3.80 0% 6.24 45.60
Austria Innsbruck Euro per sq.m per month 4.00 0% 6.56 48.00
Belgium Brussels Euro per sq.m per year 50.00 6% 6.84 50.00
Belgium Antwerp Euro per sq.m per year 42.00 2% 5.74 42.00
Bulgaria Sofia Euro per sq.m per year 72.00 9% 9.85 72.00
Croatia Zagreb Euro per sq.m per year 84.00 -7% 11.49 84.00
Czech Republic Prague Euro per sq.m per month 4.70 0% 7.71 56.40
Czech Republic Brno Euro per sq.m per month 4.50 0% 7.38 54.00
Denmark Copenhagen DKr per sq.m per year 550.00 0% 10.09 73.74
Denmark Aarhus DKr per sq.m per year 450.00 0% 8.25 60.33
Denmark Odense DKr per sq.m per year 450.00 0% 8.25 60.33
Estonia Tallinn EEK per sq.m per month 100.00 0% 10.49 76.68
Finland Helsinki Euros per sq.m per month 9.00 0% 14.77 108.00
France Paris Euro per sq.m per year 95.00 6% 12.99 95.00
France Lyon Euro per sq.m per year 52.00 -5% 7.11 52.00
France Marseille Euro per sq.m per year 50.00 -6% 6.84 50.00
France Bordeaux Euro per sq.m per year 50.00 -2% 6.84 50.00
France Lille Euro per sq.m per year 46.00 -8% 6.29 46.00
France Toulouse Euro per sq.m per year 46.00 -4% 6.29 46.00
France Nice Euro per sq.m per year 53.00 2% 7.25 53.00
France Nantes Euro per sq.m per year 48.00 -4% 6.56 48.00
France Strasbourg Euro per sq.m per year 52.00 4% 7.11 52.00
Germany Berlin Euro per sq.m per month 4.50 0% 7.38 54.00
Germany Frankfurt Euro per sq.m per month 6.00 0% 9.85 72.00
Germany Hamburg Euro per sq.m per month 5.00 0% 8.20 60.00
Germany Munich Euro per sq.m per month 5.75 0% 9.44 69.00
Germany Dusseldorf Euro per sq.m per month 5.00 0% 8.20 60.00
Germany Stuttgart Euro per sq.m per month 4.50 0% 7.38 54.00
Germany Cologne Euro per sq.m per month 4.50 0% 7.38 54.00
Germany Essen Euro per sq.m per month 4.00 0% 6.56 48.00
Germany Leipzig Euro per sq.m per month 3.50 0% 5.74 42.00
Germany Dresden Euro per sq.m per month 4.60 0% 7.55 55.20
Greece Athens Euro per sq.m per month 6.00 0% 9.85 72.00
Hungary Budapest Euro per sq.m per month 4.50 0% 7.38 54.00
Ireland Dublin Euro per sq.m per year 124.00 5% 16.96 124.00
Italy Rome Euro per sq.m per year 80.00 -2% 10.94 80.00
Rent Annual Rental Rent Rent
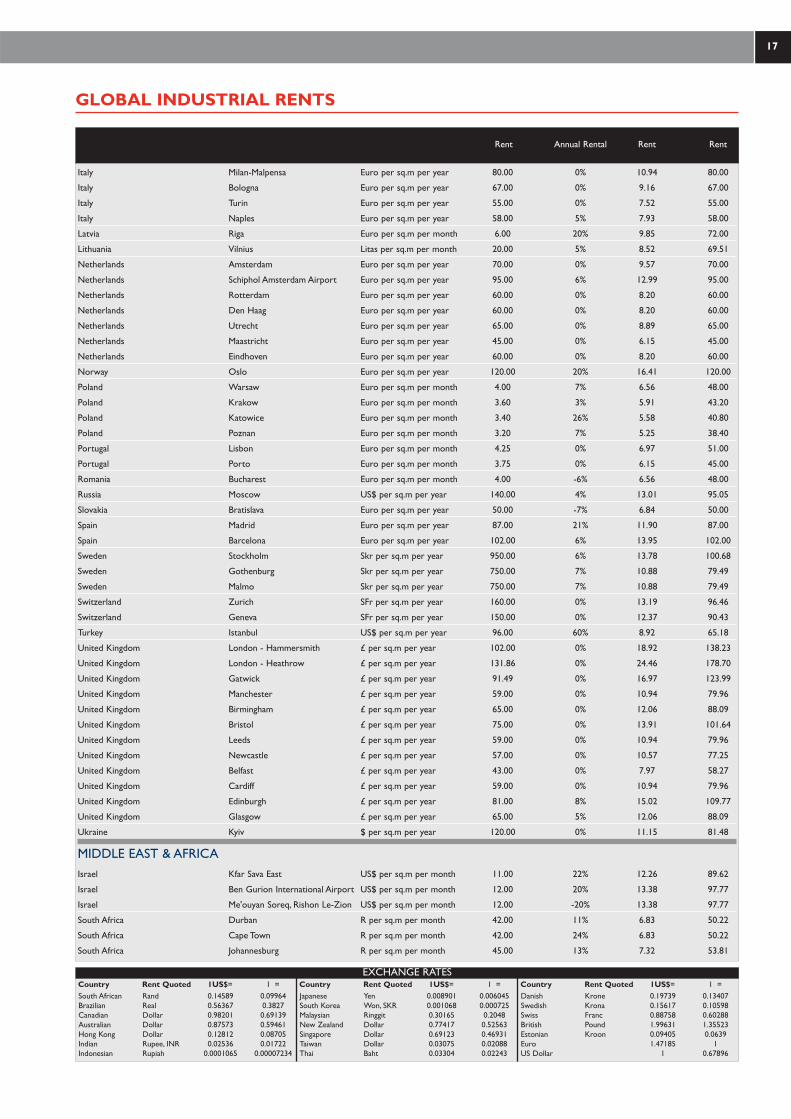
GLOBAL INDUSTRIAL RENTS
17
Italy Milan-Malpensa Euro per sq.m per year 80.00 0% 10.94 80.00
Italy Bologna Euro per sq.m per year 67.00 0% 9.16 67.00
Italy Turin Euro per sq.m per year 55.00 0% 7.52 55.00
Italy Naples Euro per sq.m per year 58.00 5% 7.93 58.00
Latvia Riga Euro per sq.m per month 6.00 20% 9.85 72.00
Lithuania Vilnius Litas per sq.m per month 20.00 5% 8.52 69.51
Netherlands Amsterdam Euro per sq.m per year 70.00 0% 9.57 70.00
Netherlands Schiphol Amsterdam Airport Euro per sq.m per year 95.00 6% 12.99 95.00
Netherlands Rotterdam Euro per sq.m per year 60.00 0% 8.20 60.00
Netherlands Den Haag Euro per sq.m per year 60.00 0% 8.20 60.00
Netherlands Utrecht Euro per sq.m per year 65.00 0% 8.89 65.00
Netherlands Maastricht Euro per sq.m per year 45.00 0% 6.15 45.00
Netherlands Eindhoven Euro per sq.m per year 60.00 0% 8.20 60.00
Norway Oslo Euro per sq.m per year 120.00 20% 16.41 120.00
Poland Warsaw Euro per sq.m per month 4.00 7% 6.56 48.00
Poland Krakow Euro per sq.m per month 3.60 3% 5.91 43.20
Poland Katowice Euro per sq.m per month 3.40 26% 5.58 40.80
Poland Poznan Euro per sq.m per month 3.20 7% 5.25 38.40
Portugal Lisbon Euro per sq.m per month 4.25 0% 6.97 51.00
Portugal Porto Euro per sq.m per month 3.75 0% 6.15 45.00
Romania Bucharest Euro per sq.m per month 4.00 -6% 6.56 48.00
Russia Moscow US$ per sq.m per year 140.00 4% 13.01 95.05
Slovakia Bratislava Euro per sq.m per year 50.00 -7% 6.84 50.00
Spain Madrid Euro per sq.m per year 87.00 21% 11.90 87.00
Spain Barcelona Euro per sq.m per year 102.00 6% 13.95 102.00
Sweden Stockholm Skr per sq.m per year 950.00 6% 13.78 100.68
Sweden Gothenburg Skr per sq.m per year 750.00 7% 10.88 79.49
Sweden Malmo Skr per sq.m per year 750.00 7% 10.88 79.49
Switzerland Zurich SFr per sq.m per year 160.00 0% 13.19 96.46
Switzerland Geneva SFr per sq.m per year 150.00 0% 12.37 90.43
Turkey Istanbul US$ per sq.m per year 96.00 60% 8.92 65.18
United Kingdom London - Hammersmith £ per sq.m per year 102.00 0% 18.92 138.23
United Kingdom London - Heathrow £ per sq.m per year 131.86 0% 24.46 178.70
United Kingdom Gatwick £ per sq.m per year 91.49 0% 16.97 123.99
United Kingdom Manchester £ per sq.m per year 59.00 0% 10.94 79.96
United Kingdom Birmingham £ per sq.m per year 65.00 0% 12.06 88.09
United Kingdom Bristol £ per sq.m per year 75.00 0% 13.91 101.64
United Kingdom Leeds £ per sq.m per year 59.00 0% 10.94 79.96
United Kingdom Newcastle £ per sq.m per year 57.00 0% 10.57 77.25
United Kingdom Belfast £ per sq.m per year 43.00 0% 7.97 58.27
United Kingdom Cardiff £ per sq.m per year 59.00 0% 10.94 79.96
United Kingdom Edinburgh £ per sq.m per year 81.00 8% 15.02 109.77
United Kingdom Glasgow £ per sq.m per year 65.00 5% 12.06 88.09
Ukraine Kyiv $ per sq.m per year 120.00 0% 11.15 81.48
MIDDLE EAST & AFRICAIsrael Kfar Sava East US$ per sq.m per month 11.00 22% 12.26 89.62
Israel Ben Gurion International Airport US$ per sq.m per month 12.00 20% 13.38 97.77
Israel Me'ouyan Soreq, Rishon Le-Zion US$ per sq.m per month 12.00 -20% 13.38 97.77
South Africa Durban R per sq.m per month 42.00 11% 6.83 50.22
South Africa Cape Town R per sq.m per month 42.00 24% 6.83 50.22
South Africa Johannesburg R per sq.m per month 45.00 13% 7.32 53.81
Rent Annual Rental Rent Rent
South African Rand 0.14589 0.09964Brazilian Real 0.56367 0.3827Canadian Dollar 0.98201 0.69139Australian Dollar 0.87573 0.59461Hong Kong Dollar 0.12812 0.08705Indian Rupee, INR 0.02536 0.01722Indonesian Rupiah 0.0001065 0.00007234
Country Rent Quoted 1US$= 1 =Japanese Yen 0.008901 0.006045South Korea Won, SKR 0.001068 0.000725Malaysian Ringgit 0.30165 0.2048New Zealand Dollar 0.77417 0.52563Singapore Dollar 0.69123 0.46931Taiwan Dollar 0.03075 0.02088Thai Baht 0.03304 0.02243
Danish Krone 0.19739 0.13407Swedish Krona 0.15617 0.10598Swiss Franc 0.88758 0.60288British Pound 1.99631 1.35523Estonian Kroon 0.09405 0.0639Euro 1.47185 1US Dollar 1 0.67896
Country Rent Quoted 1US$= 1 = Country Rent Quoted 1US$= 1 =EXCHANGE RATES

I N D U S T R I A L S PAC E AC RO S S T H E WO R L D 2 0 0 818
RESEARCH SERVICES
Cushman & Wakefield research staff are located throughout the world with the EMEA service co-ordinated in London, theAmericas in New York and Asia in Hong Kong.
Research provides a strategic advisory and supporting role to clients and other departments within the firm, with extensiveand continuously updated information systems covering property, economic, corporate and social trends.
Consultancy projects are undertaken on a local and international basis.We provide in-depth advice and analysis, producingdetailed market appraisals on current and future trends for developers, investors and occupiers.We also advise on locationand investment strategies and portfolio performance.Typical projects include a mix of the following:
• Location analysis, ranking and targeting for occupation or investment• Future development activity and existing supply/competition• Demand analysis by retail/industry sector• Rental analysis, forecasts & investment & portfolio strategy• Floorspace audits, tenant-mix assessment & catchment/expenditure analysis• Retailer, occupier and consumer surveys• Pedestrian flow analysis & local employment studies
For further information on research and its services in the Europe or worldwide, please contact:
David Hutchings - Head of the European Research GroupTel: +44 (0) 207 152 5029Email: [email protected]
TECHNICAL SPECIFICATION
For each location a standard definition of a prime unit is employed, to endeavour to make the results as comparable as pos-sible, given varying local market practices. Some countries quote their rents inclusive and some exclusive of service chargeand property taxes, so in order to make a more detailed comparison across regions, the total occupancy costs should beused.
Rents have been expressed in Euros per sq.m per year, converted using exchange rates as at December of the relevant year.Rental growth figures are quoted in local currency unless otherwise indicated.Total Occupancy costs take into account serv-ice charges and local taxes, to allow direct comparison between countries.
Direct Class A rents are quoted in all US locations.
Further information and copies of this report are available from Louise Yewdall.
Cushman & Wakefield 43-45 Portman Square London W1A 3BG
Telephone: +44 (0)20 7152 5761Facsimile: +44 (0)20 7152 5366e-mail: [email protected]

19
PUBLICATIONS
INTERNATIONAL INVESTMENT ATLAS
2008
C U S H M A N & WA K E F I E L D R E S E A R C H
RECENT REPORTS
One page summary including rent and yield information on variousEuropean countries for the Office, Industrial, Retail and Economic sectors.Countries covered:
Austria Belgium Bulgaria Ukraine
Czech Republic Denmark Finland
France Germany Greece
Hungary Ireland Italy
Netherlands Norway Poland
Portugal Romania Russia
Slovakia Spain Sweden
Switzerland Turkey United Kingdom
SNAPSHOTS
EUROPEAN MARKETBEAT
EUROPEAN RETAIL WAREHOUSING
EMERGING MARKETS
OFFICE SPACE ACROSS THE WORLD
MAIN STREETS ACROSS THE WORLD
The Emerging Markets report introduces 35 countries within Africa & theMiddle East and provides an overview of the country and an indication ofthe current office market.The report uses a variety of indicators in orderto ascertain the stability and future prospects of some of the globes moreemergent nations.
A 16 page report on the pan-European investment market, includes ananalysis of rents and yields for industrial, office and retail property.
European Retail warehousing 2008 tracks the retail warehousing market in15 countries. It provides an overview of the recent trends and includes upto date rents, yields, provision, plannning, legislation and the different retailwarehouse formats across Europe.
Analysis of the 2007 global office market fundamentals and its main trendsfor 2007.The report's main focus is on prime office rental performance andoccupancy costs across the globe in the twelve months to December 2007and the outlook for 2008. It ranks the most expensive locations across theworld in which to occupy office space. The report also provides a briefcountry overview for all of countries analysed.
A detailed analysis of retail property rental performance across the globein the twelve months to June 2007.
This report has been produced by Cushman & Wakefield for use by those with an interest in commercial property solely for information purposes and is available at the price stated below. It is not intend-ed to be a complete description of the markets or developments to which it refers. The report uses information obtained from public sources which Cushman & Wakefield believe to be reliable, but wehave not verified such information and cannot guarantee that it is accurate and complete. No warranty or representation, express or implied, is made as to the accuracy or completeness of any of the infor-mation contained herein and Cushman & Wakefield shall not be liable to any reader of this report or any third party in any way whatsoever. All expressions of opinion are subject to change.Our prior written consent is required before this report can be reproduced in whole or in part.Should you not wish to receive information from Cushman & Wakefield or any related company, please email [email protected] with your details in the body of your email as they appear onthis communication and head it "Unsubscribe".© 2008 Cushman & Wakefield All Rights Reserved
Please visit our website at www.cushmanwakefield.com

I N D U S T R I A L S PAC E AC RO S S T H E WO R L D 2 0 0 820
This report was written by
Caroline Stone & Barrie David
of the
European Research Group
London.

www.cushmanwakefield.com
©20
07C
ushm
an&
Wak
efie
ldA
llri
ghts
rese
rved