influence of the lipid environment on the dimerization properties of the amyloid ... ·...
TRANSCRIPT

1
TECHNISCHE UNIVERSITÄT MÜNCHEN
LEHRSTUHL FÜR CHEMIE DER BIOPOLYMERE
Influence of the Lipid Environment on
the Dimerization Properties of the
Amyloid Precursor Protein
Transmembrane Domain
Martin Seybold
Vollständiger Abdruck der von der Fakultät Wissenschaftszentrum Weihenstephan für
Ernährung, Landnutzung und Umwelt der Technischen Universität München zur Erlangung
des akademischen Grades eines
Doktors der Naturwissenschaften
genehmigten Dissertation.
Vorsitzender: Univ.-Prof. Dr. D. Frischmann
Prüfer der Dissertation: 1. Univ.-Prof. Dr. D. Langosch
2. Univ.-Prof. Dr. I. Antes
Die Dissertation wurde am 10.02.2016 bei der Technischen Universität München eingereicht
und durch die Fakultät Wissenschaftzentrum Weihenstephan für Ernährung, Landnutzung und
Umwelt am 10.07.2016 angenommen.


i
Acknowledgements
First and foremost, I would like to thank my PhD supervisor Prof. Dr. Dieter Langosch very
much for giving me the chance to work on this challenging and highly interesting topic. You
have provided me with a lot of feedback and support during my work, which have helped me
in overcoming all challenges and establishing two FRET assays. I have enjoyed our inspiring
talks on the theories of γ-secretase cleavage and APP TMD dimerization very much and am
really going to miss discussing my latest findings with you.
Furthermore, I am also deeply grateful to Prof. Dr. Dmitrij Frishman for being the head of
my committee chair and to Prof. Dr. Iris Antes for acting as examiner.
Prof. Dr. Steven Verhelst I would like to thank a lot for helping me several times with
chemistry related problems during the course of my thesis and for your efforts trying to detect
my peptides in the mass spectrometer.
Along this line, I would also like to thank Dr. Sevnur Serim for advising me on chemistry
related matters and on the best approaches with the detection of my peptides.
Very importantly, I want to thank Dr. Markus Gütlich for your immeasurable help with
experiments, equipment, computers, and much more. I have always valued your advice very
highly and want to thank you for all you have done for me.
Likewise, I want to express my deepest gratitude to Walter Stelzer and Ellen Schneider for
helping me with the MS measurements and spending so much time trying to make my stubborn
peptides fly. If there were 100 ways to make a peptide detectable, you must have tried 101
ways in your efforts to help me. I have appreciated this tremendously.
I would also like to thank Dr. Jan Kirrbach for helping me with the correct statistical analysis
of my data and for your general input which has helped me a lot along the way.
Next, for his thoughtful feedback and helpful comments I want to express my gratitude to
Dr. Mark Teese.
Special thanks I want to bestow upon Christoph Schanzenbach, my collegue and office
partner, for many shared stories, deep convenrsations, helpful discussions about our
experiments and generally a really good and enjoyable time.
I am also most grateful to my fellow PhD colleagues Christoph Kutzner for helping me to
measure my peptides in the MALDI and Eliane Wolf for proofreading this thesis.

ii
I also want to thank Dr. Hans-Richard Rackwitz of PSL for trying his utmost not only
synthesizing my peptides in such a good quality and purity, but furthermore for all the tries
undertaken to purify them. I am sure not many vendors would have been as diligent and as
successful as you have been.
My time at the chair for Biopolymer Chemistry has been very educating, fascinating, and
enjoyable. So many people have helped me and made me enjoy coming into the lab even on
days when my peptides were stubborn. For all their help in things little and small, I would like
to especially thank Martina Uth, Elke Holzer, Doreen Tetzlaff, and Barbara Rauscher, and
everyone from the Langosch chair.
My last thanks are for my parents Elfriede Seybold and Berthold Seybold and my siblings
Dr. Monika Seybold and Simon Seybold for your support and love.
Thank you all.

iii
Table of Contents
Acknowledgements .................................................................................................................... i
Table of Contents ..................................................................................................................... iii
Abstract .................................................................................................................................... vi
Zusammenfassung................................................................................................................... vii
1. Introduction ........................................................................................................................1
1.1. Alzheimer’s Disease ....................................................................................................1
1.1.1. Etiology of Alzheimer’s Disease .........................................................................1
1.1.2. The Amyloid Precursor Protein ...........................................................................5
1.1.1. The Secretases - Proteolytic Processing of APP ................................................14
1.2. Biological Membranes ..............................................................................................24
1.2.1. Lipids .................................................................................................................25
1.2.2. The Role of Lipids and Membranes in Alzheimer’s Disease ............................29
1.2.3. A Model System – Liposomes ...........................................................................31
2. Aims of This Work ...........................................................................................................32
3. Materials and Methods .....................................................................................................34
3.1. Design of Artificial Transmembrane Peptides ..........................................................34
3.1.1. Design of Aβ26-55-TRP and Aβ26-55-NBD ....................................................34
3.1.2. Design of Aβ16-55-NBD ...................................................................................34
3.1.3. Design of Presenilin Transmembrane Peptides .................................................35
3.1.4. Synthesis and Purification of Peptides Used in This Study ...............................35
3.2. HPLC Purification of Aβ26-55-NBD .......................................................................36
3.3. Mass Spectrometry ....................................................................................................38
3.3.1. ESI-TOF Mass Spectrometry .............................................................................38

iv
3.3.2. MALDI-TOF Mass Spectrometry......................................................................38
3.4. Schägger-Jagow Gels ................................................................................................39
3.5. Visualization of Gels .................................................................................................40
3.5.1. Silver Staining ....................................................................................................40
3.5.2. Coomassie Staining ............................................................................................41
3.6. Determination of Peptide Concentration ...................................................................41
3.6.1. Determination of Peptide Concentration by UV/VIS Spectroscopy ..................41
3.6.2. Determination of Peptide Concentration by Fluorescence Quantification ........42
3.7. Determination of Lipid Concentration ......................................................................42
3.8. Circular Dichroism Spectroscopy .............................................................................44
3.9. Preparation of Liposomes..........................................................................................45
3.9.1. Cyclohexane Method .........................................................................................45
3.9.2. Tertiary Butanol Method....................................................................................46
3.10. Förster Resonance Energy Transfer Experiments .................................................47
3.10.1. FRET Assays in Solution ...............................................................................47
3.10.2. FRET Assays in Liposomes ...........................................................................48
3.11. Reconstitution of presenilin TMD into liposomes ................................................52
4. Results ..............................................................................................................................53
4.1. Peptide/Peptide FRET Assays ...................................................................................54
4.1.1. Quality Control of the Aβ Transmembrane Peptides .........................................54
4.1.2. Peptide/Peptide FRET in Solution .....................................................................56
4.1.3. Establishment of a Peptide/Peptide FRET Assay in Liposomes .......................60
4.1.4. Influence of Lipid Composition on the Dimerization of the APP TMD ...........69
4.2. Peptide/Lipid FRET Assays ......................................................................................78
4.2.1. Establishment of a Peptide/Lipid FRET Assay in Liposomes ...........................78

v
4.2.2. Interaction of Aβ26-55-NTRP and Aβ26-55-CTRP with Lipids ......................80
4.3. Reconstitution of the Presenilin Transmembrane Peptides into Liposomes .............87
4.3.1. Reconstitution into Early- and Late-Endosomal Lipid Composition
Liposomes .........................................................................................................................88
4.3.2. Reconstitution into DOPC-Liposomes ..............................................................90
5. Discussion .........................................................................................................................92
5.1. Peptide-Peptide FRET Assay ....................................................................................92
5.2. Peptide-Lipid FRET Assay .......................................................................................99
5.3. Reconstitution of the Presenilin TMDs into Liposomes .........................................102
5.4. A Hypothesis for the Influence of the Lipid Environment......................................104
6. Conclusions and Outlook................................................................................................106
Appendix ................................................................................................................................111
Abbreviations .........................................................................................................................119
List of Tables .........................................................................................................................121
List of Figures ........................................................................................................................121
Bibliography ..........................................................................................................................123
Publications ............................................................................................................................141
Curriculum Vitae ...................................................................................................................142
vi
Abstract
The sporadic form of Alzheimer’s disease correlates with an increased production of the highly
neurotoxic Aβ42 peptide from the amyloid precursor protein (APP). The transmembrane
domain (TMD) of APP has a natural propensity to dimerize, yet a recent publication indicates
that only the monomeric form of the APP is cleaved. While the exact mechanism is not
completely understood yet, one hypothesis is that the lipid environment influences the APP
TMD dimerization, which itself is linked to the proteolytic processing of APP through the γ-
secretase. Based on this hypothesis, the aim of this thesis was to investigate the influence of
the lipid environment on the APP TMD dimerization.
In the first part of this work, a peptide-peptide Förster resonance energy transfer (FRET) assay
in liposomes was established and used to investigate the influence of various lipid species on
the APP TMD dimerization and the impact of the GxxxG dimerization motif. PE, PS, and
cholesterol, were found to either significantly increase or decrease the dimerization.
The interactions between these lipids with the APP TMD peptides were determined in a
peptide-lipid FRET assay. It could be shown that PE has the highest affinity for the APP TMD,
indicating that it might directly interact and thereby reduce dimerization. PS showed a lower
affinity for the peptide while leading to an increase in dimerization. Cholesterol was shown to
have a very low affinity for the APP TMD and also to decrease the dimerization.
Finally, the nine TMDs of presenilin were reconstituted in liposomes. This represents an
important first step towards a heterodimerization assay, which is aimed towards shedding light
on the influence of the lipid environment on the interaction between the APP TMD with its
enzyme.
Taken together, the work presented here shows that certain lipids have a significant influence
on the APP TMD dimerization while having varying affinities to the peptides. Future
experiments with the peptide-peptide-FRET and peptide-lipid-FRET assays presented in this
work will, in conjuncture with the heterodimerization FRET assay, form an important piece of
information which will help elucidate the exact mechanism of APP cleavage. This in turn may
lead to a better understanding of Alzheimer’s disease.
vii
Zusammenfassung
Die sporadische Form der Alzheimer‘schen Erkrankung korreliert mit einer erhöhten
Produktion des stark neurotoxischen Aβ42 Peptids aus dem Amyloid Vorläuferprotein (APP).
Die Transmembrandomäne (TMD) des APPs hat eine natürliche Neigung zu dimerisieren,
allerdings zeigt eine neuere Publikation dass APP als Monomer gespalten wird. Während der
exakte Mechanismus noch nicht vollständig verstanden ist, gibt es eine Hypothese, nach der
die Lipidumgebung die APP TMD Dimerisierung beeinflusst, welche wiederum im direkten
Zusammenhang mit der proteolytischen Spaltung von APP durch die γ-Secretase steht.
Basierend auf dieser Hypothese war es das Ziel dieser Arbeit, den Einfluss der Lipidumgebung
auf die Dimerisierung der APP TMD zu untersuchen.
Im ersten Teil der Arbeit wurde ein Peptid-Peptid Förster Resonanz Energie Transfer (FRET)
Assay in Liposomen etabliert und damit der Einfluss verschiedener Lipidspezies auf die APP
TMD Dimerisierung und den Einfluss auf das GxxxG Dimerisierungsmotiv untersucht. Es
konnte gezeigt werden, dass PE, PS und Cholesterin die Dimerisierung signifikant erhöhen
oder erniedrigen.
Die Interaktion dieser Lipide mit den APP TMD Peptiden wurde des Weiteren mit Hilfe eines
Peptid-Lipid FRET Assays untersucht. Es konnte gezeigt werden, dass PE die höchste Affinität
zu der APP TMD hat, was bedeuten könnte dass es direkt interagiert und dadurch die
Dimerisierung vermindert. PS zeigt eine niedrigere Affinität für das Peptid während es jedoch
die Dimerisierung erhöhte. Für Cholesterin konnte gezeigt werden, dass es eine sehr geringe
Affinität zu der APP TMD hat und ebenfalls die Dimerisierung vermindert.
Zuletzt wurden die neun TMDs des Presenilins in Liposomen rekonstituiert. Dies stellt einen
wichtigen ersten Schritt auf dem Weg zu einem Heterodimerisationsassay dar, der dazu genutzt
werden kann den Einfluss der Lipidumgebung auf die Interaktion zwischen der APP TMD mit
seinem Enzym zu untersuchen.
Zusammengenommen zeigt die hier vorgestellte Arbeit, dass bestimmte Lipide einen
signifikanten Einfluss auf die APP TMD Dimerisation bei verschiedenen Affinitäten zum
Peptid haben.

viii
Zukünftige Experimente mit dem Peptid-Peptid und dem Peptid-Lipid FRET Assay werden,
in Verbindung mit dem Heterodimerisierungs FRET Assay, wichtige Informationen liefern die
helfen werden, den exakten Mechanismus der APP Spaltung zu verstehen. Dies wiederum
könnte zu einem besseren Verständnis der Alzheimer‘schen Erkrankung führen.

1. INTRODUCTION
1
1. Introduction
All life is based on its smallest unit, the cell. A biological cell is mainly defined by its boundary,
which divides the cytoplasm from the surrounding environment. This is achieved through the
cell membrane, a complex phospholipid bilayer with specific physical and chemical
characteristics. In eukaryotic cells, membranes, in addition to defining the boundary between
the cytoplasm and the surrounding extracellular space, form a variety of different cellular
organelles with various physicochemical conditions, enabling the cell to have a multiplicity of
different biochemical processes taking place simultaneously. The important key players of the
cellular membranes are the membrane proteins, and 20-30% of all genes encode for these
important biomolecules (1-4). Membrane proteins are involved in various vital cellular
processes such as signal transduction, cell adhesion and transport across the membrane (1). It
is therefore not surprising that they take part in the development of a broad spectrum of
diseases, and consequently 70% of all drug targets are membrane protein associated (5, 6). One
of these membrane protein associated diseases is Alzheimer’s disease (AD).
1.1. Alzheimer’s Disease
Alzheimer’s disease is the most prevalent form of dementia accounting for 50% to 60% of all
cases (7). In 2010 24 to 35 million people worldwide suffered from AD (7, 8). As roughly 98%
of all AD incidences are attributed to a sporadic form, which is occurring in mid-to-late life,
AD is one of the most financially costly diseases in developed countries (9). Only 2% percent
of cases are attributed to an inherited form, call familial Alzheimer’s disease (FAD) (10). The
major risk factor for AD is age, as the prevalence doubles every five years after age 65, and
reaches 50% by age 85 (11, 12). The past century brought a huge amount of scientific progress
concerning the understanding of the etiology of the disease, however the progress in medical
applications has become slower and much has to be done (13).
1.1.1. Etiology of Alzheimer’s Disease

1. INTRODUCTION
2
AD is characterized by a progressive cognitive impairment and memory loss, caused by a
tremendous loss of neurons and synapses in the cortex, hippocampus, amygdala and basal
forebrain (12). The resulting atrophy in these regions leads to degeneration in the temporal and
parietal lobes, frontal cortex as well as the cingulate gyrus (14), and can be visualized using
positron emission tomography (PET) and magnetic resonance imaging (MRI) (15). There are
several different hypotheses about the trigger that leads to this neuronal degeneration, most
prominently the “tau hypothesis” and the “amyloid hypothesis”. Both are associated with
neurofibrillary tangles and amyloid plaques, which were already described by Alois Alzheimer
in 1907 (16), who characterized the disease for the first time and after whom it was named.
The “tau hypothesis” is based on abnormalities in the microtubule-associated tau protein which
can be found in AD patients, but also in other forms of dementia like the frontotemporal
dementia (FTD) (17, 18). In this hypothesis, hyperphosphorylated tau proteins start to pair and
form larger aggregates, which will eventually form the characteristic intracellular deposits,
called the neurofibrillary tangles (19). If this occurs, the structure of the cell’s cytoskeleton is
destroyed by the disintegration of the microtubules, leading to the collapse of the neuron’s
transport system (20). This will first result in malfunction of the neuron’s biochemical
communication, but ultimately in the cell’s death (21).
The “amyloid hypothesis”, which was postulated in 1991, suggests that extracellular amyloid
beta (Aβ) deposits, called amyloid plaques, are the fundamental cause of the AD (18, 22). This
hypothesis is supported by the fact that the amyloid precursor protein (APP) gene is localized
on chromosome 21 (23-27): people with trisomy 21 (Down syndrome) have an extra copy of this
gene and almost universally exhibit AD by the age of 40 (23-28). The amyloid plaques are mainly
composed of Aβ peptides of various lengths (25, 29), which originate from the regulated
intramembrane proteolysis (RIP) of the APP (26, 27, 30, 31). Interestingly, some more recent
studies suggest that not the amyloid plaques are the cause of the neurotoxicity, but smaller
soluble oligomeric forms of the Aβ peptides (32-38). These adversely affect the synaptic structure
and plasticity, leading to synaptic dysfunction and neuronal death (39).
The two predominant Aβ peptide species are Aβ40 and Aβ42. Aβ42 has two additional amino
acids on the C-terminus, which originate from the APP transmembrane domain (TMD)

1. INTRODUCTION
3
sequence, and thereby increase the peptide’s hydrophobicity (40). This results in a much higher
oligomerization and aggregation propensity, and consequently also neurotoxicity, which is
why the Aβ42 peptide is thought to be the most toxic species (40). While various
oligomerization states of Aβ42 exist, the dodecamer form is believed to have the highest
neurotoxic potential (41, 42).
A further significant difference between Aβ40 and Aβ42 lies in the early assemblies of
different oligomerization states: Aβ40 forms monomers, dimers, trimers, and tetramers which
exist in a rapid equilibrium, whereas Aβ42 preferentially forms pentamer and hexamer units,
called paranuclei (41, 43), which are prone to further assemble into beaded superstructures,
similar to early protofibrils (43) (Figure 1).
Figure 1 Schematic representation of the formation of β-fibrils from Aβ40 and Aβ42. Aβ42 (orange)
oligomerizes from monomers (M), to dimers (D), to tetramers (T), to penta- and hexamers (paranuclei), and finally
to decamer and dodecamer oligomers, the most cell toxic Aβ species. These can form β-protofibrils. In contrast
Aβ40 (blue) only forms monomers (M), dimers (D) and tetramers (T).
For both species, the formation of β-fibrils from the different oligomeric states is slow and accompanied by a
transition from a mainly α-helical/random coil secondary structure to a β-sheet structure (adopted from Bernstein
et al. 2009 (41)).
Despite the insights into Aβ40 and Aβ42 assemblies, the exact mechanism of Aβ peptide
oligomerization and aggregation in humans is still under debate (44). One hypothesis is that Aβ
1. INTRODUCTION
4
peptides form low- and high-order oligomers in an initial nucleation step, which then elongate
into protofibrils as intermediates and finally form fibrils (45, 46). The prerequisite for this is the
transition of the Aβ peptides from their native α-helical/unfolded conformation to a β-sheet
rich conformation (47, 48). It remains unclear whether this refolding happens right after the
proteolytic cleavage inside the membrane upon the first contact with the extracellular lumen,
or if it is triggered by the oligomer formation (41, 42). It is clear however, that the amyloid
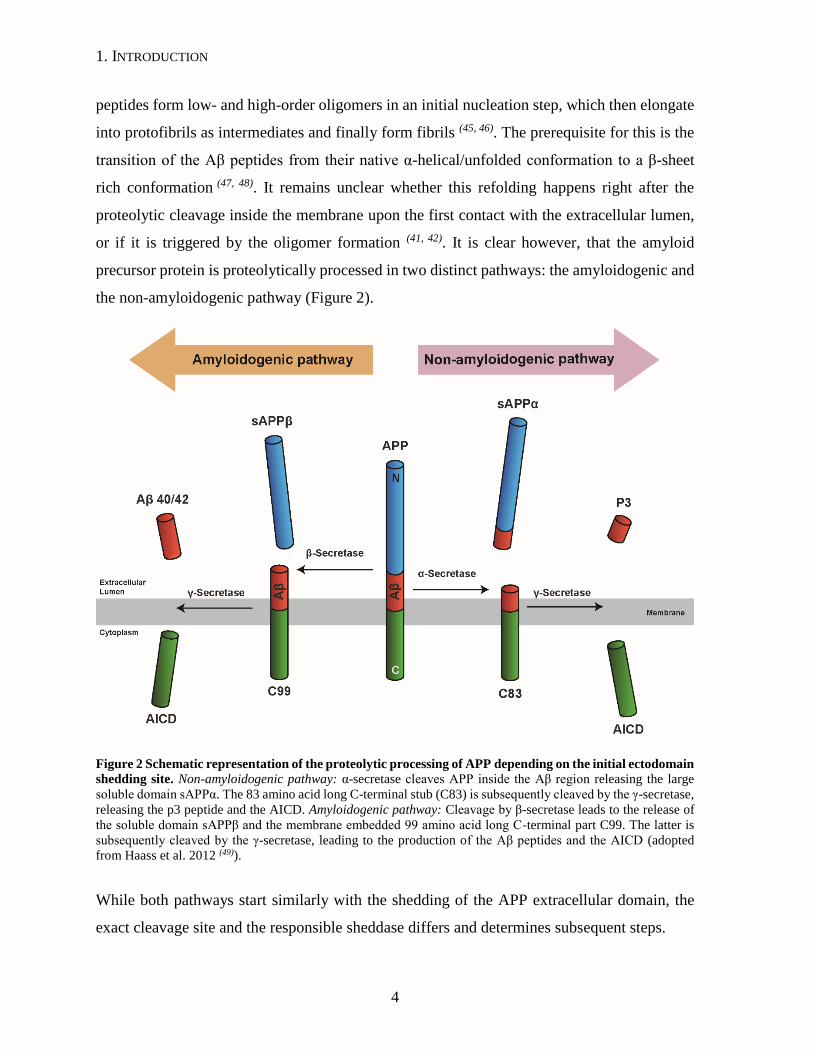
precursor protein is proteolytically processed in two distinct pathways: the amyloidogenic and
the non-amyloidogenic pathway (Figure 2).
Figure 2 Schematic representation of the proteolytic processing of APP depending on the initial ectodomain
shedding site. Non-amyloidogenic pathway: α-secretase cleaves APP inside the Aβ region releasing the large
soluble domain sAPPα. The 83 amino acid long C-terminal stub (C83) is subsequently cleaved by the γ-secretase,
releasing the p3 peptide and the AICD. Amyloidogenic pathway: Cleavage by β-secretase leads to the release of
the soluble domain sAPPβ and the membrane embedded 99 amino acid long C-terminal part C99. The latter is
subsequently cleaved by the γ-secretase, leading to the production of the Aβ peptides and the AICD (adopted
from Haass et al. 2012 (49)).
While both pathways start similarly with the shedding of the APP extracellular domain, the
exact cleavage site and the responsible sheddase differs and determines subsequent steps.

1. INTRODUCTION
5
In the non-amyloidogenic pathway, this first shedding step is processed by the α-secretase
ADAM10, a disintegrin and metalloprotease, which cleaves APP within the sequence that
gives rise to the Aβ peptides (50-54). The cleavage takes place between Lys687 and Leu688 and
thereby prevents subsequent formation of Aβ peptides by γ-secretase, as both Aβ40 and Aβ42
start with the Glu672 (53, 54). α-Secretase cleavage results in the large soluble fragment sAPPα,
which is released into the extracellular lumen, while the C-terminal stub C83 remains in the
membrane. Although ADAM10 is thought to be the most important α-secretase, other ADAM
protease family members have been identified that can process APP similarly (50, 53).
In contrast to this in the amyloidogenic pathway, the first shedding step is processed by the
β-secretase, also called β-site APP cleaving enzyme (BACE). Cleavage between Met671 and
Glu672 (55-57) results in the shedding of the large soluble fragment sAPPβ, which is released
into the extracellular lumen, while the C-terminal fragment C99 remains in the membrane.
C83 from the non-amyloidogenic pathway and C99 from the amyloidogenic pathway consist
of 83 and 99 amino acids respectively. The β-secretase cleavage site defines the N-terminus of
the Aβ peptides, which are produced by consecutive proteolysis at multiple positions (58, 59) by
the γ-secretase. Initial cleavage at the so called ε-site (60) releases the APP intracellular domain
(AICD) into the cytosol, while sequential cleavage produces p3 or Aβ peptides with different
lengths (58, 59, 61-64).
While low levels of Aβ peptides are produced in a healthy human throughout life (65-67), the
balance between the two major forms, Aβ40 and Aβ42 shifts in the sporadic form of AD
towards the highly neurotoxic variant Aβ42. The exact ratio in sporadic AD patients is
unknown, cell culture studies have shown that the ratio between Aβ40 and Aβ42 is about ten-
to-one (68, 69). In many cases of FAD, mutations in either the APP or the γ-secretase lead to a
significant shift in the ratio between Aβ40 and Aβ42 towards the latter one, enhancing the
severeness of the disease or resulting in an early onset in mid-life (70).
Several different risk factors, such as diet, level of education, hypertension, and most
importantly age are considered to correlate with sporadic AD (71-74). Furthermore the ε4-allele
genotype of the apolipoprotein E has been shown to be a genetic risk factor, implicated with a
statistically higher incidence of AD (75-78).
1.1.2. The Amyloid Precursor Protein

1. INTRODUCTION
6
The APP is a type I integral membrane protein with one TMD (UniProt: P05067). Together
with the amyloid precursor-like proteins (APLPs) it is part of the APP protein family. This
family consists of the mammalian homologs APP, APLP1 and APLP2, as well as the two
homologs from Caenorhabditis elegans (APL1) and Drosophila melanogaster (APPL) (79-81),
but remarkably so far no homologs were found in prokaryotes, yeasts, or plants (79). APP is
expressed in many different tissues and is enriched in brain, heart, spleen and kidneys (23, 82).
Different splicing variants of APP can be found depending on the tissue, but the three major
isoforms are APP770, APP751 and APP695 (83-85). APP770 resembles the canonical sequence,
and positional information refers most often to this sequence. The two shorter isoforms exist
due to alternative splicing: APP751 misses exon 8, which is sequence related to the MRC OX-
2 antigen in thymocytes (OX-2) (86-88); APP695 misses exon 8 and additionally exon 7, which
is related to a Kunitz type serine protease inhibitor domain (KPI) (82, 83, 85-87, 89, 90). Both APP770
and APP751 occur predominantly in non-neuronal cells, while APP695 is mainly expressed in
neuronal cells (88, 89, 91).
In humans two paralogs of APP exist, APLP1 and APLP2, which share a similar overall
domain structure (79-81, 85). The structure of APP can be divided into three major regions: a large
ectodomain between residues 18 and 699, a transmembrane domain from Gly700 to Leu723
and a short intracellular domain (22, 83, 85, 92). The residues 1 to 17 represent a signal peptide,
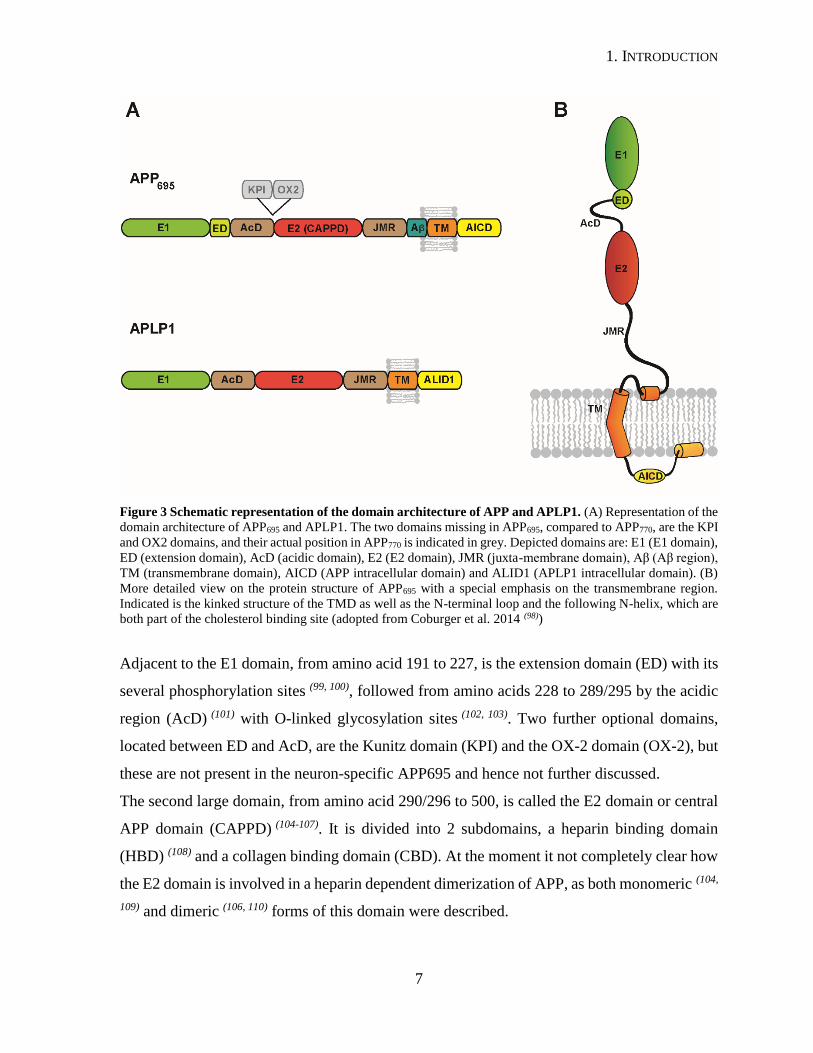
required for membrane insertion (85, 92, 93). The overall structural architecture with all domains
and subdomains is represented in Figure 3.
The extracellular part of APP is divided into seven domains, which themselves can be
subdivided into several subdomains with independent functions. The amino acids 18 to 190
build the first larger domain, called the E1 domain. It consists of two subdomains, which
together form a three dimensional structure (94).
The first subdomain is a growth factor like domain (GFLD) with a heparin binding domain
(HBD) (94, 95), which allows homodimerization of two neighboring APP molecules through the
E1 domain (94). The second subdomain is a copper binding domain (CuBD) (96, 97). Interestingly,
while the isolated CuBD binds Cu2+ ions (96), in complex with the other subdomain of E1 no
binding of Cu2+ ions (94) is possible.
1. INTRODUCTION
7
Figure 3 Schematic representation of the domain architecture of APP and APLP1. (A) Representation of the
domain architecture of APP695 and APLP1. The two domains missing in APP695, compared to APP770, are the KPI
and OX2 domains, and their actual position in APP770 is indicated in grey. Depicted domains are: E1 (E1 domain),
ED (extension domain), AcD (acidic domain), E2 (E2 domain), JMR (juxta-membrane domain), Aβ (Aβ region),
TM (transmembrane domain), AICD (APP intracellular domain) and ALID1 (APLP1 intracellular domain). (B)
More detailed view on the protein structure of APP695 with a special emphasis on the transmembrane region.
Indicated is the kinked structure of the TMD as well as the N-terminal loop and the following N-helix, which are
both part of the cholesterol binding site (adopted from Coburger et al. 2014 (98))
Adjacent to the E1 domain, from amino acid 191 to 227, is the extension domain (ED) with its
several phosphorylation sites (99, 100), followed from amino acids 228 to 289/295 by the acidic
region (AcD) (101) with O-linked glycosylation sites (102, 103). Two further optional domains,
located between ED and AcD, are the Kunitz domain (KPI) and the OX-2 domain (OX-2), but
these are not present in the neuron-specific APP695 and hence not further discussed.
The second large domain, from amino acid 290/296 to 500, is called the E2 domain or central
APP domain (CAPPD) (104-107). It is divided into 2 subdomains, a heparin binding domain
(HBD) (108) and a collagen binding domain (CBD). At the moment it not completely clear how
the E2 domain is involved in a heparin dependent dimerization of APP, as both monomeric (104,
109) and dimeric (106, 110) forms of this domain were described.

1. INTRODUCTION
8
Adjacent to the E2 domain is the mostly disordered and flexible juxta-membrane region (JMR).
The sites of β- and α-secretase cleavage are located within or at the C-terminal end of this
region. As a consequence, 16 amino acids of this region are contained in the sAPPα fragment
but not in sAPPβ.
Following the JMR is the TMD of APP. The structure of the C99 fragment shows an α-helical
structure for the TMD, with a short loop on the N-terminus (N-loop) followed by an additional
short helix, dipping slightly back into the membrane (N-helix) and a mainly unstructured juxta-
membrane regional part (111). The β-secretase cleavage site is hence located in an unstructured
region, while the α-secretase cleavage site is directly at the membrane surface, right after the
N-helix.
The α-helical TMD itself possesses a hinge at position G708/G709, resulting in an N-terminal
and a C-terminal part (111-114). The apex of this hinge is located at theG708/709 position, as was
shown by molecular dynamics simulations, as well as by NMR studies, both in detergent
micelles and lipid vesicles (111). In both environments the span of the C99 TMD is almost the
same length. Interestingly, the mutation of two glycine residues into leucine led only to a slight
straightening of the helix structure, suggesting that the curvature is only partially caused by
the G708/709 motif (111). However, these mutations, had a strong influence on the flexibility of
the TMD, which is thought to play an important role for the sequential processing of C99 by
the γ-secretase. One theory proposes that this high flexibility is important for the access of the
scissile bond.
Indeed in a recent study it was shown that the glycine rich N-terminal part of the TMD is more
flexible than the C-terminal part, which could facilitate movement of C99 inside the γ-secretase
during the sequential cleavage (114). This glycine rich N-terminal part of the TMD is also
thought to be involved in the TMD-TMD dimerization of APP. It consists of two consecutive
GxxxG motives, composed of G700, G704 and G708 (115-118). In one of the first studies, the
residues G700 and G704 were identified to play an important role not only for the formation
of homodimers, but also for the processing of C99 by the γ-secretase (115). Several mutations
of these residues led to an increased production of shorter Aβ peptides compared to the wild-
type, while having no effect on the cleavage efficiency.

1. INTRODUCTION
9
However, the strongest effect on the dimerization could be detected for the G704I mutation,
which was also confirmed in later studies (118). In contrast to the residues G700 and G704, the
hinge region glycine residues (G708/G709) play only a very minor role for the dimerization as
mutations of these residues only slightly changed the dimer formation. As an alternative, one
study describes a GxxxA motive with residues G709 and A713 as TMD-TMD dimerization
motive (119).
Several studies have shown that the GxxxGxxxG dimerization motive, rather than the GxxxA
motive, promoted the dimerization of C99 under micellar conditions (118, 120). Molecular
dynamics simulations with a peptide consisting of residues 687-727 of the APP showed that
the dimer forms predominantly a right handed coiled-coil structure in POPC lipid bilayers (326).
However, the results of this study imply that the dimer structure is heterogenic and could rather
be described as an ensemble of various structural states. The difference for the preferred
structure seems to depend on the environment, as different preferred states could be found for
the POPC lipid bilayer compared with DPC micelles. The authors of this study propose a
mechanism where the environment “selects” a predominant structural state through membrane
thickness, interfacial curvature and peptide lipid interactions (326). Furthermore, they speculate
that this could play an important role for the dimer formation and that the membrane
environment might have a great impact on the processing of C99 by the γ-secretase.
Comparable to these findings, another study showed that the C99 dimeric state is composed of
a number of different arrangements in which both the GxxxGxxxG and the GxxxA motives
compose the dimerization interface depending on the surrounding environment (118). For these
arrangements either the Aβ42 cleavage site or the Aβ40 one was more exposed suggesting that
the arrangement of the dimer could play an important role for the production of either Aβ40 or
Aβ42.
However, a recent study suggests that C99 is monomeric under physiological conditions: they
could show that the GxxxGxxxG motive is part of a cholesterol binding site with a
stoichiometry of 1:1 (111, 121-123), and that the homodimerization competes with the binding of
cholesterol (121). Based on the dissociation constants of 0.47 mol% for the homodimerization
and of 2.7 mol% for the cholesterol binding, the hypothesis is that a concentration of
0.47 mol% exceeds the physiological concentration of C99 in a membrane and therefore the
binding of cholesterol would be more likely.
1. INTRODUCTION
10
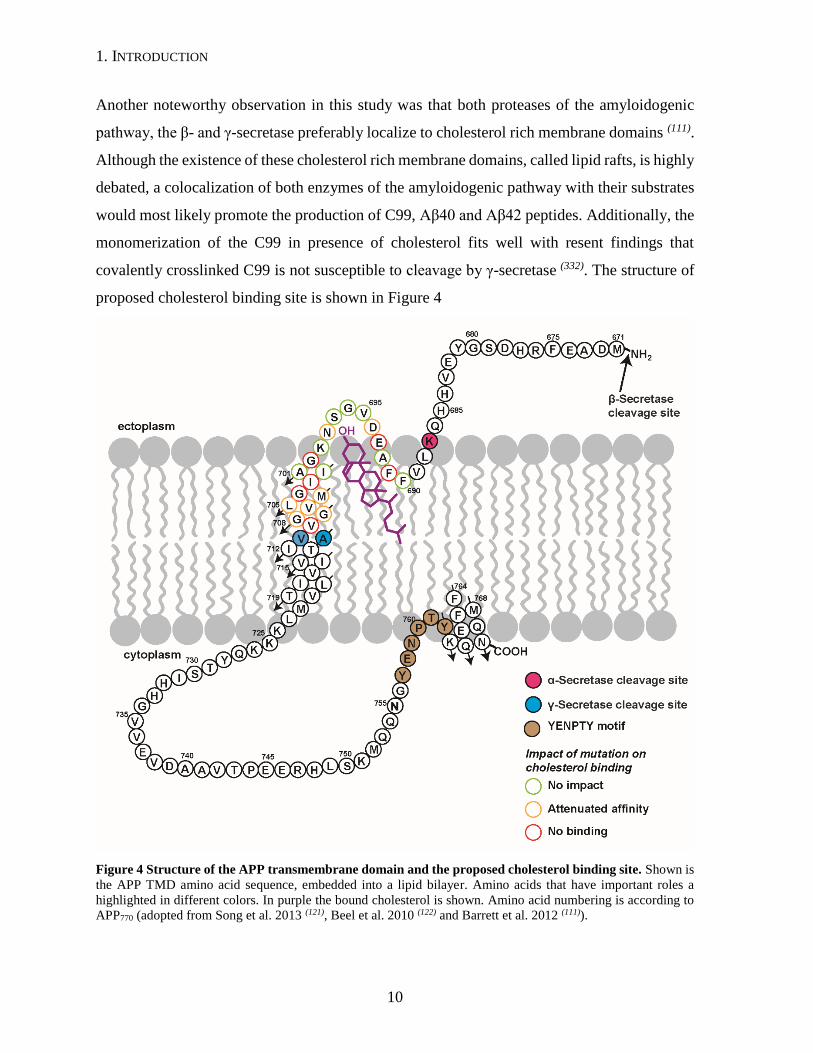
Another noteworthy observation in this study was that both proteases of the amyloidogenic
pathway, the β- and γ-secretase preferably localize to cholesterol rich membrane domains (111).
Although the existence of these cholesterol rich membrane domains, called lipid rafts, is highly
debated, a colocalization of both enzymes of the amyloidogenic pathway with their substrates
would most likely promote the production of C99, Aβ40 and Aβ42 peptides. Additionally, the
monomerization of the C99 in presence of cholesterol fits well with resent findings that
covalently crosslinked C99 is not susceptible to cleavage by γ-secretase (332). The structure of
proposed cholesterol binding site is shown in Figure 4
Figure 4 Structure of the APP transmembrane domain and the proposed cholesterol binding site. Shown is
the APP TMD amino acid sequence, embedded into a lipid bilayer. Amino acids that have important roles a
highlighted in different colors. In purple the bound cholesterol is shown. Amino acid numbering is according to
APP770 (adopted from Song et al. 2013 (121), Beel et al. 2010 (122) and Barrett et al. 2012 (111)).

1. INTRODUCTION
11
As described in the section above, the glycine residues of the N-terminal part of the C99 TMD
play an important role both for the dimerization and the processing of C99. But not only these
glycine residues of the N-terminal part of the TMD are important: two threonine residues
located in the C-terminal part at positions 714 and 719 have been shown to influence the
structure of the C99 TMD (112). Both residues are known to alter the cleavage pattern when
mutated and these mutations are correlated with early-onset AD. In a recent study the increase
in flexibility of the TMD helix was shown by CD-spectroscopy and amide exchange
experiments when these threonine residues were mutated to valine (112). These experimental
findings were confirmed by molecular dynamics simulations, showing that the intrahelical
amide H-bonding and H-bond life time were reduced for the valine mutations. The authors
suggest that mutations of these threonine residues most probably have a significant impact on
the efficiency of C99 proteolysis, as the mutations led to a helix destabilization and an increase
in helix flexibility making the scissile bonds more accessible.
The last part of the amyloid precursor protein is the intracellular domain (AICD), which
consists of the last 49 amino acids of the C-terminus of the APP and is released into the
intracellular lumen upon γ-secretase cleavage. The AICD forms a larger loop with its
C-terminal end being again associated with the membrane (111). The AICD can interact with a
large number of different effector and adaptor proteins (98, 124-130). These interactions are
attributed to the conserved YENPTY sequence patch in the AICD and the anticipated - but
quite controversial - signal transduction function of APP (81, 131-133).
The overall three-dimensional structure of APP is still unknown.
However, the soluble parts of APP have been crystallized and analyzed with X-ray diffraction
measurements. Additionally the whole C99 fragment was analyzed by nuclear magnetic
resonance spectroscopy (NMR) in lysomyristoylphosphatidylglycerol (LMPG) micelles (111,
123). Nevertheless, an X-ray structure of the whole APP is required for a better understanding
of the structures and functions of the domains presented here.

1. INTRODUCTION
12
APP production and trafficking
The APP is synthesized in the endoplasmic reticulum (ER) and then transported to the Golgi
apparatus. There it is N-glycosylated, O-glycosylated, phosphorylated and tyrosine-sulfated on
several residues on both the N-terminal extracellular as well as the C-terminal intracellular
part (134-138). Even though APP is targeted towards the plasma membrane, the majority of it can
be found in the Golgi complex (139), and more than 50% of cell surface APP is internalized
within 10 minutes (140-142) and sorted into early endosomes (141, 143, 144). From there one fraction
of APP is recycled back to the plasma membrane, while the other is transported via the late
endosomes to the lysosomes for degradation (145, 146).
The clathrin-coated vesicle internalization of APP into early endosomes is mediated by the
C-terminally located endocytosis motif YENPTY (143). The deletion or mutation of this motif
leads to a deficiency in APP endocytosis and to a significant reduction in amyloidogenic
processing (142, 147), as the proteolytic processing requires β-secretase, which is mostly localized
in the trans-Golgi network (TGN) and in endosomes and can therefore not cleave the APP
anymore (55). In contrast, the non-amyloidogenic processing by α-secretase is mainly localized
to the plasma membrane (148).
After the initial shedding by either α- or β-secretase, subsequent cleavage steps are localized
in the Golgi/TGN and endosomes, where active γ-secretase complexes are enriched (149).
Several lines of evidence indicate that the amyloidogenic cleavage of APP and subsequent Aβ
production can occur in multiple subcellular organelles, including the Golgi during
biosynthesis, the ER and ER-Golgi intermediate compartments during trafficking, as well as
the endosomal-lysosomal system after endocytosis from the plasma membrane. The
production of Aβ in the endosomal-lysosomal system is supported by the finding that the
deacidification of this system leads to a decrease in Aβ production (150, 151), and that Aβ
production can be decreased by sorting APP from the endosomes to the TGN (152-154).

1. INTRODUCTION
13
The trafficking of APP in the amyloidogenic pathway is summarized in Figure 5.
Figure 5 Schematic representation of the trafficking and processing of APP in the amyloidogenic pathway. Depicted is the localization, trafficking and proteolytic processing of APP, as well as the localization and
trafficking of the γ-secretase. (1) Both APP (yellow) and the γ-secretase subunits (purples) are synthesized in the
ER and then transported to the Golgi compartment for protein maturation. Interestingly, the transport of APP and
presenilin-1 from the ER to the Golgi is uncoupled and more and more evidence supports the idea that processing
of APP by the γ-secretase occurs beyond the Golgi (333-335). APP is transported after its synthesis in the ER towards
the plasma membrane by the constitutive secretory pathway (336). In addition, γ-secretase reaches its active form
right before it gets transported towards the plasma membrane, while all other premature complexes present in the
ER and Golgi complex are inactive. This is achieved by a complex regulation of the γ-secretase’s maturation,
here illustrated by the Rer1 protein (red) that recycles not properly incorporated nicastrin from the Golgi complex
back to the ER, thereby acting as a negative regulator of γ-secretase-catalyzed APP processing (337, 338). (2) Both
APP and γ-secretase are rapidly internalized after reaching the plasma membrane. The internalization is conducted
by two independent and different mechanisms. APP is internalized via clathrin coated pits, which are rich in
cholesterol and contain flotilin-2. Additionally, it has been shown that APP internalization depends on various
adaptor proteins like AP-2, dynamin and Ap180 (338).

1. INTRODUCTION
14
After internalization, APP is most probably cleaved in early endosomes by the β-secretase. γ-secretase on the
other hand can be co-internalized with the β2-adrenergic receptor (β2-AR, blue) via clathrin coated pits, leading
to its localization to late endosomes, where C99 and γ-secretase are co-localized, resulting in the production of
Aβ peptides. (3) Transport of aggregated Aβ peptides from the lysosomal compartment to the outside can happen
via the TGN or via exosomes.
1.1.1. The Secretases - Proteolytic Processing of APP
As already briefly described above, the proteolytic processing of APP is carried out by three
different types of secretases. The term “secretase” refers to a class of enzymes which cleaves
off pieces of membrane-embedded proteins and releases them either to the outside or inside.
While the three known types of secretases have different structures and cellular functions, they
are all involved in the proteolytic processing of APP.
α-Secretase
α-Secretase shedding of APP occurs in the center of the Aβ peptide sequence between Lys687
and Leu688 and leads to the production of the membrane bound C-terminal fragment C83 and
the extracellular released soluble domain sAPPα (155-157). α-Secretase activity can be both
constitutive and regulated, so it seemed logical that multiple α-secretase proteases exist (158-
160). Indeed three membrane metalloendopeptidases of the “a disintegrin and
metalloproteinase” (ADAM) family were shown to be responsible for α-secretase activity (161,
162) and shedding of APP: ADAM17, ADAM10 and ADAM9 (53). ADAMs represent a family
of transmembrane and soluble proteins that are involved in a broad range of physiological
processes, such as cell growth, cell adhesion and migration, cell-cell communication or intra-
and extracellular signaling. The ADAM family is characterized by the presence of several
conserved protein domains, such as a signal peptide, a metalloprotein domain, a disintegrin
domain, as well as an EGF-like domain (163, 164). Up to now 21 genes have been identified in
humans that code for ADAM proteins. ADAMs can be divided into two groups, one
catalytically active with a Zn-binding active site, the other without a functional Zn-binding
site, thus acting through other mechanism like protein interaction or protein folding (163).
ADAM activity is regulated by specific tissue inhibitors of metalloproteinases (TIMPs) (165).

1. INTRODUCTION
15
The three ADAMs that show α-secretase activity are essential for a variety of other important
physiological processes. ADAM17 is responsible for the proteolytic activation of the
epidermal growth factor (EGF) receptor ligands and the tumor necrosis factor-α (TNFα), and
therefore involved in fundamental functions like cell growth and inflammation (163, 164).
ADAM10 is required for the proper function of Notch, Eph/ephrin and cadherins, as shedding
of these membrane proteins is a pre-requisite for the subsequent regulated intramembrane
proteolysis by the γ-secretase (166).
The first ADAM proposed to be involved in APP α-secretase processing was ADAM17, also
called TACE (tumor necrosis factor-α converting enzyme) (167). While several studies suggest
that it is mainly responsible for the regulated α-secretase proteolysis of APP (167), it was also
shown that ADAM17 is to a certain degree responsible for the constitutive activity (168). While
early studies suggested that ADAM10 is responsible for both regulated and constitutive
α-secretase activity (51, 52), nowadays ADAM10 is thought to be the genuine constitutive
α-secretase in neurons (169-171). ADAM9 only possesses an α-secretase-like activity, and while
expression of ADAM9 enhances the production of sAPPα, it is not able to cleave an APP
peptide at the physiological relevant α-secretase site (172). More recent studies suggest that
ADAM9 does not play a direct role as genuine α-secretase in APP processing, but rather
indirectly by shedding of ADAM10 (173, 174).
β-Secretase
β-Secretase initiates the formation of Aβ peptides by cleavage in the APP extracellular
domain (175), resulting in the release of the soluble sAPPβ fragment while the membrane
embedded C-terminal fragment C99 is subsequently processed by the γ-secretase to produce
the Aβ peptides. Early experiments identified two potential candidates for the β-site cleavage
of APP: BACE1 (beta-site cleaving enzyme 1, also called memapsin 2 and Asp2) (55, 176-179)
and BACE2 (also called memapsin 1, Asp1 and Down region aspartic protease) (178-183). Both
are two unique aspartic proteases and share a sequence similarity of 64%.

1. INTRODUCTION
16
Nowadays BACE1 is thought to be the major β-secretase. This is supported by the fact that
β-secretase activity is widely expressed in different tissues, but shows the highest activity in
the brain (184, 185), and this activity patterns correlates with the expression pattern of BACE1,
but not with the one of BACE2 (55, 179, 181, 186): BACE1 is present in many tissues, but
predominantly in the brain, whereas BACE2 is expressed at moderate levels across a broad
variety of cell types, but is only present at low to undetectable levels in most brain regions.
The subcellular location of β-site cleavage has early on been pointed towards acidic
compartments like the endosomes and the Golgi apparatus (187-189).
BACE1 shows the highest activity at a low pH and can be found predominantly in the lumen
of acidic compartments (55, 176, 179). Another finding that points towards BACE1 is that Aβ
peptides, isolated from amyloid plaques, consist of two subspecies of Aβ, the majority having
an aspartic acid at the N-terminus (Asp+1), the rest a glutamic acid (Glu+11) (190, 191). This
cleavage pattern can be produced by BACE1, which cleaves APP only at Asp+1 and Glu+11.
BACE2 on the other hand has a different cleavage specificity, cleaving APP not only at Asp+1,
but additionally at Phe+19 and Phe+20 (192).
BACE1 is a ~70kDa large type I membrane protein that is related to pepsins and retroviral
aspartic proteases (183). Its luminal domain contains two aspartic protease active sites, located
at positions 93-96 and 289-292, and are part of the highly conserved D(T/S)G(T/S) motif that
defines aspartic proteases (55). BACE1 is synthesized as a 501 amino acid long pro-enzyme in
the ER, where it is glycosylated and transiently acetylated (193, 194). It is then translocated to the
Golgi apparatus, where complex carbohydrates are attached and the pro-domain is
removed (176, 195-197). After maturation in the Golgi, BACE1 is transported from the TGN to the
plasma membrane, where it is quickly internalized into early endosomes (198). Mature BACE1
is localized in the TGN and the endosomal system (55). The cellular compartment were it
co-localizes with APP is thought to be mainly the endosomes, but also the TGN (199).
The intracellular localization of BACE1 is regulated by several adaptor proteins, like the
Golgi-localized gamma-ear-containing ADP ribosylation factor-binding proteins (GGAs) that
regulate the trafficking of BACE1 between the TGN and the early endosomes (200-202).

1. INTRODUCTION
17
BACE1 has several different transmembrane protein substrates, which are involved in very
important mechanisms such as cell signaling, immune and inflammatory response as well as
regulation of myelination. However, a BACE1 knock out mouse model did not reveal major
phenotypic discrepancies, but just subtle yet distinct differences (203, 204).
γ-Secretase
As described above, α- and β-secretase cleave the amyloid precursor protein and produce short
membrane embedded C-terminal fragments, which are consecutively cleaved by the
γ-secretase. This γ-secretase activity involves a larger protease complex consisting of at least
four major components, presenilin1 (PS1) or presenilin2 (PS2), the presenilin enhancer 2
(PEN-2), the anterior pharynx-defective 1 (APH1) as well as nicastrin (NCT) (205).
Several studies could demonstrate that these four components are both necessary and sufficient
to generate an active γ-secretase complex (206-208), and that they form a complex in a suggested
1:1:1:1 stoichiometry (209, 210). Depending on the tissue, different γ-secretase complexes with
heterogeneous physiological and biochemical properties have been found in humans (211),
which are caused by the two isoforms of PS and APH1 as well as alternative splicing. The four
γ-secretase subunits will be discussed in greater detail below.
PRESENILIN - The two presenilin homologs in humans contain nine TMDs and share an amino
acid similarity of ~65%. Today, a multitude of mutations in the PS1 and PS2 genes are known
to be linked to FAD, a strong evidence that presenilins are critically involved in the etiology
of AD. PS1 is the dominant isoform present in the brain, whereas PS2 could only be associated
with rare forms of FAD. The first indication that suggested PS1 as the active proteolytic part
of the γ-secretase was the finding that a deficiency in PS1 led to a reduction in Aβ
generation (212). Shortly after it could be shown that two aspartic residues within two predicted
transmembrane regions of presenilin were critical for the activity of γ-secretase. This suggested
that presenilin was a novel aspartyl protease (213-215). The full-length presenilins are synthesized
as 50 kDa proteins in the ER and undergo a proteolytic maturation step when incorporated into
the γ-secretase complex. This cleavage takes place in the cytoplasmic loop between TMD6 and
TMD7, resulting in two presenilin fragments (216).
1. INTRODUCTION
18
Both fragments are stable and form a heterodimer in the membrane, representing the active
form of presenilin. Interestingly, both fragments contain one of the two active site aspartyl
residues (213). These two highly conserved aspartyl residues in TMD6 and TMD7 constitute the
catalytic site, and mutation of either abolishes γ-secretase activity (213). Together with some
surrounding residues they form the YD/LGxGD consensus motif that is highly conserved in
the presenilin homologs (217). Experiments using the substituted cysteine accessibility method
(SCAM) have shown that TMD6 and TMD7 partly face a hydrophilic environment, which
enables entry of water and consequently intramembrane proteolysis (218, 219). Further
experiments revealed that the PAL motif, which is located between TMD8 and TMD9, plays
an essential role in the formation of the active site cavity (220, 221), and that TMD1 is also
important for the catalytic site formation (222).
NICASTRIN - Nicastrin is a type I membrane glycoprotein, with a large extracellular and a small
intracellular domain (223). NCT has a highly regulated maturation process and is expressed as a
78 kDa holoprotein that is N-glycosylated with complex mannose and sialic acid sugars in the
ER (224-226), and then further N-glycosylated in the early Golgi compartments to become the
130 kDa mature protein that is incorporated into the γ-secretase complex. Interestingly, the
glycosylation of NCT is not required for γ-secretase activity (226), but for its proper
incorporation into the γ-secretase complex and its interaction with PS (224, 225, 227). Similarly the
first third of its TMD is also necessary for the correct incorporation through binding to the
C-terminus of presenilin (228, 229).
NCT plays no direct role in the catalytic activity of the γ-secretase complex, but is essential
for the maturation and proper trafficking of the other subunits, for which the integrity of the
NCT ectodomain is required (223, 230). Furthermore, NCT seems to be responsible for substrate
recognition as it was shown to co-immunoprecipitate with the C-terminal products of α- and
β-secretase cleavage (C83 and C99) (223). The substrate binding residues could be mapped to
the DYIGS and peptidase (DAP) domain. In detail, the carboxyl side chain of Glu333 binds
the α-amino group of the substrate’s free N-terminus, after it has undergone ectodomain
shedding (231).

1. INTRODUCTION
19
APH1 - APH1 is a 30 kDa transmembrane protein with seven TMD helices and exists in two
isoforms in humans (APH1a and APH1b) (232). It was suggested early on that APH1 is
important for PS processing, as well as stabilization and trafficking of the mature γ-secretase
complex, as depletion of APH1 decreases the processing of presenilin (233). Furthermore APH1
physically interacts with NCT and PS holoprotein as well as the PS-NTF and PS-CTF after the
regulated PS endoproteolysis (233, 234). Of these, it preferentially interacts with the immature
form of NCT, forming a stable subcomplex of 140 kDa with a 1:1 ratio (235). Additionally, a
GxxxG motif in TMD4 mediates the interaction of APH1 with the γ-secretase complex (236). In
a proposed mechanism, APH1 binds to immature NCT in the ER through other interactions,
and the GxxxG motif promotes the binding of the APH1/NCT subcomplex to the PS
holoprotein. This trimeric complex is then transported to the Golgi compartment, where NCT
is glycosylated to its mature form, which enhances the interaction of NCT with PS as discussed
above (237).
PEN-2 - PEN-2 is a 12 kDa membrane protein with two TMDs. Both termini face towards the
extracellular environment. PEN-2 has been shown to be the regulator of presenilin’s
endoproteolysis, as PEN-2 depletion leads to the accumulation of the PS holoprotein and loss
of proteolytic processing into PS-NTF and PS-CTF (238-240). Furthermore, PEN-2 additionally
promotes the full maturation of NCT (240). Some of these functions could be pinned down to
the C-terminus of PEN-2 and especially its conserved DYLSF motif: both are critical for the
interactions of PEN-2 with PS, the subsequent maturation of NCT and PS, as well as the
stabilization of the γ-secretase complex (240-242). Without this stabilization, the mature
γ-secretase complex would undergo rapid degradation by the proteasome. In a proposed
mechanism, PEN-2 binds to the preformed trimeric complex of APH1, NCT and PS in the ER.
Thereby PEN-2 promotes the proteolytic processing of PS, allowing the γ-secretase complex
to leave the ER towards the Golgi compartment, where NCT can fully mature.
ASSEMBLY OF THE γ-SECRETASE COMPLEX
The stepwise assembly of the γ-secretase complex is starting after the four proteins are
co-translationally inserted into the ER membrane. In an initial step, NCT and AHP1 form a
stable subcomplex (243), to which in a second step full-length PS can bind.

1. INTRODUCTION
20
In a last step PEN-2 joins the trimeric complex, thereby triggers a conformational change,
which leads to the endoproteolytic processing of PS into the PS-NTF and PS-CTF (235, 237). This
still inactive γ-secretase complex is then transported to the Golgi compartment, for full
maturation of the NCT. The active γ-secretase complex is finally translocated to the plasma
membrane.
The four subunits of the γ-secretase interact with each other, stabilizing and mutually
modulating one another, to form a stable and active complex (229, 233, 243-245). The assembly and
maturation of the γ-secretase complex is tightly controlled and only functional complexes can
pass the Golgi, on the way to the plasma membrane and the endosomal system (246). Only the
PS1-CTF possesses a typical ER retention/retrieval signal, so that the recycling must be
controlled by other proteins, one of which is Rer1: It interacts with NCT, recycling it back to
the ER, if it has not formed a correct subcomplex with APH1 (247). Though such interactions
the ER-Golgi quality control system ensures that monomeric γ-secretase components and
wrongly formed subcomplexes are recycled from the cis-Golgi to the ER and that only
functional γ-secretase complexes are transported further on.
STRUCTURE OF THE γ-SECRETASE COMPLEX
The whole 230 kDa γ-secretase complex is very challenging to investigate, as it consists of
four different proteins, an extensive glycosylation pattern, and a total of 19 TMDs. Hence the
purification of active γ-secretase complexes was an important step enabling the first
measurements through electron microscopy (EM) (248). Despite the low resolution it revealed
that the complex has a globular structure (249), and a later cryo-EM structure with a resolution
of 12 Å showed the presence of three cavities (209).
In addition to elucidating the structure of the whole γ-secretase complex, NMR and crystal
structure measurements were used to determine the structure of smaller subcomplexes and
single subunits. One such experiment determined the structure of the PS-CTF in SDS micelles
by NMR, and found three predicted transmembrane domains (7, 8 and 9), supporting the view
that presenilin has nine TMDs. (250).

1. INTRODUCTION
21
A recently published and well resolved structure of an archaeon presenilin homolog from
Methanoculleus marisnigri revealed some further insights into the structure of presenilin. The
structure shows a total of nine transmembrane regions, as well as the active site aspartic
residues in TMD 6 and 7 (251), with the TMDs of PS-NTF (TMDs 1-6) forming a horseshoe-like
structure that partially surround the C-terminal TMDs 7-9. According to this structure, the
substrate entry would be feasible between TMD 2 and 6 or alternatively TMD 6 and 9, with
the latter pair previously being reported the most likely substrate entry point (220, 221).
In 2014 another cryo-EM structure of the whole γ-secretase complex was published, showing
the complex with a highly increased overall resolution of 4.5 Å (252). In this structure the
complex has a horseshoe shaped organization, built by the 19 transmembrane domains.
Additionally, the large NCT ectodomain shows a bilobed structure. This domain has
homologies in sequence and structure to the glutamate carboxyl peptidase PSMA, supporting
previous findings that NCT is involved in substrate binding (231). Even though the specific
assignment of all 19 TMDs was not possible, some similarities to the previously published
archaeon presenilin homolog helped to build a model of the γ-secretase. In a 2015 published
cryo-EM structure, Sun et al. were able to assign all TMDs of all four γ-secretase subunits.
Surprisingly, they found that PEN-2 might possess three TMDs, compared to the previously
published two. The proposed structure is illustrated in (Figure 6).
1. INTRODUCTION
22
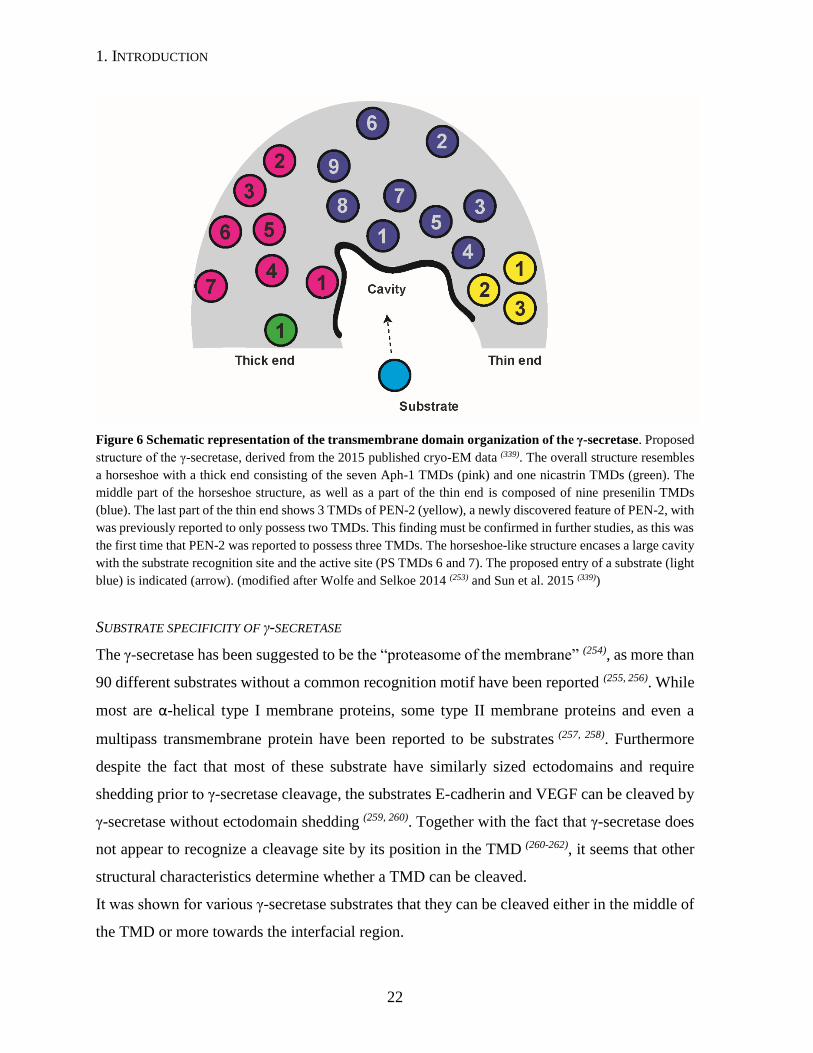
Figure 6 Schematic representation of the transmembrane domain organization of the γ-secretase. Proposed
structure of the γ-secretase, derived from the 2015 published cryo-EM data (339). The overall structure resembles
a horseshoe with a thick end consisting of the seven Aph-1 TMDs (pink) and one nicastrin TMDs (green). The
middle part of the horseshoe structure, as well as a part of the thin end is composed of nine presenilin TMDs
(blue). The last part of the thin end shows 3 TMDs of PEN-2 (yellow), a newly discovered feature of PEN-2, with
was previously reported to only possess two TMDs. This finding must be confirmed in further studies, as this was
the first time that PEN-2 was reported to possess three TMDs. The horseshoe-like structure encases a large cavity
with the substrate recognition site and the active site (PS TMDs 6 and 7). The proposed entry of a substrate (light
blue) is indicated (arrow). (modified after Wolfe and Selkoe 2014 (253) and Sun et al. 2015 (339))
SUBSTRATE SPECIFICITY OF γ-SECRETASE
The γ-secretase has been suggested to be the “proteasome of the membrane” (254), as more than
90 different substrates without a common recognition motif have been reported (255, 256). While
most are α-helical type I membrane proteins, some type II membrane proteins and even a
multipass transmembrane protein have been reported to be substrates (257, 258). Furthermore
despite the fact that most of these substrate have similarly sized ectodomains and require
shedding prior to γ-secretase cleavage, the substrates E-cadherin and VEGF can be cleaved by
γ-secretase without ectodomain shedding (259, 260). Together with the fact that γ-secretase does
not appear to recognize a cleavage site by its position in the TMD (260-262), it seems that other
structural characteristics determine whether a TMD can be cleaved.
It was shown for various γ-secretase substrates that they can be cleaved either in the middle of
the TMD or more towards the interfacial region.

1. INTRODUCTION
23
One of these characteristics might be the helix stability: The TMD sequence conservation
among the substrates is minimal and mutations are generally well tolerated (263-265).
Nevertheless some single point mutations like ERBB4-V673I can entirely abolish γ-secretase
cleavage (266), and it could be that these influence the TMD secondary structure stability: It is
known for other TMD substrates that a destabilization of the α-helical secondary structure is
required for the proteolysis (267). The same could be true for the presenilin-mediated
proteolysis, and indeed a destabilization of the α-helicity has been shown for the amyloid
precursor protein (111, 114).
A second characteristic for substrate recognition could be dimerization, as some γ-secretase
substrates are able to form dimers via TMD-TMD interactions (115, 268-270). For APP,
experiments have shown that homodimerization may be a direct regulator of the proteolytic
processing (271, 272). This dimerization of APP is mediated through two consecutive GxxxG
motives in the N-terminal part of the TMD. More than 25% of γ-secretase substrates contain a
GxxxG motif in their TMD, making dimerization a possible substrate recognition feature (273).
GENERATION OF Aβ PEPTIDES BY γ-SECRETASE
Shedding of the APP’s ectodomain by the β-secretase initiates the production of Aβ peptides
and also defines their N-terminus. In the second step, intramembrane proteolysis by the
γ-secretase defines their C-terminus. It is assumed that γ-secretase cleaves the APP TMD
several times successively resulting in Aβ peptides of various lengths (58, 59, 64, 115, 274).
γ-secretase initially cleaves at the ε-site, resulting in the generation of the AICD and the Aβ48
and Aβ49 (60). This is supported by the fact that AICD fragments with sequence positions 49-
99 and 50-99 can be detected, but no longer ones (59, 64). Aβ48 and Aβ49 peptides are the
precursors of the shorter forms, which are generated though the successive C-terminal
truncation of tri- and tetrapeptides. The Aβ peptides generated by the second cleavage at the
ζ-site are Aβ45 and Aβ46 (62). Cleavage at the γ-site will then ultimately lead to the generation
of Aβ43 and Aβ42, as well as the shortest Aβ species Aβ40 and Aβ38.
The periodicity of cleavage at every 3rd or 4th position indicates that the initial substrate and
subsequent intermediates must be helical and that a specific side of the helix faces the enzyme’s
active site residues. Dependent on the initial ε-cleavage site, two distinct cleavage pathways
lead to either Aβ49/Aβ46/Aβ43/Aβ40 or Aβ48/Aβ45/Aβ42/Aβ38 (59) (Figure 7).

1. INTRODUCTION
24
The Aβ product pattern can be influenced by mutations, for example the mutation of Lys28 to
an apolar residue leads to shorter Aβ fragments with a length of 33 and 34 amino acids (64).
Another influencing factor might be the dimerization of the C99 TMD, as the mutation of
Gly33 to an Ile, and consequent disruption of the GxxxG homodimerization motif, led to a
decrease of Aβ42 and increase of Aβ38 peptides. The dimerization is thought to play a crucial
role for the processing of C99 by the γ-secretase; it is however not clear, if only the monomers
or the dimers can efficiently be cleaved (271, 272).
Figure 7 Generation of Aβ peptides by sequential cleavage at various positions in the APP TMD by
γ-secretase. Depicted is the amino acid sequence of APP with the Aβ numbering (black) and the APP770
numbering (green). Highlighted in orange is the TMD part of APP. Depending on the initial ε-cleavage site, two
distinct production lines are possible, leading to different Aβ peptide species: The arrows above the sequence
indicate the cleavages for the Aβ40 production pathway (blue), the arrows below the sequence indicate the
cleavage sites for the Aβ42 production pathway (red). Altered after Haass et al. 2012 (49).
1.2. Biological Membranes

1. INTRODUCTION
25
Biological membranes are an essential part of all living organisms, as they constitute the outer
and inner boundaries and thereby separate the cytoplasm from the extracellular space as well
as define the different organelles in eukaryotic cells. They are constituted from a multiplicity
of different lipid molecules which build a lipid bilayer. The thickness of the plasma membrane
of a eukaryotic cell is around 60 Å, with a 30 Å hydrophobic core and two 15 Å thick
hydrophilic headgroup regions. The thickness itself depends on the chemical properties of the
lipid molecules as well as the lipid composition. Two major determinants are the acyl chain
length and the degree of unsaturation of these acyl chains.
In the past 20 years more and more evidence arose that the lipid composition of biological
membranes is extremely complex as thousands of different lipid species could be identified
using state of the art mass spectrometry and HPLC techniques (275-277). This complexity must
play a crucial role for the survival of a cell, as genome sequencing studies have revealed that
most organisms use around 5% of their genes to encode for proteins that are involved in the
biosynthesis of these lipid molecules.
1.2.1. Lipids
Cells can synthesize thousands of different lipid molecules, which are used to fulfill three
major functions: (1) energy storage for example in triacylglycerols and steryl esters; (2) lipid
bilayer formation through self-association of lipids with hydrophobic and hydrophilic parts;
(3) messaging molecules in signal transduction pathways and molecular recognition processes.
Lipids involved in the constitution of biological membranes can be divided into three major
structural classes: glycerophospholipids, sphingolipids and sterol lipids. Most membranes are
composed of one or two so-called bulk lipids, which define the major physical and chemical
properties. The hundreds of minor lipids can be considered as superimposed on the dynamic
organization of the bulk lipid. Some of the most relevant lipids will be discussed below.
PHOSPHATIDYLCHOLINE
Phosphatidylcholine (PC) is the most abundant phospholipid in eukaryotic cells, accounting
for up to 50% of the total lipid amount (278), and therefore a key building block and bulk lipid
1. INTRODUCTION
26
of membrane bilayers. Typical PC molecules carry one saturated and one unsaturated acyl
chain, yielding a fluid (liquid crystalline) membrane. The ratio between acyl chain and
headgroup size leads to a cylindrical shape, enabling the spontaneous organization into a lipid
bilayer. Most PC species do not induce membrane curvature, which is required for several
physiological processes like membrane fission and fusion. PC is a zwitterionic lipid over a
wide pH range.
PHOSPHATIDYLETHANOLAMINE
Phosphatidylethanolamine (PE) is usually the second most abundant phospholipid in
eukaryotic cells, and often the main lipid component of bacterial membranes. PE has a conical
molecule geometry due to the small size of its headgroup (279). This conical shape imposes a
curvature stress onto the membrane, enabling membrane fusion and fission (280). On its own,
PE does not form lipid bilayers, but adopts the inverted hexagonal phase. PE is a zwitterionic
lipid between pH 2 and 7.
PHOSPHATIDYLSERINE
Phosphatidylserine (PS) is distributed widely among eukaryotic cell membranes. It usually
makes up to 2-10% of the total lipid except for the plasma membrane, where it comprises ~20%
of the total phospholipids. PS is an anionic phospholipid with three ionizable groups. Due to
its negative net charge at physiological pH, PS can interact with positive ions like Ca2+ or
positively charged amino acids. PS has been implicated to play an essential role in processes
such the coagulation cascade, apoptosis and cell signaling (281).
PHOSPHATIDYLINOSITOL

1. INTRODUCTION
27
Phosphatidylinositol (PI) is a key membrane constituent of eukaryotic membranes. It is an
anionic phospholipid that consists of a phosphatidic acid backbone, to which an inositol group
is linked. In most organisms it occurs as myo-D-inositol.
Phosphate versions of PI, the phosphatidylinositol phosphates (PIPs), play an essential role in
cell signaling and other important cellular functions (282). These lipids are usually present at
low levels (0.5% – 1%) and are often specific for the membrane type. PI(3)P for example has
been implicated in membrane trafficking and is a major determinant of the identity of the early
endosomal membrane (283), while PI(3,5)P2 is specific for the late endosomal membrane (282).
PHOSPHATIDYLGLYCEROL
Phosphatidylglycerol (PG) is one of the main components of bacterial membranes, but plays
only a minor role for eukaryotic membranes, with the exception of the mitochondrial
membrane. As the head group has no charge, the only charge comes from the negative
phosphate group, giving PG a negative charge at neutral pH. PG is synthesized in the
mitochondria and is used as precursor for cardiolipin.
CARDIOLIPIN
Cardiolipin (CL) or diphosphatidylglycerol is a phospholipid with a unique structure, as two
phosphatidic acids are linked via a glycerol, giving it two native charges. CL is only found in
mitochondrial membranes, where it can make up to 20% of the total lipid content. It is
especially abundant in the heart muscle, which led to its name, cardiolipin. Its restriction to the
mitochondrial membrane makes it clear that it must be crucial in this organelle.
Due to its unique structure, cardiolipin has a severely restricted mobility, but is able to form
micellar, lamellar and hexagonal states in aqueous solution, depending on the pH and ionic
strength. CL is mainly located in the inner mitochondrial membrane where it interacts with
numerous mitochondrial proteins, which are linked to the energy metabolism (278, 284).
PHOSPHATIDIC ACID

1. INTRODUCTION
28
Phosphatidic acid (PA) is not an abundant membrane lipid, but a very important intermediate
in the biosynthesis of phospholipids: PA is hydrolyzed by phosphatidate phosphatase to
diacylglycerol (DAG), the precursor of PC and PE via the Kennedy pathway (285). It can also
play a role in signaling functions as a second messenger (286). PA does not have a headgroup,
so its only charge comes from the negatively charged phosphate, making it an anionic lipid (287).
BIS-(MONOACYLGLYCERO)-PHOSPHATE
Bis-(monoacylglycero)-phosphate (BMP) can only be found in the inner membranes, not the
peripheral membranes, of late endosomes and lysosomes, where it is highly enriched and can
amount for up to 70% of the phospholipids (288). BMP is responsible for the formation of the
complex intraluminal membrane system, due to its cone-shape at acidic pH. Additionally,
because of its negative charge, it can bind positively charged proteins responsible for the
degradation function of these organelles. It is also involved in cholesterol hemostasis by
regulating the collection and redistribution of free cholesterol in late endosomes (289). BMP is
almost a structural isomer of PG, but the phosphodiester moiety is linked to the sn1 and sn1’
positions of glycerol instead of the sn3 and sn3’ positions (290). Due to its unique stereochemical
configuration, BMP is highly stable against lipid degradation by phospholipases in the
intraluminal membranes of lysosomes (289).
CHOLESTEROL
Cholesterol is the most abundant member of the sterol lipid family and a unique component of
a lot of eukaryotic membranes, accounting for around 50% of total lipid content in the plasma
membrane (291). In contrast, mitochondrial and endoplasmic reticulum membranes contain only
very low amount of cholesterol. Cholesterol is enriched in early and recycling endosomes, but
is reduced during the endosome maturation and is very low in late endosomes (292, 293).
Interestingly, the brain contains more cholesterol than any other organ. Prokaryotes lack
cholesterol entirely.
One of the main functions of cholesterol is to modulate membrane fluidity by interaction with
phospholipids. Due to its rigid polycyclic structure, cholesterol is able to intercalate between
1. INTRODUCTION
29
phospholipids, spanning about half of a bilayer (294). In contrast to other lipids, cholesterol can
move rapidly across the membrane from one leaflet to the other (295).
SPHINGOMYELIN
Sphingomyelin (SM) is the most abundant sphingolipid and present in most eukaryotic
membranes. It consists of a ceramide with a phosphorylcholine moiety attached to position 1.
SM can account for up to 50% of the total lipid amount in certain tissues. Due to its similar
structure, SM is thought to serve as a substitute for PC as a major building block of membranes.
However, it is known that SM and cholesterol have a high affinity to each other via van der
Waals interactions, a lipid combination that is presumed to form the very controversial “lipid
rafts” (296). Sphingomyelin also seems to play an important role for various membrane proteins,
like transferrin, ion channels and some receptors (297).
1.2.2. The Role of Lipids and Membranes in Alzheimer’s Disease
Several lines of evidence support the idea that the etiology and pathology of the Alzheimer’s
disease are linked to different lipid species and cellular membranes. The amyloidogenic and
non-amyloidogenic processing of APP are for example linked to different cellular membranes
with differing lipid compositions. Additionally, the second step of the processing, performed
by the γ-secretase, seems to be influenced by the lipid microenvironment.
The APP processing by α-secretase is mostly located in the plasma membrane (123, 298), whereas
the processing by β-secretase is restricted to the TGN and the endosomal system (298-301). The
processing of the C-terminal membrane embedded stubs through the γ-secretase is suggested
to take place mainly in the late endosomes and the lysosomes, but some evidence indicates that
processing may also be localized in the early endosomes, the TGN, and the plasma
membrane (49, 70, 245, 302-306). Consequently, the three cellular membranes important for the APP
processing are the plasma membrane, the TGN, and the endosomal system.
The membranes of the early endosomes, the TGN, and the plasma membrane differ greatly in
their lipid composition. The plasma membrane has the highest cholesterol level of these three
membranes of about 40-50% of the total lipid concentration, a level only reached in early and

1. INTRODUCTION
30
recycling endosomal membranes (278). The late endosomes as well as the lysosomes contain
almost no cholesterol (288, 291, 293, 307). The Golgi and TGN contain a medium amount of
cholesterol (15-20%) (291). Other examples for differences in lipid content of the above
mentioned membranes are PS and PE: PE is present in similar amounts in the plasma
membrane and in endosomal membranes (~25%) but in a smaller amount in the Golgi
membranes (10-15%). In contrast, PS makes up around 20% in the plasma membrane, ~10%
in the Golgi membranes, and ~5% in the endosomal membranes.
In addition to differences in the lipid composition of these membranes, several lipids are
directly associated with the processing of APP or the etiology of AD: cholesterol is thought to
directly bind to C99, with a KD value that makes the interaction of cholesterol and C99 more
likely than the homodimerization of C99 (121). Additionally studies showed that vesicles that
contain PC and cholesterol support an overall increased γ-secretase activity compared to pure
PC vesicles (308). With the assumption that only monomeric C99 can be cleaved by the
γ-secretase - which is still under discussion - these findings would suggest that cholesterol is a
major factor that influences the proteolytic processing of APP. Another example would be
sphingomyelin, which was shown to enhance the processing of APP towards the smaller non-
toxic Aβ40 fragments in a γ-secretase cleavage assay (308, 309). Vice versa the complete
depletion of sphingomyelin shifts the γ-secretase product equilibrium towards the more toxic
Aβ42 (308).
Similar to cholesterol, a study suggested that APP has a V3-like SM binding motif that can
also be found in the prion protein and the HIV-1 gp120 protein. However, it seems that this
SM binding motif overlaps with the cholesterol binding site (310). For phosphatidylserine
studies could demonstrate that its overall level is increased in the brain tissue of AD
patients (309). In contrast, the overall levels of PE and PI are significantly decreased in brain
tissue of AD patients (311).
In addition to the direct linkage of several lipids to the etiology of AD, proteins that are
responsible for lipid metabolism, are also linked to the disease. Examples are the ε4-allele of
the apolipoprotein E (APOE), phospholipase A2 (PLA2), phospholipase C (PLC),

1. INTRODUCTION
31
phospholipase D (PLD) and several phosphoinositide kinases and phosphatases (308).
1.2.3. A Model System – Liposomes
As described above, several lipid species play an important role in the processing of APP and
the etiology of AD. To better study such a lipid involvement, experiments can either be
conducted in biological or artificial membranes. The drawback of biological membranes is that
it is difficult to investigate the effect a single lipid in such a complex lipid mixture has on the
target protein and vary its concentration. An artificial system that allows such studies and
enables a change of the lipid concentration are liposomes. Liposomes are microscopic spherical
vesicles that are formed when amphipathic lipids are exposed to an aqueous environment (312,
313). They can be classified into multilamellar vesicles (MLVs), which are composed of several
concentric spheres of lipid bilayers separated by an aqueous solution, and into unilamellar
vesicles (ULVs), which have only one lipid bilayer. The ULVs can be subdivided into small
unilamellar vesicles (SUVs) of 50-100 nm, large unilamellar vesicles (LUVs) of 100-250 nm,
and giant unilamellar vesicles (GUVs) larger than 250 nm (Figure 8).
Figure 8 Schematic representation of the different liposome types. Unilamellar vesicles with a diameter of
50-100 nm are termed small unilamellar vesicles (SUVs), ones with a diameter of 100-250 nm large unilamellar

1. INTRODUCTION
32
vesicles (LUVs) and giant unilamellar vesicles (GUVs) have a diameter of >250 nm. Liposomes which are
composed of two and more concentric spheres of lipid bilayers that are separated by an aqueous solution, are
termed multilamellar vesicles (MLVs).
Depending on the requirements of the experiments, liposomes of different sizes and
consequently curvatures can be created that contain the desired amounts of different lipids as
well as proteins or peptides of interest. In order to create liposomes different preparation
methods are available that can be chosen to suit the experimental requirement.
2. Aims of This Work
The aim of this work was the development of a liposome based peptide-peptide FRET assay
which should be used to determine the influence of several lipid species on the dimerization of
the APP TMD.
After determining the influence of the lipids in the peptide-peptide FRET assay, the next aim
was to investigate their mode of action more closely. To this end, a peptide-lipid FRET in
liposomes had to be established first.
Finally, in preparation for a future heterodimerization FRET assay, the nine TMDs of
presenilin were to be individually reconstituted into liposomes resembling the lipid

1. INTRODUCTION
33
composition of early or late endosomes, and to assess them for their incorporation efficiency
and secondary structure.

3. MATERIAL AND METHODS
34
3. Materials and Methods
Unless otherwise specified, solvents and salts were purchased from AppliChem, peptides from
Peptide Specialty Laboratories GmbH (PSL) and lipids from Avanti Polar Lipids, Inc.
3.1. Design of Artificial Transmembrane Peptides
3.1.1. Design of Aβ26-55-TRP and Aβ26-55-NBD
The Aβ26-55 peptides were designed based on the protein sequence of the amyloid precursor
protein (UniProtKB: P05067.3 / Accession No. P05067). The nomenclature is based on the
C99 fragment, and the positions 26 and 55 in this nomenclature correspond to the positions
697 and 726 in the full length APP. The annotated transmembrane domains of the APP include
position 700 to 723. The peptides designed for this study have additionally to this TMD three
juxta-membrane amino acids on each terminus, taken from the original APP sequence. These
are mainly hydrophilic amino acids and were included to help with the incorporation and
correct positioning of the peptides into lipid membranes. In order to enable Förster resonance
energy transfer (FRET) experiments with these peptides, tryptophan (TRP) and
7-nitrobenz-2-oxa-1,3-diazole-4-yl (NBD) were used as fluorophores. The tryptophan, which
is not present in the original sequence, was directly incorporated into the peptide sequence and
is located either between K28 and the G29 (NTRP peptides) or between L52 and K53 (CTRP
peptides). The NBD fluorophore was coupled to the N-terminal end of the peptide either via a
ε-aminocaproic acid linker or a PEG3 linker. The C-termini of both TRP and NBD peptides
were amidated. Both TRP and NBD peptides were either based on the wild type (WT) APP
sequence and are henceforth termed WT peptides, or contained a mutation on Gly33 (position
704 in APP nomenclature) and are termed G33I mutant peptides (see Table 4).
3.1.2. Design of Aβ16-55-NBD
The Aβ16-55-NBD peptide was designed analogous to the Aβ26-55-NBD peptide, with the
following changes: the sequence starts already at the position 687 (APP nomenclature) and

3. MATERIAL AND METHODS
35
thereby includes the proposed cholesterol binding motif (111, 121, 122). As a linker between the
N-terminus and the NBD fluorophore PEG3 was used. The sequence is shown in Table 4.
3.1.3. Design of Presenilin Transmembrane Peptides
For the design of the nine presenilin TMD peptides, the full length protein sequence of
presenilin 1 was downloaded from NCBI (GenBank: AAB46371.1) in the FASTA file format.
For the correct annotation of the TMD, two published annotations, one from the UniProt entry
P49768 and the other one from a publication by De Strooper and co-workers (314), were
compared with a TMD prediction made with the TMHMM 2.0 server
(http://www.cbs.dtu.dk/services/TMHMM/). The result of this comparison was then used to
design nine preliminary peptide sequences each with a length of 30 amino acids. For a better
adjustment of the correct TMD positions, these nine sequences were compared to a recent
publication (251) of the crystal structure of a presenilin homolog from the archaeon
Methanoculleus marisnigri JR1. With the additional information from this publication, the
final peptide sequences were designed with each peptide having three lysine residues on the
proposed cytosolic site and one tryptophan on the luminal site at the interfacial region
functioning as fluorophore. All naturally occurring tryptophan residues were mutated to
phenylalanine to prevent background FRET. The N-termini of all peptides were acetylated and
the C-termini were amidated. The sequence is provided in Table 4.
3.1.4. Synthesis and Purification of Peptides Used in This Study
All peptides were synthesized by PSL using a solid phase synthesis approach. Briefly, the
peptides were synthesized using a microwave assisted solid phase synthesizer (Liberty, CEM
Corp.). The used resin was a Rink amide MBHA resin LL with a loading of 0.38 mmol/g and
a mesh of 100-200 (Novabiochem). The peptides were synthesized in a 50 µmol or 100 µmol
scale using Fmoc as a protection group.
The used side chain protection groups were Pbf for arginine, Boc for lysine and tryptophan,
Trt for asparagine, glutamine and histidine, and tBu for aspartate, glutamate, serine, threonine
and tyrosine. The condensation reagent used was HBTU, the base for the coupling
N-methylmorpholine, and Fmoc was deprotected with piperidine. As solvent for the peptide
3. MATERIAL AND METHODS
36
synthesis DMF was used. The used linker molecules between the N-terminus and the NBD
fluorophore were either Ahx or later Fmoc-NH(PEG3)-COOH. For acetylation of the N-
terminus acetic anhydride was used. The fluorophore NBD was condensated to the peptide,
while it was still bound to the resin.
The peptides were cleaved of the resin with 95% TFA, 4% isopropyl silent and 1% H2O (v/v).
Then they were precipitated with diisopropyl ether, spun down and the supernatant was finally
removed so the precipitated peptides could be dissolved in 60% acetonitrile/water with
0.1% TFA (v/v). This solution was then lyophilized and the dried peptides in this state
represented the so called raw product which had a purity of 70-80% according to the vendor.
For the HPLC purification by the vendor, the peptides were dissolved in DMSO and loaded
onto different HPLC columns, mainly a Jupiter C4 Axia column (pore size 300 Å, particle size
10 µm, column size 250 x 21 mm; Phenomenex), and sometimes either a Gemini Axia C18
column (pore size 110 Å, particle size 10 µm, column size 250 x 21 mm; Phenomenex) or a
PLRP-S column (pore size 300 Å, particle size 5 µm column size 150 x 25 mm; Polymer
Laboratories/ Varian). The solvent A consisted of 0.1% TFA in ddH2O (v/v), solvent B of an
80% acetonitrile/water mixture with 0.1% TFA (v/v). The flow rate of the gradient was set to
20 ml/min and the gradient started at 10% B and went to 100% B over 20 min. All collected
fractions as well as the raw product were analyzed with MALDI mass spectrometry. The
corresponding MALDI-TOF mass spectra are shown in the appendix.
3.2. HPLC Purification of Aβ26-55-NBD
As the Aβ26-55-NBD peptides could not be HPLC purified by PSL an already established
HPLC purification procedure, which was established by C. Kutzner was used to purify these
peptides. The HPLC solvent A consisted of 95% ddH2O and 5% ACN (v/v), the solvent B of
5% ddH2O and 95% ACN (v/v).
For this purification procedure two different columns were used, which both produced
comparable results: At first a Grace Vydac 214TP1010 C4 column (Grace Davison Scientific,
pore size of 300 Å, particle size 10 µm, column size 10 x 250 mm), then a ProntoSIL-300-310-
C4 column (Bischoff, pore size 300 Å, particle size 10 µm, column size of 10 x 250 mm). The
used HPLC system consisted of a Beckman Coulter System Gold 126 Solvent Module, a

3. MATERIAL AND METHODS
37
Beckman Coulter System Gold 508 Autosampler, a Beckman Coulter System Gold 168
Detector and a Beckman Coulter Manual Injector 2600 LOT I.D. The software used to operate
the HPLC system was 32 Karat™ Version 7.0.
For the first step of the HPLC purification, the used protocol was mh8_280nm_C2.met, which
had a constant flow rate of 3 ml for the whole HPLC run which had a total length of 28 min.
The gradient started at 60% B, increased over 3 min to 100% B, was then constant at 100% B
for 15 min, then decreased back to 60% B over 1 min and finally was constant at 60% B for
9 min. First, the peptide dissolved in DMSO was loaded onto the sample loop and after the
protocol had run for 1 min the manual injector was set from “load” to “inject” to apply the
peptide to the column. During the course of the HPLC protocol the peptide started to form
aggregates on the HPLC column due to the low solubility in an acetonitrile/water DMSO
mixture. The DMSO was completely eluted from the column.
The second step was started at the earliest 1 h after loading the peptide onto the column, and
was used to dissolve the aggregated peptide on the column. To this end, 4 ml of HFIP were
sequentially loaded onto the column with a 100 µl Hamilton syringe using the protocol
ck7_60Bisocratic_HFIPinjwash_90min.met. This protocol had a constant buffer mixture of
60% B but with changing flow rates. The flow rate started at 0.3 ml/min and stayed at this level
for 90 min. Then the flow rate was increased over 1 min to 2 ml/min, stayed constant at this
level for 2 min and finally decreased over 1 min from 2 ml/min to 0 ml/min. The total run time
of this protocol was 94 min. The retention time of the HFIP applied onto the column during
this step was around 60 min. The protocol was aborted after 55 min to prevent elution of the
HFIP and enable incubation of the HFIP with the column o/n. During the o/n incubation with
HFIP, the aggregated peptide was dissolved and had enough time to refold into a helical form.
In the last and third step of the HPLC purification procedure, the HFIP was eluted from the
column. For this purpose, the ck7_60Bisocratic_HFIPinjwash_90min.met protocol was run for
the whole 94 min. Due to the fact that HFIP is not well soluble in an ACN/water mixture, the
HFIP was present in small droplets in the running buffer and the peptide was dissolved in these
droplets. Unfortunately, these droplets lead to an artificial signal at the detector which
overlapped the absorbance peaks of the peptide. Luckily, the elution of the NBD-labeled
peptide was clearly visible due to the yellow color of the NBD fluorophore.

3. MATERIAL AND METHODS
38
During the whole HPLC purification procedure the relevant elution fractions were collected,
analyzed using mass spectrometry and then lyophilized.
3.3. Mass Spectrometry
Different mass spectrometry methods were used for the confirmation of identity and purity of
the highly hydrophobic and aggregating Aβ26-55 peptides.
3.3.1. ESI-TOF Mass Spectrometry
For the ESI-TOF mass spectrometry measurements an Agilent Technologies 6210 TOF
LC/MS mass spectrometer with a Harvard Apparatus 11 Plus syringe pump was used. All
ESI-TOF measurements were performed at 20 °C using direct injection. The peptide samples
were dissolved either in pure HFIP, 80% TFE/ddH2O or 80% ACN/ddH2O with 1% acetic
acid. The blank sample consisted of the used organic solvent. The direct injection of the
samples was done with a 100 µl Hamilton syringe applied to the syringe pump. The pump rate
for the injection was set to 5 µl/min (tubing: 1/16”x ID 0.13 mm, length 200 mm).
The drying gas temperature was set to 300°C, the flow rate of the drying gas to 480 L/h, the
nebulizer gas pressure to 15 psig, the capillary voltage to 4000 V, the skimmer voltage to 60
V and the fragmentor voltage to 150 V. The mass range was set to 400-2800 m/z and the data
acquisition was 0.88 cycles/sec. For the system control the Agilent Technologies Analyst QS,
LC-MS software (Ver. A.01.00 (B663) was used. The measured masses were all
baseline-corrected and the peak evaluation was done manually.
3.3.2. MALDI-TOF Mass Spectrometry
For some of the used peptides the analysis with the ESI-TOF mass spectrometer did not
produce reliable results. Those peptides were additionally analyzed with a MALDI-TOF mass
spectrometer (Bruker Daltonics, ultrafleXtreme). As MALDI target plate a Bruker Daltonics
MTP 384 target plate ground steel T F was used. As matrices DHB, 9-AA and HCAA were
used. These were dissolved in 80% ethanol with a final concentration of 0.1 M.

3. MATERIAL AND METHODS
39
For sample preparation the peptides were dissolved in different organic solvent mixtures with
a concentration of 0.25 mg/ml. The used solvent mixtures were 100% TFE, 70% FA with
30% ACN, 70% ACN in 30% ddH2O and 0.1% TFA, 10 mM NaOH in 70% ACN or 1% NH4
in 70% ACN. 2 µl of the peptide solution was then mixed with 1 µl of matrix dissolved in 80%
ethanol and incubated for 5 min before 1 µl of this mixture was spotted on the target plate.
After air-drying the spots, the samples were directly analyzed by MALDI-TOF. For the
measurements the mass spectrometer was set to positive reflection ion mode with a laser
intensity of 65%, 4000 shots/sample, 100 shots / position on spot, and a laser frequency of
1000 shots/sec.
The laser shots acquired data with a random walk over the entire spot to minimize artifacts due
to heterogeneous crystallization of the peptide/matrix mixture. The measured mass spectra
were baseline corrected and the peak evaluation was done manually with the flexAnalysis
software (Version 3.3).
3.4. Schägger-Jagow Gels
For some of the peptides additional methods were necessary for the confirmation of purity and
correct size. Therefore tris-tricine sodium dodecyl sulfate polyacrylamide gel electrophoresis
(SDS-PAGE) was used based on the publication by H. Schägger and G. von Jagow (315). The
gels (10 x 10 x 0.75 cm) were cast using a Cast-It S gel casting unit (PEQLAB) and run with
a Perfect Blue dual gel system Twin S (PEQLAB) which was connected to an electrophoresis
power supply unit EPS 301 (Amersham Pharmacia Biotech). The gels consisted of 3 layers
which were cast in 2 steps.
First the separating gel, consisting of 10 ml acrylamide solution I (46.5% (w/v) acrylamide,
3% (w/v) N,N'-Methylenebisacrylamide), 10 ml gel buffer (3 M Tris-HCl, 0.3% (w/v) SDS,
pH 8.45), 4 ml glycerol, 6 ml ddH2O, 100 µl APS and 10 µl TEMED was cast and immediately
overlaid with the spacer gel consisting of 3.05 ml acrylamide solution II (48% (w/v)
acrylamide, 1.5% (w/v) N,N'-Methylenebisacrylamide), 5 ml gel buffer, 6.95 ml ddH2O, 50 µl
APS and 5 µl TEMED. The top of the spacer gel was then overlaid with 2 ml isopropanol.
After the polymerization of both gel layers, the isopropanol was removed and the stacking gel
consisting of 1 ml acrylamide solution II, 3.1 ml gel buffer, 8.4 ml ddH2O, 100 µl APS and 10
µl TEMED was cast on top.

3. MATERIAL AND METHODS
40
The indicated volumes were sufficient to cast three gels. For sample preparation, the peptides
dissolved in an aqueous solution were mixed with the 2x sample buffer (0.1 M Tris-HCl, 1%
(w/v) SDS, 4% (w/v) β-mercaptoethanol, 0.02% (w/v) CBB G250, 24% (v/v) glycerol,
pH 6.8).. For all gels the ultra-low range molecular weight marker M3546 (Sigma-Aldrich,
Inc.) was used and the gels run. The gels were run with cathode buffer (0.1 M Tris-HCl, 0.1 M
Tricine, 0.1% (w/v) SDS, pH 8.25) and anode buffer (0.2 M Tris-HCl, pH 8.9) for 3 h at 120 V.
3.5. Visualization of Gels
For the visualization of the peptide bands in the tris-tricine gels two methods were used,
depending on the necessary sensitivity and the presence of lipid molecules. While the
coomassie staining is straightforward and fast, it is incompatible with lipids in the sample. In
contrast to this, the ammoniacal silver staining is compatible with lipids and, while it is more
labourous, it is approximately 100-fold more sensitive than a coomassie stain.
3.5.1. Silver Staining
The protocol for the ammoniacal silver staining procedure was based on the publication by B.
R. Oakley, D. R. Kirsch and N. R. Morris (316). All steps were performed at RT. First the gel
was incubated with an ethanol fixative containing 50% ethanol and 10% acetic acid for 45 min.
Then the ethanol fixative was discarded and the gel was incubated o/n in in a freshly prepared
10% glutaraldehyde solution in a closed plastic container.
The next day, the fixative solution was discarded and the gel washed several times with ddH2O
until the glutaraldehyde was completely removed. Then the silver stain solution was prepared
fresh by mixing 1.17% NH4OH and 19 mM NaOH except for the silver nitrate in a beaker on
a stirrer. The 15.2 mM AgNO3 was slowly added drop wise until the solution turned to a light
amber color. The gel was incubated in this solution for 5 min. After staining the gel was washed
two times with ddH2O for 1 min and 3 min respectively. In the next step the gel was incubated
with the developer solution containing 0.0185% formaldehyde and 0.238 mM citric acid. If no
bands were visible after 5 min the developer solution was replaced. Upon appearance of gel
bands, the development was stopped by washing the gel repeatedly with large volumes of
ddH2O, and the gel photographed immediately.

3. MATERIAL AND METHODS
41
3.5.2. Coomassie Staining
The coomassie staining method was used as a fast staining method when no lipids were in the
samples. First the gel was incubated for 4 h in the staining solution (0.02% CBB G250 (w/v),
5% aluminium sulfate (w/v), 10% ethanol (v/v) and 2% phosphoric acid (v/v) in ddH2O), and
then repeatedly for 10 min in destaining solution (10% ethanol (v/v) and 2% phosphoric acid
(v/v) in ddH2O). A picture of the gels was taken after the gels were completely destained.
3.6. Determination of Peptide Concentration
For determination of the peptide concentration two procedures were used depending on the
solvent in which the peptides were dissolved. For organic solvents such as HFIP, TFE, or
DMSO, the peptide concentration was determined by UV/VIS spectroscopy using the specific
absorbance of the used fluorophores (tryptophan and NBD). If the peptide was dissolved in
aqueous solution (liposomes), the peptide concentration was determined using the fluorescence
intensity of the fluorophores, because of the higher sensitivity of the fluorescence compared
with the absorbance.
3.6.1. Determination of Peptide Concentration by UV/VIS Spectroscopy
For the determination of the peptide concentration by UV/VIS spectroscopy 5 µl, 10 µl and
20 µl of peptide dissolved in HFIP were mixed with 50 µl DMSO and 30 µl MeOH. The
samples were filled up with HFIP to a total volume of 100 µl. Of these three dilutions the
absorbance spectra were measured with an Amersham Biosciences Ultrospec 3100 pro
UV/VIS photo spectrometer. All spectra were measured in quartz cuvettes. If the peptide had
a tryptophan in its sequence, the spectrum was measured from 250 nm to 400 nm and the
absorbance at 280 nm was used to calculate the concentration. The used absorbance coefficient
for the Lambert-Beer law for tryptophan was 𝜀𝑇𝑅𝑃 = 5500 1
𝑀∗𝑐𝑚 . If the peptide had an NBD

3. MATERIAL AND METHODS
42
as fluorophore, the spectrum was measured from 300 nm to 600 nm. The absorbance at 470 nm
was used together with an absorbance coefficient of 𝜀𝑁𝐵𝐷 = 230001
𝑀∗𝑐𝑚 .
3.6.2. Determination of Peptide Concentration by Fluorescence Quantification
This method was used for determining the peptide concentration in liposome samples, because
the absorbance of tryptophan was not sufficiently sensitive. Due to the fact that fluorescence
is not quantitative a calibration curve (Figure 12) was measured. To this end liposomes with a
defined peptide concentration were produced as described below in section 3.9, with the
exception that the last centrifugation step was skipped. Without this last step all peptides
pipetted into the Eppendorf tube were still present in the liposome solution.
These liposomes were then lysed by mixing 100 µl of liposomes with 25 µl of EtOH and 25
µl of a 10% (w/v) SDS solution. These mixtures were then incubated in an Eppendorf
Thermomixer Compact at 1000 rpm and 37 °C o/n. On the next day a fluorescence spectrum
was measured using a Varian Cary Eclipse fluorescence spectrophotometer with a Varian
Peltier Multicell Holder, a Cary Temperature Probe Series II and a Cary Temperature
Controller. All spectra were measured in quartz cuvettes and at RT using the relevant
parameters for Tryptophan (λex = 290 nm, λem = 300 nm – 580 nm, PMT-Voltage: 770 V, Scan-
Speed: 120 nm/min) and NBD (λex = 460 nm, λem = 470 nm – 700 nm, PMT-Voltage: 700 V,
Scan-Speed: 120 nm/min).
The peptide concentrations of unknown peptide-liposome samples were determined exactly as
described for the calibration curve. For data analysis a measured blank spectrum (background
fluorescence of liposomes without peptide) was subtracted and the fluorescence values at
340 nm and 535 nm were used for the calculation of the peptide concentration.
3.7. Determination of Lipid Concentration
The method for the determination of the lipid concentration depended on the type of lipid. For
lipids that possessed a fluorophore attached to either the headgroup or one of the acyl chains,
the concentration was determined by using the fluorophore’s absorbance. Here lipids were
used that possessed an NBD or an Atto647N fluorophore, and were either incorporated into
liposomes or dissolved in chloroform. The fluorescent lipids incorporated into liposomes were

3. MATERIAL AND METHODS
43
quantified by measuring 100 µl of liposomes in a quartz cuvette with an Amersham
Biosciences Ultrospec 3100 pro. To exclude any background absorbance, the whole
absorbance spectrum was measured and compared to a spectrum of only the fluorophore.
For the NBD lipids the spectrum was measured from 300 nm to 600 nm and the absorbance at
470 nm was used together with an absorbance coefficient of 𝜀𝑁𝐵𝐷 = 230001
𝑀∗𝑐𝑚 for the
quantification; for Atto647N lipids the spectrum was measured from 600 nm to 800 nm was
used together with an absorbance coefficient of 𝜀𝐴𝑡𝑡𝑜647𝑛 = 1500001
𝑀∗𝑐𝑚 for the
quantification. For fluorescent lipids that were dissolved in chloroform, the absorbance was
measured by mixing 1 µl, 5 µl or 10 µl of lipid with 50 µl of DMSO and 20 µl of MeOH. The
mixtures were filled up with chloroform to a total volume of 100 µl.
The absorbance measurements were performed as described above. The concentrations were
then calculated from the measured absorbance and the extinction using Lambert-Beer’s law.
Due to the fact that most of the used lipids did not possess a fluorophore, a different lipid
quantification method had to be used that detects the phosphorus in the phospholipids. This
method is based on the publication of C.H. Fiske and Y. Subbarow (317). For determination of
the concentration of the lipid stock solutions 1 µl, 2.5µl and 5 µl of lipid dissolved in
chloroform were transferred into Duran glass test tubes (10 x 100 mm with straight rim). Then
100 µl of 70% perchloric acid were added.
For lipid samples in aqueous solution (in liposomes), 7 µl of the liposome solution were mixed
with 93 µl of ddH2O in an Eppendorf tube. These 100 µl were then transferred into Duran glass
test tube and 100 µl of perchloric acid were added. After addition of the perchloric acid, the
glass tubes were heated up for 1 h at 200°C (VLM EC1). Next the test tubes were cooled down
on ice for 5 min and 1 ml of the ammonium molybdate solution (4.8 g ammonium molybdate
[(NH4)6Mo7O24*4H2O], 14 ml conc. sulfuric acid [H2SO4] in 986 ml ddH2O) was added and
the samples briefly vortexed. 1 ml of the Fiske-Subbarow reducing agent was added and the
samples vortexed. For preparation of the Fiske-Subbarow reducing agent, 0.20 g 1-amino-2-
naphthol-4-sulfonic acid, 23.95 g sodium metabisulfite [Na2S2O5] and 0.85 g sodium sulfite
[Na2SO3] were vigorously mixed in a porcelain mortar with a pestle and the mixture was stored
in a glass bottle in the dark. A fresh solution of 25 mg/ml Fiske-Subbarow reducing agent in
ddH2O was prepared for each use. After both the ammonium molybdate solution and the Fiske-
Subbarow reducing agent were added to the test tubes, they were incubated for 20 min at 100°C
3. MATERIAL AND METHODS
44
in a heating block (neoLab neoBlock HeizerDuo 2-2504). Next, the test tubes were cooled
down on ice and the bluish solution was transferred into polystyrene cuvettes (10x4x45 mm;
Sarstedt).
The absorbance at 820 nm was measured with an Amersham Bioscience Ultrospec 3100 pro
photometer. A calibration curve was measured in addition to the samples each time this assay
was performed. This standard curve was produced by using 0 µl, 20 µl, 40 µl, 60 µl, 80 µl and
100 µl of a 0.208 mM phosphate solution. Each of these standard curve samples was measured
in duplicate. All regular samples were measured in triplicates. For data analysis the calibration
curve was used to obtain a correlation between the measured absorbance at 820 nm and the
corresponding concentration of the phosphate. To calculate the P/L ratio of the liposomes the
measured peptide concentration was divided by the measured lipid concentration.
3.8. Circular Dichroism Spectroscopy
The measurement of a circular dichroism (CD) spectrum was performed using a Jasco J710
spectropolarimeter with a Jasco J710 spectropolarimeter power supply and a LKB Bromma
2219 MultiTemp II thermostatic circulator. For all measurements a Hellma Precision Cell
Suprasil Type 106-QS 0.5 mm cuvette made of quartz glass was used.
CD spectra of peptides were either measured in organic solvent (80% TFE (v/v)) or in liposome
solutions. For peptide samples in 80% TFE (v/v) a 60 µM dilution was made and the
measurement conducted at 20°C with the instrument parameter listed below. For peptide
samples in liposomes the liposome sample with a nominal P/L ratio of 1:100 was used. 150 µl
of these liposomes were mixed with 50 µl of liposome buffer. The measurements were
performed at 37°C with the same instrument parameter setups (Accumulations: 10, Sensitivity:
standard, Data Pitch: 0.1 nm, Scanning Mode: continuous, Scanning Speed: 100 nm/min, Band
Width: 1.0 nm, Data Mode: CH1: CD and CH2: HT Voltage) at different wavelengths for the
80% TFE samples (Wavelength λ = 260 nm – 180 nm,) and the liposome samples (Wavelength
λ = 260 nm – 195 nm). For data analysis Microsoft Excel was used to calculate the mean
3. MATERIAL AND METHODS
45
residual ellipticity in [deg*cm2/dmol] from the measured circular dichroism in [mdeg] using
Equation 1.
[𝜽]𝑴𝑹𝑾 =𝒎𝒆𝒂𝒔𝒖𝒓𝒂𝒏𝒅 ∗ 𝟏𝟎𝟎 ∗ 𝑴𝑾
𝒄 ∗ 𝒅 ∗ 𝒙
Measurand: blank corrected measured value in [mdeg]
MW: molecular weight in [kDa]
c: concentration in [mg/ml]
d: path length of the cuvette in [cm]
x: number of residues
Equation 1 Formula to calculate the mean residual ellipticity
In order to calculate the secondary structure composition of the measured peptides the mean
residual ellipticity values were saved in a text file which was then deconvoluted with the
CDNN CD spectra deconvolution software (Version 2.1) with either the complex
33 base-spectra or the user-defined pepfit spectra. The given percentages of secondary
structure composition were then normalized to a total secondary structure content of 100%.
3.9. Preparation of Liposomes
Liposomes were produced using either the cyclohexane method or the tertiary butanol method.
For establishment of the liposome preparation protocol the cyclohexane method was used at
first but was later replaced by the tertiary butanol method, which is faster and more
reproducible.
All liposomes were produced with a nominal lipid concentration of 3 mM. The peptide
concentration was chosen according to the nominal P/L ratio. Lipids were dissolved in
chloroform and peptides in HFIP. The liposome buffer consisted of 20 mM Tris-HCl and
100 mM NaCl in ddH2O with a pH of 7.4.
3.9.1. Cyclohexane Method
Lipids were transferred to an Eppendorf tube and dried under a faint air stream. To completely
remove the chloroform, the Eppendorf tube with the lipid film was dried for 1 h in a Savant
SpeedVac SC110. The lipid film was then dissolved in 600 µl cyclohexane by shaking the
sample for 1 h in an Eppendorf Thermomixer Compact at 37°C and 1000 rpm. The peptides
dissolved in HFIP were added to the bottom of the Eppendorf tube and a defined amount of

3. MATERIAL AND METHODS
46
HFIP was added in order to create a cyclohexane to HFIP ratio of 10:1. As cyclohexane and
HFIP are not mixable, two separated phases were clearly visible. To produce a homogenous
emulsion of small HFIP droplets in cyclohexane, the samples were sonicated with a Branson
Sonifier 450 for 30 sec with an amplitude of 8, a constant duty cycle and an output of 40%.
Afterwards the samples were one disperse phase and immediately frozen in -80°C acetone.
The samples were then stored for at least 1 h at -80°C until they were lyophilized o/n with a
Christ Alpha 2-4 LSC lyophilizer which was connected to a Vacuubrand Chemistry Hybrid
Pump RC6. After the lyophilization the samples were mixed with an according volume of
liposome buffer to get a lipid concentration of 3 mM. At this stage MLVs were produced and
the turbid solution was vortexed for 10 sec with a Hellman Cuv-O-Mix Model 342 vortexer.
For a complete equilibration of the MLVs the samples were mixed for 1 h at 1000 rpm and
37°C in an Eppendorf Thermomixer Compact.
Afterwards the samples were sonicated for 10 min with a Branson Sonifier 450 with an
amplitude of 8, a constant duty cycle and an output of 40%. To prevent peptide precipitation
due to high temperatures the sonication cup was cooled with ice water.
During the sonification procedure the MLVs were disrupted and SUVs were formed, so that
the liposome solution turned from a turbid solution to a transparent and slightly opalescent
one. In order to remove unincorporated lipids and peptides as well as lipid and peptide
aggregates, the samples were centrifuged in a Hermle Z233 KM-2 centrifuge with a Hermle
220.88 V02 rotor for 30 min at 13000 rpm and 4°C. The supernatant containing the ready-to-
use liposomes was transferred to a new Eppendorf tube.
3.9.2. Tertiary Butanol Method
The limitation of the above described cyclohexane method is that it only worked well if the
cyclohexane HFIP dispersion was deep-frozen immediately after the sonication step and was
kept deep-frozen long enough during the lyophilization. This is why an easier and also slightly
quicker method was used where possible. The tertiary butanol method is based on the fact that
both lipids and peptides are soluble in tertiary butanol. First the lipids dissolved in chloroform
were mixed in an Eppendorf tube with the peptides dissolved in HFIP. The organic solvents
were evaporated under a faint air stream until a small pellet of lipid and peptide was visible.
To remove any leftover organic solvents, the samples were dried for 1 h in the SpeedVac. Next

3. MATERIAL AND METHODS
47
300 µl of 37°C warm tertiary butanol were added to the pellets and the samples were mixed
for 1h at 37°C and 1000 rpm in a Thermomixer. Next the samples were cooled down for 1 h
in the -80°C deep freezer and then lyophilized o/n to remove the tertiary butanol. The following
steps were performed as described above in 3.9.1 for the cyclohexane method.
3.10. Förster Resonance Energy Transfer Experiments
All FRET experiments were performed with a Varian Cary Eclipse fluorescence
spectrophotometer with a Varian Peltier Multicell Holder, a Varian Cary Temperature Probe
Series II, a Varian Cary Temperature Controller, and a Hellma Precision Cell Suprasil Type
105.250-QS (10 x 2 mm; Z.15) cuvette made of quartz glass.
3.10.1. FRET Assays in Solution
For the FRET in solution experiments the peptides and fluorophores were dissolved in
80% TFE/ddH2O. Of these peptide and fluorophore stock solutions different dilutions were
prepared with a total volume of 150 µl and concentrations of 0 µM, 5 µM, 10 µM, 15 µM,
20 µM, 30 µM and 40 µM. For all dilutions a donor only spectrum as well as a donor/acceptor
spectrum was measured. The unspecific background FRET was determined by using the two
fluorophores tryptophan and NBD uncoupled to a peptide. The FRET experiments were
performed with the Aβ26-55 wild type peptides and the Aβ26-55 G33I mutant. As a negative
control the LLV16 model peptide was used as donor together with the Aβ26-55-NBD (WT)
peptide as acceptor. For all experiments the donor to acceptor ratio was fixed to 1:1. The exact
peptide or fluorophore concentration was determined after the fluorescence measurements as
described in chapter 3.6.1. For all tryptophan fluorescence measurements the excitation
wavelength was set to λex = 290 nm, the emission wavelength to λem = 300 nm - 580 nm and
the PMT-Voltage to 800 V. For the NBD fluorophore the excitation wavelength was set to λex
= 460 nm, the emission wavelength to λem = 470 nm - 600 nm and the PMT-Voltage to 700 V.
All fluorescence spectra scans were recorded in the high sensitivity mode with a scan speed of
120 nm/min. For data evaluation, first a blank spectrum (80% TFE/ddH2O without any peptide
or fluorophore) was subtracted from the measurements in Microsoft Excel. Next the tryptophan
fluorescence maximum peak values at 340 nm were plotted against the corresponding
tryptophan concentrations in an x/y data plot in Origin 9.1 (OriginLab Corporation). The data
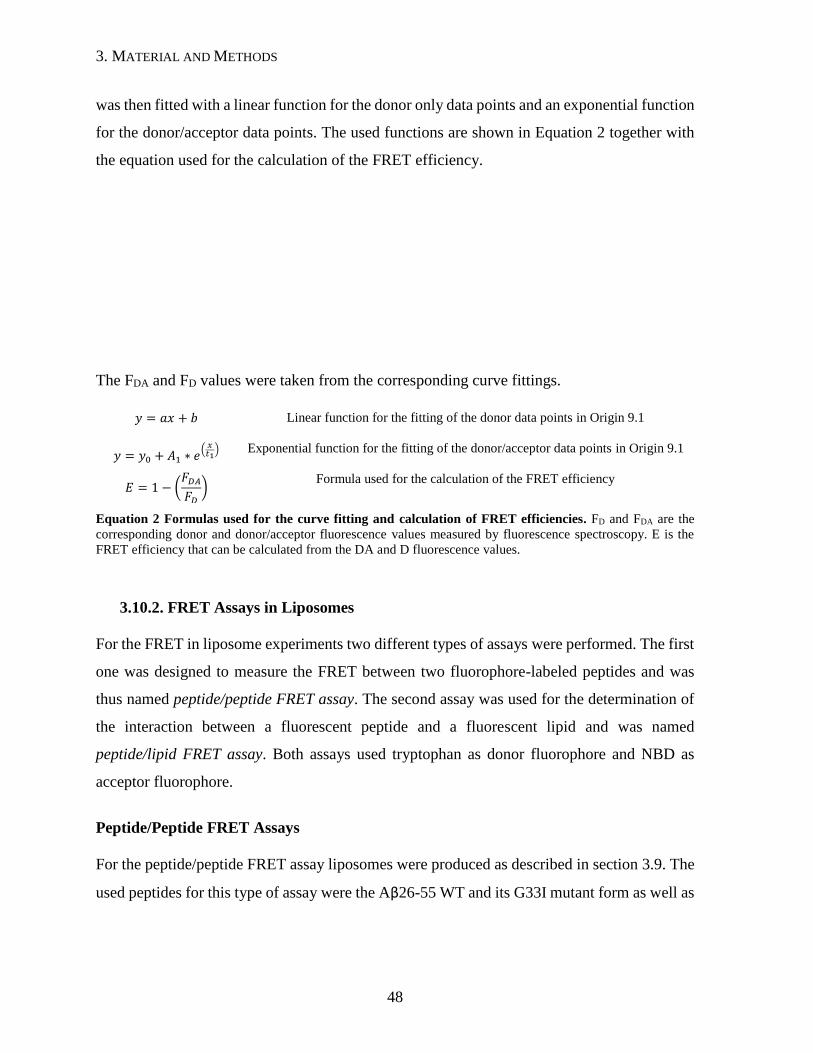
3. MATERIAL AND METHODS
48
was then fitted with a linear function for the donor only data points and an exponential function
for the donor/acceptor data points. The used functions are shown in Equation 2 together with
the equation used for the calculation of the FRET efficiency.
The FDA and FD values were taken from the corresponding curve fittings.
𝑦 = 𝑎𝑥 + 𝑏 Linear function for the fitting of the donor data points in Origin 9.1
𝑦 = 𝑦0 + 𝐴1 ∗ 𝑒( 𝑥
𝑡1)
Exponential function for the fitting of the donor/acceptor data points in Origin 9.1
𝐸 = 1 − (𝐹𝐷𝐴
𝐹𝐷
) Formula used for the calculation of the FRET efficiency
Equation 2 Formulas used for the curve fitting and calculation of FRET efficiencies. FD and FDA are the
corresponding donor and donor/acceptor fluorescence values measured by fluorescence spectroscopy. E is the
FRET efficiency that can be calculated from the DA and D fluorescence values.
3.10.2. FRET Assays in Liposomes
For the FRET in liposome experiments two different types of assays were performed. The first
one was designed to measure the FRET between two fluorophore-labeled peptides and was
thus named peptide/peptide FRET assay. The second assay was used for the determination of
the interaction between a fluorescent peptide and a fluorescent lipid and was named
peptide/lipid FRET assay. Both assays used tryptophan as donor fluorophore and NBD as
acceptor fluorophore.
Peptide/Peptide FRET Assays
For the peptide/peptide FRET assay liposomes were produced as described in section 3.9. The
used peptides for this type of assay were the Aβ26-55 WT and its G33I mutant form as well as
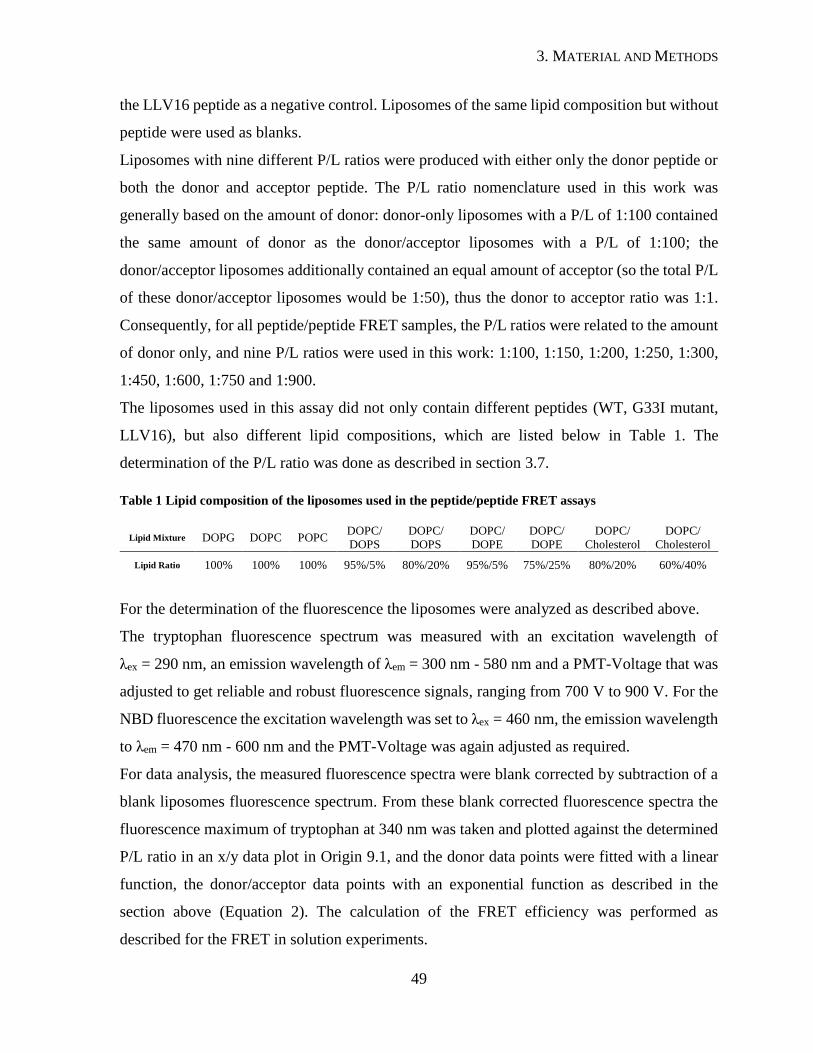
3. MATERIAL AND METHODS
49
the LLV16 peptide as a negative control. Liposomes of the same lipid composition but without
peptide were used as blanks.
Liposomes with nine different P/L ratios were produced with either only the donor peptide or
both the donor and acceptor peptide. The P/L ratio nomenclature used in this work was
generally based on the amount of donor: donor-only liposomes with a P/L of 1:100 contained
the same amount of donor as the donor/acceptor liposomes with a P/L of 1:100; the
donor/acceptor liposomes additionally contained an equal amount of acceptor (so the total P/L
of these donor/acceptor liposomes would be 1:50), thus the donor to acceptor ratio was 1:1.
Consequently, for all peptide/peptide FRET samples, the P/L ratios were related to the amount
of donor only, and nine P/L ratios were used in this work: 1:100, 1:150, 1:200, 1:250, 1:300,
1:450, 1:600, 1:750 and 1:900.
The liposomes used in this assay did not only contain different peptides (WT, G33I mutant,
LLV16), but also different lipid compositions, which are listed below in Table 1. The
determination of the P/L ratio was done as described in section 3.7.
Table 1 Lipid composition of the liposomes used in the peptide/peptide FRET assays
Lipid Mixture DOPG DOPC POPC DOPC/
DOPS
DOPC/
DOPS
DOPC/
DOPE
DOPC/
DOPE
DOPC/
Cholesterol
DOPC/
Cholesterol
Lipid Ratio 100% 100% 100% 95%/5% 80%/20% 95%/5% 75%/25% 80%/20% 60%/40%
For the determination of the fluorescence the liposomes were analyzed as described above.
The tryptophan fluorescence spectrum was measured with an excitation wavelength of
λex = 290 nm, an emission wavelength of λem = 300 nm - 580 nm and a PMT-Voltage that was
adjusted to get reliable and robust fluorescence signals, ranging from 700 V to 900 V. For the
NBD fluorescence the excitation wavelength was set to λex = 460 nm, the emission wavelength
to λem = 470 nm - 600 nm and the PMT-Voltage was again adjusted as required.
For data analysis, the measured fluorescence spectra were blank corrected by subtraction of a
blank liposomes fluorescence spectrum. From these blank corrected fluorescence spectra the
fluorescence maximum of tryptophan at 340 nm was taken and plotted against the determined
P/L ratio in an x/y data plot in Origin 9.1, and the donor data points were fitted with a linear
function, the donor/acceptor data points with an exponential function as described in the
section above (Equation 2). The calculation of the FRET efficiency was performed as
described for the FRET in solution experiments.
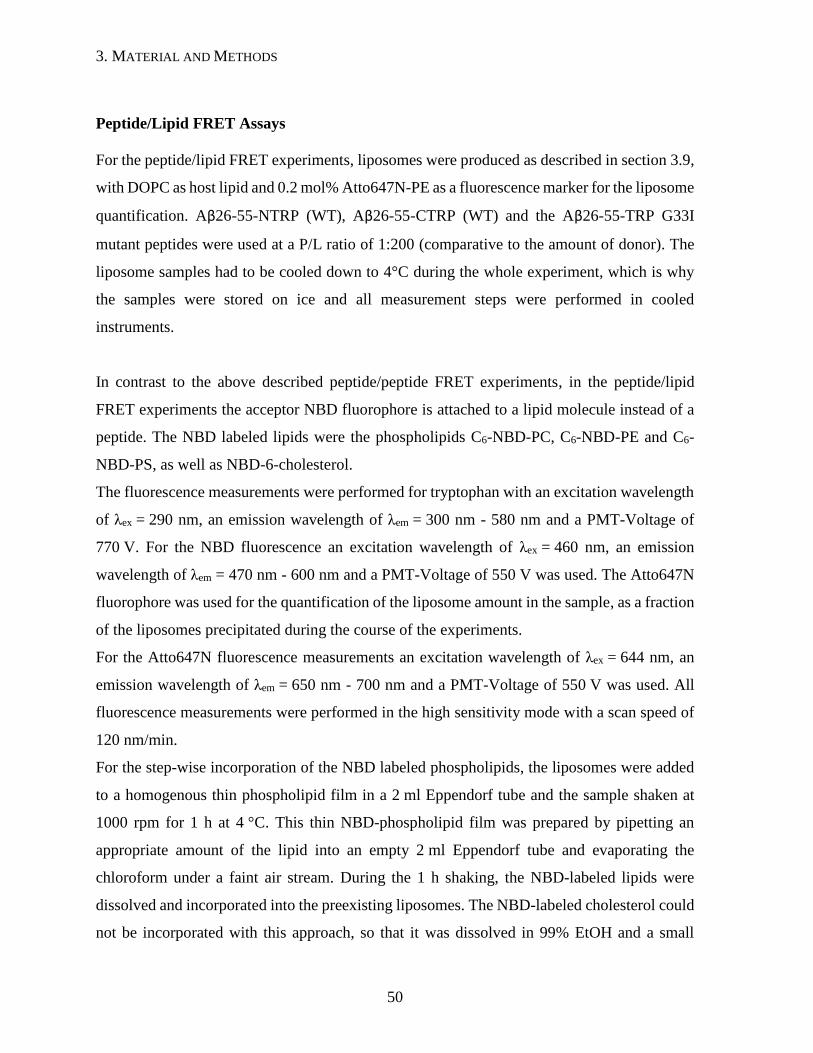
3. MATERIAL AND METHODS
50
Peptide/Lipid FRET Assays
For the peptide/lipid FRET experiments, liposomes were produced as described in section 3.9,
with DOPC as host lipid and 0.2 mol% Atto647N-PE as a fluorescence marker for the liposome
quantification. Aβ26-55-NTRP (WT), Aβ26-55-CTRP (WT) and the Aβ26-55-TRP G33I
mutant peptides were used at a P/L ratio of 1:200 (comparative to the amount of donor). The
liposome samples had to be cooled down to 4°C during the whole experiment, which is why
the samples were stored on ice and all measurement steps were performed in cooled
instruments.
In contrast to the above described peptide/peptide FRET experiments, in the peptide/lipid
FRET experiments the acceptor NBD fluorophore is attached to a lipid molecule instead of a
peptide. The NBD labeled lipids were the phospholipids C6-NBD-PC, C6-NBD-PE and C6-
NBD-PS, as well as NBD-6-cholesterol.
The fluorescence measurements were performed for tryptophan with an excitation wavelength
of λex = 290 nm, an emission wavelength of λem = 300 nm - 580 nm and a PMT-Voltage of
770 V. For the NBD fluorescence an excitation wavelength of λex = 460 nm, an emission
wavelength of λem = 470 nm - 600 nm and a PMT-Voltage of 550 V was used. The Atto647N
fluorophore was used for the quantification of the liposome amount in the sample, as a fraction
of the liposomes precipitated during the course of the experiments.
For the Atto647N fluorescence measurements an excitation wavelength of λex = 644 nm, an
emission wavelength of λem = 650 nm - 700 nm and a PMT-Voltage of 550 V was used. All
fluorescence measurements were performed in the high sensitivity mode with a scan speed of
120 nm/min.
For the step-wise incorporation of the NBD labeled phospholipids, the liposomes were added
to a homogenous thin phospholipid film in a 2 ml Eppendorf tube and the sample shaken at
1000 rpm for 1 h at 4 °C. This thin NBD-phospholipid film was prepared by pipetting an
appropriate amount of the lipid into an empty 2 ml Eppendorf tube and evaporating the
chloroform under a faint air stream. During the 1 h shaking, the NBD-labeled lipids were
dissolved and incorporated into the preexisting liposomes. The NBD-labeled cholesterol could
not be incorporated with this approach, so that it was dissolved in 99% EtOH and a small

3. MATERIAL AND METHODS
51
volume corresponding to the necessary amount of NBD-lipid was added to the liposomes
solution under vigorous vortexing. After addition of the NBD-cholesterol the samples were
shaken for 10 min at 4°C in the cold room with 1000 rpm to assure a maximized lipid insertion.
With this approach the NBD-cholesterol could easily be incorporated into the liposomes. The
EtOH concentration after the sixth NBD-cholesterol incorporation step was below 10% (v/v).
For both NBD-lipid incorporation methods a centrifugation step was used to separate
successfully incorporated NBD-lipid from unincorporated lipid molecules.
This centrifugation step was performed in a precooled Hermle Z233 MK-2 centrifuge with a
Hermle 220.88 V02 rotor at 13000 rpm for 30 min at 4°C. After this centrifugation step the
samples were transferred to new Eppendorf tube.
This step-wise incorporation of the NBD-lipid resulted in nominal donor-to-acceptor ratios of
1:0, 1:1, 1:2, 1:3, 1:4, 1:5 and 1:6. Fluorescence measurements were performed for each
incorporation step. For the quantification of the incorporated NBD-lipid, an absorbance
spectrum was measured for all samples after the fluorescence measurements. After the fourth,
fifth and sixth addition of NBD-lipid, 25 µl liposome solution were diluted in 75 µl liposome
buffer to ensure a reliable NBD-quantification despite the increasing NBD concentration.
For data evaluation, first the blank liposome fluorescence spectrum was subtracted from all
fluorescence spectra to correct for the background fluorescence. As the used liposomes did not
always exhibit a P/L ratio that was exactly 1:200, in a second step the fluorescence data was
normalized to the donor-only fluorescence intensity at 340 nm which was set to 100%.
The amount of incorporated peptide was measured as described in section 3.6.2 for the donor-
only liposomes.
As some of the liposomes and thereby peptide was lost during the NBD-lipid incorporation
procedure, in a third step the actual amount of peptide was calculated: the starting peptide
concentration was multiplied with a “lost-liposome factor”, which was derived from the
measured Atto647N fluorescence measurements. These determined actual peptide
concentrations were used together with the quantified NBD absorbance values to calculate the
exact donor-to-acceptor ratio. In a last step the normalized fluorescence intensity values were
plotted against the actual donor-to-acceptor ratio using Origin 9.1 and an exponential curve
was fitted through the data points. The used exponential function is shown in Equation 2.

3. MATERIAL AND METHODS
52
3.11. Reconstitution of presenilin TMD into liposomes
The nine presenilin TMDs were incorporation into liposomes with a nominal P/L ratio of 1:200
as described in section 3.9. The lipid compositions are shown in Table 2. The P/L ratio of the
liposomes and the CD spectra were measured as described in the sections above.
Table 2 Lipid composition for the reconstitution of the nine presenilin TMDs
Early Endosomal Lipid Composition Late Endosomal Lipid Composition DOPC Liposomes
Lipids
Amount
Lipids
Amount
Lipids
Amount
DOPC
75%
DOPC
56.25%
DOPC
100%
DOPE 10% DOPE 7.5%
DOPS 5% DOPS 3.75%
SM 10% SM 7.5%
Cholesterol 25%

4. RESULTS
53
4. Results
Despite the advances in the research of APP processing discussed in the introduction, several
issues were still up to debate in the literature at the start of this work. Several studies on the
dimerization of the APP TMD and its influence on the γ-secretase cleavage showed
contradicting results (271, 272). Furthermore studies trying to elucidate the influence of lipids on
the dimerization of the APP TMD and consequently the development of AD were were either
quite unspecific and unclear as to whether the change in lipids in the AD brain was cause or
consequence of the disease, or the studies were focused on only a single lipid class without
evidence that could relate this specific lipid with the disease (111, 308, 309, 311, 318, 319). Nevertheless
a few studies showed that lipids are fundamentally involved in the APP TMD dimerization,
and that this dimerization is most probably linked to the cleavage of APP through
γ-secretase (111, 122, 271, 272).
In order to better understand the influence of lipids on the dimerization of the APP TMD, a
FRET based liposome assay was developed in this work and utilized for the discovery of lipid
species that play an essential role for the APP TMD dimerization.
The first part of this work focused on the development of a suitable assay and the measurement
of the influence of various different lipid compositions on the APP TMD dimerization.
Relevant lipids were chosen based on their occurrence in membranes thought to be the site of
γ-secretase cleavage.
Lipids found to influence the dimerization in the first part were further investigated in a
Lipid-Peptide FRET assay in the second part of this work; this was done to better understand
if these lipids also have a high affinity towards the peptide, or if other properties like
influencing the membrane dynamics play a role.
In the third part of this work, all nine transmembrane domains of presenilin were individually
reconstituted into liposomes with three different lipid compositions. This is an important first
step towards a heterodimerization assay between the presenilin TMDs and the APP TMD,
aimed towards elucidating the influence of the lipid environment on the substrate binding, and
the importance of the GxxxG motif.
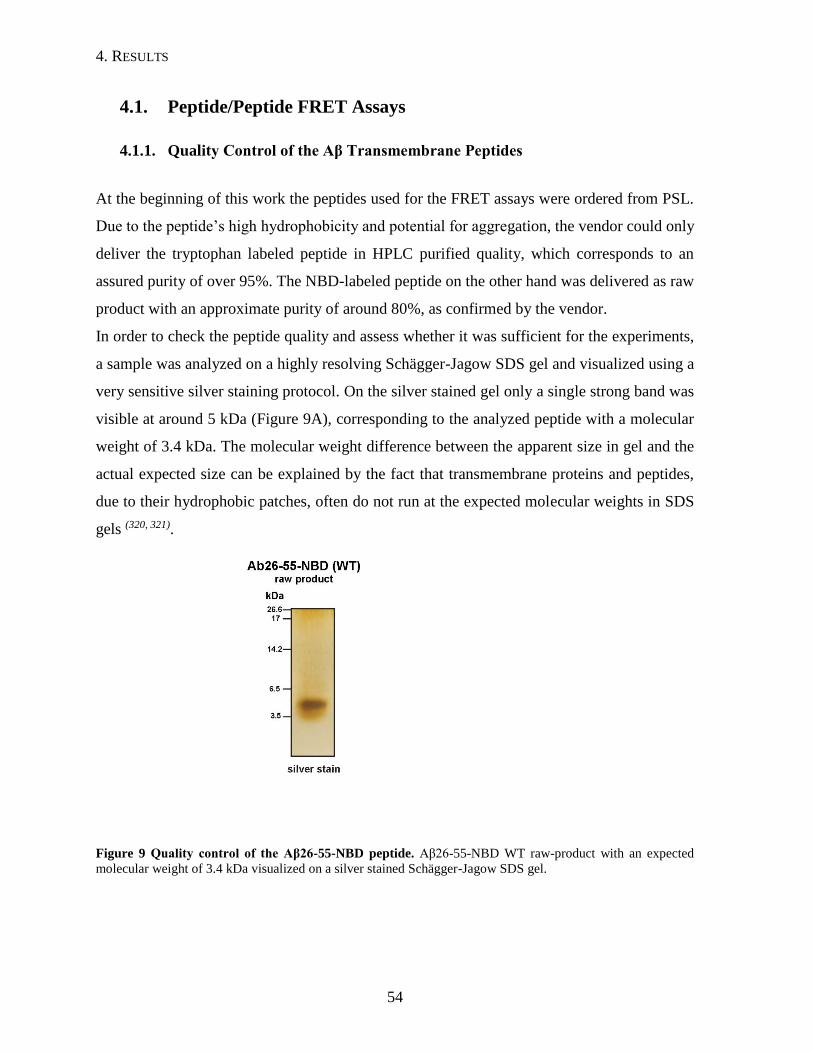
4. RESULTS
54
4.1. Peptide/Peptide FRET Assays
4.1.1. Quality Control of the Aβ Transmembrane Peptides
At the beginning of this work the peptides used for the FRET assays were ordered from PSL.
Due to the peptide’s high hydrophobicity and potential for aggregation, the vendor could only
deliver the tryptophan labeled peptide in HPLC purified quality, which corresponds to an
assured purity of over 95%. The NBD-labeled peptide on the other hand was delivered as raw
product with an approximate purity of around 80%, as confirmed by the vendor.
In order to check the peptide quality and assess whether it was sufficient for the experiments,
a sample was analyzed on a highly resolving Schägger-Jagow SDS gel and visualized using a
very sensitive silver staining protocol. On the silver stained gel only a single strong band was
visible at around 5 kDa (Figure 9A), corresponding to the analyzed peptide with a molecular
weight of 3.4 kDa. The molecular weight difference between the apparent size in gel and the
actual expected size can be explained by the fact that transmembrane proteins and peptides,
due to their hydrophobic patches, often do not run at the expected molecular weights in SDS
gels (320, 321).
Figure 9 Quality control of the Aβ26-55-NBD peptide. Aβ26-55-NBD WT raw-product with an expected
molecular weight of 3.4 kDa visualized on a silver stained Schägger-Jagow SDS gel.
4. RESULTS
55
The single band in gel showed that the raw product peptide had already a high purity: if
significant amounts of impurities were present, multiple gel bands of various sizes would be
expected in addition to the single detectable gel band However, it could not be excluded that
the major band contained other peptides than the full length Ab26-55-NBD WT peptide. It was
reasoned that the raw product peptide was already pure enough for the FRET assay without
further HPLC purification, as minor impurities would likely not influence the experimental
results.
In order to verify this assumption and prove that further purification of the peptide was not
necessary, a small fraction of the peptide was HPLC purified. This HPLC-purified fraction was
later used in parallel to the raw product in the same experiments to investigate if similar results
were obtained.
For an additional confirmation of the purity and suitability of all Aβ peptides used in this work,
the peptide secondary structure was determined in an 80% TFE solution by circular dichroism
(Figure 10). All Aβ peptides used in this work consisted of the α-helical transmembrane
domain of APP. The Aβ16-55-NBD peptide had additionally ten amino acids thought to form
a small loop and a short α-helix. Consequently the overall secondary structure of all these
peptides was expected to be α-helical. As shown in Figure 10, all used Aβ peptides had very
similar secondary structure contents in an 80% TFE solution. Yet indeed all five peptides
showed a well-defined α-helical structure in 80% TFE with an average of around 65% helix
content.
For the NBD-labeled Aβ26-55-NBD WT, one replicate consisted of the raw product, two
replicates of the in-house HPLC-purified fraction. But all replicates, independent if they
consisted of raw-product or the HPLC-purified fraction, showed similar amounts of α-helicity
as evidenced by the very small standard deviation (Figure 10B).

4. RESULTS
56
Figure 10 CD spectra of Aβ peptides in 80% TFE. (A) Mean CD spectra of all five Aβ peptides used in this
work, calculated from three individual measurements. All five peptides showed similar amounts of α-helicity. (B)
The measured spectra were analyzed using the CDNN CD spectra deconvolution software with the PEPFIT
reference spectra. Shown is the mean secondary structure content and the standard deviation (SD) of the three
individual measurements. The amount of α-helix is depicted in red, the amount of β-sheet in blue, and the amount
of random coil in grey. The total sum of α-helix, β-sheet, and random coil was normalized to one.
Taken together, both the CD-spectra traces (Figure 10A) as well as the evaluated secondary
structure contents (Figure 10B) verified that all Aβ peptides used in this work possessed a well-
defined α-helical structure.
4.1.2. Peptide/Peptide FRET in Solution
The next step was to establish a robust peptide-peptide FRET assay. While the final assay was
to be performed in liposomes, a more straightforward and more easily reproducible platform
was chosen for the first test experiments: FRET in solution. This way, the peptides could be
used dissolved in TFE and did not require reconstitution into liposomes prior to the FRET
experiments, making the first tests more reproducible and less dependent on additional factors
such as incorporation efficiencies.
These first tests in solution were performed to confirm whether the fluorophore pair, NBD and
tryptophan, was suitable, but also to see how much FRET could be expected in the later FRET-
in-liposome experiments. Hence the first FRET experiments were performed four times with
Aβ26-55-NBD WT and Aβ26-55-TRP WT peptides (Figure 11A).

4. RESULTS
57
Figure 11 FRET in solution experiments with Aβ26-55 WT, Aβ26-55 G33I, LLV16, and free fluorophores. The FRET in solution experiment were performed in TFE with the Aβ wild type peptides (A), the Aβ G33I mutant
peptides (B), the free fluorophores for the determination of the random FRET (C), and a combination of the
LLV16 peptide with the Aβ-NBD WT peptide as a negative control (D). Shown here are the mean and standard
deviation of four individual experiments for the graphs A-C and two individual experiments for D. For all, the
donor to acceptor ratio was constant at 1:1, and the fluorescence intensities were plotted against the donor peptide
concentration for both the donor and donor/acceptor samples or fluorophore mixtures. The donor data points were
fitted with a linear function, the donor/acceptor data points with an exponential function. For the calculation of
FRET efficiencies the fitting functions of each individual experiment were used.

4. RESULTS
58
(E) Mean FRET efficiency curves for the FRET in solution experiments, calculated from the individual fitted
single experiments. The FRET efficiency curves were plotted against total concentration of the donor/acceptor
mixtures. The dashed line indicates the 50% FRET efficiency values (E50). (F) The mean and standard deviation
of the E50 concentrations were calculated from individual experiments and represent the concentration of 50%
FRET efficiency. Note that the value for the free fluorophores is calculated from the extrapolated curve fittings,
as these experiments did not reach a FRET efficiency of 50%. The peptide based experiments were not
significantly different in their E50 values, but they were all significantly different from the free fluorophore
experiments (p = 1.937*10-5, p = 2.785*10-5 and p = 1.165*10-3 for WT, G33I and LLV16, respectively).
Next, the same experiments were performed four times with the Aβ26-55 G33I mutant
(Figure 11B). This mutant was expected to show a reduced amount of dimerization, because
the mutation of Gly33 to Ile destroys two consecutive GxxxG motifs, which are known to be
important for the APP TMD dimerization (115). In addition to the WT and mutant peptides, free
fluorophores were also used in four individual set-ups to measure the amount of background
FRET which originates from the random colocalization of both fluorophores (Figure 11C).
To get FRET efficiency curves from the data of the peptides and free fluorophores, the data
points for the donor and the donor/acceptor measurements were plotted and fitted (Figure 11E).
Comparing the results of the WT and G33I mutant experiments showed that both peptides
yielded similar amounts of FRET throughout the whole concentration range with only very
small differences in the lower concentration range (Figure 11E). Contrary to the expectations
stated above, there was no difference visible between the WT and the mutant peptide.
However, comparison of both peptide-based experiments with the fluorophore based
experiment showed that a significant part of the FRET efficiency of the peptide based
experiments must have been due to specific interactions: the FRET efficiency of the
fluorophore based experiment was by design solely based on an unspecific and random
colocalization of both fluorophores within the Förster distance. Consequently, the additional
FRET in the peptide based experiments must have been due to peptide-peptide interaction. The
question remained why there was no difference in FRET efficiencies between the WT and
mutant peptides.
In order to test whether the G33I mutation did indeed not influence the specific dimerization
in TFE, or if this was caused by the TFE, a combination of two peptides was used that should
only show unspecific interactions.
4. RESULTS
59
For this Aβ-NBD WT peptide was used as acceptor, and the LLV16 peptide was used as donor.
LLV16 is a model peptide used for studying transmembrane peptide dynamics and membrane
fusion. The Aβ-NBD WT/LLV16 experiments were performed two times (Figure 11D).
The resulting FRET efficiency curve from these experiments was compared to the ones of the
WT peptides and the G33I peptide (Figure 11E). Interestingly, the combination of two peptides
that show only unspecific interactions resulted in identical FRET efficiencies compared to the
experiments with the Aβ peptides.
A comparison of the concentrations where the FRET efficiencies reached 50%, the point where
the KD value is expected, additionally showed that no difference between the peptide based
experiments could be determined (Figure 11F). However, all peptide experiments showed a
significant difference compared with the fluorophore based experiment. This difference
signifies that the peptide based experiments showed significantly more FRET than the random
colocalization FRET of the fluorophore control experiment.
In conclusion, the FRET in solution experiments did not show a difference in FRET efficiency
between the Aβ WT and G33I mutant peptides. Even the negative control experiment with the
LLV16 peptide as donor resulted in equal FRET efficiencies as the other peptides. This led to
the conclusion that all measured FRET above the amount that is due to random colocalization
is based on unspecific interactions caused by the solvent. Due to these results, no further test
experiments were performed in solution, but all further experiments were immediately
conducted in liposomes as planned. Despite the challenges encountered in the TFE system, one
positive result of the FRET in solution experiment was the confirmation of the chosen
fluorophore combination.

4. RESULTS
60
4.1.3. Establishment of a Peptide/Peptide FRET Assay in Liposomes
The fundamental prerequisite for a successful peptide-peptide FRET assay in liposomes is the
ability to correctly quantify the amount of peptide incorporated into the liposomes. During the
liposome preparation procedure some peptide is lost, and a quantification of the lost or
remaining peptide is vital, because the exact concentration of donor peptide is necessary for
the calculation of the FRET efficiency. Therefore a highly sensitive and reproducible method
for the quantification of the tryptophan- and NBD-labeled peptides had to be used.
Due to the fact that the amount of tryptophan was too low for a good quantification by
absorbance measurements, the fluorescence was used for quantification, as it is more sensitive.
In order to assure that no FRET is present during the quantification measurements, the
liposomes were lyzed prior to these measurements. Both the tryptophan and the NBD
fluorescence could be measured in a highly reproducible way in both donor and donor/acceptor
liposomes. As a first step calibration curves were measured for both fluorophores (Figure 12).
Figure 12 Calibration curves for the determination of tryptophan- and NBD-peptide concentrations in
liposomes. To obtain data points for the calibration, liposomes with defined peptide concentrations were lyzed
and the fluorescence intensities measured (PMT-Voltages: TRP = 770 V and NBD = 700V). The fluorescence
intensity mean values and standard deviations of two individual experiments were plotted for each concentration.
The calibration curves were obtained by fitting linear functions through the data points. The fitting functions are:
y = -1.92592 + 7.87862*1010x (NBD – blue); y = -2.2799 + 4.97153*1010x (TRPDonor – black); y = 16.54703 +
4.52231*1010x (TRPDA – red).
As shown in Figure 12, the two single measurements for the calibration curves gave highly
reproducible data points for both fluorophores, signified by the similar means and small
standard deviations.
4. RESULTS
61
Additionally, the determined fitting functions for the tryptophan fluorescence values for the
donor and donor/acceptor experiments showed almost no difference, confirming that the
liposome lysis abolished any FRET. Therefore the use of the peptide fluorescence for peptide
quantification was proven to be a highly accurate and reproducible method and was used for
all liposome-based experiments presented in this work.
With a valid method for the correct quantification of the peptides in hand, the next step in the
establishment of the peptide-peptide FRET assay was to perform the first FRET experiments
in liposomes. To this end simple DOPG liposomes were chosen, as DOPG is a lipid that has
previously been reported to allow a high degree of APP TMD dimerization (119). The Aβ WT
tryptophan peptide and the Aβ WT NBD peptide were reconstituted into these liposomes as
donor and acceptor respectively. The first measurements showed a reduction of the tryptophan
fluorescence and induction of the NBD fluorescence by FRET for the donor/acceptor samples
compared to the donor-only samples that contained only the tryptophan peptide (Figure 13A).
In principle it is sufficient to measure only a narrow wavelength range to obtain FRET data. It
is advantageous though to measure the whole spectrum, as the tryptophan spectrum serves
additionally as a quality control, since the properties of the fluorescence spectrum are a very
good indication of the incorporation quality: if the peak of the fluorescence is around 340 nm,
the peptide is correctly incorporated (Figure 13A). This assumption is based on the fact that
the tryptophan fluorescence is highly sensitive towards its environment (322). If the tryptophan
is in a more hydrophilic and polar environment the peak is located above 340 nm. If the
tryptophan is in a highly hydrophobic environment the peak shifts towards lower wavelength.
As the tryptophan in the used peptides will be located between the hydrophobic acyl chain
region of the lipids and the hydrophilic and polar headgroup region, the expected fluorescence
maximum should be around 340 nm.
This was the case for most liposome preparations in this work, but sometimes the peak was
drastically shifted towards lower wavelengths (~310 nm). This was an indication that the
peptide was not correctly incorporated into the liposomes, but rather was present in aggregated
form. This way incorrectly reconstituted peptide samples could be identified and discarded,
making sure that only correctly incorporated peptide samples were included in the experiment.
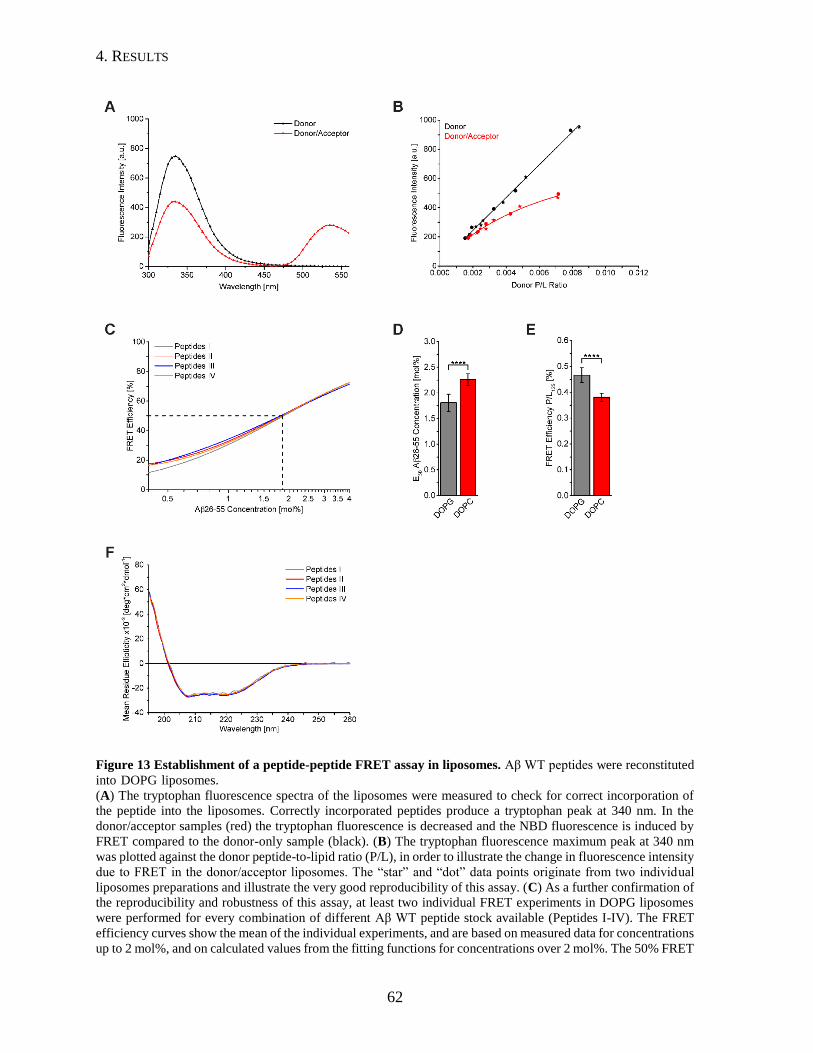
4. RESULTS
62
Figure 13 Establishment of a peptide-peptide FRET assay in liposomes. Aβ WT peptides were reconstituted
into DOPG liposomes. .
(A) The tryptophan fluorescence spectra of the liposomes were measured to check for correct incorporation of
the peptide into the liposomes. Correctly incorporated peptides produce a tryptophan peak at 340 nm. In the
donor/acceptor samples (red) the tryptophan fluorescence is decreased and the NBD fluorescence is induced by
FRET compared to the donor-only sample (black). (B) The tryptophan fluorescence maximum peak at 340 nm
was plotted against the donor peptide-to-lipid ratio (P/L), in order to illustrate the change in fluorescence intensity
due to FRET in the donor/acceptor liposomes. The “star” and “dot” data points originate from two individual
liposomes preparations and illustrate the very good reproducibility of this assay. (C) As a further confirmation of
the reproducibility and robustness of this assay, at least two individual FRET experiments in DOPG liposomes
were performed for every combination of different Aβ WT peptide stock available (Peptides I-IV). The FRET
efficiency curves show the mean of the individual experiments, and are based on measured data for concentrations
up to 2 mol%, and on calculated values from the fitting functions for concentrations over 2 mol%. The 50% FRET
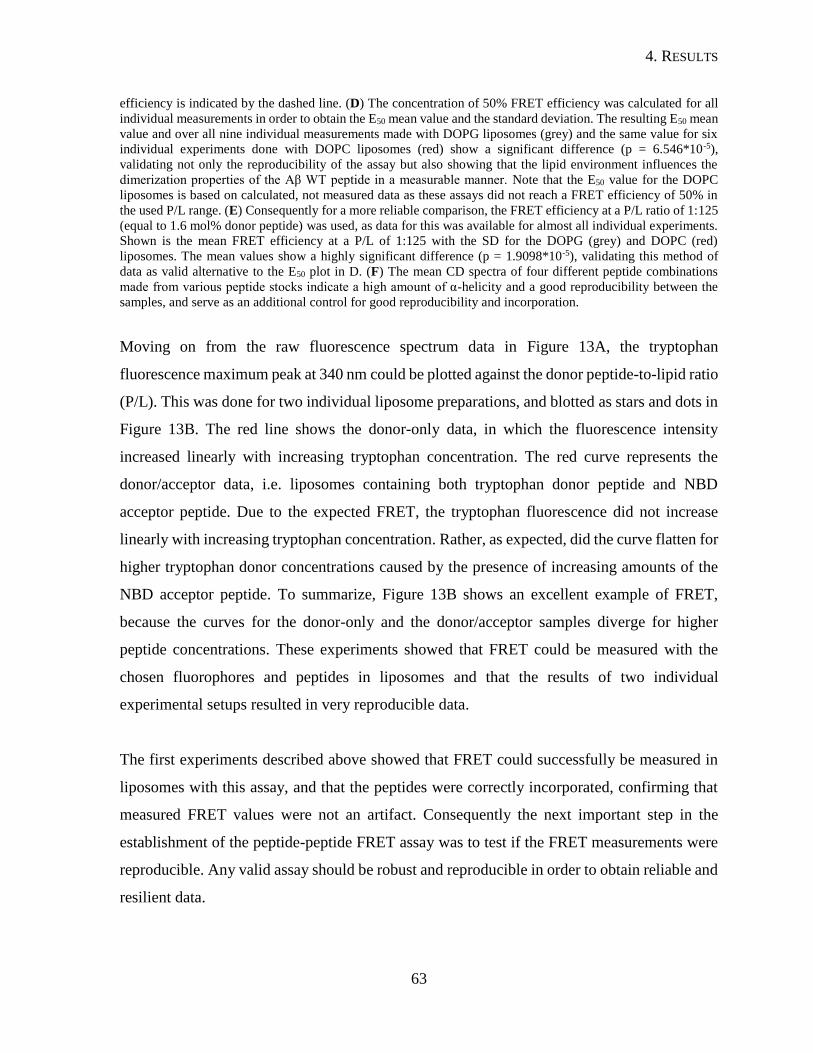
4. RESULTS
63
efficiency is indicated by the dashed line. (D) The concentration of 50% FRET efficiency was calculated for all
individual measurements in order to obtain the E50 mean value and the standard deviation. The resulting E50 mean
value and over all nine individual measurements made with DOPG liposomes (grey) and the same value for six
individual experiments done with DOPC liposomes (red) show a significant difference (p = 6.546*10-5),
validating not only the reproducibility of the assay but also showing that the lipid environment influences the
dimerization properties of the Aβ WT peptide in a measurable manner. Note that the E50 value for the DOPC
liposomes is based on calculated, not measured data as these assays did not reach a FRET efficiency of 50% in
the used P/L range. (E) Consequently for a more reliable comparison, the FRET efficiency at a P/L ratio of 1:125
(equal to 1.6 mol% donor peptide) was used, as data for this was available for almost all individual experiments.
Shown is the mean FRET efficiency at a P/L of 1:125 with the SD for the DOPG (grey) and DOPC (red)
liposomes. The mean values show a highly significant difference (p = 1.9098*10-5), validating this method of
data as valid alternative to the E50 plot in D. (F) The mean CD spectra of four different peptide combinations
made from various peptide stocks indicate a high amount of α-helicity and a good reproducibility between the
samples, and serve as an additional control for good reproducibility and incorporation.
Moving on from the raw fluorescence spectrum data in Figure 13A, the tryptophan
fluorescence maximum peak at 340 nm could be plotted against the donor peptide-to-lipid ratio
(P/L). This was done for two individual liposome preparations, and blotted as stars and dots in
Figure 13B. The red line shows the donor-only data, in which the fluorescence intensity
increased linearly with increasing tryptophan concentration. The red curve represents the
donor/acceptor data, i.e. liposomes containing both tryptophan donor peptide and NBD
acceptor peptide. Due to the expected FRET, the tryptophan fluorescence did not increase
linearly with increasing tryptophan concentration. Rather, as expected, did the curve flatten for
higher tryptophan donor concentrations caused by the presence of increasing amounts of the
NBD acceptor peptide. To summarize, Figure 13B shows an excellent example of FRET,
because the curves for the donor-only and the donor/acceptor samples diverge for higher
peptide concentrations. These experiments showed that FRET could be measured with the
chosen fluorophores and peptides in liposomes and that the results of two individual
experimental setups resulted in very reproducible data.
The first experiments described above showed that FRET could successfully be measured in
liposomes with this assay, and that the peptides were correctly incorporated, confirming that
measured FRET values were not an artifact. Consequently the next important step in the
establishment of the peptide-peptide FRET assay was to test if the FRET measurements were
reproducible. Any valid assay should be robust and reproducible in order to obtain reliable and
resilient data.
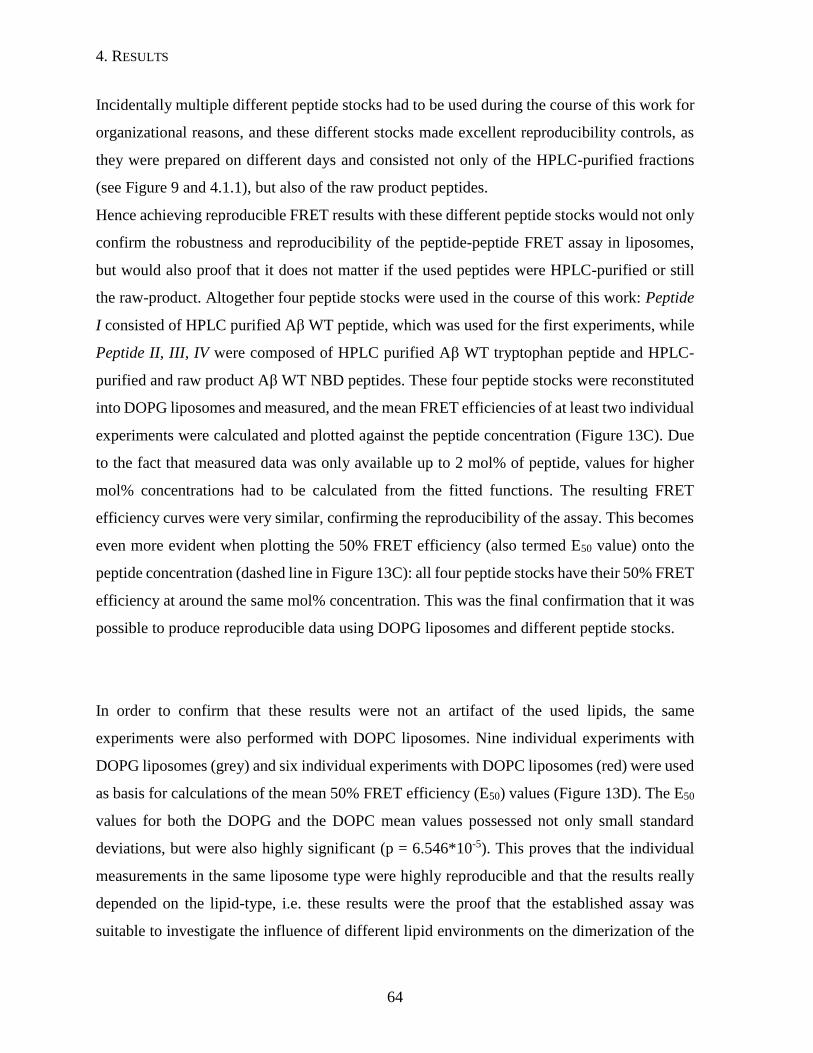
4. RESULTS
64
Incidentally multiple different peptide stocks had to be used during the course of this work for
organizational reasons, and these different stocks made excellent reproducibility controls, as
they were prepared on different days and consisted not only of the HPLC-purified fractions
(see Figure 9 and 4.1.1), but also of the raw product peptides.
Hence achieving reproducible FRET results with these different peptide stocks would not only
confirm the robustness and reproducibility of the peptide-peptide FRET assay in liposomes,
but would also proof that it does not matter if the used peptides were HPLC-purified or still
the raw-product. Altogether four peptide stocks were used in the course of this work: Peptide
I consisted of HPLC purified Aβ WT peptide, which was used for the first experiments, while
Peptide II, III, IV were composed of HPLC purified Aβ WT tryptophan peptide and HPLC-
purified and raw product Aβ WT NBD peptides. These four peptide stocks were reconstituted
into DOPG liposomes and measured, and the mean FRET efficiencies of at least two individual
experiments were calculated and plotted against the peptide concentration (Figure 13C). Due
to the fact that measured data was only available up to 2 mol% of peptide, values for higher
mol% concentrations had to be calculated from the fitted functions. The resulting FRET
efficiency curves were very similar, confirming the reproducibility of the assay. This becomes
even more evident when plotting the 50% FRET efficiency (also termed E50 value) onto the
peptide concentration (dashed line in Figure 13C): all four peptide stocks have their 50% FRET
efficiency at around the same mol% concentration. This was the final confirmation that it was
possible to produce reproducible data using DOPG liposomes and different peptide stocks.
In order to confirm that these results were not an artifact of the used lipids, the same
experiments were also performed with DOPC liposomes. Nine individual experiments with
DOPG liposomes (grey) and six individual experiments with DOPC liposomes (red) were used
as basis for calculations of the mean 50% FRET efficiency (E50) values (Figure 13D). The E50
values for both the DOPG and the DOPC mean values possessed not only small standard
deviations, but were also highly significant (p = 6.546*10-5). This proves that the individual
measurements in the same liposome type were highly reproducible and that the results really
depended on the lipid-type, i.e. these results were the proof that the established assay was
suitable to investigate the influence of different lipid environments on the dimerization of the
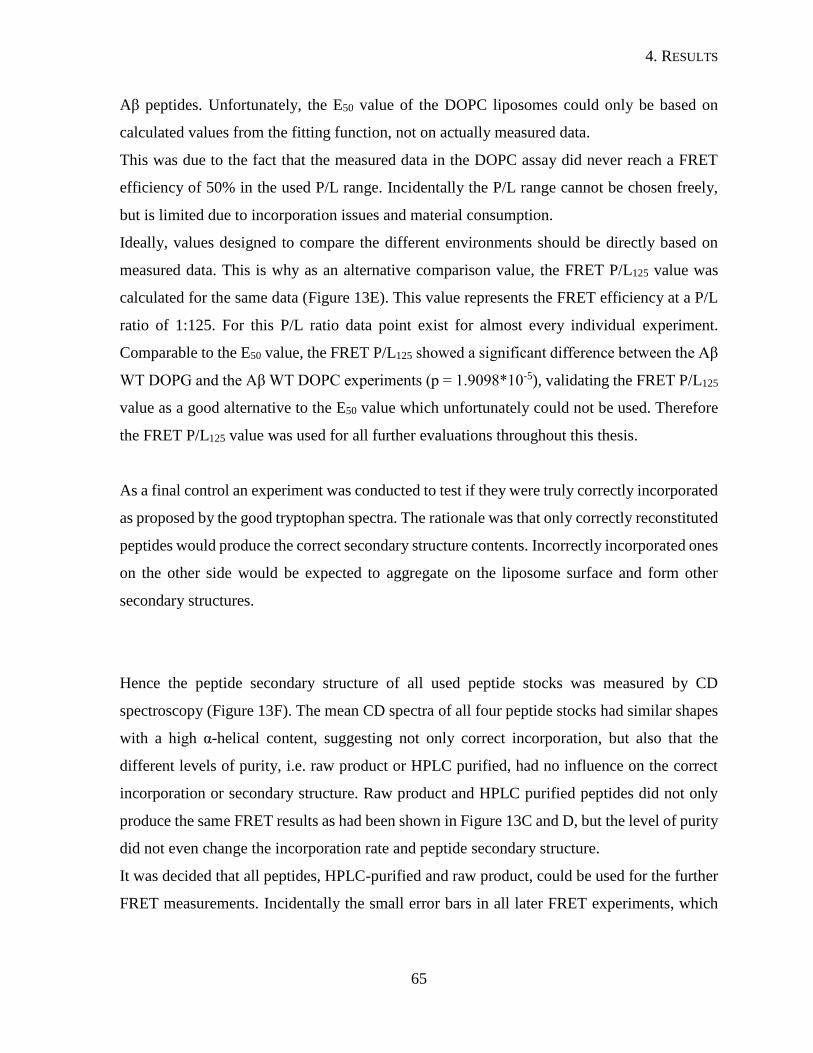
4. RESULTS
65
Aβ peptides. Unfortunately, the E50 value of the DOPC liposomes could only be based on
calculated values from the fitting function, not on actually measured data.
This was due to the fact that the measured data in the DOPC assay did never reach a FRET
efficiency of 50% in the used P/L range. Incidentally the P/L range cannot be chosen freely,
but is limited due to incorporation issues and material consumption.
Ideally, values designed to compare the different environments should be directly based on
measured data. This is why as an alternative comparison value, the FRET P/L125 value was
calculated for the same data (Figure 13E). This value represents the FRET efficiency at a P/L
ratio of 1:125. For this P/L ratio data point exist for almost every individual experiment.
Comparable to the E50 value, the FRET P/L125 showed a significant difference between the Aβ
WT DOPG and the Aβ WT DOPC experiments (p = 1.9098*10-5), validating the FRET P/L125
value as a good alternative to the E50 value which unfortunately could not be used. Therefore
the FRET P/L125 value was used for all further evaluations throughout this thesis.
As a final control an experiment was conducted to test if they were truly correctly incorporated
as proposed by the good tryptophan spectra. The rationale was that only correctly reconstituted
peptides would produce the correct secondary structure contents. Incorrectly incorporated ones
on the other side would be expected to aggregate on the liposome surface and form other
secondary structures.
Hence the peptide secondary structure of all used peptide stocks was measured by CD
spectroscopy (Figure 13F). The mean CD spectra of all four peptide stocks had similar shapes
with a high α-helical content, suggesting not only correct incorporation, but also that the
different levels of purity, i.e. raw product or HPLC purified, had no influence on the correct
incorporation or secondary structure. Raw product and HPLC purified peptides did not only
produce the same FRET results as had been shown in Figure 13C and D, but the level of purity
did not even change the incorporation rate and peptide secondary structure.
It was decided that all peptides, HPLC-purified and raw product, could be used for the further
FRET measurements. Incidentally the small error bars in all later FRET experiments, which

4. RESULTS
66
were conducted with both HPLC-purified and raw product peptides, confirm that this decision
was correct.
Another very important factor that has to be considered during the establishment of such a
FRET assay is the specificity of the measured dimerization. As shown in section 4.1.2,
specificity was not shown by the FRET in solution experiments. The same specificity control
was undertaken for the FRET in liposomes assay. This was done to make sure the FRET in
liposomes assay was truly reliable and specific. Hence the specificity control was performed
with DOPG liposomes and the combination of the LLV16 peptide as donor and the Aβ WT
NBD peptide as acceptor, which should show no specific interaction by definition.
For comparison, the experiments were conducted with donor and acceptor Aβ WT peptides in
DOPG (Figure 14A) and DOPC (Figure 14B) liposomes, or with the LLV16 donor specificity
control (Figure 14C). All experiments were conducted twice (represented as stars and dots). It
is clearly visible that the LLV16 control experiment yielded results that were different from
the experiments shown in Figure 14A and B, with the divergence between donor and
donor/acceptor curves being much smaller compared to the Aβ WT samples. The smaller
divergence in the negative control sample (Figure14C) means that there is less FRET, which
would be expected if the two peptides, Aβ WT and LLV16, are not interacting. Hence, all
measurable FRET must be due to random colocalization. In contrast all measured FRET for
the Aβ WT samples (Figure14A and B) that are above the random FRET level must
consequently be due to a specific interaction. Hence the three experiments confirmed that the
FRET in liposome assay is able to distinguish between specific interactions and random
colocalization FRET.
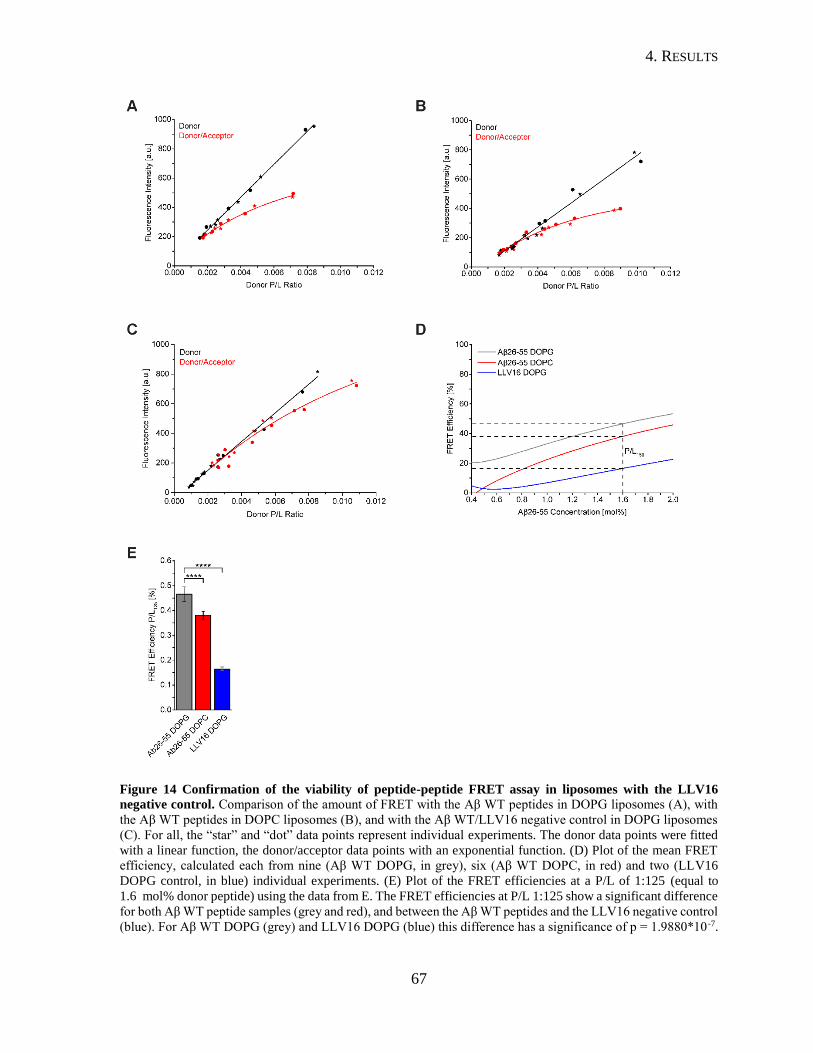
4. RESULTS
67
Figure 14 Confirmation of the viability of peptide-peptide FRET assay in liposomes with the LLV16
negative control. Comparison of the amount of FRET with the Aβ WT peptides in DOPG liposomes (A), with
the Aβ WT peptides in DOPC liposomes (B), and with the Aβ WT/LLV16 negative control in DOPG liposomes
(C). For all, the “star” and “dot” data points represent individual experiments. The donor data points were fitted
with a linear function, the donor/acceptor data points with an exponential function. (D) Plot of the mean FRET
efficiency, calculated each from nine (Aβ WT DOPG, in grey), six (Aβ WT DOPC, in red) and two (LLV16
DOPG control, in blue) individual experiments. (E) Plot of the FRET efficiencies at a P/L of 1:125 (equal to
1.6 mol% donor peptide) using the data from E. The FRET efficiencies at P/L 1:125 show a significant difference
for both Aβ WT peptide samples (grey and red), and between the Aβ WT peptides and the LLV16 negative control
(blue). For Aβ WT DOPG (grey) and LLV16 DOPG (blue) this difference has a significance of p = 1.9880*10 -7.
4. RESULTS
68
The difference between these three experiments described above gets even clearer in
Figure 14D, where the mean FRET efficiencies for the Aβ WT DOPG (grey curve), Aβ WT
DOPC (red curve) and the LLV16 DOPG control (blue curve) respectively, were plotted
against the total peptide concentration (Figure 14D). The huge difference between the Aβ
peptide based FRET assays (grey and red curves) and the LLV16 negative control (blue curve)
showed that true interactions result in a higher FRET compared to unspecific interactions.
Hence confirming that this peptide-peptide liposome FRET assay was viable for the
determination of specific TMD-TMD interactions of the APP TMD in liposomes.
In order to quantify these differences in FRET, the mean FRET P/L125 values were calculated
from the nine Aβ WT DOPG experiments, six Aβ WT DOPC experiments, and two LLV16
DOPG control experiments (Figure14E). The error bars represent the standard deviations of
these experiments. In this graph the great difference between the Aβ WT experiments and the
LLV16 control are clearly visible: the Aβ WT DOPG experiments had a significant difference
from the LLV16 control with a p-value of 1.9880*10-7. This result again strongly suggests that
the results for the Aβ peptides are based on specific interaction.
In conclusion the performed experiments for the establishment of a peptide-peptide FRET
assay in liposomes showed that this assay is not only highly reproducible, but also that the
measured FRET efficiencies are based on specific interactions between the Aβ peptides,
representing the dimerization of the APP TMD.

4. RESULTS
69
4.1.4. Influence of Lipid Composition on the Dimerization of the APP TMD
After the peptide-peptide FRET assay in liposomes had successfully been established, the
assay was suitable for application. Hence, several different lipid compositions were analyzed
for their impact on the homodimerization of the APP TMD in liposomes.
First liposomes of defined lipid compositions with correctly incorporated peptides had to be
produced. As host lipid, and therefore reference lipid, DOPC was chosen. The two
concentrations for the second lipid were chosen according to the know values in the literature,
which represent the amount of that specific lipid in either the plasma membrane or the
endosomal membrane (discussed in the introduction under 1.2.2). For the second lipid three
different species used: DOPE, DOPS, and cholesterol. These three lipids had already been
implicated to be associated with the development of AD (see also 1.2.2).
One of the most important controls for this FRET experiment was the analysis of the secondary
structure of the used Aβ WT and G33I mutant peptides, which were reconstituted into the
liposomes. This was important as the peptide-peptide FRET assay is based on the assumption
that only peptide with a mainly α-helical secondary structure will be able to induce a reliable
FRET signal. Therefore, six individual CD measurements were performed for each lipid
composition, three of them with donor liposomes and three with donor/acceptor liposomes.
The results that are shown in Figure 15 indicated that no major differences could be detected
for the various lipid compositions and that both peptides, the Aβ WT and Aβ G33I mutant
showed a mainly α-helical structure (Figure 15A and C).
This was additionally confirmed through the analysis of the measured CD spectra by the
CDNN CD spectra deconvolution software. This analysis resulted in an α-helical content of
around 60-70% for the various lipid composition. Only a slight reduction in α-helicity could
be detected for the cholesterol samples of the Aβ WT peptide (Figure 15B).

4. RESULTS
70
Figure 15 Mean CD spectra and secondary structure composition of all lipid compositions investigated by
the peptide-peptide FRET assay in liposomes. (A) CD spectra of Aβ WT peptides in eight different lipid
compositions used for the peptide-peptide FRET assay in liposomes. The spectra represent the mean of six
individual measurements, three of which were performed with donor liposomes, and three with donor/acceptor
liposomes. Most spectra show a shape indicating a high amount of α-helicity, with the exception of the Chol40
sample which shows an increase in β-sheet content. (B) The individual CD spectra were analyzed for their
secondary structure composition using the CDNN CD spectra deconvolution software with the complex 33-base
spectra. The calculated values of the three secondary structure species, α-helix (red), β-sheet (blue) and random
coil (gray) are plotted in a bar graph, showing the mean of the six individual experiments and the standard
deviation. (C) CD spectra of G33I mutant peptides in eight different lipid compositions used for the peptide-
peptide FRET assay in liposomes. The spectra represent the mean of six individual measurements, three of which
were performed with donor liposomes, and three with donor/acceptor liposomes. (D) The secondary structure
composition of the liposomes containing G33I mutant peptides was calculated as described for B.
Additionally no difference could be detected between the Aβ WT and Aβ G33I peptides
(Figure 15B and D). This led to the conclusion that both peptides adopt a mainly α-helical
structure in liposomes and that a comparison of the FRET results of both peptides was possible.
It also confirmed that a difference measured in the FRET assay must be attributed to a
difference in dimerization, not in the amount of α-helicity, as both peptides were present in the
correct secondary structure state needed for the FRET assay.

4. RESULTS
71
With this successful confirmation, the FRET assays could be performed next using the chosen
lipid compositions. For this, samples consisting of Aβ WT and Aβ G33I peptides in DOPC,
5% DOPE (DOPE5), 25% DOPE (DOPE25), 5% DOPS (DOPS5), 20% DOPS (DOPS20),
20% cholesterol (Chol20) and 40% cholesterol (Chol40) were used. Additionally the Aβ WT
peptides, but not the Aβ G33I peptides, were also measured in POPC and DOPG liposomes,
as DOPG has no biological relevance and POPC experiments were performed as a control for
the influence of the acyl chain composition. The samples were all measured and the FRET
efficiencies then calculated as described in the methods section (see 3.10.2). The calculated
mean FRET efficiencies with standard deviations of these assays at a donor P/L ratio of 1:125
are shown in Figure 16.
Figure 16 Comparison of the FRET results of Aβ WT, Aβ G33I in various lipid compositions. The FRET
assay was performed at least six times for each lipid composition. Depicted are the means and the standard
deviations for the Aβ WT peptide (blue) and the Aβ G33I mutant peptide (red) at a donor P/L ratio of 1:125 in
the various lipid compositions. The LLV16 peptide (grey) was added as a negative control for this assay and was
measured in duplicates. Measurements were performed in liposomes consisting of either DOPC, POPC, DOPG,
5% DOPE (DOPE5), 25% DOPE (DOPE25), 5% DOPS (DOPS5), 20% DOPS (DOPS20), 20% cholesterol
(Chol20) or 40% cholesterol (Chol40). Only three lipid compositions showed a significant difference between
the WT and the G33I mutant peptides (PE5: p = 2.0464*10-5, PE25: p = 2.0011*10-2 and Chol40: p = 9.1565*10-3).
Both DOPE samples lowered the dimerization efficiency of the G33I mutant, while cholesterol lowered the
dimerization efficiency of the WT. All other lipid compositions did not show a significant difference between the
WT and the G33I peptides.
A P/L of 1:125 was chosen for the evaluation as only a few lipid compositions reached a FRET
efficiency of more than 50% in the used P/L range, which would have been needed for the
determination of the E50 value.
Additionally, almost all individual assays had reliable data points at the 1:125 P/L ratio, so that
the FRET efficiencies calculated from the curve fittings were based on real data and not on
extrapolated functions.
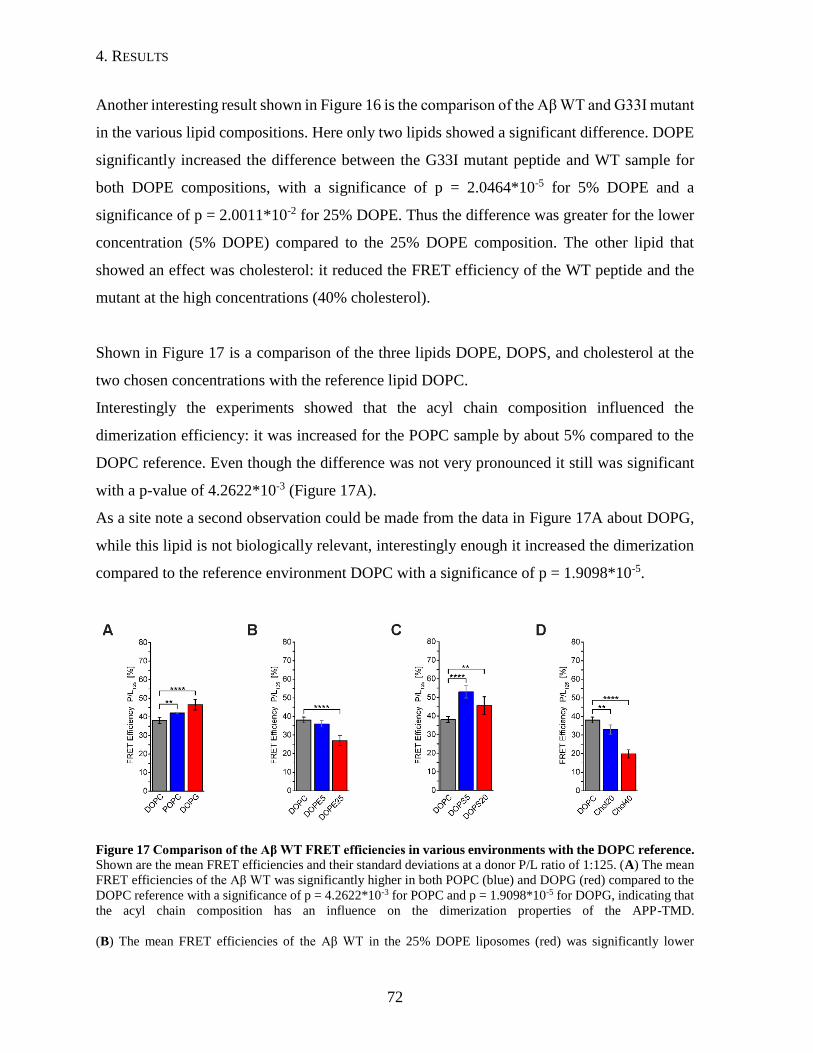
4. RESULTS
72
Another interesting result shown in Figure 16 is the comparison of the Aβ WT and G33I mutant
in the various lipid compositions. Here only two lipids showed a significant difference. DOPE
significantly increased the difference between the G33I mutant peptide and WT sample for
both DOPE compositions, with a significance of p = 2.0464*10-5 for 5% DOPE and a
significance of p = 2.0011*10-2 for 25% DOPE. Thus the difference was greater for the lower
concentration (5% DOPE) compared to the 25% DOPE composition. The other lipid that
showed an effect was cholesterol: it reduced the FRET efficiency of the WT peptide and the
mutant at the high concentrations (40% cholesterol).
Shown in Figure 17 is a comparison of the three lipids DOPE, DOPS, and cholesterol at the
two chosen concentrations with the reference lipid DOPC.
Interestingly the experiments showed that the acyl chain composition influenced the
dimerization efficiency: it was increased for the POPC sample by about 5% compared to the
DOPC reference. Even though the difference was not very pronounced it still was significant
with a p-value of 4.2622*10-3 (Figure 17A).
As a site note a second observation could be made from the data in Figure 17A about DOPG,
while this lipid is not biologically relevant, interestingly enough it increased the dimerization
compared to the reference environment DOPC with a significance of p = 1.9098*10-5.
Figure 17 Comparison of the Aβ WT FRET efficiencies in various environments with the DOPC reference. Shown are the mean FRET efficiencies and their standard deviations at a donor P/L ratio of 1:125. (A) The mean
FRET efficiencies of the Aβ WT was significantly higher in both POPC (blue) and DOPG (red) compared to the
DOPC reference with a significance of p = 4.2622*10-3 for POPC and p = 1.9098*10-5 for DOPG, indicating that
the acyl chain composition has an influence on the dimerization properties of the APP-TMD.
(B) The mean FRET efficiencies of the Aβ WT in the 25% DOPE liposomes (red) was significantly lower
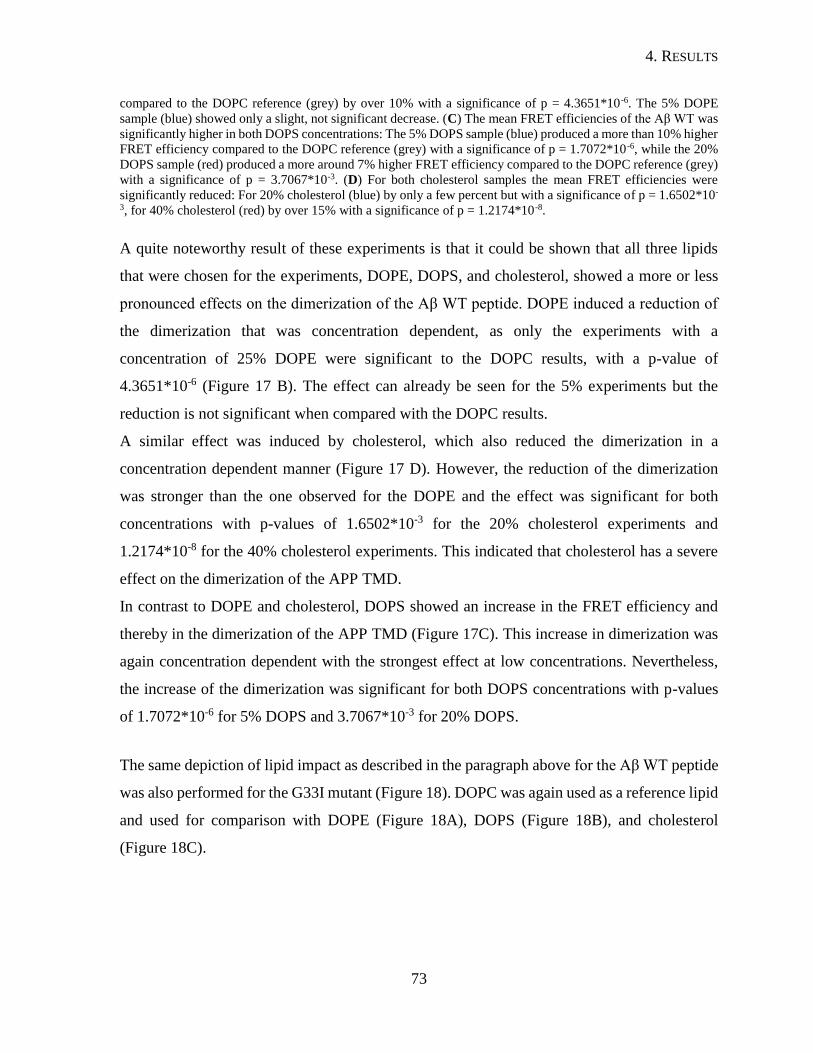
4. RESULTS
73
compared to the DOPC reference (grey) by over 10% with a significance of p = 4.3651*10-6. The 5% DOPE
sample (blue) showed only a slight, not significant decrease. (C) The mean FRET efficiencies of the Aβ WT was
significantly higher in both DOPS concentrations: The 5% DOPS sample (blue) produced a more than 10% higher
FRET efficiency compared to the DOPC reference (grey) with a significance of p = 1.7072*10-6, while the 20%
DOPS sample (red) produced a more around 7% higher FRET efficiency compared to the DOPC reference (grey)
with a significance of p = 3.7067*10-3. (D) For both cholesterol samples the mean FRET efficiencies were
significantly reduced: For 20% cholesterol (blue) by only a few percent but with a significance of p = 1.6502*10-
3, for 40% cholesterol (red) by over 15% with a significance of p = 1.2174*10-8.
A quite noteworthy result of these experiments is that it could be shown that all three lipids
that were chosen for the experiments, DOPE, DOPS, and cholesterol, showed a more or less
pronounced effects on the dimerization of the Aβ WT peptide. DOPE induced a reduction of
the dimerization that was concentration dependent, as only the experiments with a
concentration of 25% DOPE were significant to the DOPC results, with a p-value of
4.3651*10-6 (Figure 17 B). The effect can already be seen for the 5% experiments but the
reduction is not significant when compared with the DOPC results.
A similar effect was induced by cholesterol, which also reduced the dimerization in a
concentration dependent manner (Figure 17 D). However, the reduction of the dimerization
was stronger than the one observed for the DOPE and the effect was significant for both
concentrations with p-values of 1.6502*10-3 for the 20% cholesterol experiments and
1.2174*10-8 for the 40% cholesterol experiments. This indicated that cholesterol has a severe
effect on the dimerization of the APP TMD.
In contrast to DOPE and cholesterol, DOPS showed an increase in the FRET efficiency and
thereby in the dimerization of the APP TMD (Figure 17C). This increase in dimerization was
again concentration dependent with the strongest effect at low concentrations. Nevertheless,
the increase of the dimerization was significant for both DOPS concentrations with p-values
of 1.7072*10-6 for 5% DOPS and 3.7067*10-3 for 20% DOPS.
The same depiction of lipid impact as described in the paragraph above for the Aβ WT peptide
was also performed for the G33I mutant (Figure 18). DOPC was again used as a reference lipid
and used for comparison with DOPE (Figure 18A), DOPS (Figure 18B), and cholesterol
(Figure 18C).
4. RESULTS
74
DOPE showed a different result with the G33I mutant compared to the WT experiments as
discussed in the paragraph above (see Figure 17B for comparison). DOPE decreased the
dimerization of the G33I mutant peptide a lot stronger at the 5% DOPE concentration but to a
similar amount at the 25% one (Figure 18A). Both reductions were significant compared to the
DOPC reference with p-values of 2.2000*10-5 for the 5% DOPE sample and 2.7050*10-6 for
the 25% DOPE sample. In contrast to these pronounced differences, DOPS and cholesterol had
similar effects on both WT and mutant peptides (Figure 18B and C). DOPS induced an increase
of the dimerization compared to DOPC, with a stronger effect for the 5% DOPS concentration
(Figure 18B). The increase at both concentrations was again significant when compared to
DOPC with p-values of 2.4909*10-6 for the 5% DOPS experiments and 4.6087*10-4 for the
20% ones.
The results of the cholesterol samples showed again a concentration dependent decrease of the
dimerization, with similar reduction steps as for the Aβ WT experiments (Figure 18C). Both
reductions in FRET efficiency are significant to the DOPC reference with p-values of
1.4737*10-2 for the 20% cholesterol experiments and 2.1351*10-6 for the 40% ones.
Figure 18 Comparison of the Aβ G33I FRET efficiencies in DOPE, DOPS, and cholesterol with DOPC.
Shown are the mean FRET efficiencies and standard deviations at a donor P/L ratio of 1:125. (A) The mean FRET
efficiencies of the Aβ G33I mutant in DOPE showed a much stronger reduction compared to the Aβ WT
(Figure 17), as the addition of 5% DOPE (blue) to the liposomes showed already a reduction comparable with the
one that 25% DOPE showed for the WT. However, the reduction was nearly the same for the 25% DOPE (red)
experiments. Both are significant to the DOPC reference (grey) with p = 2.2000*10-5 for 5% DOPE and
p = 2.7050*10-6 for 25% DOPE. (B) Comparison between the DOPC reference (grey) and two different
concentrations of DOPS. 5% DOPS (blue) showed a significant increase in the FRET efficiency when compared
to the DOPC experiments with a significance of p = 2.4909*10-6 and a smaller increase in the FRET efficiency
for the 20% DOPS sample with a p-value of 4.6087*10-4.
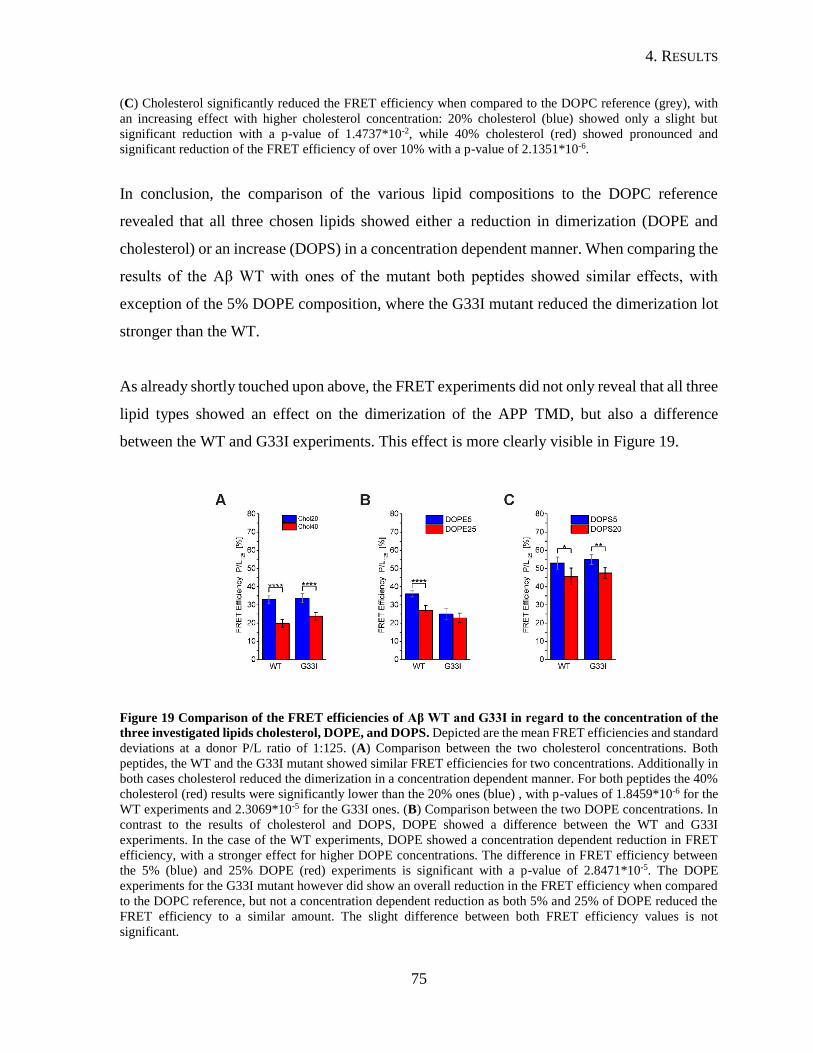
4. RESULTS
75
(C) Cholesterol significantly reduced the FRET efficiency when compared to the DOPC reference (grey), with
an increasing effect with higher cholesterol concentration: 20% cholesterol (blue) showed only a slight but
significant reduction with a p-value of 1.4737*10-2, while 40% cholesterol (red) showed pronounced and
significant reduction of the FRET efficiency of over 10% with a p-value of 2.1351*10-6.
In conclusion, the comparison of the various lipid compositions to the DOPC reference
revealed that all three chosen lipids showed either a reduction in dimerization (DOPE and
cholesterol) or an increase (DOPS) in a concentration dependent manner. When comparing the
results of the Aβ WT with ones of the mutant both peptides showed similar effects, with
exception of the 5% DOPE composition, where the G33I mutant reduced the dimerization lot
stronger than the WT.
As already shortly touched upon above, the FRET experiments did not only reveal that all three
lipid types showed an effect on the dimerization of the APP TMD, but also a difference
between the WT and G33I experiments. This effect is more clearly visible in Figure 19.
Figure 19 Comparison of the FRET efficiencies of Aβ WT and G33I in regard to the concentration of the
three investigated lipids cholesterol, DOPE, and DOPS. Depicted are the mean FRET efficiencies and standard
deviations at a donor P/L ratio of 1:125. (A) Comparison between the two cholesterol concentrations. Both
peptides, the WT and the G33I mutant showed similar FRET efficiencies for two concentrations. Additionally in
both cases cholesterol reduced the dimerization in a concentration dependent manner. For both peptides the 40%
cholesterol (red) results were significantly lower than the 20% ones (blue) , with p-values of 1.8459*10-6 for the
WT experiments and 2.3069*10-5 for the G33I ones. (B) Comparison between the two DOPE concentrations. In
contrast to the results of cholesterol and DOPS, DOPE showed a difference between the WT and G33I
experiments. In the case of the WT experiments, DOPE showed a concentration dependent reduction in FRET
efficiency, with a stronger effect for higher DOPE concentrations. The difference in FRET efficiency between
the 5% (blue) and 25% DOPE (red) experiments is significant with a p-value of 2.8471*10-5. The DOPE
experiments for the G33I mutant however did show an overall reduction in the FRET efficiency when compared
to the DOPC reference, but not a concentration dependent reduction as both 5% and 25% of DOPE reduced the
FRET efficiency to a similar amount. The slight difference between both FRET efficiency values is not
significant. .
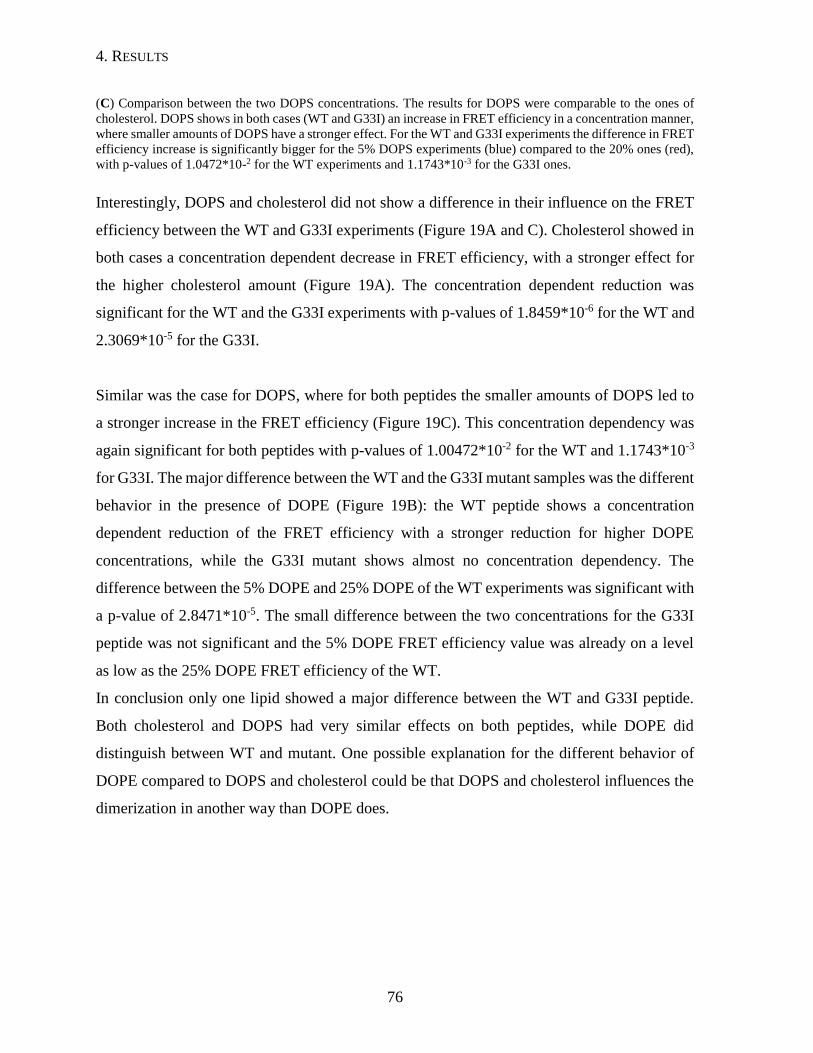
4. RESULTS
76
(C) Comparison between the two DOPS concentrations. The results for DOPS were comparable to the ones of
cholesterol. DOPS shows in both cases (WT and G33I) an increase in FRET efficiency in a concentration manner,
where smaller amounts of DOPS have a stronger effect. For the WT and G33I experiments the difference in FRET
efficiency increase is significantly bigger for the 5% DOPS experiments (blue) compared to the 20% ones (red),
with p-values of 1.0472*10-2 for the WT experiments and 1.1743*10-3 for the G33I ones.
Interestingly, DOPS and cholesterol did not show a difference in their influence on the FRET
efficiency between the WT and G33I experiments (Figure 19A and C). Cholesterol showed in
both cases a concentration dependent decrease in FRET efficiency, with a stronger effect for
the higher cholesterol amount (Figure 19A). The concentration dependent reduction was
significant for the WT and the G33I experiments with p-values of 1.8459*10-6 for the WT and
2.3069*10-5 for the G33I.
Similar was the case for DOPS, where for both peptides the smaller amounts of DOPS led to
a stronger increase in the FRET efficiency (Figure 19C). This concentration dependency was
again significant for both peptides with p-values of 1.00472*10-2 for the WT and 1.1743*10-3
for G33I. The major difference between the WT and the G33I mutant samples was the different
behavior in the presence of DOPE (Figure 19B): the WT peptide shows a concentration
dependent reduction of the FRET efficiency with a stronger reduction for higher DOPE
concentrations, while the G33I mutant shows almost no concentration dependency. The
difference between the 5% DOPE and 25% DOPE of the WT experiments was significant with
a p-value of 2.8471*10-5. The small difference between the two concentrations for the G33I
peptide was not significant and the 5% DOPE FRET efficiency value was already on a level
as low as the 25% DOPE FRET efficiency of the WT.
In conclusion only one lipid showed a major difference between the WT and G33I peptide.
Both cholesterol and DOPS had very similar effects on both peptides, while DOPE did
distinguish between WT and mutant. One possible explanation for the different behavior of
DOPE compared to DOPS and cholesterol could be that DOPS and cholesterol influences the
dimerization in another way than DOPE does.
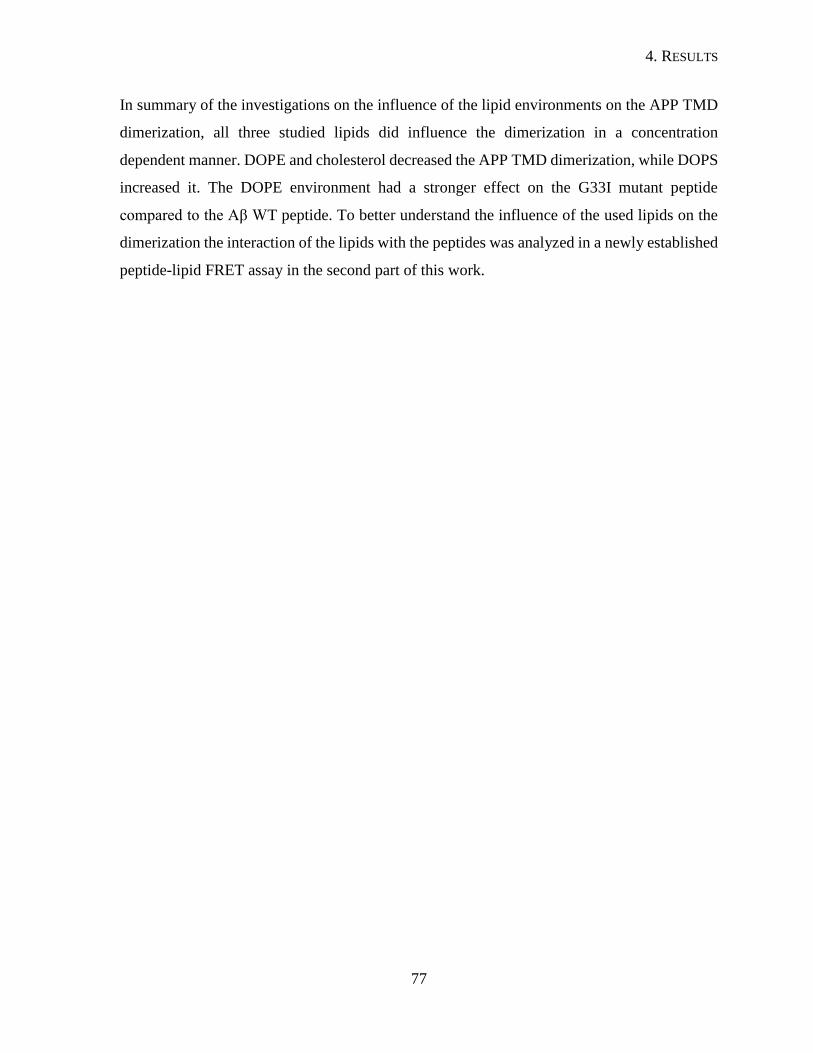
4. RESULTS
77
In summary of the investigations on the influence of the lipid environments on the APP TMD
dimerization, all three studied lipids did influence the dimerization in a concentration
dependent manner. DOPE and cholesterol decreased the APP TMD dimerization, while DOPS
increased it. The DOPE environment had a stronger effect on the G33I mutant peptide
compared to the Aβ WT peptide. To better understand the influence of the used lipids on the
dimerization the interaction of the lipids with the peptides was analyzed in a newly established
peptide-lipid FRET assay in the second part of this work.
4. RESULTS
78
4.2. Peptide/Lipid FRET Assays
As shown in the section on the peptide-peptide FRET assay, all three investigated lipids
influenced the dimerization of the APP TMD in liposomes. Both cholesterol and DOPE
decreased the dimerization in a concentration dependent manner, while DOPS increased it.
The biggest difference between the Aβ WT and Aβ G33I mutant peptides could be seen for the
DOPE experiments. To further understand the influence of these lipids on the dimerization and
to get a clue if the different behavior of DOPE on the two peptides can be explained by a
different mode of action, the interaction of these lipid species with the peptides were analyzed
in a peptide-lipid FRET assay in liposomes.
4.2.1. Establishment of a Peptide/Lipid FRET Assay in Liposomes
The basic principle of the peptide-lipid FRET assay had already been established for other
peptides, like the LV-peptides. However, the first assays revealed some aspects that were
previously not perfectly considered. One major problem that had to be solved was the correct
determination of the actual donor to acceptor ratio at each measurement point, as the acceptor
labeled phospholipids did not show comparable incorporation rates and the loss of liposomes
also varied, which led to a loss of donor in the course of this assay.
To overcome the latter challenge, a fluorophore labeled lipid with absorbance and fluorescence
maxima beyond the ones of the donor and acceptor fluorophores was used for the
quantification of liposomes present in the sample: an Atto647N fluorophore.
The problem with the incorporation efficiencies of the acceptor labeled lipids could be solved
by including an NBD quantification step after each round of NBD-lipid incorporation. With
the so determined exact concentrations of donor peptide and acceptor lipid at each donor-to-
acceptor ratio step, the peptide-lipid FRET assays were highly reproducible and reliable. The
differences in the incorporation efficiencies of the three NBD-labeled lipids are shown in
Figure 20.

4. RESULTS
79
Figure 20 Incorporation efficiencies of the NBD-labeled phospholipids PC, PS, and PE. The incorporation
efficiency of the NBD-labeled phospholipids was calculated using the determined amount of lipid actually
incorporated and the nominally used amount. The data points represent the mean of four individual experiments
and their standard deviations. For lipids the incorporation efficiency got worse with increasing D:A ratios.
NBD-PC and NBD-PS were overall very similar in their incorporation efficiencies, while NBD-PE could be
incorporated less efficient. To compensate for the poor incorporation efficiency of NBD-PE, the nominal amount
was increased as well as the number of incorporation steps.
Plotted in Figure 20 are the percentages of incorporated lipid normalized to the nominally used
amount as means with standard deviations of four individual experiments. As can be seen from
this figure, the incorporation efficiency got worse for all lipids with increasing donor to
acceptor ratios. The NBD-PC lipid and the NBD-PS lipid had overall better incorporation
efficiencies compared to the NBD-PE lipid, for which higher donor to acceptor ratios resulted
in incorporation efficiencies as low as 60%.
The results confirm that it was absolutely vital to determine the actual amount of incorporated
lipid after each incorporation step in order to make sure that the data analysis was not based
on wrongly assumed lipid concentrations. The correct lipid concentrations are important for a
proper analysis of the peptide-lipid FRET.
A similar problem had to be faced for the peptide-lipid FRET assays performed with the
NBD-labeled cholesterol. Due to the higher hydrophobicity of cholesterol compared to the
phospholipids, the NBD-labeled cholesterol could not be incorporated into the liposomes by
incubating the liposomes with a dried film of these lipids. This problem was solved by the
addition of the NBD-cholesterol dissolved in ethanol. To check that the addition of ethanol did
not influence the FRET results a similar assay was performed with NBD-PC and the results
perfectly matched the ones produced with the dried lipid film (Figure 21).
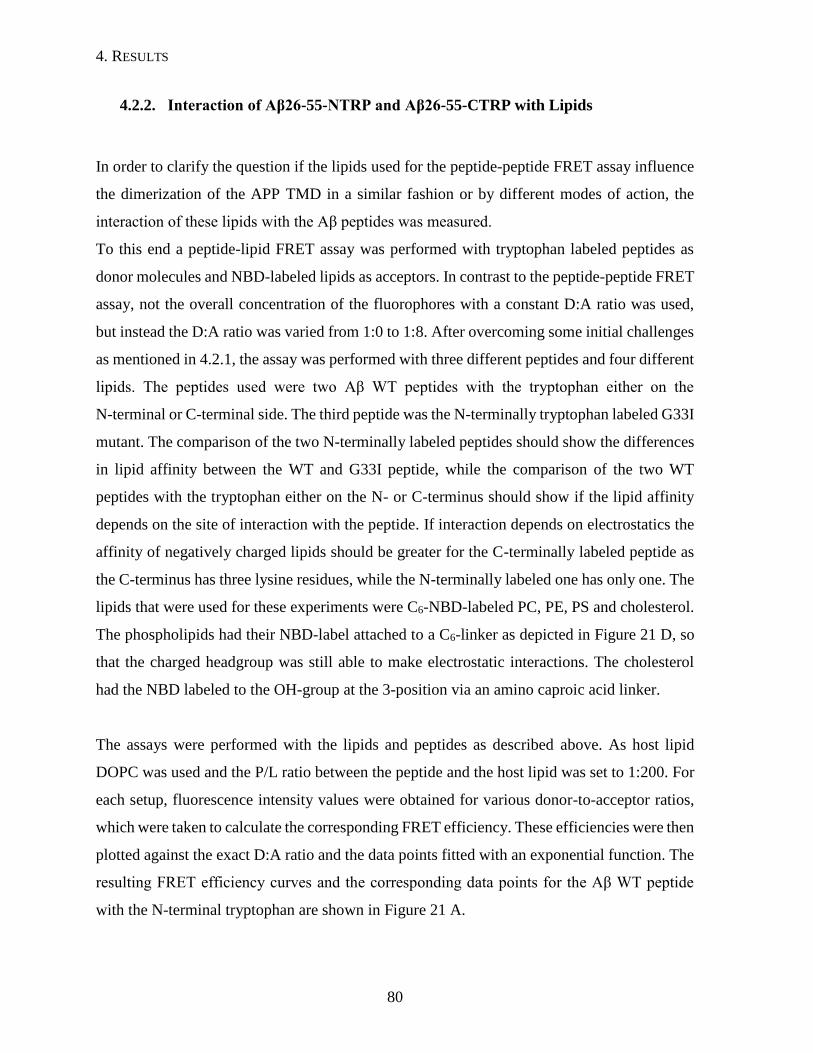
4. RESULTS
80
4.2.2. Interaction of Aβ26-55-NTRP and Aβ26-55-CTRP with Lipids
In order to clarify the question if the lipids used for the peptide-peptide FRET assay influence
the dimerization of the APP TMD in a similar fashion or by different modes of action, the
interaction of these lipids with the Aβ peptides was measured.
To this end a peptide-lipid FRET assay was performed with tryptophan labeled peptides as
donor molecules and NBD-labeled lipids as acceptors. In contrast to the peptide-peptide FRET
assay, not the overall concentration of the fluorophores with a constant D:A ratio was used,
but instead the D:A ratio was varied from 1:0 to 1:8. After overcoming some initial challenges
as mentioned in 4.2.1, the assay was performed with three different peptides and four different
lipids. The peptides used were two Aβ WT peptides with the tryptophan either on the
N-terminal or C-terminal side. The third peptide was the N-terminally tryptophan labeled G33I
mutant. The comparison of the two N-terminally labeled peptides should show the differences
in lipid affinity between the WT and G33I peptide, while the comparison of the two WT
peptides with the tryptophan either on the N- or C-terminus should show if the lipid affinity
depends on the site of interaction with the peptide. If interaction depends on electrostatics the
affinity of negatively charged lipids should be greater for the C-terminally labeled peptide as
the C-terminus has three lysine residues, while the N-terminally labeled one has only one. The
lipids that were used for these experiments were C6-NBD-labeled PC, PE, PS and cholesterol.
The phospholipids had their NBD-label attached to a C6-linker as depicted in Figure 21 D, so
that the charged headgroup was still able to make electrostatic interactions. The cholesterol
had the NBD labeled to the OH-group at the 3-position via an amino caproic acid linker.
The assays were performed with the lipids and peptides as described above. As host lipid
DOPC was used and the P/L ratio between the peptide and the host lipid was set to 1:200. For
each setup, fluorescence intensity values were obtained for various donor-to-acceptor ratios,
which were taken to calculate the corresponding FRET efficiency. These efficiencies were then
plotted against the exact D:A ratio and the data points fitted with an exponential function. The
resulting FRET efficiency curves and the corresponding data points for the Aβ WT peptide
with the N-terminal tryptophan are shown in Figure 21 A.

4. RESULTS
81
Figure 21 FRET efficiencies of the peptide-lipid FRET assay for the N-terminally labeled Aβ WT peptide
(NTRP). The peptide-lipid FRET assay was performed for various different donor-to-acceptor ratios with four
different lipid, NBD-PC, NBD-PE, NBD-PS, and NBD-cholesterol. As host lipid DOPC was used and the P/L
ratio between the host lipid and the peptide was set to 1:200. The assay was performed six times for each lipid.
(A) The calculated FRET efficiencies were plotted against the determined mol% concentration of NBD-labeled
lipid and the data points were fitted using an exponential function. Depicted is the mean FRET efficiency curve
fitted through the data points of all six individual experiments. The three phospholipids NBD-PC (grey), NBD-
PE (red), and NBD-PS (blue) reached very high FRET efficiencies in the used D:A range, while the NBD-
cholesterol (orange) did not even reach a FRET efficiency of 50% (dashed line). (B) For a better comparison, the
concentration of NBD-labeled lipid at a FRET efficiency of 50% (E50 value) was calculated for all individual
experiments as mean E50 value with standard deviation. The higher the E50 concentration, the lower is the affinity
of the lipids towards the peptide. The experiments showed that NBD-PE (red) had the highest affinity towards
the peptide, while NBD-PS (blue) and NBD-PC (grey) were less affine, with NBD-PC having the lowest affinity.
NBD-cholesterol is not shown in this graph as it did not reach a FRET efficiency of 50% in the used D:A ratio
range. The difference in the E50 values of NBD-PE and PS were both significant when compared to NBD-PC with
p-values of 1.9320*10-9 for NBD-PE and 1.0676*10-7 for NBD-PS. (C) In order to also include NBD-cholesterol
into the data evaluation, the FRET efficiency at a D:A ratio of 2.7 mol% was used. The chosen concentration of
2.7 mol% is equal to the published KD value of cholesterol and the C99 protein (121). Depicted are the mean FRET
efficiencies and standard deviations of the individual experiments at a NBD concentration of 2.7 mol%. At such
a high NBD-lipid concentration the FRET efficiencies of the phospholipids were very similar, with NBD-PE (red)
and NBD-PS (blue) being close to 100% and showing no difference. Only NBD-PC (grey) had still a significantly
lower binding compared to PE and PS with p-values of 5.5153*10-4 for PS and 8.9443*10-7 for PE. Interestingly
the affinity of NBD-cholesterol (orange) was a lot lower than the ones of the phospholipids with a significance
of p = 3.3371*10-12 compared to NBD-PC.
As can be seen from Figure 21A, the experiments with the phospholipids reached almost a
FRET efficiency of 100% in the used D:A ratio range. Nevertheless, differences between the
three lipids could be detected. The fitted curves illustrate that NBD-PE seemed to have the
highest affinity to the Aβ WT peptide, with the tryptophan at the N-terminus. A low efficient
interaction was observed for the NBD-PS lipid, followed by NBD-PC with the lowest affinity
of the three phospholipids. Interestingly, the NBD-cholesterol had a very low affinity as it did
not even reach a FRET affinity of 50% in the used D:A ratio range.

4. RESULTS
82
For a better comparison of the affinities of the lipids to the Aβ WT (NTRP) peptide, the
concentrations of NBD-lipid at a FRET efficiency of 50% (E50) was used. The difference
between the three phospholipids can thus be compared more precisely. Shown in Figure 21B
are the mean E50 concentrations and standard deviations of six individual experiments each for
the three phospholipids NBD-PE, NBD-PC, and NBD-PS. NBD-cholesterol was not included
as it did not reach a FRET efficiency of 50%. The comparison of the concentrations of NBD-
PE and NBD-PC at the point where they reached a FRET efficiency of 50% shows that NBD-
PE showed double the affinity towards the peptide as NBD-PC. NBD-PS was in the middle
between NBD-PE and NBD-PC with a medium affinity. Both NBD-PE and NBD-PS show a
significant difference towards NBD-PC with p-values of 1.9320*10-9 for NBD-PE and
1.0676*10-7 for NBD-PS.
To also be able to include the NBD-cholesterol into the evaluation, the FRET efficiencies at
2.7 mol% NBD-lipid were calculated as mean with standard deviation from the six individual
measurements per lipid (Figure 21C). The value of 2.7 mol% was chosen as it represents the
published affinity of NBD-cholesterol to the C99 protein (121). Since 2.7 mol% is a quite high
concentration, the three phospholipids got close to a FRET efficiency of 100%. NBD-PE and
NBD-PS showed almost identical affinities and only NBD-PC showed a slightly lower affinity.
In contrast, NBD-cholesterol showed by far a lower apparent binding when compared to the
phospholipids. All differences were tested to be significant compared to NBD-PC with a p-
value of 5.5153*10-4 for NBD-PS, 8.9443*10-7 for NBD-PE, and 3.3371*10-12 for NBD-
cholesterol.
In conclusion these results illustrate that cholesterol has clearly a much lower apparent binding
towards the Aβ WT peptide with the N-terminal tryptophan, compared with the phospholipids.
But also the phospholipids showed significant differences, with PE having the highest affinity,
followed by PS and PC, respectively.
To further analyze the mode of interaction between the lipids and the peptide the peptide-lipid
FRRET assays were performed with the C-terminally labeled Aβ WT peptide.
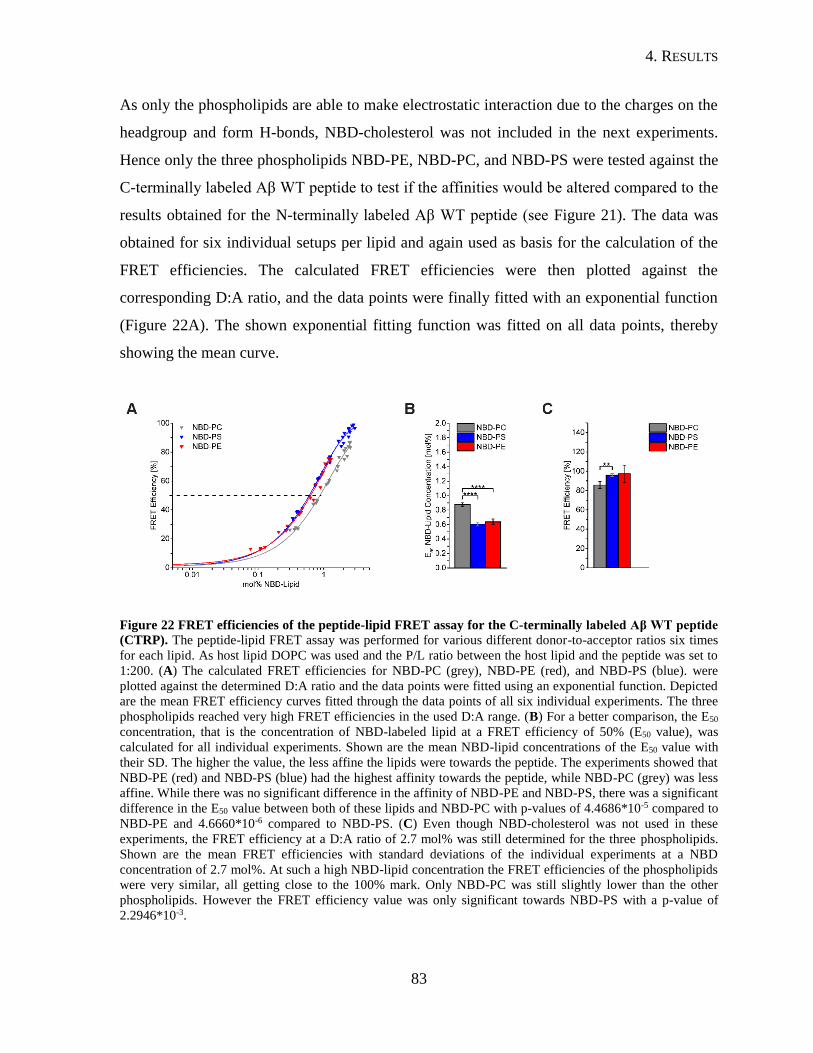
4. RESULTS
83
As only the phospholipids are able to make electrostatic interaction due to the charges on the
headgroup and form H-bonds, NBD-cholesterol was not included in the next experiments.
Hence only the three phospholipids NBD-PE, NBD-PC, and NBD-PS were tested against the
C-terminally labeled Aβ WT peptide to test if the affinities would be altered compared to the
results obtained for the N-terminally labeled Aβ WT peptide (see Figure 21). The data was
obtained for six individual setups per lipid and again used as basis for the calculation of the
FRET efficiencies. The calculated FRET efficiencies were then plotted against the
corresponding D:A ratio, and the data points were finally fitted with an exponential function
(Figure 22A). The shown exponential fitting function was fitted on all data points, thereby
showing the mean curve.
Figure 22 FRET efficiencies of the peptide-lipid FRET assay for the C-terminally labeled Aβ WT peptide
(CTRP). The peptide-lipid FRET assay was performed for various different donor-to-acceptor ratios six times
for each lipid. As host lipid DOPC was used and the P/L ratio between the host lipid and the peptide was set to
1:200. (A) The calculated FRET efficiencies for NBD-PC (grey), NBD-PE (red), and NBD-PS (blue). were
plotted against the determined D:A ratio and the data points were fitted using an exponential function. Depicted
are the mean FRET efficiency curves fitted through the data points of all six individual experiments. The three
phospholipids reached very high FRET efficiencies in the used D:A range. (B) For a better comparison, the E50
concentration, that is the concentration of NBD-labeled lipid at a FRET efficiency of 50% (E50 value), was
calculated for all individual experiments. Shown are the mean NBD-lipid concentrations of the E50 value with
their SD. The higher the value, the less affine the lipids were towards the peptide. The experiments showed that
NBD-PE (red) and NBD-PS (blue) had the highest affinity towards the peptide, while NBD-PC (grey) was less
affine. While there was no significant difference in the affinity of NBD-PE and NBD-PS, there was a significant
difference in the E50 value between both of these lipids and NBD-PC with p-values of 4.4686*10-5 compared to
NBD-PE and 4.6660*10-6 compared to NBD-PS. (C) Even though NBD-cholesterol was not used in these
experiments, the FRET efficiency at a D:A ratio of 2.7 mol% was still determined for the three phospholipids.
Shown are the mean FRET efficiencies with standard deviations of the individual experiments at a NBD
concentration of 2.7 mol%. At such a high NBD-lipid concentration the FRET efficiencies of the phospholipids
were very similar, all getting close to the 100% mark. Only NBD-PC was still slightly lower than the other
phospholipids. However the FRET efficiency value was only significant towards NBD-PS with a p-value of
2.2946*10-3.

4. RESULTS
84
In comparison to the data with the N-terminally labeled peptide, the affinities of the
phospholipids changed for the C-terminal tryptophan peptide (Figure 22A). Even though the
curves look similar, the comparison of the E50 values shows, that PE lost some of its affinity,
while PS gained a lot, being on a similar level as PE (Figure 22B). Also PC gained some
affinity, but still has the lowest of the three phospholipids. Both PE and PS showed a significant
difference compared to PC with p-values of 4.4686*10-5 for PE and 4.6660*10-6 for PS.
The analysis of the FRET efficiencies at a NBD-lipid concentration of 2.7 mol% (Figure 22C)
showed no big difference for the C-terminally labeled peptide compared to the values for the
N-terminally labeled peptide. This might be also due to the fact that the 2.7 mol% are in a
saturated concentration range and hence differences, if present, cannot be detected any longer.
In order to check whether the G33I mutation influences the lipid affinities, the peptide-lipid
FRET assays were next performed with the N-terminally labeled G33I mutant peptide. If the
dimerization were to influence the affinities, then this should be detectable with this assay.
To this end, the FRET experiments for the N-terminally labeled Aβ G33I peptide with the
different NBD-lipids were performed and the corresponding FRET efficiencies calculated and
plotted with fitted curves (Figure 23A). Again, the experiments with the phospholipids reached
almost a FRET efficiency of 100% in the used D:A ratio range, and differences between the
three lipids could be detected: the fitted curves illustrate that NBD-PE seemed to have the
highest affinity to the Aβ G33I peptide. A bit lower affinity was shown by the NBD-PS lipid,
followed by NBD-PC with the lowest affinity of the three phospholipids.
The overall appearance of the FRET efficiency curves was very similar to the ones of the
N-terminally labeled WT peptide (see Figure 21 for comparison). Also comparable to these
experiments is the FRET efficiency of the NBD-cholesterol, which had a very low apparent
binding as it did not even reach the 50% FRET-efficiency mark (dashed line in Figure 23A) in
the used D:A ratio range.
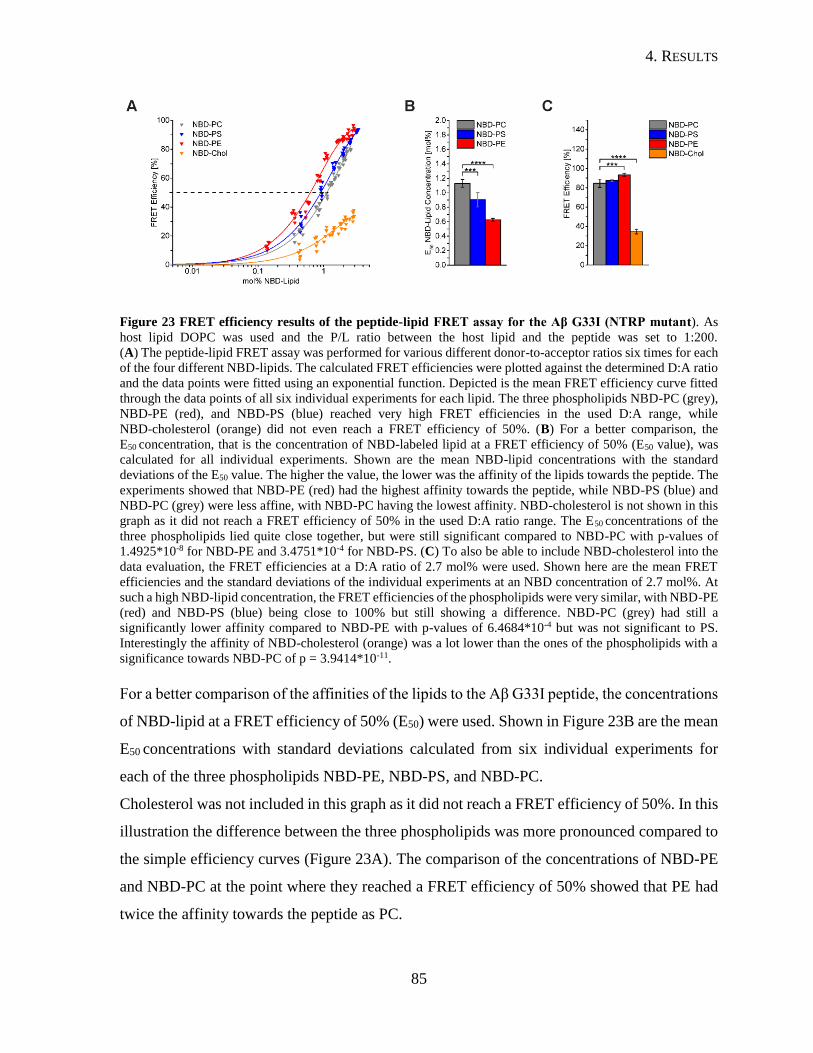
4. RESULTS
85
Figure 23 FRET efficiency results of the peptide-lipid FRET assay for the Aβ G33I (NTRP mutant). As
host lipid DOPC was used and the P/L ratio between the host lipid and the peptide was set to 1:200.
(A) The peptide-lipid FRET assay was performed for various different donor-to-acceptor ratios six times for each
of the four different NBD-lipids. The calculated FRET efficiencies were plotted against the determined D:A ratio
and the data points were fitted using an exponential function. Depicted is the mean FRET efficiency curve fitted
through the data points of all six individual experiments for each lipid. The three phospholipids NBD-PC (grey),
NBD-PE (red), and NBD-PS (blue) reached very high FRET efficiencies in the used D:A range, while
NBD-cholesterol (orange) did not even reach a FRET efficiency of 50%. (B) For a better comparison, the
E50 concentration, that is the concentration of NBD-labeled lipid at a FRET efficiency of 50% (E50 value), was
calculated for all individual experiments. Shown are the mean NBD-lipid concentrations with the standard
deviations of the E50 value. The higher the value, the lower was the affinity of the lipids towards the peptide. The
experiments showed that NBD-PE (red) had the highest affinity towards the peptide, while NBD-PS (blue) and
NBD-PC (grey) were less affine, with NBD-PC having the lowest affinity. NBD-cholesterol is not shown in this
graph as it did not reach a FRET efficiency of 50% in the used D:A ratio range. The E50 concentrations of the
three phospholipids lied quite close together, but were still significant compared to NBD-PC with p-values of
1.4925*10-8 for NBD-PE and 3.4751*10-4 for NBD-PS. (C) To also be able to include NBD-cholesterol into the
data evaluation, the FRET efficiencies at a D:A ratio of 2.7 mol% were used. Shown here are the mean FRET
efficiencies and the standard deviations of the individual experiments at an NBD concentration of 2.7 mol%. At
such a high NBD-lipid concentration, the FRET efficiencies of the phospholipids were very similar, with NBD-PE
(red) and NBD-PS (blue) being close to 100% but still showing a difference. NBD-PC (grey) had still a
significantly lower affinity compared to NBD-PE with p-values of 6.4684*10-4 but was not significant to PS.
Interestingly the affinity of NBD-cholesterol (orange) was a lot lower than the ones of the phospholipids with a
significance towards NBD-PC of p = 3.9414*10-11.
For a better comparison of the affinities of the lipids to the Aβ G33I peptide, the concentrations
of NBD-lipid at a FRET efficiency of 50% (E50) were used. Shown in Figure 23B are the mean
E50 concentrations with standard deviations calculated from six individual experiments for
each of the three phospholipids NBD-PE, NBD-PS, and NBD-PC.
Cholesterol was not included in this graph as it did not reach a FRET efficiency of 50%. In this
illustration the difference between the three phospholipids was more pronounced compared to
the simple efficiency curves (Figure 23A). The comparison of the concentrations of NBD-PE
and NBD-PC at the point where they reached a FRET efficiency of 50% showed that PE had
twice the affinity towards the peptide as PC.

4. RESULTS
86
Both NBD-PE and NBD-PS showed a significant difference towards NBD-PC with p-values
of 1.4925*10-8 and 3.4751*10-4 respectively.
In order to be able to include also the NBD-cholesterol into this evaluation, the mean FRET
efficiencies and standard deviations at 2.7 mol% NBD-lipid were calculated for the six
individual experiments (Figure 23C). Since 2.7 mol% is a quite high concentration, the three
phospholipids got close to a FRET efficiency of 100%. NBD-PE and NBD-PS seemed to be
almost identical in binding efficiencies and only NBD-PC showed a slightly lower binding
efficiency. In contrast, NBD-cholesterol had a by far lower apparent binding when compared
to the phospholipids. Both, NBD-PE and NBD-cholesterol showed a significant difference
compared to NBD-PC with p-values of 6.4684*10-4 and 3.9414*10-11 respectively.
In conclusion these results illustrate that cholesterol had clearly a much lower apparent binding
towards the Aβ G33I peptide compared with the phospholipids. This result was very similar to
the one obtained for the WT peptide. Also the phospholipids showed significant differences
between themselves, with NBD-PE having the highest affinity, followed by NBD-PS and
NBD-PC, respectively.
In summary of all data presented in this section, the peptide-lipid FRET assays showed that
the affinities of all four analyzed lipid species were very similar between the N-terminally
labeled Aβ WT and G33I peptides. This result suggests that the mutated Gly33 in the GxxxG
motif does not influence the affinity of the lipids towards the peptide. On the other hand, it
suggests that the differences in the dimerization efficiencies seen for the different lipid
environments were not cause by changes in the affinity of one and the same interface, but
rather indicate that several different dimerization interfaces are present which is chosen
according to the lipid environment: in some environments it seems that the GxxxG motif is
used, while in others different interfaces are utilized.

4. RESULTS
87
4.3. Reconstitution of the Presenilin Transmembrane Peptides into
Liposomes
A recently published paper suggests that the C99 can only be cleaved sufficiently as a
monomer, contradicting previously published experiments (271, 272). If these experiments could
be confirmed, meaning that APP is cleaved only as a monomer and not as a dimer, the role of
the two consecutive GxxxG motifs concerning the proteolytic processing would drastically
change. In this case the lipid composition of the membrane would determines if C99 is present
as a monomer or dimer and thus could be cleaved by the γ-secretase or not. Another aspect
comes in focus: the analysis of the primary sequence of presenilin’s transmembrane domains
showed that some of them also contain GxxxG or (A/S)xxxG motifs. The presenilin TMDs
having such motifs are TMD7, 8 and 9. These three transmembrane domains have been
implicated in previous experiments to be important for the substrate recognition (218-221).
Because of this it stands to reason that the APP TMD could form a heterodimer with one of
these TMDs in substrate recognition.
To test this heterodimerization, all nine transmembrane domains of presenilin were used for
the design of 31 amino acid long peptides that each possesses a single tryptophan as donor for
a peptide-peptide heterodimerization assay. In this assay the heterodimerization of the nine
presenilin TMDs with the APP TMD should be tested in complex lipid environments that
mimic the lipid composition of the early and late endosomes. A first and very important control
for the viability of such an assay is the measurement of the incorporation efficiencies of these
peptides into the liposomes as well as their secondary structure content. The determination of
the secondary structure is so important as only correctly incorporated and therefore mainly α-
helical peptides are able to produce reliable and reproducible FRET signals. The results of
these measurements are shown in the sections below.

4. RESULTS
88
4.3.1. Reconstitution into Early- and Late-Endosomal Lipid Composition Liposomes
To establish such a heterodimerization FRET assay as described above, first the reconstitution
efficiencies of the presenilin TMD peptides had to be checked. This was very important as it
is known from the literature that the reconstitution of single transmembrane domains of a
polytopic membrane protein can be very difficult and inefficient, because in vivo the
incorporation of a single TMD is often mutually dependent on the surrounding TMDs. It was
therefore unclear whether the presenilin TMDs could easily be incorporated or if such a
cooperative effect is mandatory for correct and efficient incorporation.
To test this, all nine TMDs were individually reconstituted into liposomes composed of lipids
mimicking either the composition of early or of late endosomes using four or five different
lipids respectively. These two compartments are likely the site of γ-secretase cleavage (199, 299,
305, 306). The incorporation efficiencies were determined by measuring the P/L ratios as well as
the secondary structure by CD spectroscopy (Figure 24). The nominal P/L ratio was 1:200 for
all liposome preparations, while the actual determined P/L ratio was in most cases between
1:400 and 1:800.
As can be seen from the CD spectra, the incorporation of the presenilin TMDs into liposomes
with a lipid composition similar to the one of early endosomes did not work very well (Figure
24A). The CD spectra shown represent the mean of two individual experiments. Most of the
shown spectra were very noisy due to the low amount of peptide incorporated. Only a few
TMD peptides showed a good incorporation. These were TMDs 1, 6 and 8.
Even though the CD spectra were very noisy, an evaluation with the CDNN CD spectra
deconvolution software was performed and depicted as the mean secondary structure content
with standard deviations of two individual experiments (Figure 24B). This evaluation
confirmed the finding that most of the peptides did not incorporate very well with the exception
for TMDs 1, 6 and 8, which were the only ones showing a sufficient amount of α-helicity.
All other peptides showed an amount of α-helicity of 50% or less, while the amount of β-sheet
and random coil contents were increased. This amount would hardly be sufficient for the assay.
A similar picture could be seen for the experiments with liposomes representing the late
endosomal lipid composition. Shown in Figure 24C are the mean CD spectra with standard
deviations of two individual experiments.

4. RESULTS
89
Again some of the peptides showed very noisy spectra but the overall quality was slightly
better than the one of the early endosomal liposomes. Especially TMDs 1, 2, 5, 6 and 8 showed
a relatively good CD spectrum.
For the experiments with the late endosomal lipid composition, the CD spectra of TMDs 1, 2,
5, 6 and 8 looked better than in the early endosome composition, which is even clearer in the
evaluated data, where the mean secondary structure contents with standard deviations of two
individual experiments have been calculated (Figure 24D): TMDs 1, 2, 5, 6 and 8 show over
60% α-helicity, while unfortunately the four other TMDs have α-helicity of 50% or less.
Figure 24 CD spectra of the nine presenilin TMDs in early and late endosomal lipid liposomes. (A) The CD
spectra are the mean of two individual measurements of the nine TMDs of presenilin reconstituted into liposomes
mimicking the lipid composition of early endosomes. Most of the spectra are very noisy due to the low
incorporation efficiencies, with exception of the ones for TMDs 1, 6 and 8. .
(B) Evaluation of the secondary structure content of the CD spectra shown in A, confirming that only TMDs 1, 6
and 8 could be incorporated with an α-helicity above 50%. The bars represent the mean of two individual
experiments and their standard deviations.(C) The CD spectra represent the mean of two individual measurements
of the nine TMDs of presenilin reconstituted into liposomes mimicking the lipid composition of late endosomes.
In comparison to the early endosomal lipid composition in A, the incorporation here worked slightly better as
TMDs 1, 2, 5, 6, and 8 looked better. (D) Evaluation of the secondary structure content of the CD spectra shown
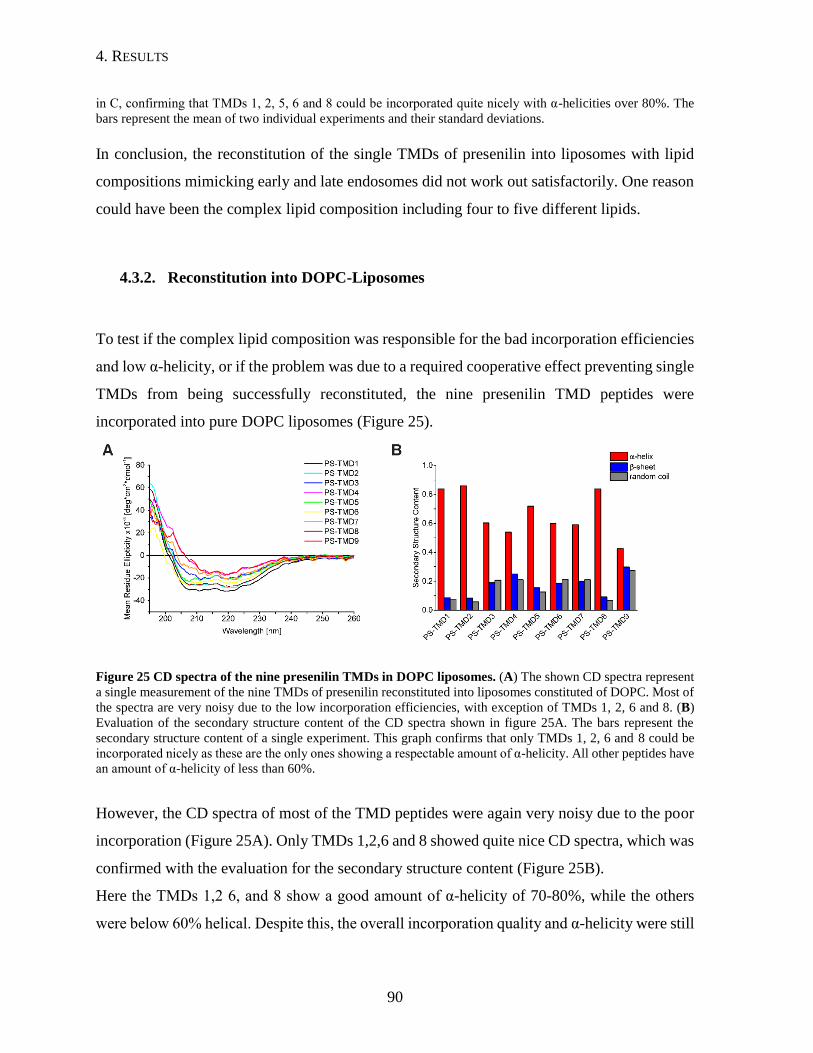
4. RESULTS
90
in C, confirming that TMDs 1, 2, 5, 6 and 8 could be incorporated quite nicely with α-helicities over 80%. The
bars represent the mean of two individual experiments and their standard deviations.
In conclusion, the reconstitution of the single TMDs of presenilin into liposomes with lipid
compositions mimicking early and late endosomes did not work out satisfactorily. One reason
could have been the complex lipid composition including four to five different lipids.
4.3.2. Reconstitution into DOPC-Liposomes
To test if the complex lipid composition was responsible for the bad incorporation efficiencies
and low α-helicity, or if the problem was due to a required cooperative effect preventing single
TMDs from being successfully reconstituted, the nine presenilin TMD peptides were
incorporated into pure DOPC liposomes (Figure 25).
Figure 25 CD spectra of the nine presenilin TMDs in DOPC liposomes. (A) The shown CD spectra represent
a single measurement of the nine TMDs of presenilin reconstituted into liposomes constituted of DOPC. Most of
the spectra are very noisy due to the low incorporation efficiencies, with exception of TMDs 1, 2, 6 and 8. (B)
Evaluation of the secondary structure content of the CD spectra shown in figure 25A. The bars represent the
secondary structure content of a single experiment. This graph confirms that only TMDs 1, 2, 6 and 8 could be
incorporated nicely as these are the only ones showing a respectable amount of α-helicity. All other peptides have
an amount of α-helicity of less than 60%.
However, the CD spectra of most of the TMD peptides were again very noisy due to the poor
incorporation (Figure 25A). Only TMDs 1,2,6 and 8 showed quite nice CD spectra, which was
confirmed with the evaluation for the secondary structure content (Figure 25B).
Here the TMDs 1,2 6, and 8 show a good amount of α-helicity of 70-80%, while the others
were below 60% helical. Despite this, the overall incorporation quality and α-helicity were still

4. RESULTS
91
unsatisfactory. An overview with all determined P/L ratios, the measured α-helicities as well
as the calculated Kyte-Doolittle hydropathy plots can be found in the appendix (Table 5).
In conclusion, the experiment confirmed that the poor incorporation of most of the presenilin
TMD peptides was not primarily caused by the lipid composition, but most likely can be
attributed to the fact, that single TMDs of a polytopic membrane protein are very difficult in
their incorporation into liposomes, and probably require surrounding TMDs in a cooperative
effect. Thus more work is required in the future to obtain suitable presenilin TMD liposomes.

5. DISCUSSION
92
5. Discussion
5.1. Peptide-Peptide FRET Assay
At the start of this work one hypothesis was that the dimerization of APP is directly linked to
its proteolytic processing. However, little was known about the connection between the
dimerization of the APP-TMD and the proteolytic processing by γ-secretase. Some studies
proposed that only dimeric C99 gets cleaved by γ-secretase, while others favored the monomer
as cleavable species (271, 272). Additionally the exact subcellular membrane compartment where
the cleavage of the C99 through the γ-secretase takes place was under debate as the processing
of C99 could be located in several different membranes: the plasma membrane, the membranes
of the trans-Golgi network, the early and late endosomes as well as the lysosomes. Of these,
the late endosomes and the lysosomes would make sense insofar, as these cellular
compartments are associated with the degradation of all possible biological components like
lipids and proteins.
In order to shed more light on this topic a FRET based assay with the APP TMD was
established in this thesis. The assay is based on two variants of the same TMD peptide, which
are labeled with two different fluorophores, one the fluorescence donor and the other the
fluorescence acceptor.
A prerequisite for FRET is that the absorbance spectrum of the acceptor fluorophore overlaps
with the emission spectrum of the donor fluorophore, so that the fluorescence energy can be
transferred from the donor to the acceptor if they are in close proximity to each other. As donor
fluorophore tryptophan was used, as it could easily be incorporated into the sequence of the
APP TMD peptide. NBD was chosen as acceptor because of the big difference of its
fluorescence emission wavelength from the one of tryptophan. By that huge shift no
interference between the measured tryptophan fluorescence and the excitation of tryptophan
or the emission of NBD were possible.

5. DISCUSSION
93
Both peptides were synthesized with solid phase peptide synthesis by PSL. However, due to
the highly hydrophobic nature of the ordered peptides and the fact that the APP TMD is very
prone to aggregation, only the tryptophan labeled peptides could be delivered in HPLC purified
quality. The NBD-labeled peptides were delivered as raw product without a HPLC purification
from PSL. To solve this problem a fraction of the peptide was HPLC purified and the analysis
by mass spectrometry showed that the purity was in an acceptable range for the establishment
of the FRET assay (Figure 9B). However, the HPLC purification of the NBD-labeled peptide
was very laborious. This is why the question arose, whether the experiments could equally well
be performed with unpurified peptides without HPLC purification.
One first hint that the quality of the unpurified peptide was quite good came from a Tris-Tricine
SDS gel: as shown in Figure 9A, the unpurified raw product peptide gives only a single clear
band in the gel, showing that the overall purity was fairly good. Additionally, the secondary
structure content was determined in 80% TFE by CD spectroscopy. TFE is an organic solvent,
known to promote the formation of an α-helical secondary structure of transmembrane helices.
The CD measurements performed with the unpurified peptide showed that the amount of
α-helicity was above 60% (Figure 10B). As hint that the unpurified peptide was pure enough
for the FRET assays, it has to be noted that FRET assays conducted both with the unpurified
NBD-peptide, as well as in-house HPLC purified NBD-peptide, gave the same experimental
results. Consequently, it turned out that utilization of the unpurified peptide, and thereby
forgoing of the laborious HPLC purification in-house, had not adverse effect on the quality of
the results. This is why in later experiments and after establishment of the assay, only
unpurified NBD-peptide was used. Taken together these tests confirmed that the quality and
purity of the unpurified peptide was quite satisfactory, so that in the next step a FRET based
dimerization assay was established.
The handling of liposomes is generally quite challenging and error-prone, so that a first try to
establish the FRET assay and verify the suitability of the fluorophores, was realized in solution
in TFE. The FRET in solution experiments were initially performed with the Aβ WT peptide
and its G33I mutant form.
5. DISCUSSION
94
In the case of the G33I mutant, the glycine at position 33 was mutated to an isoleucine, which
disrupts the two consecutive GxxxG motifs, as G33 is situated in the middle of those motifs.
This should, according to previous publications, lead to a strong reduction in dimerization (115),
so that a weaker FRET signal for the G33I mutant peptide compared to the Aβ WT was
expected in this assay. However, as shown in Figure 11A and B, the fitting curves through the
mean data points of four individual experiments for each the WT and G33I peptides looked
very similar and the calculation of the FRET efficiency curves revealed that both peptides had
almost identical FRET efficiencies in solution (Figure 11E). This is further underlined by
evaluation of the E50 value, the total peptide concentration necessary to reach a FRET
efficiency of 50%. This value is interesting as the KD value for the dimerization should be
around this concentration range. This assumption is based on the facts that KD is the
concentration where 50% of the peptides are present as a dimer while the remaining 50% is
monomeric. At the same time a FRET efficiency of 50% (E50) means that at least half of the
donor and acceptor molecules must be within the Förster distance R0 to each other and that for
50% the energy transfer was successful. Taken together, in the case of a FRET efficiency of
50% it is very likely that approximately 50% of the peptides have formed a stable dimer, which
corresponds to the KD value. However, it has to be considered that dimers can also be formed
by peptides labeled with the same fluorophore, which cannot be detected by such a FRET
assay. At the same time not all pairs of donor and acceptor molecules, which are close enough
for the energy transfer to occur, will actually lead to the energy transfer. It is assumed that
these two phenomenon will compensate each other, so that the assumption, that the KD value
is in the concentration range of the E50 value holds true. It must be noted that a detailed
calculation of the actual KD values has not be made, as the correct calculation of these values
is only possibly by complex mathematical computations and curve fittings. The mean E50
values of both the WT and G33I peptide experiments, as pictured in Figure 11F, showed no
difference. This led to the conclusion that either the peptides did not show a difference due to
solvent effects or due to the fact that - in this instance - the two GxxxG motifs are not that
important for the dimerization.

5. DISCUSSION
95
In order to further investigate this, the amount of random colocalization in the total FRET was
determined. This was achieved by using only fluorophores without peptides, which should not
have any affinity to each other. Indeed in Figure 11E the orange FRET efficiency curve,
representing the free fluorophores, was significantly lower than the ones representing the
peptides. Additionally the total fluorophore concentration necessary to reach a FRET
efficiency of 50% is significantly higher for the free fluorophores than for the peptides, with a
significance of the free fluorophores to the WT peptide of p = 1.937*10-5 and to the mutant of
p = 2.785*10-5.
However it should be noted that the experiments with the fluorophores did not reach a FRET
efficiency of 50% within the used concentration range; the shown values are based on the
extrapolation of the fitting curves and do not represent actual data. Nevertheless, with this
experiment it could be demonstrated that part of the determined FRET efficiencies of the
peptide based experiments originate from peptide-peptide interactions and are not solely based
on random colocalization.
In order to determine whether these peptide-peptide interactions were specific or a
consequence of the used solvent, a second control experiment was performed with peptides
that should have no specific interactions: the model peptide LLV16 as donor and the Aβ WT
NBD as acceptor. Surprisingly this peptide combination seemed to produce a similar amount
of FRET compared to the Aβ WT and G33I experiments (Figure 11D). This is even better
illustrated in Figure 11D and E, were the calculated FRET efficiency curve and the E50 value
showed absolutely no difference to the experiments with the Aβ peptides. This result indicates
that a combination of two peptides that have no specific affinity to each other produce an
identical amount of FRET than experiments with peptides that have a specific interaction.
Therefore the measured amount of FRET that is based on peptide-peptide interaction is an
artifact of the used solvent and shows absolutely no specificity. The colocalization of the
peptides in the TFE solution seems to be based on the high hydrophobicity of the peptides,
leading to an unspecific interaction which the solvent cannot compensate. This might be
explained by the fact that transmembrane peptides are normally surrounded by the hydrophobic
core of a lipid bilayer, which has a dielectric constant of 2-5, while TFE has a dielectric
constant of around 25, which is comparable to the dielectric constant of the headgroup region
of a lipid bilayer (325).

5. DISCUSSION
96
This difference in hydrophobicity might lead to a preferred association of the peptides with
each other, resulting in the generation of a false-positive FRET signal that originates from
unspecific interactions. Due to these results, a FRET assay in solution could not be used for
the analysis of the Aβ TMD peptides, but at least it showed that the chosen fluorophores were
suitable for this FRET assay. Consequently in the next step the assay was performed similarly
in liposomes.
With the first peptide-peptide FRET assays in liposomes the reproducibility and viability of
this assay were confirmed. Therefore donor and donor/acceptor liposomes with the lipid DOPG
were produced with the in-house HPLC purified peptide and the results were compared to
experiments with the unpurified peptide. The mean FRET efficiency curves of four different
peptide stock mixtures, which were used for the measurement of all FRET experiments in this
work, are shown in Figure 13C. No difference could be detected for the FRET efficiencies
between purified and unpurified NBD-labeled peptide, demonstrating that the unpurified
peptides could be used. Additionally the four peptide stock mixtures used produced almost
identical CD spectra (Figure 13F).
After the reproducibility of the assay was confirmed, the FRET efficiencies of two different
lipid compositions were compared next. As shown in Figure 13D and E, the comparison of
DOPG and DOPC experiments showed that the differences between the mean E50 values was
significant for both DOPG and DOPC experiments. However, as was also the case for some of
the FRET in solution experiments, the assays with DOPC reached FRET efficiencies of just
under 50% in the used donor P/L ratio range (Figure 13D). This is why the shown E50 value
for the DOPC experiments was based on the extrapolation of the fitting functions and not on
real data. Consequently an alternative evaluation was used for the FRET in liposomes
experiments: the FRET efficiencies at a donor P/L of 1:125, which were available for almost
all individual experiments. The FRET efficiencies of the DOPG and DOPC experiments
showed a significant difference with a p-value of 1.9098*10-5 (Figure 13E), indicating that this
evaluation was equally viable.
The results also showed that the measured FRET efficiencies are based on specific peptide-
peptide interactions and that the established assay is generally viable for the determination of
the influence of different lipid species on the dimerization of the APP TMD.

5. DISCUSSION
97
This viability was additionally confirmed with the previously used LLV16 specificity control,
using the LLV16 peptide as donor and the Aβ WT NBD as acceptor. The FRET efficiency of
the LLV16 control experiment was much lower than the ones of the Aβ experiments (Figure
14D), demonstrating that the dimerization of the Aβ peptide based experiments showed
specific interactions. This perfectly fits the expected result, as the LLV16 and the Aβ WT
peptides should not show any FRET over the random colocalization background. This was also
illustrated in Figure 14E, where the comparison of the FRET efficiencies of these three
experiments showed that the LLV16 control is by far the lowest, while the Aβ experiments in
DOPG and DOPC liposomes still show a significant difference.
The aforementioned experiments confirmed that the dimerization measured with this assay is
indeed based on specific TMD-TMD interactions. Consequently the analysis of various lipid
compositions could be conducted next. An overview over all conducted assays is shown in
Figure 16. In this figure the results of the assays with the Aβ WT peptide were compared with
the ones with the G33I mutant. Interestingly the differences between both peptides were much
smaller than expected as both peptides showed very similar results for most lipid compositions.
Only three showed significant differences between the WT and G33I. These were both DOPE
compositions as well as the 40% cholesterol composition. This indicates that the APP TMD
dimerization is not dependent on a functional GxxxG motif, but rather that the lipid
environment influences the impact of the GxxxG motif on the dimerization, which is in
agreement with the previously published data (326) where the dimerization interface of the APP
TMD is sensitive to its local environment and that not always the same interface is used for
the dimerization. This is in very good agreement with the data shown in Figure 16.
In conclusion it seems that two lipids negatively influence the dimerization compared with the
host lipid DOPC: DOPE and cholesterol.
The presence of high DOPE concentrations seemed to decrease the dimerization most likely
driven by the GxxxG motif of the WT C99 TMD. This effect could not be detected for the low
DOPE concentration. In contrast, the G33I mutant showed a strong reduction in dimerization
for both DOPE concentrations.
This result is in good agreement with the WT results suggesting that the dimerization driven
by the GxxxG motif of the C99 TMD is negatively influenced by high DOPE concentration.

5. DISCUSSION
98
At the same time DOPE shows no influence on the dimerization driven by other motifs, as the
reduced dimerization of the WT (DOPE25) and G33I are very similar.
Interestingly, cholesterol showed a lower dimerization for both the mutant and the WT in
presence of cholesterol. This effect can be seen for both cholesterol concentrations, with a
stronger impact for the high cholesterol concentration. However, there is no difference between
the dimerization efficiencies between same lipid compositions for the WT and G33I mutant
peptide. These results suggest that the reduction in dimerization by cholesterol might not be
dependent on the GxxxG motif but rather other motifs like the GxxxA motif. Another
explanation for these results could be the fact that the used peptides possess at least a part of
the cholesterol binding site of C99 and that the presence of cholesterol inhibits the dimer
formation by the C99 TMD in general, irrespective of any dimerization motif.
Furthermore, the comparison of the FRET assays with the various lipid compositions of the
WT peptide showed that all tested lipid species had different effects on the dimerization of the
APP TMD compared to the reference lipid DOPC (Figure 17). The comparison of DOPE with
DOPC showed that for the WT peptide a concentration dependent reduction in dimerization
could be detected. While a low DOPE concentration of 5% did not show a significant
difference to DOPC, the 25% DOPE liposomes showed a significant reduction. A similar effect
was also measured for cholesterol, however this lipid already showed a significant difference
at the lower concentration. Interestingly, DOPS showed an increase in dimerization that was
greater for the lower DOPS concentration.
The results for the mutant peptide are in general identical compared to the WT, showing a
concentration dependent decrease in dimerization for the DOPE and cholesterol experiments
(Figure 18A and C), as well as an increase for DOPS (Figure 18B). However, the effect of
DOPE was stronger, as the 5% DOPE concentration was sufficient to significantly lower the
dimerization efficiency to a level comparable to the one of the 25% DOPE result of the WT.
In conclusion these results showed that the three lipids DOPE, DOPS, and cholesterol,
compared to the reference lipid DOPC, either increased or decreased the APP TMD
dimerization. In order to understand the influence of various lipids on the cleavage of C99 by
the γ-secretase, further experiments with a combination of these lipids are necessary.
Such an investigation could show if the effects of the single lipid species would be additive or
whether one lipid would have a dominant effect over the other. To better understand the way

5. DISCUSSION
99
in which the three lipids DOPS, DOPE, and cholesterol influence the APP TMD dimerization,
the interaction of these lipids with the Aβ peptide was tested in the second part of this work.
The combination of the result of the peptide-peptide FRET assay with the results of the peptide-
lipid FRET assay could explain why the various lipids had different influences on the
dimerization.
5.2. Peptide-Lipid FRET Assay
To analyze the way in which the three lipids DOPE, DOPS, and cholesterol influence the
dimerization of the APP TMD, a peptide-lipid FRET assay was established in the second part
of this work. The lipids carried the acceptor fluorophore NBD, while as donor fluorophore the
tryptophan in the peptide was used.
The first assays were performed with the Aβ WT peptides which had tryptophan on the
N-terminus. The resulting mean FRET efficiency curves for the experiments with
NBD-labeled PC, PE, PS and cholesterol are shown in Figure 21A. All three phospholipids
reached a FRET efficiency up to ~100% for the used donor to acceptor ratio range, while the
cholesterol did not even reach a FRET efficiency of 50%. For a better comparison of the FRET
efficiencies the concentration of NBD-labeled lipid that was necessary to reach a FRET
efficiency of 50% was calculated and the mean values and their SD visualized in Figure 21B.
As mentioned cholesterol did not reach a FRET efficiency of 50% and is therefore not included
in this graph. The comparison of the three phospholipids showed that both DOPE and DOPS
showed a significant difference in the E50 value compared to DOPC. DOPE had the highest
affinity towards the peptide, followed by DOPS and DOPC, respectively.
In order to be able to also include the results of the cholesterol experiments, the FRET
efficiencies at a NBD-lipid concentration of 2.7 mol% were used (Figure 21C). This evaluation
illustrated that the affinity of cholesterol is by far lower than the ones of the phospholipids.
Nevertheless, this result is consistent with published results, which showed that residues in the
loop and helix region N-terminally of the TMD are essential for the binding of cholesterol.
Without these residues, the incomplete cholesterol binding site is not capable of binding
5. DISCUSSION
100
cholesterol with the published KD of 2.7 mol% (121). Additionally, most reports on cholesterol
influencing the formation of dimers by membrane proteins indicate that cholesterol has only a
slight impact on the dimer formation itself, but rather influences the dimer interface (340). In the
case of the β2-adrenergic receptor, increasing concentrations of cholesterol led to structural
rearrangements in the dimer, but did not directly influence the dimerization (340).
To further investigate if the binding affinities of the phospholipids are mainly based on
electrostatic interaction between the charged lipid headgroups and the lysine residue of the
peptide, an alternative Aβ WT peptide was used: This peptide had the tryptophan incorporated
at the C-terminus, and therefore possessed three lysine residues close to the tryptophan
compared to only one for the N-terminally labeled peptide.
Consequently, the FRET results obtained with this version of the Aβ peptide should indicate
if the peptide-lipid interactions were mainly based on electrostatic interactions, which should
be strengthened through the three lysine residues. Cholesterol was not included in these
experiments as it has no charge and is therefore not suitable for this assay.
Interestingly, the FRET efficiency curves (Figure 22A) and the E50 value evaluation (Figure
22B) of the experiments with the C-terminally labeled Aβ WT peptide showed that all three
headgroups, PC, PE and PS had higher affinities towards this version of the peptide. Both PS
and PC showed the greater increase in affinity towards the C-terminally labeled peptide
compared to PE. This result somehow contradicts the hypothesis that the interactions are
mainly based on electrostatic interactions. If that would be the case, NBD-PE should have
shown a greater increase in affinity than the NBD-PC, which was not observed.
This result indicates that the affinity of the PE headgroup towards both C- and N-terminally
labeled peptide is based mainly on non-electrostatic interaction. This can also be concluded
from the fact that the PS headgroup would be expected to have the highest affinity, as PS has
a negatively charged headgroup.
Additionally, it should be noted that due to the competitive binding of NBD-labeled PC and
the host DOPC lipid, no difference should be detectable between the N- and C-terminally
labeled peptide, if the lipid-peptide interactions are based on headgroup interactions. In fact, a
rather large difference between the N- and C- terminally peptide was measured for the PC
headgroup, indicating that this change in affinity must be due the acyl chain region or it could

5. DISCUSSION
101
even be caused by the NBD-label. This detected effect could also play a role for the other
headgroups, leading to the conclusion that further experiments are necessary to rule out the
influence of the NBD-label on the lipid-peptide affinities of the PE and PS headgroup.
In conclusion the experiments with the N- and C-terminally labeled Aβ WT peptides showed
no consistent result and further experiments are necessary. For the PC headgroup the observed
difference must be due to the acyl chain region and could well be caused by the NBD-label
itself. For the PE and PS experiments it must be ruled out by further experiments, that the
observed changes are caused by the NBD-label. If that is the case one could conclude that the
increase in affinity of PS in mainly caused by the negatively charged headgroup. For a final
conclusion for the PE headgroup further experiments are necessary.
In a third experiment the affinities of the used lipids towards the Aβ G33I peptide with an
N-terminal tryptophan were determined (Figure 23A). The FRET efficiency curves look very
similar to the ones of the WT experiments. This is even more pronounced when comparing the
mean E50 values of the PC, PE and PS experiments of the G33I mutant with the ones of the
WT: For both N-terminally labeled peptides the concentrations needed to reach a FRET
efficiency of 50% were very similar and did not show a significant difference. In both cases
the affinity of the PC headgroup was the lowest, followed by the PS headgroup with a
significantly higher affinity and finally the PE headgroup with the highest affinity (Figure 23A
and B).
The affinity of cholesterol towards the G33I mutant was also much comparable to the WT
experiments (Figure 23C): The plot of the FRET efficiency at a NBD-lipid concentration of
2.7 mol% showed that in both cases, WT and G33I mutant cholesterol had by far the lowest
affinity. The measured FRET efficiencies were almost identical for both peptides.
In conclusion, the affinities of the analyzed lipids did not differ between the WT and the G33I
mutant peptide. This result indicates that the differences measured for the dimerization of both
TMDs are not caused by different binding affinities of the various lipids. This leads to the
conclusion, that the lipids have an influence on the dimer structure irrespective of the G33I

5. DISCUSSION
102
mutation, resulting in the importance of various dimer interfaces. This finding is as already
mentioned in good agreement with some previously published experiments (326).
5.3. Reconstitution of the Presenilin TMDs into Liposomes
The results in the sections above all discussed the influence of the lipid environment on the
formation of a homodimer of the APP TMD and consequently, the resulting consequences on
the proteolytic processing of C99 by the γ-secretase. However, during the course of this work
more and more evidence arose that only the monomeric form of C99 can be cleaved by the
γ-secretase. The question arose if the GxxxG motif is truly important for homodimerization,
or rather for the substrate recognition of the γ-secretase. So far no common feature of the many
substrates of the γ-secretase could be detected that identifies them as substrates, while other
similar membrane proteins are not cleaved by this protease (255, 256).
In the case of APP the recognition could function through the formation of a heterodimer
formed by the APP TMD and one of the TMDs of presenilin. The sequence analysis of
presenilin showed that three TMDs have either a GxxxG or a (A/S)xxxG motif and that these
TMDs are part of the active site or close to it. Therefore it seems reasonable that the substrate
recognition and the binding to the active site could be managed by the formation of such a
heterodimer.
In order to investigate if the TMDs of presenilin can form a heterodimer with the APP TMD,
a FRET heterodimerization assay has to be established first. A very important first step towards
the establishment of such an assay is the reconstitution of the presenilin TMDs into liposome.
This first step was performed for three TMDs in the third part of this work.
The nine TMDs of presenilin were individually reconstituted into liposomes composed of
lipids that either resemble the composition of the early or the late endosomes, as these
compartments are most likely the site of γ-secretase cleavage. The liposomes were then
analyzed by CD spectroscopy to determine the peptides secondary structure (Figure 24).

5. DISCUSSION
103
The results showed that the reconstitution of individual TMDs of a polytopic membrane protein
is much more difficult compared to single span membrane proteins. As shown in Figure 24A
and C, most of the TMDs did not incorporate very well, showing only a low amount of
α-helicity and a very noisy CD spectrum. The three exceptions that incorporated reasonably
well and showed nice α-helical spectra in both lipid compositions were TMDs 1, 6, and 8. In
the late endosomal lipid composition additionally TMDs 2 and 5 showed acceptable amounts
of α-helicity. However, the overall quality of the CD spectra was not satisfying and not good
enough for the establishment of the heterodimerization FRET assay.
In principle, the low incorporation efficiencies could have been due to the complex lipid
compositions of the liposomes or alternatively due to the known phenomenon, that single
TMDs of a multipass membrane protein show very low incorporation efficiencies due to a
cooperative effect between the TMDs required for their correct incorporation into the lipid
bilayer in vivo (329, 330).
To investigate this further, the TMDs were incorporated into liposomes composed only of
DOPC, and again analyzed by CD-spectrometry (Figure 25A and B). The incorporation
efficiencies were comparable to the more complex lipid compositions. This result illustrates
that the reason for the low incorporation efficiencies can be found in the mentioned cooperative
effect between the neighboring TMDs and not in the lipid composition.
Additionally, some of the used presenilin TMDs possess charged residues in the middle of
their TMD making incorporation into liposomes very unlikely. In the full-length presenilin
protein these residues would most likely face towards the aqueous phase, thereby splitting the
TMD into one or two shorter ones. This is for example the case for the TMDs 6 and 7 which
contain the two active site Asp residues.
In conclusion, the results showed that the incorporation of the single presenilin TMDs into
liposomes is very challenging as expected. Nevertheless, three out of nine TMDs showed
incorporation efficiencies with an α-helical amount sufficient for a future heterodimerization
FRET assay. However, only one of them has a GxxxG dimerization motif. Yet the three
successfully incorporated TMDs prove that an incorporation of individual TMDs from the

5. DISCUSSION
104
polytopic presenilin is a doable, if very challenging, venture, and future experiments might
achieve the incorporation of all nine TMDs.
5.4. A Hypothesis for the Influence of the Lipid Environment
When summarizing the most important results of the work presented here, several observations
can be made about the three lipids PE, PS, and cholesterol (Table 3).
Table 3 Overview over the results obtained for PE, Ps, and cholesterol.
Lipid Influence on APP TMD dimerization Affinity towards peptide
PE decrease highest
PS increase medium
Cholesterol decrease low
PE decreases the APP TMD dimerization, but at the same time shows the highest affinity
towards the Aβ peptide. PS increases the dimerization and shows a slightly lower affinity
towards the peptide. Cholesterol also decreases the APP TMD dimerization, but shows only a
low affinity for the peptide.
Based on these observations, the following modes of action could be hypothesized for the three
lipids:
(1) PE, due to its strong affinity, directly interacts with the peptide. It forms hydrogen bonds
to the peptide, leading most probably to a change in the dimer structure. This results in the
variation of the utilized dimer interface, weakening the dimer stability.
(2) PS has a relatively high affinity to the peptide, and might interact with it without blocking
the dimerization interface. On the contrary, due to its negative charge, it might dampen the
positive repulsion between two Aβ peptides that are approaching.
The positive repulsion is due to the positively charged lysines next to the GxxxG motive on
the N-terminus of the peptides and might make dimerization more difficult, which is why the
negative charge of PS would help overcome this repulsion and enable dimerization.
(3) Cholesterol does only bind very weakly to the peptide as evidenced by its low affinity. The
decrease in the TMD dimerization is most likely not caused by this weak interaction but might
be caused by cholesterol’s effect on the membrane fluidity.
5. DISCUSSION
105
Recently published data as well as experiments conducted in the Langosch lab have provided
evidence that C99 is cleaved in its monomeric form (332). Incidentally the C99 TMD has a
natural propensity to dimerize, and experiments in the lab have shown that these dimers are
relatively stable. It could be hypothesized that this dimerization is a natural way of regulating
C99 cleavage: As long as C99 is present in its dimeric form, it is not cleaved by the γ-secretase.
If the equilibrium is shifted towards the monomeric form, the γ-secretase can cleave. The
experiments presented in this work have shown that certain lipids are able to influence this
equilibrium by increasing or decreasing the dimerization of the C99 TMD. It could be therefore
reasoned that in the human body the lipid environment indirectly regulates the C99 cleavage
by γ-secretase by influencing the monomer/dimer equilibrium.
To further investigate into the hypothesis proposed here, one could compare the lipid
composition in diseased brains to the one in healthy brains and see if monomer-favoring lipids
such as PE and cholesterol are increased in the diseased brain. While this hypothesis is merely
based on the observations made from the results in this work, and has not been confirmed by
any results, it could provide a starting point for future directions of investigation.
As a final point in favor of this hypothesis it should be noted that high cholesterol levels have
been implicated with a higher risk for AD (331). Incidentally cholesterol has been shown in this
work to decrease the C99 TMD dimerization, and according to the hypothesis presented here,
higher cholesterol levels would be expected in a diseased brain compared to a healthy brain.

6. CONCLUSIONS AND OUTLOOK
106
6. Conclusions and Outlook
Peptide-Peptide FRET Assay
In the course of this work a liposome based FRET assay for evaluation of the influence of
various lipid species on the dimerization of the APP TMD was established. In contrast to
previous experiments on the APP TMD dimerization, the assay presented here is focused on
the effect of the lipid microenvironment on the dimerization. This focus is necessary to gain
more knowledge about the lipid composition of the cellular membrane in which the
amyloidogenic processing of the APP TMD through the γ-secretase takes place.
The FRET assay was successfully established in the course of this work and used to investigate
the influence of binary lipid compositions of DOPC and either DOPE, DOPS, or cholesterol
on the APP TMD dimerization. The presented results could demonstrate that the lipid
microenvironment has a major impact on the dimer formation not only because some lipids
showed a significant reduction (DOPE, cholesterol) or enhancement (DOPS) in dimerization,
but also because the dimer formation was not always dependent on the GxxxG motif (DOPC,
DOPS, cholesterol at low concentrations).
Even though one previously published paper gave an initial hint that the microenvironment
may influence the dimer formation (111, 121-123), the here presented results are the first that
explicitly show the influence of lipid environment.
In addition the information gained from the results presented here can be used for the
conceptual design of further experiments. These should include the combination of more than
two lipid species to investigate if the impacts of the lipids DOPE, DOPS and cholesterol seen
here show a cooperative behavior in more complex lipid compositions. Furthermore, the here
established FRET assay can easily be used to investigate other lipid species not included in
this study. Interesting lipid candidates could be sphingomyelin as well as different variant of
the phosphatidylinositol phosphates. These have previously been shown to enhance or inhibit
the activity of the γ-secretase, respectively (308,309).

6. CONCLUSIONS AND OUTLOOK
107
Lastly the findings on the influence of lipids on the dimerization presented here together with
the results of a research cooperation done by the Langosch lab with another group, in which
the question will be solved if the monomeric or the dimeric form of C99 is cleaved by the
γ-secretase, will finally lead to the conclusion which subcellular membranes can promote the
amyloidogenic processing of APP. This could open up the way towards the development of
new therapeutic approaches of the Alzheimer’s disease.
Peptide-Lipid FRET Assay
To gain a better understanding about how the various lipids influence the dimerization of the
APP TMD, the interaction between the lipids and the peptides was determined in the second
part of this work. To this end a peptide-lipid FRET assay was successfully established and the
affinities between the peptides and the PC, PE and PS headgroup as well as cholesterol were
measured. To differentiate if the measured affinities are mainly based on electrostatic
interaction or hydrogen bonding, two versions of the WT APP TMD were used, one with the
donor tryptophan at the N-terminus, the other at the C-terminus. The two peptide termini differ
in the number of positive charged residues, favoring the C-terminally labeled peptide for
electrostatic interactions.
It could be shown as expected, that the negatively charged PS headgroup shows a much
stronger interaction towards the C-terminally labeled peptide compared with the N-terminal
one. However, the most interesting finding was that the PE headgroup showed for both
peptides the strongest interaction, demonstrating that the hydrogen bonding between the PE
headgroup and the peptide seem to be more favorable than the electrostatic interactions with
the PS headgroup. The influence of the acyl chain region could be ignored as all NBD-labeled
lipids had an identical acyl chain composition.
The combination of the results of both FRET assay allows to speculate on the mode of action,
how the lipids influence the dimerization of the APP TMD. In case of the PE headgroup a
possible explanation would be that the hydrogen bonding between the peptide and the lipid
headgroup stabilizes the α-helical structure of the TMD peptide, which would be more
favorable for the peptide than the formation of a dimer.
6. CONCLUSIONS AND OUTLOOK
108
In the case of the PS headgroup its capability to undergo electrostatic interactions seemed to
bring two peptides in close proximity, thereby increasing the amount of dimer formation.
Another very interesting finding of these experiments was that cholesterol does not have a high
affinity towards the used peptides. This is in good agreement to previously published data that
showed that a loop and short helix region that lay N-terminally of the APP TMD harbor
important residues that constitute the cholesterol binding site. With these residues missing the
cholesterol cannot be bound, which is reflected in the very low affinity in this work. This is
also in good agreement with the expected results as cholesterol does not show high affinities
towards peptides and proteins except for specific binding sites. This can be explained by the
fact that cholesterol is not able to undergo interaction with the peptide like the phospholipids
as it does not have any charges and is a very weak H-bond donor and acceptor.
In conclusion the here presented results have demonstrated that the various lipids used
influence the dimerization of the APP TMD by different mechanisms. This information will
be very important for the interpretation of future TMD dimerization experiments with lipid
compositions that resemble the ones of the cellular membranes that are supposed to exhibit the
proteolytic processing of C99 by the γ-secretase.
In the future the peptide-lipid FRET assay established here can be used for investigations of
other lipids such as sphingomyelin or the phosphatidylinositol phosphates.
6. CONCLUSIONS AND OUTLOOK
109
Reconstitution of Presenilin TMDs
In the third part of this work the first steps towards a heterodimerization assay were performed.
In this assay the heterodimerization between the nine TMDs of presenilin and the APP TMD
should be determined. As an initial experiment in the establishment of such an assay, the nine
presenilin TMD peptides were reconstituted into liposomes that were composed of a lipid
composition resembling either the early or the late endosomes.
To assure that the reconstituted peptides are reconstituted correctly and principally able to form
heterodimers, their secondary structure was determined by CD spectroscopy. The results
showed that only three of the nine peptides would reconstitute in a mainly α-helical structure
into the used liposomes. This result, while unfortunate, was predictable as it is well known
from the literature that single TMDs of a polytopic transmembrane protein are often weak in
their reconstitution efficiencies. The explanation for that phenomenon is that the insertion of
the transmembrane domains of a polytopic membrane protein often relays on a cooperative
effect between the neighboring TMDs. Therefore the single TMDs, which miss this
cooperative effect for the insertion into the membrane show a very bad reconstitution
efficiency. However, the realization of a heterodimerization assay between the single
presenilin TMDs and the APP TMD would be worth the effort of solving the above mentioned
problems, as three of the presenilin TMDs have motifs known to promote the formation of
dimers. Such an interaction between the substrate APP and the active part of the γ-secretase,
the presenilin, could help to solve the question of substrate recognition at least for APP. The
information of the exact mode of substrate recognition could then help in the development of
new strategies in the struggle against the Alzheimer’s disease.
Therefore in future experiments a way must be found to mimic the required cooperative effect
and enable efficient incorporation of the TMDs into the liposomes. To this end more effort has
to be put into the optimization of the reconstitution before the FRET assays can finally be
performed. The insights gained in this work have shown that the incorporation problem is due
to the cooperative effect and not due to the complex lipid composition, so that in the future the
assay can be performed as planned in these complex but realistic environments.
Further Directions From This Work
6. CONCLUSIONS AND OUTLOOK
110
Even though some fundamental new insights into the formation of the dimer of the APP TMD
and especially the influence of some lipids on this formation could be achieved, the results
presented in this work represent only the first steps towards a better understanding of the
molecular determinants that lead to the fatal formation of amyloid plaques, a major hallmark
of the Alzheimer’s disease.
To further clarify the question which cellular changes lead to an increase in the production of
the highly neurotoxic Aβ42 peptides, the influence of more complex lipid compositions on the
dimerization of the APP TMD would be necessary. Therefore, the here presented peptide-
peptide FRET assay in liposomes is a great tool to further investigate the influence of the lipid
composition on the C99 TMD dimerization, which will give first hints in which subcellular
membrane the cleavage of APP by the γ-secretase takes place.
Additionally the information about the form that is cleaved by the γ-secretase is very important.
So far it is not completely clear if only the monomeric form of APP can be cleaved or if also
the dimeric form can be a substrate, although some experiments point towards the monomeric
form (272). However, some very promising experiments aiming to solve this question will be
performed by the Langosch lab in the future.
To further analyze the influence of cholesterol on the APP TMD, a peptide version of the APP
TMD with the additional N-terminal loop and helix regions can be used to first replicate the
previously published affinity between the C99 and cholesterol, and can then be used in the
assays presented here to screen for small molecular compounds that are able to complement
this interaction. This would be interesting as more and more evidence arises that this complex
formation might be a key player in the amyloidogenic processing of APP.
Lastly the successful establishment and realization of the heterodimerization assay between
the nine presenilin TMDs and the APP TMD will give some highly important results that would
shed light on the mode of substrate recognition of the γ-secretase.
All these results together will then hopefully help in the development of new therapeutic
approaches in the struggle against a disease that will most probably become the worst suffering
of old people in developed countries in the upcoming 20 years.

APPENDIX
111
Appendix
The sequence of all peptides used in this work is provided in Table 4.
Table 4 Sequences and modifications of the used transmembrane domain peptides
Name Amino Acid Sequence
Aβ26-55-NTRP (WT)
NH2-SNKWG AIIGL MVGGV VIATV IVITL VMLKK K-CONH2
Aβ26-55-CTRP (WT)
NH2-SNKGA IIGLM VGGVV IATVI VITLV MLWKK K-CONH2
Aβ26-55-NBD (WT)
NBD-Ahx/PEG3-SNKGA IIGLM VGGVV IATVI VITLV MLKKK-CONH2
Aβ26-55-NTRP (G33I)
NH2-SNKWG AIIIL MVGGV VIATV IVITL VMLKK K-CONH2
Aβ26-55-NBD (G33I)
NBD-PEG3-SNKGA IIILM VGGVV IATVI VITLV MLKKK-CONH2
Aβ16-55-NBD
NBD-PEG3-KLVFF AEDVG SNKGA IIGLM VGGVV IATVI VITLV MLKKK-
CONH2
PS-TMD1
Ac-KKKAK HVIML FVPVT LCMVV VVATI WKSVS-CONH2
PS-TMD2
Ac-HSWIL NAAIM ISVIV VMTIL LVVLY KYKKK-CONH2
PS-TMD3
Ac-KKKSL LLLFF FSFIY LGEVF KTYNV WAVDY-CONH2
PS-TMD4
Ac-VDYIW TVALL IFNFG VVGMI SIHFK GPKKK-CONH2
PS-TMD5
Ac-KKKPL RLQQA YLIMI SALMA LVFIK YWLPE-CONH2
PS-TMD6
Ac-LPEWT AFLIL AVISV YDLVA VLCPK GPKKK-CONH2
PS-TMD7
Ac-KKKER GVKLG LGDFI FYSVL VGKAS AWTAS-CONH2
PS-TMD8
Ac-GDWNT TIACF VAILI GLCLT LLLLA IFKKK-CONH2
PS-TMD9
Ac-KKKAL PALPI SITFG LVFYF ATDYL VWQPF-CONH2
LLV16
KKKWLLVLLVLLVLLVLLVLKKK
W = single tryptophan residue used as fluorophore
F = naturally occurring tryptophan residues mutated to phenylalanine
NBD = NBD fluorophore attached to the N-terminal linker
Ahx/PEG3 = linker molecules used to couple the NBD fluorophore to the N-terminus
I = mutation site, where the glycine at position 33 is changed to an isoleucine

APPENDIX
112
A list of determined P/L ratios, measured α-helicities and calculated Kyte-Doolittle
hydropathy plots is shown in Table 5. The Kyte-Doolittle hydropathy plots were produced
using: http://gcat.davidson.edu/DGPB/kd/kyte-doolittle.htm.
Peptide Lipid
Composition
P/L
Ratio
α-helicity Calculated Kyte-Doolittle Plot
PS1 EE 1:472 73,95%
LE 1:570 66,35%
DOPC 1:637 83,30%
PS2 EE 1:465 49,35%
LE 1:621 66,15%
DOPC 1:456 84,60%
PS3 EE 1:1063 49,70%
LE 1:596 46,75%
DOPC 1:528 58,20%

APPENDIX
113
PS4 EE 1:814 40,65%
LE 1:529 46,65%
DOPC 1:337 51,40%
PS5 EE 1:354 44,95%
LE 1:492 65,90%
DOPC 1:361 71,40%
PS6 EE 1:341 74,50%
LE 1:250 70,40%
DOPC 1:279 64,60%

APPENDIX
114
PS7 EE 1:936 42,70%
LE 1:893 52,60%
DOPC 1:816 57,30%
PS8 EE 1:322 68,15%
LE 1:476 68,25%
DOPC 1:333 82,50%
PS9 EE 1:1221 26,15%
LE 1:922 36,15%
DOPC 1:455 40,70%

APPENDIX
115
The MS spectra of all peptides used in this work are provided in Figure 26.
A B
C D
E F
G H

APPENDIX
116
I J
K L
M N
O P

APPENDIX
117
Q R
S T
Figure 26 MS spectra of all peptides used in this study. (A) Aβ 26-55-NTRP (WT) HPLC purified (11.04.2013)
(B) Aβ 26-55-CTRP (WT) HPLC purified (11.04.2013) (C) Aβ 26-55-NTRP (WT) HPLC purified (29.11.2013)
(D) Aβ 26-55-NBD (WT) raw product (09.04.2014) (E) Aβ 26-55-NBD (WT) HPLC fraction 1-6 (09.04.2014)
(F) Aβ 26-55-NBD (WT) HPLC fraction 7 (09.04.2014) (G) Aβ 26-55-NTRP (G33I) raw product (09.04.2014)
(H) Aβ 26-55-NBD (G33I) raw product (09.04.2014) (I) Aβ 26-55-NTRP (G33I) HPLC fraction 5-6 (09.04.2014)
(J) Aβ 26-55-NTRP (G33I) HPLC fraction 7-8 (09.04.2014) (K) Aβ 26-55-NBD (G33I) HPLC fraction 1-2
(09.04.2014) (L) PS-TMD1 HPLC purified (23.06.2014) (M) PS-TMD2 HPLC purified (23.06.2014) (N) PS-
TMD3 HPLC purified (23.06.2014) (O) PS-TMD4 HPLC purified (23.06.2014) (P) PS-TMD5 HPLC purified
(23.06.2014) (Q) PS-TMD6 HPLC purified (23.06.2014) (R) PS-TMD7 HPLC purified (23.06.2014) (S) PS-
TMD8 HPLC purified (23.06.2014) (T) PS-TMD9 HPLC purified (23.06.2014)
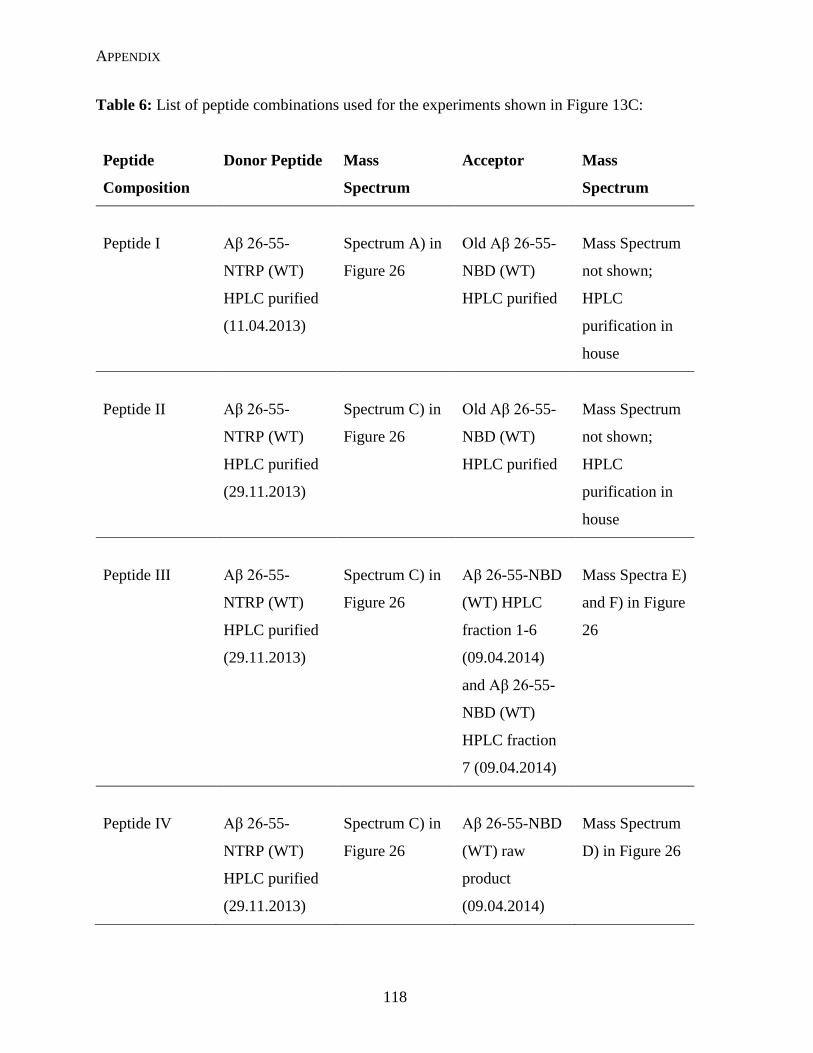
APPENDIX
118
Table 6: List of peptide combinations used for the experiments shown in Figure 13C:
Peptide
Composition
Donor Peptide Mass
Spectrum
Acceptor Mass
Spectrum
Peptide I
Aβ 26-55-
NTRP (WT)
HPLC purified
(11.04.2013)
Spectrum A) in
Figure 26
Old Aβ 26-55-
NBD (WT)
HPLC purified
Mass Spectrum
not shown;
HPLC
purification in
house
Peptide II Aβ 26-55-
NTRP (WT)
HPLC purified
(29.11.2013)
Spectrum C) in
Figure 26
Old Aβ 26-55-
NBD (WT)
HPLC purified
Mass Spectrum
not shown;
HPLC
purification in
house
Peptide III Aβ 26-55-
NTRP (WT)
HPLC purified
(29.11.2013)
Spectrum C) in
Figure 26
Aβ 26-55-NBD
(WT) HPLC
fraction 1-6
(09.04.2014)
and Aβ 26-55-
NBD (WT)
HPLC fraction
7 (09.04.2014)
Mass Spectra E)
and F) in Figure
26
Peptide IV Aβ 26-55-
NTRP (WT)
HPLC purified
(29.11.2013)
Spectrum C) in
Figure 26
Aβ 26-55-NBD
(WT) raw
product
(09.04.2014)
Mass Spectrum
D) in Figure 26

ABBREVIATIONS
119
Abbreviations
9-AA 9-aminoacridine
Å Ångström, equals 0.1 nm
AcD Acidic region
ACN Acetonitrile
AD Alzheier's disease
ADAM A disintegrin and metalloprotease
Ahx ε-aminocaproic acid
AICD APP intracellular domain
APH1 Anterior pharynx-defective 1
APLPs Amyloid precursor-like proteins
APOE Apolipoprotein E
APP Amyloid precursor protein
Aβ Amyloid beta
BACE β-site APP cleaving enzyme
BMP Bis-(monoacylglycero)-phosphate
Boc Tert-butyloxycarbonyl
CAPPD Central APP domain
CBB G250 Coomassie brilliant blue G250
CBD Collagen binding domain
CD Circular dichroism
CL Cardiolipin
CTF C-terminal fragment
CTRP C-terminal tryptophan
CuBD Copper binding domain
Da Dalton
DAG Diacylglycerol
DAP DYIGS and peptidase
ddH2O Double-distilled water or better
(Milli-Q preferred)
DHB 2,5-dihydroxybenzoic acid
DMF Dimethylformamide
DOPC 1,2-dioleoyl-sn-glycero-3-
phosphocholine
ED Extension domain
EGF Epidermal growth factor
EM Elect on microscopy
ER Endoplasmic reticulum
ESI Electrospray ionization
EtOH Ethanol
FA Formic acid
FAD Familial Alzh imer's disease
Fmoc Fluorenylmethyloxycarbonyl
FRET Förster resonance energy transfer
FTD Frontotemporal dementia
GFLD Growth factor like domain
GGAs Golgi-localized gamma-ear-containing
ADP ribosylation factor-binding
proteins
GUVs Giant unilamellar vesicles
HBD Heparin binding domain
HBTU N,N,N′,N′-tetramethyl-O-(1H-
benzotriazol-1-yl)uronium
hexafluorophosphate
HCAA α-cyano-4-hydroxycinnamic acid
HFIP Hexafluoroisopropanol
HPLC High-pressure liquid chromatography
JMR Juxta-membrane region
KD Dissociation constant
KPI Kunitz type ser ne protease inhibitor
LMPG Lysomyristoylphosphatidylglycerol
LUVs Large unilamellar vesicles
MALDI Matrix-assisted laser
desorption/ionization
MBHA 4-methylbenzhydrylamine
MeOH Methanol
MLVs Multilamellar vesicles
MRI Magnetic resonance imaging

ABBREVIATIONS
120
MS Mass spectrometry
MW Molecular weight
NaOH Sodium hydroxide
NBD 7-nitrobenz-2-oxa-1,3-diazole-4-yl
NCT Nicastrin
NMR Nuclear magnetic resonance
NTF N-terminal fragment
NTRP N-terminal tryptophan
o/n Overnight
OD Optical density
P/L Peptide/Lipid
PA Phosphatidic acid
PAGE Polyacrylamide gel electrophoresis
Pbf 2,2,4,6,7-pentamethyl
dihydrobenzofuran-5-sulfonyl
PC Phosphatidylcholine
PE Phosphatidylethanolamine
PEG Polyethylene glycol
PEN-2 Presenilin enhancer 2
PET Positron emission tomography
PG Phosphatidylglycerol
PI Phosphatidylinositol
PIPs Phosphatidylinositol phosphates
PLA2 Phospholipase A2
PLC Phospholipase C
PLD Phospholipase D
PS Phosphatidylserine
PS1 Presenilin1
psig Pounds-force per square inch gauge
PSL Peptide Specialty Laboratories
RIP Regulated intramembrane proteolysis
rpm Revolutions per minute
sAPPα Soluble APPα fragment
sAPPβ Soluble APPβ fragment
SCAM Substituted cysteine accessibility
method
SD Standard diviation
SDS Sodium dodecyl sulfate
SM Sphingomyelin
SPPS Solid phase peptide synthesis
SUVs Small unilamellar vesicles
TACE Tumor necrosis factor-α converting
enzyme
tBu t-Butyl
TFA Trifluoroacetic acid
TGN Trans-Golgi network
TIMPs Tissue inhibitors of metalloproteinases
TMD Transmembrane domain
TNFα Tumor necrosis factor-α
TOF Time of flight
Tris Tris(hydroxymet yl)aminomethane
TRP Tryptophan
Trt Tripheylmethyl
ULVs Unilamellar vesicles
UV/VIS Ultraviolet-visible
v/v Volume/Volume
VEGF Vascular endothelial growth factor
w/v Weight/Volume
WT Wild type

LISTS OF TABLES AND FIGURES
121
List of Tables
Table 1 Lipid composition of the liposomes used in the peptide/peptide FRET assays......... 49
Table 2 Lipid composition for the reconstitution of the nine presenilin TMDs ..................... 52
Table 3 Overview over the results obtained for PE, Ps, and cholesterol. ............................. 104
Table 4 Sequences and modifications of the used transmembrane domain peptides ........... 112
Table 5 List of determined P/L ratios, measured α-helicities and calculated Kyte-Doolittle
hydropathy plots.................................................................................................................... 113
Table 6 List of peptide combinations used for the experiments shown in Figure 13C ........ 119
List of Figures
Figure 1 Schematic representation of the formation of β-fibrils from Aβ40 and Aβ42. .......... 3
Figure 2 Schematic representation of the proteolytic processing of APP depending on the initial
ectodomain shedding site. ......................................................................................................... 4
Figure 3 Schematic representation of the domain architecture of APP and APLP1. ............... 7
Figure 4 Structure of the APP transmembrane domain and the proposed cholesterol binding
site. .......................................................................................................................................... 10
Figure 5 Schematic representation of the trafficking and processing of APP in the
amyloidogenic pathway. ......................................................................................................... 13
Figure 6 Schematic representation of the transmembrane domain organization of the
γ-secretase. .............................................................................................................................. 22
Figure 7 Generation of Aβ peptides by sequential cleavage at various positions in the APP
TMD by γ-secretase. ............................................................................................................... 24
Figure 8 Schematic representation of the different liposome types. ....................................... 31
Figure 9 Quality control of the Aβ26-55-NBD peptide. ......................................................... 54
Figure 10 CD spectra of Aβ peptides in 80% TFE. ................................................................ 56
Figure 11 FRET in solution experiments with Aβ26-55 WT, Aβ26-55 G33I, LLV16, and free
fluorophores. ........................................................................................................................... 57
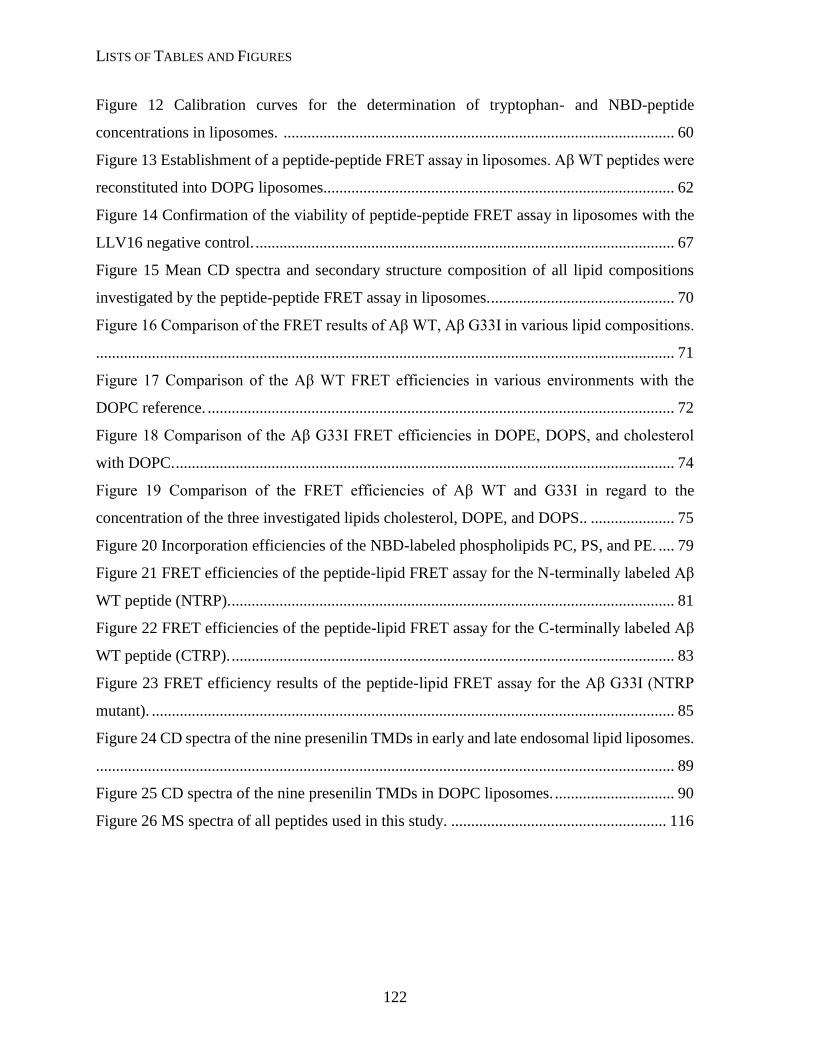
LISTS OF TABLES AND FIGURES
122
Figure 12 Calibration curves for the determination of tryptophan- and NBD-peptide
concentrations in liposomes. .................................................................................................. 60
Figure 13 Establishment of a peptide-peptide FRET assay in liposomes. Aβ WT peptides were
reconstituted into DOPG liposomes........................................................................................ 62
Figure 14 Confirmation of the viability of peptide-peptide FRET assay in liposomes with the
LLV16 negative control. ......................................................................................................... 67
Figure 15 Mean CD spectra and secondary structure composition of all lipid compositions
investigated by the peptide-peptide FRET assay in liposomes. .............................................. 70
Figure 16 Comparison of the FRET results of Aβ WT, Aβ G33I in various lipid compositions.
................................................................................................................................................. 71
Figure 17 Comparison of the Aβ WT FRET efficiencies in various environments with the
DOPC reference. ..................................................................................................................... 72
Figure 18 Comparison of the Aβ G33I FRET efficiencies in DOPE, DOPS, and cholesterol
with DOPC. ............................................................................................................................. 74
Figure 19 Comparison of the FRET efficiencies of Aβ WT and G33I in regard to the
concentration of the three investigated lipids cholesterol, DOPE, and DOPS.. ..................... 75
Figure 20 Incorporation efficiencies of the NBD-labeled phospholipids PC, PS, and PE. .... 79
Figure 21 FRET efficiencies of the peptide-lipid FRET assay for the N-terminally labeled Aβ
WT peptide (NTRP). ............................................................................................................... 81
Figure 22 FRET efficiencies of the peptide-lipid FRET assay for the C-terminally labeled Aβ
WT peptide (CTRP). ............................................................................................................... 83
Figure 23 FRET efficiency results of the peptide-lipid FRET assay for the Aβ G33I (NTRP
mutant). ................................................................................................................................... 85
Figure 24 CD spectra of the nine presenilin TMDs in early and late endosomal lipid liposomes.
................................................................................................................................................. 89
Figure 25 CD spectra of the nine presenilin TMDs in DOPC liposomes. .............................. 90
Figure 26 MS spectra of all peptides used in this study. ...................................................... 116

BIBLIOGRAPHY
123
Bibliography
1. Almen, M., Nordstrom, K., Fredriksson, R., and Schioth, H. (2009) Mapping the human membrane
proteome: a majority of the human membrane proteins can be classified according to function and
evolutionary origin, BMC Biology 7, 50.
2. Wallin, E., and von Heijne, G. (1998) Genome-wide analysis of integral membrane proteins from
eubacterial, archaean, and eukaryotic organisms, Protein Science : A Publication of the Protein Society
7, 1029-1038.
3. Krogh, A., Larsson, B., von Heijne, G., and Sonnhammer, E. L. L. (2001) Predicting transmembrane
protein topology with a hidden markov model: application to complete genomes1, Journal of Molecular
Biology 305, 567-580.
4. Stevens, T. J., and Arkin, I. T. (2000) The effect of nucleotide bias upon the composition and prediction
of transmembrane helices, Protein Science : A Publication of the Protein Society 9, 505-511.
5. Yildirim, M. A., Goh, K.-I., Cusick, M. E., Barabasi, A.-L., and Vidal, M. (2007) Drug[mdash]target
network, Nat Biotech 25, 1119-1126.
6. Overington, J. P., Al-Lazikani, B., and Hopkins, A. L. (2006) How many drug targets are there?, Nat
Rev Drug Discov 5, 993-996.
7. Querfurth, H. W., and LaFerla, F. M. (2010) Alzheimer's Disease, New England Journal of Medicine
362, 329-344.
8. Ballard, C., Gauthier, S., Corbett, A., Brayne, C., Aarsland, D., and Jones, E. (2011) Alzheimer's disease,
The Lancet 377, 1019-1031.
9. Meek, P. D., McKeithan, E. K., and Schumock, G. T. (1998) Economic Considerations in Alzheimer's
Disease, Pharmacotherapy: The Journal of Human Pharmacology and Drug Therapy 18, 68-73.
10. Campion, D., Dumanchin, C., Hannequin, D., Dubois, B., Belliard, S., Puel, M., Thomas-Anterion, C.,
Michon, A., Martin, C., Charbonnier, F., Raux, G., Camuzat, A., Penet, C., Mesnage, V., Martinez, M.,
Clerget-Darpoux, F., Brice, A., and Frebourg, T. (1999) Early-Onset Autosomal Dominant Alzheimer
Disease: Prevalence, Genetic Heterogeneity, and Mutation Spectrum, The American Journal of Human
Genetics 65, 664-670.
11. Morris, J. C. (1999) Is Alzheimer’s disease inevitable with age?: Lessons from clinicopathologic studies
of healthy aging and very mild Alzheimer's disease, Journal of Clinical Investigation 104, 1171-1173.
12. Sisodia, S. S. (1999) Series Introduction: Alzheimer’s disease: perspectives for the new millennium,
Journal of Clinical Investigation 104, 1169-1170.
13. Hardy, J. (2006) A Hundred Years of Alzheimer's Disease Research, Neuron 52, 3-13.
14. Wenk, G. L. (2003) Neuropathologic changes in Alzheimer's disease, The Journal of clinical psychiatry
64 Suppl 9, 7-10.
15. Desikan, R. S., Cabral, H. J., Hess, C. P., Dillon, W. P., Glastonbury, C. M., Weiner, M. W., Schmansky,
N. J., Greve, D. N., Salat, D. H., Buckner, R. L., and Fischl, B. (2009) Automated MRI measures identify
individuals with mild cognitive impairment and Alzheimer's disease, Vol. 132.
16. Alzheimer, A. (1907) Über eine eigenartige Erkrankung der Hirnrinde., Allgemeine Zeitschrift für
Psychiatrie und Psychisch-Gerichtliche Medizin 64, 146–148.
17. Mudher, A., and Lovestone, S. (2002) Alzheimer's disease – do tauists and baptists finally shake hands?,
Trends in Neurosciences 25, 22-26.
18. Goedert, M., and Spillantini, M. G. (2006) A Century of Alzheimer's Disease, Science (New York, N.Y.)
314, 777-781.
19. Goedert, M., Spillantini, M. G., and Crowther, R. A. (1991) Tau Proteins and Neurofibrillary
Degeneration, Brain Pathology 1, 279-286.
20. Iqbal, K., del C. Alonso, A., Chen, S., Chohan, M. O., El-Akkad, E., Gong, C.-X., Khatoon, S., Li, B.,
Liu, F., Rahman, A., Tanimukai, H., and Grundke-Iqbal, I. (2005) Tau pathology in Alzheimer disease
and other tauopathies, Biochimica et Biophysica Acta (BBA) - Molecular Basis of Disease 1739, 198-
210.
21. Chun, W., and Johnson, G. V. (2007) The role of tau phosphorylation and cleavage in neuronal cell
death, Frontiers in bioscience : a journal and virtual library 12, 733-756.
22. Hardy, J., and Allsop, D. (1991) Amyloid deposition as the central event in the aetiology of Alzheimer's
disease, Trends in Pharmacological Sciences 12, 383-388.
BIBLIOGRAPHY
124
23. Tanzi, R., Gusella, J., Watkins, P., Bruns, G., St George-Hyslop, P., Van Keuren, M., Patterson, D.,
Pagan, S., Kurnit, D., and Neve, R. (1987) Amyloid beta protein gene: cDNA, mRNA distribution, and
genetic linkage near the Alzheimer locus, Science (New York, N.Y.) 235, 880-884.
24. St George-Hyslop, P., Tanzi, R., Polinsky, R., Haines, J., Nee, L., Watkins, P., Myers, R., Feldman, R.,
Pollen, D., Drachman, D., and al., e. (1987) The genetic defect causing familial Alzheimer's disease
maps on chromosome 21, Science (New York, N.Y.) 235, 885-890.
25. Masters, C. L., Simms, G., Weinman, N. A., Multhaup, G., McDonald, B. L., and Beyreuther, K. (1985)
Amyloid plaque core protein in Alzheimer disease and Down syndrome, Proceedings of the National
Academy of Sciences of the United States of America 82, 4245-4249.
26. Kang, J., Lemaire, H. G., Unterbeck, A., Salbaum, J. M., Masters, C. L., Grzeschik, K. H., Multhaup,
G., Beyreuther, K., and Muller-Hill, B. (1987) The precursor of Alzheimer's disease amyloid A4 protein
resembles a cell-surface receptor, Nature 325, 733-736.
27. Goldgaber, D., Lerman, M. I., McBride, O. W., Saffiotti, U., and Gajdusek, D. C. (1987)
Characterization and chromosomal localization of a cDNA encoding brain amyloid of Alzheimer's
disease, Science (New York, N.Y.) 235, 877-880.
28. Lott, I. T., and Head, E. (2005) Alzheimer disease and Down syndrome: factors in pathogenesis,
Neurobiology of Aging 26, 383-389.
29. Glenner, G. G., and Wong, C. W. (1984) Alzheimer's disease: initial report of the purification and
characterization of a novel cerebrovascular amyloid protein, Biochemical and biophysical research
communications 120, 885-890.
30. Annaert, W., and De Strooper, B. (2002) A CELL BIOLOGICAL PERSPECTIVE ON ALZHEIMER'S
DISEASE, Annual Review of Cell and Developmental Biology 18, 25-51.
31. Selkoe, D., and Kopan, R. (2003) NOTCH AND PRESENILIN: Regulated Intramembrane Proteolysis
Links Development and Degeneration, Annual Review of Neuroscience 26, 565-597.
32. Lacor, P. N., Buniel, M. C., Furlow, P. W., Clemente, A. S., Velasco, P. T., Wood, M., Viola, K. L., and
Klein, W. L. (2007) Abeta oligomer-induced aberrations in synapse composition, shape, and density
provide a molecular basis for loss of connectivity in Alzheimer's disease, The Journal of neuroscience :
the official journal of the Society for Neuroscience 27, 796-807.
33. Klein, W. L., Krafft, G. A., and Finch, C. E. (2001) Targeting small Aβ oligomers: the solution to an
Alzheimer's disease conundrum?, Trends in Neurosciences 24, 219-224.
34. DaRocha-Souto, B., Scotton, T. C., Coma, M., Serrano-Pozo, A., Hashimoto, T., Serenó, L., Rodríguez,
M., Sánchez, B., Hyman, B. T., and Gómez-Isla, T. (2011) Brain Oligomeric β-Amyloid but Not Total
Amyloid Plaque Burden Correlates With Neuronal Loss and Astrocyte Inflammatory Response in
Amyloid Precursor Protein/Tau Transgenic Mice, Journal of neuropathology and experimental
neurology 70, 360-376.
35. Lue, L.-F., Kuo, Y.-M., Roher, A. E., Brachova, L., Shen, Y., Sue, L., Beach, T., Kurth, J. H., Rydel, R.
E., and Rogers, J. (1999) Soluble Amyloid β Peptide Concentration as a Predictor of Synaptic Change
in Alzheimer’s Disease, The American Journal of Pathology 155, 853-862.
36. Walsh, D. M., Klyubin, I., Fadeeva, J. V., Cullen, W. K., Anwyl, R., Wolfe, M. S., Rowan, M. J., and
Selkoe, D. J. (2002) Naturally secreted oligomers of amyloid [beta] protein potently inhibit hippocampal
long-term potentiation in vivo, Nature 416, 535-539.
37. McLean, C. A., Cherny, R. A., Fraser, F. W., Fuller, S. J., Smith, M. J., Konrad, V., Bush, A. I., and
Masters, C. L. (1999) Soluble pool of Aβ amyloid as a determinant of severity of neurodegeneration in
Alzheimer's disease, Annals of Neurology 46, 860-866.
38. Lauren, J., Gimbel, D. A., Nygaard, H. B., Gilbert, J. W., and Strittmatter, S. M. (2009) Cellular prion
protein mediates impairment of synaptic plasticity by amyloid-beta oligomers, Nature 457, 1128-1132.
39. Haass, C., and Selkoe, D. J. (2007) Soluble protein oligomers in neurodegeneration: lessons from the
Alzheimer's amyloid [beta]-peptide, Nat Rev Mol Cell Biol 8, 101-112.
40. Lambert, M. P., Barlow, A. K., Chromy, B. A., Edwards, C., Freed, R., Liosatos, M., Morgan, T. E.,
Rozovsky, I., Trommer, B., Viola, K. L., Wals, P., Zhang, C., Finch, C. E., Krafft, G. A., and Klein, W.
L. (1998) Diffusible, nonfibrillar ligands derived from Abeta1-42 are potent central nervous system
neurotoxins, PNAS 95, 6448-6453.
41. Bernstein, S. L., Dupuis, N. F., Lazo, N. D., Wyttenbach, T., Condron, M. M., Bitan, G., Teplow, D. B.,
Shea, J.-E., Ruotolo, B. T., Robinson, C. V., and Bowers, M. T. (2009) Amyloid-β protein
oligomerization and the importance of tetramers and dodecamers in the aetiology of Alzheimer’s disease,
Nature chemistry 1, 326-331.

BIBLIOGRAPHY
125
42. Lesné, S., Koh, M. T., Kotilinek, L., Kayed, R., Glabe, C. G., Yang, A., Gallagher, M., and Ashe, K. H.
(2006) A specific amyloid-[beta] protein assembly in the brain impairs memory, Nature 440, 352-357.
43. Bitan, G., Kirkitadze, M. D., Lomakin, A., Vollers, S. S., Benedek, G. B., and Teplow, D. B. (2003)
Amyloid β-protein (Aβ) assembly: Aβ40 and Aβ42 oligomerize through distinct pathways, Proceedings
of the National Academy of Sciences 100, 330-335.
44. De Strooper, B. (2010) Proteases and Proteolysis in Alzheimer Disease: A Multifactorial View on the
Disease Process, Vol. 90.
45. Straub, J. E., and Thirumalai, D. (2011) Toward a Molecular Theory of Early and Late Events in
Monomer to Amyloid Fibril Formation, Annual Review of Physical Chemistry 62, 437-463.
46. Chiti, F., and Dobson, C. M. (2006) Protein Misfolding, Functional Amyloid, and Human Disease,
Annual Review of Biochemistry 75, 333-366.
47. Xu, Y., Shen, J., Luo, X., Zhu, W., Chen, K., Ma, J., and Jiang, H. (2005) Conformational transition of
amyloid β-peptide, Proceedings of the National Academy of Sciences of the United States of America
102, 5403-5407.
48. Bartolini, M., Bertucci, C., Bolognesi, M. L., Cavalli, A., Melchiorre, C., and Andrisano, V. (2007)
Insight Into the Kinetic of Amyloid β (1–42) Peptide Self-Aggregation: Elucidation of Inhibitors’
Mechanism of Action, ChemBioChem 8, 2152-2161.
49. Haass, C., Kaether, C., Thinakaran, G., and Sisodia, S. (2012) Trafficking and proteolytic processing of
APP, Cold Spring Harbor perspectives in medicine 2, a006270.
50. Tanabe, C., Hotoda, N., Sasagawa, N., Sehara-Fujisawa, A., Maruyama, K., and Ishiura, S. (2007)
ADAM19 is tightly associated with constitutive Alzheimer's disease APP alpha-secretase in A172 cells,
Biochemical and biophysical research communications 352, 111-117.
51. Lammich, S., Kojro, E., Postina, R., Gilbert, S., Pfeiffer, R., Jasionowski, M., Haass, C., and Fahrenholz,
F. (1999) Constitutive and regulated alpha-secretase cleavage of Alzheimer's amyloid precursor protein
by a disintegrin metalloprotease, Proceedings of the National Academy of Sciences of the United States
of America 96, 3922-3927.
52. Fahrenholz, F., Gilbert, S., Kojro, E., Lammich, S., and Postina, R. (2000) Alpha-secretase activity of
the disintegrin metalloprotease ADAM 10. Influences of domain structure, Annals of the New York
Academy of Sciences 920, 215-222.
53. Asai, M., Hattori, C., Szabo, B., Sasagawa, N., Maruyama, K., Tanuma, S., and Ishiura, S. (2003)
Putative function of ADAM9, ADAM10, and ADAM17 as APP alpha-secretase, Biochemical and
biophysical research communications 301, 231-235.
54. Huovila, A. P., Turner, A. J., Pelto-Huikko, M., Karkkainen, I., and Ortiz, R. M. (2005) Shedding light
on ADAM metalloproteinases, Trends in biochemical sciences 30, 413-422.
55. Vassar, R., Bennett, B. D., Babu-Khan, S., Kahn, S., Mendiaz, E. A., Denis, P., Teplow, D. B., Ross, S.,
Amarante, P., Loeloff, R., Luo, Y., Fisher, S., Fuller, J., Edenson, S., Lile, J., Jarosinski, M. A., Biere,
A. L., Curran, E., Burgess, T., Louis, J. C., Collins, F., Treanor, J., Rogers, G., and Citron, M. (1999)
Beta-secretase cleavage of Alzheimer's amyloid precursor protein by the transmembrane aspartic
protease BACE, Science (New York, N.Y.) 286, 735-741.
56. Vassar, R. (2004) Bace 1, J Mol Neurosci 23, 105-113.
57. Cole, S. L., and Vassar, R. (2008) The role of amyloid precursor protein processing by BACE1, the beta-
secretase, in Alzheimer disease pathophysiology, The Journal of biological chemistry 283, 29621-29625.
58. Takami, M., Nagashima, Y., Sano, Y., Ishihara, S., Morishima-Kawashima, M., Funamoto, S., and Ihara,
Y. (2009) γ-Secretase: Successive Tripeptide and Tetrapeptide Release from the Transmembrane
Domain of β-Carboxyl Terminal Fragment, The Journal of Neuroscience 29, 13042-13052.
59. Qi-Takahara, Y., Morishima-Kawashima, M., Tanimura, Y., Dolios, G., Hirotani, N., Horikoshi, Y.,
Kametani, F., Maeda, M., Saido, T. C., Wang, R., and Ihara, Y. (2005) Longer Forms of Amyloid β
Protein: Implications for the Mechanism of Intramembrane Cleavage by γ-Secretase, The Journal of
Neuroscience 25, 436-445.
60. Weidemann, A., Eggert, S., Reinhard, F. B., Vogel, M., Paliga, K., Baier, G., Masters, C. L., Beyreuther,
K., and Evin, G. (2002) A novel epsilon-cleavage within the transmembrane domain of the Alzheimer
amyloid precursor protein demonstrates homology with Notch processing, Biochemistry 41, 2825-2835.
61. Sato, T., Dohmae, N., Qi, Y., Kakuda, N., Misonou, H., Mitsumori, R., Maruyama, H., Koo, E. H.,
Haass, C., Takio, K., Morishima-Kawashima, M., Ishiura, S., and Ihara, Y. (2003) Potential Link
between Amyloid β-Protein 42 and C-terminal Fragment γ 49–99 of β-Amyloid Precursor Protein,
Journal of Biological Chemistry 278, 24294-24301.
BIBLIOGRAPHY
126
62. Zhao, G., Mao, G., Tan, J., Dong, Y., Cui, M. Z., Kim, S. H., and Xu, X. (2004) Identification of a new
presenilin-dependent zeta-cleavage site within the transmembrane domain of amyloid precursor protein,
The Journal of biological chemistry 279, 50647-50650.
63. Zhao, G., Cui, M. Z., Mao, G., Dong, Y., Tan, J., Sun, L., and Xu, X. (2005) gamma-Cleavage is
dependent on zeta-cleavage during the proteolytic processing of amyloid precursor protein within its
transmembrane domain, The Journal of biological chemistry 280, 37689-37697.
64. Kukar, T. L., Ladd, T. B., Robertson, P., Pintchovski, S. A., Moore, B., Bann, M. A., Ren, Z., Jansen-
West, K., Malphrus, K., Eggert, S., Maruyama, H., Cottrell, B. A., Das, P., Basi, G. S., Koo, E. H., and
Golde, T. E. (2011) Lysine 624 of the amyloid precursor protein (APP) is a critical determinant of
amyloid beta peptide length: support for a sequential model of gamma-secretase intramembrane
proteolysis and regulation by the amyloid beta precursor protein (APP) juxtamembrane region, The
Journal of biological chemistry 286, 39804-39812.
65. Seubert, P., Vigo-Pelfrey, C., Esch, F., Lee, M., Dovey, H., Davis, D., Sinha, S., Schlossmacher, M.,
Whaley, J., Swindlehurst, C., and et al. (1992) Isolation and quantification of soluble Alzheimer's beta-
peptide from biological fluids, Nature 359, 325-327.
66. Shoji, M., Golde, T. E., Ghiso, J., Cheung, T. T., Estus, S., Shaffer, L. M., Cai, X. D., McKay, D. M.,
Tintner, R., Frangione, B., and et al. (1992) Production of the Alzheimer amyloid beta protein by normal
proteolytic processing, Science (New York, N.Y.) 258, 126-129.
67. Moghekar, A., Rao, S., Li, M., Ruben, D., Mammen, A., Tang, X., and O'Brien, R. J. (2011) Large
quantities of Abeta peptide are constitutively released during amyloid precursor protein metabolism in
vivo and in vitro, The Journal of biological chemistry 286, 15989-15997.
68. Suzuki, N., Cheung, T. T., Cai, X. D., Odaka, A., Otvos, L., Jr., Eckman, C., Golde, T. E., and Younkin,
S. G. (1994) An increased percentage of long amyloid beta protein secreted by familial amyloid beta
protein precursor (beta APP717) mutants, Science (New York, N.Y.) 264, 1336-1340.
69. Younkin, S. G. (1998) The role of A beta 42 in Alzheimer's disease, Journal of physiology, Paris 92,
289-292.
70. Kaether, C., Haass, C., and Steiner, H. (2006) Assembly, trafficking and function of gamma-secretase,
Neuro-degenerative diseases 3, 275-283.
71. Patterson, C., Feightner, J. W., Garcia, A., Hsiung, G. Y., MacKnight, C., and Sadovnick, A. D. (2008)
Diagnosis and treatment of dementia: 1. Risk assessment and primary prevention of Alzheimer disease,
CMAJ : Canadian Medical Association journal = journal de l'Association medicale canadienne 178,
548-556.
72. Luchsinger, J. A., and Mayeux, R. (2004) Dietary factors and Alzheimer's disease, The Lancet Neurology
3, 579-587.
73. Kawas, C. H. (2006) Medications and diet: protective factors for AD?, Alzheimer disease and associated
disorders 20, S89-96.
74. Hu, N., Yu, J.-T., Tan, L., Wang, Y.-L., Sun, L., and Tan, L. (2013) Nutrition and the Risk of Alzheimer's
Disease, BioMed Research International 2013, 12.
75. Tsai, M. S., Tangalos, E. G., Petersen, R. C., Smith, G. E., Schaid, D. J., Kokmen, E., Ivnik, R. J., and
Thibodeau, S. N. (1994) Apolipoprotein E: risk factor for Alzheimer disease, American Journal of
Human Genetics 54, 643-649.
76. St Clair, D., Rennie, M., Slorach, E., Norrman, J., Yates, C., and Carothers, A. (1995) Apolipoprotein E
epsilon 4 allele is a risk factor for familial and sporadic presenile Alzheimer's disease in both homozygote
and heterozygote carriers, Journal of Medical Genetics 32, 642-644.
77. Saunders, A. M., Strittmatter, W. J., Schmechel, D., George-Hyslop, P. H., Pericak-Vance, M. A., Joo,
S. H., Rosi, B. L., Gusella, J. F., Crapper-MacLachlan, D. R., Alberts, M. J., and et al. (1993) Association
of apolipoprotein E allele epsilon 4 with late-onset familial and sporadic Alzheimer's disease, Neurology
43, 1467-1472.
78. Poirier, J., Bertrand, P., Poirier, J., Kogan, S., Gauthier, S., Poirier, J., Gauthier, S., Davignon, J.,
Bouthillier, D., and Davignon, J. (1993) Apolipoprotein E polymorphism and Alzheimer's disease, The
Lancet 342, 697-699.
79. Shariati, S. A., and De Strooper, B. (2013) Redundancy and divergence in the amyloid precursor protein
family, FEBS letters 587, 2036-2045.
80. Kaden, D., Munter, L. M., Reif, B., and Multhaup, G. (2012) The amyloid precursor protein and its
homologues: Structural and functional aspects of native and pathogenic oligomerization, European
Journal of Cell Biology 91, 234-239.

BIBLIOGRAPHY
127
81. Jacobsen, K. T., and Iverfeldt, K. (2009) Amyloid precursor protein and its homologues: a family of
proteolysis-dependent receptors, Cellular and molecular life sciences : CMLS 66, 2299-2318.
82. Tanzi, R. E., McClatchey, A. I., Lamperti, E. D., Villa-Komaroff, L., Gusella, J. F., and Neve, R. L.
(1988) Protease inhibitor domain encoded by an amyloid protein precursor mRNA associated with
Alzheimer's disease, Nature 331, 528-530.
83. Yoshikai, S., Sasaki, H., Doh-ura, K., Furuya, H., and Sakaki, Y. (1990) Genomic organization of the
human amyloid beta-protein precursor gene, Gene 87, 257-263.
84. Tang, K., Wang, C., Shen, C., Sheng, S., Ravid, R., and Jing, N. (2003) Identification of a novel
alternative splicing isoform of human amyloid precursor protein gene, APP639, European Journal of
Neuroscience 18, 102-108.
85. Sandbrink, R., Masters, C. L., and Beyreuther, K. (1996) APP gene family. Alternative splicing generates
functionally related isoforms, Annals of the New York Academy of Sciences 777, 281-287.
86. Sisodia, S. S., Koo, E. H., Hoffman, P. N., Perry, G., and Price, D. L. (1993) Identification and transport
of full-length amyloid precursor proteins in rat peripheral nervous system, The Journal of neuroscience
: the official journal of the Society for Neuroscience 13, 3136-3142.
87. Ponte, P., Gonzalez-DeWhitt, P., Schilling, J., Miller, J., Hsu, D., Greenberg, B., Davis, K., Wallace,
W., Lieberburg, I., and Fuller, F. (1988) A new A4 amyloid mRNA contains a domain homologous to
serine proteinase inhibitors, Nature 331, 525-527.
88. Haass, C., Hung, A., and Selkoe, D. (1991) Processing of beta-amyloid precursor protein in microglia
and astrocytes favors an internal localization over constitutive secretion, The Journal of Neuroscience
11, 3783-3793.
89. Menendez-Gonzalez, M., Perez-Pinera, P., Martinez-Rivera, M., Calatayud, M. T., and Blazquez Menes,
B. (2005) APP processing and the APP-KPI domain involvement in the amyloid cascade, Neuro-
degenerative diseases 2, 277-283.
90. Matsui, T., Ingelsson, M., Fukumoto, H., Ramasamy, K., Kowa, H., Frosch, M. P., Irizarry, M. C., and
Hyman, B. T. (2007) Expression of APP pathway mRNAs and proteins in Alzheimer's disease, Brain
research 1161, 116-123.
91. Kitaguchi, N., Takahashi, Y., Tokushima, Y., Shiojiri, S., and Ito, H. (1988) Novel precursor of
Alzheimer's disease amyloid protein shows protease inhibitory activity, Nature 331, 530-532.
92. Selkoe, D. J. (1998) The cell biology of β-amyloid precursor protein and presenilin in Alzheimer's
disease, Trends in Cell Biology 8, 447-453.
93. De Strooper, B., and Annaert, W. (2000) Proteolytic processing and cell biological functions of the
amyloid precursor protein, Journal of cell science 113 ( Pt 11), 1857-1870.
94. Dahms, S. O., Hoefgen, S., Roeser, D., Schlott, B., Guhrs, K. H., and Than, M. E. (2010) Structure and
biochemical analysis of the heparin-induced E1 dimer of the amyloid precursor protein, Proceedings of
the National Academy of Sciences of the United States of America 107, 5381-5386.
95. Rossjohn, J., Cappai, R., Feil, S. C., Henry, A., McKinstry, W. J., Galatis, D., Hesse, L., Multhaup, G.,
Beyreuther, K., Masters, C. L., and Parker, M. W. (1999) Crystal structure of the N-terminal, growth
factor-like domain of Alzheimer amyloid precursor protein, Nature structural biology 6, 327-331.
96. Kong, G. K., Adams, J. J., Harris, H. H., Boas, J. F., Curtain, C. C., Galatis, D., Masters, C. L., Barnham,
K. J., McKinstry, W. J., Cappai, R., and Parker, M. W. (2007) Structural studies of the Alzheimer's
amyloid precursor protein copper-binding domain reveal how it binds copper ions, J Mol Biol 367, 148-
161.
97. Barnham, K. J., McKinstry, W. J., Multhaup, G., Galatis, D., Morton, C. J., Curtain, C. C., Williamson,
N. A., White, A. R., Hinds, M. G., Norton, R. S., Beyreuther, K., Masters, C. L., Parker, M. W., and
Cappai, R. (2003) Structure of the Alzheimer's Disease Amyloid Precursor Protein Copper Binding
Domain: A REGULATOR OF NEURONAL COPPER HOMEOSTASIS, Journal of Biological
Chemistry 278, 17401-17407.
98. Coburger, I., Hoefgen, S., and Than, M. E. (2014) The structural biology of the amyloid precursor protein
APP - a complex puzzle reveals its multi-domain architecture, Biological chemistry 395, 485-498.
99. Walter, J., Capell, A., Hung, A. Y., Langen, H., Schnolzer, M., Thinakaran, G., Sisodia, S. S., Selkoe,
D. J., and Haass, C. (1997) Ectodomain phosphorylation of beta-amyloid precursor protein at two distinct
cellular locations, The Journal of biological chemistry 272, 1896-1903.
100. Walter, J., Schindzielorz, A., Hartung, B., and Haass, C. (2000) Phosphorylation of the β-Amyloid
Precursor Protein at the Cell Surface by Ectocasein Kinases 1 and 2, Journal of Biological Chemistry
275, 23523-23529.

BIBLIOGRAPHY
128
101. Bush, A. I., Multhaup, G., Moir, R. D., Williamson, T. G., Small, D. H., Rumble, B., Pollwein, P.,
Beyreuther, K., and Masters, C. L. (1993) A novel zinc(II) binding site modulates the function of the
beta A4 amyloid protein precursor of Alzheimer's disease, The Journal of biological chemistry 268,
16109-16112.
102. Klatt, S., Rohe, M., Alagesan, K., Kolarich, D., Konthur, Z., and Hartl, D. (2013) Production of
glycosylated soluble amyloid precursor protein alpha (sAPPalpha) in Leishmania tarentolae, Journal of
proteome research 12, 396-403.
103. Perdivara, I., Petrovich, R., Alliquant, B., Deterding, L. J., Tomer, K. B., and Przybylski, M. (2009)
Elucidation of O-glycosylation structures of the ß-amyloid precursor protein by liquid chromatography
- mass spectrometry using electron transfer dissociation and collision induced dissociation, Journal of
proteome research 8, 631-642.
104. Dahms, S. O., Könnig, I., Roeser, D., Gührs, K.-H., Mayer, M. C., Kaden, D., Multhaup, G., and Than,
M. E. (2012) Metal Binding Dictates Conformation and Function of the Amyloid Precursor Protein
(APP) E2 Domain, Journal of Molecular Biology 416, 438-452.
105. Keil, C., Huber, R., Bode, W., and Than, M. E. (2004) Cloning, expression, crystallization and initial
crystallographic analysis of the C-terminal domain of the amyloid precursor protein APP, Acta
crystallographica. Section D, Biological crystallography 60, 1614-1617.
106. Wang, Y., and Ha, Y. (2004) The X-ray structure of an antiparallel dimer of the human amyloid precursor
protein E2 domain, Molecular cell 15, 343-353.
107. Dulubova, I., Ho, A., Huryeva, I., Südhof, T. C., and Rizo, J. (2004) Three-Dimensional Structure of an
Independently Folded Extracellular Domain of Human Amyloid-β Precursor Protein†,‡, Biochemistry
43, 9583-9588.
108. Mok, S. S., Sberna, G., Heffernan, D., Cappai, R., Galatis, D., Clarris, H. J., Sawyer, W. H., Beyreuther,
K., Masters, C. L., and Small, D. H. (1997) Expression and analysis of heparin-binding regions of the
amyloid precursor protein of Alzheimer's disease, FEBS letters 415, 303-307.
109. Hoopes, J. T., Liu, X., Xu, X., Demeler, B., Folta-Stogniew, E., Li, C., and Ha, Y. (2010) Structural
characterization of the E2 domain of APL-1, a Caenorhabditis elegans homolog of human amyloid
precursor protein, and its heparin binding site, The Journal of biological chemistry 285, 2165-2173.
110. Lee, S., Xue, Y., Hu, J., Wang, Y., Liu, X., Demeler, B., and Ha, Y. (2011) The E2 Domains of APP
and APLP1 Share a Conserved Mode of Dimerization, Biochemistry 50, 5453-5464.
111. Barrett, P. J., Song, Y., Van Horn, W. D., Hustedt, E. J., Schafer, J. M., Hadziselimovic, A., Beel, A. J.,
and Sanders, C. R. (2012) The amyloid precursor protein has a flexible transmembrane domain and binds
cholesterol, Science (New York, N.Y.) 336, 1168-1171.
112. Scharnagl, C., Pester, O., Hornburg, P., Hornburg, D., Gotz, A., and Langosch, D. (2014) Side-chain to
main-chain hydrogen bonding controls the intrinsic backbone dynamics of the amyloid precursor protein
transmembrane helix, Biophysical journal 106, 1318-1326.
113. Pester, O., Gotz, A., Multhaup, G., Scharnagl, C., and Langosch, D. (2013) The cleavage domain of the
amyloid precursor protein transmembrane helix does not exhibit above-average backbone dynamics,
Chembiochem 14, 1943-1948.
114. Pester, O., Barrett, P. J., Hornburg, D., Hornburg, P., Probstle, R., Widmaier, S., Kutzner, C., Durrbaum,
M., Kapurniotu, A., Sanders, C. R., Scharnagl, C., and Langosch, D. (2013) The backbone dynamics of
the amyloid precursor protein transmembrane helix provides a rationale for the sequential cleavage
mechanism of gamma-secretase, Journal of the American Chemical Society 135, 1317-1329.
115. Munter, L.-M., Voigt, P., Harmeier, A., Kaden, D., Gottschalk, K. E., Weise, C., Pipkorn, R., Schaefer,
M., Langosch, D., and Multhaup, G. (2007) GxxxG motifs within the amyloid precursor protein
transmembrane sequence are critical for the etiology of Aβ42, The EMBO Journal 26, 1702-1712.
116. Kaden, D., Munter, L.-M., Joshi, M., Treiber, C., Weise, C., Bethge, T., Voigt, P., Schaefer, M.,
Beyermann, M., Reif, B., and Multhaup, G. (2008) Homophilic Interactions of the Amyloid Precursor
Protein (APP) Ectodomain Are Regulated by the Loop Region and Affect β-Secretase Cleavage of APP,
Journal of Biological Chemistry 283, 7271-7279.
117. Sato, T., Tang, T.-c., Reubins, G., Fei, J. Z., Fujimoto, T., Kienlen-Campard, P., Constantinescu, S. N.,
Octave, J.-N., Aimoto, S., and Smith, S. O. (2009) A helix-to-coil transition at the ε-cut site in the
transmembrane dimer of the amyloid precursor protein is required for proteolysis, Proceedings of the
National Academy of Sciences of the United States of America 106, 1421-1426.

BIBLIOGRAPHY
129
118. Wang, H., Barreyro, L., Provasi, D., Djemil, I., Torres-Arancivia, C., Filizola, M., and Ubarretxena-
Belandia, I. (2011) Molecular determinants and thermodynamics of the amyloid precursor protein
transmembrane domain implicated in Alzheimer's disease, Journal of molecular biology 408, 879-895.
119. Gorman, P., Kim, S., Guo, M., Melnyk, R., McLaurin, J., Fraser, P., Bowie, J., and Chakrabartty, A.
(2008) Dimerization of the transmembrane domain of amyloid precursor proteins and familial
Alzheimer's disease mutants, BMC Neuroscience 9, 17.
120. Nadezhdin, K. D., Bocharova, O. V., Bocharov, E. V., and Arseniev, A. S. (2012) Dimeric structure of
transmembrane domain of amyloid precursor protein in micellar environment, FEBS letters 586, 1687-
1692.
121. Song, Y., Hustedt, E. J., Brandon, S., and Sanders, C. R. (2013) Competition between homodimerization
and cholesterol binding to the C99 domain of the amyloid precursor protein, Biochemistry 52, 5051-
5064.
122. Beel, A. J., Sakakura, M., Barrett, P. J., and Sanders, C. R. (2010) Direct binding of cholesterol to the
amyloid precursor protein: An important interaction in lipid-Alzheimer's disease relationships?,
Biochimica et biophysica acta 1801, 975-982.
123. Beel, A. J., Mobley, C. K., Kim, H. J., Tian, F., Hadziselimovic, A., Jap, B., Prestegard, J. H., and
Sanders, C. R. (2008) Structural Studies of the Transmembrane C-Terminal Domain of the Amyloid
Precursor Protein (APP): Does APP Function as a Cholesterol Sensor?(,), Biochemistry 47, 9428-9446.
124. Ramelot, T. A., Gentile, L. N., and Nicholson, L. K. (2000) Transient Structure of the Amyloid Precursor
Protein Cytoplasmic Tail Indicates Preordering of Structure for Binding to Cytosolic Factors†,
Biochemistry 39, 2714-2725.
125. Kroenke, C. D., Ziemnicka-Kotula, D., Xu, J., Kotula, L., and Palmer, A. G. (1997) Solution
Conformations of a Peptide Containing the Cytoplasmic Domain Sequence of the β Amyloid Precursor
Protein, Biochemistry 36, 8145-8152.
126. Cao, X., and Südhof, T. C. (2004) Dissection of Amyloid-β Precursor Protein-dependent Transcriptional
Transactivation, Journal of Biological Chemistry 279, 24601-24611.
127. Cao, X., and Sudhof, T. C. (2001) A transcriptionally [correction of transcriptively] active complex of
APP with Fe65 and histone acetyltransferase Tip60, Science (New York, N.Y.) 293, 115-120.
128. McLoughlin, D. M., and Miller, C. C. J. (2008) The FE65 proteins and Alzheimer's disease, Journal of
Neuroscience Research 86, 744-754.
129. Muller, T., Meyer, H. E., Egensperger, R., and Marcus, K. (2008) The amyloid precursor protein
intracellular domain (AICD) as modulator of gene expression, apoptosis, and cytoskeletal dynamics-
relevance for Alzheimer's disease, Prog Neurobiol 85, 393-406.
130. Müller, T., Concannon, C. G., Ward, M. W., Walsh, C. M., Tirniceriu, A. L., Tribl, F., Kögel, D., Prehn,
J. H. M., and Egensperger, R. (2007) Modulation of Gene Expression and Cytoskeletal Dynamics by the
Amyloid Precursor Protein Intracellular Domain (AICD), Molecular Biology of the Cell 18, 201-210.
131. Pardossi-Piquard, R., and Checler, F. (2012) The physiology of the β-amyloid precursor protein
intracellular domain AICD, Journal of Neurochemistry 120, 109-124.
132. Chakrabarti, A., and Mukhopadhyay, D. (2012) Novel Adaptors of Amyloid Precursor Protein
Intracellular Domain and Their Functional Implications, Genomics, Proteomics & Bioinformatics 10,
208-216.
133. Borg, J. P., Ooi, J., Levy, E., and Margolis, B. (1996) The phosphotyrosine interaction domains of X11
and FE65 bind to distinct sites on the YENPTY motif of amyloid precursor protein, Molecular and
Cellular Biology 16, 6229-6241.
134. Thinakaran, G., and Koo, E. H. (2008) Amyloid Precursor Protein Trafficking, Processing, and Function,
Journal of Biological Chemistry 283, 29615-29619.
135. Turner, P. R., O'Connor, K., Tate, W. P., and Abraham, W. C. (2003) Roles of amyloid precursor protein
and its fragments in regulating neural activity, plasticity and memory, Prog Neurobiol 70, 1-32.
136. Weidemann, A., Konig, G., Bunke, D., Fischer, P., Salbaum, J. M., Masters, C. L., and Beyreuther, K.
(1989) Identification, biogenesis, and localization of precursors of Alzheimer's disease A4 amyloid
protein, Cell 57, 115-126.
137. Dyrks, T., Weidemann, A., Multhaup, G., Salbaum, J. M., Lemaire, H. G., Kang, J., Muller-Hill, B.,
Masters, C. L., and Beyreuther, K. (1988) Identification, transmembrane orientation and biogenesis of
the amyloid A4 precursor of Alzheimer's disease, EMBO J 7, 949-957.
138. Hung, A. Y., and Selkoe, D. J. (1994) Selective ectodomain phosphorylation and regulated cleavage of
beta-amyloid precursor protein, The EMBO Journal 13, 534-542.

BIBLIOGRAPHY
130
139. Caporaso, G. L., Takei, K., Gandy, S. E., Matteoli, M., Mundigl, O., Greengard, P., and De Camilli, P.
(1994) Morphologic and biochemical analysis of the intracellular trafficking of the Alzheimer beta/A4
amyloid precursor protein, The Journal of neuroscience : the official journal of the Society for
Neuroscience 14, 3122-3138.
140. Koo, E. H., Squazzo, S. L., Selkoe, D. J., and Koo, C. H. (1996) Trafficking of cell-surface amyloid
beta-protein precursor. I. Secretion, endocytosis and recycling as detected by labeled monoclonal
antibody, Journal of cell science 109 ( Pt 5), 991-998.
141. Koo, E. H., and Squazzo, S. L. (1994) Evidence that production and release of amyloid beta-protein
involves the endocytic pathway, The Journal of biological chemistry 269, 17386-17389.
142. Perez, R. G., Soriano, S., Hayes, J. D., Ostaszewski, B., Xia, W., Selkoe, D. J., Chen, X., Stokin, G. B.,
and Koo, E. H. (1999) Mutagenesis identifies new signals for beta-amyloid precursor protein
endocytosis, turnover, and the generation of secreted fragments, including Abeta42, The Journal of
biological chemistry 274, 18851-18856.
143. Lai, A., Sisodia, S. S., and Trowbridge, I. S. (1995) Characterization of sorting signals in the beta-
amyloid precursor protein cytoplasmic domain, The Journal of biological chemistry 270, 3565-3573.
144. Haass, C., Koo, E. H., Mellon, A., Hung, A. Y., and Selkoe, D. J. (1992) Targeting of cell-surface beta-
amyloid precursor protein to lysosomes: alternative processing into amyloid-bearing fragments, Nature
357, 500-503.
145. Nordstedt, C., Caporaso, G. L., Thyberg, J., Gandy, S. E., and Greengard, P. (1993) Identification of the
Alzheimer beta/A4 amyloid precursor protein in clathrin-coated vesicles purified from PC12 cells, The
Journal of biological chemistry 268, 608-612.
146. Yamazaki, T., Koo, E. H., and Selkoe, D. J. (1996) Trafficking of cell-surface amyloid beta-protein
precursor. II. Endocytosis, recycling and lysosomal targeting detected by immunolocalization, Journal
of cell science 109 ( Pt 5), 999-1008.
147. Selkoe, D. J., Yamazaki, T., Citron, M., Podlisny, M. B., Koo, E. H., Teplow, D. B., and Haass, C.
(1996) The role of APP processing and trafficking pathways in the formation of amyloid beta-protein,
Annals of the New York Academy of Sciences 777, 57-64.
148. Parvathy, S., Hussain, I., Karran, E. H., Turner, A. J., and Hooper, N. M. (1999) Cleavage of Alzheimer's
amyloid precursor protein by alpha-secretase occurs at the surface of neuronal cells, Biochemistry 38,
9728-9734.
149. Zhang, J., Kang, D. E., Xia, W., Okochi, M., Mori, H., Selkoe, D. J., and Koo, E. H. (1998) Subcellular
distribution and turnover of presenilins in transfected cells, The Journal of biological chemistry 273,
12436-12442.
150. Schrader-Fischer, G., and Paganetti, P. A. (1996) Effect of alkalizing agents on the processing of the
beta-amyloid precursor protein, Brain research 716, 91-100.
151. Siman, R., Mistretta, S., Durkin, J. T., Savage, M. J., Loh, T., Trusko, S., and Scott, R. W. (1993)
Processing of the beta-amyloid precursor. Multiple proteases generate and degrade potentially
amyloidogenic fragments, The Journal of biological chemistry 268, 16602-16609.
152. Andersen, O. M., Reiche, J., Schmidt, V., Gotthardt, M., Spoelgen, R., Behlke, J., von Arnim, C. A.,
Breiderhoff, T., Jansen, P., Wu, X., Bales, K. R., Cappai, R., Masters, C. L., Gliemann, J., Mufson, E.
J., Hyman, B. T., Paul, S. M., Nykjaer, A., and Willnow, T. E. (2005) Neuronal sorting protein-related
receptor sorLA/LR11 regulates processing of the amyloid precursor protein, Proceedings of the National
Academy of Sciences of the United States of America 102, 13461-13466.
153. Schmidt, V., Sporbert, A., Rohe, M., Reimer, T., Rehm, A., Andersen, O. M., and Willnow, T. E. (2007)
SorLA/LR11 regulates processing of amyloid precursor protein via interaction with adaptors GGA and
PACS-1, The Journal of biological chemistry 282, 32956-32964.
154. Rogaeva, E., Meng, Y., Lee, J. H., Gu, Y., Kawarai, T., Zou, F., Katayama, T., Baldwin, C. T., Cheng,
R., Hasegawa, H., Chen, F., Shibata, N., Lunetta, K. L., Pardossi-Piquard, R., Bohm, C., Wakutani, Y.,
Cupples, L. A., Cuenco, K. T., Green, R. C., Pinessi, L., Rainero, I., Sorbi, S., Bruni, A., Duara, R.,
Friedland, R. P., Inzelberg, R., Hampe, W., Bujo, H., Song, Y. Q., Andersen, O. M., Willnow, T. E.,
Graff-Radford, N., Petersen, R. C., Dickson, D., Der, S. D., Fraser, P. E., Schmitt-Ulms, G., Younkin,
S., Mayeux, R., Farrer, L. A., and St George-Hyslop, P. (2007) The neuronal sortilin-related receptor
SORL1 is genetically associated with Alzheimer disease, Nature genetics 39, 168-177.
155. Wang, R., Meschia, J. F., Cotter, R. J., and Sisodia, S. S. (1991) Secretion of the beta/A4 amyloid
precursor protein. Identification of a cleavage site in cultured mammalian cells, The Journal of biological
chemistry 266, 16960-16964.

BIBLIOGRAPHY
131
156. Esch, F. S., Keim, P. S., Beattie, E. C., Blacher, R. W., Culwell, A. R., Oltersdorf, T., McClure, D., and
Ward, P. J. (1990) Cleavage of amyloid beta peptide during constitutive processing of its precursor,
Science (New York, N.Y.) 248, 1122-1124.
157. Anderson, J. P., Esch, F. S., Keim, P. S., Sambamurti, K., Lieberburg, I., and Robakis, N. K. (1991)
Exact cleavage site of Alzheimer amyloid precursor in neuronal PC-12 cells, Neuroscience letters 128,
126-128.
158. Caporaso, G. L., Gandy, S. E., Buxbaum, J. D., Ramabhadran, T. V., and Greengard, P. (1992) Protein
phosphorylation regulates secretion of Alzheimer beta/A4 amyloid precursor protein, Proceedings of the
National Academy of Sciences of the United States of America 89, 3055-3059.
159. Buxbaum, J. D., Koo, E. H., and Greengard, P. (1993) Protein phosphorylation inhibits production of
Alzheimer amyloid beta/A4 peptide, Proceedings of the National Academy of Sciences of the United
States of America 90, 9195-9198.
160. Hung, A. Y., Haass, C., Nitsch, R. M., Qiu, W. Q., Citron, M., Wurtman, R. J., Growdon, J. H., and
Selkoe, D. J. (1993) Activation of protein kinase C inhibits cellular production of the amyloid beta-
protein, The Journal of biological chemistry 268, 22959-22962.
161. Roberts, S. B., Ripellino, J. A., Ingalls, K. M., Robakis, N. K., and Felsenstein, K. M. (1994) Non-
amyloidogenic cleavage of the beta-amyloid precursor protein by an integral membrane
metalloendopeptidase, The Journal of biological chemistry 269, 3111-3116.
162. McDermott, J. R., and Gibson, A. M. (1991) The processing of Alzheimer A4/beta-amyloid protein
precursor: identification of a human brain metallopeptidase which cleaves -Lys-Leu- in a model peptide,
Biochemical and biophysical research communications 179, 1148-1154.
163. Edwards, D. R., Handsley, M. M., and Pennington, C. J. (2008) The ADAM metalloproteinases,
Molecular aspects of medicine 29, 258-289.
164. Blobel, C. P. (2005) ADAMs: key components in EGFR signalling and development, Nat Rev Mol Cell
Biol 6, 32-43.
165. Baker, A. H., Edwards, D. R., and Murphy, G. (2002) Metalloproteinase inhibitors: biological actions
and therapeutic opportunities, Journal of cell science 115, 3719-3727.
166. Marambaud, P., and Robakis, N. K. (2005) Genetic and molecular aspects of Alzheimer's disease shed
light on new mechanisms of transcriptional regulation, Genes, brain, and behavior 4, 134-146.
167. Buxbaum, J. D., Liu, K. N., Luo, Y., Slack, J. L., Stocking, K. L., Peschon, J. J., Johnson, R. S., Castner,
B. J., Cerretti, D. P., and Black, R. A. (1998) Evidence that tumor necrosis factor alpha converting
enzyme is involved in regulated alpha-secretase cleavage of the Alzheimer amyloid protein precursor,
The Journal of biological chemistry 273, 27765-27767.
168. Slack, B. E., Ma, L. K., and Seah, C. C. (2001) Constitutive shedding of the amyloid precursor protein
ectodomain is up-regulated by tumour necrosis factor-alpha converting enzyme, The Biochemical
journal 357, 787-794.
169. Kuhn, P. H., Wang, H., Dislich, B., Colombo, A., Zeitschel, U., Ellwart, J. W., Kremmer, E., Rossner,
S., and Lichtenthaler, S. F. (2010) ADAM10 is the physiologically relevant, constitutive alpha-secretase
of the amyloid precursor protein in primary neurons, EMBO J 29, 3020-3032.
170. Jorissen, E., Prox, J., Bernreuther, C., Weber, S., Schwanbeck, R., Serneels, L., Snellinx, A., Craessaerts,
K., Thathiah, A., Tesseur, I., Bartsch, U., Weskamp, G., Blobel, C. P., Glatzel, M., De Strooper, B., and
Saftig, P. (2010) The disintegrin/metalloproteinase ADAM10 is essential for the establishment of the
brain cortex, The Journal of neuroscience : the official journal of the Society for Neuroscience 30, 4833-
4844.
171. Allinson, T. M., Parkin, E. T., Condon, T. P., Schwager, S. L., Sturrock, E. D., Turner, A. J., and Hooper,
N. M. (2004) The role of ADAM10 and ADAM17 in the ectodomain shedding of angiotensin converting
enzyme and the amyloid precursor protein, European journal of biochemistry / FEBS 271, 2539-2547.
172. Koike, H., Tomioka, S., Sorimachi, H., Saido, T. C., Maruyama, K., Okuyama, A., Fujisawa-Sehara, A.,
Ohno, S., Suzuki, K., and Ishiura, S. (1999) Membrane-anchored metalloprotease MDC9 has an alpha-
secretase activity responsible for processing the amyloid precursor protein, The Biochemical journal 343
Pt 2, 371-375.
173. Weskamp, G., Cai, H., Brodie, T. A., Higashyama, S., Manova, K., Ludwig, T., and Blobel, C. P. (2002)
Mice lacking the metalloprotease-disintegrin MDC9 (ADAM9) have no evident major abnormalities
during development or adult life, Mol Cell Biol 22, 1537-1544.
174. Tousseyn, T., Thathiah, A., Jorissen, E., Raemaekers, T., Konietzko, U., Reiss, K., Maes, E., Snellinx,
A., Serneels, L., Nyabi, O., Annaert, W., Saftig, P., Hartmann, D., and De Strooper, B. (2009) ADAM10,
BIBLIOGRAPHY
132
the rate-limiting protease of regulated intramembrane proteolysis of Notch and other proteins, is
processed by ADAMS-9, ADAMS-15, and the gamma-secretase, The Journal of biological chemistry
284, 11738-11747.
175. Citron, M., Teplow, D. B., and Selkoe, D. J. (1995) Generation of amyloid beta protein from its precursor
is sequence specific, Neuron 14, 661-670.
176. Hussain, I., Powell, D., Howlett, D. R., Tew, D. G., Meek, T. D., Chapman, C., Gloger, I. S., Murphy,
K. E., Southan, C. D., Ryan, D. M., Smith, T. S., Simmons, D. L., Walsh, F. S., Dingwall, C., and
Christie, G. (1999) Identification of a novel aspartic protease (Asp 2) as beta-secretase, Molecular and
cellular neurosciences 14, 419-427.
177. Sinha, S., Anderson, J. P., Barbour, R., Basi, G. S., Caccavello, R., Davis, D., Doan, M., Dovey, H. F.,
Frigon, N., Hong, J., Jacobson-Croak, K., Jewett, N., Keim, P., Knops, J., Lieberburg, I., Power, M.,
Tan, H., Tatsuno, G., Tung, J., Schenk, D., Seubert, P., Suomensaari, S. M., Wang, S., Walker, D., Zhao,
J., McConlogue, L., and John, V. (1999) Purification and cloning of amyloid precursor protein beta-
secretase from human brain, Nature 402, 537-540.
178. Yan, R., Bienkowski, M. J., Shuck, M. E., Miao, H., Tory, M. C., Pauley, A. M., Brashier, J. R.,
Stratman, N. C., Mathews, W. R., Buhl, A. E., Carter, D. B., Tomasselli, A. G., Parodi, L. A., Heinrikson,
R. L., and Gurney, M. E. (1999) Membrane-anchored aspartyl protease with Alzheimer's disease beta-
secretase activity, Nature 402, 533-537.
179. Lin, X., Koelsch, G., Wu, S., Downs, D., Dashti, A., and Tang, J. (2000) Human aspartic protease
memapsin 2 cleaves the beta-secretase site of beta-amyloid precursor protein, Proceedings of the
National Academy of Sciences of the United States of America 97, 1456-1460.
180. Acquati, F., Accarino, M., Nucci, C., Fumagalli, P., Jovine, L., Ottolenghi, S., and Taramelli, R. (2000)
The gene encoding DRAP (BACE2), a glycosylated transmembrane protein of the aspartic protease
family, maps to the down critical region, FEBS letters 468, 59-64.
181. Bennett, B. D., Babu-Khan, S., Loeloff, R., Louis, J. C., Curran, E., Citron, M., and Vassar, R. (2000)
Expression analysis of BACE2 in brain and peripheral tissues, The Journal of biological chemistry 275,
20647-20651.
182. Solans, A., Estivill, X., and de La Luna, S. (2000) A new aspartyl protease on 21q22.3, BACE2, is highly
similar to Alzheimer's amyloid precursor protein beta-secretase, Cytogenetics and cell genetics 89, 177-
184.
183. Saunders, A. J., Kim, T.-W., and Tanzi, R. E. (1999) BACE Maps to Chromosome 11 and a BACE
Homolog, BACE2, Reside in the Obligate Down Syndrome Region of Chromosome 21, Science (New
York, N.Y.) 286, 1255.
184. Seubert, P., Oltersdorf, T., Lee, M. G., Barbour, R., Blomquist, C., Davis, D. L., Bryant, K., Fritz, L. C.,
Galasko, D., Thal, L. J., and et al. (1993) Secretion of beta-amyloid precursor protein cleaved at the
amino terminus of the beta-amyloid peptide, Nature 361, 260-263.
185. Zhao, J., Paganini, L., Mucke, L., Gordon, M., Refolo, L., Carman, M., Sinha, S., Oltersdorf, T.,
Lieberburg, I., and McConlogue, L. (1996) Beta-secretase processing of the beta-amyloid precursor
protein in transgenic mice is efficient in neurons but inefficient in astrocytes, The Journal of biological
chemistry 271, 31407-31411.
186. Marcinkiewicz, M., and Seidah, N. G. (2000) Coordinated expression of beta-amyloid precursor protein
and the putative beta-secretase BACE and alpha-secretase ADAM10 in mouse and human brain, J
Neurochem 75, 2133-2143.
187. Haass, C., Hung, A. Y., Schlossmacher, M. G., Teplow, D. B., and Selkoe, D. J. (1993) beta-Amyloid
peptide and a 3-kDa fragment are derived by distinct cellular mechanisms, The Journal of biological
chemistry 268, 3021-3024.
188. Haass, C., Capell, A., Citron, M., Teplow, D. B., and Selkoe, D. J. (1995) The vacuolar H(+)-ATPase
inhibitor bafilomycin A1 differentially affects proteolytic processing of mutant and wild-type beta-
amyloid precursor protein, The Journal of biological chemistry 270, 6186-6192.
189. Knops, J., Suomensaari, S., Lee, M., McConlogue, L., Seubert, P., and Sinha, S. (1995) Cell-type and
amyloid precursor protein-type specific inhibition of A beta release by bafilomycin A1, a selective
inhibitor of vacuolar ATPases, The Journal of biological chemistry 270, 2419-2422.
190. Roher, A. E., Lowenson, J. D., Clarke, S., Wolkow, C., Wang, R., Cotter, R. J., Reardon, I. M., Zurcher-
Neely, H. A., Heinrikson, R. L., Ball, M. J., and et al. (1993) Structural alterations in the peptide
backbone of beta-amyloid core protein may account for its deposition and stability in Alzheimer's
disease, The Journal of biological chemistry 268, 3072-3083.
BIBLIOGRAPHY
133
191. Gouras, G. K., Xu, H., Jovanovic, J. N., Buxbaum, J. D., Wang, R., Greengard, P., Relkin, N. R., and
Gandy, S. (1998) Generation and regulation of beta-amyloid peptide variants by neurons, J Neurochem
71, 1920-1925.
192. Farzan, M., Schnitzler, C. E., Vasilieva, N., Leung, D., and Choe, H. (2000) BACE2, a beta -secretase
homolog, cleaves at the beta site and within the amyloid-beta region of the amyloid-beta precursor
protein, Proceedings of the National Academy of Sciences of the United States of America 97, 9712-
9717.
193. Haniu, M., Denis, P., Young, Y., Mendiaz, E. A., Fuller, J., Hui, J. O., Bennett, B. D., Kahn, S., Ross,
S., Burgess, T., Katta, V., Rogers, G., Vassar, R., and Citron, M. (2000) Characterization of Alzheimer's
beta -secretase protein BACE. A pepsin family member with unusual properties, The Journal of
biological chemistry 275, 21099-21106.
194. Costantini, C., Ko, M. H., Jonas, M. C., and Puglielli, L. (2007) A reversible form of lysine acetylation
in the ER and Golgi lumen controls the molecular stabilization of BACE1, The Biochemical journal 407,
383-395.
195. Capell, A., Steiner, H., Willem, M., Kaiser, H., Meyer, C., Walter, J., Lammich, S., Multhaup, G., and
Haass, C. (2000) Maturation and pro-peptide cleavage of beta-secretase, The Journal of biological
chemistry 275, 30849-30854.
196. Bennett, B. D., Denis, P., Haniu, M., Teplow, D. B., Kahn, S., Louis, J. C., Citron, M., and Vassar, R.
(2000) A furin-like convertase mediates propeptide cleavage of BACE, the Alzheimer's beta -secretase,
The Journal of biological chemistry 275, 37712-37717.
197. Benjannet, S., Elagoz, A., Wickham, L., Mamarbachi, M., Munzer, J. S., Basak, A., Lazure, C.,
Cromlish, J. A., Sisodia, S., Checler, F., Chretien, M., and Seidah, N. G. (2001) Post-translational
processing of beta-secretase (beta-amyloid-converting enzyme) and its ectodomain shedding. The pro-
and transmembrane/cytosolic domains affect its cellular activity and amyloid-beta production, The
Journal of biological chemistry 276, 10879-10887.
198. Walter, J., Fluhrer, R., Hartung, B., Willem, M., Kaether, C., Capell, A., Lammich, S., Multhaup, G.,
and Haass, C. (2001) Phosphorylation regulates intracellular trafficking of beta-secretase, The Journal
of biological chemistry 276, 14634-14641.
199. Kinoshita, A., Fukumoto, H., Shah, T., Whelan, C. M., Irizarry, M. C., and Hyman, B. T. (2003)
Demonstration by FRET of BACE interaction with the amyloid precursor protein at the cell surface and
in early endosomes, Journal of cell science 116, 3339-3346.
200. He, X., Chang, W. P., Koelsch, G., and Tang, J. (2002) Memapsin 2 (beta-secretase) cytosolic domain
binds to the VHS domains of GGA1 and GGA2: implications on the endocytosis mechanism of
memapsin 2, FEBS letters 524, 183-187.
201. He, X., Zhu, G., Koelsch, G., Rodgers, K. K., Zhang, X. C., and Tang, J. (2003) Biochemical and
structural characterization of the interaction of memapsin 2 (beta-secretase) cytosolic domain with the
VHS domain of GGA proteins, Biochemistry 42, 12174-12180.
202. von Arnim, C. A., Tangredi, M. M., Peltan, I. D., Lee, B. M., Irizarry, M. C., Kinoshita, A., and Hyman,
B. T. (2004) Demonstration of BACE (beta-secretase) phosphorylation and its interaction with GGA1
in cells by fluorescence-lifetime imaging microscopy, Journal of cell science 117, 5437-5445.
203. Roberds, S. L., Anderson, J., Basi, G., Bienkowski, M. J., Branstetter, D. G., Chen, K. S., Freedman, S.
B., Frigon, N. L., Games, D., Hu, K., Johnson-Wood, K., Kappenman, K. E., Kawabe, T. T., Kola, I.,
Kuehn, R., Lee, M., Liu, W., Motter, R., Nichols, N. F., Power, M., Robertson, D. W., Schenk, D.,
Schoor, M., Shopp, G. M., Shuck, M. E., Sinha, S., Svensson, K. A., Tatsuno, G., Tintrup, H., Wijsman,
J., Wright, S., and McConlogue, L. (2001) BACE knockout mice are healthy despite lacking the primary
beta-secretase activity in brain: implications for Alzheimer's disease therapeutics, Human molecular
genetics 10, 1317-1324.
204. Luo, Y., Bolon, B., Kahn, S., Bennett, B. D., Babu-Khan, S., Denis, P., Fan, W., Kha, H., Zhang, J.,
Gong, Y., Martin, L., Louis, J. C., Yan, Q., Richards, W. G., Citron, M., and Vassar, R. (2001) Mice
deficient in BACE1, the Alzheimer's beta-secretase, have normal phenotype and abolished beta-amyloid
generation, Nature neuroscience 4, 231-232.
205. De Strooper, B. (2003) Aph-1, Pen-2, and Nicastrin with Presenilin generate an active gamma-Secretase
complex, Neuron 38, 9-12.
206. Edbauer, D., Winkler, E., Regula, J. T., Pesold, B., Steiner, H., and Haass, C. (2003) Reconstitution of
gamma-secretase activity, Nature cell biology 5, 486-488.
BIBLIOGRAPHY
134
207. Takasugi, N., Tomita, T., Hayashi, I., Tsuruoka, M., Niimura, M., Takahashi, Y., Thinakaran, G., and
Iwatsubo, T. (2003) The role of presenilin cofactors in the gamma-secretase complex, Nature 422, 438-
441.
208. Kimberly, W. T., LaVoie, M. J., Ostaszewski, B. L., Ye, W., Wolfe, M. S., and Selkoe, D. J. (2003)
Gamma-secretase is a membrane protein complex comprised of presenilin, nicastrin, Aph-1, and Pen-2,
Proceedings of the National Academy of Sciences of the United States of America 100, 6382-6387.
209. Osenkowski, P., Li, H., Ye, W., Li, D., Aeschbach, L., Fraering, P. C., Wolfe, M. S., Selkoe, D. J., and
Li, H. (2009) Cryoelectron microscopy structure of purified gamma-secretase at 12 A resolution, J Mol
Biol 385, 642-652.
210. Sato, T., Diehl, T. S., Narayanan, S., Funamoto, S., Ihara, Y., De Strooper, B., Steiner, H., Haass, C.,
and Wolfe, M. S. (2007) Active gamma-secretase complexes contain only one of each component, The
Journal of biological chemistry 282, 33985-33993.
211. Hebert, S. S., Serneels, L., Dejaegere, T., Horre, K., Dabrowski, M., Baert, V., Annaert, W., Hartmann,
D., and De Strooper, B. (2004) Coordinated and widespread expression of gamma-secretase in vivo:
evidence for size and molecular heterogeneity, Neurobiology of disease 17, 260-272.
212. De Strooper, B., Saftig, P., Craessaerts, K., Vanderstichele, H., Guhde, G., Annaert, W., Von Figura, K.,
and Van Leuven, F. (1998) Deficiency of presenilin-1 inhibits the normal cleavage of amyloid precursor
protein, Nature 391, 387-390.
213. Wolfe, M. S., Xia, W., Ostaszewski, B. L., Diehl, T. S., Kimberly, W. T., and Selkoe, D. J. (1999) Two
transmembrane aspartates in presenilin-1 required for presenilin endoproteolysis and gamma-secretase
activity, Nature 398, 513-517.
214. De Strooper, B., Annaert, W., Cupers, P., Saftig, P., Craessaerts, K., Mumm, J. S., Schroeter, E. H.,
Schrijvers, V., Wolfe, M. S., Ray, W. J., Goate, A., and Kopan, R. (1999) A presenilin-1-dependent
gamma-secretase-like protease mediates release of Notch intracellular domain, Nature 398, 518-522.
215. Struhl, G., and Greenwald, I. (1999) Presenilin is required for activity and nuclear access of Notch in
Drosophila, Nature 398, 522-525.
216. Thinakaran, G., Borchelt, D. R., Lee, M. K., Slunt, H. H., Spitzer, L., Kim, G., Ratovitsky, T., Davenport,
F., Nordstedt, C., Seeger, M., Hardy, J., Levey, A. I., Gandy, S. E., Jenkins, N. A., Copeland, N. G.,
Price, D. L., and Sisodia, S. S. (1996) Endoproteolysis of presenilin 1 and accumulation of processed
derivatives in vivo, Neuron 17, 181-190.
217. Steiner, H., Kostka, M., Romig, H., Basset, G., Pesold, B., Hardy, J., Capell, A., Meyn, L., Grim, M. L.,
Baumeister, R., Fechteler, K., and Haass, C. (2000) Glycine 384 is required for presenilin-1 function and
is conserved in bacterial polytopic aspartyl proteases, Nature cell biology 2, 848-851.
218. Sato, C., Morohashi, Y., Tomita, T., and Iwatsubo, T. (2006) Structure of the catalytic pore of gamma-
secretase probed by the accessibility of substituted cysteines, The Journal of neuroscience : the official
journal of the Society for Neuroscience 26, 12081-12088.
219. Tolia, A., Chavez-Gutierrez, L., and De Strooper, B. (2006) Contribution of presenilin transmembrane
domains 6 and 7 to a water-containing cavity in the gamma-secretase complex, The Journal of biological
chemistry 281, 27633-27642.
220. Tolia, A., Horre, K., and De Strooper, B. (2008) Transmembrane domain 9 of presenilin determines the
dynamic conformation of the catalytic site of gamma-secretase, The Journal of biological chemistry 283,
19793-19803.
221. Sato, C., Takagi, S., Tomita, T., and Iwatsubo, T. (2008) The C-terminal PAL motif and transmembrane
domain 9 of presenilin 1 are involved in the formation of the catalytic pore of the gamma-secretase, The
Journal of neuroscience : the official journal of the Society for Neuroscience 28, 6264-6271.
222. Takagi, S., Tominaga, A., Sato, C., Tomita, T., and Iwatsubo, T. (2010) Participation of transmembrane
domain 1 of presenilin 1 in the catalytic pore structure of the gamma-secretase, The Journal of
neuroscience : the official journal of the Society for Neuroscience 30, 15943-15950.
223. Yu, G., Nishimura, M., Arawaka, S., Levitan, D., Zhang, L., Tandon, A., Song, Y. Q., Rogaeva, E.,
Chen, F., Kawarai, T., Supala, A., Levesque, L., Yu, H., Yang, D. S., Holmes, E., Milman, P., Liang,
Y., Zhang, D. M., Xu, D. H., Sato, C., Rogaev, E., Smith, M., Janus, C., Zhang, Y., Aebersold, R., Farrer,
L. S., Sorbi, S., Bruni, A., Fraser, P., and St George-Hyslop, P. (2000) Nicastrin modulates presenilin-
mediated notch/glp-1 signal transduction and betaAPP processing, Nature 407, 48-54.
224. Yang, D. S., Tandon, A., Chen, F., Yu, G., Yu, H., Arawaka, S., Hasegawa, H., Duthie, M., Schmidt, S.
D., Ramabhadran, T. V., Nixon, R. A., Mathews, P. M., Gandy, S. E., Mount, H. T., St George-Hyslop,

BIBLIOGRAPHY
135
P., and Fraser, P. E. (2002) Mature glycosylation and trafficking of nicastrin modulate its binding to
presenilins, The Journal of biological chemistry 277, 28135-28142.
225. Kimberly, W. T., LaVoie, M. J., Ostaszewski, B. L., Ye, W., Wolfe, M. S., and Selkoe, D. J. (2002)
Complex N-linked glycosylated nicastrin associates with active gamma-secretase and undergoes tight
cellular regulation, The Journal of biological chemistry 277, 35113-35117.
226. Herreman, A., Van Gassen, G., Bentahir, M., Nyabi, O., Craessaerts, K., Mueller, U., Annaert, W., and
De Strooper, B. (2003) gamma-Secretase activity requires the presenilin-dependent trafficking of
nicastrin through the Golgi apparatus but not its complex glycosylation, Journal of cell science 116,
1127-1136.
227. Edbauer, D., Winkler, E., Haass, C., and Steiner, H. (2002) Presenilin and nicastrin regulate each other
and determine amyloid beta-peptide production via complex formation, Proceedings of the National
Academy of Sciences of the United States of America 99, 8666-8671.
228. Capell, A., Kaether, C., Edbauer, D., Shirotani, K., Merkl, S., Steiner, H., and Haass, C. (2003) Nicastrin
interacts with gamma-secretase complex components via the N-terminal part of its transmembrane
domain, The Journal of biological chemistry 278, 52519-52523.
229. Kaether, C., Capell, A., Edbauer, D., Winkler, E., Novak, B., Steiner, H., and Haass, C. (2004) The
presenilin C-terminus is required for ER-retention, nicastrin-binding and gamma-secretase activity,
EMBO J 23, 4738-4748.
230. Shirotani, K., Edbauer, D., Capell, A., Schmitz, J., Steiner, H., and Haass, C. (2003) Gamma-secretase
activity is associated with a conformational change of nicastrin, The Journal of biological chemistry 278,
16474-16477.
231. Shah, S., Lee, S. F., Tabuchi, K., Hao, Y. H., Yu, C., LaPlant, Q., Ball, H., Dann, C. E., 3rd, Sudhof, T.,
and Yu, G. (2005) Nicastrin functions as a gamma-secretase-substrate receptor, Cell 122, 435-447.
232. Goutte, C., Tsunozaki, M., Hale, V. A., and Priess, J. R. (2002) APH-1 is a multipass membrane protein
essential for the Notch signaling pathway in Caenorhabditis elegans embryos, Proceedings of the
National Academy of Sciences of the United States of America 99, 775-779.
233. Lee, S. F., Shah, S., Li, H., Yu, C., Han, W., and Yu, G. (2002) Mammalian APH-1 interacts with
presenilin and nicastrin and is required for intramembrane proteolysis of amyloid-beta precursor protein
and Notch, The Journal of biological chemistry 277, 45013-45019.
234. Gu, Y., Chen, F., Sanjo, N., Kawarai, T., Hasegawa, H., Duthie, M., Li, W., Ruan, X., Luthra, A., Mount,
H. T., Tandon, A., Fraser, P. E., and St George-Hyslop, P. (2003) APH-1 interacts with mature and
immature forms of presenilins and nicastrin and may play a role in maturation of presenilin.nicastrin
complexes, The Journal of biological chemistry 278, 7374-7380.
235. LaVoie, M. J., Fraering, P. C., Ostaszewski, B. L., Ye, W., Kimberly, W. T., Wolfe, M. S., and Selkoe,
D. J. (2003) Assembly of the gamma-secretase complex involves early formation of an intermediate
subcomplex of Aph-1 and nicastrin, The Journal of biological chemistry 278, 37213-37222.
236. Lee, S. F., Shah, S., Yu, C., Wigley, W. C., Li, H., Lim, M., Pedersen, K., Han, W., Thomas, P.,
Lundkvist, J., Hao, Y. H., and Yu, G. (2004) A conserved GXXXG motif in APH-1 is critical for
assembly and activity of the gamma-secretase complex, The Journal of biological chemistry 279, 4144-
4152.
237. Niimura, M., Isoo, N., Takasugi, N., Tsuruoka, M., Ui-Tei, K., Saigo, K., Morohashi, Y., Tomita, T.,
and Iwatsubo, T. (2005) Aph-1 contributes to the stabilization and trafficking of the gamma-secretase
complex through mechanisms involving intermolecular and intramolecular interactions, The Journal of
biological chemistry 280, 12967-12975.
238. Francis, R., McGrath, G., Zhang, J., Ruddy, D. A., Sym, M., Apfeld, J., Nicoll, M., Maxwell, M., Hai,
B., Ellis, M. C., Parks, A. L., Xu, W., Li, J., Gurney, M., Myers, R. L., Himes, C. S., Hiebsch, R., Ruble,
C., Nye, J. S., and Curtis, D. (2002) aph-1 and pen-2 are required for Notch pathway signaling, gamma-
secretase cleavage of betaAPP, and presenilin protein accumulation, Developmental cell 3, 85-97.
239. Luo, W. J., Wang, H., Li, H., Kim, B. S., Shah, S., Lee, H. J., Thinakaran, G., Kim, T. W., Yu, G., and
Xu, H. (2003) PEN-2 and APH-1 coordinately regulate proteolytic processing of presenilin 1, The
Journal of biological chemistry 278, 7850-7854.
240. Prokop, S., Shirotani, K., Edbauer, D., Haass, C., and Steiner, H. (2004) Requirement of PEN-2 for
stabilization of the presenilin N-/C-terminal fragment heterodimer within the gamma-secretase complex,
The Journal of biological chemistry 279, 23255-23261.
241. Prokop, S., Haass, C., and Steiner, H. (2005) Length and overall sequence of the PEN-2 C-terminal
domain determines its function in the stabilization of presenilin fragments, J Neurochem 94, 57-62.

BIBLIOGRAPHY
136
242. Hasegawa, H., Sanjo, N., Chen, F., Gu, Y. J., Shier, C., Petit, A., Kawarai, T., Katayama, T., Schmidt,
S. D., Mathews, P. M., Schmitt-Ulms, G., Fraser, P. E., and St George-Hyslop, P. (2004) Both the
sequence and length of the C terminus of PEN-2 are critical for intermolecular interactions and function
of presenilin complexes, The Journal of biological chemistry 279, 46455-46463.
243. Shirotani, K., Edbauer, D., Kostka, M., Steiner, H., and Haass, C. (2004) Immature nicastrin stabilizes
APH-1 independent of PEN-2 and presenilin: identification of nicastrin mutants that selectively interact
with APH-1, J Neurochem 89, 1520-1527.
244. Steiner, H., Winkler, E., Edbauer, D., Prokop, S., Basset, G., Yamasaki, A., Kostka, M., and Haass, C.
(2002) PEN-2 is an integral component of the gamma-secretase complex required for coordinated
expression of presenilin and nicastrin, The Journal of biological chemistry 277, 39062-39065.
245. Pasternak, S. H., Bagshaw, R. D., Guiral, M., Zhang, S., Ackerley, C. A., Pak, B. J., Callahan, J. W., and
Mahuran, D. J. (2003) Presenilin-1, nicastrin, amyloid precursor protein, and gamma-secretase activity
are co-localized in the lysosomal membrane, The Journal of biological chemistry 278, 26687-26694.
246. Michelsen, K., Yuan, H., and Schwappach, B. (2005) Hide and run. Arginine-based endoplasmic-
reticulum-sorting motifs in the assembly of heteromultimeric membrane proteins, EMBO Rep 6, 717-
722.
247. Spasic, D., Raemaekers, T., Dillen, K., Declerck, I., Baert, V., Serneels, L., Fullekrug, J., and. (2007)
Rer1p competes with APH-1 for binding to nicastrin and regulates gamma-secretase complex assembly
in the early secretory pathway, The Journal of cell biology 176, 629-640.
248. Fraering, P. C., Ye, W., Strub, J. M., Dolios, G., LaVoie, M. J., Ostaszewski, B. L., van Dorsselaer, A.,
Wang, R., Selkoe, D. J., and Wolfe, M. S. (2004) Purification and characterization of the human gamma-
secretase complex, Biochemistry 43, 9774-9789.
249. Lazarov, V. K., Fraering, P. C., Ye, W., Wolfe, M. S., Selkoe, D. J., and Li, H. (2006) Electron
microscopic structure of purified, active gamma-secretase reveals an aqueous intramembrane chamber
and two pores, Proceedings of the National Academy of Sciences of the United States of America 103,
6889-6894.
250. Sobhanifar, S., Schneider, B., Lohr, F., Gottstein, D., Ikeya, T., Mlynarczyk, K., Pulawski, W.,
Ghoshdastider, U., Kolinski, M., Filipek, S., Guntert, P., Bernhard, F., and Dotsch, V. (2010) Structural
investigation of the C-terminal catalytic fragment of presenilin 1, Proceedings of the National Academy
of Sciences of the United States of America 107, 9644-9649.
251. Li, X., Dang, S., Yan, C., Gong, X., Wang, J., and Shi, Y. (2013) Structure of a presenilin family
intramembrane aspartate protease, Nature 493, 56-61.
252. Lu, P., Bai, X. C., Ma, D., Xie, T., Yan, C., Sun, L., Yang, G., Zhao, Y., Zhou, R., Scheres, S. H., and
Shi, Y. (2014) Three-dimensional structure of human gamma-secretase, Nature 512, 166-170.
253. Wolfe, M. S., and Selkoe, D. J. (2014) gamma-Secretase: a horseshoe structure brings good luck, Cell
158, 247-249.
254. Fortini, M. E. (2002) Gamma-secretase-mediated proteolysis in cell-surface-receptor signalling, Nat Rev
Mol Cell Biol 3, 673-684.
255. McCarthy, J. V., Twomey, C., and Wujek, P. (2009) Presenilin-dependent regulated intramembrane
proteolysis and gamma-secretase activity, Cellular and molecular life sciences : CMLS 66, 1534-1555.
256. Hemming, M. L., Elias, J. E., Gygi, S. P., and Selkoe, D. J. (2008) Proteomic profiling of gamma-
secretase substrates and mapping of substrate requirements, PLoS biology 6, e257.
257. Becker-Herman, S., Arie, G., Medvedovsky, H., Kerem, A., and Shachar, I. (2005) CD74 is a member
of the regulated intramembrane proteolysis-processed protein family, Mol Biol Cell 16, 5061-5069.
258. Nakahara, S., Saito, T., Kondo, N., Moriwaki, K., Noda, K., Ihara, S., Takahashi, M., Ide, Y., Gu, J.,
Inohara, H., Katayama, T., Tohyama, M., Kubo, T., Taniguchi, N., and Miyoshi, E. (2006) A secreted
type of beta1,6 N-acetylglucosaminyltransferase V (GnT-V), a novel angiogenesis inducer, is regulated
by gamma-secretase, FASEB journal : official publication of the Federation of American Societies for
Experimental Biology 20, 2451-2459.
259. Cai, J., Jiang, W. G., Grant, M. B., and Boulton, M. (2006) Pigment epithelium-derived factor inhibits
angiogenesis via regulated intracellular proteolysis of vascular endothelial growth factor receptor 1, The
Journal of biological chemistry 281, 3604-3613.
260. Marambaud, P., Shioi, J., Serban, G., Georgakopoulos, A., Sarner, S., Nagy, V., Baki, L., Wen, P.,
Efthimiopoulos, S., Shao, Z., Wisniewski, T., and Robakis, N. K. (2002) A presenilin-1/gamma-
secretase cleavage releases the E-cadherin intracellular domain and regulates disassembly of adherens
junctions, EMBO J 21, 1948-1956.

BIBLIOGRAPHY
137
261. Tomita, T., Tanaka, S., Morohashi, Y., and Iwatsubo, T. (2006) Presenilin-dependent intramembrane
cleavage of ephrin-B1, Molecular neurodegeneration 1, 2.
262. Uemura, K., Kihara, T., Kuzuya, A., Okawa, K., Nishimoto, T., Ninomiya, H., Sugimoto, H., Kinoshita,
A., and Shimohama, S. (2006) Characterization of sequential N-cadherin cleavage by ADAM10 and
PS1, Neuroscience letters 402, 278-283.
263. Lichtenthaler, S. F., Ida, N., Multhaup, G., Masters, C. L., and Beyreuther, K. (1997) Mutations in the
transmembrane domain of APP altering gamma-secretase specificity, Biochemistry 36, 15396-15403.
264. Lichtenthaler, S. F., Wang, R., Grimm, H., Uljon, S. N., Masters, C. L., and Beyreuther, K. (1999)
Mechanism of the cleavage specificity of Alzheimer's disease gamma-secretase identified by
phenylalanine-scanning mutagenesis of the transmembrane domain of the amyloid precursor protein,
Proceedings of the National Academy of Sciences of the United States of America 96, 3053-3058.
265. Zhang, J., Ye, W., Wang, R., Wolfe, M. S., Greenberg, B. D., and Selkoe, D. J. (2002) Proteolysis of
chimeric beta-amyloid precursor proteins containing the Notch transmembrane domain yields amyloid
beta-like peptides, The Journal of biological chemistry 277, 15069-15075.
266. Vidal, G. A., Naresh, A., Marrero, L., and Jones, F. E. (2005) Presenilin-dependent gamma-secretase
processing regulates multiple ERBB4/HER4 activities, The Journal of biological chemistry 280, 19777-
19783.
267. Wolfe, M. S. (2009) Intramembrane proteolysis, Chemical reviews 109, 1599-1612.
268. Huber, O., Kemler, R., and Langosch, D. (1999) Mutations affecting transmembrane segment
interactions impair adhesiveness of E-cadherin, Journal of cell science 112 ( Pt 23), 4415-4423.
269. Mendrola, J. M., Berger, M. B., King, M. C., and Lemmon, M. A. (2002) The single transmembrane
domains of ErbB receptors self-associate in cell membranes, The Journal of biological chemistry 277,
4704-4712.
270. Chin, C. N., Sachs, J. N., and Engelman, D. M. (2005) Transmembrane homodimerization of receptor-
like protein tyrosine phosphatases, FEBS letters 579, 3855-3858.
271. Scheuermann, S., Hambsch, B., Hesse, L., Stumm, J., Schmidt, C., Beher, D., Bayer, T. A., Beyreuther,
K., and Multhaup, G. (2001) Homodimerization of amyloid precursor protein and its implication in the
amyloidogenic pathway of Alzheimer's disease, The Journal of biological chemistry 276, 33923-33929.
272. Jung, J. I., Premraj, S., Cruz, P. E., Ladd, T. B., Kwak, Y., Koo, E. H., Felsenstein, K. M., Golde, T. E.,
and Ran, Y. (2014) Independent relationship between amyloid precursor protein (APP) dimerization and
gamma-secretase processivity, PloS one 9, e111553.
273. Russ, W. P., and Engelman, D. M. (2000) The GxxxG motif: a framework for transmembrane helix-
helix association, J Mol Biol 296, 911-919.
274. Sagi, S. A., Lessard, C. B., Winden, K. D., Maruyama, H., Koo, J. C., Weggen, S., Kukar, T. L., Golde,
T. E., and Koo, E. H. (2011) Substrate sequence influences gamma-secretase modulator activity, role of
the transmembrane domain of the amyloid precursor protein, The Journal of biological chemistry 286,
39794-39803.
275. Schmelzer, K., Fahy, E., Subramaniam, S., and Dennis, E. A. (2007) The lipid maps initiative in
lipidomics, Methods in enzymology 432, 171-183.
276. Fahy, E., Subramaniam, S., Brown, H. A., Glass, C. K., Merrill, A. H., Jr., Murphy, R. C., Raetz, C. R.,
Russell, D. W., Seyama, Y., Shaw, W., Shimizu, T., Spener, F., van Meer, G., VanNieuwenhze, M. S.,
White, S. H., Witztum, J. L., and Dennis, E. A. (2005) A comprehensive classification system for lipids,
Journal of lipid research 46, 839-861.
277. Fahy, E., Subramaniam, S., Murphy, R. C., Nishijima, M., Raetz, C. R., Shimizu, T., Spener, F., van
Meer, G., Wakelam, M. J., and Dennis, E. A. (2009) Update of the LIPID MAPS comprehensive
classification system for lipids, Journal of lipid research 50 Suppl, S9-14.
278. van Meer, G., Voelker, D. R., and Feigenson, G. W. (2008) Membrane lipids: where they are and how
they behave, Nat Rev Mol Cell Biol 9, 112-124.
279. Vance, J. E., and Tasseva, G. (2013) Formation and function of phosphatidylserine and
phosphatidylethanolamine in mammalian cells, Biochimica et biophysica acta 1831, 543-554.
280. Chernomordik, L. V., and Kozlov, M. M. (2003) Protein-lipid interplay in fusion and fission of biological
membranes, Annu Rev Biochem 72, 175-207.
281. Leventis, P. A., and Grinstein, S. (2010) The distribution and function of phosphatidylserine in cellular
membranes, Annual review of biophysics 39, 407-427.
282. Michell, R. H. (2008) Inositol derivatives: evolution and functions, Nat Rev Mol Cell Biol 9, 151-161.

BIBLIOGRAPHY
138
283. van Meer, G., and de Kroon, A. I. (2011) Lipid map of the mammalian cell, Journal of cell science 124,
5-8.
284. Haines, T. H. (2009) A new look at Cardiolipin, Biochimica et biophysica acta 1788, 1997-2002.
285. Kennedy, E. P., and Weiss, S. B. (1956) THE FUNCTION OF CYTIDINE COENZYMES IN THE
BIOSYNTHESIS OF PHOSPHOLIPIDES, Journal of Biological Chemistry 222, 193-214.
286. Wang, X., Devaiah, S. P., Zhang, W., and Welti, R. (2006) Signaling functions of phosphatidic acid,
Progress in lipid research 45, 250-278.
287. Kooijman, E. E., and Burger, K. N. (2009) Biophysics and function of phosphatidic acid: a molecular
perspective, Biochimica et biophysica acta 1791, 881-888.
288. Mobius, W., van Donselaar, E., Ohno-Iwashita, Y., Shimada, Y., Heijnen, H. F., Slot, J. W., and Geuze,
H. J. (2003) Recycling compartments and the internal vesicles of multivesicular bodies harbor most of
the cholesterol found in the endocytic pathway, Traffic (Copenhagen, Denmark) 4, 222-231.
289. Gallala, H. D., and Sandhoff, K. (2011) Biological function of the cellular lipid BMP-BMP as a key
activator for cholesterol sorting and membrane digestion, Neurochemical research 36, 1594-1600.
290. Tan, H. H., Makino, A., Sudesh, K., Greimel, P., and Kobayashi, T. (2012) Spectroscopic evidence for
the unusual stereochemical configuration of an endosome-specific lipid, Angewandte Chemie
(International ed. in English) 51, 533-535.
291. Ikonen, E. (2008) Cellular cholesterol trafficking and compartmentalization, Nat Rev Mol Cell Biol 9,
125-138.
292. Hullin-Matsuda, F., Taguchi, T., Greimel, P., and Kobayashi, T. (2014) Lipid compartmentalization in
the endosome system, Seminars in cell & developmental biology 31, 48-56.
293. Schulze, H., Kolter, T., and Sandhoff, K. (2009) Principles of lysosomal membrane degradation: Cellular
topology and biochemistry of lysosomal lipid degradation, Biochimica et biophysica acta 1793, 674-
683.
294. Ohvo-Rekila, H., Ramstedt, B., Leppimaki, P., and Slotte, J. P. (2002) Cholesterol interactions with
phospholipids in membranes, Progress in lipid research 41, 66-97.
295. Maxfield, F. R., and van Meer, G. (2010) Cholesterol, the central lipid of mammalian cells, Current
opinion in cell biology 22, 422-429.
296. Harder, T. (2003) Formation of functional cell membrane domains: the interplay of lipid- and protein-
mediated interactions, Philosophical transactions of the Royal Society of London. Series B, Biological
sciences 358, 863-868.
297. Slotte, J. P. (2013) Biological functions of sphingomyelins, Progress in lipid research 52, 424-437.
298. Barthet, G., Georgakopoulos, A., and Robakis, N. K. (2012) Cellular mechanisms of gamma-secretase
substrate selection, processing and toxicity, Prog Neurobiol 98, 166-175.
299. Vetrivel, K. S., Cheng, H., Lin, W., Sakurai, T., Li, T., Nukina, N., Wong, P. C., Xu, H., and Thinakaran,
G. (2004) Association of gamma-secretase with lipid rafts in post-Golgi and endosome membranes, The
Journal of biological chemistry 279, 44945-44954.
300. Vetrivel, K. S., Cheng, H., Kim, S. H., Chen, Y., Barnes, N. Y., Parent, A. T., Sisodia, S. S., and
Thinakaran, G. (2005) Spatial segregation of gamma-secretase and substrates in distinct membrane
domains, The Journal of biological chemistry 280, 25892-25900.
301. Vetrivel, K. S., and Thinakaran, G. (2010) Membrane rafts in Alzheimer's disease beta-amyloid
production, Biochimica et biophysica acta 1801, 860-867.
302. Nixon, R. A. (2007) Autophagy, amyloidogenesis and Alzheimer disease, Journal of cell science 120,
4081-4091.
303. Dries, D. R., and Yu, G. (2008) Assembly, maturation, and trafficking of the gamma-secretase complex
in Alzheimer's disease, Current Alzheimer research 5, 132-146.
304. Pasternak, S. H., Callahan, J. W., and Mahuran, D. J. (2004) The role of the endosomal/lysosomal system
in amyloid-beta production and the pathophysiology of Alzheimer's disease: reexamining the spatial
paradox from a lysosomal perspective, Journal of Alzheimer's disease : JAD 6, 53-65.
305. Lorenzen, A., Samosh, J., Vandewark, K., Anborgh, P. H., Seah, C., Magalhaes, A. C., Cregan, S. P.,
Ferguson, S. S., and Pasternak, S. H. (2010) Rapid and direct transport of cell surface APP to the
lysosome defines a novel selective pathway, Molecular brain 3, 11.
306. Tam, J. H., Seah, C., and Pasternak, S. H. (2014) The Amyloid Precursor Protein is rapidly transported
from the Golgi apparatus to the lysosome and where it is processed into beta-amyloid, Molecular brain
7, 54.
BIBLIOGRAPHY
139
307. Kolter, T., and Sandhoff, K. (2010) Lysosomal degradation of membrane lipids, FEBS letters 584, 1700-
1712.
308. Di Paolo, G., and Kim, T. W. (2011) Linking lipids to Alzheimer's disease: cholesterol and beyond,
Nature reviews. Neuroscience 12, 284-296.
309. Osenkowski, P., Ye, W., Wang, R., Wolfe, M. S., and Selkoe, D. J. (2008) Direct and potent regulation
of gamma-secretase by its lipid microenvironment, The Journal of biological chemistry 283, 22529-
22540.
310. Mahfoud, R., Garmy, N., Maresca, M., Yahi, N., Puigserver, A., and Fantini, J. (2002) Identification of
a common sphingolipid-binding domain in Alzheimer, prion, and HIV-1 proteins, The Journal of
biological chemistry 277, 11292-11296.
311. Prasad, M. R., Lovell, M. A., Yatin, M., Dhillon, H., and Markesbery, W. R. (1998) Regional membrane
phospholipid alterations in Alzheimer's disease, Neurochemical research 23, 81-88.
312. Bangham, A. D., and Horne, R. W. (1964) Negative staining of phospholipids and their structural
modification by surface-active agents as observed in the electron microscope, J Mol Biol 8, 660-668.
313. Bangham, A. D., Standish, M. M., and Watkins, J. C. (1965) Diffusion of univalent ions across the
lamellae of swollen phospholipids, J Mol Biol 13, 238-252.
314. De Strooper, B., Iwatsubo, T., and Wolfe, M. S. (2012) Presenilins and gamma-secretase: structure,
function, and role in Alzheimer Disease, Cold Spring Harbor perspectives in medicine 2, a006304.
315. Schägger, H., and von Jagow, G. (1987) Tricine-sodium dodecyl sulfate-polyacrylamide gel
electrophoresis for the separation of proteins in the range from 1 to 100 kDa, Analytical Biochemistry
166, 368-379.
316. Oakley, B. R., Kirsch, D. R., and Morris, N. R. (1980) A simplified ultrasensitive silver stain for
detecting proteins in polyacrylamide gels, Analytical Biochemistry 105, 361-363.
317. Fiske, C. H., and Subbarow, Y. (1925) THE COLORIMETRIC DETERMINATION OF
PHOSPHORUS, Journal of Biological Chemistry 66, 375-400.
318. Holmes, O., Paturi, S., Ye, W., Wolfe, M. S., and Selkoe, D. J. (2012) Effects of membrane lipids on the
activity and processivity of purified gamma-secretase, Biochemistry 51, 3565-3575.
319. Nesic, I., Guix, F. X., Vennekens, K., Michaki, V., Van Veldhoven, P. P., Feiguin, F., De Strooper, B.,
Dotti, C. G., and Wahle, T. (2012) Alterations in phosphatidylethanolamine levels affect the generation
of Abeta, Aging cell 11, 63-72.
320. Rath, A., and Deber, C. M. (2013) Correction factors for membrane protein molecular weight readouts
on sodium dodecyl sulfate-polyacrylamide gel electrophoresis, Anal Biochem 434, 67-72.
321. Rath, A., Cunningham, F., and Deber, C. M. (2013) Acrylamide concentration determines the direction
and magnitude of helical membrane protein gel shifts, PNAS 110, 15668-15673.
322. Vivian, J. T., and Callis, P. R. (2001) Mechanisms of Tryptophan Fluorescence Shifts in Proteins,
Biophysical journal 80, 2093-2109.
323. Winkler, E., Kamp, F., Scheuring, J., Ebke, A., Fukumori, A., and Steiner, H. (2012) Generation of
Alzheimer disease-associated amyloid beta42/43 peptide by gamma-secretase can be inhibited directly
by modulation of membrane thickness, The Journal of biological chemistry 287, 21326-21334.
324. Pedersen, S. L., Tofteng, A. P., Malik, L., and Jensen, K. J. (2012) Microwave heating in solid-phase
peptide synthesis, Chemical Society Reviews 41, 1826-1844.
325. Mukherjee, L. H., and Grunwald, E. (1958) Physical Properties and Hydrogen-bonding in the System
Ethanol–2,2,2-Trifluoro-ethanol, The Journal of Physical Chemistry 62, 1311-1314.
326. Dominguez, L., Foster, L., Meredith, S. C., Straub, J. E., and Thirumalai, D. (2014) Structural
heterogeneity in transmembrane amyloid precursor protein homodimer is a consequence of
environmental selection, Journal of the American Chemical Society 136, 9619-9626.
327. Lee, A. G. (2004) How lipids affect the activities of integral membrane proteins, Biochimica et
biophysica acta 1666, 62-87.
328. Lee, A. G. (2005) How lipids and proteins interact in a membrane: a molecular approach, Molecular
bioSystems 1, 203-212.
329. Bogdanov, M., Dowhan, W., and Vitrac, H. (2014) Lipids and topological rules governing membrane
protein assembly, Biochimica et Biophysica Acta (BBA) - Molecular Cell Research 1843, 1475-1488.
330. Zimmermann, R., Eyrisch, S., Ahmad, M., and Helms, V. (2011) Protein translocation across the ER
membrane, Biochimica et Biophysica Acta (BBA) - Biomembranes 1808, 912-924.
331. Hicks, D. A., Nalivaeva, N. N., and Turner, A. J. (2012) Lipid rafts and Alzheimer's disease: protein-
lipid interactions and perturbation of signaling, Frontiers in physiology 3, 189.

BIBLIOGRAPHY
140
332. Winkler, E., Julius, A., Steiner, H., and Langosch, D. (2015) Homodimerization Protects the Amyloid
Precursor Protein C99 Fragment from Cleavage by γ-Secretase, Biochemistry 54, 6149-6152.
333. Kim, J., Hamamoto, S., Ravazzola, M., Orci, L., and Schekman, R. (2005) Uncoupled Packaging of
Amyloid Precursor Protein and Presenilin 1 into Coat Protein Complex II Vesicles, Journal of Biological
Chemistry 280, 7758-7768.
334. Kim, J., Kleizen, B., Choy, R., Thinakaran, G., Sisodia, S. S., and Schekman, R. W. (2007) Biogenesis
of γ-secretase early in the secretory pathway, The Journal of cell biology 179, 951-963.
335. Cupers, P., Bentahir, M., Craessaerts, K., Orlans, I., Vanderstichele, H., Saftig, P., De Strooper, B., and
Annaert, W. (2001) The discrepancy between presenilin subcellular localization and γ-secretase
processing of amyloid precursor protein, The Journal of cell biology 154, 731-740.
336. Sannerud, R., and Annaert, W. (2009) Trafficking, a key player in regulated intramembrane proteolysis,
Seminars in cell & developmental biology 20, 183-190.
337. Kaether, C., Scheuermann, J., Fassler, M., Zilow, S., Shirotani, K., Valkova, C., Novak, B., Kacmar, S.,
Steiner, H., and Haass, C. (2007) Endoplasmic reticulum retention of the γ‐secretase complex component
Pen2 by Rer1, EMBO reports 8, 743-748.
338. Lemberg, M. K. (2011) Intramembrane Proteolysis in Regulated Protein Trafficking, Traffic 12, 1109-
1118.
339. Sun, L., Zhao, L., Yang, G., Yan, C., Zhou, R., Zhou, X., Xie, T., Zhao, Y., Wu, S., Li, X., and Shi, Y.
(2015) Structural basis of human γ-secretase assembly, Proceedings of the National Academy of Sciences
112, 6003-6008.
340. Prasanna, X., Chattopadhyay, A., and Sengupta, D. (2014) Cholesterol Modulates the Dimer Interface
of the β2-Adrenergic Receptor via Cholesterol Occupancy Sites, Biophysical journal 106, 1290-1300.

PUBLICATIONS
141
Publications
“Influence of the Lipid Environment on the Dimerization Properties of the Amyloid
Precursor Protein Transmembrane Domain.”
(Manuscript in preparation)
Seybold M, […], Langosch D.
“Activity-based protein profiling of rhomboids in liposomes.”
(Manuscript in preparation)
Wolf EV, Seybold M, [...], Langosch D, Verhelst SH.

Curriculum Vitae
Personal data
Name
Address
Place of birth
Date of birth
Martin Seybold
Am Kapellenacker 4
85368 Moosburg a.d. Isar
Germany
Schwäbisch Gmünd, Baden-Württemberg, Germany
30. August 1984
Education
02/2011 – present Ph.D. studies in Molecular Biotechnology, Technische Universität
München (TUM), Germany;
10/2008 –
06/2010
Master of Science in Molecular Biotechnology, Technische Universität
München (TUM), Germany
10/2004 –
01/2008
Bachelor of Science in Molecular Biotechnology, Technische
Universität München (TUM), Germany
07/2004 Abitur (A levels), Erich-Kästner-Gymnasium in Eislingen, Germany