ingenious tools hazet – specialty tools
TRANSCRIPT

59 International Journal of Scientifi c Study | May 2014 | Vol 2 | Issue 2
Chest Ultrasonography - A Quick and Accurate Diagnostic Tool in Pediatric Emergency Department and Intensive Care Unit
Dinakara Prithviraj1, Suresh A2
1Associate Professor, Chief Neonatologist, Vydehi Institute of Medical Sciences and Research Centre, Whitefi eld, Bengaluru, 2Department of Radio Diagnosis, Vydehi Institute of Medical Sciences and Research Centre, Whitefi eld, Bengaluru
Corresponding Author: Dr. Dinakara Prithviraj, Neonatal ICU, Department of Pediatrics, Department of Radiology, Postgraduate Department of Pediatrics,Vydehi Institute of Medical Sciences And Research Centre. Whitefi eld,Bengaluru Phone: 080-28413385-89 Ext 273,E-mail: [email protected]
While the computed tomography scan of the chest is considered the gold standard for the imaging diagnosis of all the conditions listed so far, it is neither inexpensive nor available within the intensive care unit, necessitating potentially dangerous transport to the radiology department. In addition, it exposes the patient to high doses of ionizing radiation. Ultrasound compares favorably with computed tomography scan in the diagnostic ability for some disease conditions, most prominently pneumothorax, where it has a sensitivity of 92% compared tocomputed tomography. In addition it is relatively cheap and is readily available at the bedside making it easier and faster than chest X-ray or CT.2
Each computed tomography chest exposure gives the patient an effective dose of eight msv, equivalent to four hundred chest x-rays,this is equivalent to 3.6 years of natural background radiation from earth (one x-ray
INTRODUCTION
Traditionally, air has been considered the enemy of ultrasound and the lung has been considered an organ not amenable to ultrasonography examination.Chest diagnostic imaging is essential when dealing with a critically ill patient. At present, direct visualization of the lung parenchyma is performed with a chest x-ray (CXR) a nd computed tomography (CT), with the patient in the supine position. In the ICU, chest x-rays is only performed on patients in the supine position. The x-ray beam is positioned directly onto the chest at a fi lmdistance of less than sixfeet. In fact, when the x-ray beam does not falltangentially on the diaphragm dome and the mediastinal structures, a correct diagnosis of the “silhouette sign” may not be achieved. Hence itmay result in diagnostic errors regarding pleural effusions, parenchymal consolidation, and alveolar-interstitial syndrome.1
Review Article
Abstract
Chest ultrasonography is a useful diagnostic tool for pediatricians. It can be used to complete and widen the general objectives of clinicalexamination in emergency situations, at the patient’s bedside.
The diagnosis of pneumonia in children relies on history, physical examination, blood tests and chest X-rays. These methods have a low accuracy in the pediatric population that is even lower in the critically ill.
The relative ease of bedside ultrasound examination and the availability of user-friendly, inexpensive, portable equipment have made chest ultrasonography an interesting and alternative investigating tool in various situations, because it offers accurate information that is of diagnostic and therapeutic relevance.
In this article we attempt to summarize the equipment, examination techniques, normal fi ndings and various signs of chest ultrasonography seen in multiple pathologies like pneumonia, pneumothorax, pleural effusion, interstitial syndrome, consolidations, pulmonaryedema, ETT placement and diaphragmatic movements.
Keywords: Chest Ultrasonography, Pneumonia, Pneumothorax, Pleural Effusion, Sonographic Interstitial Syndrome

Prithvira, et al.: Chest Ultrasonography - A Quick and Accurate Diagnostic Tool
60International Journal of Scientifi c Study | May 2014 | Vol 2 | Issue 2
exposure gives the patient an effective dose of 0.02 msv equivalent to three days of natural background radiation)
Current estimates indicate that a single CT scan exposure will result in a lethal malignant transformation of at least one in every 10,000 patients or greater.3
For many years transthoracic ultrasound was limited exclusively to the examination of pleural effusions. However, over the past few years ultrasonography of the pleural space and lung parenchyma is gaining a wide consensus in different conditions in clinical practice, particularly in emergency conditions.4
The limitations of computed tomography along with the risk of ionizing radiations mandate the search for a safe diagnostic tool for patients with suspected pneumonia, with the advent of portable bedside ultrasound.5 Chest scan using ultrasound can be adopted as a simple and non-invasive method for evaluating children with pleural and parenchymal pathology especially pneumonia which, allows close follow-up and avoids the use of ionizing radiation.6 Lung ultrasound may be used to distinguish viral from bacterial pneumonia.7
The relative ease of bedside chest ultrasonography (chest ultrasonography) as an interesting alternative method in different respiratory situations, because it offers accurate information that is of diagnostic and therapeutic relevance. This is why it is often used by intensivists who ask radiologists for a second opinion in diffi cult or complicated case studies. Experienced radiologists can integrate chest ultrasound fi ndings with better radiological techniques, which mean that the contribution of a radiologist is often necessary in patient management.
BASICS
Lung sonography is made feasible by the interpretation of ultrasound artifacts that arise from the chest wall and pleural surface. A brief review of the relevant normal anatomy will provide the framework to facilitate an understanding of the various patterns one may encounter when performing lung sonography.
Superfi cial structures (skin, subcutaneous fat, pectoral and intercostal muscles) conduct sound waves well and do not generate artifacts.
The cortex of each rib refl ects ultrasound waves and blocks their transmission, resulting in a hyperechoic (bright) appearance to the near-fi eld (superfi cial) cortex, with distal shadows extending to the edge of the ultrasound screen (Figure 1).
The parietal and visceral pleurae appear as a single hyperechoic “pleural line” just deep to the internal intercostal muscles. This line will “slide” or oscillate from side to side on the ultrasound screen, representing movement of the pleural surfaces as the lung expands and contracts during the respiratory cycle.
Normal lung parenchyma is not visualized because it is composed primarily of air, which scatters and impedes the transmission of sound waves. The dramatic difference in the acoustic characteristics of soft tissues and the lung makes the lung surface a particularly strong refl ector of ultrasound waves, and is responsible for creating a number of reverberation artifacts that provide valuable information about the lung’s current pathophysiology.8
The more the ultrasound waves are refl ected back the brighter the image:• Hyperechoic (bright): air, diaphragm, periostium.• Echogenic: liver,kidney,muscle.• Hypoechoic: (dark) fl uid, bloodfat.
A-LinesA-lines occur when sound waves pass through the superfi cial soft tissues and cross the pleural line encountering air (as in a pneumothorax) or tissue that is almost completely composed of air (as in normal lung, or pathologic states that do typically affect the lung parenchyma such as asthma or chronic obstructive pulmonary disease). These waves are refl ected strongly by this tissue/air interface and reverberate, or “bounce” back and forth, between the transducer and lung surface (Figure 2).
A Lines:• Horizontal lines parallel to the pleural line.• Seen in normal lung parenchyma.
Figure 1: Anatomical drawing fused with corresponding ultrasoundimage demonstrating the superfi cial chest wall
structures. (www.philips.com/CCEMeducation)

Prithvira, et al.: Chest Ultrasonography - A Quick and Accurate Diagnostic Tool
61 International Journal of Scientifi c Study | May 2014 | Vol 2 | Issue 2
• If A lines present along with lung sliding: asthma.• If A lines present without lung sliding – Pneumothorax
should be suspected.
B-LinesB-lines occur when sound waves pass through the superfi cial soft tissues and cross the pleural line encountering a mixture of air and water (as in pulmonary edema, pneumonia, lung contusion, acute respiratory distress syndrome, etc.). In this instance, the mixed density of the lung parenchyma causes reverberation artifact within the lung, giving rise to discrete laser-like vertical hyperechoic reverberation artifacts that arise from the pleural line, extend to the bottom of the screen without fading, and move synchronously with lung sliding.
When several B lines are visible the term “Lung rocket`s” is used.
B lines:• Arise from the pleural line and extend up to bottom
of screen.
• Move with lung sliding.• Correlate with alveolar interstitial pattern – 7 mm apart
Blines,interlobular septa process: diffuse interstitial fi brosis.
• <3 mm apart closely spaced B lines intra alveolar process: pulmonary edema (smooth pleura) or acute respiratory distress syndrome (rough pleura) (Figure 3a and b).
Z lines are short, broad, ill defi ned, vertical comet tail artifacts arising from the pleural line but not reaching the distal edge of the screen and are not B lines (Figure 3c). These are found in normal persons as well as in those with pneumothorax. They are less echogenic than the pleural line, usually taper off at after 2-4 centimetres, they do not erase A lines and do not move with lung sliding. E lines are comet tail artifacts can be seen superfi cial to the pleural line in those with parietal emphysema or parietal echogenic multiple foreign bodies (shot gun pellets). These are called E lines (subcutaneous emphysema).7
TRANSDUCER SELECTION
There has been a great deal of controversy regarding the optimal choice of transducer for lung sonography. In recent years, however, prospective studies using high-frequency linear, low-frequency curvilinear and low-frequency sector transducers have demonstrated that the performance and interpretation of lung sonography is not transducer-specifi c.
Curvilinear low frequency transducer (3-5 MHz) is used best for clear A and B line determination. High frequency (12-15 MHz) because of better resolution can be used for assessing lung sliding. Lower frequency transducers will provide more depth penetration but will sacrifi ce image quality; high-frequency transducers provide better resolution but will sacrifi ce depth penetration.Phased array cardiac probes are even better in this regard. We generally use pediatric cardiac phased array or curvilinear (5-8 MHz) probe and fordemonstrating lung sliding and high frequency linear probe (12-15 MHz) forpleural pathology.
Figure 2: Ultrasound image demonstrating A-lines. The A-linesare the bright horizontal lines deep to the pleural
line. A-lines are a classic reverberation artifact; the distance from the skin to the pleural line equals the distance from the
pleural line to the fi rst A-line, the fi rst A-line to the second A-line, and so forth
Figure 3: (a and b) The ultrasound images demonstrating B-lines. B-lines are discrete laser-like vertical hyperechoic reverberation artifacts that arise from the pleural line, extend to the bottomof the screen without fading, and move synchronously with lung
sliding. Figure A was obtained usinga low-frequency curved transducer; the Figure b and c were obtained using a high-frequency linear transducer. (c) – Z lines not touching the bottom
cba

Prithvira, et al.: Chest Ultrasonography - A Quick and Accurate Diagnostic Tool
62International Journal of Scientifi c Study | May 2014 | Vol 2 | Issue 2
IMAGE OPTIMIZATION
We recommend that features that decrease artifacts such as compound imaging, speckle reduction, etc. are de-activated for the lung exam. Some newer ultrasound systems have “lung” exam types or presets that have been optimized for lung imaging. These exam types deactivate the software-processing features that decrease artifacts. Lung examtype presetoptimizes other ultrasound parameters such as depth, focal zone and gain settings.9
EXAMINATION TECHNIQUE
The patient can be scanned supine or erect, anteriorly, posteriorly or in the mid axillary line intercostal (between the ribs) depending on the pathology being assessed. When scanning the lungs it is recommended to scan in the longitudinal plane between the ribs to assist in identifying the level of the pleura between the rib artifacts (Figure 4).
For optimization of the image transducer should be placed always perpendicular to the pleural line. Transducers directional indicator should be always oriented towards patients head in longitudinal views. The left side of the image on the monitor corresponds to the cephalad part of the patient in all longitudinal scans, on all lateral/axial imaging the left of image corresponds to right half of patient. Positioning the probe under the xiphoid with cranial inclination allows evaluation of the pericardium. Subcostal and intercostal acoustic windows of the liver and the spleen are used to study the lung base and pleural effusion.
NORMAL LUNG FINDINGS
• Pleural line.• Bat wing sign.
• Sliding lung• A lines.• Lung pulse.• B lines/Comet tails.
The pleural line “slides” (to and fro movement)with respiration. The movement is distinctive as the surrounding chest wall structures are still or move in an opposite direction to the lung.This is pleural/lung sliding. The sliding movement seen is the lung which moves on respiration. Its amplitude is greater at the base than at the apex where it may be inappreciable. The image best seen in M mode as the superfi cial parietal layers are motionless and have a horizontal pattern of lines while the area deep to the pleural line appears “granular” as the motion of the pleural line is refl ected all over this area. This is also known as the “seashore sign” (Figure 4b).
In B-Mode scanning the normal Pleura is seen as a white (echogenic) line which moves with respiration (lung sliding). The pleura are situated posterior (below) to the ribs which appear as white curved lines with a dark shadow behind. This is known as the “Bat sign” (Figure 4a) When scanning intercostally you may see the liver and diaphragm covered by lung during inspiration. This is known as the “Curtain sign.”
LUNG PULSE
As the heart beats the movement of the heart is transmitted through the lung which is demonstrated in M-mode as a regular motion artifact through the seashore pattern to the level of the pleura (Figure 5a and b). The Lung Pulse is easily identifi ed when the patient holds their breath. If there was a pneumothorax present the
Figure 4: Six-zone examination protocol of lung scanning in pediatrics. Top Row: Anterior Midclavicle Line; Middle Row: Lateral Midaxillary Line; Bottom Row: Posterior Paraspinal Line. Probes in transverse (columns in A and D) and parasagittal planes (columns B
and C) in anterior and posterior lung fi elds, and in transverse and coronal planes (middle row) in lateral lung fi elds (Modifi ed)

Prithvira, et al.: Chest Ultrasonography - A Quick and Accurate Diagnostic Tool
63 International Journal of Scientifi c Study | May 2014 | Vol 2 | Issue 2
motion of the heart beat could not be identifi ed within the Barcode. (Figure 5c)
ABNORMAL LUNG
PneumothoraxIn supine patient, a free pneumothorax usually collects in the anterior and non dependent area. The signs are best appreciated with a high frequency probe. A probe grater than 5 MHz is advisable. High frequency linear (such as a vascular) probes will give a clearer picture.
Absence of lung sliding: This is a sign of pneumothorax. If lung sliding is present, pneumothorax can be ruled out. However, loculated posterior, mediastinal and apical pneumothoracies can be missed. For a complete examination, the probe must be placed along the anterior, lateral and posterior intercostals spaces and observation must include a whole respiratory cycle at each point. In an M mode, this will show absence of the normal granular
Figure 4a: Lung sliding sign, Bat sign and A Lines. (normal lung)
Figure 4b: Seashore sign by M mode
Figure 5a: Lung pulse extending from the bottom of the screen where the heart is positioned behind the lung to the
pleura
Figure 5b: Pause in the respiration on the ventilator causing loss of sea shore sign but demonstrates a lung pulse hence
excluding a pneumothorax
Figure 5c: Side by side M-mode and 2D tracing demonstrating a “lung pulse.” On the M-mode, note the rapid, regular,
intermittent movement at and below the pleural line, corresponding to the movement of the pleural line with each
heartbeat

Prithvira, et al.: Chest Ultrasonography - A Quick and Accurate Diagnostic Tool
64International Journal of Scientifi c Study | May 2014 | Vol 2 | Issue 2
pattern deep to the pleural line - the whole picture will show a number of horizontal lines.
Absence of B-lines: Although is not specific for pneumothorax, the presence of B-lines rules out a pneumothorax. B-lines with absent lung sliding may be seen in lower lobe consolidations. Absent B-lines with lung sliding present may be seen in emphysema or hyper infl ated lung states.
The Lung PointSince the air in the pleural space moves anterior and the lung collapses to a dependent position posteriorly, there is a point, usually in the lateral regions where the lung and air may be visualized in the same view. On moving from anterior to lateral, a pneumothorax pattern gives way to a fl eeting appearance of lung pattern in a particular location of the chest wall. ‘Lung point has a sensitivity of 66% and a specifi city of 100%’ (Figure 6a-c). Lung pulse sign has been explained earlier to rule out pneumothorax.
PLEURAL EFFUSION
Ultrasound is more efficient than a normal physical examinationand more useful than chest X-rayin pleural effusion diagnosis. Even minimal pleural effusion (about 5 mL), which is not evident on achest X-ray, can be detected. If the chest X-raydemonstrateshemi thorax opacity, the chest ultrasonography can detect quickly and with certainty the nature of the opacity, differentiating liquid and solid components of the opacity. Transudates are normally anechoic, while exudates are corpuscular. Hyper-refl ect ant air bubbles in effusion suggest hydro pneumothorax. In M mode Sinusoidal pattern noted. (Figure 7a)
Chest ultrasonography is the most accurate technique in indicating the organized or septate nature of effusion (Figure 7b) and can help to avoid the ineffectiveness of evacuative thoracocentesis. Chest ultrasonography is also more accurate in quantifying pleural effusion than achest X-ray.
To quantify the pleural fl uid in basal lung scan. The distance between baseof the lung and pleura that is milliliters (ml)of fl uid = distance in millimeters (mm) x 20.
Fluid (Black) will collect in the dependent area of the chest cavity. The patient can be scanned supine or erect, depending on the condition of the patient, in the mid axillary line or slightly posterior to the mid axillary line. Methodical surveillance of the chest cavity in the longitudinal plane from medial to lateral and superior to
inferior will assist in locating the largest pool of fl uid in the erect patient. The largest pool of fl uid can be marked for thoracocentesis.
Figure 6a: Bar code sign in M mode in pneumothorax
Figure 6b: Seashore sign normal lungs
Figure 6c: Seashore sign, Lung point, Barcode sign

Prithvira, et al.: Chest Ultrasonography - A Quick and Accurate Diagnostic Tool
65 International Journal of Scientifi c Study | May 2014 | Vol 2 | Issue 2
LUNG CONSOLIDATION
Water is a good transmitter of ultrasound and a consolidated lung is water rich. Alveolar consolidation usually reaches the lung surface. Collapsed lung segments can resemble consolidation sonologically. It appears as poorly defi ned hypoechoic lung tissue structure. In contrast, the tissue structure of normal lung cannot be seen. What is seen is the artifacts that arise at the pleural line. (Figure 8a)
Within the consolidation, hyperechoic puntiform images can be seen corresponding to air in the bronchi - a so called ultrasound air bronchogram. These air bubbles can be seen to move in the bronchi during respiration. The size of a consolidation does not change with respiration, in contrast to a pleural effusion.
Sonologically diagnosed alveolar consolidation is abnormal pathology in thorax, should arise from pleural line, tissue like pattern, superfi cial boundary should be pleural line (otherwise pleural effusion), and deep boundary should be irregular. It helps in assessing degree of aeration
as a measure of effectiveness of therapy (Positive end expiratory pressure effect or antibiotic effect on the consolidation).
Consolidations of an infl ammatory nature have an irregular profi le, with a hypo-anechoic heterogeneous structure and a branching bronchogram. When present, the air bronchograms resemble reverberant ribbon images with a branch-shaped aspect. Due to loss of volume during atelectasis, the bronchial tubes present a parallel aspect, rather than a branching one (the latter of which is typical of fl ogisticconsolidations (Figure 8b).
In bronchial obstruction, a fl uid bronchogram may be observed. The bronchus resembles tubular images, with hyperechoic walls and anechoic content.
In consolidation the lung volume is increased by fl uid or tissue, but the bronchi are spared and retain their normal branching pattern. In atelectasis, overall lung volume is
Figure 7a: Pleural effusion in M mode "Sinusoid Pattern"
Figure 7b: Pleural effusion with septae
Figure 8a: Left lower lobe consolidation (LL), Pleural effusion (E), White arrow showing pleural lines, black arrows showing
irregular Lower border of consolidation and transitional zone (shred Line) That is connected with aereated lung and B lines.
M Mode showing Sinusoid sign
Figure 8b: Viral pneumonia shows sub pleural consolidation with comet tails (B Lines). But there is minimal sonographic air bronchograms, no A Lines which indicates bacterial pneumonia
Prithvira, et al.: Chest Ultrasonography - A Quick and Accurate Diagnostic Tool
66International Journal of Scientifi c Study | May 2014 | Vol 2 | Issue 2
decreased; supplying bronchi of the involved lung can be crowded together in very close apposition in one plane, appearing as parallel-running bright lines.
Occasionally when the bronchial tree is fi lled with fl uid rather than air, as in mucoid impaction, ultra sound may demonstrate a branching pattern of anechoic or hypoechoic tubular structures within consolidated lung. Demonstration of fl uid-fi lled bronchi, an appearance termed a sonographic or mucous bronchogram, is a specifi c indicator of pulmonary parenchymal consolidation, equivalent to the air bronchograms.
Sonographic air fl uid bronchograms may not be visible, particularly in the peripheral lung. In this case color fl ow ultra sound demonstrates the normally branching pattern of pulmonary vessels in consolidated lung.
RECRUITMENT MANEUVERS OF LUNG AND ULTRASOUND EVALUATION
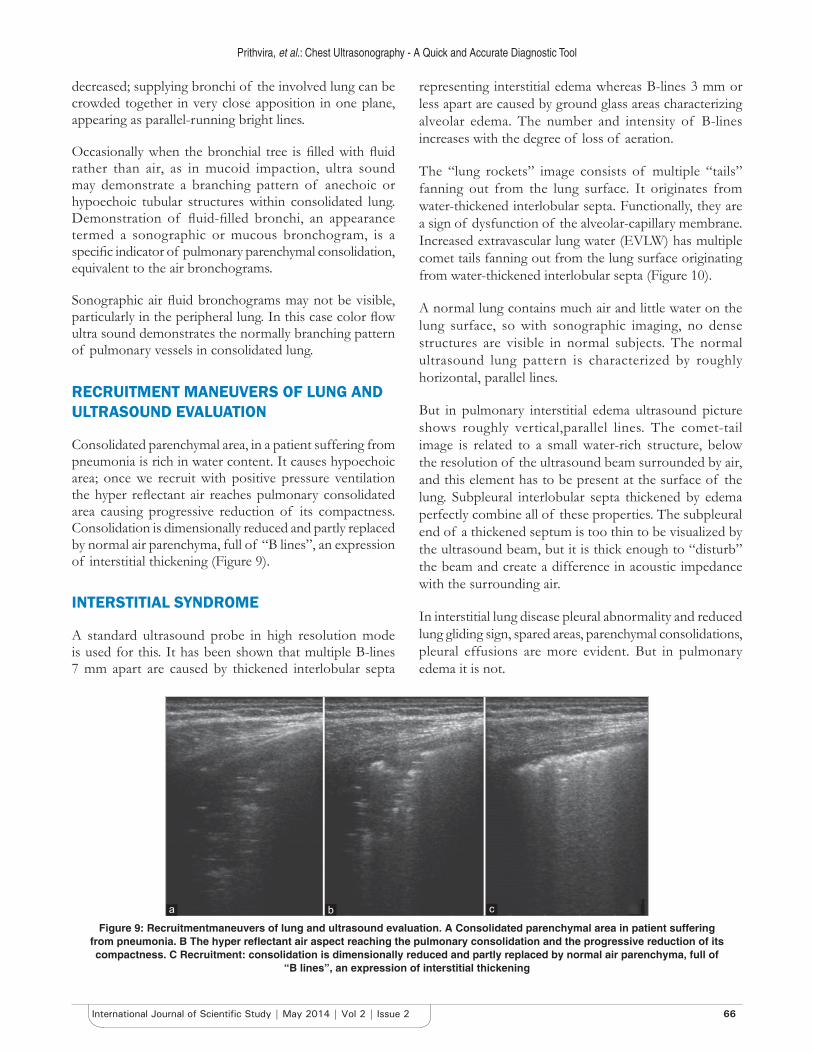
Consolidated parenchymal area, in a patient suffering from pneumonia is rich in water content. It causes hypoechoic area; once we recruit with positive pressure ventilation the hyper refl ectant air reaches pulmonary consolidated area causing progressive reduction of its compactness. Consolidation is dimensionally reduced and partly replaced by normal air parenchyma, full of “B lines”, an expression of interstitial thickening (Figure 9).
INTERSTITIAL SYNDROME
A standard ultrasound probe in high resolution mode is used for this. It has been shown that multiple B-lines 7 mm apart are caused by thickened interlobular septa
representing interstitial edema whereas B-lines 3 mm or less apart are caused by ground glass areas characterizing alveolar edema. The number and intensity of B-lines increases with the degree of loss of aeration.
The “lung rockets” image consists of multiple “tails” fanning out from the lung surface. It originates from water-thickened interlobular septa. Functionally, they are a sign of dysfunction of the alveolar-capillary membrane. Increased extravascular lung water (EVLW) has multiple comet tails fanning out from the lung surface originating from water-thickened interlobular septa (Figure 10).
A normal lung contains much air and little water on the lung surface, so with sonographic imaging, no dense structures are visible in normal subjects. The normal ultrasound lung pattern is characterized by roughly horizontal, parallel lines.
But in pulmonary interstitial edema ultrasound picture shows roughly vertical,parallel lines. The comet-tail image is related to a small water-rich structure, below the resolution of the ultrasound beam surrounded by air, and this element has to be present at the surface of the lung. Subpleural interlobular septa thickened by edema perfectly combine all of these properties. The subpleural end of a thickened septum is too thin to be visualized by the ultrasound beam, but it is thick enough to “disturb” the beam and create a difference in acoustic impedance with the surrounding air.
In interstitial lung disease pleural abnormality and reduced lung gliding sign, spared areas, parenchymal consolidations, pleural effusions are more evident. But in pulmonary edema it is not.
Figure 9: Recruitmentmaneuvers of lung and ultrasound evaluation. A Consolidated parenchymal area in patient suffering from pneumonia. B The hyper refl ectant air aspect reaching the pulmonary consolidation and the progressive reduction of its compactness. C Recruitment: consolidation is dimensionally reduced and partly replaced by normal air parenchyma, full of
“B lines”, an expression of interstitial thickening
cba

Prithvira, et al.: Chest Ultrasonography - A Quick and Accurate Diagnostic Tool
67 International Journal of Scientifi c Study | May 2014 | Vol 2 | Issue 2
DIAPHRAGMATIC MOVEMENTS
Diaphragmatic movements and its contractility were evaluated using ultrasonography after cardiac surgery resulting in phrenic nerve damage. Further it can be used in degenerative nerve disorders and severe sepsis causing diaphragmatic damage leading to diffi cult extubations.
Normal diaphragmatic movement is downwards during inspiration and opposite during expiration.In ultrasound this downward movement of diaphragm appears like an upward stroke white line (because diaphragm is coming towards the probe, where probe is in right and left hypochondriac region) (Figure 11).
In diaphragmatic paralysis the caudal movement (downwards) is absent during inspiration.There will be abnormal cephalad (upwards) movement during inspiration.10
Normaldiaphragmatic movementsin variousmaneuvers observed in M mode tracing (Figures 12 and 13).
ENDOTRACHEAL TUBE INSERTION
It has been used to confi rm endotracheal intubation, position of the endotracheal tube after intubation, assess vocal cord movement, and diagnose end bronchialintubation (Figure 14).
Proximal Endotracheal tube malposition“endotracheal tubetoo high• Measure distance from vocal cord to tip of tube.• Tip of tube should be visible above sternal notch.
Distal Endotracheal tube malposition• Unilateral pleural sliding may indicate main stem
intubation.Combination of both may eliminate the need for chest X ray.11
Figure 10: Comparison of the CT scans andultrasound showing normal lung, interstitial lung disease and pulmonary edema.
Note the compactness and number of vertical B lines
Figure 11: Picturised illustration of diaphragmatic movements and probe position and orientation
Figure 12: Pictured illustration of measurement of diaphragmatic movement
Figure 13: M Mode measurements of diaphragm movements in normal breathing, sniffi ng, deep breathing normal values of all
manures
Prithvira, et al.: Chest Ultrasonography - A Quick and Accurate Diagnostic Tool
68International Journal of Scientifi c Study | May 2014 | Vol 2 | Issue 2
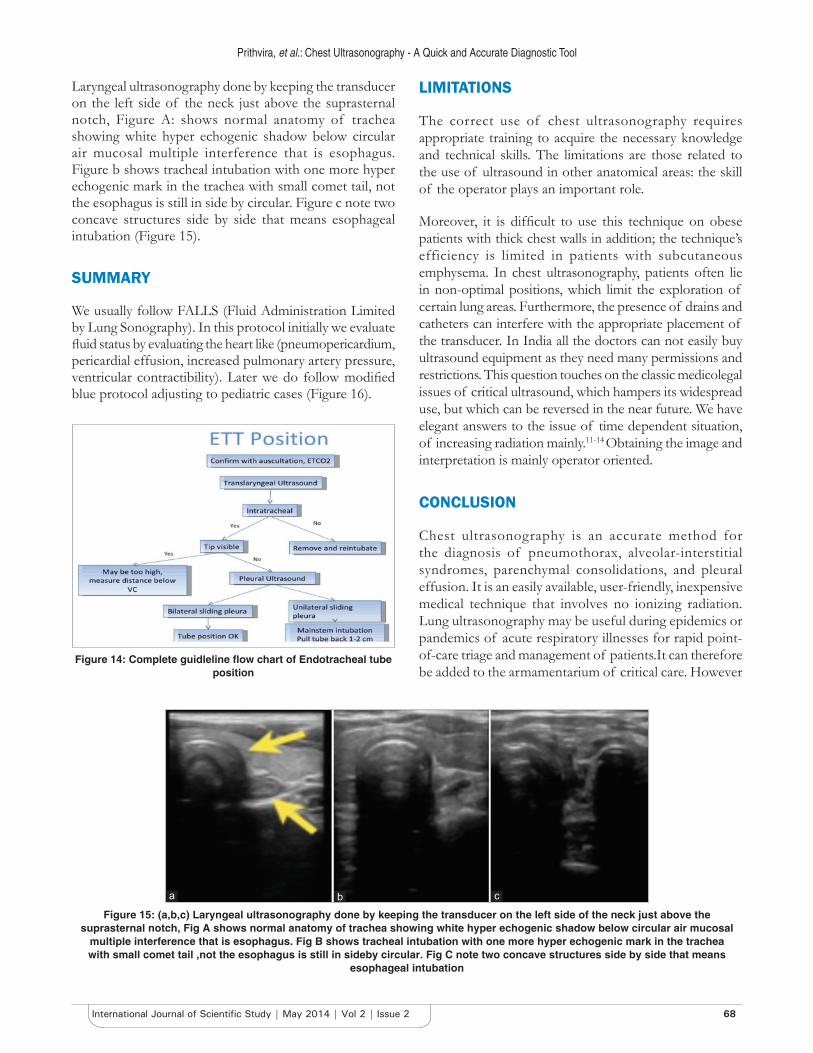
Laryngeal ultrasonography done by keeping the transducer on the left side of the neck just above the suprasternal notch, Figure A: shows normal anatomy of trachea showing white hyper echogenic shadow below circular air mucosal multiple interference that is esophagus. Figure b shows tracheal intubation with one more hyper echogenic mark in the trachea with small comet tail, not the esophagus is still in side by circular. Figure c note two concave structures side by side that means esophageal intubation (Figure 15).
SUMMARY
We usually follow FALLS (Fluid Administration Limited by Lung Sonography). In this protocol initially we evaluate fl uid status by evaluating the heart like (pneumopericardium, pericardial effusion, increased pulmonary artery pressure, ventricular contractibility). Later we do follow modifi ed blue protocol adjusting to pediatric cases (Figure 16).
LIMITATIONS
The correct use of chest ultrasonography requires appropriate training to acquire the necessary knowledge and technical skills. The limitations are those related to the use of ultrasound in other anatomical areas: the skill of the operator plays an important role.
Moreover, it is diffi cult to use this technique on obese patients with thick chest walls in addition; the technique’s efficiency is limited in patients with subcutaneous emphysema. In chest ultrasonography, patients often lie in non-optimal positions, which limit the exploration of certain lung areas. Furthermore, the presence of drains and catheters can interfere with the appropriate placement of the transducer. In India all the doctors can not easily buy ultrasound equipment as they need many permissions and restrictions. This question touches on the classic medicolegal issues of critical ultrasound, which hampers its widespread use, but which can be reversed in the near future. We have elegant answers to the issue of time dependent situation, of increasing radiation mainly.11-14 Obtaining the image and interpretation is mainly operator oriented.
CONCLUSION
Chest ultrasonography is an accurate method for the diagnosis of pneumothorax, alveolar-interstitial syndromes, parenchymal consolidations, and pleural effusion. It is an easily available, user-friendly, inexpensive medical technique that involves no ionizing radiation. Lung ultrasonography may be useful during epidemics or pandemics of acute respiratory illnesses for rapid point-of-care triage and management of patients.It can therefore be added to the armamentarium of critical care. However
Figure 14: Complete guidleline fl ow chart of Endotracheal tube position
Figure 15: (a,b,c) Laryngeal ultrasonography done by keeping the transducer on the left side of the neck just above the suprasternal notch, Fig A shows normal anatomy of trachea showing white hyper echogenic shadow below circular air mucosal
multiple interference that is esophagus. Fig B shows tracheal intubation with one more hyper echogenic mark in the trachea with small comet tail ,not the esophagus is still in sideby circular. Fig C note two concave structures side by side that means
esophageal intubation
cba

Prithvira, et al.: Chest Ultrasonography - A Quick and Accurate Diagnostic Tool
69 International Journal of Scientifi c Study | May 2014 | Vol 2 | Issue 2
chest x-ray continues to be the gold standard for lung related problems.
REFERENCES
1. Gardelli G, Feletti F, Nanni A, Mughetti M, Piraccini A, Zompatori M. Chest ultrasonography in the ICU. Respiratory care. 2012;57(5):773-781.
2. Bouhemad B, Zhang M, Lu Q, Rouby JJ. Clinical review: bedside lung ultrasound in critical care practice. Crit Care. 2007;11(1):205.
3. Penelope Allisy-Roberts, Jerry Williams,Farr`s Physics for Medical Imaging (2nd edition), Saunders (2008) 44-47.
4. Andrea Smargiassi, Riccardo Inchingolo, Gino Soldati et al. The role of chest ultrasonography in the management of respiratory diseases. Multidisciplinary Respiratory Medicine. 2013;8:55 doi:10.1186/2049-6958-8-55.
5. Snyder et al. Whole-body imaging in blunt multisystem trauma patients who were never exam- ined. Ann Emerg Med. 2008;52(2):101-103.
6. Copetti R, Cat- tarossi L. Ultrasound diagnosis of pneumonia in children. Radiol Med. 2008, 113: 190-198.
7. Tsung JW, Kessler DO, Shah VP. Prospective application of clinician-
Figure 16: Bedside lung ultrasound in emergency protocol - modifi ed for emergency department and intensive care unit. This protocol Includes posterior thorax scanning
performed lung ultrasonography during the 2009 H1N1 infl uenza A pandemic: distinguishing viral from bacterial pneumonia. Critical Ultrasound Journal. 2012;4(1), 1-10.
8. Point-of-care lung ultrasound, Philipstutorial, Michael B. Stone, MD, RDMS, Director, Division of Emergency Ultrasound, Department of Emergency Medicine, Brigham and Women’s Hospital, Boston MA. IMG-12-21738 * SEP 2012,www.philips.com/CCEMeducation.
9. Mower, et al. Radiation doses among blunt trauma patients: assessing risks and benefi ts of computed tomographic imaging. Ann Emerg Med. 2008;52(2): 99-100.
10. Boussuges A, Gole Y, Blanc P. Diaphragmatic Motion Studied by M-Mode UltrasonographyMethods, Reproducibility and Normal Values. CHEST Journal. 2009;135(2): 391-400.
11. Brenner DJ, Elliston CD, Hall EJ, Berdon WE. Estimated risks of radiation-induced fatal cancer from pediatric CT. Am J Rœntgenol 2001;176:289-96.
12. Brenner DJ, Hall EJ. Computed Tomography - an increasing source of radiation exposure. New Engl J Med. 2007;357:2277-84.
13. Berrington de Gonzales A, Darby S. Risk of cancer from diagnostic X-Rays. Lancet. 2004; 363:345-51.
14. Kalra MK, Maher MM, Toth TL et al. Strategies for CT radiation dose optimization. Radiology. 2004;230:619-28.
How to cite this article: Dinakara Prithviraj, A. Suresh. "Chest Ultrasonography - A quick and accurate diagnostic tool in pediatric emergency department and Intensive Care Unit". Int J Sci Stud. 2014;2(2):59-69.
Source of Support: Nil, Confl ict of Interest: None declared.