initial stages of nucleation in phase separating polymer ... · initial stages of nucleation in...
TRANSCRIPT

JOURNAL OF CHEMICAL PHYSICS VOLUME 111, NUMBER 13 1 OCTOBER 1999
Down
Initial stages of nucleation in phase separating polymer blendsA. A. Lefebvre, J. H. Lee, H. S. Jeon, and N. P. Balsaraa)
Department of Chemical Engineering, Chemistry, and Materials Science, Polytechnic University,Six Metrotech Center, Brooklyn, New York 11201
B. HammoudaNational Institute of Standards and Technology, Building 235, E 151, Gaithersburg, Maryland 20899
~Received 20 April 1999; accepted 6 July 1999!
The initial stages of nucleation during liquid–liquid phase separation in mixtures of high molecularweight polymers was studied by time-resolved small angle neutron scattering. Phase separation wasinduced either by decreasing temperature or by increasing pressure. One of the blend componentswas labeled with deuterium to obtain sufficient scattering contrast between the components. Thegeneral features of nucleation were independent of quench depth and the nature of the quench~temperature quench versus pressure quench!. The early stages of nucleation consisted ofamplification of concentration fluctuations. During this stage, the scattered intensity~I! in the lowscattering vector~q! limit was consistent with the Ornstein–Zernike equation. This enabled thedetermination of the characteristic length scale of the growing fluctuations,j. The I vs q behaviorat intermediate scattering vectors (q.1/j) could be described by a power law (I;q2d). Wedemonstrate the existence of a time–temperature superposition principle during nucleation: Thetime dependence ofd at different quench depths could be superimposed by a lateral shift of the dataalong the time axis~log scale!. In analogy to the shift factor for viscoelastic behavior of polymers,we define a nucleation shift factor,aN , which describes the slowing down of nucleation kineticswith decreasing quench depth. Similarly, nucleation after pressure quenches can be described by atime–pressure superposition law. For each quench, we find that the scattering intensity isindependent of time in the highq regime (q.qmerge). This implies the absence of growingstructures with length scales smaller thanjcrit51/qmergeduring nucleation. This aspect of nucleationis consistent with classical theories which predict the existence of a critical nucleus size. Asexpected,jcrit increases with decreasing quench depth. ©1999 American Institute of Physics.@S0021-9606~99!50437-6#
b
epierhor-
haeas,licrinreth
si-le
esth
volu-tzofus-
tion
tical
en-hiscat-htr
lvedthe
nalsthe
lingas-on-ouseu-
ma
I. INTRODUCTION
Phase separation in liquid mixtures can occur eitherspinodal decomposition or nucleation.1–3 The classicaltheory of spinodal decomposition indicates that phase sration is initiated by the amplification of selected Fourmodes of concentration fluctuations that preexist in themogeneous liquid.2 The signature of this process in scatteing experiments is a scattering peak that brightens as pseparation proceeds. Remarkable agreement between thand experiment has been reported in mixtures of ordinliquids ~with waterlike viscosity!, metals, glasses, ceramicand polymers.2–17 In contrast, the signatures of the initiastage of nucleation are not well established. The classtheory of nucleation is based on the assumption that duthe initial stages of the transformation, a few moleculesarrange themselves into droplets or nuclei that have all ofcharacteristics~composition, density, and symmetry! of thenew phase.1 In liquid–liquid phase separation, the compotion difference is the main factor that differentiates the nucfrom the surrounding mother phase. If the radius of thnuclei exceeds a certain critical radius, then the growth of
a!Author to whom correspondence should be addressed; [email protected]
6080021-9606/99/111(13)/6082/18/$15.00
loaded 01 Mar 2011 to 129.6.123.112. Redistribution subject to AIP licens
y
a-
-
seoryry
alg-e
iee
new phase is spontaneous. Theoretical aspects of the etion of such systems were studied by Langer and Schwar18
and others.2 On the other hand, computer simulationsnucleation have revealed the formation and growth of clters with varying shape and compactness.19–22 Optical tech-niques have been used in experimental studies of nucleain mixtures of low molecular weight compounds,23 colloidalsuspensions,24 and polymer mixtures.25 However, the initialstages of phase separation and the formation of the crinucleus were not resolved in any of the experiments.23–25
The main purpose of this paper is to present experimtal data obtained during the initial stages of nucleation. Twas accomplished by conducting time-resolved neutron stering experiments on mixtures of high molecular weigpolymers. Molecular motion in melts of high moleculaweight polymers is slow due to chain entanglement.26 Thisexpands the nucleation time scales and enables time-resomeasurements. Substantial scattering contrast betweencomponents is required in order to obtain measurable sigfrom the subtle clustering processes that occur duringearly stages of nucleation. This is accomplished by labeone of the components in the mixture with deuterium. Clsic experiments by Herkt-Maetzky and Schelten demstrated that concentration fluctuations in homogenesamples in the single-phase region could be studied by nil:
2 © 1999 American Institute of Physics
e or copyright; see http://jcp.aip.org/about/rights_and_permissions

d.ot
.nh
-afher
eh
fnsoe
d
eord
siet
a
bucr
arp
herlledfinly-o-
of
at-icaltionringentlso
tion
ilararyed
e-
u-andiza-
atu-
le-ed
ofHy-ingthis
rsingthe
us-in
ion.heth-t the
inth
B
6083J. Chem. Phys., Vol. 111, No. 13, 1 October 1999 Initial stages of nucleation in blends
Down
tron scattering if one of the components is deuterate27
Therefore, clustering of chains during the initial stagesnucleation, which must necessarily lead to an increase inscattering intensity, is, in principle, within detection limits
In this study, we examine mixtures of hydrogenous adeuterated polyolefins. Since all polyolefins are saturateddrocarbons~the empirical formula CH2 applies to all mem-bers of the polyolefin family!, the interactions between different components are expected to be nonspecificdispersive in nature. The thermodynamic properties owide variety of polyolefin mixtures can be described by tFlory–Huggins model.28–30 The Gibbs energy of mixing peunit volume for binary mixtures is given by
DG
kT5Ff ln f
vANA1
~12f!ln~12f!
vBNBG1
x
v0f~12f!, ~1!
wherek is the Boltzmann constant,f is the volume fractionof componentA in the mixture,Ni is the number of mono-mers per chain of componenti, v i is the volume of eachmonomer of componenti, x is the Flory–Huggins interactionparameter, andv0 is an arbitrary reference volume which wset equal to the mean monomer volume of the polymers csen for this study at atmospheric conditions, 149 Å3. The firsttwo terms in Eq.~1! reflect the combinatorial entropy omixing. We use the last term for all of the other contributioto DG, including changes in the internal energy and the vume change of mixing.31 These effects are manifested in thtemperature and pressure dependence ofx.
The particular polyolefins that we have used in this stuare polymethylbutylene ~PMB! and polyethylbutylene~PEB!. The temperature and pressure dependence of thxparameter between PMB and PEB chains has been repin previous publications31–34 and the results are summarizein Fig. 1. Thex parameter~or equivalently,DG) can beincreased by either decreasing temperature or by increapressure. Phase separation can thus be initiated by eithdecrease in temperature or by an increase in pressure. Inpaper, we study nucleation triggered by both temperaturepressure quenches.
Our studies on polyolefin blends are also motivatedtheir technological importance. The current annual prodtion of polyolefins (531010kg/yr) exceeds that of any otheman-made solid material. Most commercial polyolefinsused as blends. In some cases, the blending is done on
FIG. 1. The dependence ofx on temperature and pressure in PMB/PEblends. This plot is based on data in Refs. 31 and 32.
loaded 01 Mar 2011 to 129.6.123.112. Redistribution subject to AIP licens
fhe
dy-
nda
o-
l-
y
ted
ngr ahisnd
y-
eur-
pose, to impart particular properties to the material. In otcases, blends are produced inadvertently, due to uncontroside reactions. Understanding the properties of polyoleblends is also relevant to problems related to recycling pomeric waste, which is dominated by polyolefinic compnents.
This paper is part of a series on the thermodynamicspolyolefin blends.17,31–42In earlier work, we studied binaryand multicomponent polyolefin mixtures using neutron sctering. We compared our experimental data with theoretpredictions based on the random phase approxima~RPA!.31–34 We demonstrated that the measured scatteprofiles were in quantitative agreement with multicomponRPA predictions without any adjustable parameters. We aexamined the early stages of liquid–liquid phase separaby spinodal decomposition in polyolefin blends.17 In this pa-per, we focus on nucleation in mixtures that are very simto those studied in Refs. 17, 31–35, and 37. A preliminreport of our findings in the nucleation regime was publishin Ref. 35.
II. EXPERIMENT
A. Materials
Nearly monodisperse model polyolefins were synthsized following the methodology of Rachapudyet al.43
Homopolymers—polymethylbutylene and polyethylbtylene—were synthesized in two steps using isopreneethylbutadiene, respectively, as monomers. The polymertions were conducted under high vacuum44 in cyclohexaneand the polydienes consisted of predominantly~93%! 1, 4addition. Separate aliquots of the polydienes were then srated in the presence of a palladium catalyst with H2 and D2
to yield fully hydrogenated and partially deuterated polyofins. A pair of hydrogenous and partially deuteratpolymethylbutylene-block-polyethylbutylene copolymerswere synthesized by sequential anionic polymerizationisoprene and ethylbutadiene followed by saturation with2and D2. The polyolefins are essentially derivatives of polethylene and are chemically equivalent to alternatethylene–propylene and ethylene–butene copolymers. Inpaper we refer to the poly~methylbutylene! chains as PMBand the poly~ethylbutylene! chains as PEB, where the letteM and E refer to the methyl and ethyl branches emanatfrom the C–C backbone. The chemical structures ofpolymer chains used in this study are shown below.
–@CH2–CH–CH2–CH2#–uCH3
poly~methylbutylene! ~PMB!
–@CH2–CH–CH2–CH2#–u
CH2–CH3
poly~ethylbutylene! ~PEB!
The characteristics of the polymers were determineding the procedures described in Ref. 33 and are listedTable I. Polymers are named on the basis of compositThe prefix h refers to the hydrogenated polymers and tprefix d refers to partially deuterated polymers. Using meods discussed in Refs. 33 and 40, it was determined thaneutron scattering contrast between the blocksdPMB–dPEB is negligible. The neutron scattering leng
e or copyright; see http://jcp.aip.org/about/rights_and_permissions

6084 J. Chem. Phys., Vol. 111, No. 13, 1 October 1999 Lefebvre et al.
Downloaded 01 Mar 2011
TABLE I. Characteristics of polymers.
PolymerDensity~g/cm3!
No. ofdeuterium
per sixcarbonatoms
Molecularweight~g/mol!
Polydispersityindex
Volumefraction of
PEB inblock
copolymer
Neutronscattering
lengthdensity~Å22!
hPMB 0.8540 ¯ 1.73105 1.07 ¯ 23.0431027
dPMB 0.9300 7.33 1.83105 1.07 ¯ 4.3731026
hPEB 0.8628 ¯ 2.23105 1.08 ¯ 23.0731027
dPEB 0.9272 6.15 2.43105 1.08 ¯ 3.6531026
hPMB–hPEB 0.8562 ¯ 2.03105 1.10 0.33 23.0631027
dPMB–dPEB 0.9048 4.68 2.13105 1.10 0.33 2.6931026
oinibodrhds,
b
teh
sucotee
enrio
stwp
xe
s
ring
tion,
re
r
m-y ansuremple
een
ut 1hton
ndAlle
,
ig.
in-is
om-P35
w-in-
a-
density of each component was calculated using the methdescribed in Ref. 33 and is listed in Table I. The scattercontrast between the hydrogeneous components is neglig
The experiments were performed on ternary blendsPMB, PEB, and PMB–PEB mixtures. The blends were maby dissolving the components in cyclohexane and then ding to a constant weight in a vacuum oven at 70 °C. Tcomposition of the blends discussed in this paper are listeTable II. The ratio of homopolymer volume fractionfPEB/fPMB, was 0.34 in all of the blends (f i is the volumefraction of species i in the mixture, i5PEB, PMB, or PMB–PEB!. The composition of each blend is thus determinedthe volume fraction of the block copolymer, i.e.,fPMB–PEB.The blends are labeled Tx or Px where the letter T indicathat the blend was subjected to temperature quenches, wthe letter P indicates that the blend was subjected to presquenches and x/100 is the volume fraction of the blockpolymer in the blend. For example, the name T20, indicathat this blend was used in the temperature quench expments andfPMB–PEB50.2. All of the blends contained ondeuterated species. Since the scattering contrast betweedrogeneous components is negligible, the neutron scatteprofiles are related to intramolecular and intermolecular crelations of the labeled species.
B. Small-angle neutron scattering
Small-angle neutron scattering~SANS! experimentswere conducted on the NG3 beamline at the National Intute of Standards and Technology in Gaithersburg, MD. Ttypes of SANS experiments were performed on each samFirst, the limits of stability and metastability~the phase dia-gram! for each blend were estimated from static SANS eperiments. Then time-resolved SANS measurements wtaken to follow the kinetics of phase separation. The serie
TABLE II. Blend compositions.
Sample Blend components fPMB–PEB fPMB fPEB
fPEB/fPMB
T20 hPMB–hPEB/hPMB/dPEB 0.204 0.594 0.202 0.340T40 hPMB–hPEB/hPMB/dPEB 0.399 0.449 0.152 0.339T50 hPMB–hPEB/hPMB/dPEB 0.501 0.373 0.126 0.338T40D dPMB–dPEB/hPMB/hPEB 0.407 0.444 0.149 0.336T508 hPMB–hPEB/hPMB/dPEB 0.499 0.375 0.125 0.333P35 hPMB–hPEB/dPMB/hPEB 0.354 0.484 0.163 0.337
to 129.6.123.112. Redistribution subject to AIP licens
dsgle.fey-ein
y
silere-sri-
hy-ngr-
i-ole.
-reof
experiments reported in this paper were conducted dufive separate sessions, each lasting three to four days.
The phase diagram was determined using configuraA: neutron wavelength,l56.0 Å, wavelength spreadDl/l50.15, sample-to-detector distance511 m, sampleaperture50.635 cm, source-to-sample distance510.12 m,and source size55.0 cm. The phase separation kinetics wefollowed using configuration B: neutron wavelength,l514 Å, wavelength spread,Dl/l50.15, sample-to-detectodistance513.18 m, sample aperature50.635 cm, source-to-sample distance514.77 m, and source size55.0 cm. Con-figuration B allowed access to scattering vectors,q, as low as0.02 nm21 @q54p sin(u/2)/l, u is the scattering angle#.
The temperature quenches were conducted on 1-mthick samples held between quartz windows separated baluminum spacer. The apparatus used for the presquenches on sample P35 is described in Ref. 37. The sawas held in a thermostated steel pressure chamber betwtwo sapphire windows separated by a 1.5 mm o ring.~Afterassembly the o ring is squeezed to a thickness of abomm.! The o ring was surrounded by silicone oil, whicserved as the pressurizing fluid. A computer-driven pisassembly was used to control the sample pressure.
The scattering data were collected using a 1283128pixel two-dimensional detector, corrected for backgrouscattering, empty cell scattering, and detector sensitivity.of the scattering profiles were azimuthally symmetric. Wthus report the azimuthally averaged scattering intensityI,as a function ofq.
III. RESULTS AND DISCUSSION
A. Determination of phase diagrams
Typical static small-angle neutron scattering~SANS!profiles obtained from the T-series blends are shown in F2~a!, where we show the intensity,I, vs q obtained from theT20 blend as a function of temperature. A substantialcrease in the low-q scattering is evident as the temperaturedecreased. Qualitatively similar results were obtained frthe T40 and T50 blends. In Fig. 2~b!, we show the temperature dependence of the scattering data obtained from theblend at 0.01 kbar. Again, we see an increase in the loqscattering with decreasing temperature. The observedcrease in the low-q scattering in Figs. 2~a! and 2~b! is aqualitative indication of an upper critical solution temper
e or copyright; see http://jcp.aip.org/about/rights_and_permissions

ina
oap
ffectits a
withEB
ta.20
eent
the
t
e the
6085J. Chem. Phys., Vol. 111, No. 13, 1 October 1999 Initial stages of nucleation in blends
Down
ture ~UCST!, i.e., the blends are single phase above the bodal temperature,Tb . The effect of increasing the pressurea constant temperature is shown in Fig. 2~c!, where we showI (q) obtained from the P35 blend at pressures ranging fr0.01 to 1.03 kbar, at a fixed temperature of 54 °C. It is
FIG. 2. Theq dependence of the static SANS intensity,I, from ~a! blendT20, and~b! blend P35, at selected temperatures.~c! The q dependence ofthe static SANS intensity,I, from blend P35, at selected pressures, and aconstant temperature of 54 °C.
loaded 01 Mar 2011 to 129.6.123.112. Redistribution subject to AIP licens
-t
m-
parent that increasing pressure has the same qualitative eas decreasing temperature. The blend P35 thus exhiblower critical solution pressure~LCSP!, i.e., this blend issingle phase below a certain critical pressure,Pb . Thetrends with temperature and pressure are consistentprevious thermodynamic studies on PMB/PEB/PMB–Pblends;31–34,45see Fig. 1.
In Fig. 3~a!, we show the low-q scattering data from theblend T20 atT>126 °C in the Zimm format, 1/I vs q2. Thelines in Fig. 3~a! represent least-squares fits through the daIt is apparent that the scattering profiles from the blend Tat T>126 °C are consistent with the Zimm equation~stan-dard deviation at 126 °C52.031025). This is typical ofsingle-phase blends.46 In Fig. 3~b!, we show the low-q scat-tering data from the same blend~T20! at T,126 °C in theZimm format. The dashed lines in Fig. 3~b! represent least-squares fits through the data. Systematic deviations betwthe Zimm equation and the data can clearly be seen aT,126 °C ~standard deviation at 121 °C53.431025) as isnormally found for phase separated blends.46
The scattering intensity asq→0(I 0) can be estimated byextrapolating the straight lines in Figs. 3~a! and 3~b!. Forconsistency, the data in the range of 0.003<q2
<0.016 nm22 was used at all temperatures, regardless of
a
FIG. 3. The inverse of the scattered intensity, 1/I , vs q2 at various tempera-tures,~a! above the estimated binodal temperature, and~b! below the esti-mated binodal temperature for blend T20. The solid and dashed lines arleast-squares fits through the data.
e or copyright; see http://jcp.aip.org/about/rights_and_permissions

ee
teee
nece
ac
ich
wa
ree
a-
3et-
y
ten
hilory
asion0as
20,
f the
d byand-ticsnd
ehil
es fitsast-
tchedepara-itedibited
6086 J. Chem. Phys., Vol. 111, No. 13, 1 October 1999 Lefebvre et al.
Down
goodness of the fit. The extrapolated value of 1/I 0 is negativeat T,116 °C @e.g., see the 97 °C data in Fig. 3~b!#. Ofcourse, the true value ofI 0 must be positive. The negativ~extrapolated! values ofI 0 are due to the presence of largphase separated domains that scatter atq values lower thanthe low-q limit of our instrument in configuration A.
In Fig. 4, we plot 1/I 0 versus the reciprocal of absolutemperature (1/T). One expects a linear dependence betw1/I 0 and 1/T in the single-phase region.47 In contrast, we seea clear break in the 1/I 0 vs 1/T plot of the blend T20~Fig. 4!.Two linear regimes, represented by dashed and solid liare evident. The two lines were obtained by a fitting produre wherein the data were divided into two groups~low Tand highT! and a least-squares line was drawn through eof the sets. The point of division between the lowT and highT regimes was varied systematically. The pair of lines, whminimized the sum of the square of the residuals, were csen to describe the data. The binodal temperature (Tb) isassumed to be the median temperature between the lotemperature of the highT data set and the highest temperture of the lowT data set. For the blend T20, we obtainTb
512363 °C. The stability limit, i.e., spinodal temperatu(Ts), for T20 is obtained by extrapolating the straight linobtained in the single-phase regime~the solid line in Fig. 4!to the point where 1/I 050. As a result, the spinodal temperture is estimated at 93615 °C for the blend T20.
The static SANS data from the blends T40, T50, and Pwere analyzed by the same procedure as described abovT20. The reportedTb values were obtained by the two leassquares lines approach and theTs values were obtained bextrapolating the highT branch of the 1/I 0 vs 1/T plot. In thecase of P35, the procedure for obtainingTb andTs was re-peated at elevated pressures. In all of the samples, atperatures aboveTb , the scattering profiles were independeof thermal history. However, at temperatures belowTb , wefound that the scattering profiles did depend on thermaltory. This is expected, because the two-phase morphoobtained in a given blend will depend on thermal histo
FIG. 4. The extrapolated inverse scattered intensity atq50, 1/I 0 , vs 1/T forsample T20. The lines are determined by the least-squares procedurscribed in the text. The median between the lowest temperature of theT set and the highest temperature of the lowT set determines the binodatemperature indicated byTb . Extrapolation of the solid line to 1/I 050determines the spinodal temperature,Ts .
loaded 01 Mar 2011 to 129.6.123.112. Redistribution subject to AIP licens
n
s,-
h
ho-
est-
5for
m-t
s-gy.
The data in Fig. 4 were obtained while sample T20 wheated from room temperature to 155 °C. The differentiatbetween the highT and lowT regimes was sharper for T4than that shown in Fig. 4, while for T50 and P35 it wweaker.
The binodal and spinodal temperatures of blends TT40, and T50 are summarized in Fig. 5~a!, where we show aphase diagram forhPMB/dPEB/hPMB–hPEB blends withfPEB/fPMB50.34 in theT2fhPMB–hPEB plane. The pressuredependence of the binodal and spinodal temperatures oblend P35 is shown in Fig. 5~b!. In Figs. 5~a! and 5~b!, thebinodal and the spinodal temperatures are representesolid and dashed lines, respectively. The diamondshatched squares in Figs. 5~a! and 5~b! represent the temperatures and pressures at which the phase transition kinewere examined. The distinction between diamonds ahatched squares will be explained below.
Determining the equilibrium properties~binodal and
de-gh
FIG. 5. ~a! The phase diagram forhPMB/dPEB/hPMB–hPEB polymerblends~T20, T40, T50! at atmospheric pressure.~b! The phase diagram forblend P35 at elevated pressures. The solid lines represent least-squarthrough the binodal data points while the dashed lines represent lesquares fits through the spinodal data points. The diamonds and hasquares indicate the temperatures and pressures at which the phase stion kinetics were studied. The diamonds indicate systems that exhibnucleation and growth. The hatched squares indicate systems that exhspinodal decomposition.
e or copyright; see http://jcp.aip.org/about/rights_and_permissions

to-
teb
te
era
thser
emto
tdi
edth
ae.0ed2esimthd.sttrothhed
el
ne
waW
ed.0ft
th
eimpas
tesase9 tohe.69
De-
ethanty istelylu-ra-se it
hench
m
6087J. Chem. Phys., Vol. 111, No. 13, 1 October 1999 Initial stages of nucleation in blends
Down
spinodal points! of our blends is not straightforward dueslow kinetics. In blends of lower molecular weight compounds, the binodal curve can simply be located by demining the temperature and pressure at which the blendscome cloudy~the ‘‘cloud point’’!. Most of our blends do nobecome cloudy even after they have been at atmosphconditions for several years. All of the blends studied hare deep in the two-phase region at room temperaturepressure. It is evident that slow kinetics, the very featureenables kinetic measurements during the early stagenucleation, hinders the determination of equilibrium propties.
The T-series samples were annealed at 250 °C~deep inthe single-phase region! for a minimum of 4 h in a vacuumoven. The samples were then rapidly transferred to a tperature controlled sample stage in the neutron beam. Itapproximately 3 min to transfer the sample from the oventhe sample stage. The SANS data acquisition was startesoon as the sample was placed in the sample stage. Tzero (t50) is defined as the time at which the time-resolvSANS measurements began. The time required forsample temperature to reach quench temperature~within1 °C! was estimated to be about 5 min. The P35 blend wfirst annealed at 0.01 kbar at 78 °C~deep in the single-phasregion! in the pressure cell, and then cooled to 42 °C at 0kbar. All of the kinetics experiments, in which increaspressure induced phase separation, were conducted at 4After equilibration at 42 °C and 0.01 kbar, the sample prsure controller was set to the experimental pressure. Tzero (t50) for the pressure quenches is defined to betime at which the pressure controller setting was change
In the pressure quench experiments, the annealingwas conducted in the pressure cell while it was in the neubeam. We were thus able to obtain data just beforequench (t502) in the single phase region and just after tquench (t53 min). In addition, the sample could be cyclebetween the different regions of the phase diagram with rtive ease, as we show below.
B. Reversibility of phase separation
We now discuss the time-resolved SANS data obtaiin configuration B. In Fig. 6~a!, we show SANS profilesobtained from the sample P35 at 42 °C, after the blendsubjected to a pressure quench from 0.01 to 0.69 kbar.see a significant increase in the scattering intensity duphase separation. We let the phase separation proceeover 103 min, and then we depressurized the sample to 0kbar. The time dependence of the scattering profiles adepressurization are shown in Fig. 6~b!. Time zero, for thedepressurization data set in Fig. 6~b!, is defined to be thetime when the pressure controller setting was changed0.01 kbar. The scattering intensity at all accessibleq valuesdecreases with increasing time, indicating dissolution ofphase separated structure.
The phase diagram for P35 in Fig. 5~b! indicates that atT542 °C andP50.01 kbar, the sample is near the bordbetween the single-phase regime and the two-phase regwhile at T542 °C and P50.69 kbar, the sample is deewithin the two-phase region. These assignments were b
loaded 01 Mar 2011 to 129.6.123.112. Redistribution subject to AIP licens
r-e-
ricendatof-
-okoas
me
e
s
1
°C.-ee
epne
a-
d
se
tofor1
er
to
e
re,
ed
on static SANS data. The time-resolved data in Figs. 6~a!and 6~b! confirm these results. In particular, they indicaclearly that atT542 °C andP50.01 kbar, the sample P35 iin the single-phase regime. If we had not crossed a phboundary when the sample was depressurized from 0.60.01 kbar, then there would not be a driving force for tdissolution of the two-phase morphology obtained at 0kbar. The data in Figs. 6~a! and 6~b! also indicate that it isrelatively easy to reverse phase separation in our blends.spite the fact that atP50.69 kbar, P35 is well within the twophase boundary, and atP50.01 kbar, P35 is close to thphase boundary, the dissolution kinetics are much fasterthe phase separation kinetics. The reason for this disparinot clear. The two-phase structure that took approxima103 min to develop was well on its way to complete dissotion after only 150 min. The ease with which phase sepation can be reversed in these systems was crucial, becauenabled repeated measurements on the same sample.
C. Quenches into the spinodal region
Typical SANS profiles obtained after quenches into tspinodal region are shown in Fig. 7. The results for a queto 63 °C for the T20 sample are shown in Fig. 7~a!. A scat-
FIG. 6. Time dependence of the SANS profiles from blend P35.~a! Pressurequench from 0.01 to 0.69 kbar, and~b! is the reverse pressure quench fro0.69 to 0.01 kbar.
e or copyright; see http://jcp.aip.org/about/rights_and_permissions

-gio0
noin
,T
t
poe-arthis
or
o-
Eq.
hendsary
po-Bereeain
om-o the
the
ringckted
heofl-orbe-
ures
r allly.
rom
pi
atahn–
6088 J. Chem. Phys., Vol. 111, No. 13, 1 October 1999 Lefebvre et al.
Down
tering peak develops during the early stages atq50.028 nm21. At times, t.16 min, the location of the scattering peak inq space,qm , decreases with time, indicatinthe start of the intermediate stage of spinodal decompositThe early stage of spinodal decomposition in sample T263 °C is completed relatively rapidly~16 min! due, mainly,to the large depth of the quench@see Fig. 5~a!#. In Fig. 7~b!,we show the scattering profiles obtained from the T40 bleat 25 °C at selected temperatures. The early stage of spindecomposition during this experiment lasted for 83 mwherein a time-independentqm is observed. At later timesqm decreases with time, as was the case for sampleshown in Fig. 7~a!.
The data obtained from quenches represented byhatched squares in Figs. 5~a! and 5~b! @e.g., P35 at 0.69kbar—Fig. 6~a!, T20 at 63 °C—Fig. 7~a!, and T40 at 25 °C—Fig. 7~b!# exhibited classic signatures of spinodal decomsition. The data obtained during the early stages of thquenches~beforeqm decreased with time! were analyzed using the Cahn–Hilliard–Cook theory. In some cases, the estage of spinodal decomposition was too rapid and thusCahn–Hilliard–Cook analysis could not be applied. In ththeory,2,48 the time dependence of the structure fact
FIG. 7. SANS intensity vs scattering vector at selected times during sodal decomposition.~a! Sample T20 at 63 °C, and~b! sample T40 at 25 °C.
loaded 01 Mar 2011 to 129.6.123.112. Redistribution subject to AIP licens
n.at
ddal
20
he
-se
lye
,
S(q,t), which is proportional to the scattered intensity prfile, I (q,t), is given by
I ~q,t !}S~q,t !5Sx~q!1@S~q,0!2Sx~q!#exp@Lq2t#, ~2!
whereSx(q) is the virtual structure factor, andL is the On-sager coefficient. Typical least-squares fits of the data to~2! are given in Fig. 8, where the time dependence ofI atselectedq values from P35 at 1.03 kbar are shown. Tsignatures of spinodal decomposition observed in the bleT20, T40, and P35 were identical to those observed in binpolymer blends.8 In a previous publication,17 we analyzedtime-resolved SANS data obtained in the spinodal decomsition region from a different set of PMB/PEB/PMB–PEbends. The data obtained from the present set of blends wqualitatively similar to the previously published data. Wtherefore do not discuss these data in any detail. The mpurpose of presenting the data in Figs. 7 and 8 was to cpare these data with the data obtained after quenches intnucleation regime. These quenches are represented byclosed diamonds in Figs. 5~a! and 5~b!.
D. Role of the block copolymer
Before discussing the time-resolved data obtained dunucleation, it is important to establish the role of the blocopolymer in our multicomponent blends. In phase-separamixtures of two homopolymers and a block copolymer, tblock copolymer can exhibit three different typesbehavior.49,50 It could ~1! serve as a polymeric common sovent that is uniformly distributed throughout the sample,~2! serve as a surfactant and segregate to the interfacetween coexisting homopolymer-rich phases, or~3! form aseparate, copolymer-rich phase. In most studies on mixtof two homopolymers and a block copolymer,51 the blockcopolymers serve as surfactants. However, evidence fothree types of behavior have been obtained experimental52
For symmetric blends of two homopolymers,A and B (fA
5fB) with xNA'xNB'2, and a symmetricA–B diblockcopolymer it has been demonstrated that the transition f
n-
FIG. 8. Analysis of the spinodal decomposition data for the P35 blend1.03 kbar. The solid curves are least-squares fits of the data to the CHilliard–Cook theory at q50.023 nm21 ~the open circles! and at q50.033 nm21 ~the open squares!.
e or copyright; see http://jcp.aip.org/about/rights_and_permissions

s
-es
epn
inibns
hte
er
dtiola
tedthentheBn
asitc
the
earth
de
rgilati
b-ll
erin
ed11,useionS
by
the
the
at-
d
heq.
--
by
setthe
t 15in ale–
pi-m-
nchepa-
end
ni-et:
at
m
6089J. Chem. Phys., Vol. 111, No. 13, 1 October 1999 Initial stages of nucleation in blends
Down
common solvent-to-surfactant behavior occurs whenxNA–B
is about 12.38,40–42,50,52In the PMB/PEB/PMB–PEB blendstudied in this paper,xNPMB–PEB is in the vicinity of 4. Thisis well below the threshold for interfacial activity of the copolymer. Similarly, the formation of copolymer-rich phasoccurs atxNA–B values significantly greater than 4.49 Wethus expect the PMB–PEB block copolymer to behave likpolymeric common solvent. In this scenario, the phase seration results in PMB-rich and PEB-rich macrophases, athe PMB–PEB block copolymer is uniformly distributedboth phases. If we assume that the blend is incompressthen the spatial variation of homopolymer concentratiofPMB(r ) andfPEB(r ) must satisfy the relationshipfPMB(r )1fPEB(r )5constant. In the past,17 we have referred to sucblends as pseudobinary blends because they are expecbehave like binary blends of simple liquids@wherefPMB(r )1fPEB(r )51].
In order to study the distribution of the block copolymchains, we prepared a sample that we call T40D~see TableII !, which is identical to T40 in most respects. Both blencontain 40 vol % PMB–PEB block copolymer and the rafPEB/fPMB is 0.34. Both blends contain one deuteriumbeled species. In the blend T40, the labeled species isPEB homopolymer, while in the blend T40D, the labelspecies is the PMB–PEB block copolymer. We expectqualitative behaviors of samples T40 and T40D to be idtical. Based on previous studies,17,34 we can assert thaswitching deuterium labels from one component to anothas little effect on the thermodynamics of these PMB/PEPMB–PEB blends with 40 vol % block copolymer. Givethat blend T40 at 44 °C is located deep in the two-phregion@Fig. 5~a!#, we expect the sample T40D to also exhibphase separation at 44 °C. However, since there is no stering contrast between thehPMB andhPEB homopolymersin the T40D blend~see Table I!, changes in the distributionof these two components will not result in an increase inscattering intensity. The scattering from T40D will evolvwith time only if the distribution ofdPMB–dPEB chains inthe sample changes with time.
In Fig. 9, we show the SANS profiles from T40D atT544 °C at selected times. The scattered intensity is relativweak and independent of time for 1000 min. This is in shcontrast to sample T40 wherein a 400-fold increase inscattering intensity was observed in 109 min~Fig. 9 inset!.The time independence of the scattering data in Fig. 9 incates this blend exhibits pseudobinary behavior. Theseperiments confirm conclusions based on theoretical aments that were presented earlier in this section. Simresults were reported in a previous study of phase separain PMB/PEB/PMB–PEB mixtures.17 Based on the data inFig. 9, previous experimental results,36,38–42and theory49,50
we conclude that the block copolymer is uniformly distriuted during all stages of the phase separation process in athe blends examined in this paper.
The main objective of this paper is to study the clusting of homopolymer chains during nucleation. We do thisthe remainder of this paper.
loaded 01 Mar 2011 to 129.6.123.112. Redistribution subject to AIP licens
aa-d
le,,
d to
s
-he
e-
r/
e
at-
e
lype
i-x-u-r
on
of
-
E. Three stages of nucleation
The time dependence of the SANS profiles obtainfrom samples T40, T50, and P35 are shown in Figs. 10,and 12, respectively. We have left out sample T20, becaall of the quenches were located deep in the spinodal reg@Fig. 5~a!#. The differences between the time-resolved SANdata obtained during spinodal decomposition~discussedabove!, and those obtained during nucleation can be seencomparing data obtained from P35 at 1.03 kbar@Fig. 12~a!#and at 0.34 kbar@Fig. 12~c!#. An obvious difference betweenthe two sets of data is the presence of a scattering peak inspinodal decomposition regime@Fig. 12~a!# at q5qmax
'0.03 nm21, and the absence of a scattering peak innucleation regime@Fig. 12~c!#.
In Fig. 13~a!, we show the time dependence of the sctered intensity from P35 at a fixedq50.021 nm21 duringspinodal decomposition (P51.03 kbar). The data obtaineduring the early stage (t<266 min), designated by ‘‘E,’’ arein agreement with the Cahn–Hilliard–Cook theory. Tsolid curve in Fig. 13~a! represents a least-squares fit of E~2! through the data obtained att<266 min. Systematic deviations between theI (t) and the Cahn–Hilliard–Cook predictions are evident in the intermediate stage, designated‘‘ I’’ in Fig. 13~a!. The inset in Fig. 13~a! shows the pressurereading from the transducer closest to the sample after thepoint on the pressure controller is changed. Changingsample pressure from 0.01 to 1.03 kbar requires aboumin. A sudden change in the sample pressure will resultchange in the sample temperature due to the JouThompson effect. Migler and Han have shown that for tycal polymer samples with 1 mm thickness, the sample teperature returns to the set temperature within 10 s.53 Thetime scale required to enforce an isothermal pressure queis thus considerably less than the time scale for phase s
FIG. 9. SANS intensity vs scattering vector at selected times from blT40D at 44 °C. Solid diamonds:t53 min; open circles:t5225 min; opensquares:t5439 min; open triangles:t51193 min. The lack of change in thescattering intensity from T40D indicates that the block copolymer is uformly distributed in the coexisting PEB- and PMB-rich phases. InsSANS intensity vs scattering vector at selected times from blend T4044 °C. Circles: t54 min; upside down triangles:t548 min; squares:t569 min; plus signs: t580 min; diamonds: t590 min; crosses: t599 min; triangles:t5109 min. The change in scattering intensity froT40 indicates the formation of PEB- and PMB-rich phases.
e or copyright; see http://jcp.aip.org/about/rights_and_permissions
n,
6090 J. Chem. Phys., Vol. 111, No. 13, 1 October 1999 Lefebvre et al.
Down
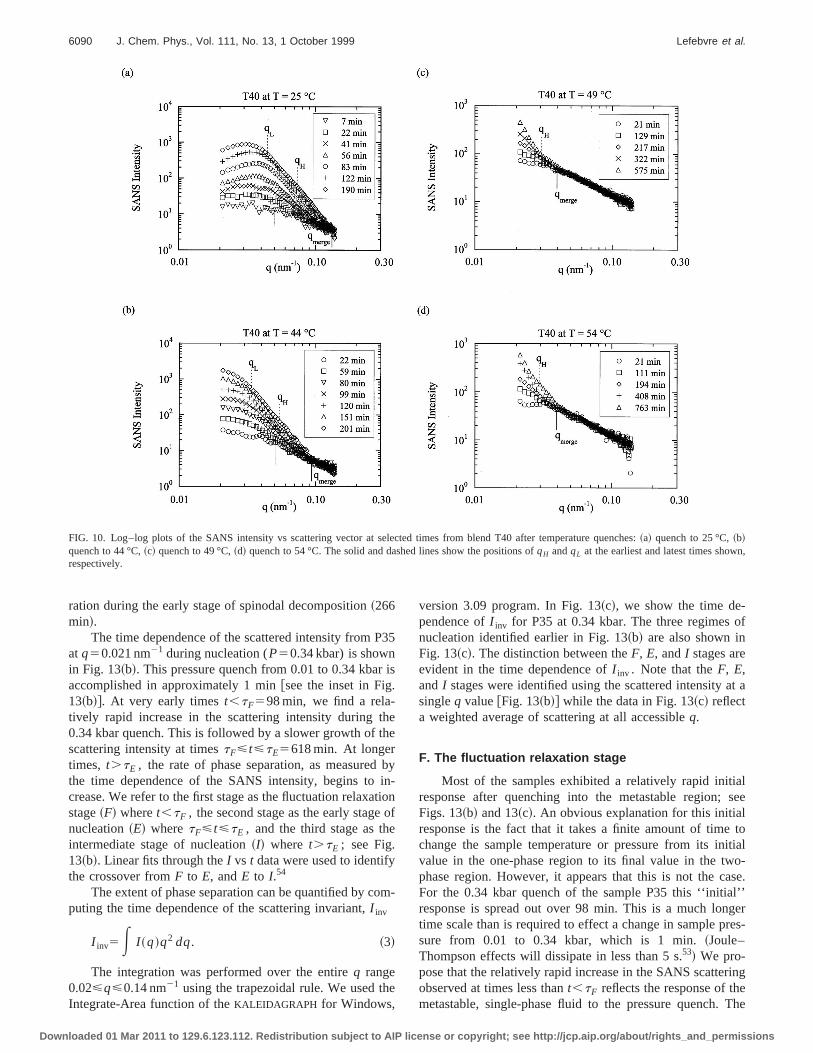
FIG. 10. Log–log plots of the SANS intensity vs scattering vector at selected times from blend T40 after temperature quenches:~a! quench to 25 °C,~b!quench to 44 °C,~c! quench to 49 °C,~d! quench to 54 °C. The solid and dashed lines show the positions ofqH andqL at the earliest and latest times showrespectively.
P3
i.
hehe
bintio
e
om
e
of
at a
alsee
lto
itialo-
ase.l’’gerres-
ringeThe
ration during the early stage of spinodal decomposition~266min!.
The time dependence of the scattered intensity fromat q50.021 nm21 during nucleation (P50.34 kbar) is shownin Fig. 13~b!. This pressure quench from 0.01 to 0.34 kbaraccomplished in approximately 1 min@see the inset in Fig13~b!#. At very early timest,tF598 min, we find a rela-tively rapid increase in the scattering intensity during t0.34 kbar quench. This is followed by a slower growth of tscattering intensity at timestF<t<tE5618 min. At longertimes, t.tE , the rate of phase separation, as measuredthe time dependence of the SANS intensity, begins tocrease. We refer to the first stage as the fluctuation relaxastage~F! wheret,tF , the second stage as the early stagenucleation~E! wheretF<t<tE , and the third stage as thintermediate stage of nucleation~I! where t.tE ; see Fig.13~b!. Linear fits through theI vs t data were used to identifythe crossover fromF to E, andE to I.54
The extent of phase separation can be quantified by cputing the time dependence of the scattering invariant,I inv
I inv5E I ~q!q2 dq. ~3!
The integration was performed over the entireq range0.02<q<0.14 nm21 using the trapezoidal rule. We used thIntegrate-Area function of theKALEIDAGRAPH for Windows,
loaded 01 Mar 2011 to 129.6.123.112. Redistribution subject to AIP licens
5
s
y-
onf
-
version 3.09 program. In Fig. 13~c!, we show the time de-pendence ofI inv for P35 at 0.34 kbar. The three regimesnucleation identified earlier in Fig. 13~b! are also shown inFig. 13~c!. The distinction between theF, E, andI stages areevident in the time dependence ofI inv . Note that theF, E,and I stages were identified using the scattered intensitysingleq value@Fig. 13~b!# while the data in Fig. 13~c! reflecta weighted average of scattering at all accessibleq.
F. The fluctuation relaxation stage
Most of the samples exhibited a relatively rapid initiresponse after quenching into the metastable region;Figs. 13~b! and 13~c!. An obvious explanation for this initiaresponse is the fact that it takes a finite amount of timechange the sample temperature or pressure from its invalue in the one-phase region to its final value in the twphase region. However, it appears that this is not the cFor the 0.34 kbar quench of the sample P35 this ‘‘initiaresponse is spread out over 98 min. This is a much lontime scale than is required to effect a change in sample psure from 0.01 to 0.34 kbar, which is 1 min.~Joule–Thompson effects will dissipate in less than 5 s.53! We pro-pose that the relatively rapid increase in the SANS scatteobserved at times less thant,tF reflects the response of thmetastable, single-phase fluid to the pressure quench.
e or copyright; see http://jcp.aip.org/about/rights_and_permissions

iu
th
firr
ot
er-
se
esn,
se-
eds
6091J. Chem. Phys., Vol. 111, No. 13, 1 October 1999 Initial stages of nucleation in blends
Down
response of polymer blends quenched from one equilibrstate to another was studied by Fenget al.55 We believe thatthe initial response of our polymer blends is analogous toprocess studied by Fenget al., except for the fact that thefinal state in our case is metastable. We thus refer to theprocess in our nucleation experiments as the fluctuation
FIG. 11. Log–log plots of the SANS intensity vs scattering vector atlected times from blend T50 after temperature quenches:~a! quench to25 °C, ~b! quench to 34 °C,~c! quench to 44 °C. The solid and dashed linshow the positions ofqH andqL at the earliest and the latest times, showrespectively.
loaded 01 Mar 2011 to 129.6.123.112. Redistribution subject to AIP licens
m
e
ste-
laxation process~F!. The fluctuation relaxation process is nobserved during spinodal [email protected]., P35 during1.03 kbar quench—Fig. 13~a!#. Similar results were obtainedin other studies of spinodal decomposition in polymblends, e.g., Refs. 7–9. We settF50 in the spinodal decomposition regime.
-FIG. 12. Log–log plots of the SANS intensity vs scattering vector atlected times from blend P35 after pressure quenches:~a! quench to 1.03kbar,~b! quench to 0.69 kbar,~c! quench to 0.34 kbar. The solid and dashlines show the positions ofqH and qL at the earliest and the latest timeshown, respectively.
e or copyright; see http://jcp.aip.org/about/rights_and_permissions

thess is
nch
arlythe
lete
d to
willour
the
40dali-
seof
es
in-
a
ior
.to10
osi-e
e
enrl
erin
6092 J. Chem. Phys., Vol. 111, No. 13, 1 October 1999 Lefebvre et al.
Down
FIG. 13. Characteristics of the different stages of phase separation.F de-notes the fluctuation relaxation stage,E denotes the early stage, andI de-notes the intermediate stage.tF is the end of the fluctuation relaxation stag~F!, andtE is the end of the early stage of nucleation~E!. ~a!, ~b! The SANSintensity vs time atq50.021 nm21 for the P35 blend after pressurquenches.~a! Quench to 1.03 kbar. The solid line represents the CahHilliard–Cook fit to the data. The vertical line indicates the end of the eastage for spinodal decomposition~E!. ~b! Quench to 0.34 kbar.~c! The timedependence of the scattering invariant,I inv during the 0.34 kbar quench. Thinset in~a! and~b! show the time dependence of the sample pressure duthese quenches.
loaded 01 Mar 2011 to 129.6.123.112. Redistribution subject to AIP licens
The fluctuation relaxation process is observed innucleation regime, because the phase separation procerelatively slow. We conclude that, regardless of the quetype ~temperature quench versus pressure quench!, the rapidincrease in the scattering intensity observed in the very estages of the quenches to the nucleation regime is due tofluctuation relaxation process. The time required to compthe fluctuation relaxation process,tF , in each of thequenches to the metastable region, and the times requirecomplete the early stage of nucleation,tE , are given inTable III. We find that in most casestF andtE increase withdecreasing quench depth. In general, these time scalesdepend on thermodynamic and viscoelastic factors. Inlimited experimental window,tF andtE are dictated by ther-modynamic factors. Since we are primarily interested innucleation process, we do not discuss the data att,tF in theremainder of the paper.
G. The early and intermediate stages of nucleation
Let us go back to the data obtained from sample T~Fig. 10!. The presence of a scattering peak during spinodecomposition@Fig. 10~a!# indicates the presence of a perodic structure. The lack of a scattering peak@Figs. 10~b!–10~d!# during nucleation indicates that the emerging phaseparated structure is characterized by a distributionlength scales. Examination of Figs. 10~a!–10~d! shows thatfor each quench, the scattering profiles at different timmerge at a point that we depict by the symbolqmerge. TheSANS intensity is independent of time in the rangeq.qmerge. We begin by studying the SANS profiles atq,qmerge. For sample T40 at 44 °C@Fig. 10~b!#, at t5201 min, the scattered intensity decreases sharply withcreasingq in the range 0.033 nm21,q,0.055 nm21. The qdependence ofI in this region can be approximated bypower lawI;q2d. We defineqL andqH to be the lower andupper bounds, respectively, over which power law behavis observed.56
A crossover in theq dependence ofI is evident atq'qL @qL50.033 nm21 in T40 at 44 °C at 201 min; see Fig10~b!#. In the range,q,qL , the scattered intensity appearsapproach aq-independent plateau. The solid lines in Fig.indicate the position ofqL andqH at tF , which is the earliesttime shown in the figures. The dashed lines show the ptions ofqL andqH at the last time shown in the figures. Th
–y
g
TABLE III. Start and end times (tF and tE , respectively! for the earlystage of nucleation and growth.
Quenchtemperatureor pressure
P35 T40 T50
tF ~min! tE ~min! tF ~min! tE ~min! tF ~min! tE ~min!
25 °C 19.5 14934 °C 43 28044 °C 22 42 56 18149 °C 21 7654 °C 21 111
0.34 kbar 98 618
e or copyright; see http://jcp.aip.org/about/rights_and_permissions

adulc-
m4
es
bl
rol
gi-wmheeethrr
aaigth
te
ar
og
tein35obensplmh
er
e
tent
ingla-
at--
ageon-
-b-
ep
of-
the
6093J. Chem. Phys., Vol. 111, No. 13, 1 October 1999 Initial stages of nucleation in blends
Down
crossover from power law behavior to an apparent plateq,qL @Fig. 10~b!# is typical of scattering from disorderesystems such as polymer blends and solutions and particsuspensions.4 This crossover is an indication of the charateristic length scale of the structure,j(j'1/qL) and it rep-resents the approach toward Zimm scattering in theqj!1limit. The characteristics of the SANS data obtained frosamples T50 and P35 were similar to that of sample T~compare Fig. 10 with Figs. 11 and 12!. The characteristicscattering vectors,qmerge, qL , andqH in these samples werobtained using procedures that were identical to those uin the analysis of the T40 data.
A detailed analysis of the scattering profiles is possiin the case of quenches into the binodal region whereqL wasidentified~T40 at 44 °C, T50 at 25 °C, and P35 at 0.34 kba!.A number of simple models have been used to describe pmer mixtures.4 The Ornstein–Zernike~OZ! equation is oftenused to analyze scattering profiles in the single-phase rewhile the Debye–Bueche~DB! equation is often used to analyze scattering profiles in the two-phase region. Sincehave a blend that is transforming from a one-phase systea two-phase system, it is not immediately obvious whetwe should use the OZ equation or the DB equation. In SIII F we established that the system is single phase at theof the fluctuation relaxation stage. We therefore expectOZ equation to be applicable, at least during the very eastages of nucleation. The OZ equation for the scattering pfile is given by
I ~q!5I 0
11q2j2 , ~4!
whereI 0 , the extrapolated intensity asq→0, is proportionalto the product of the scattering power and the average mof the scatterers. In Fig. 14~a!, we show data obtained aftertemperature quench in sample T40 to 44 °C, while in F14~b! we show data obtained after a pressure quench forsample P35 to 0.34 kbar. In both cases we restrict our attion to the early stage of nucleation (tF<t<tE) and to timeswhere a significant number of data points were obtainedthe q,qL range. The curves through the data in Fig. 14the least-squares fits to the OZ equation@Eq. ~4!# with I 0 andj as free parameters. It is evident that the data after btemperature and pressure quenches are in reasonable ament with the OZ equation.
The typical time dependence of the fitted OZ parame(I 0 and j! during the early stage of nucleation is shownFig. 15. We show data obtained from T40, T50, and PNote the wide variety of time scales and length scalestained during the early stages of nucleation in the differsamples. In the T40 sample at 44 °C, the early stage last20 min andj increases from 30 to 40 nm. In the P35 samat 0.34 kbar, the early stage lasts for 250 min in which tij increases from 50 to 150 nm. In Fig. 16, we show trelationship betweenj and I 0 for all of the data shown inFig. 15. ~The 25 °C quench on the T50 sample was pformed twice!. The time-dependent values ofI 0 and j ob-tained from the different quenches were normalized by thvalues at the beginning of the early stage (tF). It is apparent
loaded 01 Mar 2011 to 129.6.123.112. Redistribution subject to AIP licens
u,
ate
0
ed
e
y-
on
etor
c.nde
lyo-
ss
.e
n-
ine
three-
rs
.-t
foreee
-
ir
that all of the data collapse onto a master line, consiswith the following scaling law:
j~ t !
j~tF!5A I 0~ t !
I 0~tF!. ~5!
The observed increase in the scattering intensity, durthe early stage of nucleation, implies clustering of thebeled chains in the mixture. Thej;AI 0 scaling is indicativeof the nature of the clusters. In the mean-field limit, the sctering from concentration fluctuations in binary liquid mixtures~including polymer mixtures! obeys Eq.~5!. We there-fore conclude that the clusters formed during the early stof nucleation cannot be distinguished from mean-field ccentration fluctuations. The fact thatj and I 0 increase withtime ~Figs. 15 and 16! implies that the concentration fluctuations grow during the early stages of nucleation. The oserved scaling ofj on I 0 @Eq. ~5!# provides some justificationfor using the OZ equation.
The Ornstein–Zernike analysis was restricted to dequenches wherein bothqL andqH were within the accessibleq window. It is not possible to conduct the same analysisthe data in the cases whereqL could not be identified, spe
FIG. 14. SANS intensity vs scattering vector at selected times duringearly stage of nucleation.~a! Blend T40 at 44 °C.~b! Blend P35 at 0.34kbar. The solid curves are the Ornstein–Zernike@Eq. ~4!# fits through thedata.
e or copyright; see http://jcp.aip.org/about/rights_and_permissions

plyin
r
insb-
ofen-
a
otingub-t at, andn is
atedclear
arp
ated
ma-
ssuc-ua-fall
ethe
o-re-
e is
s,
°C.ares:e
6094 J. Chem. Phys., Vol. 111, No. 13, 1 October 1999 Lefebvre et al.
Down
cifically the shallower quench [email protected]., T40 at 49 and54 °C, see Figs. 10~c! and 10~d!#. All microstructures mustexhibit Zimm scattering in the limit ofqj→0. The fact thatwe do not observe this limit at low-quench depths simindicates that the characteristic length scale of the growstructures~j! is larger than the instrumental resolution.
Having established the origin of the scattering in theqrangeq,qL , we move on to theqL<q<qH regime whereIscales asq2d. This is sometimes called the intermediateqregime. The scattering profiles in this regime are relatedthe fractal dimension of the scatterers.4 Least-squares powe
FIG. 15. The dependence on time of the Ornstein–Zernike parameterI 0
~solid circles! andj ~open squares!. ~a! Blend T40 at 44 °C,~b! blend T50 at25 °C, and~c! blend P35 at 0.34 kbar.
loaded 01 Mar 2011 to 129.6.123.112. Redistribution subject to AIP licens
g
to
law fits were used to estimated as a function of time andquench depth for each sample. For the cases whereqL couldnot be identified, we fit all of theI vs q data atq<qH to apower law I;q2d, assuming thatqL lies behind the beamstop. Typical results of the fitting procedure are shownFig. 17~a! where we plotd versus time for the four quenche(t.tF) performed on T40. We have included the data otained at the largest quench depth~25 °C!, the open trianglesin Fig. 17~a!, where T40 exhibited standard signaturesspinodal decomposition. In all of the cases the time depdence ofd has a sigmoidal shape. At early times,d variesbetween 0.8 and 2. At later times,d increases, reachesmaximum value, and then decreases.
The value ofd obtained during the early times are nreliable due to the relatively weak scattering intensity durthis time. Incoherent scattering, which has not been stracted from the measured signal, is probably importanlarge scattering vectors. As phase separation proceedsthe scattering intensity increases, background subtractiono longer important, and reliable values ofd are obtained. Inall of the cases, the fractal dimension of the phase separstructure increases as phase separation proceeds. It isfrom Fig. 17~a! that ast→`, d will approach an asymptoticvalue between 3 and 4. In two phase systems with shinterfaces,I;q23, in the qj'1 regime ~Kratky regime!,and I;q24 in the qj@1 regime~the Porod regime!.4 ~Herej is the characteristic length scale of the phase separstructure.! Therefore, the increase ind from low initial val-ues to values between 3 and 4 is consistent with the fortion of a phase-separated structure. The fact thatd is lessthan 3 during a significant portion of the nucleation proceindicates that nucleation occurs via the formation of strtures that are not compact. Mean-field concentration flucttions, which we believe are responsible for nucleation,into this category.
The data in Fig. 17~a! suggests that increasing thquench depth in sample T40 simply results in a shift ofd(t) data to the right. Note that the abscissa in Fig. 17~a! islog(t). The data are reminiscent of rheological data from hmopolymers, wherein the time dependence of the stresslaxation modulus shifts to longer times as the temperatur
FIG. 16. The relationship between the Ornstein–Zernike parameters,I 0 andj, during the early stage of nucleation. Diamonds: blend T40 at 44Circles and triangles: two separate quenches of blend T50 to 25 °C. Squblend P35 at 0.34 kbar.I 0 and j were normalized by their values at thbeginning of the early stage (t5tF) for each of the quenches.
e or copyright; see http://jcp.aip.org/about/rights_and_permissions

ioffee
a
er,of
cle-ture.tres.calwithpido-
ver,ap-ics,ofaato-ger
ical
tic
dss,
ofion.
aris
ere-
andn-
astion
rveto
oneples
orke–
thsdur-
o
he
th
6095J. Chem. Phys., Vol. 111, No. 13, 1 October 1999 Initial stages of nucleation in blends
Down
lowered. The principle of time–temperature superposithas been established for collapsing rheological data at dient temperatures.57 We find that a similar principle can bapplied to our nucleation data. Multiplying the time axis byshift factor,aN , results in a collapse of thed(t) curves. This
FIG. 17. Demonstration of the time–temperature superposition principledata obtained from blend T40.~a! A plot of the exponentd vs log time forall of the quenches on the T40 blend.~b! The d(t) data in~a! shifted alongthe horizontal~log time! axis to obtain best overlap with the 54 °C data. Tabscissa is thus log(aNt) whereaN is the nucleation shift factor.~c! The shiftfactor, aN , vs temperature. The solid curve is a quadratic fit throughdata.
loaded 01 Mar 2011 to 129.6.123.112. Redistribution subject to AIP licens
nr-
concept is tested in Fig. 17~b! where we plotd vs aNt forT40. The reference temperature~whereaN is set to unity! is54 °C, for the T40 blend. Aside from the early time scattwe observe a significant collapse of the time dependenced@see Fig. 17~b!#.
The temperature dependence of the shift factors (aN) forthe T40 sample is shown in Fig. 17~c!. The value of 1/aN
may be considered as an estimate of the time scale for nuation, relative to that observed at the reference temperaThe large values ofaN at lower temperatures thus imply thathe nucleation process is more rapid at lower temperatuThe nucleation shift factors are different from the rheologishift factors because rheological time scales decreaseincreasing temperature as a result of the increasingly ramolecular motion. Of course, in our blends, molecular mtion does slow down with decreasing temperature. Howethe nucleation time scales in our experimental windowpear to be dominated by quench depth, i.e., thermodynamrather than molecular mobility. A quadratic extrapolationthe shift factor data@Fig. 17~c!# suggests the existence ofpoint at whichaN→0. For the T40 sample this happens57 °C. A shift factor of zero implies that the nucleation prcess would require infinite time, i.e., time scales much larthan the experimental window (103 min). One may thus re-gard these points as binodal points determined by dynammeasurements. Our dynamical estimate ofTb of 57 °C inT40 is somewhat lower than that determined from staSANS ~81 °C!.
The time dependence ofd obtained for samples T50 anP35 were similar to that obtained for T40. For completeneFig. 18~a! showsd vs aNt for P35 at a reference pressure0.34 kbar. We refer to this as time–pressure superpositThe pressure dependence of the shift factoraN is shown inFig. 18~b!. The dynamical estimate ofPb in P35 at 42 °C is0.2 kbar, while static SANS indicate that it is near 0 kb@Fig. 5~b!#. In most casesaN decreases as the binodalapproached@see Figs. 17~c! and 18~b!#. The T549 °Cquench of the sample T40@Fig. 17~c!# andT534 °C quenchof sample T50~see Fig. 11! are the only exceptions. We havno explanation for these deviations. We suspect that itflects the delicate nature of nucleation near the binodalour inability to exercise precise control over quenching coditions.
In both T40 and P35, the superposition principle wapplied to data obtained during both spinodal decomposiand nucleation~Figs. 17 and 18!. The ability to collapse allthe quenches for a particular sample onto a master cuimplies that the crossover from spinodal decompositionnucleation is smooth. The lack of an abrupt change ascrosses the mean-field spinodal line, observed in samT40 and P35, was anticipated by Binder.19,20 To our knowl-edge there has not been any theoretical or experimental wthat indicates this crossover would be manifested in timtemperature and time–pressure superposition principles.
The similarity of the data obtained at all quench depin Fig. 17 suggests that the nucleating structures formeding the shallow quenches~e.g., T40 at 49 and 54 °C! aresimilar to those formed during deep quenches~e.g., T40 at
n
e
e or copyright; see http://jcp.aip.org/about/rights_and_permissions
b
iswith
es
th
t
ngin
es
turesain.en
taalsoe tode-
theilib-
istics
200heentalla-
o
r theeorin
6096 J. Chem. Phys., Vol. 111, No. 13, 1 October 1999 Lefebvre et al.
Down
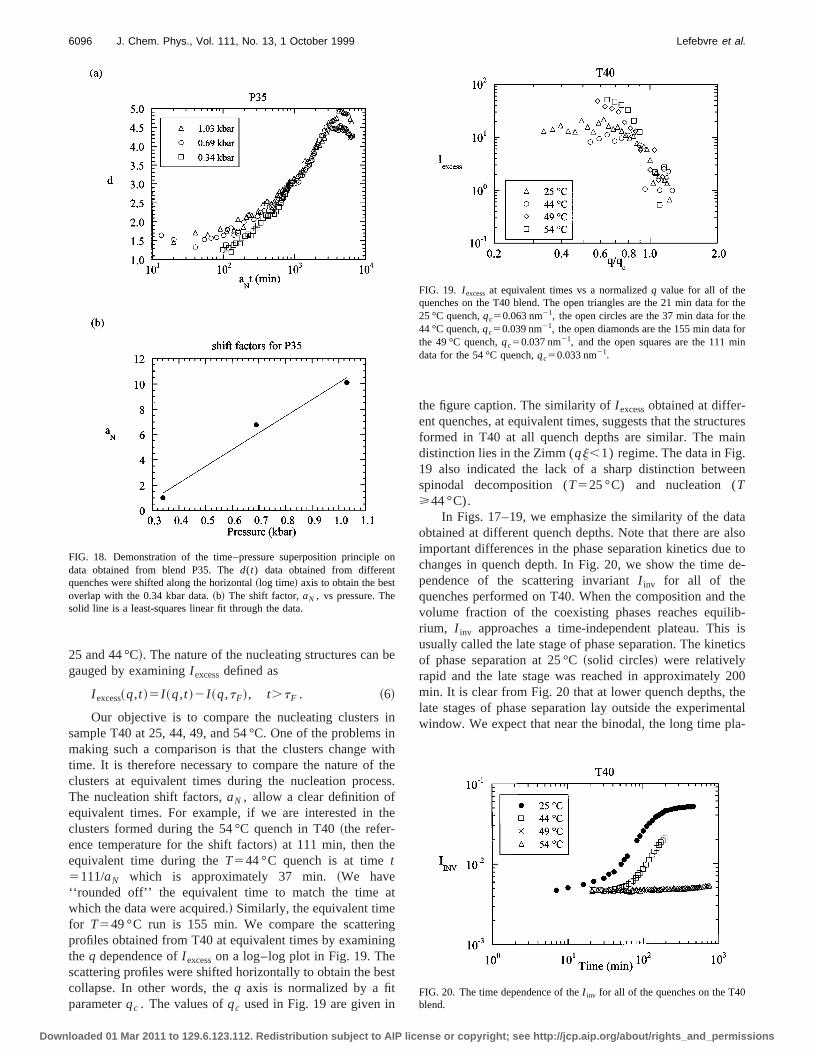
25 and 44 °C!. The nature of the nucleating structures cangauged by examiningI excessdefined as
I excess~q,t !5I ~q,t !2I ~q,tF!, t.tF . ~6!
Our objective is to compare the nucleating clusterssample T40 at 25, 44, 49, and 54 °C. One of the problemmaking such a comparison is that the clusters changetime. It is therefore necessary to compare the nature ofclusters at equivalent times during the nucleation procThe nucleation shift factors,aN , allow a clear definition ofequivalent times. For example, if we are interested inclusters formed during the 54 °C quench in T40~the refer-ence temperature for the shift factors! at 111 min, then theequivalent time during theT544 °C quench is at timet5111/aN which is approximately 37 min.~We have‘‘rounded off’’ the equivalent time to match the time awhich the data were acquired.! Similarly, the equivalent timefor T549 °C run is 155 min. We compare the scatteriprofiles obtained from T40 at equivalent times by examinthe q dependence ofI excesson a log–log plot in Fig. 19. Thescattering profiles were shifted horizontally to obtain the bcollapse. In other words, theq axis is normalized by a fitparameterqc . The values ofqc used in Fig. 19 are given in
FIG. 18. Demonstration of the time–pressure superposition principledata obtained from blend P35. Thed(t) data obtained from differentquenches were shifted along the horizontal~log time! axis to obtain the bestoverlap with the 0.34 kbar data.~b! The shift factor,aN , vs pressure. Thesolid line is a least-squares linear fit through the data.
loaded 01 Mar 2011 to 129.6.123.112. Redistribution subject to AIP licens
e
ninthes.
e
g
t
the figure caption. The similarity ofI excessobtained at differ-ent quenches, at equivalent times, suggests that the strucformed in T40 at all quench depths are similar. The mdistinction lies in the Zimm (qj,1) regime. The data in Fig19 also indicated the lack of a sharp distinction betwespinodal decomposition (T525 °C) and nucleation (T>44 °C).
In Figs. 17–19, we emphasize the similarity of the daobtained at different quench depths. Note that there areimportant differences in the phase separation kinetics duchanges in quench depth. In Fig. 20, we show the timependence of the scattering invariantI inv for all of thequenches performed on T40. When the composition andvolume fraction of the coexisting phases reaches equrium, I inv approaches a time-independent plateau. Thisusually called the late stage of phase separation. The kineof phase separation at 25 °C~solid circles! were relativelyrapid and the late stage was reached in approximatelymin. It is clear from Fig. 20 that at lower quench depths, tlate stages of phase separation lay outside the experimwindow. We expect that near the binodal, the long time p
n
FIG. 19. I excessat equivalent times vs a normalizedq value for all of thequenches on the T40 blend. The open triangles are the 21 min data fo25 °C quench,qc50.063 nm21, the open circles are the 37 min data for th44 °C quench,qc50.039 nm21, the open diamonds are the 155 min data fthe 49 °C quench,qc50.037 nm21, and the open squares are the 111 mdata for the 54 °C quench,qc50.033 nm21.
FIG. 20. The time dependence of theI inv for all of the quenches on the T40blend.
e or copyright; see http://jcp.aip.org/about/rights_and_permissions

isilcsqu
r-
er
ncatomsri
nt
ndan
etohe
e
tele
tteederfil
ceent of
, thed
de-
T50
ergeing
ith
aseetion.
°C.a
e-ex-icallei
ples
heby
hee usessa.
l %d
end
6097J. Chem. Phys., Vol. 111, No. 13, 1 October 1999 Initial stages of nucleation in blends
Down
teau ofI inv will be a strong function of quench depth. Thisbecause the composition of the coexisting phases at equrium approach each other as the quench depth is reduThe differences inI inv obtained at different quench depththus reflect kinetic differences as well as changes in the elibrium characteristics. The collapse ofd vs t data @Figs.17~a! and 18~a!# was obtained in spite of the large diffeences inI inv(t).
Nucleation experiments are often difficult to reproducespecially if the nucleation is heterogeneous. We testedproducibility in our systems by examining samples T50 aT508. These are two different samples with nearly identicompositions~see Table II!. Two temperature quenches25 °C were performed on T50 two years after the saquench was conducted on T508. The source that producecold neutrons at NIST, where these experiments were carout, was changed after the T508 sample was examined. Iorder to compare the runs before and after the change incold source, we divided the T508 data by a constant~5.0! toempirically account for the changes in the cold source motor reading. Qualitative agreement between the threesets was obtained. In Fig. 21, we show the time dependeof the scattering intensity atq'0.02 nm21. It is evident fromFig. 21 that the trends in the nucleation data are entirreproducible in samples with 50% block copolymer. Duelimited access to the neutron beam and the success of texperiments, we did not repeat the other quenches.
As a final check of our experimental protocol, wquenched sample T50 to 63 °C. As indicated in Fig. 5~a!, thisquench is located slightly above the binodal curve estimafrom static measurements, i.e., it is located in the singphase regime. In Fig. 22 we show the time-resolved scaing results that were obtained during this quench. Theperiment was terminated after 3 h, because we observeevidence of nucleation during this time. All of the othquenches showed significant changes in the SANS proafter 3 h.
FIG. 21. The dependence of the SANS intensities on time atq50.02 nm21, for the three 25 °C quenches on blends containing 50 vodiblock copolymer. Circles and triangles: separate quenches performethe T50 blend. Diamonds: T508 blend.
loaded 01 Mar 2011 to 129.6.123.112. Redistribution subject to AIP licens
ib-ed.
i-
,e-dl
e
ed
he
i-tace
ly
se
d-r-
x-no
es
H. Critical length scale during nucleation
We conclude this section by discussing the significanof qmerge, the characteristic scattering vector for a givquench beyond which the SANS intensity is independentime ~see Figs. 10–12!. It is important to note thatqmergewasidentified in all of the quenches into~and near! the nucle-ation regime. It is evident thatqmerge for a given sampledepends on quench depth. For example, in sample T40value ofqmergeat 44 °C is distinctly lower than that obtaineat 25 °C @compare Figs. 10~a! and 10~b!#. Increasing thequench temperature to 49 and 54 °C results in a furthercrease inqmerge @Figs. 10~c! and 10~d!#. It is evident thatqmerge decreases with decreasing quench depth. Thequench data~Fig. 11! and the P35 quench data~Fig. 12!,show the same qualitative features: the existence of a mpoint qmerge, which in most cases, decreases with decreasquench depth.
In an approximate sense, the formation of structures wa length scale ofj will result in increased scattering atq;1/j. The fact that the scattered intensity does not increat q values greater thanqmerge sets a lower bound on thlength scale of the structures formed during phase separaThis lower bound, defined by the symboljcrit51/qmerge, in-creases with decreasing quench depth~Figs. 10–12!. For ex-ample, in the case of T40,jcrit increases from 8 to 26 nmwhen the quench temperature is increased from 25 to 54Classical nucleation theory1,3,14,18predicts the existence ofcritical nucleus size (Rcrit), and that only nuclei with sizesgreater than the critical nucleus size will grow spontanously. The merge point provides direct evidence for theistence of such a critical length scale. However, the classestimate ofRcrit is based on the assumption that the nuchave attained equilibrium.1 In contrast, the nuclei that wehave obtained during the early stage of nucleation in samT40, T50, and P35 are distinctly out of equilibrium.
In Fig. 23, we summarize the critical length scale of tnucleating structures obtained from all of the samplesplotting jcrit versus quench depth. In order to display tpressure and temperature quenches on the same plot, wx, the Flory–Huggins interaction parameter as the absciThe conversion from temperature and pressure tox were
on
FIG. 22. SANS intensity vs scattering vector at selected times from blT50 during the 63 °C quench.
e or copyright; see http://jcp.aip.org/about/rights_and_permissions

th
e
o-eu
ddextuodcocamobub
teethikdih
uraanthei
sp
ofelyrpe–forpo-ral
e
pth.oththeour
by
is
les
size
hes isali-er-estalnterre-thatiza-eion
andla-isn-
l-the
r
6098 J. Chem. Phys., Vol. 111, No. 13, 1 October 1999 Lefebvre et al.
Down
done using the data in Fig. 1. In addition, we normalizedvalue ofx with its value at the spinodal,xs ~5x at Ts or Ps).In the case of sample T40,xs5x(T56 °C, P50 kbar)50.002 38, while for P35,xs5x(T532 °C,P50.34 kbar)50.001 73. The measured values ofjcrit lie between 5 and 30nm. We thus see thatjcrit can be smaller or larger than thradius of gyration of the polymer molecules (Rg517 nm forall of the components!.
IV. CONCLUDING REMARKS
Liquid–liquid phase separation in mixtures of high mlecular weight polyolefins was studied by time-resolved ntron scattering. Phase separation was induced by eithercreasing temperature or increasing pressure. We focusedata obtained during the initial stages of nucleation, i.e.,periments wherein the sample was quenched to temperaor pressures that were between the spinodal and the binSeparate static neutron scattering experiments wereducted to identify the binodal and spinodal points for eamixture. Phase separation, initiated by both temperaturepressure quenches, yielded similar results. Three regiwere identified during the nucleation process. First, weserve a relatively rapid process wherein concentration fltuations relax in response to the quench. This is followedthe nucleation regime wherein the neutron scattering insity increases relatively slowly with time. We call this thearly stage of nucleation. The scattering profiles duringearly stage are in agreement with the Ornstein–Zernequation. The structures formed during this stage are intinguishable from mean-field concentration fluctuations. Texponent of theI vs q scaling in the intermediateq regime,d,was used to determine the fractal dimension of the structformed during the early stages of phase separation. The vof d obtained during this stage was significantly lower th3, supporting our conclusion regarding the nature ofstructures responsible for nucleation based on the OrnstZernike analysis.
After the early stage of nucleation is completed, phaseparation proceeded rapidly. This is indicated by the ra
FIG. 23. The critical nucleation length scale,jcrit vs x/xs for all of thequenches. T40~circles!, T50 ~diamonds!, P35 ~squares!. The dashed linesare least squares fits through the data obtained from each sample. Theof gyration of the polymer chains in our blends~Rg! are in the vicinity of17 nm.
loaded 01 Mar 2011 to 129.6.123.112. Redistribution subject to AIP licens
e
-e-on-
resal.n-hndes-
c-yn-
ees-e
eslue
en–
eid
increase in scattered intensity. The exponentd approachesvalues between 3 and 4. This is the intermediate stagephase separation of nucleation and growth, which ultimatleads to the formation of the new liquid phase with shainterfaces. We demonstrated the existence of timtemperature and time–pressure superposition principlenucleation. We found that the time dependence of the exnentd for a given blend could be superimposed by a lateshift of the data along the time axis~log scale!. Analogous tothe shift factor for viscoelastic behavior of polymers, wdefine a nucleation shift factor,aN , which describes the in-crease in nucleation kinetics with increasing quench deThe superposition principle applies to data obtained babove and below the classical spinodal, indicating thatcrossover from nucleation to spinodal decomposition insystem is smooth and continuous. This was anticipatedBinder and co-workers.19,20
For each quench, we find that the scattering intensityindependent of time in the highq regime (q.qmerge). Thisimplies the absence of growing structures with length scasmaller thanjcrit51/qmerge during nucleation. The lengthscalejcrit bears some resemblance to the critical nucleuspredicted by classical nucleation theory.1
Aside from the existence of a critical length scale, tnature of the nucleating structures during the early stagesubstantially different from the predictions of the classictheories. They are out of equilibrium and qualitatively simlar to the diffuse, ramified structures proposed by Bindet al.19,20 and Klein et al.21 Recent experiments and computer simulations indicate that nonequilibrium structurmay play an important role in the initial stages of crysnucleation58–60ten Wolde and Frankel studied crystallizatioof a colloidal suspension from the liquid state by compusimulation.58 They found that disordered clusters were pcursors to nucleation. Likewise, it is has been reportedamorphous density fluctuations are precursors to crystalltion of some polymers.59,60There is thus increasing evidencthat the nuclei formed during the early stages of nucleatin some systems are out of equilibrium.
ACKNOWLEDGMENTS
We thank Jack Douglas for his valuable suggestions,Chenchy Lin, Ramanan Krishnamoorti and S. V. Jonnagadda for their contributions during the initial stages of thproject. Financial support from the National Science Foudation ~CTS-9805852, DMR-9457950!, and the DreyfusFoundation to Polytechnic University is gratefully acknowedged. The SANS instrument at NIST is supported byNational Science Foundation~DMR-9423101!.61
1J. W. Gibbs,The Scientific Papers of J. Willard Gibbs~Dover, New York,1961!.
2J. W. Cahn, Trans. Am. Inst. Min. Metall. Pet. Eng.242, 166 ~1968!.3J. D. Gunton, M. San Miguel, and P. S. Sahani, inPhase Transitions~Academic, New York, 1983!, Vol. 8.
4J. S. Higgins and H. C. Benoıˆt, Polymers and Neutron Scattering~OxfordUniversity Press, Oxford, 1994!.
5T. Nishi, T. T. Wang, and T. K. Kwei, Macromolecules8, 227 ~1975!.6J. E. Morral and J. W. Cahn, Acta Metall.19, 1037~1971!.7T. Hashimoto, M. Itakura, and H. Hasegawa, J. Chem. Phys.85, 6118~1986!.
adii
e or copyright; see http://jcp.aip.org/about/rights_and_permissions

m
.
.
hy
v.
h-
da
ish
ish
d A
hy
ul
ym
ac-
W.
as,
.
inge
sover
awasAfterslopethan
e re-
t-
sed
es-
R.
apertionandvail-
6099J. Chem. Phys., Vol. 111, No. 13, 1 October 1999 Initial stages of nucleation in blends
Down
8M. Okada and C. C. Han, J. Chem. Phys.85, 5317~1986!.9F. S. Bates and P. Wiltzius, J. Chem. Phys.91, 3258~1989!.
10D. Schwahn, S. Janssen, and T. Springer, J. Chem. Phys.97, 8775~1992!.11M. Motowoka, H. Jinnai, T. Hashimoto, Y. Qiu, and C. C. Han, J. Che
Phys.99, 2095~1993!.12H. Jinnai, H. Hasegawa, T. Hashimoto, and C. C. Han, J. Chem. Phys99,
4845 ~1993!.13H. Jinnai, H. Hasegawa, T. Hashimoto, and C. C. Han, J. Chem. Phys99,
8154 ~1993!.14P. G. Debenedetti,Metastable Liquids Concepts and Principles~Princeton
University Press, Princeton, 1996!.15W. Zhuang and E. Kiran, Polymer39, 2903~1998!.16Y. Xiong and E. Kiran, Rev. Sci. Instrum.69, 1463~1998!.17C. C. Lin, H. S. Jeon, N. P. Balsara, and B. Hammouda, J. Chem. P
103, 1957~1995!.18J. S. Langer and A. J. Schwartz, Phys. Rev. A21, 948 ~1980!.19K. Binder and D. Stauffer, Adv. Phys.25, 343 ~1976!.20K. Binder, Phys. Rev. A29, 341 ~1984!.21A. Sur, J. L. Lebowitz, J. Marro, and M. H. Kalos, Phys. Rev. B15, 3014
~1977!.22D. W. Heermann and W. Klein, Phys. Rev. B27, 1732~1983!.23S. Krishnamurthy and W. I. Goldburg, Phys. Rev. A22, 2147~1980!.24A. Cumming, P. Wiltzius, F. S. Bates, and J. H. Rosedale, Phys. Re
45, 885 ~1992!.25K. Schatzel and B. J. Ackerson, Phys. Rev. E48, 3766~1993!.26P. G. de Gennes,Scaling Concepts in Polymer Physics~Cornell Univer-
sity Press, Ithaca, 1979!.27C. Herkt-Maetzky and J. Schelten, Phys. Rev. Lett.51, 896 ~1983!.28A. J. Staverman and J. H. Van Saten, Recl. Trav. Chim. Pays-Bas.60, 76
~1941!.29M. L. Huggins, J. Phys. Chem.49, 151 ~1942!.30P. J. Flory, J. Phys. Chem.10, 51 ~1942!.31A. A. Lefebvre, J. H. Lee, N. P. Balsara, B. Hammouda, R. Kris
namoorti, and S. Kumar, Macromolecules32, 5460~1999!.32N. P. Balsara, A. A. Lefebvre, J. H. Lee, C. C. Lin, and B. Hammou
AIChE. J.44, 2515~1998!.33N. P. Balsara, S. V. Jonnalagadda, C. C. Lin, C. C. Han, and R. Kr
namoorti, J. Chem. Phys.99, 10011~1993!.34C. C. Lin, S. V. Jonnalagadda, N. P. Balsara, C. C. Han, and R. Kr
namoorti, Macromolecules29, 661 ~1996!.35N. P. Balsara, C. C. Lin, and B. Hammouda, Phys. Rev. Lett.77, 3847
~1996!.36H. S. Jeon, J. H. Lee, N. P. Balsara, B. Majumdar, L. J. Fetters, an
Faldi, Macromolecules30, 973 ~1997!.37B. Hammouda, N. P. Balsara, and A. A. Lefebvre, Macromolecules30,
5572 ~1997!.38H. S. Jeon, J. H. Lee, and N. P. Balsara, Phys. Rev. Lett.79, 3274~1997!.39J. H. Lee, H. S. Jeon, N. P. Balsara, and M. C. Newstein, J. Chem. P
108, 5173~1998!.40H. S. Jeon, J. H. Lee, and N. P. Balsara, Macromolecules31, 3328~1998!.41H. S. Jeon, J. H. Lee, N. P. Balsara, and M. C. Newstein, Macromolec
31, 3340~1998!.42N. P. Balsara, Curr. Opin. Solid State Mater. Sci.3, 589 ~1998!.43H. Rachapudy, G. G. Smith, V. R. Raju, and W. W. Graessley, J. Pol
Sci., Polym. Phys. Ed.17, 1211~1979!.44M. Morton and L. J. Fetters, Rubber Chem. Technol.48, 359 ~1975!.
loaded 01 Mar 2011 to 129.6.123.112. Redistribution subject to AIP licens
.
s.
A
,
-
-
.
s.
es
.
45R. Krishnamoorti, W. W. Graessley, N. P. Balsara, and D. J. Lohse, Mromolecules27, 3073~1994!.
46N. P. Balsara, L. J. Fetters, N. Hadjichristidis, D. J. Lohse, C. C. Han,W. Graessley, and R. Krishnamoorti, Macromolecules25, 6137~1992!.
47D. Schwahn, K. Mortensen, T. Springer, H. Yee-Madeira, and R. ThomJ. Chem. Phys.87, 6078~1987!.
48H. E. Cook, Acta Metall.18, 297 ~1970!.49D. Broseta and G. H. Fredrickson, J. Chem. Phys.93, 2927~1990!.50M. W. Matsen and M. Schick, Macromolecules27, 187 ~1994!.51R. J. Roe and D. Rigby, Adv. Polym. Sci.82, 103 ~1987!, and references
therein.52F. S. Bates, W. W. Maurer, P. M. Lipic, M. A. Hillmyer, K. Almdal, K
Mortensen, G. H. Fredrickson, and T. P. Lodge, Phys. Rev. Lett.79, 849~1997!.
53K. B. Migler and C. C. Han, Macromolecules31, 360 ~1998!.54The value oftF was determined using the two line least-squares fitt
procedure that was used to determineTb . This enabled separation of thdata into two sets: the ‘‘short’’ time, fluctuation relaxation stage,F, andthe ‘‘long’’ time, early stage,E. tF is the shortest time in the long timedata set. The time defining the end of the early stage,tE , could not bedetermined by the two line least-squares approach because the crosfrom the early to the intermediate stage~E to I! was [email protected]., Fig.13~b!#. To determinetE , the slope of the least-squares line throughminimum of four data points was determined, and then another pointadded and the slope calculated. These slopes were then averaged.each subsequent point was added and the slope calculated, the newwas compared to the average slope. If the slope increased by more5% of the average, the time of the previous data point was designatedtE .Otherwise a new average slope was determined, and the procedurpeated.
55Y. Feng, C. C. Han, M. Takenaka, and T. Hashimoto, Polymer33, 2729~1992!.
56For the nucleation experiments, att5tF , qH was defined using the fol-lowing equation: DI /I 50.25, where DI 5@ I ~at the last measurementaken in the experiment!2I (t5tF)#/I (t5tF). For the spinodal decomposition experiments instead of using the intensity profile att5tF in theequation, the intensity profile at the first time data was taken was u~sincetF50). As the experiments proceeded, the value ofqH decreaseddue to the growth of the phase separated structure. The lowestq valuebefore deviations from the power law relationship were observed is dignatedqL . For the nucleation experiments, att5tF , qmergeis set equal toqH . For the spinodal decomposition experiments,qmergeis set equal toqH
at the first time data is taken.57J. D. Ferry,Viscoelastic Properties of Polymers~Wiley, New York, 1980!.58P. R. ten Wolde and D. Frenkel, Science277, 1975~1997!.59M. Imai, K. Kaji, and T. Kanaya, Macromolecules27, 7103~1994!.60N. J. Terrill, P. A. Fairclough, E. Towns-Andrews, B. U. Komanschek,
J. Young, and A. J. Ryan, Polymer39, 2381~1998!.61Certain equipment and instruments or materials are identified in this p
in order to adequately specify the experimental details. Such identificadoes not imply recommendation by the National Institute of StandardsTechnology, nor does it imply the materials are necessarily the best aable for the purpose.
e or copyright; see http://jcp.aip.org/about/rights_and_permissions