initiating coverage 23 apr 2018 rbl bank - hdfc sec
TRANSCRIPT

INITIATING COVERAGE 23 APR 2018
RBL Bank BUY
HDFC securities Institutional Research is also available on Bloomberg HSLB <GO> & Thomson Reuters
Speed, sense and solidity RBL Bank (RBK) is India’s fastest growing private sector bank (~59% loan CAGR over FY10-17). It is adequately diversified across geographies and has a reasonable fix on asset quality. Beyond its corporate focus, RBK has selectively ventured into retail segments with high growth potential. With a well capitalised B/S, RBK is set to make the most of receding competition from corporate lenders (esp. PSUs) Strategic clarity, tight execution and superlative growth off a low base make RBK attractive for long term investors. The rising share of high yielding retail loans will fatten NIMs (est. +51bps in FY17-20E). While expanding fee streams and the ability to tweak SA rates are key profit levers, RBK’s high (and well directed) spend on people and technology will limit oplev for now. Our conservative cost and provision estimates still provide upside risk to earnings. Initiate coverage with a BUY. Our TP of Rs 573 is based on a 3x Mar-20 ABV of Rs 191. RBK’s underperformance (-24% relative to the Bank Nifty over the last year) makes for a good entry point.
Investment arguments Strong growth visible: On a relatively smaller base,
RBK’s management is confident of growing the loan book at 30-35% CAGR. With increasing retail/SME tilt, a calibrated risk appetite on corporate loans, deep relationships and an expanding client base, this looks feasible to us. We have factored 33% loan CAGR over FY18-20E.
Strategic clarity, tight execution: RBK’s management has consciously shied away from tricky (even if lucrative) segments like CVs and 2Ws. It is sticking to a narrow (and carefully chosen) range of products, even as it explores new credit segments via pilot initiatives. Meanwhile, cross-selling (credit cards and PL) within the current business mix provides opportunities.
Impeccable asset quality: The aversion for project finance, green field risks and a consequent focus on shorter tenure loans has helped RBK keep asset quality under control (GNPA ~1.6%) in a relatively stressed credit environment. Impaired assets at 1.15% (3QFY18) compare well with peers (YES at ~3.24%, and FB at ~3.04%). We have factored in 1.45% slippages and LLP of 67bps over FY18-20E.
Healthy fee streams: Despite the caution on growing riskier credit segments, a third of RBK’s income is attributable to non-interest income. The bank offers 3.-5 fee products to existing clients (with a focus on forex). Achieving scale in distribution income (>7x in 10 qtrs) has boosted fee income.
FINANCIAL SUMMARY YE Mar (Rs mn) FY16 FY17 FY18E FY19E FY20E NII 8,192 12,213 17,382 22,523 28,450 POPP 5,424 9,204 13,425 16,631 20,797 PAT 2,925 4,176 6,425 8,440 10,829 EPS (Rs) 9.0 11.1 15.5 20.3 26.1 EPS growth (%) 41.2 42.8 53.9 31.4 28.3 RoAE (%) 11.2 11.4 11.7 12.1 13.9 RoAA (%) 0.88 0.95 1.19 1.25 1.27 Adj BVPS (Rs) 88.2 110.4 155.7 171.2 191.0 P/ABV (x) 5.74 4.58 3.25 2.95 2.65 P/E (x) 56.2 45.5 32.7 24.9 19.4 Source: Bank, HDFC sec Inst Research
INDUSTRY BANKS CMP (as on 20 Apr 2018) Rs 506 Target Price Rs 573 Nifty 10,564
Sensex 34,465
KEY STOCK DATA
Bloomberg RBK IN
No. of Shares (mn) 420
MCap (Rs bn) / ($ mn) 211 / 3,222
6m avg traded value (Rs mn) 640
STOCK PERFORMANCE (%)
52 Week high / low Rs 601 / 443
3M 6M 12M
Absolute (%) (3.0) (2.6) (12.1)
Relative (%) (0.1) (9.0) (29.3)
SHAREHOLDING PATTERN (%)
Promoters -
FIs and Local MFs 16.99
FPIs 15.51
Public and Others 67.50 Source : BSE
Pranav Gupta [email protected] +91-22-6171-7337
Darpin Shah [email protected] +91-22-6171-7328
RBL BANK: INITIATING COVERAGE
Page | 2
Contents Superlative Growth Story ................................................................................................................................ 3
Corporate Loans: A core strength ....................................................................................................................... 4
Retail: Growth Driver ........................................................................................................................................... 6
Branch & Business Banking ................................................................................................................................. 7
Financial Inclusion ................................................................................................................................................ 9
Impeccable Asset Quality .............................................................................................................................. 10
No blow up in stress ........................................................................................................................................... 10
Peer Comparison ................................................................................................................................................ 13
NIMs will sustain ........................................................................................................................................... 15
Fee Income .................................................................................................................................................. 16
RoAA will inch up; Fund raise imminent ........................................................................................................ 18
Management has skin in the game ............................................................................................................... 19
View and valuation ....................................................................................................................................... 20
Quarterly snapshot ....................................................................................................................................... 20
Peer valuation............................................................................................................................................... 22
Financials ...................................................................................................................................................... 23

RBL BANK: INITIATING COVERAGE
Page | 3
Superlative growth story Over the last 5 years, each of RBK’s business verticals
has grown in excess of 25%. Within segments, corporate loans (the focus area for the bank) have grown at ~45% over FY13-17. .
The management is focused on growing the retail book at a faster pace, which will further diversify the book and reduce of overall risk.
The bank has also diversified into retail products like home loans, LAP, personal loans and credit cards. Higher yields and solid underwriting have helped maintain NIMs and control asset quality
In our view, RBK’s aversion towards taking project finance exposures and avoiding green field risks augurs well for credit quality.
We believe RBK is poised to grow much faster than the industry given the weak position of PSBs and sufficient growth capital given the fund raise in 1QFY18 (CRAR at 15.9%). We have modelled a loan CAGR of 33% over FY18-20E.
Growth Will Persist
Source : Bank, HDFC sec Inst Research
Mix Shifting Towards Retail
Source : Bank, HDFC sec Inst Research
Growth Ahead Of Peers FY13 FY14 FY15 FY16 FY17
HDFCB Advances 1,954 2,397 3,030 3,655 4,646 Growth (%) 22.2 22.7 26.4 20.6 27.1
ICICIBC Advances 2,537 2,902 3,387 3,875 4,353 Growth (%) 17.3 14.4 16.7 14.4 12.3
AXISB Advances 1,698 1,970 2,301 2,811 3,388 Growth (%) 19.2 16.0 16.8 22.2 20.5
IIB Advances 351 443 551 688 884 Growth (%) 34.0 26.4 24.3 24.8 28.5
YES Advances 380 470 556 755 982 Growth (%) 10.5 23.7 18.4 35.8 30.0
RBK Advances 64 98 144 212 294 Growth (%) 116.9 54.3 54.2 46.9 46.9
FB Advances 378 441 434 513 581 Growth (%) 18.2 16.8 -1.5 18.1 13.3
DCBB Advances 53 66 81 105 129 Growth (%) 23.4 24.6 23.6 28.6 23.5
Source: Bank, HDFC sec Inst Research. Figures in Rs bn
60 60 61 60 59 58
40 40 39 40 41 42
FY15
FY16
FY17
FY18
E
FY19
E
FY20
E
Wholesale (%) Non Wholesale (%)
0.010.020.030.040.050.060.070.080.0
0100200300400500600700800
FY13
FY14
FY15
FY16
FY17
FY18
E
FY19
E
FY20
E
Loan Chg (RHS) %Rs bn
RBL BANK: INITIATING COVERAGE
Page | 4
Corporate loans: A core strength
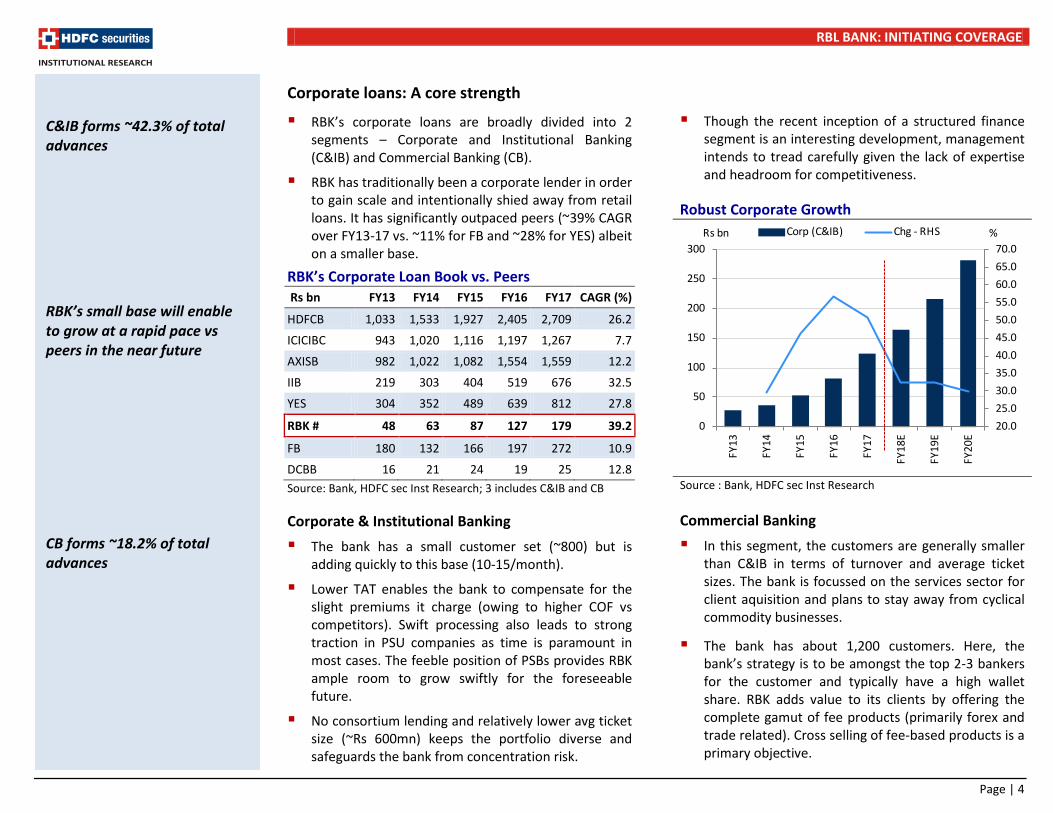
RBK’s corporate loans are broadly divided into 2 segments – Corporate and Institutional Banking (C&IB) and Commercial Banking (CB).
RBK has traditionally been a corporate lender in order to gain scale and intentionally shied away from retail loans. It has significantly outpaced peers (~39% CAGR over FY13-17 vs. ~11% for FB and ~28% for YES) albeit on a smaller base.
RBK’s Corporate Loan Book vs. Peers Rs bn FY13 FY14 FY15 FY16 FY17 CAGR (%)
HDFCB 1,033 1,533 1,927 2,405 2,709 26.2
ICICIBC 943 1,020 1,116 1,197 1,267 7.7
AXISB 982 1,022 1,082 1,554 1,559 12.2
IIB 219 303 404 519 676 32.5
YES 304 352 489 639 812 27.8
RBK # 48 63 87 127 179 39.2
FB 180 132 166 197 272 10.9
DCBB 16 21 24 19 25 12.8 Source: Bank, HDFC sec Inst Research; 3 includes C&IB and CB Corporate & Institutional Banking The bank has a small customer set (~800) but is
adding quickly to this base (10-15/month).
Lower TAT enables the bank to compensate for the slight premiums it charge (owing to higher COF vs competitors). Swift processing also leads to strong traction in PSU companies as time is paramount in most cases. The feeble position of PSBs provides RBK ample room to grow swiftly for the foreseeable future.
No consortium lending and relatively lower avg ticket size (~Rs 600mn) keeps the portfolio diverse and safeguards the bank from concentration risk.
Though the recent inception of a structured finance segment is an interesting development, management intends to tread carefully given the lack of expertise and headroom for competitiveness.
Robust Corporate Growth
Source : Bank, HDFC sec Inst Research Commercial Banking In this segment, the customers are generally smaller
than C&IB in terms of turnover and average ticket sizes. The bank is focussed on the services sector for client aquisition and plans to stay away from cyclical commodity businesses.
The bank has about 1,200 customers. Here, the bank’s strategy is to be amongst the top 2-3 bankers for the customer and typically have a high wallet share. RBK adds value to its clients by offering the complete gamut of fee products (primarily forex and trade related). Cross selling of fee-based products is a primary objective.
C&IB forms ~42.3% of total advances
RBK’s small base will enable to grow at a rapid pace vs peers in the near future CB forms ~18.2% of total advances
20.025.030.035.040.045.050.055.060.065.070.0
0
50
100
150
200
250
300
FY13
FY14
FY15
FY16
FY17
FY18
E
FY19
E
FY20
E
Corp (C&IB) Chg - RHSRs bn %
RBL BANK: INITIATING COVERAGE
Page | 5
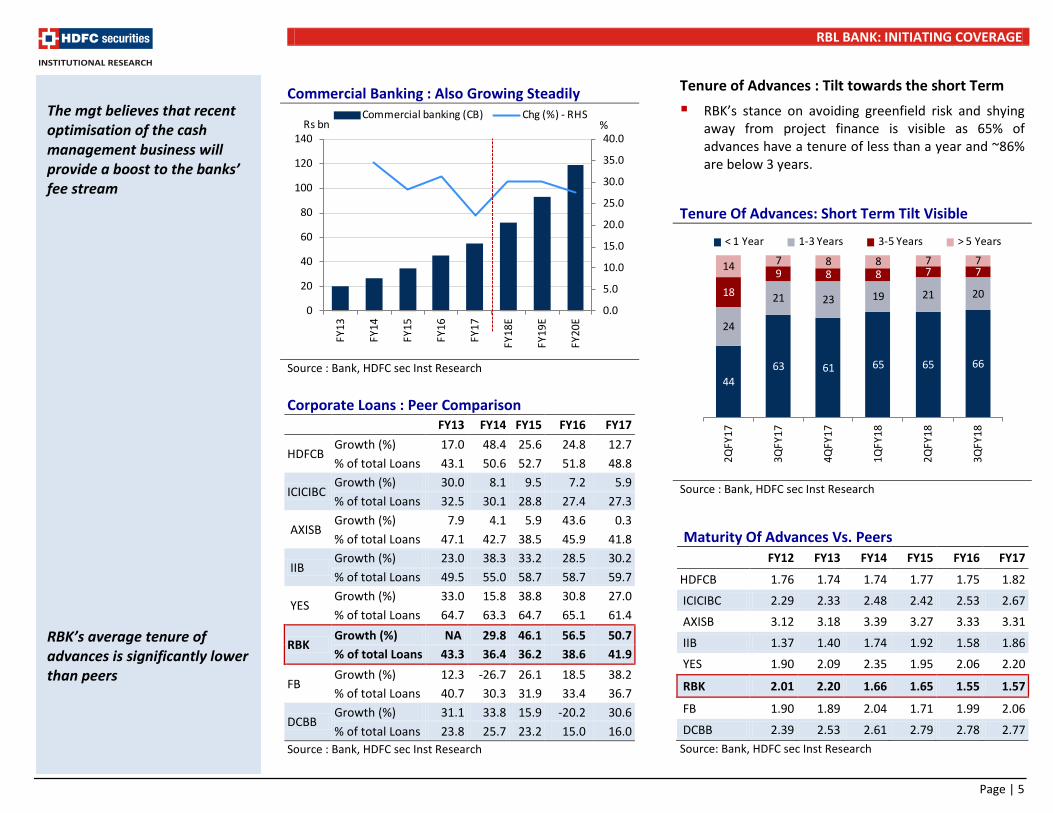
Commercial Banking : Also Growing Steadily
Source : Bank, HDFC sec Inst Research Corporate Loans : Peer Comparison
FY13 FY14 FY15 FY16 FY17
HDFCB Growth (%) 17.0 48.4 25.6 24.8 12.7 % of total Loans 43.1 50.6 52.7 51.8 48.8
ICICIBC Growth (%) 30.0 8.1 9.5 7.2 5.9 % of total Loans 32.5 30.1 28.8 27.4 27.3
AXISB Growth (%) 7.9 4.1 5.9 43.6 0.3 % of total Loans 47.1 42.7 38.5 45.9 41.8
IIB Growth (%) 23.0 38.3 33.2 28.5 30.2 % of total Loans 49.5 55.0 58.7 58.7 59.7
YES Growth (%) 33.0 15.8 38.8 30.8 27.0 % of total Loans 64.7 63.3 64.7 65.1 61.4
RBK Growth (%) NA 29.8 46.1 56.5 50.7 % of total Loans 43.3 36.4 36.2 38.6 41.9
FB Growth (%) 12.3 -26.7 26.1 18.5 38.2 % of total Loans 40.7 30.3 31.9 33.4 36.7
DCBB Growth (%) 31.1 33.8 15.9 -20.2 30.6 % of total Loans 23.8 25.7 23.2 15.0 16.0
Source : Bank, HDFC sec Inst Research
Tenure of Advances : Tilt towards the short Term RBK’s stance on avoiding greenfield risk and shying
away from project finance is visible as 65% of advances have a tenure of less than a year and ~86% are below 3 years.
Tenure Of Advances: Short Term Tilt Visible
Source : Bank, HDFC sec Inst Research
Maturity Of Advances Vs. Peers FY12 FY13 FY14 FY15 FY16 FY17
HDFCB 1.76 1.74 1.74 1.77 1.75 1.82
ICICIBC 2.29 2.33 2.48 2.42 2.53 2.67
AXISB 3.12 3.18 3.39 3.27 3.33 3.31
IIB 1.37 1.40 1.74 1.92 1.58 1.86
YES 1.90 2.09 2.35 1.95 2.06 2.20
RBK 2.01 2.20 1.66 1.65 1.55 1.57
FB 1.90 1.89 2.04 1.71 1.99 2.06
DCBB 2.39 2.53 2.61 2.79 2.78 2.77 Source: Bank, HDFC sec Inst Research
The mgt believes that recent optimisation of the cash management business will provide a boost to the banks’ fee stream RBK’s average tenure of advances is significantly lower than peers
0.0
5.0
10.0
15.0
20.0
25.0
30.0
35.0
40.0
0
20
40
60
80
100
120
140
FY13
FY14
FY15
FY16
FY17
FY18
E
FY19
E
FY20
E
Commercial banking (CB) Chg (%) - RHSRs bn %
44 63 61 65 65 66
24
21 23 19 21 20 18 9 8 8 7 7 14 7 8 8 7 7
2QFY
17
3QFY
17
4QFY
17
1QFY
18
2QFY
18
3QFY
18
< 1 Year 1-3 Years 3-5 Years > 5 Years
RBL BANK: INITIATING COVERAGE
Page | 6
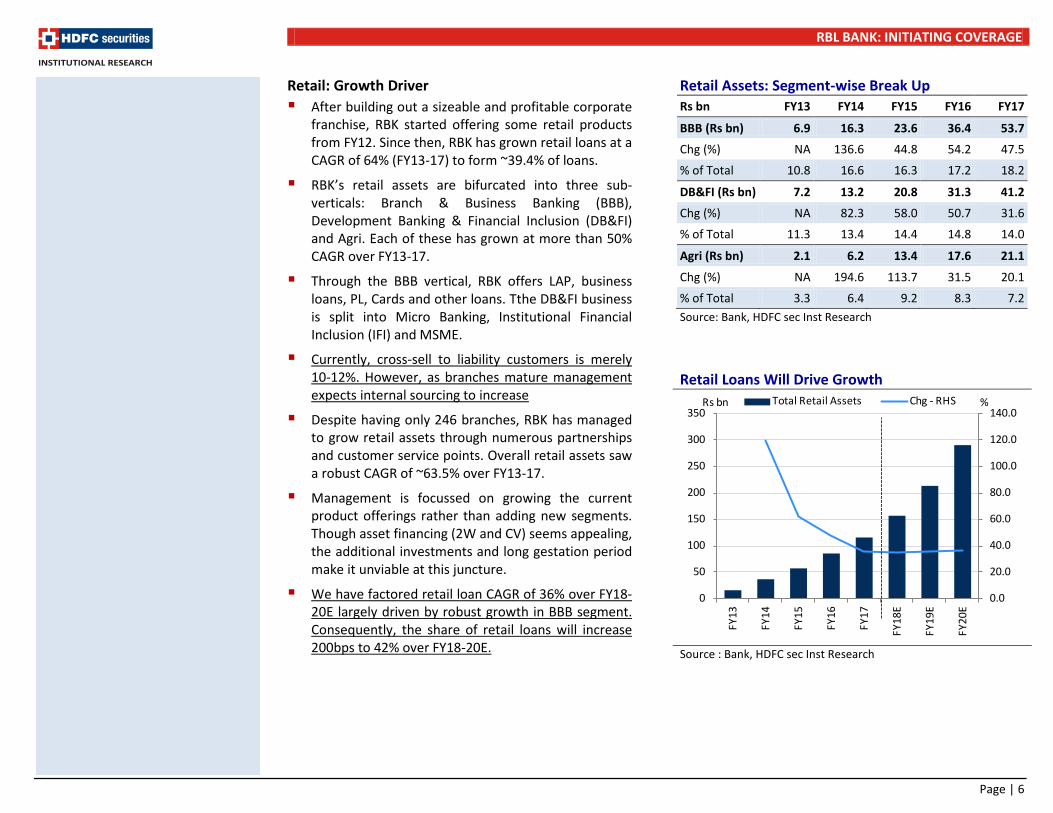
Retail: Growth Driver After building out a sizeable and profitable corporate
franchise, RBK started offering some retail products from FY12. Since then, RBK has grown retail loans at a CAGR of 64% (FY13-17) to form ~39.4% of loans.
RBK’s retail assets are bifurcated into three sub-verticals: Branch & Business Banking (BBB), Development Banking & Financial Inclusion (DB&FI) and Agri. Each of these has grown at more than 50% CAGR over FY13-17.
Through the BBB vertical, RBK offers LAP, business loans, PL, Cards and other loans. Tthe DB&FI business is split into Micro Banking, Institutional Financial Inclusion (IFI) and MSME.
Currently, cross-sell to liability customers is merely 10-12%. However, as branches mature management expects internal sourcing to increase
Despite having only 246 branches, RBK has managed to grow retail assets through numerous partnerships and customer service points. Overall retail assets saw a robust CAGR of ~63.5% over FY13-17.
Management is focussed on growing the current product offerings rather than adding new segments. Though asset financing (2W and CV) seems appealing, the additional investments and long gestation period make it unviable at this juncture.
We have factored retail loan CAGR of 36% over FY18-20E largely driven by robust growth in BBB segment. Consequently, the share of retail loans will increase 200bps to 42% over FY18-20E.
Retail Assets: Segment-wise Break Up Rs bn FY13 FY14 FY15 FY16 FY17
BBB (Rs bn) 6.9 16.3 23.6 36.4 53.7
Chg (%) NA 136.6 44.8 54.2 47.5
% of Total 10.8 16.6 16.3 17.2 18.2
DB&FI (Rs bn) 7.2 13.2 20.8 31.3 41.2
Chg (%) NA 82.3 58.0 50.7 31.6
% of Total 11.3 13.4 14.4 14.8 14.0
Agri (Rs bn) 2.1 6.2 13.4 17.6 21.1
Chg (%) NA 194.6 113.7 31.5 20.1
% of Total 3.3 6.4 9.2 8.3 7.2 Source: Bank, HDFC sec Inst Research
Retail Loans Will Drive Growth
Source : Bank, HDFC sec Inst Research
0.0
20.0
40.0
60.0
80.0
100.0
120.0
140.0
0
50
100
150
200
250
300
350
FY13
FY14
FY15
FY16
FY17
FY18
E
FY19
E
FY20
E
Total Retail Assets Chg - RHSRs bn %

RBL BANK: INITIATING COVERAGE
Page | 7
Branch & Business Banking BBB is one of RBK’s fastest growing segments clocking
a CAGR of ~67% over FY13-17. This segment accounts for ~21.2% of total loans as on 3QFY18.
(1) Loan Against Property A chunk of the BBB book is towards LAP (~50%). RBK
is currently focussed on offering LAP loans only in the top 30-40 cities. However, the bank will add this product in another 20-30 cities by the end of FY19.
Though ~80% of LAP loans are sourced through external channels, ~98% of collateral is either self owned property or primary place of business, which counter balances the risk.
Currently, LAP is offered only through 140 branches but as overall vintage improves, RBK will source loans through all branches and reduce DSA sourcing.
The bank aims to operate in the market between large private banks who offer lower rates and NBFCs who cater to lower customer segments with lower ticket sizes and higher interest rates.
Future growth will largely be due to a differentiated and customised product offering. Additionally, giving a top-up to financially disciplined customers with an established track record at higher rates (differential of 7-8%) will boost profitability
(2) Credit Cards RBK’s credit card slice is an upcoming and exciting
segment. The bank has a fragmented offering here with specialized cards for each type of spend with customized offers for travel, entertainment and leisure.
Customer acquisition has accelerated over the past few quarters given the extensive marketing activities From a bit over 7k adds in Apr-16, acquisition has jumped to 50-60k/month.
The partnership with BAF (Bajaj Finance) is also beneficial as the bank can cross-sell their cards to the huge customer base. However, RBK will focus on the top 25% of customers (~10mn) of BAF given their proven track record and better credit behavior.
Card Additions Per Month Steadily Increasing
Spends Per Card vs. Industry
Source : RBI, HDFC sec Inst Research
RBK does not offer any cards to mass customers About 50-55% of credit card sourcing is done through DSA’s 70% of credit card customers are salaried
0.4%
0.6%
0.8%
1.0%
1.2%
1.4%
1.6%
1.8%
2.0%
-10
0
10
20
30
40
50
60
70
Apr-
16M
ay-1
6Ju
n-16
Jul-1
6Au
g-16
Sep-
16O
ct-1
6N
ov-1
6De
c-16
Jan -
17Fe
b-17
Mar
-17
Apr-
17M
ay-1
7Ju
n-17
Jul-1
7Au
g-17
Sep-
17O
ct-1
7N
ov-1
7De
c-17
Addition Mkt Share (%) - RHS000'S
0
5
10
15
20
25
30
35
40
1QFY
15
2QFY
15
3QFY
15
3QFY
15
1QFY
16
2QFY
16
3QFY
16
3QFY
16
1QFY
17
2QFY
17
3QFY
17
3QFY
17
1QFY
18
2QFY
18
3QFY
18
Industry RBL000'S

RBL BANK: INITIATING COVERAGE
Page | 8
Credit Card Spends Market Share (%) Banks 1Q
FY15 2Q
FY15 3Q
FY15 4Q
FY15 1Q
FY16 2Q
FY16 3Q
FY16 4Q
FY16 1Q
FY17 2Q
FY17 3Q
FY17 4Q
FY17 1Q
FY18 2Q
FY18 3Q
FY18 AMEX 12.5 12.6 12.0 12.0 12.6 12.4 11.4 11.8 12.8 12.7 11.4 11.5 10.2 9.6 9.7 AXSB 6.9 6.8 6.8 7.7 5.0 7.4 8.0 9.1 8.8 8.6 8.4 9.0 9.0 9.1 9.5 CITI 16.5 16.4 16.1 15.2 15.4 14.5 14.6 13.7 13.5 12.9 13.3 11.7 11.7 10.6 10.3 HDFCB 29.5 29.6 30.6 30.3 31.0 31.1 30.7 29.5 29.5 29.6 29.6 29.3 28.9 29.1 28.1 HSBC 2.0 2.0 1.9 1.8 1.8 1.6 1.6 1.5 1.4 1.3 1.3 1.2 1.1 1.1 1.1 ICICIBC 11.2 11.2 11.4 11.1 11.1 10.6 10.8 11.1 10.7 11.0 10.9 11.1 11.2 11.0 11.2 IIB 1.4 1.4 1.5 1.7 2.2 2.2 2.4 2.9 2.9 3.0 2.9 3.4 3.3 3.3 3.2 KMB 1.7 1.7 1.7 1.7 1.9 1.9 1.9 2.0 2.0 2.0 2.0 2.2 2.3 2.3 2.3
RBK 0.2 0.2 0.3 0.3 0.3 0.4 0.4 0.6 0.8 0.9 0.9 1.0 1.2 1.3 1.5
STANC 4.8 4.7 4.8 4.2 4.1 3.9 3.8 3.4 3.2 3.1 3.2 3.0 2.7 2.5 2.5 SBIN 10.9 11.1 10.6 11.7 12.3 11.7 11.9 12.1 12.0 12.5 13.7 14.0 15.8 17.3 18.0
Cards Market Share (%)
Banks 1Q FY15
2Q FY15
3Q FY15
4Q FY15
1Q FY16
2Q FY16
3Q FY16
4Q FY16
1Q FY17
2Q FY17
3Q FY17
4Q FY17
1Q FY18
2Q FY18
3Q FY18
AMEX 3.4 3.4 3.4 3.4 3.4 3.5 3.5 3.5 3.4 3.4 3.4 3.4 3.4 3.3 3.3 AXSB 7.2 7.5 7.7 7.8 8.2 8.3 8.8 9.5 9.8 10.2 10.5 10.8 11.2 11.2 11.5 CITI 12.6 12.3 12.1 11.7 11.4 10.9 10.5 10.5 9.8 9.4 9.0 8.7 8.5 8.2 7.8 HDFCB 26.8 27.1 27.6 28.2 28.3 28.8 29.2 27.6 29.7 30.1 30.2 30.5 28.6 28.7 28.9 HSBC 2.6 2.5 2.5 2.4 2.4 2.3 2.2 2.1 1.9 1.9 1.7 1.6 1.5 1.6 1.6 ICICIBC 16.6 16.8 16.7 16.1 15.8 15.5 15.1 15.4 14.9 14.9 14.9 14.5 14.3 13.8 13.5 IIB 1.4 1.5 1.5 1.6 1.6 1.6 1.7 1.8 1.8 1.8 1.8 1.9 2.0 2.0 2.1 KMB 2.3 2.2 2.3 2.4 2.5 2.7 2.8 3.0 3.0 3.1 3.3 3.4 3.5 3.6 3.7
RBK 0.7 0.4 0.4 0.4 0.4 0.4 0.5 0.5 0.6 0.7 0.8 0.8 0.9 1.2 1.4
STANC 6.1 5.9 5.7 5.4 5.2 4.9 4.6 4.5 4.1 4.0 3.9 3.7 3.7 3.6 3.6 SBIN 14.9 15.0 14.5 14.8 15.0 15.1 15.1 15.2 14.8 14.8 14.9 15.0 15.3 15.7 15.8 Source: RBI, Bank, HDFC sec Inst Research

RBL BANK: INITIATING COVERAGE
Page | 9
Financial Inclusion The Financial Inclusion (FI) segment is broadly divided
into three businesses i.e. Micro Banking, Institutional Financial Inclusion (IFI) and MSME. As at 3QFY18, FI forms ~13% of loans.
Micro Banking (7.8% of loans as on 3Q) is a focus area for the bank given the granularity of loans and significantly higher yields.
RBK operates through a network of business correspondents (BC). The bank works with 1-2 BC organisations in each state that are well versed with the geography. Hence, RBK is able to work with experts in the area and have a single point of contact.
Swadhaar (RBK’s subsidiary) is also an important partner for this vertical. Management aims to source a majority of micro banking loans through the sub as it enables better control on quality, while also being cost effective.
Growth in the micro banking business will largely be driven by expansion into newer geographies. The bank is already present in 21 states (3-4 states added over the last couple of quarters) but sees ample room for growth .
However, the IFI business has been de-growing (3.7% of loans vs 5.5% as on FY17) and will continue to do so as many of its customers in this segment have converted to banks (Equitas, Ujjivan, etc).
Though asset quality has worsened ( from 0.36% to 3.38%) over the past few quarters, it was largely due to the impact of demonetisation. Collection effeciency on incremental loans has significantly improved (99.6%) since then and no major jolts are expected hereon.
FI Growth To Remain Steady
Source : Bank, HDFC sec Inst Research
Deterioration Visible In The Last 3 Quarters
Source : Bank, HDFC sec Inst Research
Micro Banking customers have access to all the basic asset and liability products through the bank’s wide BC network (esp. Swadhaar) RBK operates with a total of 6 BC’s Currently, all loans under Micro banking are JLG loans Swadhaar sources ~40% of Micro banking and 100% of MSME loans Going forward, no state will contribute > 15% to loans thereby reducing risks related to specific regions The ngt has guided that asset quality in the MFI business will peak out in 4Q
0.0
10.0
20.0
30.0
40.0
50.0
60.0
70.0
80.0
90.0
0102030405060708090
100
FY13
FY14
FY15
FY16
FY17
FY18
E
FY19
E
FY20
E
DB&FI Chg - RHSRs bn %
-
0.5
1.0
1.5
2.0
2.5
3.0
3.5
4.0
0200400600800
1,0001,2001,4001,6001,800
2QFY
16
3QFY
16
4QFY
16
1QFY
17
2QFY
17
3QFY
17
4QFY
17
1QFY
18
2QFY
18
3QFY
18
GNPA (Rs mn) GNPA (%) - RHS

RBL BANK: INITIATING COVERAGE
Page | 10
Impeccable Asset Quality No blow up in stress
Over FY12-14, most banks witnessed strong growth largely driven by the corporate credit boom. However, as the economic downturn began, a significant chunk of these loans turned bad. This was visible as slippages shot up and asset quality deteriorated over FY15-17.
Slippages spiked and GNPA accretion was elevated. Corporate lenders such as ICICIBC, AXSB and various PSBs still face asset quality woes, exacerbated by tighter RBI guidelines on stress recognition.
Slippages Have Jumped For Corporate-heavy Banks % FY12 FY13 FY14 FY15 FY16 FY17 HDFCB 0.98 1.59 1.89 1.58 1.52 1.54 ICICIBC 1.27 1.32 1.44 2.19 4.06 7.46 AXISB 1.18 1.10 1.19 1.12 2.34 6.12 IIB 0.94 1.33 1.26 1.43 1.08 1.42 YES 0.18 0.57 0.78 0.59 1.05 2.28 RBK 0.60 0.78 0.79 0.39 1.12 2.11 FB 1.99 1.97 1.56 1.72 3.47 1.64 DCBB 1.43 1.27 1.32 1.87 1.93 1.82 Source : Bank, HDFC sec Inst Research
However, RBK has fared relatively better in this situation given the bank’s aversion to greenfield risk, project finance and its focus on shorter tenure loans. Being a late entrant in the system also worked in its advantage. The bank has also been focussed on lending to better rated borrowers which is visible as more than 70% of rated borrowers are above investment grade. The bank is inclined to improving this rating profile further.
NPAs In Line With Growth
Source : Bank, HDFC sec Inst Research
Well Rated Portfolio
Source : Bank, HDFC sec Inst Research
Industry NPAs for Corporate lenders % FY15 FY16 FY17 HDFCB 1.0 1.0 1.1 ICICIBC 4.7 9.7 18.1 AXSB 1.7 2.2 9.6 IIB 0.7 0.9 0.8 YES 0.5 0.3 2.1 RBK 0.4 1.0 1.6 FB 3.4 6.5 5.0 DCBB 2.9 3.2 2.6
-
0.20
0.40
0.60
0.80
1.00
1.20
1.40
-
1,000
2,000
3,000
4,000
5,000
6,000
7,000
8,000
FY13
FY14
FY15
FY16
FY17
FY18
E
FY19
E
FY20
E
GNPA Rs mn NNPA Rs mnGNPA % - RHS NNPA % - RHSRs bn %
2QFY
16
3QFY
16
4QFY
16
1QFY
17
2QFY
17
3QFY
17
4QFY
17
1QFY
18
2QFY
18
3QFY
18
AAA/AA+/AA AA- A+/A A-/BBB+ BBB BBB- BB+ BB & Below

RBL BANK: INITIATING COVERAGE
Page | 11
Stress by lending segment: 10 quarter history
Rs mn 2Q FY16
3Q FY16
4Q FY16
1Q FY17
2Q FY17
3Q FY17
4Q FY17
1Q FY18
2Q FY18
3Q FY18
Corp & Institutional Banking (C&IB) 501 171 171 266 378 378 1,038 1,030 1,028 1,422 % of loans 0.77 0.21 0.21 0.3 0.36 0.33 0.84 0.78 0.74 0.91
Commercial Banking (CB) 785 1,344 1,384 1,589 1,592 1,604 1,389 1,438 1,236 1,057 % of loans 1.87 2.87 2.96 3.42 3.44 3.29 2.53 2.60 2.00 1.56
Branch & Business Banking (BBB) 198 312 378 472 550 617 763 865 1,037 1,108 % of loans 0.74 0.9 1.09 1.26 1.26 1.29 1.42 1.41 1.49 1.41 LAP (Rs mn) 6 6 42 61 85 128 199 153 200 253 BIL (Rs mn) 26 39 34 56 78 108 159 197 246 257 PIL (Rs mn) 4 6 8 13 19 27 43 57 77 85 Cards (Rs mn) 32 29 46 69 81 84 98 144 158 193 Others (Rs mn) 130 232 248 273 285 270 264 315 356 320
Agri 47 58 66 102 107 117 181 234 264 576 % of loans 0.31 0.33 0.38 0.56 0.64 0.67 0.86 1.03 1.28 2.89
Financial Inclusion (FI) 85 106 82 98 119 131 197 1,012 1,307 1,635 % of loans 0.36 0.34 0.26 0.31 0.33 0.36 0.48 2.39 2.81 3.38
Total 1,616 1,991 2,081 2,527 2,746 2,847 3,568 4,579 4,872 5,798 % of loans 0.48 0.69 0.59 0.66 0.55 0.52 0.64 0.81 0.78 0.97 Source: Bank, HDFC sec Inst Research
C&IB: Stress has been under control given the bank’s focus on lending to better rated corporates and shorter tenure loans. The recent accretion is due to recognition of one chunky account of ~Rs 530mn (sugar sector as per RBI directions). However, post the RBI circular on 12th Feb, this account may not get upgraded till Dec-18.
CB: This segment has traditionally seen higher than average NPAs as the business was tilted towards cyclical commodity players. Disruption owing to GST has also caused some issues. However, GNPAs have been reducing in recent quarters as the mgt has
revamped processes. We do not expect any major shocks hereon.
Financial Inclusion: This portfolio was badly hit after the demonetisation shock as a chunk of MFI borrowers faced cash crunch. The mgt has been guiding for GNPAs of ~5-5.5% by FY18, post which a gradual improvement in expected. However, collection efficiency has regained normalcy over the past 2-3 qtrs. The institutional part of FI business was relatively unaffected as most MFI’s were well capitalized.

RBL BANK: INITIATING COVERAGE
Page | 12
Agri: Recent announcements regarding loan waiver has led to a spike in GNPAs. Maharashtra and Karnataka are the most affected regions for the bank. However the mgt believes a part of this portfolio will see an improvement driven by greater clarity on waiver eligibility.
BBB: Asset quality trends in his portfolio have largely been in line with asset growth. However, the mgt expect slightly higher addition in the LAP segment as the portfolio gets seasoned.
Exposure to Major Sectors (Fund + Non Fund Based) Rs bn 1QFY17 2QFY17 3QFY17 4QFY17 1QFY18 2QFY18 3QFY18 % of Total
exposure Mining and Quarrying 3.7 5.0 5.4 5.7 4.9 5.6 5.5 1.0 Food Processing 23.0 23.1 23.6 22.9 22.2 21.0 23.9 4.5 Textiles 5.5 5.8 6.3 6.5 6.5 7.9 8.1 1.5 Petroleum (non-infra), Coal Products non-mining) and Nuclear Fuels 5.3 5.8 5.6 5.4 6.7 7.4 6.2 1.2
Chemicals and Chemical Products 28.4 29.1 32.7 31.3 32.0 37.8 38.0 7.1 Rubber, Plastic and their products 3.2 3.4 5.1 5.0 5.4 5.5 5.5 1.0 Basic Metal and Metal Products 7.2 4.3 4.7 10.4 9.5 9.1 5.6 1.1 All Engineering 11.6 14.4 16.1 14.9 15.9 17.9 20.2 3.8 Vehicles, Vehicle Parts and Transport Equipments 3.0 3.0 3.1 4.0 4.7 5.2 5.8 1.1
Gems and Jewellery 5.2 5.6 4.2 5.3 5.8 6.0 5.5 1.0 Construction 18.1 21.8 30.1 25.3 26.5 25.1 36.7 6.9 Infrastructure 28.4 36.0 39.5 42.8 43.3 47.0 51.1 9.6 NBFC 11.8 14.3 16.7 17.0 18.8 16.7 38.8 7.3 Micro-Finance Institutions (MFI) 15.6 17.5 17.5 11.8 10.6 11.1 65.4 12.3 Housing Finance Companies (HFC) 4.9 5.5 5.2 3.8 4.4 3.7 19.5 3.7 Core Investment Companies (CIC) 1.5 4.8 1.5 1.5 1.3 1.3 5.4 1.0 Traders 18.1 23.5 19.8 22.3 22.8 25.5 9.6 1.8 Other Industries 23.6 101.8 35.7 49.0 51.4 36.6 28.6 5.4 Residuary Other Advances 80.8 94.6 97.3 112.1 119.5 129.7 142.4 26.7 TOTAL 335.9 374.8 402.7 438.0 454.5 487.0 533.0
Source : Bank, HDFC sec Inst Research
RBK’s book is well diversified across sectors, eliminating specific sectorial risk Non fund based exposures form ~26% of total exposures RBK has relatively lower exposure to stressed sectors vs. peers
ICICIBC YES AXSB RBK Metals 4.1 4.2 4.1 1.1 Infra 7.8 14.0 9.1 9.6 Textile 0.5 1.3 0.4 1.5 Gems & Jewels 0.5 1.8 0.3 1.0
Source : Bank, HDFC sec Inst Research RBK’s total exposure to energy sector is ~Rs 37.7bn which are largely towards renewable energy projects These projects are 100% operational
RBL BANK: INITIATING COVERAGE
Page | 13
Peer Comparison
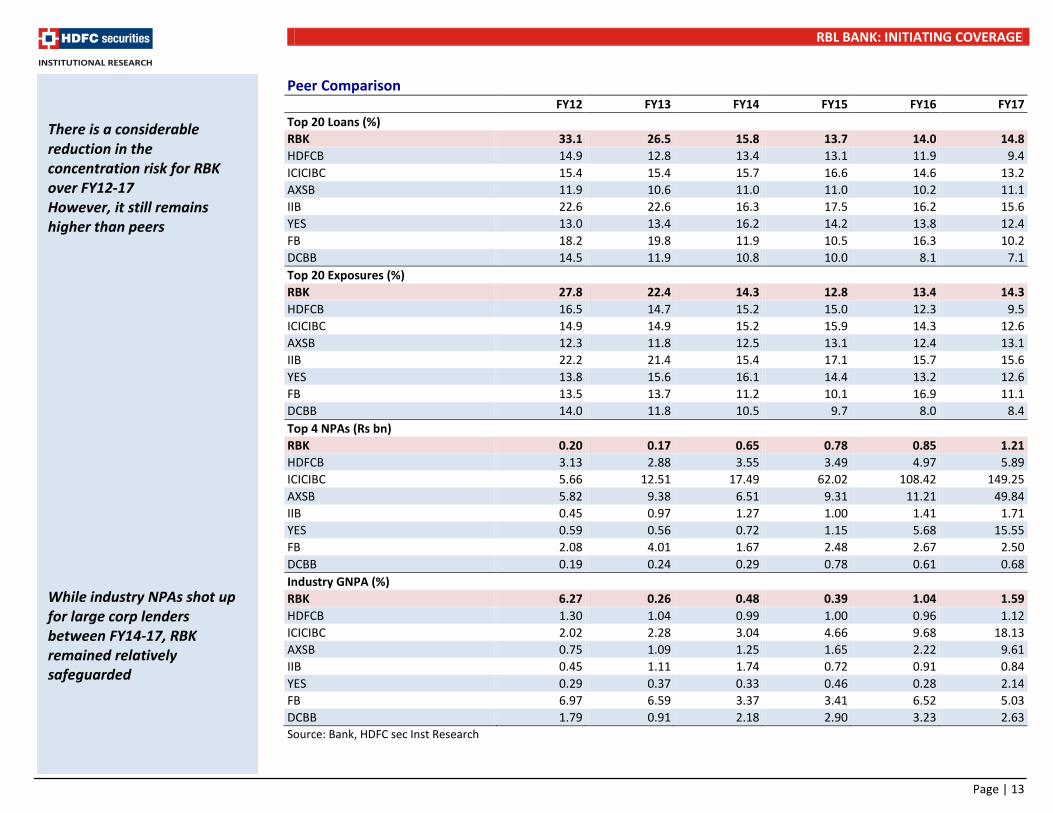
FY12 FY13 FY14 FY15 FY16 FY17 Top 20 Loans (%) RBK 33.1 26.5 15.8 13.7 14.0 14.8 HDFCB 14.9 12.8 13.4 13.1 11.9 9.4 ICICIBC 15.4 15.4 15.7 16.6 14.6 13.2 AXSB 11.9 10.6 11.0 11.0 10.2 11.1 IIB 22.6 22.6 16.3 17.5 16.2 15.6 YES 13.0 13.4 16.2 14.2 13.8 12.4 FB 18.2 19.8 11.9 10.5 16.3 10.2 DCBB 14.5 11.9 10.8 10.0 8.1 7.1 Top 20 Exposures (%) RBK 27.8 22.4 14.3 12.8 13.4 14.3 HDFCB 16.5 14.7 15.2 15.0 12.3 9.5 ICICIBC 14.9 14.9 15.2 15.9 14.3 12.6 AXSB 12.3 11.8 12.5 13.1 12.4 13.1 IIB 22.2 21.4 15.4 17.1 15.7 15.6 YES 13.8 15.6 16.1 14.4 13.2 12.6 FB 13.5 13.7 11.2 10.1 16.9 11.1 DCBB 14.0 11.8 10.5 9.7 8.0 8.4 Top 4 NPAs (Rs bn) RBK 0.20 0.17 0.65 0.78 0.85 1.21 HDFCB 3.13 2.88 3.55 3.49 4.97 5.89 ICICIBC 5.66 12.51 17.49 62.02 108.42 149.25 AXSB 5.82 9.38 6.51 9.31 11.21 49.84 IIB 0.45 0.97 1.27 1.00 1.41 1.71 YES 0.59 0.56 0.72 1.15 5.68 15.55 FB 2.08 4.01 1.67 2.48 2.67 2.50 DCBB 0.19 0.24 0.29 0.78 0.61 0.68 Industry GNPA (%) RBK 6.27 0.26 0.48 0.39 1.04 1.59 HDFCB 1.30 1.04 0.99 1.00 0.96 1.12 ICICIBC 2.02 2.28 3.04 4.66 9.68 18.13 AXSB 0.75 1.09 1.25 1.65 2.22 9.61 IIB 0.45 1.11 1.74 0.72 0.91 0.84 YES 0.29 0.37 0.33 0.46 0.28 2.14 FB 6.97 6.59 3.37 3.41 6.52 5.03 DCBB 1.79 0.91 2.18 2.90 3.23 2.63 Source: Bank, HDFC sec Inst Research
There is a considerable reduction in the concentration risk for RBK over FY12-17 However, it still remains higher than peers While industry NPAs shot up for large corp lenders between FY14-17, RBK remained relatively safeguarded

RBL BANK: INITIATING COVERAGE
Page | 14
Peer Comparison
FY12 FY13 FY14 FY15 FY16 FY17 Agri GNPA (%) RBK 0.34 0.21 0.19 0.34 0.31 0.57 HDFCB 0.92 0.90 1.18 1.31 1.41 1.93 ICICIBC 4.78 3.60 3.62 2.97 3.15 3.11 AXSB 2.33 2.36 2.83 2.26 2.44 3.25 IIB 0.93 1.11 1.11 0.69 0.73 0.77 YES 0.16 0.01 0.03 0.12 1.69 3.64 FB 3.42 3.11 3.56 2.00 1.69 2.86 DCBB 0.00 2.10 2.21 1.02 1.40 2.42 Credit Costs (%) RBK 0.33 0.23 0.37 0.29 0.45 0.60 HDFCB 0.61 0.57 0.60 0.52 0.51 0.62 ICICIBC 0.42 0.57 0.80 0.97 1.83 3.34 AXSB 0.55 0.64 0.61 0.70 1.23 3.13 IIB 0.47 0.55 0.63 0.55 0.64 0.70 YES 0.03 0.34 0.26 0.20 0.57 0.58 FB 0.64 0.46 0.52 0.43 1.02 0.62 DCBB 0.51 0.29 0.47 0.45 0.54 0.60 Provision Coverage calc. (%) RBK 74.7 73.4 60.8 65.3 40.2 46.8 HDFCB 82.4 79.9 72.6 73.9 69.9 68.7 ICICIBC 80.4 76.8 68.6 58.6 50.6 40.2 AXSB 73.8 70.6 67.4 68.0 58.6 59.5 IIB 72.7 70.1 70.4 62.6 58.6 58.4 YES 79.2 92.6 85.1 72.0 62.0 46.9 FB 84.7 72.2 70.4 64.7 43.0 45.5 DCBB 87.5 77.1 46.5 43.2 50.6 51.1 Source: Bank, HDFC sec Inst Research
RBK has managed to keep Agri stress under control despite various macro headwinds

RBL BANK: INITIATING COVERAGE
Page | 15
NIMs will sustain
RBK is one of the few banks (in addition to KMB, IIB and YES) that offers differenntial rates of interest on SA deposits. This has led to robust CASA accretion over the past 8 quarters (from ~18.2% to ~24%). The bank will continue to hold up rates as the mgt expects strong customer addition to continue.
Interest Rates On Savings Accounts Slabs Rate (%) Up to Rs 0.1mn 5.50 Above Rs 0.1mn and up to Rs. 1mn 6.00 Above Rs.1mn and up to Rs. 50mn 6.50 Source : Bank, HDFC sec Inst Research
Despite the higher rates on SA deposits, RBK’s NIMs have been continuously trending upwards. This is largely owing to the rising share of high yielding retail loans, focus on risk-based pricing and lower interest reversals, as slippages remain under control
The headroom to tweak SA rates (and still offer a premium on market rates) is a key advantage.
We believe that NIMs will remain stable over FY18-20E as retail traction continues and COF remains moderate with rising CASA.
NIMs Vs Peers NIM FY15 FY16 FY17 FY18E FY19E FY20E ICICIBC 3.47 3.56 3.35 3.23 3.27 3.28 AXISB 3.70 3.80 3.64 3.39 3.43 3.39 IIB 3.86 3.99 4.20 4.19 4.20 4.22 YES 3.18 3.38 3.37 3.47 3.58 3.66 RBK 2.68 2.65 3.02 3.51 3.59 3.53 FB 3.35 3.23 3.28 3.27 3.26 3.22 DCBB 3.68 3.72 3.89 3.90 3.91 3.81
Visible Uptick In NIMs
Source : Bank, HDFC sec Inst Research
CASA Rising Slowly But Steadily
Source : Bank, HDFC sec Inst Research
Peer SA Offerings IIB % < Rs 1mn 4.00 Rs 1 to 10mn 5.00 Rs 10-100mn 5.50 > Rs 100mn 6.00
YES % < Rs 0.1mn 5.00 Rs 0.1-10mn 6.00 > Rs 10mn 6.25
KMB % < Rs 0.1mn 5.00 > Rs 0.1mn 6.00 Source: Bank, HDFC sec Inst Research
AVERAGE COST OF SA
6.256.00
5.755.58
RBL YES IIB KMB
6.8 7.9
7.2 8.2 10
.0
12.0
11.1
13.1
14.9
13.5
11.2
10.3
11.4
10.3
9.9 11
.2
10.9
9.0 8.
8
10.5
2QFY
16
3QFY
16
4QFY
16
1QFY
17
2QFY
17
3QFY
17
4QFY
17
1QFY
18
2QFY
18
3QFY
18
SA (%) CA (%)
11.8
10.4
7.8
6.3
3.0 3.
9
-
2.0
4.0
6.0
8.0
10.0
12.0
14.0
2QFY
16
3QFY
16
4QFY
16
1QFY
17
2QFY
17
3QFY
17
4QFY
17
1QFY
18
2QFY
18
3QFY
18
Yield (%) CoF (%) NIM (%)
RBL BANK: INITIATING COVERAGE
Page | 16
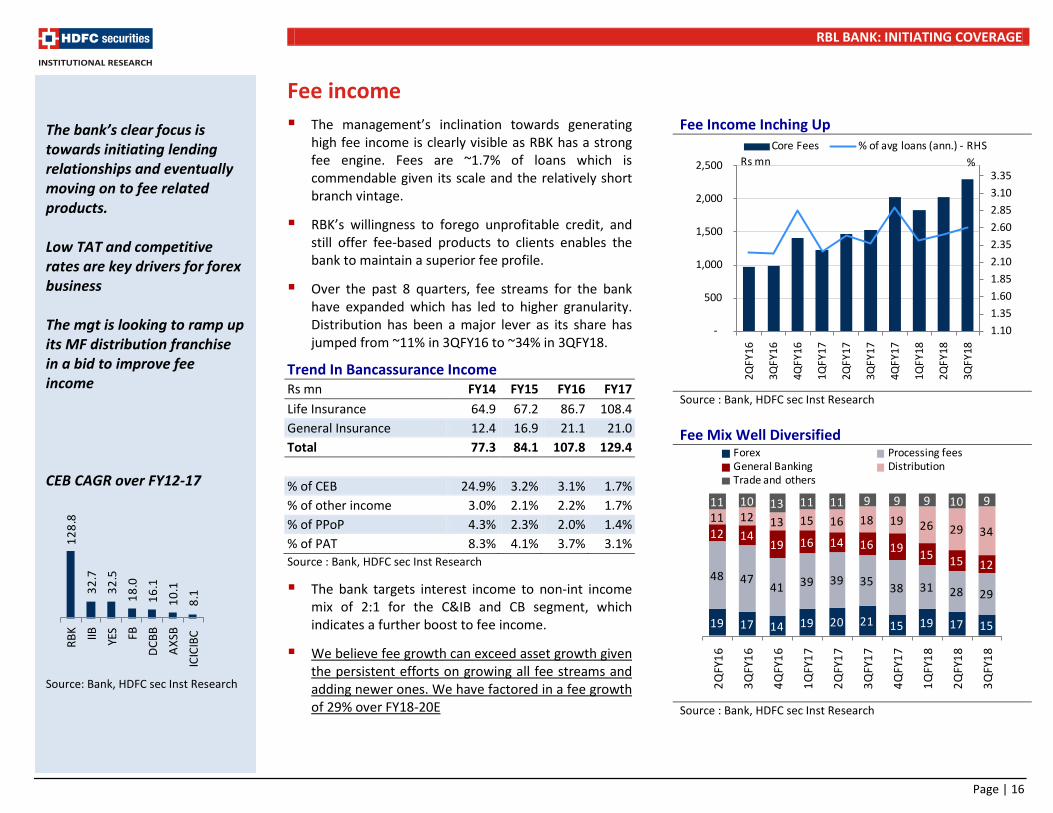
Fee income The management’s inclination towards generating
high fee income is clearly visible as RBK has a strong fee engine. Fees are ~1.7% of loans which is commendable given its scale and the relatively short branch vintage.
RBK’s willingness to forego unprofitable credit, and still offer fee-based products to clients enables the bank to maintain a superior fee profile.
Over the past 8 quarters, fee streams for the bank have expanded which has led to higher granularity. Distribution has been a major lever as its share has jumped from ~11% in 3QFY16 to ~34% in 3QFY18.
Trend In Bancassurance Income Rs mn FY14 FY15 FY16 FY17 Life Insurance 64.9 67.2 86.7 108.4 General Insurance 12.4 16.9 21.1 21.0 Total 77.3 84.1 107.8 129.4
% of CEB 24.9% 3.2% 3.1% 1.7% % of other income 3.0% 2.1% 2.2% 1.7% % of PPoP 4.3% 2.3% 2.0% 1.4% % of PAT 8.3% 4.1% 3.7% 3.1% Source : Bank, HDFC sec Inst Research
The bank targets interest income to non-int income mix of 2:1 for the C&IB and CB segment, which indicates a further boost to fee income.
We believe fee growth can exceed asset growth given the persistent efforts on growing all fee streams and adding newer ones. We have factored in a fee growth of 29% over FY18-20E
Fee Income Inching Up
Source : Bank, HDFC sec Inst Research
Fee Mix Well Diversified
Source : Bank, HDFC sec Inst Research
The bank’s clear focus is towards initiating lending relationships and eventually moving on to fee related products. Low TAT and competitive rates are key drivers for forex business The mgt is looking to ramp up its MF distribution franchise in a bid to improve fee income CEB CAGR over FY12-17
Source: Bank, HDFC sec Inst Research
128.
8
32.7
32.5
18.0
16.1
10.1
8.1
RBK IIB YES FB
DCBB
AXSB
ICIC
IBC
19 17 14 19 20 21 15 19 17 15
48 4741 39 39 35 38 31 28 29
12 1419 16 14 16 19 15 15 12
11 12 13 15 16 18 19 26 29 34
11 10 13 11 11 9 9 9 10 9
2QFY
16
3QFY
16
4QFY
16
1QFY
17
2QFY
17
3QFY
17
4QFY
17
1QFY
18
2QFY
18
3QFY
18
Forex Processing fees General Banking Distribution Trade and others
1.101.351.601.852.102.352.602.853.103.35
-
500
1,000
1,500
2,000
2,500
2QFY
16
3QFY
16
4QFY
16
1QFY
17
2QFY
17
3QFY
17
4QFY
17
1QFY
18
2QFY
18
3QFY
18
Core Fees % of avg loans (ann.) - RHS%Rs mn

RBL BANK: INITIATING COVERAGE
Page | 17
Fees as a % of advances
FY13 FY14 FY15 FY16 FY17 HDFCB 2.16% 1.89% 1.80% 1.67% 1.59% ICICIBC 1.88% 1.86% 1.80% 1.71% 1.73% AXISB 2.55% 2.34% 2.18% 1.98% 1.88% IIB 2.39% 2.35% 2.73% 2.84% 2.87% YES 2.29% 2.27% 2.62% 2.50% 2.37% RBK 0.27% 0.32% 1.80% 1.62% 1.67% FB 0.74% 0.76% 0.80% 0.76% 0.67% DCBB 1.36% 1.23% 1.14% 1.09% 1.05% Source: Bank, HDFC sec Inst Research Fees as a % of avg assets
FY13 FY14 FY15 FY16 FY17 HDFCB 1.40% 1.29% 1.22% 1.19% 1.12% ICICIBC 1.54% 1.71% 1.71% 1.69% 1.46% AXISB 1.91% 1.96% 1.74% 1.69% 1.51% IIB 1.98% 2.20% 2.44% 2.47% 2.42% YES 1.28% 1.49% 1.55% 1.63% 1.81% RBK 0.98% 1.40% 1.53% 1.30% 1.45% FB 0.70% 0.74% 0.79% 0.78% 0.75% DCBB 1.03% 0.96% 0.95% 1.01% 0.95% Source: Bank, HDFC sec Inst Research
RBL BANK: INITIATING COVERAGE
Page | 18
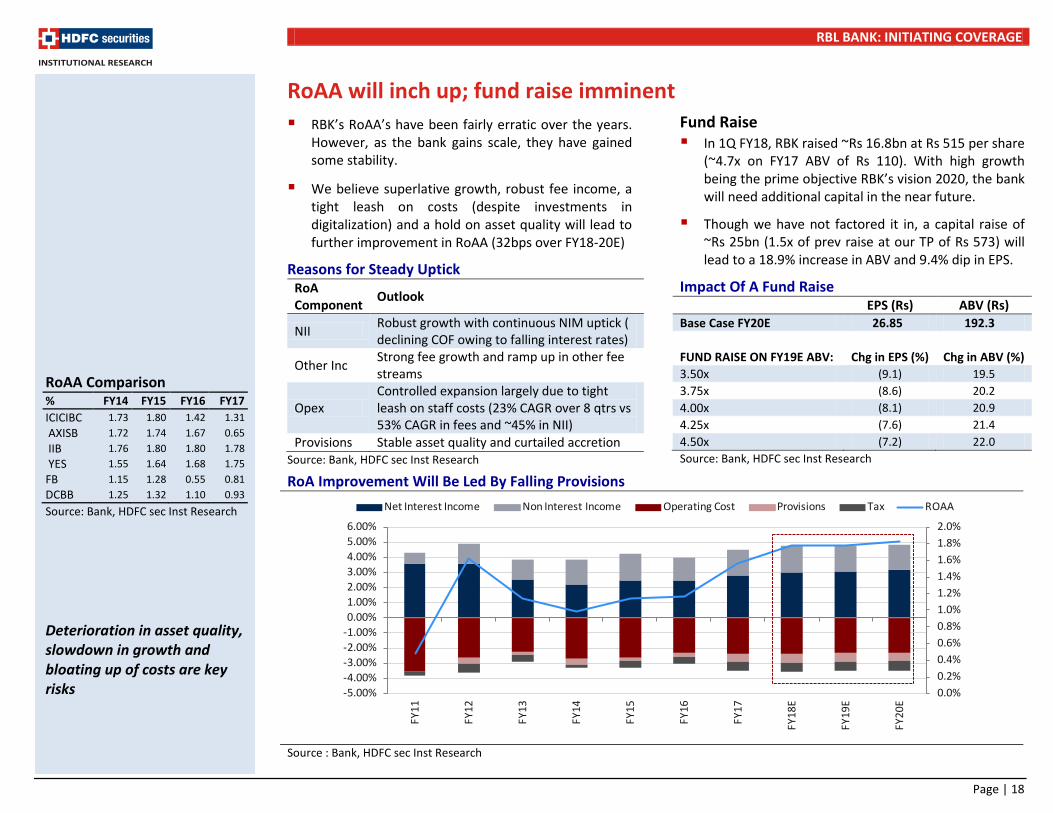
RoAA will inch up; fund raise imminent RBK’s RoAA’s have been fairly erratic over the years.
However, as the bank gains scale, they have gained some stability.
We believe superlative growth, robust fee income, a tight leash on costs (despite investments in digitalization) and a hold on asset quality will lead to further improvement in RoAA (32bps over FY18-20E)
Reasons for Steady Uptick RoA Component Outlook
NII Robust growth with continuous NIM uptick ( declining COF owing to falling interest rates)
Other Inc Strong fee growth and ramp up in other fee streams
Opex Controlled expansion largely due to tight leash on staff costs (23% CAGR over 8 qtrs vs 53% CAGR in fees and ~45% in NII)
Provisions Stable asset quality and curtailed accretion Source: Bank, HDFC sec Inst Research
Fund Raise In 1Q FY18, RBK raised ~Rs 16.8bn at Rs 515 per share
(~4.7x on FY17 ABV of Rs 110). With high growth being the prime objective RBK’s vision 2020, the bank will need additional capital in the near future.
Though we have not factored it in, a capital raise of ~Rs 25bn (1.5x of prev raise at our TP of Rs 573) will lead to a 18.9% increase in ABV and 9.4% dip in EPS.
Impact Of A Fund Raise
EPS (Rs) ABV (Rs) Base Case FY20E 26.85 192.3
FUND RAISE ON FY19E ABV: Chg in EPS (%) Chg in ABV (%) 3.50x (9.1) 19.5 3.75x (8.6) 20.2 4.00x (8.1) 20.9 4.25x (7.6) 21.4 4.50x (7.2) 22.0 Source: Bank, HDFC sec Inst Research
RoA Improvement Will Be Led By Falling Provisions
Source : Bank, HDFC sec Inst Research
RoAA Comparison % FY14 FY15 FY16 FY17 ICICIBC 1.73 1.80 1.42 1.31 AXISB 1.72 1.74 1.67 0.65 IIB 1.76 1.80 1.80 1.78 YES 1.55 1.64 1.68 1.75 FB 1.15 1.28 0.55 0.81 DCBB 1.25 1.32 1.10 0.93 Source: Bank, HDFC sec Inst Research
Deterioration in asset quality, slowdown in growth and bloating up of costs are key risks 0.0%
0.2%0.4%0.6%0.8%1.0%1.2%1.4%1.6%1.8%2.0%
-5.00%-4.00%-3.00%-2.00%-1.00%0.00%1.00%2.00%3.00%4.00%5.00%6.00%
FY11
FY12
FY13
FY14
FY15
FY16
FY17
FY18
E
FY19
E
FY20
E
Net Interest Income Non Interest Income Operating Cost Provisions Tax ROAA

RBL BANK: INITIATING COVERAGE
Page | 19
Management has skin in the game Since the induction of the new management team in
FY11, the bank has transformed from an old PVT sector bank, to a new age bank. The mgt has consistently delivered growth (loan CAGR of ~59% over FY10-17) and improved profitability Post the listing in Sept-16, the mgt has tirelessly worked towards achieving the goals set for the bank under ‘VIVION 2020'
VISION 2020 METRIC TARGET AS ON 3QFY18
Advances 30-35% 38% CASA Ratio
0.75-1% increase every year
Increase of 5.4% over FY16-3QFY18
Other Income 1/3 of total income 35.8%
C-I Ratio 51-52% 54%
ROA 1.5% 1.22% ann. Source: Bank, HDFC sec Inst Research
We believe that RBKs policy of rewarding employees heavily through ESOPs will in the banks favour. The management is aligned with the organisation’s objectives and will strive to achieve the same given that top executives hold significant equity in the bank. Additionally, prudence is paramount as the
bank is still relatively small and any major shocks could be detrimental for the bank
RBK’s ESOP Scheme mn FY14 FY15 FY16 FY16 O/S options as at beginning of FY 15.45 21.40 26.11 33.81
ADD: Granted 10.53 18.08 16.43 13.19
LESS: Exercised 3.58 11.30 6.28 13.48
LESS: Lapsed 1.00 2.07 2.45 2.54
Options outstanding 21.40 26.11 33.81 30.98
Number Of ESOPs Outstanding As A % Of Share Capital % FY14 FY15 FY16 FY17
RBK 7.9 8.9 10.4 8.3
HDFCB 3.9 4.4 5.1 3.6
ICICIBC 2.4 2.6 3.3 3.5
AXSB 2.3 1.8 1.5 1.2
IIB 3.1 2.9 2.2 2.0
YES 5.7 4.5 4.6 3.7
DCBB 4.1 3.9 3.1 3.6 Source: Bank, HDFC sec Inst Research

RBL BANK: INITIATING COVERAGE
Page | 20
View and valuation We believe RBK will continue its superlative growth
given its small and expanding client base. With an increasing focus on Retail/SME loans, granularity of the book is set to improve
Asset quality blips like the blow up in FI loans and slippage of one large account (~Rs 530mn in 3Q) are largely behind. Portfolio quality should remain stable hereon. RBK’s focus in shorter tenure loans and negligible restructured book provides additional comfort on asset quality
We believe that NIMs are set to expand for RBK as the share of retail loans continues to rise. Differential SA offerings will also keep low cost deposits buoyant and push CoF downwards
RBK’s robust fee profile is impressive despite being choosy on credit. Fees are largely driven by a flourishing forex franchise and a steady ramp up in distribution income. An increasing credit card base and the advent of MF distribution are future levers for growth
Initiate coverage with a BUY. Our TP of Rs 573 is 3x Mar-20 ABV of Rs 191.
Peer Comparison Charts
Source : Bank, HDFC sec Inst Research
RBKICICIBC
AXSB
IIB
FB DCBB
0.5
0.7
0.9
1.1
1.3
1.5
1.7
1.9
0.50 1.00 1.50 2.00 2.50 3.00 3.50
P/ABV FY20E
RoAA FY20E
ICICIBC
AXSB
IIB
RBK
DCBB
FB
0.0
5.0
10.0
15.0
20.0
25.0
30.0
35.0
- 0.50 1.00 1.50 2.00 2.50 3.00 3.50
P/ABV FY20E
Loan CAGR FY18-20E

RBL BANK: INITIATING COVERAGE
Page | 21
Five Quarters At A Glance Rs mn 3QFY17 4QFY17 1QFY18 2QFY18 3QFY18 YoY Growth QoQ Growth Net Interest Income 3,216 3,522 3,784 4,202 4,673 45.3% 11.2% Non Interest Income 1,823 2,366 2,569 2,411 2,582 41.7% 7.1% Core Fee Income 1,531 2,034 1,824 2,025 2,298 50.1% 13.5% Treasury Income 292 331 745 386 284 -2.6% -26.4% Operating Income 5,038 5,887 6,353 6,612 7,255 44.0% 9.7% Operating Expenses 2,687 3,070 3,239 3,581 3,921 45.9% 9.5% Pre provision Profits 2,351 2,818 3,114 3,032 3,334 41.8% 10.0% Other Provisions 362 821 945 749 823 127.6% 9.9% PBT 1,989 1,997 2,169 2,283 2,511 26.2% 10.0% Provision for Tax 703 695 759 776 858 22.1% 10.5% PAT 1,287 1,301 1,410 1,506 1,653 28.5% 9.8% APAT 1,287 1,301 1,410 1,506 1,653 28.5% 9.8% Other details Balance Sheet items/ratios Deposits Rs bn 300.1 345.9 354.3 365.7 386.2 28.7% 5.6%
CASA Deposits Rs bn 69.6 76.1 78.3 86.7 92.7 33.2% 7.0% Advances Rs bn 267.7 294.5 311.1 335.8 368.9 37.8% 9.9% CD Ratio (%) 89.2 85.1 87.8 91.8 95.5 628 bps 370 bps CAR (%) 14.6 13.7 13.4 16.6 15.9 136 bps -62 bps Tier I (%) 12.1 11.4 11.1 14.5 14.1 204 bps -33 bps Profitability Yield on Advances (%) 11.30 10.80 10.60 10.60 10.40 -90 bps -20 bps Cost of Funds (%) 6.90 6.70 6.50 6.40 6.30 -60 bps -10 bps NIM (%) 3.40 3.52 3.54 3.70 3.90 50 bps 20 bps Cost-Income (%) 53.3 52.1 51.0 54.2 54.0 71 bps -11 bps Tax Rate (%) 35.3 34.8 35.0 34.0 34.2 -115 bps 15 bps Asset quality Gross NPA (Rs mn) 2,847 3,568 4,578 4,872 5,799 103.7% 19.0% Net NPA (Rs mn) 1,396 1,899 2,504 2,608 3,578 156.3% 37.2% Gross NPAs (%) 1.06 1.20 1.46 1.44 1.56 50 bps 12 bps Net NPAs (%) 0.52 0.64 0.81 0.78 0.97 45 bps 19 bps Coverage Ratio calc. (%) 51.0 46.8 45.3 46.5 38.3 -1268 bps -818 bps Coverage Ratio reported (%) 61.0 59.6 58.0 58.3 53.5 -742 bps -473 bps Restructured book (%) 0.28 0.25 0.24 0.41 0.18 -10 bps -23 bps
Source: HDFC sec Inst Research
Driven by an uptick in loan growth (+38/10% YoY/QoQ) and a 20bps sequential NIM expansion
Fee growth driven by robust expansion of distribution income (+184/53% YoY/QoQ)
Other opex grew strongly (65/16% YoY/QoQ) as the bank continues to invest in technology
The differential rate offering has helped RBK to grow well, even on a high base (demonetisation)
Broad based growth with retail (+43% YoY) and corp (+35% YoY) contributing equally
Wholesale yields dipped 20bps QoQ to ~8.9% while retail yields jumped 30bps QoQ to ~13.2%
RBK plans to open ~50 branches over FY19
As per RBI divergence, one a/c of ~Rs 530mn from the agri sector was classified as NPA. The mgt expects this to be upgraded in 4Q

RBL BANK: INITIATING COVERAGE
Page | 22
Peer Valuations
BANK Mcap (Rs bn)
CMP (Rs) Rating TP
(Rs) ABV (Rs) P/E (x) P/ABV (x) ROAE (%) ROAA (%)
FY18E FY19E FY20E FY18E FY19E FY20E FY18E FY19E FY20E FY18E FY19E FY20E FY18E FY19E FY20E KMB # 2197 1154 BUY 1291 181 205 234 44.4 34.9 28.0 5.37 4.62 3.92 13.2 13.4 14.2 1.77 1.84 1.85 ICICIBC # 1811 282 BUY 363 100 125 145 19.0 11.7 8.3 1.91 1.38 1.07 7.0 9.9 10.0 0.80 1.07 1.22 AXSB 1323 506 NEU 587 211 260 293 41.6 18.6 13.1 2.40 1.94 1.72 5.1 9.9 12.7 0.49 0.96 1.18 IIB 1079 1814 BUY 1,966 379 443 524 30.2 24.3 19.3 4.79 4.09 3.46 16.5 17.6 19.0 1.80 1.79 1.82 RBL 211 506 BUY 573 156 171 191 32.7 24.9 19.4 3.25 2.96 2.65 11.7 12.1 13.9 1.19 1.25 1.27 FB 188 97 BUY 127 57 63 71 18.7 15.0 11.7 1.70 1.54 1.37 9.5 9.9 11.6 0.80 0.85 0.93 CUB 119 180 BUY 212 56 66 77 19.6 17.1 14.8 3.22 2.73 2.34 15.8 15.5 15.5 1.64 1.63 1.58 KVB 78 107 BUY 157 63 71 79 20.8 15.6 8.8 1.70 1.51 1.36 6.6 7.8 13.3 0.57 0.68 1.08 DCBB 60 195 BUY 205 78 88 98 24.4 18.9 15.3 2.49 2.22 1.98 9.8 10.8 12.0 0.90 0.95 0.97 SBIN # 2161 241 BUY 333 80 137 175 -101.3 10.2 5.1 1.72 1.00 0.78 -0.6 5.4 10.0 -0.04 0.35 0.64 BOB 331 143 BUY 192 65 109 148 49.2 17.4 9.2 2.22 1.32 0.97 2.0 5.0 8.9 0.11 0.29 0.51 AUSFB 187 653 NEU 585 73 88 104 61.3 45.9 36.3 8.89 7.40 6.28 14.3 16.5 17.9 2.04 2.03 1.89 Equitas 51 151 NEU 165 64 66 72 177.6 40.4 20.4 2.36 2.27 2.09 1.3 5.5 10.0 0.28 1.01 1.33 Ujjivan 47 392 BUY 440 144 158 176 NA 28.6 20.6 2.71 2.49 2.23 -0.2 9.0 11.4 -0.15 1.55 1.75
Source: Company, HDFC sec Inst Research, # Adjusted for subsidiaries value
RBL BANK: INITIATING COVERAGE
Page | 23
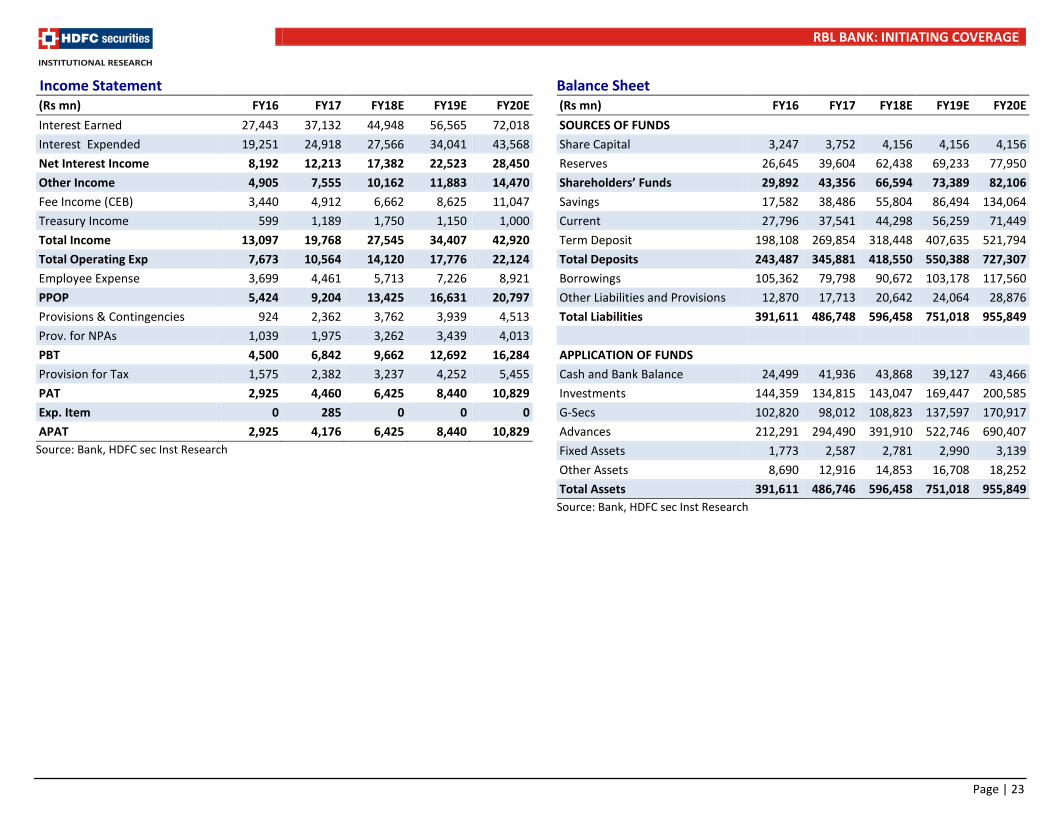
Income Statement (Rs mn) FY16 FY17 FY18E FY19E FY20E Interest Earned 27,443 37,132 44,948 56,565 72,018 Interest Expended 19,251 24,918 27,566 34,041 43,568 Net Interest Income 8,192 12,213 17,382 22,523 28,450 Other Income 4,905 7,555 10,162 11,883 14,470 Fee Income (CEB) 3,440 4,912 6,662 8,625 11,047 Treasury Income 599 1,189 1,750 1,150 1,000 Total Income 13,097 19,768 27,545 34,407 42,920 Total Operating Exp 7,673 10,564 14,120 17,776 22,124 Employee Expense 3,699 4,461 5,713 7,226 8,921 PPOP 5,424 9,204 13,425 16,631 20,797 Provisions & Contingencies 924 2,362 3,762 3,939 4,513 Prov. for NPAs 1,039 1,975 3,262 3,439 4,013 PBT 4,500 6,842 9,662 12,692 16,284 Provision for Tax 1,575 2,382 3,237 4,252 5,455 PAT 2,925 4,460 6,425 8,440 10,829 Exp. Item 0 285 0 0 0 APAT 2,925 4,176 6,425 8,440 10,829
Source: Bank, HDFC sec Inst Research
Balance Sheet (Rs mn) FY16 FY17 FY18E FY19E FY20E SOURCES OF FUNDS Share Capital 3,247 3,752 4,156 4,156 4,156 Reserves 26,645 39,604 62,438 69,233 77,950 Shareholders’ Funds 29,892 43,356 66,594 73,389 82,106 Savings 17,582 38,486 55,804 86,494 134,064 Current 27,796 37,541 44,298 56,259 71,449 Term Deposit 198,108 269,854 318,448 407,635 521,794 Total Deposits 243,487 345,881 418,550 550,388 727,307 Borrowings 105,362 79,798 90,672 103,178 117,560 Other Liabilities and Provisions 12,870 17,713 20,642 24,064 28,876 Total Liabilities 391,611 486,748 596,458 751,018 955,849
APPLICATION OF FUNDS Cash and Bank Balance 24,499 41,936 43,868 39,127 43,466 Investments 144,359 134,815 143,047 169,447 200,585 G-Secs 102,820 98,012 108,823 137,597 170,917 Advances 212,291 294,490 391,910 522,746 690,407 Fixed Assets 1,773 2,587 2,781 2,990 3,139 Other Assets 8,690 12,916 14,853 16,708 18,252 Total Assets 391,611 486,746 596,458 751,018 955,849 Source: Bank, HDFC sec Inst Research

RBL BANK: INITIATING COVERAGE
Page | 24
Key Ratios
FY16 FY17 FY18E FY19E FY20E Valuation Ratios EPS 9.0 11.1 15.5 20.3 26.1 Earnings Growth (%) 41.2 42.8 53.9 31.4 28.3 BVPS (ex reval.) 92.0 115.5 160.2 176.6 197.5 Adj. BVPS (ex reval. and 100% cover) 88.2 110.4 155.7 171.2 191.0 DPS (Rs) 1.5 1.8 2.5 3.3 4.2 ROAA (%) 0.88 0.95 1.19 1.25 1.27 ROAE (%) 11.2 12.2 11.7 12.1 13.9 P/E (x) 56.2 45.5 32.7 24.9 19.4 P/ABV (x) 5.74 4.58 3.25 2.95 2.65 P/PPOP (x) 30.3 20.6 15.7 12.6 10.1 Dividend Yield (%) 0.3 0.4 0.5 0.7 0.8 Profitability Yield on Advances (%) 10.95 10.42 10.14 9.89 9.69 Yield on Investment (%) 6.14 7.03 6.95 6.90 6.85 Cost of Funds (%) 6.83 6.35 5.82 5.78 5.95 Cost of Deposits (%) 7.27 6.65 6.26 6.13 6.02 Core Spread (%) 4.12 4.07 4.32 4.11 3.74 NIM (%) 2.65 3.02 3.51 3.59 3.53 Operating Efficiency Cost/Avg. Asset Ratio (%) 2.32 2.41 2.61 2.64 2.59 Cost-Income Ratio (Excl Treasury) 61.39 56.86 54.74 53.45 52.78 Balance Sheet Structure Ratios Loan Growth (%) 46.9 38.7 33.1 33.4 32.1 Deposit Growth (%) 42.4 42.1 21.0 31.5 32.1 C/D Ratio (%) 87.2 85.1 93.6 95.0 94.9 Equity/Assets (%) 7.6 8.9 11.2 9.8 8.6 Equity/Loans (%) 14.1 14.7 17.0 14.0 11.9 CASA (%) 18.6 22.0 23.9 25.9 28.3 Total Capital Adequacy Ratio (CAR) 12.9 13.7 16.3 14.1 12.3 Tier I CAR 11.1 11.4 14.4 12.6 11.1
FY16 FY17 FY18E FY19E FY20E Asset Quality Gross NPLs (Rs mn) 2,081 3,568 5,121 6,092 7,278 Net NPLs (Rs mn) 1,245 1,900 1,880 2,204 2,691 Gross NPLs (%) 0.98 1.20 1.31 1.17 1.05 Net NPLs (%) 0.59 0.64 0.48 0.42 0.39 Slippages (%) 1.12 2.11 1.70 1.50% 1.25 Coverage Ratio (%) 40.2 46.8 63.3 63.8 63.0 Provision/Avg. Loans (%) 0.45 0.60 0.82 0.64 0.55 RoAA Tree Net Interest Income 2.47% 2.78% 3.21% 3.34% 3.33% Non Interest Income 1.48% 1.72% 1.88% 1.76% 1.70% Treasury Income 0.18% 0.27% 0.32% 0.17% 0.12% Operating Cost 2.32% 2.41% 2.61% 2.64% 2.59% Provisions 0.28% 0.54% 0.69% 0.58% 0.53% Provisions for NPAs 0.24% 0.35% 0.52% 0.43% 0.39% Tax 0.48% 0.54% 0.60% 0.63% 0.64% ROAA 0.88% 1.02% 1.19% 1.25% 1.27% Leverage (x) 12.70 11.99 9.85 9.63 10.98 ROAE 11.21% 12.18% 11.69% 12.06% 13.93% Source: Bank, HDFC sec Inst Research

RBL BANK: INITIATING COVERAGE
Page | 25
Rating Definitions BUY : Where the stock is expected to deliver more than 10% returns over the next 12 month period NEUTRAL : Where the stock is expected to deliver (-)10% to 10% returns over the next 12 month period SELL : Where the stock is expected to deliver less than (-)10% returns over the next 12 month period
Date CMP Reco Target 23-Apr-18 506 BUY 573
RECOMMENDATION HISTORY
400
450
500
550
600
650
Apr-
17
May
-17
Jun-
17
Jul-1
7
Aug-
17
Sep-
17
Oct
-17
Nov
-17
Dec-
17
Jan-
18
Feb-
18
Mar
-18
Apr-
18
RBL Bank TP

RBL BANK: INITIATING COVERAGE
Page | 26
Disclosure: We, Pranav Gupta, ACA & Darpin Shah, MBA, authors and the names subscribed to this report, hereby certify that all of the views expressed in this research report accurately reflect our views about the subject issuer(s) or securities. HSL has no material adverse disciplinary history as on the date of publication of this report. We also certify that no part of our compensation was, is, or will be directly or indirectly related to the specific recommendation(s) or view(s) in this report. Research Analyst or his/her relative or HDFC Securities Ltd. does not have any financial interest in the subject company. Also Research Analyst or his relative or HDFC Securities Ltd. or its Associate may have beneficial ownership of 1% or more in the subject company at the end of the month immediately preceding the date of publication of the Research Report. Further Research Analyst or his relative or HDFC Securities Ltd. or its associate does not have any material conflict of interest. Any holding in stock –No HDFC Securities Limited (HSL) is a SEBI Registered Research Analyst having registration no. INH000002475. Disclaimer: This report has been prepared by HDFC Securities Ltd and is meant for sole use by the recipient and not for circulation. The information and opinions contained herein have been compiled or arrived at, based upon information obtained in good faith from sources believed to be reliable. Such information has not been independently verified and no guaranty, representation of warranty, express or implied, is made as to its accuracy, completeness or correctness. All such information and opinions are subject to change without notice. This document is for information purposes only. Descriptions of any company or companies or their securities mentioned herein are not intended to be complete and this document is not, and should not be construed as an offer or solicitation of an offer, to buy or sell any securities or other financial instruments. This report is not directed to, or intended for display, downloading, printing, reproducing or for distribution to or use by, any person or entity who is a citizen or resident or located in any locality, state, country or other jurisdiction where such distribution, publication, reproduction, availability or use would be contrary to law or regulation or what would subject HSL or its affiliates to any registration or licensing requirement within such jurisdiction. If this report is inadvertently send or has reached any individual in such country, especially, USA, the same may be ignored and brought to the attention of the sender. This document may not be reproduced, distributed or published for any purposes without prior written approval of HSL. Foreign currencies denominated securities, wherever mentioned, are subject to exchange rate fluctuations, which could have an adverse effect on their value or price, or the income derived from them. In addition, investors in securities such as ADRs, the values of which are influenced by foreign currencies effectively assume currency risk. It should not be considered to be taken as an offer to sell or a solicitation to buy any security. HSL may from time to time solicit from, or perform broking, or other services for, any company mentioned in this mail and/or its attachments. HSL and its affiliated company(ies), their directors and employees may; (a) from time to time, have a long or short position in, and buy or sell the securities of the company(ies) mentioned herein or (b) be engaged in any other transaction involving such securities and earn brokerage or other compensation or act as a market maker in the financial instruments of the company(ies) discussed herein or act as an advisor or lender/borrower to such company(ies) or may have any other potential conflict of interests with respect to any recommendation and other related information and opinions. HSL, its directors, analysts or employees do not take any responsibility, financial or otherwise, of the losses or the damages sustained due to the investments made or any action taken on basis of this report, including but not restricted to, fluctuation in the prices of shares and bonds, changes in the currency rates, diminution in the NAVs, reduction in the dividend or income, etc. HSL and other group companies, its directors, associates, employees may have various positions in any of the stocks, securities and financial instruments dealt in the report, or may make sell or purchase or other deals in these securities from time to time or may deal in other securities of the companies / organizations described in this report. HSL or its associates might have managed or co-managed public offering of securities for the subject company or might have been mandated by the subject company for any other assignment in the past twelve months. HSL or its associates might have received any compensation from the companies mentioned in the report during the period preceding twelve months from t date of this report for services in respect of managing or co-managing public offerings, corporate finance, investment banking or merchant banking, brokerage services or other advisory service in a merger or specific transaction in the normal course of business. HSL or its analysts did not receive any compensation or other benefits from the companies mentioned in the report or third party in connection with preparation of the research report. Accordingly, neither HSL nor Research Analysts have any material conflict of interest at the time of publication of this report. Compensation of our Research Analysts is not based on any specific merchant banking, investment banking or brokerage service transactions. HSL may have issued other reports that are inconsistent with and reach different conclusion from the information presented in this report. Research entity has not been engaged in market making activity for the subject company. Research analyst has not served as an officer, director or employee of the subject company. We have not received any compensation/benefits from the subject company or third party in connection with the Research Report. HDFC securities Limited, I Think Techno Campus, Building - B, "Alpha", Office Floor 8, Near Kanjurmarg Station, Opp. Crompton Greaves, Kanjurmarg (East), Mumbai 400 042 Phone: (022) 3075 3400 Fax: (022) 2496 5066 Compliance Officer: Binkle R. Oza Email: [email protected] Phone: (022) 3045 3600 HDFC Securities Limited, SEBI Reg. No.: NSE-INB/F/E 231109431, BSE-INB/F 011109437, AMFI Reg. No. ARN: 13549, PFRDA Reg. No. POP: 04102015, IRDA Corporate Agent License No.: HDF 2806925/HDF C000222657, SEBI Research Analyst Reg. No.: INH000002475, CIN - U67120MH2000PLC152193 Mutual Funds Investments are subject to market risk. Please read the offer and scheme related documents carefully before investing.

RBL BANK: INITIATING COVERAGE
Page | 27
HDFC securities Institutional Equities Unit No. 1602, 16th Floor, Tower A, Peninsula Business Park, Senapati Bapat Marg, Lower Parel, Mumbai - 400 013 Board : +91-22-6171 7330 www.hdfcsec.com