innovating for development
TRANSCRIPT

I N T E R N AT I O N A L D E V E L O P M E N T R E S E A R C H C E N T R EI N T E R N AT I O N A L D E V E L O P M E N T R E S E A R C H C E N T R E
Annual Report 2010–2011
Innovating for development

Research and innovation hold the keys to progressin developing countries. Our programs respond to evolving priorities in a fast-changing world byfostering science and innovation ...
... strengthening health systems ...
M e e t i n g O u R O b j e c t i v e s c
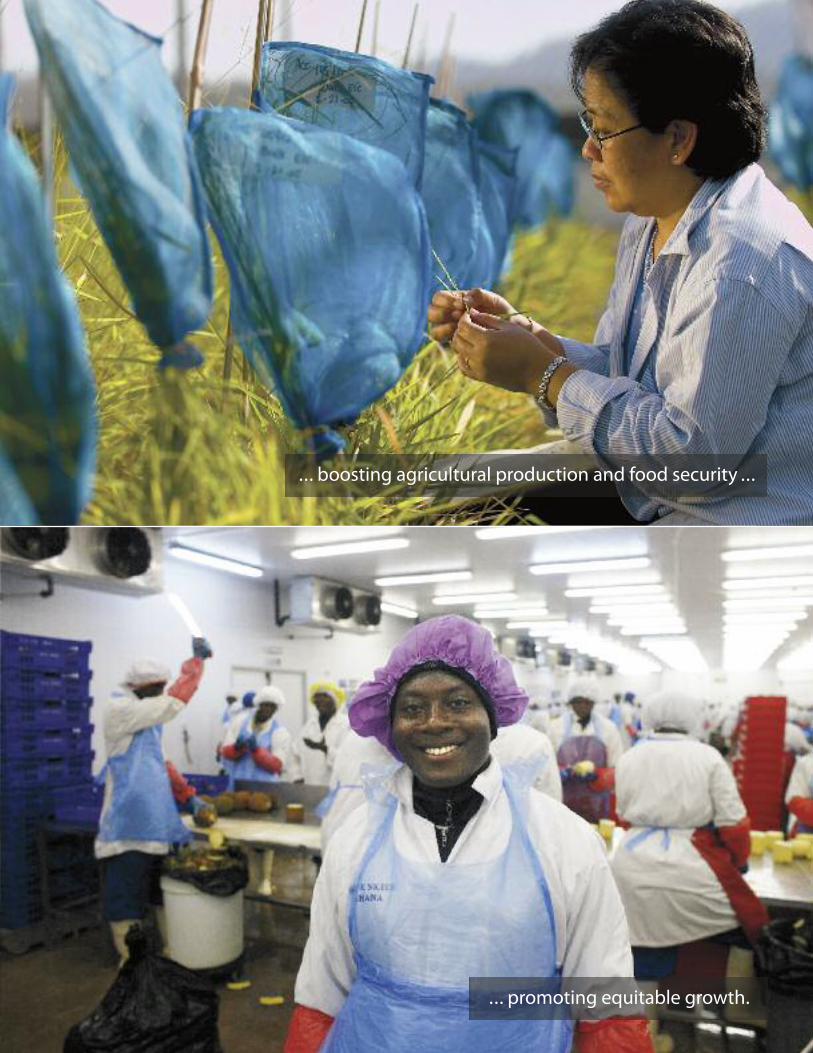
... boosting agricultural production and food security ...
... promoting equitable growth.

d i d R c a n n u a l R e p O R t 2 0 1 0 – 2 0 1 1
Working with some of the brightest minds in the world, we focus on achieving results.Our efforts lead to healthier people ...
... higher incomes ...

... cleaner environments ...
... responsible governments.

Innovating for development 2010–2011
cuRt
ca
RneM
aRk
/ W
ORl
d b
an
k
$248.8 million in revenues• $195.6 million from parliament• $50.9 million from donor contributions• $2.3 million other revenue
3.9% of canada’s international assistance
$210.2 million for new research activities
16 donor partners
924 research activities
766 institutions supported, 103 canadian
150 awardees
idRc supports research in developing countries to reduce poverty, the goal of canada’s
international development efforts. We promote growth and development and encourage
sharing knowledge with policymakers, other researchers, and communities around the
world. the result is innovative, lasting local — and global — solutions that aim to bring
choice and change to those who need it most.
all monetary amounts in this annual Report are in canadian dollars unless otherwise stated.
On the cover: Working to ensure food security: cassava experimental station near luang prabang, laos.

M e e t i n g O u R O b j e c t i v e s 1M e e t i n g O u R O b j e c t i v e s 1
2 Message from the Chairman
3 Message from the President
4 The year in review
6 FOCUSING ON PRIORITIESengaging canadians in development
8 IDRC AT 40celebrating four decades of research for development
11 MEETING OUR OBJECTIVESa three-pronged approach to fulfilling our mandaten new knowledge, bold solutionsn skilled researchers, robust institutionsn sound decisions, strong societies
19 OUR PROGRAMS
promoting growth, reducing poverty
22 BOARD OF GOVERNORScorporate governance
25 MANAGING AND MEASURING OUR PERFORMANCEstewardship and accountability
52 Financial statements
72 How to reach us
contents
COVER
: nei
l pa
lMeR
/ ci
at, INTE
RIOR PH
OTO
S: s
ven
tO
Rfin
n /
pan
Os,
iRRi
, gia
cOM
O p
iRO
zzi /
pa
nO
s,
jan
e H
aH
n /
pan
Os,
gia
cOM
O p
iRO
zzi /
pa
nO
s, p
eteR
ben
net
t / i
dRc
, ed
ua
RdO
Ma
Rtin
O /
pan
Os,
la
na
sle
zic
/ pa
nO
s

2 i d R c a n n u a l R e p O R t 2 0 1 0 – 2 0 1 1
Turning vision into action
In 2010–2011, IDRC began to implementits new Strategic Framework 2010–2015,Innovating for Development. The thrust ofthe plan is to ensure that IDRC’s researchis aligned with Canadian values andCanadian Government priorities whileresponding to the ever-changing concernsof the world’s poor regions. This is easier
said than done given the quickening pace of change andthe innovation required to meet constantly shiftingcircumstances in the developing world.
IDRC’s work is continually being adjusted to confront themost urgent priorities of developing countries, throughsupporting research that is directly related to improvingpeople’s lives. Our Board of Governors was fully engagedin overseeing management’s excellent efforts in bringingthis plan to life.
To meet our obligations as overseers, governors workedclosely with the senior management team but also used a number of tools to measure the impact of the overallprogram and its elements. The Board examined a numberof external reviews, concept notes, and five-year programprospectuses designed to modify the thrust of the Centre’sresearch funding to increase its relevance whereverpossible. The Board approved the creation of two newresearch programs within our Social and Economicprogram area: Supporting Inclusive Growth, andGovernance, Security, and Justice.
Reorienting programming directions every five years is important if IDRC is to stay relevant and effective. The exercise is also challenging, and both governors andmanagement brought vigour and dedication to thiscomplex task.
Streamlined Board
In line with a Canadian Government initiative to trim thesize of Crown corporation boards, IDRC’s Board wasreduced from 21 governors to 18. In fact, as of spring 2011our Board is short of its complement of 18 members, due
to the expiry of five members’ terms just before theCanadian federal election. The Board is working with thenew Minister of Foreign Affairs to ensure that somegovernors are reappointed and that other new andequally well-qualified governors are selected to bring usup to full strength.
We said a fond goodbye to international governors RoryStewart, who resigned to take up new responsibilities inthe British House of Commons, and Francisco Sagasti,who served for 12 years on the Board and had beenassociated with IDRC for many decades. We also saidfarewell to Jocelyn Coulon, whose term ended after fouryears of thoughtful contributions. I join everyoneassociated with IDRC in thanking all of our governors,past and present, for their dedication, wisdom, and service.
Special visitors
On March 23, His Excellency the Right Honourable David Johnston, Governor General of Canada, honouredIDRC by visiting its Ottawa headquarters.
His Excellency took advantage of the regular meeting ofIDRC’s Board to engage in a lively discussion abouteducation, research, and innovation. At his installation in2010 he had highlighted learning and innovation as pillarsof his landmark “call to serve.” His visit was mostappropriate, given the close alignment of his vision andIDRC’s objectives.
We were also honoured during our June 22 Board meetingby the visit of the Minister of Foreign Affairs, theHonourable John Baird, and the Minister of InternationalCooperation, the Honourable Beverley Oda. We greatlyappreciate their interest in IDRC. �
The Honourable Barbara McDougallChairman
Message from the chairman

i d R c a n n u a l R e p O R t 2 0 1 0 – 2 0 1 1 3
IDRC experienced an exciting 2010, marking its 40thanniversary in a variety of ways. We engaged Parliamentaround the visit of South African Minister Trevor Manuel,who served for 13 years as his country’s finance ministerand currently plays a prominent role in the G-20. Hespoke of the important role Canada’s government askedIDRC to play during the transition between the apartheidregime and the Mandela government.
This year also marked the start of a new five-yearprogramming cycle that advances Canada’s priorities ininternational development, notably in the fields of foodsecurity and maternal and child health.
Further to Canada’s commitments at the 2009 L’Aquila G-8Summit, IDRC and the Canadian International DevelopmentAgency (CIDA) launched an ambitious partnership topromote global food security through applied agriculturaland nutrition research — with an emphasis on womensmallholder farmers — linking Canadian teams withcolleagues in the developing world. Three major rounds of competitive applications have been received andadjudicated, leading to new work to identify and developunder-researched “orphan” crops, and improved post-harvest technologies, value-chains, and market analysis.
IDRC moved swiftly to support Canada’s priority ofmaternal and child health following the 2010 G-8 Summit.The Development Innovation Fund, a signature initiativeof the Government, overseen by IDRC and implementedby Grand Challenges Canada, identified this as a centralpriority for its competitive research. Likewise, maternaland child health is a key part of the Global HealthResearch Initiative, a partnership among IDRC, CIDA, theCanadian Institutes of Health Research, Health Canada,and the Public Health Agency of Canada.
IDRC was honoured to be asked to oversee Canada’scontribution to the Next Einstein Initiative to createcentres of excellence that provide African students withthe most advanced teaching available globally. Theinitiative builds upon the success of the African Institutefor Mathematical Sciences in Cape Town, championed byNeil Turok, Director of the Perimeter Institute forTheoretical Physics. Following the G-8 Summit, PrimeMinister Harper announced the Government’s support of the Initiative at an event in Waterloo, Ontario, thatfeatured renowned physicist Stephen Hawking and MPs from the area.
IDRC continues to lead innovative, ground-level work onlocal approaches to adapting to climate change in Africa,in partnership with the UK’s Department for InternationalDevelopment (DFID). This work received a further boostas part of Canada’s commitment under the CopenhagenAccord. An additional $10 million is supporting sevencentres of excellence in Africa to conduct research andhelp the most vulnerable adapt to climate change.
Our efforts to strengthen local policy-relevant researchadvanced further through the Think Tank Initiative,supporting 52 institutions in 23 countries of LatinAmerica, Africa, and South Asia. IDRC leads a consortiumof donors that has grown to include the William and FloraHewlett Foundation, the Bill & Melinda Gates Foundation,DFID, and the Netherlands Directorate-General forInternational Cooperation, with total funding of $113 million for the Initiative’s first phase up to 2014.
In sum, during 2010 IDRC redoubled its commitment topolicy development throughout the Global South, throughresults on issues that resonate with Canadians. We areprivileged, in this way, to serve the Government andParliament of Canada. n
David M. MalonePresident and Chief Executive Officer
Message from the president
David Malone (right) in conversation with Nobel Laureate
Amartya Sen during one of IDRC’s Speakers of Renown events.
den
ise
leip

4 i d R c a n n u a l R e p O R t 2 0 1 0 – 2 0 1 1
A Crown corporation, IDRC supports research in developingcountries to promote growth, reduce poverty, and improvelives. This year marked our 40th anniversary. It was also thefirst year under our Strategic Framework 2010–2015.
That document is the result of extensive reflection and consultation to ensure that our programming responds toevolving needs in developing countries and puts our resources to their best use. We took a hard look at the worldin which we operate, our strengths and weaknesses, and the priorities of Canada’s international development, innovation, and science and technology agendas. Theseconsiderations guided us as we set new directions to reachour objectives over the next five years.
New priorities for our programs include a greater focus onagriculture and climate change, food security, chronic diseases,and inclusive growth — all increasingly important issues.
During the past year, we received $195.6 million in Parlia-mentary appropriation revenues. This represented about78.6% of our 2010–2011 revenues and 3.9% of Canada’sinternational assistance. At the end of 2010–2011, we weresupporting 924 research activities.
IDRC joins forces with Canadian Government and inter-national funders to increase the resources for research that addresses the needs of developing countries. As ofMarch 31, 2011, we were involved in 34 donor agreementsworth $281.4 million. We also work with other Canadianagencies to create opportunities for researchers fromCanada and the developing world to collaborate onresearch of common interest.
IDRC’s head office is in Ottawa. Six regional offices acrossthe developing world ensure the relevance of our activitiesand provide direct contact with researchers and policy-makers in Africa, Asia, Latin America and the Caribbean,and the Middle East. n
SUMMARY OF OPERAT IONS
the year in review
Corporate profile
Corporate A&E ICT4D IPS RHE SEP Total
asia 868 15 924 4 401 2 654 1 225 24 224 49 296
global 8 066 2 930 532 12 583 1 770 2 214 28 095
latin america and the caribbean 4 017 16 793 5 136 35 720 19 341 46 042
Middle east and north africa 2 222 1 143 322 180 0 2 208 6 075
sub-saharan africa 3 275 31 322 6 493 18 278 15 020 6 267 80 655
Total 18 448 68 112 16 884 33 730 18 735 54 254 210 163a
Research activities in 2010–2011Project allocations by area of impact and by program area ($000)
a this includes $127.494 million funded by parliament and $82.669 million funded by donor contributions.
Corporate: includes the activities of the specialinitiatives and donor partnerships divisions, corporate strategy and Regional Management branch (including the communications division,evaluation unit, and policy and planning group), Regional activity funds, and forward-planning fund.
A&E: agriculture and environment
ICT4D: information and communication technologies for development
IPS: innovation, policy, and science
RHE: Research for Health equity
SEP: social and economic policy

s u M M a R Y O f O p e R at i O n s 5
SINGAPORE
DAKAR
NEW DELHICAIRO
MONTEVIDEO
NAIROBI
IDRC offices and allocations by region
allocations ($000)
28,09513.4% of total
Research activities
245
Sub-Saharan Africa
allocations ($000)
80,65538.4% of total
Research activities
285
Latin America and the Caribbean
allocations ($000)
46,04221.8% of total
Research activities
137
Middle East and North Africa
allocations ($000)
6,0752.9% of total
Research activities
78
Asia
allocations ($000)
49,29623.5% of total
Research activities
179
2010–2011 2009–2010
Actual Revised budget Actual
Revenuesparliamentary appropriations 195 616 196 182 174 041donor contributions
funding for development research programming 46 299 48 490 35 109Recovery of administrative costs 4 623 4 925 3 842
investment and other income 2 300 1 527 1 469
248 838 251 124 214 461
Expensesdevelopment research programming
Research projects 144 502 141 489 136 269capacity building 50 549 54 069 50 867
195 051 195 558 187 136
corporate and administrative services 24 048 25 235 23 811
219 099 220 793 210 947
Net results 29 739 30 331 3 514
EquityRetained earnings 46 598 47 211 16 859accumulated other comprehensive income 6 (30) (30)
Expenditure benchmarks 66/23/11 64/25/11 65/24/11
Program allocationsfunded by parliamentary appropriations 127 494a 129 147a 308 294a
funded by donor contributions 82 669 85 788 49 046
210 163 214 935 357 340
Key financial highlightsfor the year ended 31 March 2011 (in thousands of dollars)
Notes:a program allocations (grants) include total
allocations for program areas and corporateactivities as well as the allocations for the institute for connectivity in the americas.
� the parliamentary appropriations represent78.6% of total revenues.
� the expenses for development research programming and capacity building represent89.0% of total expenses.
for further information on these key financialhighlights, please refer to Management’s discussion and analysis on page 34.
Global
OTTAWA

6 i d R c a n n u a l R e p O R t 2 0 1 0 – 2 0 1 1
IDRC’s goal: to reduce poverty. To do so, we also engagesome of the brightest minds in Canada and the developingworld to collaborate on cutting-edge projects. These leadto higher crop yields, better health, more jobs and marketaccess, fairer laws and more accountable governments —to brighter futures.
In pursuing these goals we often join forces with CanadianGovernment departments and agencies on programs ofmutual interest that are aligned with Canadian values andCanadian Government priorities. For example, we workwith the Canadian Institutes of Health Research (CIHR),the Natural Sciences and Engineering Research Council,and the Social Sciences and Humanities Research Council(SSHRC) on the International Research Initiative onAdaptation to Climate Change. Launched in December2009, this initiative marked the first time that IDRC andthe three granting councils joined together in a collabora-tive enterprise. The effort supports the formation ofmultinational teams from Canada and low- and middle-income countries to advance knowledge, shape policiesand programs, and mentor students.
Four new projects were launched in 2010–2011:
African Institute for Mathematical Sciences
Also known as the Next Einstein Initiative, this project aimsto create a pan-African network of 15 centres of excellence inmathematics, technology, and science over the next decade.IDRC is administering Canada’s $20 million contribution,which supports the establishment of five such centres acrossAfrica by 2015. Prime Minister Stephen Harper announcedthe new federal funding in July 2010 as a central element of a partnership between Canadian universities, the private sector, and African governments.
Canadian International Food Security Research Fund
A joint initiative with the Canadian International Develop-ment Agency (CIDA), the Canadian International Food Security Research Fund finances a wide variety of applied
research projects that aim to solve food security challengesin developing countries by promoting more productive andsustainable agricultural systems. The five-year $62 millionproject supports partnerships between research organiza-tions in Canada and those in developing countries. Food security is a priority of Canadian aid efforts.
Development Innovation Fund
IDRC is the Government of Canada’s lead agency for its$225 million Development Innovation Fund, announced inthe 2008 federal budget and launched in May 2010. Thisfive-year initiative brings together Canadian and develop-ing-country scientists, and the private sector, to tackle persistent health challenges facing poor countries. Thenon-profit Grand Challenges Canada was created to imple-ment the project. CIHR is also collaborating.
Three programs are now underway: on technologies forpoint-of-care diagnostics, promising ideas on global health,and improving maternal and child health. Future programswill focus on non-communicable diseases and a topic to befinalized. IDRC President David Malone sits on the boardof directors of Grand Challenges Canada.
FOCUS ING ON PR IOR I T I ES
engaging canadians in development
Joining forces to advance Canada’s foreign policy goals
IDRC’s Chairman, the Hon. Barbara McDougall, welcomed the Minister of Foreign Affairs, the Hon. John Baird, to the Centre on June 22. The Minister of International Cooperation, the Hon. Beverley Oda, also attended.
idRc

f O c u s i n g O n p R i O R i t i e s 7
African Adaptation Research Centres Initiative
Building on the innovative work carried out under the Climate Change Adaptation in Africa program, this $10 million project — funded through Canada’s fast-startclimate change financing — will increase the ability ofAfrican research centres to deliver timely scientific adviceand assessments on climate change adaptation. The goal:better informed policies and well-targeted investments. This new funding is part of Canada's commitment to provideclimate change financing under the Copenhagen Accord.
In addition, IDRC and the SSHRC collaborate on the $8 million International Community-University Research Alliance program through which community organizationsand universities in Canada are teaming up with similar alliances in the developing world to undertake research onglobal issues. And in company with four other Canadianfederal agencies — CIHR, CIDA, Health Canada, and thePublic Health Agency of Canada — we fund the GlobalHealth Research Initiative.
Informing public policy
As a member of Canada’s foreign policy family, IDRC’swork helps to inform policy and contributes to Canada’sreputation as an innovative and generous country. Givenour mandate, we routinely consult with the Department of Foreign Affairs and International Trade, for example,on issues such as Canada’s contribution to the G-8 Summits:
this past year we helped inform Canada’s position on Internet issues at the Deauville G-8 meeting.
Also in 2010–2011:
n IDRC contributed to preparations for the G-8 and G-20Summits held in Canada.
n IDRC supported the UN Commission on Informationand Accountability for Women’s and Children’sHealth, co-chaired by Prime Minister Harper.
n Researchers from the IDRC-supported MercosurNetwork briefed MPs on Latin American issues.
n IDRC participated in the Policy Research Initiative’sMetaScan Project to identify trends, change drivers,and discontinuities that will shape Canada and federalgovernment policy over the coming decade.
n Federico Burone, Regional Director for Latin Americaand the Caribbean, testified via webcast before theStanding Senate Committee on Foreign Affairs andInternational Trade on the role of research in Brazil.
n Jean Lebel, Director, Agriculture and Environment,gave the keynote address at a Breakfast on the Hillorganized by the Canadian Fertilizer Institute.
alb
eRt
gO
nza
lez
/ un
Finding innovative solutions to pressing health problems is
the thrust of the Development Innovation Fund, which brings
together Canadian and developing-country scientists, and
the private sector.

8 i d R c a n n u a l R e p O R t 2 0 1 0 – 2 0 1 1
MARK ING A M I LESTONE
idRc at 40
Celebrating four decades of research for development
In 2010, IDRC celebrated four decades of support for research and innovation aimed at improving lives acrossthe developing world. Since 1970, IDRC has funded about13,000 research activities leading to concrete improvementsin people’s lives.
On Parliament Hill
A reception on Parliament Hill showcased IDRC-funded research to MPs. The Hon. Trevor Manuel, South Africa’sMinister in the Presidency and a former IDRC grantee, was the guest of honour. Manuel thanked Canada — and IDRCin particular — for support during his country’s difficult
transition from apartheid. More than half the cabinet members in President Nelson Mandela’s post-apartheidgovernment, elected in 1994, had been involved in IDRC-supported research. Manuel, for example, who served asMinister of Finance from 1996 to 2009, had taken part inan economic policy research initiative. He is pictured withCanada’s Minister of Finance, the Hon. Jim Flaherty.
Lasting Impacts
The year-long online Lasting Impacts series describedIDRC-funded research initiatives that had enduring results. Here are a few examples:� In two districts in Tanzania, evidence-based reforms topublic health systems reduced child mortality by 40%.
� Following an economic crisis, innovative agriculturalpractices launched urban gardens in Rosario, Argentina,that feed more than 40,000 people.
� In Morocco, breakthroughs in oil-processing technolo-gies helped preserve endangered trees that generateenough income to lift 2,500 women out of poverty.
teck
les
pHO
tOg
RapH
Y
idRc
/ pe
teR
ben
net
t
fHia
flic
kR /
jOYO
flif
e
HO
use
Of
cOM
MO
ns
pHO
tOg
RapH
Y se
Rvic
e

i d R c at 4 0 9
Speakers of Renown
To mark IDRC’s 40th anniversary, we invited 16 leadingthinkers and doers to give public presentations on inter-national development and related topics. More than 2,200people attended the Speakers of Renown series, and 17,000others have watched the webcasts or archived videos onIDRC’s YouTube channel.
These distinguished speakers included historian Suzy Castor(above left) and agronomist Gebisa Ejeta (above right).Other Speakers of Renown: Helen Clark, Paul Collier, Ramachandra Guha, Rima Khalaf Hunaidi, MargaretMacMillan, Trevor Manuel, Marwan Muasher, AmartyaSen, MS Swaminathan, Romila Thapar, David Waltner-Toews, and Muhammad Yunus, as well as IDRC governorsAmina Az-Zubair and Xue Lan. n
IDRC: 40 Years of Ideas, Innovation, and Impact
The full scope and impact of IDRC’s work across fourdecades are outlined in an independent academichistory written by historians Bruce Muirhead andRon Harpelle, published in 2010 by Wilfrid LaurierUniversity Press.
The IDRC model was based on finding the best local talents and challenging them to take up the task of addressing major mission-oriented research and development.The justifiable assumption was that local folks
know their problems, and with appropriate
assistance and solid education they could design
practical solutions that address local needs
far more effectively than most foreign experts.
— Ethiopian-American agronomist Gebisa Ejeta, winner of the 2009 World Food Prize, reflecting on
his early years as an IDRC-supported researcher.

10 i d R c a n n u a l R e p O R t 2 0 1 0 – 2 0 1 1
Mik
kel
Ost
eRg
aa
Rd /
pan
Os
IDRC invited many distinguished developmentthinkers and practitioners to speak at events organizedin Ottawa and in other parts of the world to mark its40th anniversary. Here is what some had to say aboutour contribution to research for development.
“IDRC has brought a unique approach to addressingthe research agenda in Africa by promoting our indigenous expertise while ensuring that we have the cutting-edge techniques with the highest academic standards.”
— Amina Az-ZubairSenior Special Assistant to the President of Nigeria on
the Millennium Development Goals and IDRC governor
“[…] if you look at the foresight demonstrated by IDRCthen in 1992, and you look at countries that performedbetter during the last great recession, it demonstratesthat IDRC certainly saw something that the rest of theworld didn’t.”
— Trevor ManuelFounding member of the National Executive Committee of the African National Congress, now Minister in the Presidency in charge of the Planning Commission of South Africa
“What I like about IDRC is that they are really willingto take risks. They are willing to support long-termthings to give the space required to do the kind of workand build capacities in difficult countries, difficult institutions.”
— Kirith ParikhFounder and Director, Indira Gandhi Institute
of Development Research, India
“It is particularly impressive that IDRC has been able to provide support for many non-mainstream projects,which are often neglected by the more traditionalistsupport agencies. Many of these innovative ventures[…] have actually ended up doing a lot of good in ourbadly organized world.”
— Amartya SenNobel Laureate, Economics, India
“IDRC’s contribution has really opened up a new wayof looking at the national level upon research that promotes most development, and it has now become research that promotes sustainable development.”
— M S SwaminathanArchitect of India’s Green Revolution and
Chairman of the M S Swaminathan Research Foundation, India
“Support provided by the donor community in generaland IDRC in particular in building research capacity in Vietnam and bridging research and policy has clearlyplayed and will play an important role in helping Vietnam achieve her ambitious development objectivesand prosperity.”
— Nguyen Van PhucVice-Chairman, Economic Committee
of the National Assembly, Vietnam
speaking about idRc
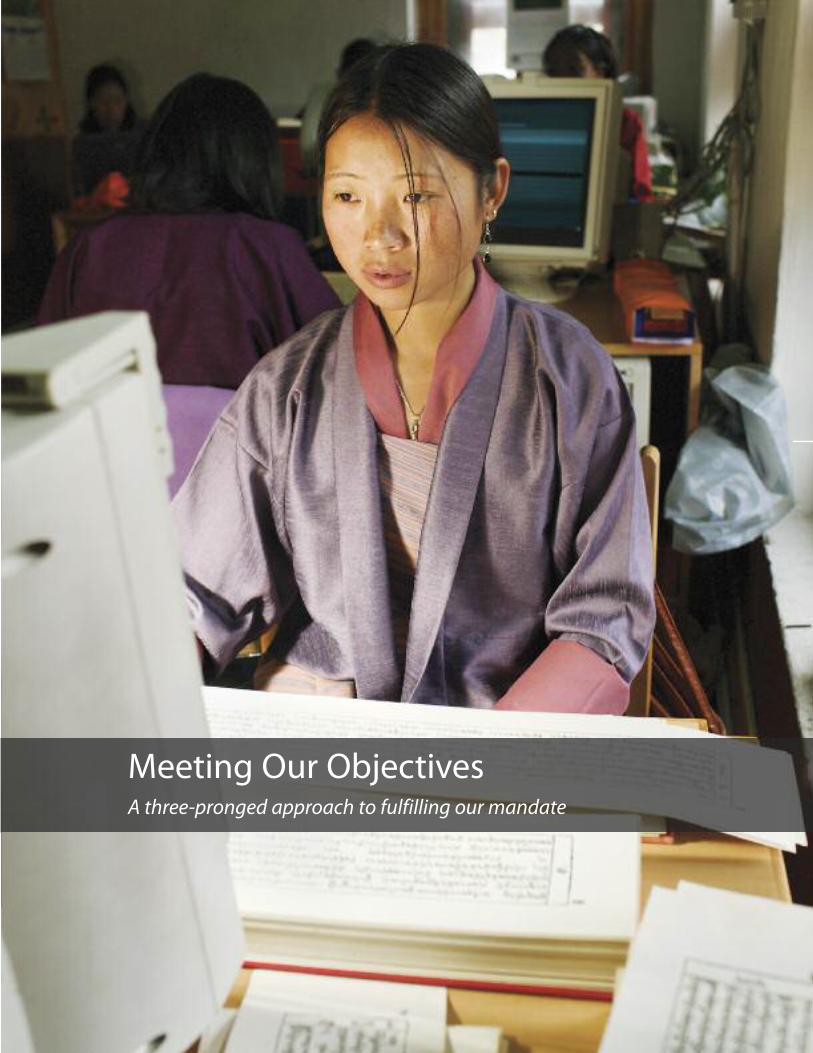
Meeting Our ObjectivesA three-pronged approach to fulfilling our mandate

nic
Ola
s g
Old
beRg
/ pa
nO
s
MEET ING OUR OB JECT IVES
new knowledge, bold solutions
BUILDINGKNOWLEDGE2010–2011
335new research activitieswith knowledge-buildingobjectives
924research activities withknowledge-buildingobjectives during the year
766recipient institutionsinvolved
Building a strong foundation for innovation
Knowledge is the main driver of today’s economy. But theability to create and use knowledge is unevenly distributedaround the world. Building new knowledge and using it to improve lives in developing countries has always beencentral to IDRC’s work.
IDRC strives to help developing countries find novel solutionsand more effective ways to tackle economic, environmental,and social challenges — new and old. Our programs reflectCanadian Government aid priorities: n agriculture and the environmentn science, technology, and innovationn social and economic policyn health and health systems
An increasingly important part of our work is to build newfields of knowledge. We bring together communities of researchers and practitioners and help them develop newmethods, tools, and technologies.
Here are some examples of the work we support:
Boosting global food security
Frequent droughts, poor soils, and population growthhave led to food insecurity in Ethiopia. Here, farmers depend on pulses — crops such as lentils, chickpeas, andfaba beans — as sources of protein and income. Unfortu-nately, varieties grown in Ethiopia are typically low-yielding, low in protein, and poor at fixing nitrogen.
As part of Canada’s commitment of increasing food secu-rity, the Canadian International Food Security ResearchFund, a five-year, $62 million collaboration between theCanadian International Development Agency and IDRC,is working to improve these and other traditionally important, but under-researched crops. The Fund brings together Canadian and developing-country researchers to increase food security and enhance nutrition in devel-oping countries. To date, 13 projects have been funded.
Securing women’s access to land
Women produce most of the food in Africa, yet own verylittle of the land. Many consider that ensuring women’srights and access to land is crucial to enhancing food security and reducing poverty. Promoting and protectingwomen’s rights are central to Canada’s foreign policies.
Over the past decade, IDRC-supported researchers in 14 African countries examined women’s relationship toland from many angles — economic, legal, social, and political. In September 2010 they shared their findingswith each other and a wider community in Africa. Theyfound, for example, that owning land boosts women’s incomes and independence, and in turn contributes to ensuring that families are better fed and food secure.
The knowledge gained can lead to fairer laws in manyparts of the world where women’s land rights are limited.
Harnessing technology for the poorest
“Let’s innovate together!” is the slogan of iBoP Asia’s information-sharing platform. iBoP Asia is short for Science and Technology Innovations for the Base of thePyramid in Southeast Asia, an IDRC-supported project atthe Ateneo School of Government, Manila, Philippines.
At the “base of the pyramid” are more than 4 billion people who live on less than $4 a day and have little or no access to technologies that could improve their lives:75% of these poor people are in Asia. iBoP works to fosterinnovations that can meet their needs — innovations likelow-cost wind turbines and new communication tools.Key to success is encouraging governments to developpro-innovation policies and promote investment in thesetechnologies. iBop Asia is doing just that. n
12 i d R c a n n u a l R e p O R t 2 0 1 0 – 2 0 1 1

Pablo Tubaro
Pablo Tubaro is Vice-Director of the National Museum of Natural Sciences in Buenos Aires. He is the lead researcher in Argentina of an IDRC-supported effort to expand a new species-identification tool, DNA barcoding, to developingcountries.
Advancing science
i’ve been involved in dna barcoding since 2004, when i first met paul Hebert, the universityof guelph scientist who developed the technique. from the outset, i was impressed by the simplicity and power of the idea, andconvinced of its extraordinary potential to advance biodiversity science.
barcoding uses a short sequence in an organism’s dna as a unique species identifier.scientists around the world working on the international barcode of life project are buildinga reference library for life on earth. Our goal is to catalogue 5 million specimens from 500,000species by 2015, with a particular focus onspecies of importance to the economy, health,and conservation.
dna barcoding represents a huge opportu-nity to generate new knowledge and apply it in many useful ways. for example, it can helpidentify disease vectors, track invasive species or food contamination sources, and control illegal trade in plants and animals. in argentina,we’ve already used barcoding to identify speciesinvolved in aircraft bird strikes.
Expanding the work
so far, most barcoding research has taken placein developed countries. idRc support is helpingus set up a barcode library in argentina, whichwill act as a regional node. We’ve hired a team to carry out field and lab work, and helped trainseveral hundred researchers from a dozen latinamerican countries in dna barcoding.
i’ve worked on argentina’s bird species —we’ve already produced barcodes for 70% ofthem. the new funding has allowed us to expand our work to other plants and animals. for example, we’re barcoding marine and fresh-water fish species, which will help manage thisimportant economic resource. Other informa-tion we’re collecting will be useful in predictingthe movement of agricultural pests, as well aspollinators, in response to climate change.
Learn more: http://ibol.org/
14 i d R c a n n u a l R e p O R t 2 0 1 0 – 2 0 1 1
nYa
ni Q
ua
RMYn
e
Developed countries achieved their growth through researchthat led to the application of new technologies. Developingcountries could follow the same course, but they have limitedcapacity to conduct the needed research.
For more than 40 years, IDRC has helped developing coun-tries build up the research capabilities, innovative skills, andinstitutions required to solve their problems. We continue toprovide our grantees with opportunities to conduct researchand develop and refine methods. We also improve their access to research information and resources. And we striveto strengthen research institutions.
How do we do this? We encourage new talent by offeringfellowships and awards. We bring people and institutions together across disciplines and sectors to help them learnfrom one another. We provide core support to well-run research institutions. We also engage with our recipients inframing research problems, improving research designs, andtraining and mentoring. Here are some examples:
Safeguarding human and animal health
Sri Lankan and Canadian researchers at the University ofCalgary have joined forces to develop a veterinary publichealth system in Sri Lanka. The goal: prevent emerginginfectious diseases.
With support from the Global Health Research Initiative —a partnership of five Canadian federal departments and agencies, including IDRC — the team is working to better understand how diseases are transmitted between animalsand humans. And it is bringing that knowledge to farmers,researchers, governments, and communities throughout Asia.
Building the capacity of people and institutions to pre-vent, detect, and manage emerging diseases is central tothe project’s success.
Training a new generation
Charles Michael Mtabho from Tanzania, Malik Sane ofSenegal, Hellen Kongai of Uganda — these are just threeof 193 PhD candidates in 24 sub-Saharan countries whohave received IDRC International Fellowships.
Launched in 2007, the fellowships enable graduate studentsto pursue their training in their home regions. This helpsimprove education locally and stem the brain drain.
Nine African institutions administer the award competitions.Doing so strengthens their ability to manage grants andsupport research. It also contributes to building Africancentres of excellence.
Advancing a new field of knowledge
This year, IDRC launched a four-year initiative to helpleading ecohealth researchers in Latin America and theCaribbean win the fight against vector-borne diseasessuch as Chagas, malaria, and dengue. The project willstrengthen the field of ecohealth research, education, andpractice to better address how interactions between peopleand ecosystems affect these diseases.
Led by Mexico’s National Institute of Public Health withpartners in Colombia and Venezuela, institutions through-out the region will train hundreds of students and publichealth professionals. They will also work to influence policies to reduce the threat of diseases.
The project consolidates more than 10 years of IDRC-fundedecohealth research and training in the region. A similarproject launches in Southeast Asia in 2011–2012. n
MEET ING OUR OB JECT IVES
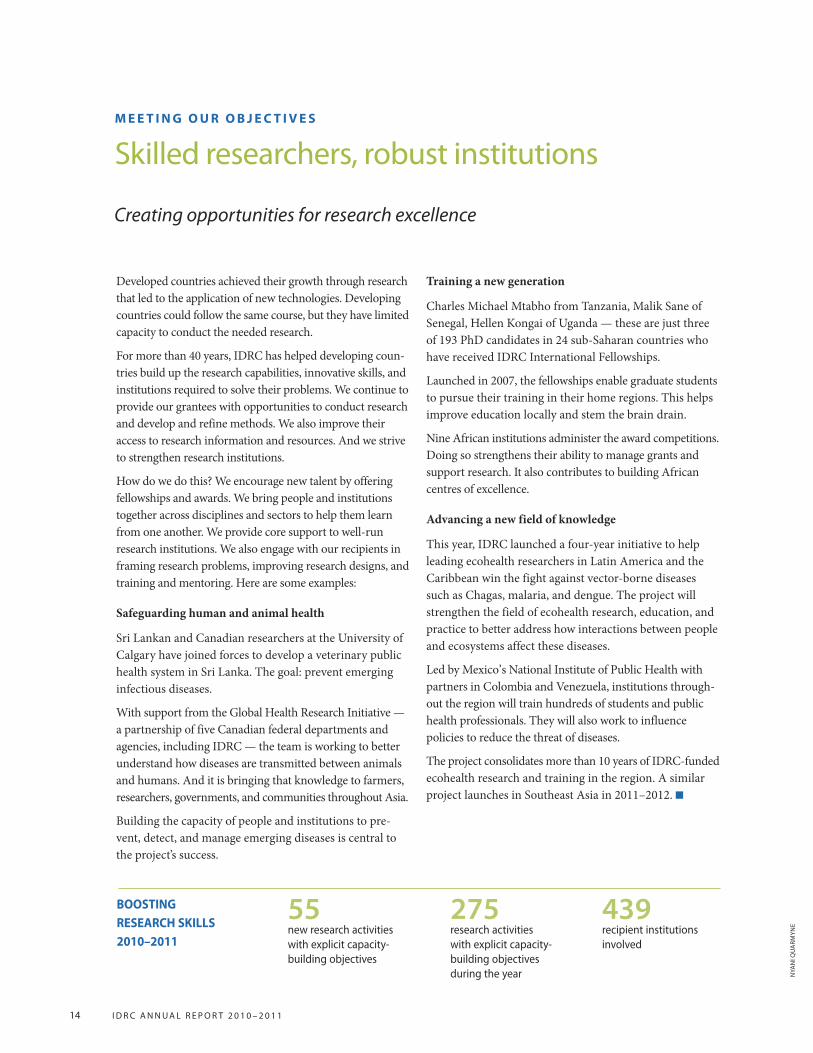
skilled researchers, robust institutions
BOOSTING RESEARCH SKILLS2010–2011
55new research activitieswith explicit capacity-building objectives
275research activitieswith explicit capacity-building objectivesduring the year
439recipient institutionsinvolved
Creating opportunities for research excellence

Jean Mensa
A lawyer, Jean Mensa joined Ghana’s Institute of Economic Affairs (IEA) in 2000, becoming Executive Director in 2009. The institute is one of 52 policy research organizations in 23 develop-ing countries that receive multi-year funding fromthe Think Tank Initiative.
Sparking national debate
When the iea was founded in 1989, using research to provoke national discussion and influence policy was new in ghana. that’s what attracted me to it. i wanted to work in anorganization that used its research to bringabout policy reform.
ghana is rich in natural resources, yet remains poor. Our funding from the think tank initiative coincided with the discovery of oil and gas. We felt this was an opportunity for us,as a country, to ensure that the oil revenues areused to promote economic growth and devel-opment, and reduce poverty substantially.
We conducted a study that proposed ways of managing the resource, and then engaged inextensive advocacy. Most of our recommenda-tions were included in a new law that commits70% of oil revenues to developing ghana’s physical and social infrastructure. the balance is to be set aside to cushion the economy fromshocks and benefit future generations.
Awarding excellence
in the past, the iea relied mostly on programfunding and couldn’t afford to retain seniorresearchers once a project ended. the institutenow has predictable core funding, which has allowed us to recruit full-time researchers, and develop and mentor a pool of younger researchers.
We’ve upgraded our computer system and procured new software. We now have fast, reliable internet service. this has promoted research efficiency — and joy. the funding has energized us, and helped us raise our profile. We’re viewed as a credible organizationundertaking independent, high-quality research. ghana’s president praised our work in his state of the nation addresses in 2009 and 2010, and indicated he intended to take up our recommendations.
Learn more: www.idrc.ca/thinktank

16 i d R c a n n u a l R e p O R t 2 0 1 0 – 2 0 1 1
abb
ie t
RaYl
eR-s
Mit
H /
pan
Os
The value of the research we support lies in how lives arechanged — through cleaner environments, improved nutri-tion, higher incomes, effective health systems, and greatersecurity. But even the best research will have little impact if it doesn’t reach those who can use the results — policy-makers, business leaders, communities, and citizens.
We work to make that happen by ensuring that the researchwe fund is timely and of high quality. We support researchthat can bring about change. We communicate the results of that work, and assist our partners to do so. We bring researchers and research users to the table through work-shops and conferences.
As an increasing number of developing countries look fornew knowledge to underpin policies and programs and astheir capacity to generate research grows, IDRC’s supportfor transformative solutions is all the more vital.
Here are some examples of our support:
Southern answers to southern challenges
Mercosur, the “southern common market,” comprises Argentina, Brazil, Paraguay, and Uruguay. In 1998, IDRChelped create the Mercosur Economic Research Network(MercoNet) to carry out policy-relevant studies on keychallenges for the region in the emerging global economy— regional integration, macroeconomic coordination,foreign direct investment, and climate change, amongother issues.
Recently, MercoNet broadened its thematic and geo-graphic scope to become a regional centre of excellencefor research on regionalism and inclusive growth agendas.The network aims to bridge the gap between researchersand policymakers, and to engage with businesses, trade
unions, and parliamentarians — including members ofparliament from trading partners such as Canada.
Technical boost for urban farming
In Soukra, a suburb of Tunisia’s capital, Tunis, hundreds ofpoor families feed themselves and earn a small living fromagriculture. In recent years, however, climate change andrapid urbanization have reduced the amount of arableland, threatening livelihoods.
IDRC-funded research found some answers. Techniciansbuilt greenhouses, which conserve water, protect crops,and allow for more intensive farming. They installedrooftop basins to catch rainwater and deliver it to crops.And they filtered household “greywater” for use in irriga-tion. Today, Soukra’s farmers enjoy higher incomes and improved food security. The technical innovations are becoming widely known in the region.
Climate change adaptation in the fishing industry
Coastal West Africa is one of the world’s most productivefishing zones. But stocks are threatened by destructivefishing practices, ecosystem decline, excessive competi-tion, and by climate change. Global warming aggravatesthe risk of sea level rise, more frequent and intensestorms, and changing fish stocks.
An IDRC-supported initiative seeks to widen policy dialogue so that industry stakeholders — fishers, boatowners, outfitters, and packers — can work together toward sustainable management. The goal is policy harmonization among the countries of the region to discourage wasteful fishing practices and to strengthenfishery policies and institutions. n
MEET ING OUR OB JECT IVES
sound decisions, strong societies
INFLUENCING POLICY2010–2011 39
new research activitieswith explicit policy-influence objectives
218research activitieswith explicit policy-influence objectives during the year
299recipient institutionsinvolved
Informing policies to improve lives

Ravi Sundaram
Ravi Sundaram is co-director of Sarai, a researchprogram on media at the Centre for the Study ofDeveloping Societies in New Delhi. He is one of 35researchers who took part in a landmark study, co-funded by IDRC, that examines music, film, andsoftware piracy in Bolivia, Brazil, India, Mexico,Russia, and South Africa.
First solid research
Media Piracy in Emerging Economies presents the first solid research in the global intellectualproperty debate. for the chapter on india, welooked at what was happening on the ground in several asian countries, because of courseelectronic media move across borders. togetherwith lawrence liang, a legal researcher with the alternative law forum in bangalore, i coordinated a team of researchers who exam-ined in great detail the local media markets,legal and otherwise.
We found that the level of media access by thepoor is extremely high. this remarkable shift from15 years ago is due, in part, to piracy and all thevery low-cost media available on the street.
through our research, we wanted to answerthe claims by media corporations that billions ofdollars are being lost to piracy. those estimatesdon’t come out of research, but are based on potential — what would have happened had peoplebought everything legally in a high-price market.
A novel approach
One of our key concerns was to reach the publicwith our findings, so we collaborated with artistson a graphic novel. Tinker. Solder. Tap traces howa delhi neighbourhood changes through thecoming of the tv, the vcR, the dvd. it has beenwidely read and featured in several art exhibitsinternationally.
We need new knowledge to anchor the debate on intellectual property. the researchclearly shows that the old-style, high-enforcementmodel isn’t working. the report should help policymakers understand the existing mediaecosystem in all its complexity, and inform anew approach.
Media Piracy in Emerging Economies:http://piracy.ssrc.org/the-report/
Tinker. Solder. Tap: www.sarai.net/publications/occasional/tinker-solder-tap/tinker.solder.tap.pdf

18 i d R c a n n u a l R e p O R t 2 0 1 0 – 2 0 1 1
die
teR
tele
Ma
ns
/ pa
nO
s
patR
icia
lei
va/O
as
Chemist Zoubida Charrouf received Morocco’s Grand Prize for Invention and Researchin Science and Technology. Charrouf established women’s argan oil processing coopera-tives in an arid region of southwest Morocco, fostering private sector entrepreneurship.Charrouf is professor of chemistry at Morocco’s Université Mohamed V-Agdal.
ScholarMartha Chen received India’s prestigious Padma Shri award for her contributionsto the field of social work and her research on gender, informal workers, and poverty alleviation. Chen is the international coordinator of Women in Informal Employment:Globalizing and Organizing, a global policy-research network that seeks to improve thestatus of the working poor, especially women, in the informal economy.
The Toronto-based Citizen Lab was awarded the 2010 Vox Libera Award from theCanadian Journalists for Free Expression for its commitment to the principles of freeexpression. Located in the Munk School of Global Affairs at the University of Toronto,the interdisciplinary research organization also works to pinpoint threats to the securityof electronic databases and communications around the world.
Ecohealth researcher Durga Datt Joshi was awarded the Birendra Scientific Award fromthe Nepal Academy of Science and Technology in recognition of his work on animal-transmitted diseases and viral encephalitis. Joshi is director of the IDRC-supported National Zoonoses and Food Hygiene Research Centre, which works with local authoritiesand residents to improve community health by reducing food and water-borne diseasesthat spread from animals to humans.
Kalpana Pant received the Praj Maha-Intrapreneur Award for her efforts to promotewomen’s empowerment in rural India through community-based microfinance.Kalpana is the Deputy Director of Chaitanya, a pioneer of the self-help microfinancemovement that encourages women’s self-reliance and control over resources.
Criminal law specialist Claudia Paz y Paz Bailey was appointed Guatemala’s AttorneyGeneral in December 2010. Paz is the founder of the Institute for Comparative Studiesin Criminal Sciences in Guatemala, an IDRC partner, and a former researcher with theUN Truth Commission in Guatemala.
Geneticist Suman Sahai was awarded India’s Padma Shri award for her contributions to agriculture and the rights of farmers. Sahai is the founder and current chairperson of the Gene Campaign, a grassroots research and advocacy organization focused onpromoting food and livelihood security. She is a former chair of India’s Planning Commission Task Force on Biodiversity and Genetically Modified Organisms. n
idRc grantees recognized for excellence
Zoubida Charrouf
Martha Chen
Claudia Paz y Paz Bailey
Suman Sahai
gen
e c
aM
paig
njO
sé O
ROzc
O/l
a H
ORa

Our programsPromoting growth, reducing poverty
20 i d R c a n n u a l R e p O R t 2 0 1 0 – 2 0 1 1
OUR PROGRAMS
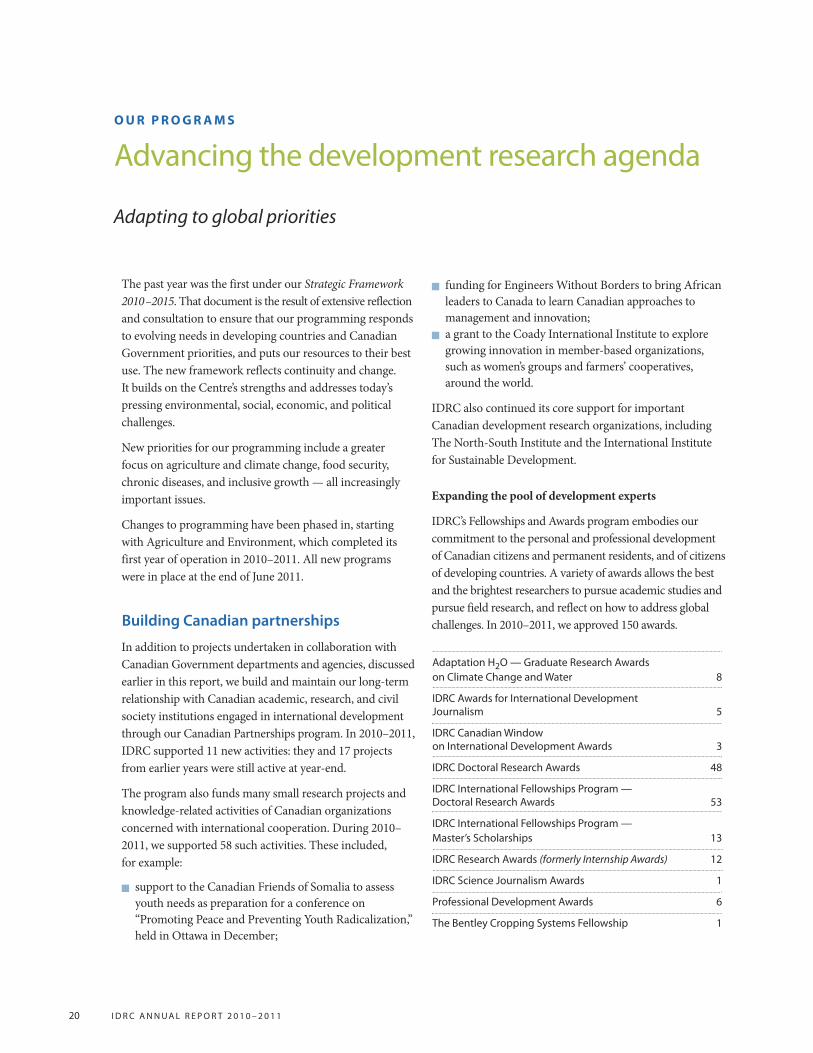
advancing the development research agenda
Adapting to global priorities
The past year was the first under our Strategic Framework2010–2015. That document is the result of extensive reflectionand consultation to ensure that our programming respondsto evolving needs in developing countries and CanadianGovernment priorities, and puts our resources to their bestuse. The new framework reflects continuity and change. It builds on the Centre’s strengths and addresses today’spressing environmental, social, economic, and politicalchallenges.
New priorities for our programming include a greater focus on agriculture and climate change, food security,chronic diseases, and inclusive growth — all increasinglyimportant issues.
Changes to programming have been phased in, startingwith Agriculture and Environment, which completed itsfirst year of operation in 2010–2011. All new programswere in place at the end of June 2011.
Building Canadian partnerships
In addition to projects undertaken in collaboration withCanadian Government departments and agencies, discussedearlier in this report, we build and maintain our long-termrelationship with Canadian academic, research, and civilsociety institutions engaged in international developmentthrough our Canadian Partnerships program. In 2010–2011,IDRC supported 11 new activities: they and 17 projectsfrom earlier years were still active at year-end.
The program also funds many small research projects andknowledge-related activities of Canadian organizationsconcerned with international cooperation. During 2010–2011, we supported 58 such activities. These included, for example:
n support to the Canadian Friends of Somalia to assessyouth needs as preparation for a conference on “Promoting Peace and Preventing Youth Radicalization,”held in Ottawa in December;
n funding for Engineers Without Borders to bring Africanleaders to Canada to learn Canadian approaches to management and innovation;
n a grant to the Coady International Institute to exploregrowing innovation in member-based organizations,such as women’s groups and farmers’ cooperatives,around the world.
IDRC also continued its core support for important Canadian development research organizations, includingThe North-South Institute and the International Institutefor Sustainable Development.
Expanding the pool of development experts
IDRC’s Fellowships and Awards program embodies ourcommitment to the personal and professional developmentof Canadian citizens and permanent residents, and of citizensof developing countries. A variety of awards allows the bestand the brightest researchers to pursue academic studies andpursue field research, and reflect on how to address globalchallenges. In 2010–2011, we approved 150 awards.
adaptation H2O — graduate Research awards on climate change and Water 8
idRc awards for international development journalism 5
idRc canadian Window on international development awards 3
idRc doctoral Research awards 48
idRc international fellowships program — doctoral Research awards 53
idRc international fellowships program —Master’s scholarships 13
idRc Research awards (formerly Internship Awards) 12
idRc science journalism awards 1
professional development awards 6
the bentley cropping systems fellowship 1
O u R p R O g R a M s 21
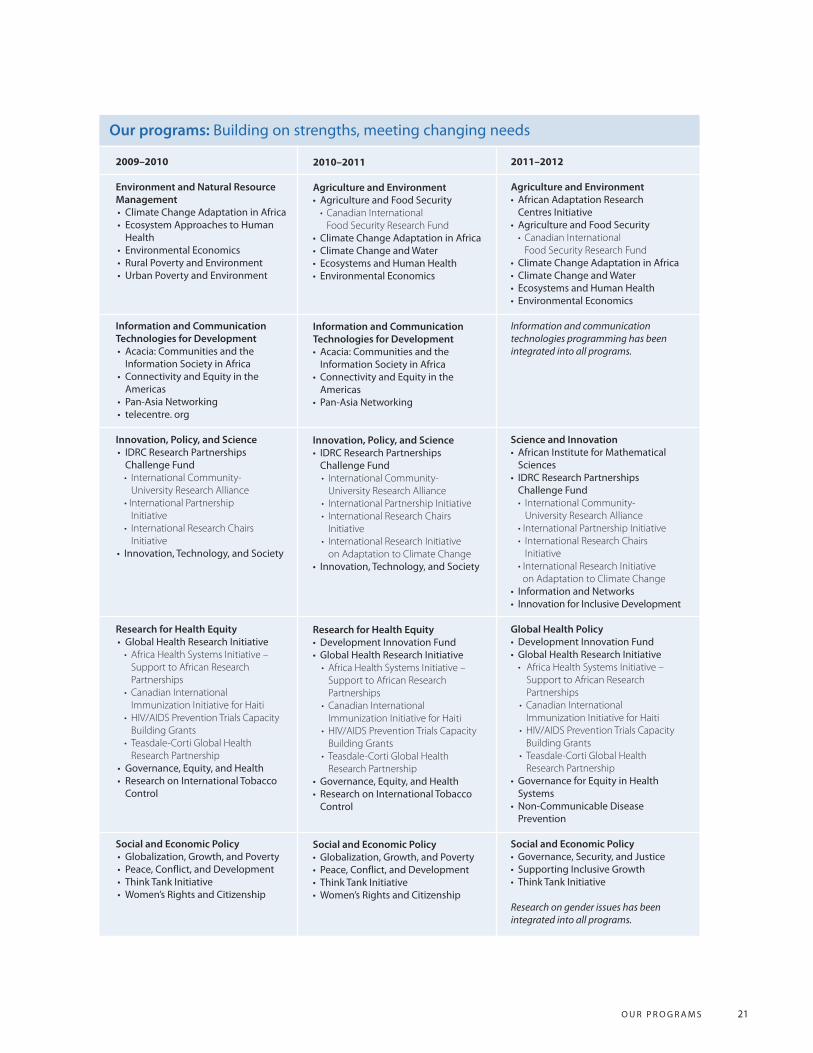
2009–2010
Environment and Natural ResourceManagement • climate change adaptation in africa • ecosystem approaches to Human
Health• environmental economics• Rural poverty and environment• urban poverty and environment
Information and CommunicationTechnologies for Development• acacia: communities and the
information society in africa • connectivity and equity in the
americas• pan-asia networking• telecentre. org
Innovation, Policy, and Science• idRc Research partnerships
challenge fund• International Community-University Research Alliance
• International Partnership Initiative
• International Research Chairs Initiative
• innovation, technology, and society
Research for Health Equity• global Health Research initiative• Africa Health Systems Initiative –Support to African Research Partnerships
• Canadian International Immunization Initiative for Haiti
• HIV/AIDS Prevention Trials Capacity Building Grants
• Teasdale-Corti Global HealthResearch Partnership
• governance, equity, and Health• Research on international tobacco
control
Social and Economic Policy• globalization, growth, and poverty• peace, conflict, and development• think tank initiative• Women’s Rights and citizenship
2011–2012
Agriculture and Environment • african adaptation Research
centres initiative • agriculture and food security• Canadian International Food Security Research Fund
• climate change adaptation in africa • climate change and Water • ecosystems and Human Health • environmental economics
Information and communication technologies programming has been integrated into all programs.
Science and Innovation• african institute for Mathematical
sciences• idRc Research partnerships
challenge fund• International Community-University Research Alliance
• International Partnership Initiative• International Research Chairs Initiative
• International Research Initiative on Adaptation to Climate Change
• information and networks• innovation for inclusive development
Global Health Policy• development innovation fund• global Health Research initiative• Africa Health Systems Initiative –
Support to African Research Partnerships
• Canadian International Immunization Initiative for Haiti
• HIV/AIDS Prevention Trials Capacity Building Grants
• Teasdale-Corti Global HealthResearch Partnership
• governance for equity in Health systems
• non-communicable disease prevention
Social and Economic Policy• governance, security, and justice• supporting inclusive growth• think tank initiative
Research on gender issues has been integrated into all programs.
2010–2011
Agriculture and Environment• agriculture and food security• Canadian International Food Security Research Fund
• climate change adaptation in africa • climate change and Water • ecosystems and Human Health • environmental economics
Information and CommunicationTechnologies for Development• acacia: communities and the
information society in africa • connectivity and equity in the
americas• pan-asia networking
Innovation, Policy, and Science• idRc Research partnerships
challenge fund• International Community-University Research Alliance
• International Partnership Initiative• International Research Chairs Initiative
• International Research Initiative on Adaptation to Climate Change
• innovation, technology, and society
Research for Health Equity• development innovation fund • global Health Research initiative
• Africa Health Systems Initiative –Support to African Research Partnerships
• Canadian International Immunization Initiative for Haiti
• HIV/AIDS Prevention Trials Capacity Building Grants
• Teasdale-Corti Global HealthResearch Partnership
• governance, equity, and Health• Research on international tobacco
control
Social and Economic Policy• globalization, growth, and poverty• peace, conflict, and development• think tank initiative• Women’s Rights and citizenship
Our programs: building on strengths, meeting changing needs

22 i d R c a n n u a l R e p O R t 2 0 1 0 – 2 0 1 1
The Board of Governors
IDRC’s work is guided by an 18-member internationalBoard of Governors. The size of the Board was reducedfrom 21, in line with the Government’s initiative to reducethe size of Crown corporation boards. Currently, the Boardis short of its complement of 18 members, but is workingwith the Minister of Foreign Affairs to ensure that the appointment process will soon bring the Board back to fullstrength. The Chairman of the Board reports to Parliamentthrough the Minister of Foreign Affairs.
The IDRC Act states that a majority of Board members, including the Chair and Vice-Chair, must be Canadian. Up to 8 governors are appointed from other countries. The composition of our Board helps to ensure that our programs and operations respond effectively to the needs ofthe developing world, adhere to good governance practices,and uphold the public interest.
The IDRC Act specifies that at least 11 of the governorsmust have experience in international development or abackground in the natural or social sciences, or in technol-ogy. These stipulations are reflected in a profile of skills andexperience that the Board drafted to assist in identifyingsuitable candidates to fill vacancies.
Board members are appointed by Canada’s Governor in Council for a term of up to four years and may be appointed for a further term.
Key responsibilities
IDRC’s Board is committed to openness, transparency,and accountability. Its key responsibilities are to
n establish IDRC’s strategic direction;
n review and approve the Centre’s budget and financialstatements;
n assess and ensure that systems are in place to managerisks associated with the Centre’s business;
n ensure the integrity of the corporation’s internal controland management information systems;
n monitor corporate performance against strategic andbusiness plans;
n assess its own performance in fulfilling Board responsibilities;
n measure and monitor the performance of the Presidentand Chief Executive Officer; and
n ensure that the Centre has an effective communicationsstrategy.
Committees
The Board normally meets three times a year. It has fourstanding committees:
n the Executive Committee
n the Finance and Audit Committee
n the Governance Committee
n the Human Resources Committee
Committee members are elected on the basis of their interests, expertise, and availability. The Board also estab-lishes ad hoc committees to deal with particular issues, as the need arises.
BOARD OF GOVERNORS
corporate governance
A commitment to accountability, transparency, effectiveness
“As a researcher and director of a regional think tankin the developing world, and as a governor on IDRC’sBoard, I have no less than full admiration for the integrity, professionalism, and sense of purpose ofthis extraordinary Canadian Crown corporation.”
— Ahmed GalalManaging Director, Economic Research Forum, Egypt

b O a R d O f g O v e R n O R s 23
Committee membership as at March 31, 2011:
Executive Committee Members: The Honourable Barbara McDougall (Chair); Denis Desautels; Ahmed Galal; Frieda Granot;David Malone; Faith Mitchell
Finance and Audit Committee Members: Denis Desautels (Chair); Ahmed Galal; Frieda Granot; Elizabeth Parr-Johnston; Gordon Shirley
Governance CommitteeMembers: The Honourable Barbara McDougall (Chair);Claude-Yves Charron; Denis Desautels; Pratap Mehta;Francisco Sagasti; the Honourable Monte Solberg
Human Resources Committee Members: Faith Mitchell (Chair); Claude-Yves Charron; David Malone; Xue Lan
g.M
.b. a
kasH
/ pa
nO
s
“I was able to see first-hand how fundingGuatemalan researchers working to prevent the spread of Chagas disease is helping to save thousands of lives in Central America. As a CanadianI couldn’t be more proud.”
— The Hon. Monte SolbergSenior Advisor, Fleishman-Hillard, Canada
“At a time when research funding is scarce, IDRC'smission of promoting research in developing countries has acquired renewed importance. So much of the critical research infrastructure inmany countries would not exist without IDRC. It provides the base for genuinely innovative andlong-term development thinking.”
— Pratap B. MehtaPresident & Chief Executive Officer, Centre for Policy Research, India
The composition of our Board helps to ensure that our
programs and operations respond effectively to the needs
of the developing world.
Compensation for Board members is set according to Government of Canada Remuneration Guidelines for Part-time Governor in Council Appointees in Crown Corporations. These guidelines establish the following ranges:
n Per diem for Governors: $390 – $420
n Annual retainer for Committee Chairs: $4,600 – $5,400
n Annual retainer for the Chairman: $9,200 – $10,800

24 i d R c a n n u a l R e p O R t 2 0 1 0 – 2 0 1 1
Mik
kel
Ost
eRg
aa
Rd /
pan
Os
THE HONOURABLE
BARBARA MCDOUGALL
Chairman, Toronto, Canada Advisor, international businessdevelopment, corporate governance,and government relations, Aird &Berlis; former Secretary of State for External Affairs and Minister of Employment and ImmigrationAttended 3 out of 3 meetings*
DENIS DESAUTELS
Vice-Chairman, Ottawa, Canada Chairman, Board of Directors,Laurentian Bank; Chairman,Accounting Standards and OversightCouncil, Canadian Institute ofChartered Accountants; and formerAuditor General of CanadaAttended 3 out of 3 meetings
DAVID M. MALONE
President, IDRC, Ottawa, CanadaFormer High Commissioner forCanada to India and non-residentAmbassador to the Kingdom of Bhutan and to Nepal; former AssistantDeputy Minister (Global Issues),Department of Foreign Affairs andInternational TradeAttended 3 out of 3 meetings
AMINA AZ-ZUBAIR
Abuja, Nigeria Senior Special Assistant to thePresident of Nigeria on the MillenniumDevelopment GoalsAttended 1 out of 2 meetings (Term expired March 4, 2011)
MARGARET BIGGS
Ottawa, CanadaPresident, Canadian InternationalDevelopment AgencyAttended 3 out of 3 meetings
CLAUDE-YVES CHARRON
Montréal, Canada Vice-President, Université du Québec à Montréal Attended 3 out of 3 meetings
JOCELYN COULON
Montréal, CanadaDirector, Réseau de recherche sur les opérations de paix, Centre d’étudeset de recherches internationales del’Université de Montréal Attended 2 out of 2 meetings (Term expired February 8, 2011)
GED DAVIS
Sevenoaks, United Kingdom Co-President, Global EnergyAssessment, International Institute for Applied Systems Analysis Attended 2 out of 2 meetings (Term expired March 4, 2011)
AHMED GALAL
Cairo, EgyptManaging Director, EconomicResearch ForumAttended 2 out of 3 meetings
FRIEDA GRANOT
Vancouver, CanadaSenior Associate Dean, StrategicDevelopment and External Relations,Sauder School of Business, University of British ColumbiaAttended 3 out of 3 meetings
W. ANDY KNIGHT
Edmonton, Canada Chairman, Department of PoliticalScience, University of AlbertaAttended 2 out of 2 meetings (Term expired March 4, 2011)
PRATAP B. MEHTA
Delhi, India President, Centre for Policy ResearchAttended 3 out of 3 meetings
FAITH MITCHELL
Washington DC, United StatesVice-President for Program andStrategy, Grantmakers in HealthAttended 3 out of 3 meetings
ELIZABETH PARR-JOHNSTON
Chester Basin, CanadaPresident, Parr Johnston Economic andPolicy ConsultantsAttended 3 out of 3 meetings
ANDRÉS ROZENTAL
Mexico City, Mexico President, Mexican Council on Foreign RelationsAttended 2 out of 2 meetings (Term expired March 4, 2011)
FRANCISCO SAGASTI
Lima, Peru External Advisor to the President of FORO Nacional/InternacionalAttended 2 out of 2 meetings (resigned November 15, 2010)
GORDON SHIRLEY
Kingston, JamaicaPrincipal, University of the West Indies, Mona CampusAttended 3 out of 3 meetings
THE HONOURABLE
MONTE SOLBERG
Calgary, AlbertaSenior Advisor, Fleishman-Hillard CanadaAttended 3 out of 3 meetings
RORY STEWART
Crieff, United KingdomDirector of the Carr Center for Human Rights Policy, Harvard Kennedy School of Government Attended 0 out of 1 meeting (Resigned October 21, 2010)
XUE LAN
Beijing, People’s Republic of ChinaDean, School of Public Policy and Management, Tsinghua University Attended 1 out of 3 meetings
* This report lists attendance from April 1, 2010 to March 31, 2011.
The IDRC Board of Governors 2010–2011

CONTENTS
26 Stewardship and accountability• IDRC’s foundations• Accountability• Risk management• Capabilities to deliver results• Partnerships• Evaluation• Human resources• Communications• Information management
and technology
34 Management’s discussion and analysis
52 Financial statements
72 How to reach us
Managing and measuring our performanceStewardship and accountability

26 IDRC ANNUAL R EPORT 2 0 10–2011
IDRC’s foundations
MandateThe International Development Research Centre (IDRC)initiates, encourages, supports, and conducts research intothe problems of the developing regions of the world andinto the means for applying and adapting scientific,technical, and other knowledge to the economic andsocial advancement of those regions. IDRC operatesunder the IDRC Act (1970).
Business modelIn carrying out our mandate, we� provide financial support to researchers and
institutions in developing countries for appliedresearch on the problems they identify as crucial to their communities;
� engage with researchers throughout the researchprocess, sometimes as a mentor but increasingly on apeer-to-peer basis;
� act as a research broker to further networking amonggrantees. IDRC facilitates access to research materialsand services, as well as to other researchers and policy-makers, increasing the impact of the research it supports.
Our activitiesThis was the first year of operation under IDRC’s StrategicFramework 2010–2015, which establishes three objectives: � to build new knowledge, including new fields of
knowledge; � to build research capacity, especially in developing
countries;� to enable our grantees to influence policy and practice.
Our research-funding activities are organized under fourthemes that guide a series of programs: � Agriculture and environment� Global health policy� Science, technology, and innovation� Social and economic policy
AccountabilityIDRC is accountable to Parliament and to Canadians forits use of public resources. Here are a few of the measuresin place that help us meet or exceed the standards ofaccountability and transparency in corporate governanceset by Treasury Board:� IDRC’s financial statements are audited annually
by the Office of the Auditor General of Canada. Five internal audit projects were also completed in2010–2011.
� IDRC is subject to both the Access to Information Actand the Privacy Act. Seven requests were receivedunder the Access to Information Act in 2010–2011.
� IDRC publishes travel and hospitality expenses forsenior executives on its website, in adherence withfederal government policy.
� IDRC held its annual public meeting in October,hosted by Board Chairman, the Hon. BarbaraMcDougall. Some 75 people attended the event.
� Our comprehensive project database is accessible onour public website.
� All completed evaluations are posted on our website.� In accordance with legislative requirements, IDRC
submitted reports on its application of the CanadianMulticulturalism Act, the Employment Equity Act, andthe Official Languages Act.
� IDRC’s Senior Officer, designated for the purpose ofthe Public Servants Disclosure Protection Act, submittedhis annual report.
� IDRC contributed to the Government’s report underthe Official Development Assistance Accountability Act.
Stewardship and accountability
M A N A G I N G A N D M E A S U R I N G O U R P E R F O R M A N C E

MANAG ING AND MEASUR ING OUR P ER FORMANCE 27
Risk managementInnovation, which is at the heart of almost every activityundertaken by the Centre, is rarely risk-free. At IDRC,risk also arises from operating in environments whereresearch infrastructure is weak, institutions fragile, andpolitical and economic conditions unstable. The nature ofthe Centre’s knowledge-intensive endeavours also places itat risk in the recruitment and retention of an internationalpool of unique talent to deliver its programs.
The Centre’s risk management processes involveidentifying, assessing, monitoring, and mitigating the risksto achieving its corporate objectives. This corporate riskprofile is reviewed annually while specific risks arethoroughly examined through an ongoing program ofaudits. IDRC has a formal risk management process, but akey element of its ability to mitigate risk is the knowledgeand skills of its staff.
Strategic risks are related to the Centre’s reputation, therelevance of its work, accountability for program andfinancial results, and the provision of reliable informationon performance. Strategic risks are managed though thesound governance and accountability structure overseenby the Board of Governors.
Program risks form the core of IDRC’s corporate riskprofile. They arise from: � the countries where IDRC works� the donors, research partners, and recipient institutions
we work with� the research methodologies used � the potential for results.
In January–February 2011, protests in Cairo tested theCentre’s crisis management processes and required thetemporary closure of the regional office. The situation wassuccessfully managed, and opportunities for improvementwere identified.
In addition:� Improvements are being implemented to enhance
project risk management, performance monitoring,and documentation protocols.
� IDRC also reviewed risks related to research ethics.This led to the establishment of an internal AdvisoryCommittee on Research Ethics.
Operational risks relate to the Centre’s operations and itsfinancial, human, and information resources. Risks aremanaged through a set of systems and internal controlsand strategies, including:� ensuring the adequacy of financial controls� maintaining an adequate staffing complement� ensuring a healthy and safe work environment� providing effective systems to capture, secure, and
disseminate information for decision-making.
Managing risk through auditsInternal audit is a key element of IDRC’s accountabilityand risk management framework. In 2010–2011, IDRCconducted audits of:� three regional offices: West and Central Africa
(Dakar), Eastern and Southern Africa (Nairobi), andMiddle East and North Africa (Cairo)
� contracting at IDRC to assess the adequacy of thecontrol framework used by the Centre for itsprocurement activities.
We also conducted a review of the Health ResearchCapacity Strengthening (Kenya) project and produced asummative report on the audits of all the regional officesfor Africa and the Middle East.
At the end of 2010–2011, a new three-year plan of workwas being prepared to guide a more strategic round ofinternal audits for the coming period. This was approvedby the Board’s Finance and Audit Committee in June 2011.

28 IDRC ANNUAL R EPORT 2 0 10–2011
Capabilities to deliver results
PeopleIDRC’s success depends on its staff. The Centre has a highlyqualified, international, multilingual staff. Many possessextensive knowledge of particular geographic areas. Thisallows them to engage effectively with grant recipients inframing research problems, improving research designs,and selecting and implementing research methods.
Balancing continuity with changeSupporting research is a long-term endeavour. IDRC has the capacity to provide support for the full project orprogram cycle from conceptualization to dissemination of research results. We balance existing — and often long-standing — research activities with new projects andprograms. We maintain the overall ratio between ongoingand new research activities at approximately 2:1.
Regional officesIDRC’s regional offices are a critical component of ourability to achieve our strategic objectives. The regionaloffices are a significant strategic asset and play asubstantial role in our success by: � providing a local perspective to IDRC’s programming� attracting and nurturing partnerships� providing a first point of contact for developing-
country researchers� promoting the dissemination of research results.
They also ensure close monitoring of risks associated withIDRC’s work and allow us to respond to opportunities in atimely and coherent way. IDRC has six regional offices:� Nairobi, Kenya� Dakar, Senegal� Cairo, Egypt� New Delhi, India� Singapore� Montevideo, Uruguay
PartnershipsIDRC works with a wide variety of organizations —government agencies, granting councils, the private sector,philanthropic foundations, and others. We collaborate tolearn from one another’s experiences, extend the reach ofthe ideas we support, and bring innovations to scale. Bypooling technical, scientific, and financial resources, weare able to further a shared commitment to research.
Donor partnershipsAs of 31 March 2011, IDRC was involved with 16 partnersin 34 contribution agreements worth $281.4 million.
IDRC has agreements with many different kinds ofpartners: government agencies, bilateral and multilateralorganizations, philanthropic foundations, and privateorganizations. All but 12 agreements are worth more than $1 million in contractual value. Our largest activeagreement ($50 million) is with CIDA for the CanadianInternational Food Security Research Fund.
Other large co-funded programs include:
� The Climate Change Adaptation in Africa program(program budget of $51.6 million) funded by IDRCand the UK Department for InternationalDevelopment (DFID). DFID is IDRC’s largest non-Canadian co-funder. DFID’s contribution amounts to$45.3 million.
� The Global Health Research Initiative ($49.4million), a partnership of five Canadian federalagencies and departments: Canadian Institutes ofHealth Research, CIDA, Health Canada, IDRC, andthe Public Health Agency of Canada.
� The Think Tank Initiative ($113 million) with the Bill& Melinda Gates Foundation, the William and FloraHewlett Foundation, DFID, and the Netherlands’Directorate-General for International Cooperation(DGIS). DFID and DGIS were new partners to thisinitiative during 2010 –2011.

MANAG ING AND MEASUR ING OUR P ER FORMANCE 29
During 2010–2011, IDRC signed six new multi-yearpartnership agreements with a total value of $15.7 million.Among the largest were those with DFID and DGIS thatexpanded the resources for the Think Tank Initiative by $14.5 million. Supplements were agreed to the Economy andEnvironment Program for Southeast Asia by the SwedishInternational Development Cooperation Agency and to theClimate Change Adaptation in Africa program by DFID.
The graph above illustrates that the number of new partner-ship agreements decreased in 2010–2011. However, giventhe different maturity of active donor agreements,significant funds remain from previously signed agreements($165.0 million at the end of 2010–2011). Any newagreements signed will contribute to a steady level ofproject expenditures, and therefore, revenues going intothe future (see Revenue Outlook, page 38).
Engaging with international organizations In addition to increasing the resources available fordevelopment research, IDRC seeks to enhance itsengagement with key international organizations interestedin research for development. During 2010–2011, wecontinued to support the Donor Committee for EnterpriseDevelopment, a forum for donors to share their experiencewith private sector development. We are an active memberof Enhancing Support for Strengthening the Effectivenessof National Capacity Efforts, a collaborative framework for
donors working to enhance research capacity in Africa. We also work with other funders through the InternationalForum of Research Donors.
EvaluationResponsibility for nurturing evaluative thinking, buildingevaluation capacity among IDRC staff and partners, andcarrying out research on evaluation tools and methodsresides within IDRC’s Evaluation Unit. Evaluation atIDRC is carried out for both accountability and learning.
During 2010–2011, IDRC developed and adopted a newevaluation strategy to inform and support the implementationof the Centre’s Strategic Framework 2010–2015. IDRCEvaluation Strategy 2010–2015 is available at www.idrc.ca.
The Evaluation Unit manages, conducts, and supportsthree types of evaluation: � strategic evaluations of the consolidated impact
of research � external reviews of IDRC programs� evaluations of particular projects, themes, results,
and organizations.
Strategic evaluationsStrategic evaluations provide evidence of the success orfailure of IDRC efforts to achieve program goals. Theyalso inform our staff, management, and partners of issuesof concern to the organization as a whole, identifypotential improvements in our structure and/or operations,and strengthen our evaluative culture. We did not completea strategic evaluation in 2010–2011 as we focused onexternal reviews.
External reviews Every IDRC program is reviewed approximately every five years. Conducted by a team of independent experts,these reviews document the program’s strategy andevolution, key research findings, major programoutcomes, and the main lessons drawn from the program’sexperiences. We use the reviews to develop new programsand strategies.
PROFILE OF DONOR AGREEMENTS
225
2001751501251007550250
2007–2008
2008–2009
2009–2010
2010–2011
Annual value (number) of agreements signed and amended
Undisbursed donorcontributions at 31 March
52.7($ m
illions)
(19)
112.1
(23) 56.4
(13)16.1
(8)

30 IDRC ANNUAL R EPORT 2 0 10–2011
During 2010–2011, six external reviews were completedfor the Research for Health Equity; Innovation, Technology,and Society; and Information and CommunicationTechnologies for Development programs.
All external reviews were of acceptable quality and areavailable at www.idrc.ca.
Program and project evaluationsIn 2010–2011, 183 project completion reports werecompleted. These reports on projects are preparedaccording to a rolling process under which achievementsand learning are captured during and at the end of theresearch. During 2011–2012, IDRC will evaluate how thisrolling process affects the reports and their overall quality.
These reports also form the basis of an Annual LearningForum for all staff. The 2010–2011 reports informed aCentre-wide forum on effective communication ofresearch, held in April 2011.
Human resources IDRC launched its Human Resources Plan 2010–2013 thispast year. The new plan establishes three key objectives: � finding and growing talent globally� providing a stimulating workplace� enhancing the Centre’s capacity to manage human
resources.
To meet these objectives, we will harness staff strengths;facilitate meaningful communication; modernize humanresource (HR) operations and processes; and enhancewellness initiatives.
Harness staff strengthsThe HR Plan acknowledges the diversity of staffcharacteristics and needs and establishes consistentprograms, policies, and benefits in support of sharedvalues at head office and each regional office.
In 2010–2011, one-third of vacant positions were filledwith internal candidates. This has provided a suitablebalance between continuity and renewal.
Training and development help to build staff skills. In2010–2011 � 101 employees undertook language training� 25 employees attended workshops on career planning � orientation training was provided to 50 new head office
employees.
Recruitment and retentionOn 31 March 2011, there were 487 persons (Ottawa-hiredand locally engaged staff) employed at IDRC: 64% werelocated at head office in Ottawa and 36% were in regionaloffices.
Close to 45% of our workforce has been at IDRC for lessthan five years. Recruiting individuals with the skills werequire has always been a priority. In 2010–2011 weadopted a more systematic, targeted outreach to universitiesand international networks to raise awareness of IDRC andemployment opportunities. This effort supplementstraditional recruiting approaches. During the year, we
Outcome mapping: A decade later
Outcome mapping celebrated its 10th anniversary in2010–2011. Developed at IDRC, this method forplanning and evaluating development projects focuseson changes in behaviour rather than on products. Thismethodology is now integrated into standard practicebecause of its ability to support learning and its agility in complex situations. By 31 March 2011, the onlineoutcome mapping learning community had grown tomore than 2,500 members. Funded by IDRC, thiscommunity is coordinated by the UK’s OverseasDevelopment Institute.
Outcome Mapping: Building Learning and Reflection intoDevelopment Programs is now available in six languagesand is online at www.idrc.ca/books.

MANAG ING AND MEASUR ING OUR P ER FORMANCE 31
received 9,362 applications from all parts of Canada andfrom abroad for 50 advertised positions. Staff turnover ratewas 13%, slightly lower than in comparable organizations.
We strive to create a workplace representative of Canadianlabour market availability. Women and visible minoritiesare well represented at IDRC. However, despite specialinitiatives over the past three fiscal years, Aboriginals andpersons with disabilities remain under-represented athead office.
Facilitating communicationIDRC’s culture of collaboration requires frequent formaland informal discussions. During 2010–2011, we � carried out an ongoing dialogue between employees
and managers on new staffing and performancemanagement policies and guidelines
� held a second round of 360-degree feedback exercises� carried out succession management discussions in
Ottawa and the regional offices � consulted regularly with members of the staff
associations� held quarterly meetings of the Advisory Committee on
Regional Offices and Human Resources ManagementCommittee.
During 2011–2012 a Quick Pulse Survey of all staff will becarried out to seek employee feedback on topics such asthe work environment, training and developmentopportunities, leadership, and communications.
Modernizing HR operations and processes During 2010–2011, we launched 18 new or revised HRpolicies and guidelines, including a HR Delegation Policyand Authority Matrix. The objective was to make HRmanagement principles better known and understood byall. Upgrades to the payroll system this year will make theimplementation of self-service applications possibleduring 2011–2012.
Enhancing wellness IDRC strives to create a healthy work environment. Inaddition to providing travel health services, we organizevarious health-promotion activities for employees at headoffice and in the regions. This year, we organized ninedifferent types of workshops, ranging from sessions onnavigating life transitions, smoking cessation, tounderstanding mental health.
The Centre also engaged a new Employee AssistanceProgram provider to better meet staff needs.
CommunicationsIDRC’s Strategic Framework 2010–2015 includes astronger emphasis on communicating the results ofresearch to our stakeholders, and training staff andgrantees to better communicate. The CommunicationsDivision works to ensure continued and increased supportfor development research, to raise awareness andknowledge of IDRC, and to build the communicationcapacity of staff and grantees.
Create awareness and build support for IDRC and development researchIDRC’s 40th anniversary provided an exceptionalopportunity to raise awareness and demonstrate thecontinued relevance and value of our work. Throughout2010–2011 we hosted events and undertook activities inCanada and abroad through our regional offices. Theseincluded� a monthly series of websites highlighting the lasting
impacts of research we have supported, such as higherincomes, greater food security, better health.
� 16 lectures in our Speakers of Renown series onpressing development issues: more than 2,200 peopleattended and 17,000 others have watched the webcastsor archived videos on IDRC’s YouTube channel.
� 17 events showcased the impact of research fordevelopment on nine Canadian university and collegecampuses during International Development Week in February 2011.

32 IDRC ANNUAL R EPORT 2 0 10–2011
Expanding international awareness of IDRC and development researchMedia coverage of IDRC continues to increase steadily.IDRC-funded projects, staff, and grantees appeared in4,381 news reports reaching an estimated 430 millionpeople. IDRC media coverage continues to be heavilyWeb-based, with 85% of the reports appearing in onlinemedia. The coverage was overwhelmingly positive.
Social media is gaining in importance at IDRC. Launchedin early 2010, our Facebook page now counts 2,000 friendswhile our Twitter followers now number more than 1,800.IDRC launched its first blog, Development Research Works,in March 2011, authored by Rohinton Medhora, Vice-President, Programs, to explore issues and practices ininternational development.
Sharing research resultsIn January 2011 the first volume in the Insight andInnovation in International Development flagshipcollection was published. Universities in Transition,explores the changing role and challenges for academicinstitutions. This collection is a collaboration withSpringer Science+Business Media, LLC. We plan to releasefour more titles in 2011–2012.
During the past year we published 27 books presentingthe results of IDRC-supported research through co-publishing agreements with 20 commercial and academicpublishers in Canada, Europe, and developing countries.All IDRC books are fully open access and are availablefree of charge on the IDRC website.
During 2010–2011, we added some 2,554 researchdocuments to our digital library, which provides theinternational research community with access to acomprehensive collection of research results and documents generated by IDRC-funded projects, recipients, and staff. This is also an important part of ouraccountability to Canadian taxpayers. More than 45,000documents are now available through our website.
Information management and technologyDuring 2010–2011, the Information TechnologyManagement and the Research Information Managementdivisions merged to form the Information ManagementTechnology Division (IMTD). IMTD combines thestrengths of both former divisions and creates a clearservice orientation.
The work of the new division is guided by a three-yearstrategic plan. A central goal of this plan is to establish asingle interface to the Centre’s information. This will� improve the ability of staff to collaborate and preserve
knowledge � increase the effectiveness of information-sharing using
the Internet � allow us to explore, deploy, and support useful new
technologies economically and quickly.
Maturing IDRC’s information infrastructureDuring 2010–2011, IMTD’s strategic activities focused on:
� Meeting the Centre’s changing informationmanagement needs. This Basic Content Initiative, as itis called, is a three-year enterprise: • During 2010–2011 the public website was revitalized
and workspaces for internal collaboration wereintroduced.
• In 2011–2012, the capability for extranetcollaboration with partners will be built and a morerobust search engine implemented.
• In 2012–2013, we will focus on developing a moreeffective system for archiving and recall ofinformation.
� Creating a funding and awards portal. This Web-basedtool will allow IDRC programs to post theircompetitive grant processes, and potential recipients to apply online. The tool will help IDRC staff to accessand evaluate those applications. The system waslaunched as a working beta site in March 2011.

MANAG ING AND MEASUR ING OUR P ER FORMANCE 33
Information security During 2010–2011, Web-content filtering technology wasimplemented to protect staff and the Centre from illegalcontent and malicious software. Web-content filteringcomplies with the Centre’s policies and Canadian federalprivacy legislation. The average number of threats —including viruses, Trojans, and other malware — detectedand blocked each week exceeds 2,200.
As part of the ongoing process to protect IDRC’sincoming email from spam and malware, we replaced ourexisting anti-spam solution, which was housed at allIDRC offices, with one operating on the Internet “cloud.”This provided IDRC with a more cost-effective solutionwhile being more scalable and responsive to new threats.This year, we recorded a daily average of 35,000 spam andmalicious emails, accounting for 85% of email received.
DAVID M. MALONE
President (Chair)
ABOUDOU KARIM ADJIBADE
Regional Director, Middle East and North Africa
FEDERICO BURONE
Regional Director, Latin America and the Caribbean
SIMON CARTER
Regional Director, Eastern andSouthern Africa
MICHAEL CLARKE
Director, Research for Health Equity;Director, Information andCommunication Technologies for Development
NIKKI DIGNARD
Director, Finance and Administration
SYLVAIN DUFOUR
Vice-President, Resources and ChiefFinancial Officer
NASER FARUQUI
Director, Innovation, Policy, and Science
JEAN LEBEL
Director, Agriculture and Environment
STEPHEN MCGURK
Regional Director, South Asia and China
ROHINTON MEDHORA
Vice-President, Programs and Partnerships
LAUCHLAN T. MUNRO
Vice-President, Corporate Strategy and Regional Management
ANNETTE NICHOLSON
Secretary and General Counsel
LINE NOREAU
Director, Human Resources
ANGELA PROKOPIAK
Director, Communicationsand Parliamentary Affairs
GERD SCHÖNWÄLDER
Director, Policy and Planning Group
ROSALIA SCIORTINO
Regional Director, Southeast and East Asia
SUE SZABO
Director, Social and Economic Policy
KATHRYN TOURÉ
Regional Director, West and Central Africa
Senior Management Committee (as at 31 March 2011)

34 I D R C A N N u A L R e p o R T 2 0 1 0 – 2 0 1 1
Summary of results � Revenue increased by 16.0% to $248.8 million from$214.5 million in 2009–2010 as a result of increasedfunding from Parliament and donors. Details are onpage 35.
� Expenses increased by 3.9% to $219.1 million from$210.9 million in 2009–2010, due primarily to greaterdonor partnership spending. Details are on page 40.
� Development Innovation Fund (DIF) spendingincreased to $9.4 million from $1.7 million in2009–2010. However, it still lagged behind the relatedrevenues, resulting in a $15.8 million unspent balanceas at 31 March 2011.
� As at 31 March 2011, equity had increased by 176.9%to reach $46.6 million compared to $16.8 million at31 March 2010. The equity balance includes$15.8 million related to the DIF and $8.4 million forthe African Adaptation Research Centres (AARC).In total, equity was $0.6 million lower than budgeted.Details are on page 48.
� Outstanding commitments funded by Parliamentaryappropriations, excluding the DIF, increased by 1.4%while those funded by donor contributions increasedby 48.7% over the course of the year. Details are onpage 46.
Note: All monetary amounts are in Canadian dollars unlessotherwise stated.
Management’s discussion and analysis
M A N A G I N G A N D M E A S U R I N G O U R P E R F O R M A N C E
FIGURE 1: FINANCIAL HIGHLIGHTS
300
250
200
150
100
50
0
($millions)
Revenues Expenses Internally restrictedequity
2009–2010 2010–2011 2011–2012 Budget
The internally restricted equity is to be used specifically for the DIF and the AARC.

M A N A G e M e N T ’ S D I S C u S S I o N A N D A N A Ly S I S 35
RevenuesThe Centre derives its funding from five sources:Parliamentary appropriations, donor contributions,recovery of administrative costs, investment income, andother income. Of these, Parliamentary appropriations are
the most significant. Parliamentary appropriations areincluded with revenues for discussion purposes, althoughthey do not appear as revenues on the Statement ofOperations.
2011–2012 2010–2011 2009–2010
Revised % change($000) Budget budget Actual Variance Actual actuala
Total revenues 261 990 251 124 248 838 (2 286) 214 461 16.0%
Parliamentary appropriations (Table 2) 211 327 196 182 195 616 ( 566) 174 041 12.4%
Donor contributionsFunding for developmentresearch programming 45 259 48 490 46 299 (2 191) 35 109 31.9%
Recovery of administrative costs 4 390 4 925 4 623 ( 302) 3 842 20.3%
Investment income 600 311 627 316 288 117.7%
Other income 414 1 216 1 673 457 1 181 41.7%
a % change actual in 2010–2011 over 2009–2010.
TABLE 1: ReveNueS
Parliamentary appropriation revenueThe Centre receives different types of Parliamentaryappropriations including a share of Canada’s OfficialDevelopment Assistance (ODA) envelope and federalgovernment funding from other sources. Parliamentaryappropriations increased by 12.4% to $195.6 millioncompared to $174.0 million in 2009–2010, $0.6 millionlower than budgeted. The decline is the result ofaccounting adjustments related to property andequipment purchased and amortized, not to reducedvotes in Parliament. The Centre will be changing the wayit accounts for property and equipment and intangibles in2011–2012 (see Balance Sheet Outlook, page 49).
The federal budget tabled in February 2008 created theDevelopment Innovation Fund (DIF) to be “implementedby strategic partners in the research community workingwith the International Development Research Centre.”The government selected health as the DIF’s initialresearch theme. The DIF is being driven by a consortiumled by the Centre. The Parliamentary appropriation forthe DIF was $20.0 million in 2010–2011.
Parliamentary appropriations also included transfers fromother federal agencies that are not part of the long-termrecurring funding base, but a result of the Centre’scollaborations with other federal agencies.

36 I D R C A N N u A L R e p o R T 2 0 1 0 – 2 0 1 1
Donor contribution revenuesRevenues from donor contributions relate to funding forentire development research programs and to funding forspecific research projects within existing developmentresearch programs the Centre conducts or manages onbehalf of other organizations. Funds received in advanceare not recognized as revenue until the related expensesare incurred. Consequently, the impact of variances indonor contributions on the Centre’s net results and
year-end equity is limited to the amount of administrativecosts recovered (or not) from donors. Despite ending theyear at $2.2 million lower than budgeted, donorcontribution revenues, excluding administrative costsrecovery, increased by 31.9% to $46.3 million compared to$35.1 million in 2009–2010. The budget variance is dueto delayed spending on a few large agreements.
2011–2012 2010–2011 2009–2010 % change($000) Budget Actual Actual actuala
Appropriation before transfers 208 057 195 574 168 171 16.3%
Appropriation transfers fromCanadian International Development Agency — — 2 000 -100.0%Canadian Institutes of Health Research 676 172 3 579 -95.2%Public Health Agency of Canada 176 172 246 -30.1%Natural Sciences Engineering Research Council of Canada 500 — — —
Social Sciences and Humanities Research Council of Canada 350 — — —
1 702 344 5 825 -94.1%
Total approved appropriations 209 759 195 918 173 996 12.6%
Deferrals and amortizations (Note 12) 1 568 (302) 45 —
Total appropriations recognized (Table 1) 211 327 195 616 174 041 12.4%
a % change actual in 2010–2011 over 2009–2010.
TABLE 2: AppRoveD pARLIAMeNTARy AppRopRIATIoNS

M A N A G e M e N T ’ S D I S C u S S I o N A N D A N A Ly S I S 37
a expended on development research programming andadministrative cost recovery.
CIDA: Canadian International Development AgencyDFID: Department for International Development (uK)
The volatility in sources and levels of donor funding can beseen in Figure 2. For example, in 2010–2011, total fundingfrom the Canadian International Development Agency(CIDA) increased to $15.2 million, representing 29.9% oftotal donor funding, compared to $7.2 million and 18.5%of funding in 2009–2010.
The recovery of administrative costs representsreimbursement for costs incurred to administer projectsand to support project staff, but does not include coreoperating costs covered by Parliamentary appropriations.The rate of cost recovery is calculated according togenerally accepted management accounting principles andis reviewed annually. Since the recovery of administrativecosts from donor contribution agreements is directlyproportional to donor contribution revenues recognized,the total variance is proportional to the variance in therevenues recognized from donor contributions. Revenuein 2010–2011 was under budget by $0.3 million.
FIGURE 2: ReveNueS FRoM DoNoR CoNTRIBuTIoNS a
18
16
14
12
10
8
6
4
2
0
($millions)
CIDA DFID Bill &Melinda The William OthersGates and Flora
Foundation HewlettFoundation
2009–2010 2010–2011
FIGURE 3: ReCoveRy oF ADMINISTRATIve CoSTS CoMpAReD To DoNoR CoNTRIBuTIoN ReveNueS
2006– 2007– 2008– 2009– 2010– 2011–2007 2008 2009 2010 2011 2012
% of recovery of administrative costs
12%
11%
10%
9%
8%
7%
Actuals Projections

38 I D R C A N N u A L R e p o R T 2 0 1 0 – 2 0 1 1
The recovery of administrative costs on donorcontribution agreements decreased to 10.0% of directproject costs (recognized as donor contribution revenues)in 2010–2011 from 10.9% in 2009–2010. The variancereflects the implementation of a large agreement withan 8.0% contracted administrative cost-recovery rate,substantially lower than the Centre’s 12.0% standardadministrative cost-recovery rate. The lower rate of costrecovery corresponds to lower projected administrativecosts related to this agreement. The Centre hasconservatively budgeted an average cost-recovery rate of9.7% for 2011–2012, which takes into consideration thevariances in rates on the many agreements that will beactive during the year.
Investment income In line with the Centre’s asset management policy, excessworking capital is invested in high-quality money marketinstruments that returned investment income of$0.6 million in 2010–2011. For the first half of 2010–2011there was limited availability of short-term instrumentsoffering yields higher than those earned on the Centre’sbank account balances. It was not until mid-year thatmoney market investment rates rose above those offeredby the Centre’s bank on cash deposits. From that pointforward, many short-term investments were made andcash balances dropped steadily over the balance of the year.The average return on the bank account and investmentswas 0.90% compared to the average Treasury Bill yieldof 0.75% for 2010–2011.
Other incomeOther income includes revenues associated with conferenceand catering facilities and other miscellaneous items suchas the sale of publications and office space subleasing.Income from these sources amounted to $1.7 million in2010–2011, slightly higher than the $1.2 million earnedin 2009–2010.
Revenue outlookThe 2010–2011 federal budget capped the Centre’s shareof the International Assistance Envelope at the 2010–2011levels. Despite this cap, the 2011–2012 revenue budgetwill increase by $13.2 million from $248.8 million in2010–2011 to reach an all-time high for the Centre of$262.0 million (see Table 1, page 35). The variance reflectsan increase in revenue of $25.0 million for the DIF,partially offset by the non-recurrence of a one-timeamount of $10.0 million received in 2010–2011 for theAfrican Adaptation Research Centres (AARC). TheCentre will continue to receive Parliamentaryappropriation transfers from other federal departmentsas indicated in Table 2 (see page 36).
Over the past several years, the Centre has entered intolarge financial agreements with donors for fundingprograms in their entirety rather than smaller singleprojects. The implementation of these programs willcontinue. During 2011–2012, management anticipatesthat $41.3 million — 91.2% of $45.3 million in donorcontribution funding available for the year — will be

M A N A G e M e N T ’ S D I S C u S S I o N A N D A N A Ly S I S 39
recognized against existing donor agreements. Theremaining $4.0 million is expected to be recognizedagainst new agreements to be finalized during 2011–2012.
Figure 4 shows the total value of signed donorcontribution agreements ($281 million), the amountremaining to be allocated to projects from theseagreements ($71 million), and the amount ofundisbursed donor contributions ($165 million) as at31 March 2011. Of the $281 million in active agreements,$116 million had been expensed by 31 March 2011,leaving $165 million in undisbursed donor contributionsfor the remaining life of the agreements. Managementexpects to realize $49.6 million (30% of the undisburseddonor contributions) during 2011–2012.
The Centre’s Parliamentary appropriations representedapproximately 78.6% of total revenues in 2010–2011.This will increase to 81.0% in 2011–2012, mostly due toplanned revenue increases for the DIF (see Figure 5).
FIGURE 4: DoNoR FuNDING AS AT 31 MARCH 2011
Active Allocations Expensesagreements
300
250
200
150
100
50
0
281210
71
116
165undisburseddonorcontributionsoutstanding
commitments104.9
unallocatedto projects
($millions)
300
250
200
150
100
50
0
($millions)
FIGURE 5: ReLATIve SHAReS oF INCoMe (ACTuAL AND pRoJeCTeD) 2006–2007 To 2011–2012
145
521
150
429
169
233
174
1
39
196
2
51
211
1
50
2006– 2007– 2008– 2009– 2010– 2011–2007 2008 2009 2010 2011 2012
Actuals Projections
Parliamentary appropriations
Donor contributions
Other

ExpensesThe Centre tracks its expenses under two main headings:corporate and administrative services; and development
research programming, which is tracked by two businesslines — research projects and capacity building.
40 I D R C A N N u A L R e p o R T 2 0 1 0 – 2 0 1 1
2011–2012 2010–2011 2009–2010
Revised % change($000) Budget budget Actual Variance Actual actual a
Total expenses 241 754 220 793 219 099 (1 694) 210 947 3.9%
Development research programmingResearch projectsFunded by Parliamentary appropriations 123 608 100 046 104 641 4 595 108 430 -3.5%
Funded by donor contributions 39 766 41 443 39 861 (1 582) 27 839 43.2%
163 374 141 489 144 502 3 013 136 269 6.0%Capacity buildingFunded by Parliamentary appropriations 47 814 47 022 44 111 (2 911) 43 597 1.2%
Funded by donor contributions 5 493 7 047 6 438 ( 609) 7 270 -11.4%
53 307 54 069 50 549 (3 520) 50 867 -0.6%
216 681 195 558 195 051 ( 507) 187 136 4.2%
Corporate and administrative services 25 073 25 235 24 048 (1 187) 23 811 1.0%
a % change actual in 2010−2011 over 2009−2010.
TABLE 3: expeNSeS
Development research programming expenses
Development research programming expenses increasedby 4.2% in 2010–2011 to $195.1 million from$187.1 million in 2009–2010. The net increase was theresult of an $11.2 million increase in expenses fundedby donor contributions and a $3.3 million decrease inexpenses funded by Parliamentary appropriations. Thedevelopment research programming envelope consists ofexpenses for capacity-building activities and researchprojects. Research projects include grants to recipients for
technical and scientific research projects as well as theCentre-administered (in-house) portion of researchprojects, which is expended by the Centre when there areno recipients to whom the work can be devolved. Capacitybuilding is carried out through two main modalitiesrelated to the Centre’s grants-plus business model: in-house projects and mentoring activities providedby the Centre.
As noted above, Centre-administered (in-house) projectexpenses are found in both the subcategories of research

M A N A G e M e N T ’ S D I S C u S S I o N A N D A N A Ly S I S 41
TABLE 4: ReSeARCH pRoJeCT expeNSeS By pRoGRAM FoR THe yeAR eNDeD 31 MARCH 2011 ($000)
2010–2011 2009–2010
Funded by Funded Parliamentary by donor
Program area appropriations contributions Total Total
Agriculture and Environment 24 081 12 368 36 449 36 787
Information and Communication Technologies for Development 20 300 2 550 22 850 26 944
Innovation, Policy, and Science 7 788 — 7 788 7 960
Social and Economic Policy 20 795 15 115 35 910 28 410
Research for Health Equity 17 912 8 455 26 367 18 182
Special Initiatives Division 8 622 1 080 9 702 10 562
Program Support and Complement 1 639 — 1 639 2 878
Corporate Strategy and Regional Management Branch 3 504 293 3 797 4 546
Total 104 641 39 861 144 502 136 269
projects and capacity building. When dividing the totaldevelopment research programming expenses bymodality, we gain a different perspective on the make upof these expenses. In 2010–2011, close to $124.3 millionof the development research programming expenses werespent on grant payments to recipients, compared to$111.2 million in 2009–2010 (see Figure 6). In-houseprojects represented $31.1 million of the developmentresearch programming expenses in 2010–2011, downfrom $37.3 million in 2009–2010. The Centre’s mentoringcosts remained relatively stable in 2010–2011 at$39.7 million of development research programmingexpenses compared to $38.6 million in 2009–2010.
As previously noted, research project expenses reflect thedirect costs, mainly in the form of grants and scientificand technical research project funding, administered bythe Centre as part of its ongoing programs. This categoryof expenses also includes individual training grants,scholarships, fellowships, internships, and individualresearch and research-related grants that support thework and activities undertaken by individuals.
In 2010–2011, the share of research project expensesfunded by Parliamentary appropriations decreased by3.5% to $104.6 million compared to $108.4 million in2009–2010: they were nonetheless $4.6 million more thanbudgeted. The variance is primarily due to higher expensesfor the DIF. The decline in expenditures levels was not aspronounced as anticipated in the revised budget.
FIGURE 6: DeveLopMeNT ReSeARCH pRoGRAMMING expeNSeS
250
200
150
100
50
0
111.2
37.3
38.6
124.3
31.1
39.7
144.5 Research projectsa
50.6 Capacity buildinga
136.2 Research projectsa
50.9 Capacity buildinga
($millions)
187.1 195.1
Grants In-house research Mentoring and other projects capacity-building activities
2009–2010 2010–2011
a See Table 3

42 I D R C A N N u A L R e p o R T 2 0 1 0 – 2 0 1 1
As shown in Figure 7, the proportion of the Centre’sdevelopment research programming expenses used asmatching funds (or co-funding) to donor contributionfunding decreased to 11.4% in 2010–2011 from 13.2%in 2009–2010. As the level of donor contribution activityincreased (to 23.7% in 2010–2011 from 18.8% in2009–2010), the level of development researchprogramming expenses related to projects funded solelyby the Centre declined to 64.8% of the total in 2010–2011compared to 68.0% in 2009–2010.
The capacity-building portion of the developmentresearch programming expenses represents the Centre’sadvisory and knowledge-brokerage functions. During2010–2011, expansion in capacity-building activities notrelated to donor contributions was constrained to littlemore than inflationary growth as management restrictedincreases to expenses. Management also reviewed theimpact of not filling positions vacated by departingemployees to further reduce costs and manage theanticipated impact of future inflation. Capacity-buildingexpenses decreased 0.6% to $50.6 million in 2010–2011from $50.9 million in 2009–2010, $3.5 million lower thanbudgeted. These savings are primarily due to under-spending on travel, salaries, and benefits, and expensesfunded by Parliamentary appropriations.
Corporate and administrative services expensesCorporate and administrative services provide a variety ofpolicy, executive, administrative, and service functionssuch as legal, information technology, human resourcemanagement, financial management, facilitiesmanagement, and material management and procurementservices. These services support the Centre’s overalloperations and corporate responsibilities. All corporateand administrative services expenses except salaries andrent were constrained in 2010–2011. As a result, despitemodest salary and rent increases, expenses increased byonly 1.0% to $24.0 million from $23.8 million in2009–2010. These expenses were $1.2 million less thanbudgeted, primarily due to underspending on professionalservices and amortization. As shown in Figure 8, the
FIGURE 7: DeveLopMeNT ReSeARCH pRoGRAMMINGexpeNSeS — CeNTRe AND DoNoR FuNDING
250
200
150
100
50
0
($millions)
187.1 195.1
IDRC Donors Co-funded
2009–2010 2010–2011
FIGURE 8: CoRpoRATe AND ADMINISTRATIve SeRvICeSexpeNSeS
30
25
20
15
10
5
0
($millions)
23.8 24.0
2009–2010 Expenses
2010–2011Expenses
Corporate services
Regional office management
Information Technology
Finance and AdministrationDivision
Human Resources Division

M A N A G e M e N T ’ S D I S C u S S I o N A N D A N A Ly S I S 43
spending by function in 2010–2011 remained relativelystable year over year.
As shown in Figure 9, corporate and administrative costsdeclined from 14.4% in 2006–2007 to a projected 10.4% in2011–2012. The Centre continues to strive to balanceprogram spending and administrative costs.
Expenses outlookExpenses will reach $241.8 million during 2011–2012.
Development research programming expenses areexpected to increase by 11.1% to $216.7 million in2011–2012 compared to actual expenses of $195.1 millionin 2010–2011. The increase reflects planned expenses onthe DIF as well as large donor-funded programs such asthe Canadian International Food Security Research Fund.
Corporate and administrative services budgets arebudgeted to remain relatively consistent at $25.1 million.
Management’s decision to restrict expenses related tocorporate and administrative services, as well as theportion of capacity building not related to donorcontributions, will help to address the freezing of theCentre’s appropriation for the foreseeable future andposition the Centre for the government’s strategic andoperating review expected in 2011–2012.
It is noteworthy that expenses for outstandingcommitments funded by Parliamentary appropriationswill reach an all-time high of $96.2 million in 2011–2012(see “old” projects in Figure 10). This amount representsnearly 78% of the funding available for projects during theyear. The increase in expenditures from previous yearscontinues to be reflected in ongoing projects, but thefreezing of the regular Parliamentary appropriation(excluding the DIF) leaves substantially fewer resources tofund new projects. The funding available for new projectswill drop from $32.8 million in 2010–2011 to $27.4 millionin 2011–2012. Management expects funding available fornew projects to remain steady at about $27 millionafter 2011–2012.
We expect DIF-related expenditures to grow incrementallyover the next 24 months, reflective of the pace at whichprojects are moving forward. That trend will have afavourable impact on the relative share of administrativeservices costs (Figure 9).
FIGURE 9: ADMINISTRATIve CoSTS
2006– 2007– 2008– 2009– 2010– 2011–2007 2008 2009 2010 2011 2012
% of administrative costs as % of total expenses
15%
14%
13%
12%
11%
10%
9%
8%
Actuals Projections
FIGURE 10: pARLIAMeNTARy AppRopRIATIoN-FuNDeDpRoGRAM expeNSeS
2005– 2006– 2007– 2008– 2009– 2010– 2011–2006 2007 2008 2009 2010 2011 2012
Actuals Projections
140
120
100
80
60
40
20
0
DIF
Total ($m
illions)
New projects
old projects

44 I D R C A N N u A L R e p o R T 2 0 1 0 – 2 0 1 1
Program allocations funded by ParliamentaryappropriationsProgram allocations represent the funds approved for newresearch projects, which can last up to five years.Disbursement is progressive over the project’s life. Therecurring program allocations funded by Parliamentaryappropriations decreased to $127.4 million in 2010–2011from $305.9 million in 2009–2010. This included therequired matching funds for projects and programs co-financed with donors, which declined to $20.7 millionfrom $29.4 million in 2009–2010. The significant decreasereflects the one-time DIF allocation of $220.5 million in2009–2010. Excluding the DIF, 2010–2011 regularprogram allocations increased 49.2% to $127.4 millionfrom $85.4 million in 2009–2010, primarily due to twolarge projects being fully allocated during the year and forwhich the Centre received additional revenue.
Other key financial indicators
FIGURE 11: pRoGRAM ALLoCATIoNS (ACTuAL AND pRoJeCTeD) 2006–2007 To 2011–2012
400
350
300
250
200
150
100
50
0
Actuals Projections
Funded by Parliamentary appropriations
DIF Funded by donorcontributions
27.2
114.3146.7 129.9 87.8
49.0
60.6 82.737.0
127.5
17.6
220.5
2011–2012 2010–2011 2009–2010
Revised % change($000) Budget budget Actual Variance Actual actual a
Total program allocations 117 650 214 935 210 163 (4 772) 357 340 -41.2%
Development research programmingFunded by Parliamentary appropriations
Recurring funding 100 000 128 647 127 420 (1 227) 305 862 -58.3%
Specific projects andprograms funding 50 500 74 ( 426) 2 432 -97.0%
Funded by donor contributions 17 600 85 788 82 669 (3 119) 49 046 68.6%
a % change actual in 2010–2011 over 2009–2010.
TABLE 5: pRoGRAM ALLoCATIoNS
100.1
($millions)
2006– 2007– 2008– 2009– 2010– 2011–2007 2008 2009 2010 2011 2012

M A N A G e M e N T ’ S D I S C u S S I o N A N D A N A Ly S I S 45
Program allocations funded by donor contributionsThe program allocations funded by donor contributionsincreased by 68.6% to $82.7 million in 2010–2011($3.1 million below budget) compared to $49.0 million in2009–2010. The significant increase in 2010–2011 is dueto the rollout of Think Tank Initiative activities in LatinAmerica and South Asia, and the approval of manyresearch projects covered by the Canadian InternationalFood Security Research Fund.
Most (around 82.0%) of the $210.2 million programallocations made in 2010–2011 were committed duringthe 2010–2011 fiscal year. Expenditures began for projectscommitted in 2010–2011 and will continue over thelifespan of the individual projects. During 2010–2011,program allocations increased from an original budget of$90.5 million to $127.4 million as a result of one-timeincreases to the Centre’s Parliamentary appropriations.To accommodate the cap in the Centre’s recurringParliamentary appropriation at 2010–2011 levels (seeRevenue Outlook, page 38), management has determinedthat the 2011–2012 program allocations funded byParliamentary appropriations will be $100.1 million,which is $27.4 million lower than in 2010–2011(see Figure 11). When co-funding pledges to projectsare considered, the amount of funds remaining forprogramming not linked to donor contributions standsat $91.1 million or 77% of total program allocationsof $117.7 million (see Figure 12).
FIGURE 12: expeCTeD FuNDING SouRCe oF pRoGRAM ALLoCATIoNS
400
300
200
100
0
Funded by donor contributions
Funded by Parliamentary appropriations but linked to donor contributions
Funded by Parliamentary appropriations — DIF (one-time only)
Funded by Parliamentary appropriations
($millions)
357.3
2009–2010
117.7
2011–2012
210.2
2010–2011
Actuals Projections

As at 31 March 2011, the Centre is committed to paymentsof up to $471.9 million on development researchprogramming activities over the next five years. Thiscommitment is subject to funds being provided byParliament ($366.7 million) and by donor partners($105.2 million) and, with few exceptions, to recipients’compliance with the terms and conditions of their grantagreements. The increase in outstanding commitmentsfunded by donor contributions reflects the approval of alarge project during the year. The DIF-related outstandingcommitment is valued at $208.8 million. Excluding thisamount, the outstanding commitment funded byParliamentary appropriations remains relatively stable ata 1.4% increase to $157.9 million from $155.7 millionin 2009–2010.
Of the $366.7 million in outstanding commitments fundedby Parliamentary appropriations, $36.6 million is linked toprojects co-financed by donor contribution agreements,which are included in the $157.9 million in Table 6.
46 I D R C A N N u A L R e p o R T 2 0 1 0 – 2 0 1 1
2010–2011 2009–2010 % change($000) Actual Actual actuala
Total outstanding commitments 471 851 444 415 6.2%
Funded by Parliamentary appropriations – DIF b 208 795 217 975 -4.2%
Funded by Parliamentary appropriations 157 887 155 725 1.4%
Funded by donor contributions 105 169 70 715 48.7%
a % change actual in 2010–2011 over 2009–2010.b This segregation is made solely by management to facilitate the interpretation of the figures below.
TABLE 6: ouTSTANDING CoMMITMeNTS oN DeveLopMeNT ReSeARCH pRoGRAMMING
FIGURE 13: ouTSTANDING CoMMITMeNTSoN DeveLopMeNT ReSeARCH pRoGRAMMING
500
450
400
350
300
250
200
150
100
50
0
20.7
110.0162.6 159.6 155.7
70.7
53.4
105.2
30.2
157.9
75.0
218.0 208.8 197.7
162.7
($millions)
Internal Internal – DIF External
2006– 2007– 2008– 2009– 2010– 2011–2007 2008 2009 2010 2011 2012
Actuals Projections

M A N A G e M e N T ’ S D I S C u S S I o N A N D A N A Ly S I S 47
Total assets increased by 17.2% to $108.8 million from$92.8 million in 2009–2010. Current assets are comprisedof cash, investments, accounts receivable, and prepaidexpenses: long-term assets include property andequipment that initially cost $5,000 or more. The increasein current assets is largely due to funds received andinvested for the DIF and the AARC, as well as loweraccounts receivable from donor contributions (see Note 5of the Notes to the Financial Statements, page 63). Thedecrease in long-term assets is due to a net increase ofamortization and disposals over purchases, offset by thecapitalization of assets such as software applications andleasehold improvements.
Total liabilities decreased by 18.2% to $62.2 million from$76.0 million. The current liabilities include accountspayable, accrued liabilities, and deferred revenue. Thelong-term liabilities include the long-term portion ofdeferred revenue and employee future benefits. Thedecrease in liabilities, both current and long-term, is duelargely to a decline in deferred revenues, related to theunspent portion of funds received from donorcontributions (see Note 9 from the Notes to the FinancialStatements, page 64).
TABLE 7: ASSeTS AND LIABILITIeS
2010–2011 2009–2010 % change($000) Actual Actual actuala
Total assets 108 774 92 818 17.2%Current 96 840 80 467 20.3%Long-term 11 934 12 351 -3.4%
Total liabilities 62 170 75 989 -18.2%Current 39 730 50 483 -21.3%Long-term 22 440 25 506 -12.0%
a % change actual in 2010–2011 over 2009–2010.
Balance sheet discussion

48 I D R C A N N u A L R e p o R T 2 0 1 0 – 2 0 1 1
The Centre’s equity is segregated between unrestricted,internally restricted, reserved, and other comprehensiveincome. Internally restricted and reserved equity levels areestablished in accordance with the Centre’s Equity Policy.
The unrestricted retained earnings represent the balancenot set aside to cover either the financial planning reserveor internally restricted retained earnings. Unrestrictedretained earnings increased by 167.8% to $10.8 millionfrom $4.0 million in 2009–2010. This is due primarily tosavings in capacity building and corporate andadministrative services, as well as incrementalParliamentary appropriations year-over-year.
The Centre has internally restricted a portion of theretained earnings ($24.2 million), which is the unspentportion of the funds to be used for the DIF ($15.8 million)and the AARC ($8.4 million). In accordance with ourpolicy, internally restricted equity will be drawn downas funds are used.
The Centre has established a financial planning reserve of$11.5 million (7.0% of its 2011–2012 Parliamentary
appropriation) to stabilize its financial position. Having areserve is important for a number of reasons: the fundingmodality and contractual arrangements with projectrecipients are evolving; the timing of program spending isnot entirely controlled by the Centre as it depends to alarge extent on the performance of recipients; and smallvariances in project expenditure patterns can have asignificant impact on total expenditures. The Board ofGovernors has approved a policy requiring a financialplanning reserve of 4.0% to 7.0% of the recognizedappropriation.
Further to a choice made pursuant to Canadianaccounting standards (see Note 2 in the Notes to theFinancial Statements, page 59), the financial instrumentsclassified as available for sale are measured at fair valuewith unrealized gains and losses recognized inaccumulated other comprehensive income. This year’scomprehensive income reflects an unrealized gain of$36,000, resulting in a residual balance at year-end of$6,000. (Refer to the Notes to the Financial Statementsfor more details.)
TABLE 8: equITy
2011–2012 2010–2011 2009–2010
Revised % change($000) Budget budget Actual Variance Actual actuala
Total equity 78 525 47 181 46 604 (577) 16 829 176.9%
Retained earnings
Unrestricted 8 899 6 919 10 815 3 896 4 038 167.8%
Internally restricted 51 783 28 659 24 249 (4 410) 5 225 364.1%
Reserved 17 843 11 633 11 534 (99) 7 596 51.8%
Accumulated other comprehensiveincome — ( 30) 6 36 ( 30) -120.0%
a % change actual in 2010–2011 over 2009–2010.

M A N A G e M e N T ’ S D I S C u S S I o N A N D A N A Ly S I S 49
Balance sheet outlook
During 2011–2012, the Centre will continue to investsurplus cash in accordance with the Centre’s policies andas financial market offerings permit.
The change in the accounting treatment of deferredproperty and equipment and intangible assets, requiredunder International Financial Reporting Standards(IFRS), will result in an increase of $12.9 million in our2011–2012 equity (see Future Accounting Changesrelated to IFRS on page 50). It should be noted, however,that this reclassification into equity is non-cash and willoffset the amortization of property and equipment andintangibles in equity from 2011–2012 onward.
Equity levels are projected to be $78.5 million at the endof 2011–2012. This includes $51.8 million of internallyrestricted equity related to the DIF and the AARC, andunrestricted equity of $8.9 million. The unrestrictedequity will act as a cushion permitting the Centre tostabilize program allocations pending the government’sexpenditure review expected in 2011–2012.
Quarterly financial reportingEffective 1 April 2011, the Financial Administration Actrequires that all departments and parent Crowncorporations prepare and make public a quarterlyfinancial report within 60 calendar days after the endof each quarter.
The quarterly financial reports will include:
� financial statements for the fiscal quarter with year-to-date and comparative information for thepreceding fiscal year, where required;
� selected explanatory notes;� a narrative discussion outlining the financial results,risks, and significant changes in relation to operations,personnel, and programs, including explanations offinancial results on a quarterly and year-to-date basis;
� a report on the use of appropriations.
Management is responsible for ensuring that allinformation in the quarterly financial report is consistent,where appropriate, with the unaudited quarterly financialstatements. IDRC’s first quarterly financial reportingperiod will end on 30 June 2011.
Future accounting changesEffective 1 January 2011, the Canadian Institute ofChartered Accountants (CICA) adopted InternationalFinancial Reporting Standards as Canadian GenerallyAccepted Accounting Principles (GAAP) for publiclyaccountable enterprises. Throughout 2010–2011 wecaptured the necessary data to produce IFRS-compliantstatements to ensure that comparative figures are availablefor our 2011–2012 financial statements.
We have completed our in-depth assessment of theaccounting standards relevant to the Centre. There will be changes to our financial statement presentation andexpanded financial statement note disclosures. The moresignificant accounting policy changes that we have madebased on the standards in effect as of 31 March 2011 areoutlined on page 50.

50 I D R C A N N u A L R e p o R T 2 0 1 0 – 2 0 1 1
Comparison of accounting treatments Impact on the Centre
Governmentassistance
IAS 20 requires the recognition of untargetedgovernment grants as revenue in the period itis received.
Under Canadian Generally Accepted AccountingPrinciples (Canadian GAAP), the portion ofgovernment grants used for property andequipment, and intangible assets was held indeferred revenue and recognized as revenue as theassets were depreciated.
The impact of recognizing accumulated deferredrevenue linked to property and equipment andintangible assets will result in a $12.9 million decreasein deferred revenue and a corresponding increase inequity.
Financial instruments
IFRS 9 allows for alternative classification offinancial instruments. This new standard becomeseffective 1 January 2013; however, we have electedto early adopt IFRS 9 as part of our transition to IFRSon 1 April 2010. Financial instruments are classifiedby their intended use, taking into consideration theorganization’s business model.
Upon transition, the Centre will classify investments as“amortized cost,” instead of “available for sale” underCanadian GAAP.
This classification eliminates the need to record changesin the fair value of investments through OtherComprehensive Income. As a result, that statement willbe eliminated. Upon transition, equity will increaseby $30,000.
Employee future benefits
IAS 19 requires the accrual of amounts related tothe sick leave benefit given to employees.
IAS also strongly recommends that companies usean actuary to determine the amount of liability toaccrue for employee future benefits.
Other employee future benefits, namely severance,were not subject to actuarial evaluations.
The impact of recognizing the sick leave benefit willcreate a $250,000 liability, with that amount beingabsorbed from equity. This amount was determined byan actuarial review.
An actuarial review was also performed of the Centre’sseverance benefits. As a result, the severance benefitliability was increased by $140,000 and removed fromequity.
Actuarial reviews will be needed in the future to re-evaluate these liabilities.
Key management personnel
IAS 24 requires the disclosure of salary and benefitinformation for key management personnel.
No such additional disclosure is required underCanadian GAAP.
The Centre will need to disclose a total number forsalary and benefit information for key managementpersonnel in the Notes to the Financial Statements.
Contingent liabilities
IAS 37 requires a different valuation method for the accrual and disclosure of contingent liabilities.IAS 37 requirements are more onerous thanCanadian GAAP.
Canadian GAAP required that outcomes ofcontingent liabilities be assessed on a basic“likely/unlikely” scale.
The Centre will change the way it valuatescontingent liabilities.
Depending on the circumstances of the contingentliability, additional disclosures than currently requiredunder Canadian GAAP may be necessary.
Future accounting changesInternational Financial Reporting Standards beginning fiscal year 2011–2012

M A N A G e M e N T ’ S D I S C u S S I o N A N D A N A Ly S I S 51
Four year historical reviewBudget Actual
($000) 2011–2012 2010–2011 2009–2010a 2008–2009a 2007–2008a
Statement of Operations
RevenuesParliamentary appropriations 211 327 195 616 174 041 168 828 149 742Donor contributionsFunding for development research programming 45 259 46 299 35 109 29 675 26 091Recovery of administrative costs 4 390 4 623 3 842 2 969 2 729
Investment income 600 627 288 1 096 2 377Other income 414 1 673 1 181 1 196 1 154
ExpensesDevelopment research programmingResearch projects Funded by Parliamentary appropriations 123 608 104 641 108 430 108 324 98 773Funded by donor contributions 39 766 39 861 27 839 22 289 19 500
Capacity buildingFunded by Parliamentary appropriations 47 814 44 111 43 597 42 383 40 722Funded by donor contributions 5 493 6 438 7 270 7 386 6 591
Development research programming 216 681 195 051 187 136 180 382 165 586
Corporate and administrative services 25 073 24 048 23 811 25 047 24 284
Net results from continuing operations 20 236 29 739 3 514 (1 665) (7 777)
Program allocationsDevelopment research programmingFunded by Parliamentary appropriations 100 000 127 420 305 862 126 108 145 033Funded by Parliamentary appropriations – specific programs and projects 50 74 2 432 3 769 1 643Funded by donor contributions 17 600 82 669 49 046 60 621 37 041
Budget Actual
($000) 2011–2012 2010–2011 2009–2010a 2008–2009a 2007–2008a
Balance sheet
AssetsCash and cash equivalents 14 235 23 238 39 076 22 450Investments 73 890 45 952 21 407 38 891Accounts receivables and prepaid expenses 8 715 11 277 16 071 10 382Property and equipment 9 224 10 332 11 494 11 002Intangible assets 2 710 2 019 1 271 1 082
LiabilitiesAccounts payable and accrued liabilities 15 294 14 202 15 927 18 012Deferred revenue – current 24 436 36 281 35 956 30 765Deferred revenue – long term 16 071 19 354 17 819 14 154 Employee future benefits 6 369 6 152 6 154 5 858
EquityRetained earnings 78 525 46 598 16 859 13 345 15 010Accumulated other comprehensive income — 6 ( 30) 118 8
Outstanding commitmentsFunded by Parliamentary appropriations 360 455 366 682 373 700 159 577 162 579Funded by donor contributions 75 004 105 169 70 715 53 353 30 182
a Certain costs were reclassified to conform to the financial presentation for this year.
52 IDRC ANNUAL R E POR T 2 0 1 0 – 2 0 1 1
Financial statements
Management Responsibility for Financial Statements
The financial statements presented in this annual report are the responsibility of management and have been approved by
the Board of Governors. The financial statements have been prepared by management in accordance with Canadian
generally accepted accounting principles and, where appropriate, include amounts that have been estimated according to
management’s best judgment. Financial information presented elsewhere in the annual report is consistent with the
information presented in the financial statements.
Management maintains books of accounts, information systems, and financial and management controls that are designed
to provide reasonable assurance as to the reliability of financial information. Management also asserts that the Centre’s
assets are safeguarded, that resources are managed economically and efficiently in the attainment of corporate objectives
and that operations are carried out in accordance with the International Development Research Centre Act and by-laws of
the Centre.
The Centre’s Internal Auditor has the responsibility for assessing the Centre’s systems procedures and practices. The Auditor
General of Canada conducts an independent audit of the annual financial statements in accordance with Canadian generally
accepted auditing standards. His audit includes appropriate tests and procedures to enable him to express an opinion on the
financial statements. The external auditors have full and free access to the Finance and Audit Committee of the Board.
The Board of Governors is responsible for ensuring that management fulfills its responsibilities for financial reporting and
internal control. The Board benefits from the assistance of its Finance and Audit Committee in overseeing and discharging its
financial management responsibility, which includes the review and approval of the financial statements. The Committee,
which is made up of governors, meets with management, the internal auditors and the external auditors on a regular basis.
David M. Malone Sylvain Dufour
President Vice-President, Resources and CFO
Ottawa, Canada
June 22, 2011

F I NANC IA L S TAT EMENTS 53

54 IDRC ANNUAL R E POR T 2 0 1 0 – 2 0 1 1
Balance Sheetas at 31 March 2011(in thousands of dollars)
2011 2010
AssetsCurrent
Cash and cash equivalents (Note 3) 14 235 23 238 Investments (Note 4) 73 890 45 952 Accounts receivable (Note 5) 7 143 9 594 Prepaid expenses 1 572 1 683
96 840 80 467
Property and equipment (Note 6) 9 224 10 332Intangible assets (Note 7) 2 710 2 019
108 774 92 818
LiabilitiesCurrent
Accounts payable and accrued liabilities (Note 8) 15 294 14 202 Deferred revenue (Note 9) 24 436 36 281
39 730 50 483
Deferred revenue (Note 9) 16 071 19 354 Employee future benefits (Note 10) 6 369 6 152
62 170 75 989
EquityRetained earnings 46 598 16 859 Accumulated other comprehensive gain (loss) income 6 (30)
46 604 16 829
108 774 92 818 Commitments (Note 14)Contingencies (Note 15)
The accompanying notes form an integral part of these financial statements.
The Honourable Barbara McDougall Denis DesautelsChairman ChairmanBoard of Governors Finance and Audit Committee

F I NANC IA L S TAT EMENTS 55
Statement of Operationsfor the year ended 31 March 2011(in thousands of dollars)
2011 2010
RevenuesDonor contributions (Note 11)
Funding for development research programming 46 299 35 109 Recovery of administrative costs 4 623 3 842
Investment income 627 288 Other income 1 673 1 181
53 222 40 420
ExpensesDevelopment research programming Research projects
Funded by Parliamentary appropriations 104 641 108 430 Funded by donor contributions 39 861 27 839
Capacity buildingFunded by Parliamentary appropriations 34 698 34 643 Funded by donor contributions 6 438 7 270 Research complements 9 413 8 954
195 051 187 136 Corporate and administrative services
Corporate services 18 666 18 362 Regional office administration 5 382 5 449
24 048 23 811
Total expenses 219 099 210 947
Cost of operations before Parliamentary appropriations (165 877) (170 527)
Parliamentary appropriations (Note 12) 195 616 174 041
Net results of operations 29 739 3 514
The accompanying notes form an integral part of these financial statements.

56 IDRC ANNUAL R E POR T 2 0 1 0 – 2 0 1 1
Statement of Changes in Equityfor the year ended 31 March 2011(in thousands of dollars)
2011 2010
Retained earnings
UnrestrictedBeginning of year 4 038 5 892Net results of operations 29 739 3 514 Transfers to reserved and restricted (22 962) (5 368)
Balance end of year 10 815 4 038
ReservedBeginning of year 7 596 6 753 Financial planning reserve increase 3 938 843
Balance end of year 11 534 7 596
Internally restrictedBeginning of year 5 225 700 Expenditures incurred (9 985) (2 475)Additions 29 009 7 000
Balance end of year (Note 13) 24 249 5 225
Total retained earnings end of year 46 598 16 859
Accumulated other comprehensive gain (loss) income Beginning of year (30) 118 Other comprehensive gain (loss) income 36 (148)
Balance end of year 6 (30)
Total equity end of year 46 604 16 829
The accompanying notes form an integral part of these financial statements.
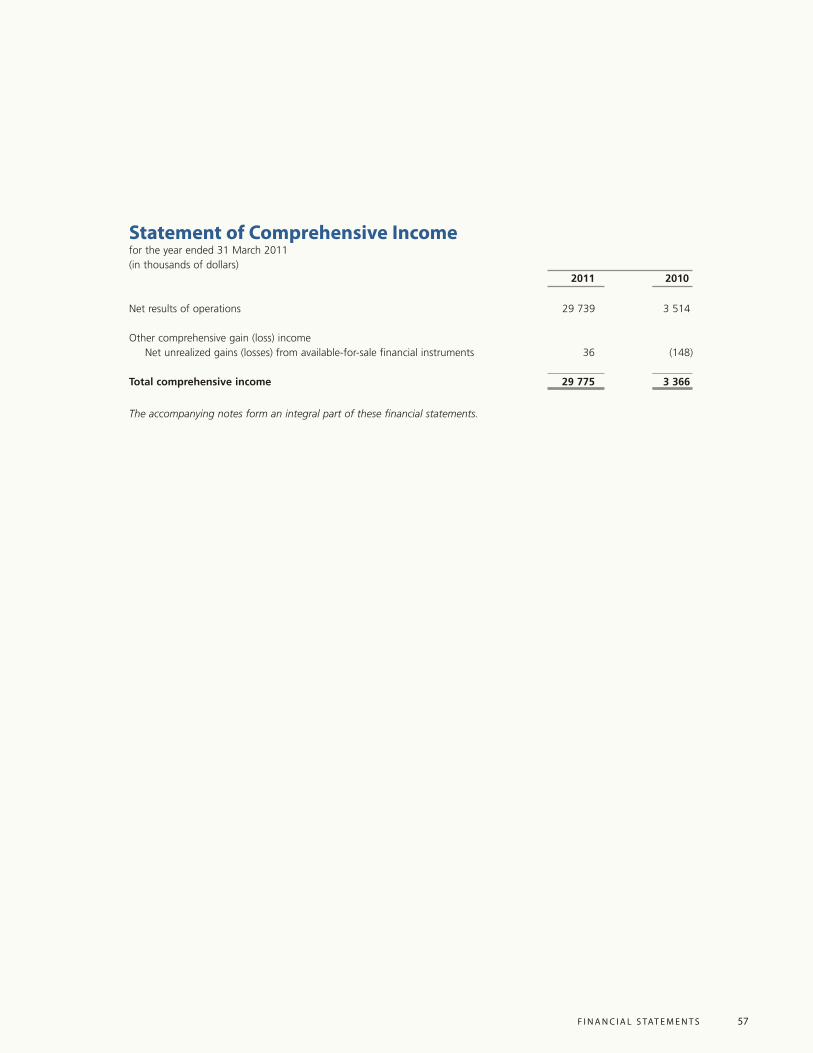
F I NANC IA L S TAT EMENTS 57
Statement of Comprehensive Incomefor the year ended 31 March 2011(in thousands of dollars)
2011 2010
Net results of operations 29 739 3 514
Other comprehensive gain (loss) income Net unrealized gains (losses) from available-for-sale financial instruments 36 (148)
Total comprehensive income 29 775 3 366
The accompanying notes form an integral part of these financial statements.

58 IDRC ANNUAL R E POR T 2 0 1 0 – 2 0 1 1
Statement of Cash Flowsfor the year ended 31 March 2011(in thousands of dollars)
2011 2010
Operating activitiesNet results of operations 29 739 3 514
Items not affecting cashAmortization of property and equipment and intangible assets 2 035 2 214 Amortization of deferred revenue — property and
equipment and intangible assets (2 035) (2 214)Amortization of bond premium 1 095 756 (Gain) Loss on disposal of property and equipment and intangible assets (41) 56 Employee future benefits 217 (2) Deferred revenue — long-term (3 137) 1 821
(1 866) 2 631Change in non-cash operating items
Accounts receivable 2 451 4 771Prepaid expenses 112 23Accounts payable and accrued liabilities 1 092 (1 725)Deferred revenue — current (11 574) 453
(7 919) 3 522
Cash flows from operating activities 19 954 9 667
Financing activitiesParliamentary appropriation used for property and equipment and intangible assets 1 618 1 800 Cash flows from financing activities 1 618 1 800
Investing activitiesPurchase of investments (130 186) (47 409)Maturity of investments 101 189 21 960 Acquisition of property and equipment and intangible assets (1 632) (1 863)Proceeds from the disposition of property and equipment and intangible assets 54 7Cash flows (used in) investing activities (30 575) (27 305)
(Decrease) in cash and cash equivalents (9 003) (15 838)
Cash, beginning of the year 23 238 39 076
Cash and cash equivalents, end of the year 14 235 23 238
Composition of cash and cash equivalentsCash 2 760 23 238Cash equivalents 11 475 —
14 235 23 238
The accompanying notes form an integral part of these financial statements.

F I NANC IA L S TAT EMENTS 59
Notes to the Financial Statementsfor the year ended 31 March 2011(in thousands of dollars unless otherwise stated)
1. Authority and objectiveThe International Development Research Centre (the Centre), a corporation without share capital, was established in 1970
by the Parliament of Canada through the International Development Research Centre Act. The Centre is funded primarily
through an annual appropriation received from the Parliament of Canada. In accordance with section 85(1) of the Financial
Administration Act, the Centre is exempt from Divisions I to IV of Part X of the Act, except for sections 131 to 148 of
Division III. The Centre is a registered charity and is exempt under section 149 of the Income Tax Act from the payment
of income tax.
The objective of the Centre is to initiate, encourage, support, and conduct research into the problems of the developing
regions of the world and into the means for applying and adapting scientific, technical, and other knowledge to the
economic and social advancement of those regions.
2. Summary of significant accounting policiesThe financial statements have been prepared in accordance with Canadian generally accepted accounting principles (GAAP).
The significant accounting policies of the Centre are:
a. Revenue recognition
i) Parliamentary appropriations
Parliamentary appropriations, other than the portions used for the purchase of property and equipment, and
intangible assets and for specific projects and programs, are recorded as revenue in the year for which they are
appropriated. The portion of the Parliamentary appropriations used for the purchase of property and equipment and
intangible assets is recorded as deferred revenue and amortized into income on the same basis and over the same
period as the related assets. Upon disposition of depreciable property and equipment and intangible assets, all
remaining deferred funding related to the specific asset is recognized into income. Parliamentary appropriations
received for specific projects and programs are also deferred and recognized when the related expenses are incurred.
ii) Donor contributions
The Centre enters into contribution agreements for research conducted or managed on behalf of other organizations.
Funds received or receivable under donor contribution agreements are recorded as deferred revenues. These deferred
revenues are recognized as revenues in the year in which the related expenses are incurred.
iii) Investment and other income
Investment income is recorded on an accrual basis and includes realized gains and losses on disposal of investments.
All other income is recorded on the accrual basis of accounting.

60 IDRC ANNUAL R E POR T 2 0 1 0 – 2 0 1 1
b. Grant paymentsAll contractual grant payments are subject to the provision of funds by Parliament or by donor partners. They are
recorded as an expense in the year they come due under the terms and conditions of the agreements. Refunds on
previously disbursed grant payments are credited against the current year expenses when the project is active or to
other income when the project is closed.
c. Property and equipment and amortizationProperty and equipment are recorded at cost and amortized over their estimated useful lives on a straight-line basis.
The estimated useful life of each asset class is as follows:
Computer equipment 3 years
Office furniture and equipment 5 years
Vehicles 3 to 7 years
Communication systems 5 years
Leasehold improvements Remaining term of lease
d. Intangible assets and amortizationIntangible assets consist of internally developed software and computer software and are recorded at cost and amortized
over their estimated useful lives on a straight-line basis. The estimated useful life of the asset class is 3 to 10 years.
e. Financial instrumentsThe Centre’s financial instruments consist of cash, cash equivalents, investments, accounts receivable, accounts payable,
and accrued liabilities that are incurred in the normal course of business. Financial instruments are initially recognized at
the transaction price, which is the fair value of the consideration given and, subsequent to initial recognition, measured
based on their classification. The classifications were as follows:
i) Financial instrument Classification Measurement
Cash Held for trading Fair value
Cash equivalents and investments Available for sale Fair value
Accounts receivable Loans and receivables Amortized cost
Accounts payable and accrued liabilities Other financial liabilities Amortized cost
ii) Cash and cash equivalents
Cash and cash equivalents include balances with banks and short-term money market instruments with maturities of
90 days or less at the time of acquisition.
iii) Investments
Investments are comprised of high quality money market instruments with a maturity between 91 days and one year
at the time of acquisition. Investments may be sold in response to changes in the Centre’s liquidity requirements, to
changes in the credit rating of the instruments, or to an imbalance in the asset mix relative to benchmarks stipulated
in the Centre’s investment policy. These investments are initially recognized at the transaction price, which is the fair

F I NANC IA L S TAT EMENTS 61
value of the consideration given. Gains and losses arising from changes in fair value, except for impairment losses,
are recognized in other comprehensive income (OCI) until the financial asset is sold or otherwise derecognized. Upon
derecognition, the cumulative gain or loss previously recognized in OCI is transferred to other income. Purchases
and sales of investments are recorded on the settlement date. Where applicable, transaction costs related to the
acquisition of investments are expensed.
iv) Embedded derivatives
Embedded derivatives are required to be separated and measured at fair value if certain conditions are met.
Management has reviewed contracts and determined that the Centre does not have embedded derivatives that
require separate accounting treatment.
f. Foreign currency translationMonetary assets and liabilities denominated in foreign currencies are translated into Canadian dollars at the exchange
rate in effect at the balance sheet date. Assets and liabilities are translated at rates in effect when the assets were
acquired or obligations incurred. Revenue and expense items are translated at a weekly rate of exchange. Exchange
gains and losses are included in other income.
g. Employee future benefits
i) Pension benefits — head office
All eligible head office-hired employees participate in the Public Service Pension Plan administered by the Government
of Canada. The Centre’s contributions reflect the full cost as employer. This amount is currently based on a multiple
of an employee’s required contributions and may change over time depending on the experience of the Plan. The
Centre’s contributions are expensed during the year in which the employee’s services are rendered and represent the
total pension obligation of the Centre. The Centre is not currently required to make contributions with respect to
actuarial deficiencies of the Public Service Pension Plan.
ii) Pension benefits — regional offices
The Centre offers a number of defined contribution plans that provide pension and other benefits to eligible
employees. The Centre’s contributions reflect the full cost as employer. This amount is currently based on a multiple
of an employee’s required contributions to the plans. The Centre’s contributions are expensed during the year in
which the employee’s services are rendered and represent the total obligation of the Centre.
iii) Other benefit plansSeverance benefits
Employees are entitled to severance benefits, as provided for under their conditions of employment. Management
determines the accrued obligation for severance benefits using a method based on assumptions and its best
estimates. This method reflects that, generally, employees with more than five years of service are entitled to a
severance benefit calculated on the basis of one week of salary per year of service. The cost of these benefits is
accrued as employees render the services necessary to earn them.

62 IDRC ANNUAL R E POR T 2 0 1 0 – 2 0 1 1
h. Retained earningsThe Centre’s retained earnings consist of the accumulation of revenues over expenditures from operations and include
unrestricted, internally restricted amounts for special program and operational projects, and reserved amounts.
Internally restricted equity for special program and operational projects is drawn down as the funds are used for the initiatives.
Internally restricted equity unused at the end of the initiatives is reclassified by management into unrestricted equity.
Variances in regular program spending can have a significant impact on net results of operations and therefore the
retained earnings balance. One of the objectives of the Centre’s equity policy is to ensure that a sufficient balance is
available to absorb these program expenditure variances. Management earmarks a minimum of 4% and a maximum of
7% of the Parliamentary appropriation as a financial planning reserve. The value of the reserve is established each year
during the budgeting process.
i. Non-monetary transactionsOn occasion, the Centre carries out non-monetary exchanges, which are exchanges of non-monetary assets, goods, or
services for other non-monetary assets, goods, or services with little or no monetary consideration involved. Non-monetary
transactions are recorded at the fair value of the assets, goods, or services given up, unless the fair value of the assets,
goods, or services received is more reliable.
j. Use of estimatesThe preparation of financial statements in accordance with Canadian GAAP principles requires management to make
estimates and assumptions that affect the reported amount of assets and liabilities at the date of the financial
statements, as well as the reported amounts of income and expenses during the period. Employee severance benefits,
estimated useful lives of property and equipment and intangible assets, the fair value of financial instruments, and
contingent liabilities are the most significant items for which estimates are used. Actual results could differ significantly
from those estimated.
k. Future accounting changesIn December 2009, the Public Sector Accounting Board (PSAB) issued an amendment to the introduction to the Public
Sector Accounting Standards of the PSA Handbook. The amendment eliminated the Government Business Type
Organizations (GBTO) classification. Entities currently classified as a GBTO were required to reassess their classification.
Under the revised introduction the Centre is classified as an Other Government Organization (OGO). As an OGO, the
Centre has determined that the most appropriate basis of accounting to meet the needs of the users of its financial
statements are the International Financial Reporting Standards (IFRS).
Effective 1 January 2011, the Canadian Institute of Chartered Accountants (CICA) adopted the International Financial
Reporting Standards (IFRS) as Canadian GAAP for publicly accountable enterprises. The Centre will adopt IFRS for its
fiscal year beginning 1 April 2011. The assessment of the impact of the new accounting standards relevant to the Centre
is complete. The Centre is now modifying processes and procedures to accommodate the changes. The preparation of an
IFRS opening balance sheet as at 1 April 2010 is required, in order to produce the IFRS balance sheet elements for
2010–2011, which will be used as the comparative numbers in the 2011–2012 financial statements. At fiscal year end,
the Centre is on track with the IFRS conversion plan. There will be adjustments to the opening equity upon
implementation of these standards.

The International Accounting Standards Board has a number of projects underway, some of which will impact the
standards relevant to the Centre. The Centre is closely monitoring the progress of these projects. Revisions made to the
standards could potentially have an impact on the financial statements and may result in the revisiting of the Centre’s
conclusions.
3. Cash and cash equivalents2011 2010
Cash 2 760 23 238Cash equivalents 11 475 —
14 235 23 238
The Centre invests in money market instruments such as commercial paper, bankers’ acceptances, and bearer deposit
notes that are rated R-1 (low) or better by the Dominion Bond Rating Service (DBRS). The weighted average yield as at
31 March 2011 is 1.15% (2010: nil) and the average term to maturity of the Centre’s year-end portfolio at the time of
purchase is 66 days (2010: nil)
4. Investments2011 2010
Canadian chartered banks 55 930 4 976Federal, provincial, or municipal governments 9 974 37 476Corporations 7 986 3 500
73 890 45 952
The Centre invests in bonds that are rated A or better by the Dominion Bond Rating Service and money market instruments
such as commercial paper, bankers’ acceptances, and bearer deposit notes that are rated R-1 (low) or better by the DBRS.
The weighted average yield as at 31 March 2011 is 1.23% (2010: 0.54%) and the average term to maturity of the Centre’s
year-end portfolio at the time of purchase is 139 days (2010: 284 days).
5. Accounts receivableAccounts receivable are incurred in the normal course of business and are due on demand. Of the total related to donor
contributions, 86% is due from the Canadian International Development Agency (CIDA) and is not considered by
management to present a significant credit risk (2010: 85% was due from CIDA).
2011 2010
Donor contributions 3 474 7 375Parliamentary appropriation 829 205Other 2 840 2 014
7 143 9 594
F I NANC IA L S TAT EMENTS 63
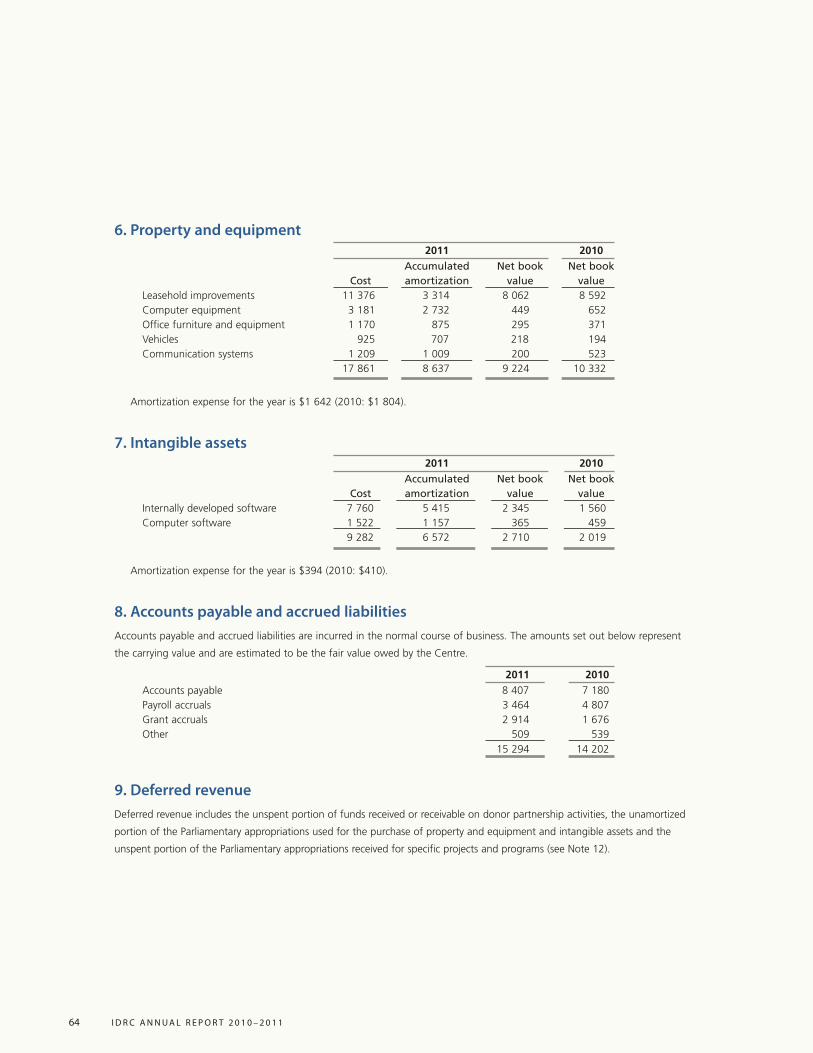
64 IDRC ANNUAL R E POR T 2 0 1 0 – 2 0 1 1
6. Property and equipment2011 2010
Accumulated Net book Net bookCost amortization value value
Leasehold improvements 11 376 3 314 8 062 8 592Computer equipment 3 181 2 732 449 652Office furniture and equipment 1 170 875 295 371Vehicles 925 707 218 194Communication systems 1 209 1 009 200 523
17 861 8 637 9 224 10 332
Amortization expense for the year is $1 642 (2010: $1 804).
7. Intangible assets2011 2010
Accumulated Net book Net bookCost amortization value value
Internally developed software 7 760 5 415 2 345 1 560Computer software 1 522 1 157 365 459
9 282 6 572 2 710 2 019
Amortization expense for the year is $394 (2010: $410).
8. Accounts payable and accrued liabilities Accounts payable and accrued liabilities are incurred in the normal course of business. The amounts set out below represent
the carrying value and are estimated to be the fair value owed by the Centre.
2011 2010
Accounts payable 8 407 7 180Payroll accruals 3 464 4 807Grant accruals 2 914 1 676Other 509 539
15 294 14 202
9. Deferred revenueDeferred revenue includes the unspent portion of funds received or receivable on donor partnership activities, the unamortized
portion of the Parliamentary appropriations used for the purchase of property and equipment and intangible assets and the
unspent portion of the Parliamentary appropriations received for specific projects and programs (see Note 12).

F I NANC IA L S TAT EMENTS 65
Details of these balances are as follows:
a. Donor contribution funding for development research programming
2011 2010
Current 21 011 32 059Long-term 4 269 8 651
25 280 40 710
Of the total deferred donor contribution funding, CIDA accounts for $7 694 (2010: $8 072) of which $2 997 (2010: $6 321)
is receivable at year-end.
b. Parliamentary appropriations — property and equipment and intangible assets
2011 2010
Balance at beginning of year 12 351 12 765Portion of the appropriations used for property and equipment
and intangible assets 1 618 1 800Amortization (2 035) (2 214)Balance at end of year 11 934 12 351
Current 1 706 1 977Long-term 10 228 10 374
11 934 12 351
c. Parliamentary appropriations — projects and programs
2011 2010
Current 1 719 2 245Long-term 1 574 329
3 293 2 574
d. Total deferred revenues (sum of all of the above)
2011 2010
Current 24 436 36 281Long-term 16 071 19 354
40 507 55 635
10. Employee future benefits
a. Pension benefits — head office
The Centre and all eligible head office-hired employees contribute to the Public Service Pension Plan. This pension plan
provides benefits based on years of service and average earnings at retirement. The benefits are fully indexed to the
increase in the Consumer Price Index. The Centre’s and employees’ contributions to the Public Service Pension Plan for
the year were as follows:2011 2010
Centre contributions 4 258 4 050Employee contributions 2 334 2 250

66 IDRC ANNUAL R E POR T 2 0 1 0 – 2 0 1 1
b. Pension benefits — regional offices
The Centre and eligible regional employees contribute to various defined contribution pension plans as specified in
the Plan Agreements. The Centre’s contributions to these plans for the year were $439 (2010: $436).
c. Severance benefitsThe Centre provides severance benefits to its employees based on years of service and final salary. This benefit plan is
not pre-funded and thus has no assets, resulting in a plan deficit equal to the accrued benefit obligation. Benefits will
be paid from future appropriations. Information about the plan, measured as at the balance sheet date, is as follows:
2011 2010
Accrued benefit obligation, beginning of year 6 558 6 809Cost for the year 934 659 Benefits paid during the year (764) (910)Accrued benefit obligation, end of year 6 728 6 558
Current 359 406Long-term 6 369 6 152
6 728 6 558
The current portion is reported in the balance for accounts payable and accrued liabilities.
11. Donor contributionsDonor contribution funding for development research programming relates specifically to research projects conducted or
managed by the Centre on behalf of other organizations. This research is funded by CIDA, the United Kingdom’s
Department for International Development (DFID), the Bill & Melinda Gates Foundation, the William and Flora Hewlett
Foundation, several other Government of Canada entities, and other donor agencies. A breakdown of the revenue and
expense recognition for donor contributions is provided below:
2011 2010
CIDA 13 957 6 596DFID 12 171 12 298The Bill & Melinda Gates Foundation 8 955 9 200The William and Flora Hewlett Foundation 7 399 1 643Other Government of Canada entities 685 36Other donor agencies 3 132 5 336
46 299 35 109
The Centre recovers administrative costs from the management of donor contribution funding. The total recovery for this
year is $4 623 (2010: $3 842) of which $1 290 (2010: $622) was from CIDA.

F I NANC IA L S TAT EMENTS 67
12. Parliamentary appropriations2011 2010
Approved Parliamentary appropriations 195 918 173 996Portion deferred for projects and programs (2 400) (2 000)
193 518 171 996
Deferral for property and equipment and intangible assets purchased in the current year (Note 9) (1 618) (1 800)
Amortization of deferred Parliamentary appropriations — projects andprograms 1 681 1 631
193 581 171 827Amortization of deferred Parliamentary appropriations — property and
equipment and intangible assets 2 035 2 214Parliamentary appropriation recognized in the statement of operations 195 616 174 041
13. Retained earnings — internally restricted
2011 2010
Received and
internally Closing ClosingOpening restricted Expended value value
African Adaptation Research Centres(AARC) — 9 009 (627) 8 382 —
Development Innovation Fund (DIF) 5 225 20 000 (9 358) 15 867 5 225
Total 5 225 29 009 (9 985) 24 249 5 225
A portion of the 2010–2011 Parliamentary appropriation was internally restricted by management to finance theDevelopment Innovation Fund (DIF). The DIF is a large initiative implemented by the Centre to support leading-edge scientificresearch that improves the lives of the poor in developing countries. The DIF is focused on global health research. Fundingsupport is being provided to scientific institutions engaged in health research through a series of peer-reviewed grantcompetitions which result in research awards to successful applicants. Management has segregated the DIF in its accountsbecause of its significant size and the impact any delays or variance in implementation could have on the Centre’s results.
The African Adaptation Research Centres (AARC) initiative will help deliver timely and independent scientific advice andexpert assessment for adaptation investments and policy decisions across Africa. Funding was provided to existingorganizations that have demonstrated their scientific leadership in adaptation and their capacity to work effectively withdecision-makers. Management has internally restricted the AARC funding because of the relative importance of the amountthe Centre received in 2010–2011, which management intends to disburse to recipients over approximately three years.Internally restricted equity allows management to segregate the AARC commitments from the recurring programming ofthe Centre.

68 IDRC ANNUAL R E POR T 2 0 1 0 – 2 0 1 1
14. Commitments
a. Program-relatedThe Centre is committed to making payments up to $471.9 million (2010: $444.4 million) during the next five years
subject to funds being provided by Parliament or donors and subject to compliance by recipients with the terms and
conditions of grant agreements. Of this amount, $366.7 million (2010: $373.7 million) is expected to be covered by
funding from future Parliamentary appropriations and the balance of $105.2 million (2010: $70.7 million) by funding
from currently valid donor contribution agreements.
b. Operating leasesThe Centre has entered into various contractual commitments for leases of office premises in Canada and abroad
and for staff accommodation in various countries. The lease agreements expire at different dates up to 2022.
Future payments related to these contractual commitments as at 31 March 2011 are as follows:
2011–2012 7 3722012–2013 7 5432013–2014 7 6222014–1015 7 7352015–1016 7 4102016 to 2022 51 445
Total future payments 89 127
15. ContingenciesVarious claims have been asserted or instituted against the Centre. Litigation is subject to many uncertainties and the
outcome of individual matters is not predictable. Based on the advice of legal counsel, management is of the opinion that
these claims are unlikely to materialize.
16. Related party transactionsIn addition to the related party transactions disclosed in Notes 5, 9, and 11 to these financial statements, the Centre is
related in terms of common ownership to all Government of Canada-created departments, agencies, and Crown
corporations. The Centre enters into transactions with these entities in the normal course of operations, under the same
terms and conditions that apply to unrelated parties. The transactions are recorded at their exchange amounts which are
determined to approximate fair value.
17. Fair value of financial instrumentsFair value represents the amount of consideration that would be agreed upon to exchange a financial instrument in an arm’s-
length transaction between knowledgeable, willing parties who are under no compulsion to act. Fair value of investments is
determined using quoted prices in active markets for identical assets. Fair value is assumed to equal book value for accounts
receivable and payable and accrued liabilities due to the short-term nature of these instruments. Fair value is also assumed to
equal book value for cash and cash equivalents.

F I NANC IA L S TAT EMENTS 69
Fair value hierarchyThe table below presents the fair value hierarchy for those items carried on the Centre’s balance sheet at fair value.
The fair value hierarchy prioritizes the valuation techniques used to determine the fair value of a financial instrument
based on whether the inputs to those techniques are observable or unobservable.
Level 1 — fair values are based on quoted prices (unadjusted) in active markets for identical assets or liabilities
Level 2 — fair values are determined using inputs other than quoted prices included within Level 1 that are observable
for the assets or liabilities, either directly (i.e., as prices) or indirectly (i.e., derived from prices)
Level 3 — fair values are determined using inputs for the assets or liabilities that are not based on observable market
data (unobservable inputs).
All of the Centre’s financial instruments, measured at fair value, are classified as Level 1.
18. Financial instrument risksThe principal risks that the Centre is exposed to as a result of holding financial instruments are credit risk, market risk, and
liquidity risk. Risk management for investing activities is carried out by the Corporate Treasury function. Investments are held
for liquidity purposes, or for longer terms. The Centre has various other financial instruments such as cash and cash
equivalents, accounts receivable, accounts payable, and accrued liabilities which arise directly from operations.
a. Credit riskCredit risk is the risk that the counterparty to a financial instrument will default on its obligations to the Centre, thus
resulting in financial losses. The Centre is exposed to credit risk since it has investments and extends credit to its
customers and donor partners in the normal course of business. The maximum exposure is represented by cash and
cash equivalents, investments, and accounts receivable amounts presented on the Centre’s balance sheet. Credit risk
associated with accounts receivable is considered by management to be minimal since most receivables are due from
donor partners and Canadian government entities. The Centre’s investment policy sets out guidelines that define the
minimum acceptable counterparty credit rating pertaining to investments. The investments in financial institutions and
Canadian government entities must have minimum ratings from two external rating agencies that are equivalent to
Dominion Bond Rating Service (DBRS) ratings of R-1 (low) for short-term investments and A for long-term investments.
The investment policy is reviewed and approved as required by the Board of Governors, and procedures which
establish credit limits for each counterparty are reviewed by management at least annually. These policies and
procedures are designed to manage and limit the credit risk associated with these financial instruments.
i) Concentrations of credit risk
The Centre’s primary exposure to credit risk is summarized as follows:
DBRSrating 2011 2010
Canadian chartered banks R1-L 55 930 4 976
Federal, provincial, and municipal governments R1-L 9 974 37 476
Corporations R1-M 7 986 3 500

70 IDRC ANNUAL R E POR T 2 0 1 0 – 2 0 1 1
b. Market risk Market risk is the risk that the fair value or future cash flows of a financial instrument will fluctuate because of
changes in market prices. Market risk comprises three types of risk: currency risk, interest rate risk, and other price
risk. The Centre is exposed to potential losses as a result of movements in interest and foreign exchange rates.
i) Currency risk
Currency risk is the potential adverse impact on the fair value or future cash flows of financial instruments resulting
from foreign exchange rate movements. The Centre has exposure to currency risk in part from the operating costs
of six regional offices throughout the world. To manage this risk, the Centre normally funds regional operations to
meet short-term requirements only, minimizing currency balances and reducing significant exposure to foreign
exchange rate movements.
The Centre has multi-year donor contribution agreements with non-Canadian donors which are denominated in
currencies other than the Canadian dollar. When progress payments are received from donors, they are translated to
Canadian dollars at the weekly exchange rate (see Note 2f). In turn, the Centre issues multi-year grant agreements
which are denominated in Canadian dollars. The Centre manages its foreign currency risk on these activities by
setting aside a portion of the donor contribution agreement funding to absorb exchange gains and losses until such
time that the full impact of the currency risk is known. The magnitude of the foreign currency funding set aside is
gauged against actual fluctuations on a quarterly basis, with additions being made when needed, which occurs
rarely, and releases being made only toward the end of the agreement, when no longer needed. The Centre’s
currency risk is not considered material.
ii) Interest rate risk
Interest rate risk is the risk that the fair value or future cash flows of a financial instrument will fluctuate due to
changes in market interest rates. The Centre is exposed to interest rate risk in that changes in market interest rates
may cause fluctuations in the fair value of investments. To manage this risk, the Centre normally invests in short-term
marketable securities that are not significantly affected by variations in interest rates.
c. Liquidity riskLiquidity risk is the risk that the Centre will encounter difficulty in meeting its financial obligations as they fall due.
Liquidity risk can arise from mismatched cash flows related to assets and liabilities. The treasury function within
Corporate Accounting is responsible for the Centre’s liquidity management. This risk is managed by monitoring
forecasted and actual cash flows and matching the maturity profiles of financial assets and liabilities. The Centre also
holds cash equivalents and investments in marketable securities which are readily convertible to cash, to ensure that
sufficient liquidity can be made available to meet forecasted cash requirements. Given the timing of receipts and
payments, the Centre’s exposure to liquidity risk is not considered material.

F I NANC IA L S TAT EMENTS 71
19. Capital managementThe Centre defines its capital as the balance of retained earnings comprised of reserved, internally restricted, and unrestricted
components. The Centre has a capital management process in place to ensure that it is appropriately capitalized and that
the capital position is identified, measured, managed, and regularly reported to the Board of Governors.
The objectives, with respect to its capital management, are to minimize the accumulation of retained earnings while
ensuring adequate capital exists to protect the financial position of the Centre.
Capital is managed through a Board-approved equity policy which reserves a portion of retained earnings as a financial
planning reserve. The financial planning reserve is intended to cushion the impact of significant variances in development
research programming expenditures. Management will also restrict a portion of retained earnings to fund special or
significant programs and operational initiatives planned for future fiscal years. The Centre is not subject to any externally
imposed capital requirements.
20. Comparative figuresCertain comparative figures have been reclassified to conform to the current year presentation.
On the Internetwww.idrc.cahttp://idl-bnc.idrc.ca — to access IDRC’s Digital [email protected] — to reach the library reference [email protected] — to get general informationwww.idrc.ca/subscribe — to subscribe to IDRC’s e-Bulletin
Head OfficeInternational Development Research CentrePO Box 8500, Ottawa, ON, Canada K1G 3H9
Street address:150 Kent Street, Ottawa, ONCanada K1P 0B2 Phone: (+1) 613-236-6163Fax: (+1) 613-238-7230Email: [email protected]: www.idrc.ca
Latin America and the CaribbeanIDRC Regional Office for Latin America and the CaribbeanAvenida Brasil 2655, 11300 Montevideo, UruguayPhone: (+598-2) 709-0042Fax: (+598-2) 708-6776Email: [email protected]: www.idrc.ca/lacro
AsiaIDRC Regional Office for South Asia and China208 Jor Bagh, New Delhi 110003, IndiaPhone: (+91-11) 2461-9411Fax: (+91-11) 2462-2707Email: [email protected]: www.idrc.ca/saro
IDRC Regional Office for Southeast and East Asia22 Cross Street #02-55 South Bridge Court Singapore 048421Phone: (+65) 6438-7877Fax: (+65) 6438-4844Email: [email protected]: www.idrc.ca/asro
AfricaIDRC Regional Office for Eastern and Southern AfricaPO Box 62084, 00200 Nairobi, Kenya
Street address:Liaison House, 2nd floor, State House Avenue, Nairobi, Kenya(address all mail to the IDRC Regional Director)Phone: (+254-20) 2713-160/61Fax: (+254-20) 2711-063Email: [email protected]: www.idrc.ca/esaro
IDRC Regional Office for the Middle East and North AfricaPO Box 14 Orman, Giza, Cairo, Egypt
Street address:8 Ahmed Nessim Street, 8th floorGiza, Cairo, EgyptPhone: +2 02 333 67 051/2/3/4/7Fax: +2 02 333 67 056Email: [email protected]:: www.idrc.ca/cairo
IDRC Regional Office for West and Central AfricaBP 11007, Peytavin, Dakar, Senegal
Street address:Rue de Saint-Louis angle avenue Cheikh Anta Diop, Point EDakar, SenegalPhone: (+221) 33 864-0000Fax: (+221) 33 825-3255Email: [email protected]: www.idrc.ca/waro
How to reach us
idrc.ca
72 IDRC ANNUAL R E POR T 2 0 1 0 – 2 0 1 1
© International Development Research Centre 2011
Library and Archives Canada Cataloguing in Publication: International Development Research Centre (Canada) IDRC Annual Report 2010–2011
Annual1970/71–Text in English and in French.Title on added t.p. : Rapport annuel CRDI 2010–2011ISSN 0704-7584ISBN 978-1-55250-500-7
1.Technical assistance, Canadian — Periodicals.
2. Economic development — Canada — Periodicals.
I. Title.HC60 338.91’71’01754 C75-743379E