innovation in europe: where’s it going? how does it happen?
TRANSCRIPT

Innovation in Europe:Where’s it going? How does it happen?
Stephen RoperAston Business School, Birmingham, UK
Email: [email protected]

Overview
Innovation in Europe: Where is it going?The challengeThe Lisbon Agenda, targets and progressFramework programmesDealing with diversity
Innovation in Europe: How does it happen? Modelling the innovation value chain – knowledge sourced, transformed and exploited

Innovation in Europe – Where is it going?
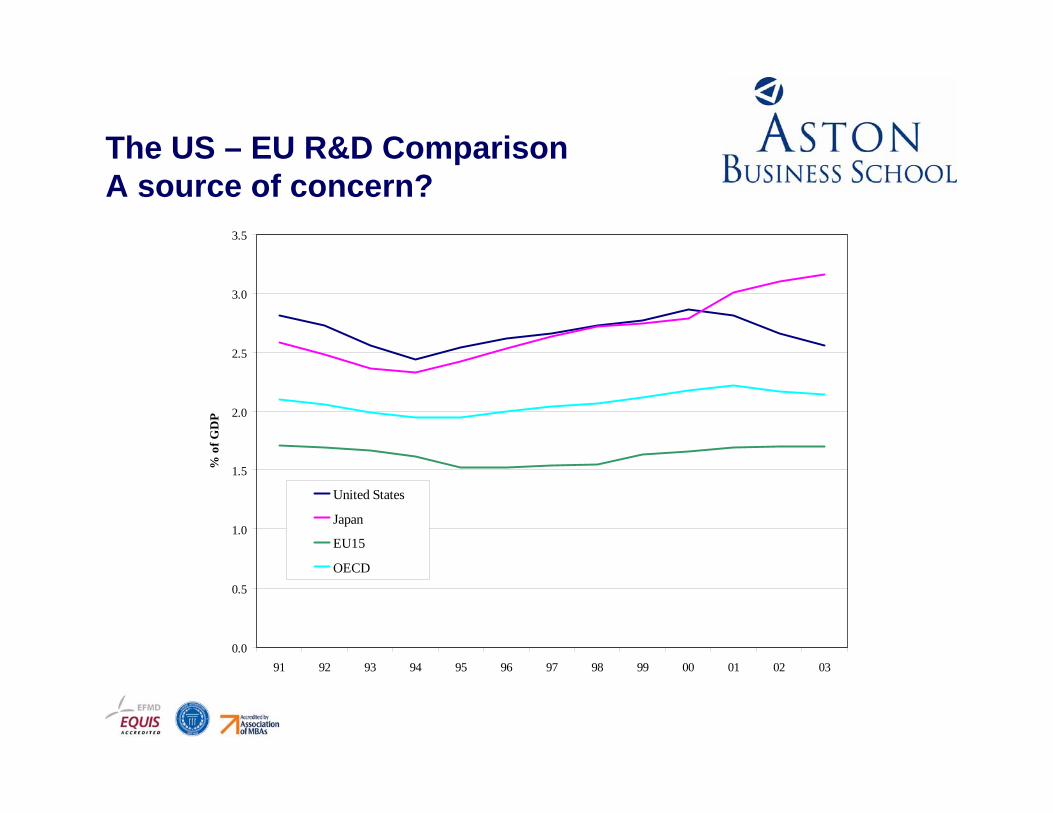
The US – EU R&D ComparisonA source of concern?
0.0
0.5
1.0
1.5
2.0
2.5
3.0
3.5
91 92 93 94 95 96 97 98 99 00 01 02 03
% o
f GD
P
United States
Japan
EU15
OECD

The ‘Lisbon Agenda’In March 2000, EU heads met in Lisbon Summit and set goal to make the EU "the most competitive and dynamic knowledge-based economy in the world, capable of sustainable economic growth with more and better jobs and greater social cohesion".
The Lisbon Summit was designed to mark a turning point for EU enterprise and innovation policy: it saw the high-level integration of social and economic policy with practical initiatives to strengthen the EU's research capacity, promote entrepreneurship and facilitate take-up of information society technologies.
Key target – to raise investment in R&D to three per cent of GDP with objective of two-thirds of this coming from the private sector.
Key initiative – development of a European Research Area – with intensified cooperation on R&D and innovation – draws strongly on ideas of ‘open innovation’ and innovation systems

Total R&D as % of GDP
0.40.60.6
0.70.7
0.91.0
1.11.11.21.2
1.31.3
1.61.71.7
1.81.91.9
1.92.0
2.22.22.2
2.32.52.62.62.62.6
3.03.2
3.54.0
0.0 0.5 1.0 1.5 2.0 2.5 3.0 3.5 4.0 4.5
Mexico (2001)
Slovak Republic
Turkey (2002)
Hungary
Ireland (2002)
New Zealand
Georgia (2003)
Luxembourg (2000)
Norway
United Kingdom
EU15 (1)
Austria (2002)
Belgium
Germany
United States
Iceland
Finland

Business R&D (% of GDP)
0.10.2
0.20.2
0.30.30.4
0.50.6
0.60.80.80.80.8
1.01.01.0
1.21.21.3
1.41.5
1.51.6
1.71.7
1.71.81.8
1.92.0
2.42.5
2.9
0.0 0.5 1.0 1.5 2.0 2.5 3.0 3.5
Mexico (2001)
Turkey (2002)
Portugal (2002)
Hungary
Italy (2002)
Czech Republic
Georgia (2003)
Netherlands (2002)
Norway
United Kingdom
France
OECD
Iceland
Denmark (2002)
United States
Korea
Finland
% of GDP

Higher Education R&D as % of GDP
0.10.1
0.20.2
0.30.30.3
0.30.30.3
0.30.4
0.40.40.4
0.40.40.40.40.40.40.40.4
0.50.5
0.50.60.60.6
0.60.7
0.70.9
0.0 0.1 0.2 0.3 0.4 0.5 0.6 0.7 0.8 0.9 1.0
Slovak Republic
Poland
Ireland (2002)
Hungary
New Zealand
Portugal (2002)
Georgia (2003)
EU25
France
EU15 (1)
Germany
United States
Norway
Denmark (2002)
Austria (2002)
Finland
Sweden

But little progress towards Lisbon target ..
Recent figures show worrying trends in R&D investment and innovation in Europe. Not only will the Barcelona target of increasing R&D spending from 1.9 to 3 percent of GDP by 2010 be missed, but the R&D intensity has actually been declining since 2000. (As in the US, OECD, 2005).
So what to do? Well increase public investment of course!
Key EU measure is the Framework Programme (FP 7) covering 2007-2013 and €48bn investment.

Framework Programme 7 FP7 is main EU measure to support cooperative R&D across Europe by supporting collaborative R&D projects, increasing researcher mobility and investing in large-scale capacity projects. Key mechanism is focussed calls for proposals and then competitive evaluation of project proposals.
Four main areas of activity:
1. Supporting collaborative R&D projects between universities, industry, research centres and public authorities
2. The establishment of an autonomous European Research Council to support and stimulate basic research carried out by individual teams competing at European level.
3. 'Marie Curie' actions, to strengthen training, the career prospects and mobility of European researchers.
4. Capacities: refers to developing and fully exploiting the EU’s research capacities through large-scale research infrastructure, regional cooperation and innovating SMEs.
Other supports for R&D and innovation – national measures and EU Structural Funds

Measuring Innovation (% firms)
GeorgiaAll Firms Industry Services Manuf, 200
Total number of enterprises 100 100 100 100
Product only innovators 10 10 11 23Process only innovators 7 8 5 14Product & Process innovators 23 25 20 33
Enterprises without innovation activit 56 53 60 29
Note in the EU survey another category of incomplete innovation was allowed. This did not exist in the Georgia Survey
EU 1998-2000
Innovation in Europe: How does it happen?

Background remarksFocus on some research we are currently undertaking on panel data on the innovation activities of Irish firms over the 1999-2002 period
Specifically, we are interested in using econometric modelling approaches to capture the process through which firms:
source the knowledge they need to undertake innovationtransform this knowledge into new products and processes, and then exploit their innovations to generate added value.
So we focus on three steps in the innovation process:
Step 1 - what factors shape the strategies firms adopt in sourcing the knowledge necessary for innovation? Are there complementarities here?
Step 2 - how do these alternative knowledge sources influence innovationoutputs?
Step 3 - how do these innovations influence business growth and productivity?

Step 1: Knowledge SourcingThe aim here is to identify what determines firms’ engagement with different knowledge sources – think open innovation
We argue that firms can either ‘make’ knowledge through R&D or gather it through links to customers, suppliers, other firms or public knowledge sources
We find strong support for the idea that these knowledge sources are complementary. In other words 2 + 2 = 5 in knowledge sourcing, perhaps suggesting economies of scope or learning effects
Absorptive capacity effects – linked to R&D organisation – prove important in determining knowledge sourcing behaviour. Other aspects of firms’resource base are less important.
Policy factors also prove important – firms which received state support for innovation were more likely to develop new connectivity – possible behavioural additionality

The innovation value chain
ProductInnovation(intensity)
ProcessInnovation(decision)
Labourproductivity1
Sales Growth2
EmploymentGrowth
3
0.181
0.1 1
1
0.119
0.160.0814
Knowledge Production Innovation Production Output Production
KS-F
KS-H
KS-I
KS-P
0.0607
0.0607
0.321
0.5280.472
0.141
0.0074
KS-B
0.093
0.0792
0.16
0.059
0.0367
0.197
0.170.4380.28
0.134
16.72
5.256
3.012
-0.302
6.747

Step 2: Knowledge transformation
Now we are interested in the factors which shape the effectiveness of firms in translating knowledge into new products and processes
R&D proves important here both in terms of increasing innovationdirectly as well as having an indirect benefit through enhanced absorptive capacity.
External knowledge has a strong and positive effect on innovation outputs – but this differs in terms of product and process innovation
Other factors are also important: plant vintage (-ve); multinationals (-ve); human resources (+ve); state support for innovation (+ve)

The innovation value chain
ProductInnovation(intensity)
ProcessInnovation(decision)
Labourproductivity1
Sales Growth2
EmploymentGrowth
3
0.181
0.1 1
1
0.119
0.160.0814
Knowledge Production Innovation Production Output Production
KS-F
KS-H
KS-I
KS-P
0.0607
0.0607
0.321
0.5280.472
0.141
0.0074
KS-B
0.093
0.0792
0.16
0.059
0.0367
0.197
0.170.4380.28
0.134
16.72
5.256
3.012
-0.302
6.747

Step 3: Knowledge ExploitationHere we focus finally on the impact of innovation on business growth and productivity
Innovation in product and processes are found to have a strong positive effect on growth
Effects on productivity are more complex – process innovation has a positive effect on productivity but product innovation has a short-term negative effect
Capital intensity also has a positive effect on as do skill levels
Policy implications are straightforward encouraging innovation will lead to faster business growth, and this can be supported by training and measures to support capital investment.

The innovation value chain
ProductInnovation(intensity)
ProcessInnovation(decision)
Labourproductivity1
Sales Growth2
EmploymentGrowth
3
0.181
0.1 1
1
0.119
0.160.0814
Knowledge Production Innovation Production Output Production
KS-F
KS-H
KS-I
KS-P
0.0607
0.0607
0.321
0.5280.472
0.141
0.0074
KS-B
0.093
0.0792
0.16
0.059
0.0367
0.197
0.170.4380.28
0.134
16.72
5.256
3.012
-0.302
6.747

Final RemarksEurope has made slow progress in increasing levels of R&D spending and innovation investment over recent years despite thepolicy emphasis
The Scandinavian countries tend to be setting the pace for R&D and innovation investments and a more conscious systemic approach topolicy – considerable variation remains between countries and between ‘modes’ of innovation
Issues such as absorptive capacity and behavioural additionality are seen as important in terms of building lasting innovation capabilities
Our understanding of the complexity of the innovation value chain remains limited and will be a continued focus of research