insert presentation title heres2.q4cdn.com/591876415/files/doc_presentations/2018/q1...proven...
TRANSCRIPT

| ©2017 Belden Inc. belden.com @beldeninc 1
Belden Overview Q1 2018

| ©2017 Belden Inc. belden.com @beldeninc 2 Adjusted results. See investor.belden.com for reconciliation to comparable GAAP results.
1. 2005 – 2017
Belden Overview
Operational Excellence
Disciplined Capital Allocation
Proven Management Team
DEPLOYS A Robust Business System
Revenue CAGR +6%
FCF CAGR +15% DELIVERS Strong, Consistent Results1
EBITDA +970 bps
ROIC +910 bps
Bandwidth
Video Consumption BENEFITS From Favorable Secular Trends
Industrial Automation
Smart Buildings
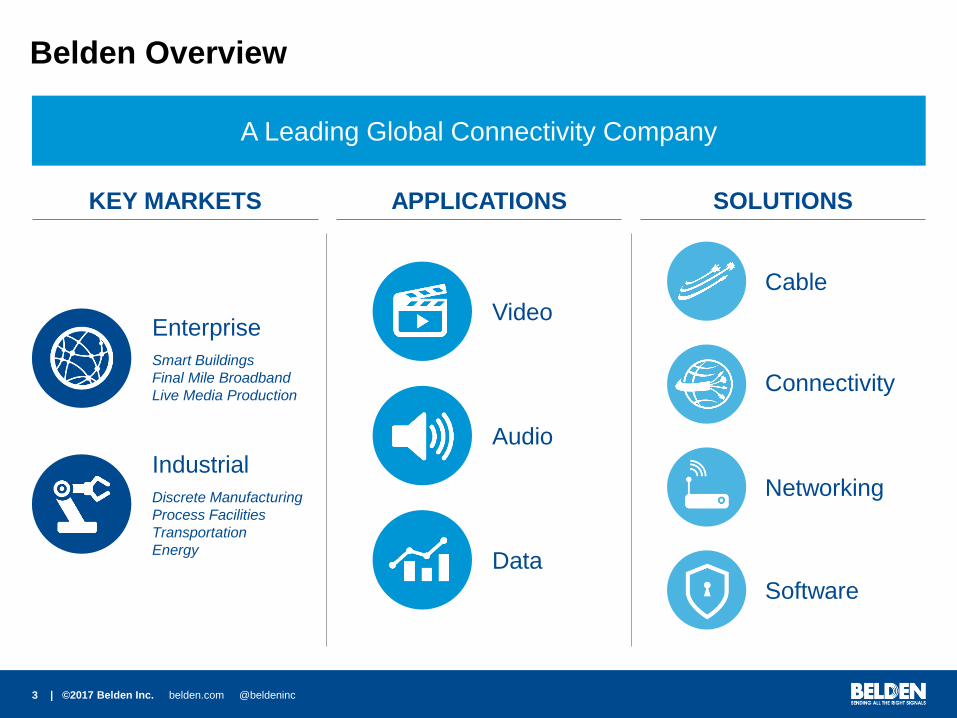
What is Belden? A Leading Global Connectivity Company that …
SERVES Two Primary End-Markets
Enterprise
Industrial
| ©2017 Belden Inc. belden.com @beldeninc 3
Belden Overview
KEY MARKETS
Industrial
Discrete Manufacturing
Process Facilities
Transportation
Energy
Enterprise
Smart Buildings
Final Mile Broadband
Live Media Production
Data
Audio
Video
Connectivity
Cable
Networking
Software
APPLICATIONS SOLUTIONS
A Leading Global Connectivity Company

| ©2017 Belden Inc. belden.com @beldeninc 4
Transmitting and Securing Data, Sound, and Video in
Complex Enterprise and Media Networks
Fiber Copper A/V
KEY SOLUTIONS
Enterprise
Smart Buildings
KEY MARKETS
Cable Connectivity Networking Software
Fiber Copper A/V
Racks Connectivity Tools
Cameras Switchers Replay
Routing Playout
Extended LAN Commercial A/V Broadband Deployment (Fiber/Copper) Live News and Sports Production Stadium Infrastructure
Final Mile Broadband Live Media Production
Editing Playout Asset Management
Automated Production Control

| ©2017 Belden Inc. belden.com @beldeninc 5
Fiber Copper
KEY SOLUTIONS
Industrial
Discrete Manufacturing Process Facilities Transportation Energy
KEY MARKETS
Cable Connectivity Networking Software
Active I/O Modules Passive Distribution
Boxes Connectors
Wireless Gateways Switches Routers Security Configuration Management Firewalls
Network Management Vulnerability Management
Factory Floor Automation Process Automation Transportation Control Systems
and Wireless
Smart Grid Infrastructure
Transmitting and Securing Data, Sound, and Video in
Harsh Industrial Environments

| ©2017 Belden Inc. belden.com @beldeninc 6
Proven Track Record
REVENUE EBITDA
MARGIN
FREE CASH
FLOW
RETURN
ON INVESTED
CAPITAL1
2005 $1.246B 8.5% $37M 4.1%
2017 $2.389B 18.2% $192M 13.2%
Variance 6% CAGR Improvement of
970 bps 15% CAGR
Improvement of
910 bps
Non-GAAP results. See investor.belden.com for reconciliation to comparable GAAP results.
1. Excluding excess cash.
SIGNIFICANTLY IMPROVED FINANCIAL PERFORMANCE

| ©2017 Belden Inc. belden.com @beldeninc 7
REVENUE MIX
Improved Portfolio Composition
DIVESTED Lower-margin cable
ACQUIRED Higher-margin software,
networking, and connectivity CABLE
CONNECTIVITY
CABLE
CONNECTIVITY
NETWORKING
SOFTWARE
REVENUE MIX
2005
2017
1.2B Revenues
Gross Profit
21
$ %
2.4B Revenues
Gross Profit
41
$ %
| ©2017 Belden Inc. belden.com @beldeninc 8
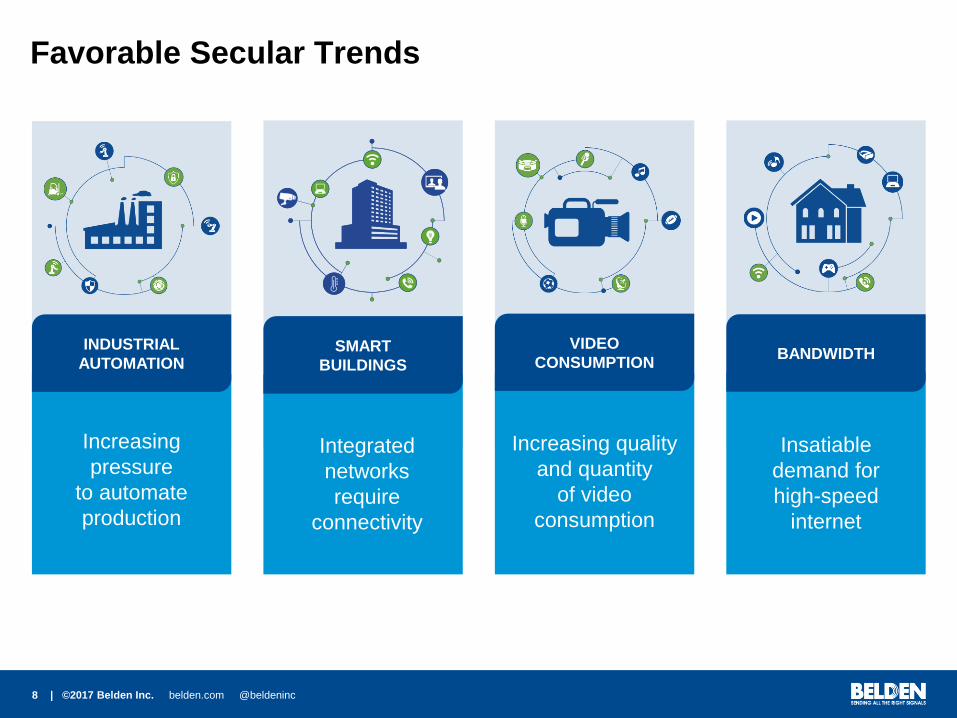
Favorable Secular Trends
INDUSTRIAL
AUTOMATION
Increasing
pressure
to automate
production
SMART
BUILDINGS
Integrated
networks
require
connectivity
BANDWIDTH
Insatiable
demand for
high-speed
internet
VIDEO
CONSUMPTION
Increasing quality
and quantity
of video
consumption
| ©2017 Belden Inc. belden.com @beldeninc 9
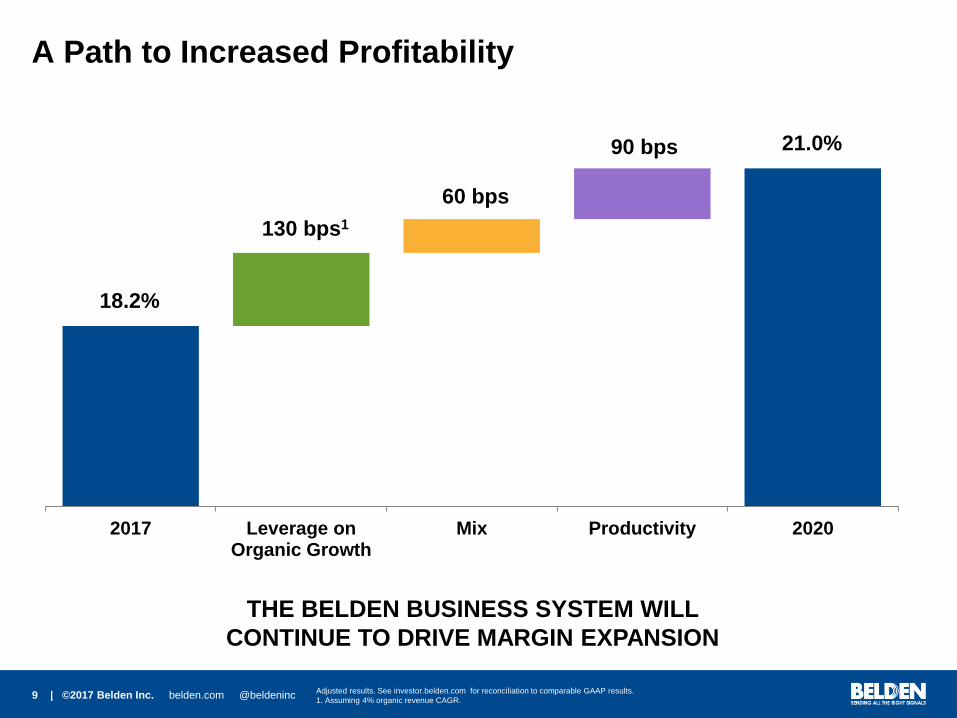
2017 Leverage onOrganic Growth
Mix Productivity 2020
Adjusted results. See investor.belden.com for reconciliation to comparable GAAP results.
1. Assuming 4% organic revenue CAGR.
THE BELDEN BUSINESS SYSTEM WILL
CONTINUE TO DRIVE MARGIN EXPANSION
130 bps1
60 bps
90 bps 21.0%
A Path to Increased Profitability
18.2%

| ©2017 Belden Inc. belden.com @beldeninc 10
$240
$200
$361
$240
$541
2017 2018 2019 2020 2021 2022 2023 2024 2025 2026 2027
SIGNIFICANTLY IMPROVED BALANCE SHEET
1. Euro-denominated debt. Using exchange rate as of 12/31/17.
A Quality Balance Sheet with Long-Term Maturities
1 1 1 1
Fixed, Long-Term Maturities
Euro-Denominated
Debt Improves Earnings
Exposure to the Euro
Pre-Tax Cost of Debt
= 3.9%
(millions)

| ©2017 Belden Inc. belden.com @beldeninc 11
Well-Capitalized and Strategically Advantaged
~$1.7 BILLION ~$430 million
≤ 3.0x
Management’s best estimate. 1. Estimated cash available for deployment.

| ©2017 Belden Inc. belden.com @beldeninc 12
Organic Investments in capital
expenditures to support organic
growth and sustain core businesses
Highly selective M&A to expand
our product offering into our current
customer set and realize significant
synergies
Belden Capital Allocation Framework
Based on management’s best estimates.
Percent
of Capital
~25%
~55%
~20%
We invest only where we can leverage the Belden Business System
to generate best-in-class ROIC
Share Repurchase when the market
price is below the NPV of our strategic
plan and Dividends

| ©2017 Belden Inc. belden.com @beldeninc 13
EPS Accretion from Capital Deployment
9%
$100M $0.16
$300M $0.48
$500M $0.80
$700M $1.12
ROIC
Assumes Tax Rate = 24%, Number of Shares = 48.9M, Depreciation = 2% of Revenues
Deployed Capital
YEAR 1

| ©2017 Belden Inc. belden.com @beldeninc 14 Adjusted results. Please see appendix for comparable GAAP results.
1. Constant currency. 2. ROIC excluding excess cash.
3-YEAR FINANCIAL GOALS
(2017 – 2020)
Revenue
CAGR1 5-7%
EBITDA Margin 20-22%
Free Cash Flow
CAGR 13-15%
Return on
Invested Capital2 13-15%
3-Year Financial Goals

| ©2017 Belden Inc. belden.com @beldeninc 15
Investment Thesis
Attractive Valuation3
Proven Track Record 2005-2017
EBITDA Margin Upside
Secular Tailwinds
Accretive M&A Potential
Revenue +6% CAGR to $2.4B | EBITDA +970 bps to 18.2% | FCF +15% CAGR to $192M | ROIC +910 bps to 13.2%
15.5% in 2014 | 18.2% in 2017 | 20 - 22% goal by 2020
Industrial Automation | Smart Buildings | Video Consumption | Bandwidth
$1.7B dry powder available 2018 – 20201 | ~$0.16 - $0.18 EPS accretion per $100M deployed2
9x EV/EBITDA | 12x P/E | 7% FCF Yield
Adjusted results. See investor.belden.com for reconciliation to comparable GAAP result.
1. Management’s best estimate 12/5/17. Estimated cash available for deployment from organic activities.
2. Expectations for year-one assuming 9 -10% ROIC.
3. Stock price as of 2/2/2018. Denominator based on 12-month forward consensus

| ©2017 Belden Inc. belden.com @beldeninc 16
Q4 2017 Earnings

| ©2017 Belden Inc. belden.com @beldeninc 17
Q4 2017 Overview
Adjusted results. See investor.belden.com for reconciliation to comparable GAAP results..
All references to Net Income refer to income from continuing operations attributable to Belden.
All references to Earnings Per Share refer to adjusted net income per diluted share attributable to Belden common stockholders
• Revenues of $604.9M, decreasing 50 basis points
year-over-year
• Generated EBITDA of $110.2M
• EPS of $1.62, increasing 14.1% year-over-year
• Increased full-year 2018 revenue guidance to
$2.528 - $2.578 billion from $2.492 - $2.542 billion

| ©2017 Belden Inc. belden.com @beldeninc 18
FY 2017 Highlights
Adjusted results. See investor.belden.com for reconciliation to comparable GAAP results..
All references to Net Income refer to income from continuing operations attributable to Belden.
All references to Earnings Per Share refer to adjusted net income per diluted share attributable to Belden common stockholders
• Record revenues of $2.389B
• Generated record EBITDA of $434.3M
• Record net income of $265.0M, increasing 10.4%
• Strengthened balance sheet, acquired Thinklogical
and increased investment in attractive organic
growth initiatives

| ©2017 Belden Inc. belden.com @beldeninc 19
Revenue $162.6M
EBITDA Margin 19.9%
Revenue $110.0M
EBITDA Margin 25.8%
Revenue $174.7M
EBITDA Margin 12.7%
Revenue $157.7M
EBITDA Margin 16.7% Precision A/V
Cable & Connectivity
Q4 2017 Segment Overview
Cameras Signal Processing
& Routing
Monitoring
Systems
Automation Playout
& Branding
Systems
Industrial
I/O Connectors
Industrial
Cables
IP/Networking
Cables
I/O Modules/
Active
Distribution
Boxes
Customer-Specific
Wiring
Copper & Fiber
Connectivity
Racks &
Enclosures
Ethernet,
Fiber Optic & Coaxial
Drop, Headend &
Hardline Connectors
Broadcast
Solutions
Enterprise
Solutions
Industrial
Solutions
Network
Solutions Wireless, Gateways
Embedded
Switches &
Routers
Network Management
Software Vulnerability & Configuration
Management Firewalls
KVM
Switches

| ©2017 Belden Inc. belden.com @beldeninc 20
Q4 2017 Financial Summary
Adjusted results. See investor.belden.com for reconciliation to comparable GAAP results.
(1) All references to Net Income refer to adjusted net income attributable to Belden
(2) All references to Earnings Per Share refer to adjusted net income per diluted share attributable to Belden common stockholders
Q4 2017 Q3 2017 Q4 2016
Revenue $604.9M $621.7M $608.2M
Gross profit $237.7M $255.4M $264.1M
Gross profit percentage 39.3% 41.1% 43.4%
EBITDA $110.2M $119.2M $122.5M
EBITDA percentage 18.2% 19.2% 20.1%
Net Income(1) $79.0M $73.9M $70.3M
Earnings Per Share(2) $1.62 $1.49 $1.42

| ©2017 Belden Inc. belden.com @beldeninc 21
Q4 2017 Segment Results
Consolidated are adjusted results. See investor.belden.com for reconciliation to comparable GAAP results.
(1) Consolidated results include income / (loss) from our equity method investment.
Broadcast
Solutions
Enterprise
Solutions
Industrial
Solutions
Network
Solutions Consolidated
Q4 2017
Revenue $174.7M $157.7M $162.6M $110.0M $604.9M
EBITDA(1) $22.2M $26.3M $32.3M $28.3M $110.2M
EBITDA Margin 12.7% 16.7% 19.9% 25.8% 18.2%
Q3 2017
Revenue $193.8M $167.1M $160.5M $100.4M $621.7M
EBITDA(1) $35.7M $26.4M $30.5M $24.9M $119.2M
EBITDA Margin 18.4% 15.8% 19.0% 24.8% 19.2%
Q4 2016
Revenue $208.8M $150.2M $146.7M $102.4M $608.2M
EBITDA(1) $48.6M $20.7M $27.5M $26.0M $122.5M
EBITDA Margin 23.3% 13.8% 18.8% 25.4% 20.1%

| ©2017 Belden Inc. belden.com @beldeninc 22
Q4 2017 Balance Sheet Highlights
(1) Net leverage is calculated as (A) total debt less cash and cash equivalents divided by (B) trailing twelve months Adjusted EBITDA plus trailing twelve months stock based compensation
expense.
Q4 2017 Q3 2017 Q4 2016
Cash and cash equivalents $561M $461M $848M
Working Capital Turns 8.6x 7.1x 15.4x
PP&E turns 7.2x 7.7x 7.9x
Total debt principal amount $1.58B $1.55B $1.64B
Net Leverage(1) 2.3x 2.3x 1.8x

| ©2017 Belden Inc. belden.com @beldeninc 23
Q4 2017 Cash Flow Highlights
(1) Capital expenditures, net of proceeds from the disposal of tangible assets. See Appendix for reconciliation.
(2) Free cash flow is not a term defined by generally accepted accounting principles (GAAP) and our definition may or may not be used consistently with other companies that define this term.
See investor.belden.com for reconciliation to comparable GAAP results.
(3) Net of cash acquired.
Q4 2017 Q4 2016 FY 2017 FY 2016
Cash flows from operating activities $151.7M $167.4M $255.3M $314.8M
Less: Net capital expenditures(1) $29.8M $17.8M $63.2M $53.6M
Free cash flow (2) $121.9M $149.6M $192.1M $261.2M
Cash used to acquire businesses(3) $0.0M $1.0M $166.9M $18.8M
Dividends / Share Repurchases $24.3M $9.8M $68.4M $16.1M

| ©2017 Belden Inc. belden.com @beldeninc 24
Outlook
(1) Adjusted Outlook. See investor.belden.com for reconciliation to comparable GAAP outlook.
(2) All references to Earnings Per Share refer to adjusted net income per diluted share attributable to Belden common stockholders.
Q1 2018
• Revenue of $575 - $595 million
• Earnings Per Share(1)(2) of $1.05 - $1.15
2018 Full Year
• Revenue of $2.528 - $2.578 billion
• Earnings Per Share(1)(2) of $5.95 - $6.20

| ©2017 Belden Inc. belden.com @beldeninc 25
Appendix

| ©2017 Belden Inc. belden.com @beldeninc 26
Industrial Automation
Sources: “The Skills Gap in Manufacturing”, Deloitte, 2015; Bureau of Economic Analysis;
Eurostat; Federal Reserve.
DRIVING IP ADOPTION
IP BENEFITS IP CHALLENGES
TRENDS ASSET REPLACEMENT INDICATORS
FLEXIBILITY …
LABOR SUBSTITUTION …
SHORTER LEAD-TIMES
LOWER COST OF CAPITAL
AGING EQUIPMENT …
CAPACITY UTILIZATION AT MULTI-YEAR HIGHS …
84%
EU
77%
UNITED STATES PRODUCT CUSTOMIZATION
2025
2M Unfilled
manufacturing
jobs globally
2015
SKILLS GAP AND WAGE INFLATION
Connect new technologies with legacy systems
Collaboration between operational
and information technologies
Manage security risks
Factory connected to the enterprise
Remote access
Open standards
2016 = 7.7 years
Average age of manufacturing assets highest since 1951

| ©2017 Belden Inc. belden.com @beldeninc 27
Smart Buildings
Driving Investment …
High-Spec Copper Cabling Cat 6A
+26% CAGR1 (2015 – 2021)
Connectivity LAN Connectivity Points
+3% CAGR1 (2015 – 2021)
Audio/
Visual
Lighting
Fire/
Alarm
HVAC
Control/
Instrumentation
Local Area
Network
Security
1. “Convergence and Digitization of Commercial Buildings in U.S.”, BSRIA, May 2017.
Deliver New User
Experiences
Enable Business
Analytics
Improve Efficiency
and Sustainability

| ©2017 Belden Inc. belden.com @beldeninc 28
CREATING CHALLENGES
FOR OUR CUSTOMERS
LIVE BROADCAST 63% of television ad spend is allocated to
live events vs. pre-produced content
BROADCASTERS NEED TO ADOPT IP TECHNOLOGIES
TO ADDRESS THESE CHALLENGES
Video Consumption
VIDEO CONSUMPTION
IS CHANGING
VIDEO QUALITY 51% CAGR of UHD televisions installed
(2016 – 2021)
VIDEO FORMATS 26% CAGR of over-the-top subscribers
(2014 – 2017)
UHD CONTENT CREATION
Requires higher bandwidth than
legacy protocols can provide
DELIVERING CONTENT ON
MULTIPLE PLATFORMS
Challenges existing workflow
Sources: Cisco VNI, 2017; Bloomberg; Major Networks.
PRODUCING LIVE EVENTS
Is complex and has the highest
cost of failure

| ©2017 Belden Inc. belden.com @beldeninc 29
Bandwidth
Creating Opportunity for our Customers …
… Driving Significant Investment
Internet traffic will grow 3x by 2021
Video traffic will exceed 80% in 2021
Today, the number of
NETWORKED
DEVICES
MSO revenue
per high-speed data user
= 2X Global
Population
2014 2017 2020E
$44.94
$52.75
$60.80
Sources: Cisco VNI, 2017; SNL Global Market Intelligence, 2017; Sell-side consensus estimates as of 10/9/17.
By 2021, the number of
NETWORKED
DEVICES
= 4X Global
Population
73% of internet traffic today is video
Global fixed broadband
speeds will double by 2021