institucional presentation - december/15
TRANSCRIPT

11
Localiza Rent a Car S.A.
The 25th most valuable brand in Brazil.
December, 2015
Source: Interbrand

1. Company overview
2. Main business divisions
Car Rental
Fleet Rental
Seminovos
3. Financials
Appendix: Earnings release 3Q15
Agenda
2

Company: milestones
Phase I – Rise to #1
1973 – Founded in Belo Horizonte/MG
Late 70’s - Acquisitions in the Northeast of Brazil
1981 – Brazilian car rental leader in # of branches
Phase II – Expansion
1984 – Expansion strategy by adjacencies: Franchising
1991 – Expansion strategy by adjacencies: Seminovos
1997 – Expansion strategy by adjacencies: Fleet Rental
1997 – PE firm DL&J enters at a market cap of US$ 150 mm
Phase III – Reaching Scale
2005 – IPO: market cap of US$ 295 mm
2011 – Rated as investment grade by Moody’s, Fitch and S&P in 2012
2012 – ADR level I
09/30/2015 – Market cap of about US$1.3 bi with ADTV of US$8 million
1973 1982 1983 2004 2005 2014
3
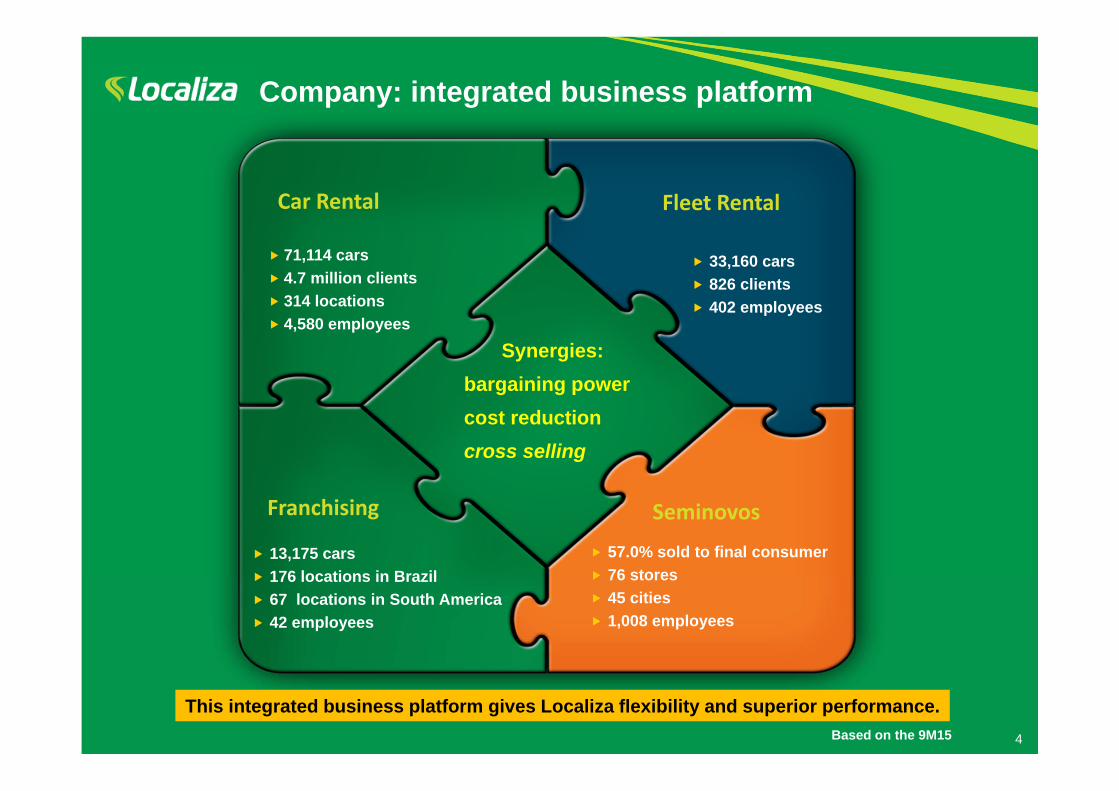
Company: integrated business platform
Synergies:bargaining powercost reductioncross selling
13,175 cars 176 locations in Brazil 67 locations in South America 42 employees
57.0% sold to final consumer 76 stores 45 cities 1,008 employees
71,114 cars 4.7 million clients 314 locations 4,580 employees
33,160 cars 826 clients 402 employees
This integrated business platform gives Localiza flexibility and superior performance.Based on the 9M15 4
Car Rental Fleet Rental
SeminovosFranchising

5
High fixed cost Standard fleet 1 year cycle High entry barriers Gains of scale Intensive capital Consolidated in airport
market Fragmented off airport
market
Support area Reduces depreciation Know How of used cars
market Low dependence on
intermediates
Supplementary business
Important for distribution
High profitability Low contribution in
results
Company: Business platform divisions
Car Rental
Rents to individuals and companies at airports and off airport locations.
Franchising
Contributes to expand the Localiza’s network.
Fleet Rental
Outsources fleet for 2-3 years term contracts.
Used Car Sales
Sells the used cars mainly to final consumers after the rental and estimates the residual values.
Low fixed cost Customized fleet 3 years cycle Low entry barriers Intensive capital

6
Net car salerevenue R$26.21 year cycle
Car Rental Division - 2014 Financial CyclePer car
R$27.8Average car price
1 2 3 4 5 6 7 8 9 10 11 12Expenses, interest and tax
Revenue
Spread9.5p.p.
Total1 year
R$ % R$ % R$Net revenues 20.9 100.0% 29.0 100.0% 49.8Costs - fixed and variable (9.4) -44.9% (9.4)SG&A (3.4) -16.3% (2.8) -9.6% (6.2)Net revenues of car sold 26.2 90.4% 26.2Book value of car sold (24.8) -85.6% (24.8)EBITDA 8.1 38.7% 1.4 4.7% 9.5Cars Depreciation (1.3) -4.4% (1.3)Others depreciation (0.4) -1.7% (0.2) -0.6% (0.5)Financial expenses (1.7) -6.0% (1.7)Taxes (2.3) -11.1% 0.5 1.9% (1.8)Net Income (Loss) 5.4 25.9% (1.3) -4.4% 4.1
NOPAT 5.3ROIC (it considers the effect of the average book value of the car in its useful life) 17.5%Cost of debt after taxes 8.0%
Car Rental SeminovosPer car soldPer operating car

7
Net car salerevenue R$24.4
3 year cycle
Fleet Rental Division - 2014 Financial Cycle Per car
Spread9.5p.p.
1 2 3 4 5 6 31 32 33 34 35 36Expenses, interest and tax
Revenue
R$33.3Average car price
Total3 years
R$ % Seminovos % R$Net revenues 55.7 100.0% 26.9 100.0% 82.6Costs - fixed and variable (18.6) -33.4% (18.6)SG&A (3.7) -6.7% (2.5) -9.3% (6.2)Net revenues of car sold 24.4 90.7% 24.4Book value of car sold (21.2) -78.9% (21.2)EBITDA 33.4 60.0% 3.2 11.8% 36.6Cars Depreciation (12.6) -46.9% (12.6)Others depreciation (0.1) -0.2% (0.1) -0.2% (0.2)Financial expenses (4.4) -16.3% (4.4)Taxes (10.0) -17.9% 4.2 15.5% (5.8)Net Income (Loss) 23.3 41.8% (9.7) -36.1% 13.6
Net Income (Loss) - per year 7.8 41.8% (3.2) -36.1% 4.5
NOPAT 5.6ROIC (it considers the effect of the average book value of the car in its useful life) 17.5%Cost of debt after taxes 8.0%
Per operating carFleet Rental Seminovos
Per car sold

8
2014 Consolidated breakdownR$ million
Company’s profitability comes from Car Rental and Fleet Rental Divisions.
12%
35%
52%
35%
65%
Net RevenuesR$3,892
EBITDAR$970
52%
15%
33%
EBIT*R$726
R$2,018
R$1,302
R$572
R$120
R$507
R$343
R$253
R$473
*Seminovos results recorded in the Car Rental and Fleet Rental Divisions

Raisingmoney Buying
cars
Renting Cars SellingCars
Cash to renew the fleet or pay debt
$
Profitability comes from rental divisions
Competitive advantages
$
9
42 years of experience in managing assets and generating value.

Competitive advantages: raising money
Global Scale
National Scale
Localiza raises money with better conditions then its competitors.
As of December, 2015.
BBB- FitchBaa3 Moody’sBBB- S&P
Baa1 Moody´sBBB+ S&P
B1 Moody´sB+ S&P
Ba3 Moody´sBB- S&PBB- Fitch
brAAA S&P Aa1.br Moody’sAAA(bra) Fitch
brAA- S&PA+ (bra) Fitch
brA S&P A- (bra) Fitch A+ (bra) Fitch A(bra) Fitch
Raisingmoney
Buyingcars Renting Cars Selling
Cars
10
Investment grade: lower spreads and longer tenors
Source: Bloomberg and companies website

11
Competitive advantages: buying cars
Localiza buys cars with better conditions due to the volume of purchases.
Number of cars purchased - 2014
* Includes Franchising
86,426
22,920 17,246 14,177
Localiza Unidas Movida Locamerica
*
Source: each company website and ANFAVEA
Localiza’s share in the internal sales of themajor OEMs - 2014
3.6%
Raisingmoney
Buyingcars Renting Cars Selling
Cars

442
15595 107
43
Localiza Unidas Hertz Movida Avis
12
The Company is present in 243 cities where the other largest networks do not operate.
Competitive advantages: renting cars
Brand Brazilian distribution
# of
bra
nche
s*#
of c
ities
**
Source: Each company website and Earnings Release*As of September, 2015 **As of November, 2015
484
Raisingmoney
Buyingcars
Renting CarsSellingCars
108
185
14645
Localiza Competitors
490

13Constant innovations allow maintenance of the premium service.
Localiza Express®Self‐service that provides fast service, reducing queues and scalability to service.
Localiza Way®New platform to offer value‐added services
Mobile Checklist
More quality, control and agility in providing cars for rental
Fast CheckoutMore operational productivity and agility in returning the cars after rental
Connected ShuttleOptimization of customer shuttle service at airports
Anti fraudTaylor‐made solution for fraud prevention in car rentals
Raisingmoney
Buyingcars
Renting CarsSellingCars
Competitive advantages: Innovation

Raisingmoney
Buyingcars
Car rentalSelling
cars
Competitive advantages: Client satisfaction
81.0%
*Range of Net Promoter Scores (NPS) Across Industries in USA
*Source:Temkin Group Q3 2015 Consumer benchmark Survey
Low HighNPS Avg. NPS
% of Promoters % de DetractorsScore between 9 and 10 = 85.6% Score between 0 and 6 = 4.6%
YTD September/2015
“In a scale from 0 (zero) to 10, how much would you recommend Localiza to afriend or colleague?”
Satisfaction Index: NPS – Net Promoter Score
Localiza: 1st place in the category Rental Vehicles.

15Differentiated offer with higher added value to the customer.
Integrated technology solution that increases competitive intelligence and leverages productivity gains.
CONNECTED FLEETIntegrated mobile solution tofleet rental services for drivers and contract manager.
MOBILE SOLUTIONRapid diagnosis and friendly vision of the fleet by the customer.
ONLINE FLEET RENTAL
Raisingmoney
Buyingcars
Fleet rentalSellingCars
Competitive advantages: Innovation

16
Sales to final consumer
Competitive advantages: selling cars
Distribution channel: 200 cities and 1,900 customers.
Sales center: 20k incoming calls per month with 55% visits to stores scheduled.
Raising money
Buying cars Renting Cars
Selling Cars
Buffer: additional fleet during peaks of demand
Information/mobility: Ipad for Salesmen
• Support sale• Access to the database • Customer registration• Agility in car sales

17
ROIC versus cost of debt after taxes
7.3%8.6%
6.3% 6.0%8.0%
9.3%
16.9% 17.1%16.1% 16.5%
17.5% 16.3%
2010 2011 2012 2013 2014 9M15**Annualized
ROIC
Cost of debt after taxes
9.6p.p. 8.5p.p. 9.5p.p.9.8p.p. 10.5p.p.7.0p.p.

Localiza Unidas Locamerica Ouro Verde JSL
Localiza Unidas Locamerica Ouro Verde JSL
Localiza vs. playersProfitability
Source: Companies’ Financial Statements 18
ROIC 2014
ROE 2014
FleetRAC+Fleet Rental RAC+Fleet Rental Fleet Rental Fleet Rental RAC+Fleet Rental
125,224 40,296 30,291 25,326 49,429*ReferenceROIC = NOPAT / (Average net debt + average equity)ROE = Net income / Equity at the beginning of the year
17.5%
8.1% 9.1% 8.5% 7.6%
30.6%
8.2%7.1%10.9%
7.1%
Consolidated
Consolidated

0.8x 1.0x 2.2x
8.5x
3.5x
Localiza Unidas Locamerica Ouro Verde JSL
1.4x 2.2x
3.3x 3.7x 4.2x
Localiza Unidas Locamerica Ouro Verde JSL
19
Net Debt / EBITDA - 2014
Net Debt / Equity - 2014
Source: Companies’ Financial Statements.
Localiza vs. playersDebt ratios
Consolidated
Consolidated

20
1. Company overview
2. Main business divisions
Car Rental
Fleet Rental
Seminovos
3. Financials
Appendix: Earnings release 3Q15
Agenda

21
Car Rental overview
63.9%Compact cars
2014 Fleet composition77,573 cars
36.1%Others
Corporate fleet size
65,08670,717 77,573 71,114
2012 2013 2014 9M15
Car rental distribution (Brazil)
474 479 476 490
2012 2013 2014 9M15

22
Drivers
Source: BCB and Localiza rates
151180 200
240260 300
350 380415
465510
545
622678
724
51%
38%37% 35%
31%27%
22% 20% 18% 16% 15% 15% 13% 13% 12%2000 2001 2002 2003 2004 2005 2006 2007 2008 2009 2010 2011 2012 2013 2014
Monthly minimum salary (R$) Daily rental price over minimum salary (%)
Car rental affordability
Source: IPEADATA and Localiza’s loyalty program.
5 million
84 millionAdult population(age > 20 years)
Class A+B+C
15 millionAdult population(age > 20 years)
Class A+B
Increasing affordability and low penetration in leisure trips brings growth opportunities.

23
Drivers
# domestic air traffic passengersIn million
Infrastructure investment prospects 2015-2018(in US$ billion)
Source: BNDES June, 2015.
7082 89 90 96
122
2010 2011 2012 2013 2014 2017E
Source: ANAC 2017 estimates: BOEING
The strong pipeline of investments tend to benefit the corporate segment. Air traffic growth supporting demand at the airports.
89.4
57.9
27.2
21.3
17.0
16.6
12.3
6.8
ENERGY
TELECOMS
HIGHWAYS
URBAN MOBILITY
PORTS
SANITATION
RAILWAYS
AIRPORTS

24Source: RAIS and each company’s websiteAs of November 2015.
Off-airport market is still fragmented.
Airport locations Off-airport locations
Car Rental Locations in Brazil

25
Market Share – Car Rental 2014
Fleet332,485 cars
Source: ABLA and Companies’ Financial Statements and estimates.
23.3%
2.4%
6.9%
5.8%2.1%
59.5%
Localiza’s market share is higher than the 2nd and 3rd players together.
MovidaUnidas
Franchising
25.7%
Others
Avis

26
1. Company overview
2. Main business divisions
Car Rental
Fleet Rental
Seminovos
3. Financials
Appendix: Earnings release 3Q15
Agenda

27
Number of clients
Fleet Rental overview
35.0%Compact cars
2014 Fleet composition34,312 cars
65.0%Others
729 760798 826
2012 2013 2014 9M15
End of period fleet
32,104 32,809 34,312 33,160
2012 2013 2014 9M15

28Source: ABLA, Datamonitor and Localiza
Low penetration of rented fleet in Brazil.
Rented fleet penetration
Corporate fleet:4,000,000*
Rented fleet:440,737
34,312
Brazilian Market World
11.0% 8.9%13.3% 16.5%
24.5%
37.4%
46.9%
58.3%
Drivers
*Localiza estimates

Market Share – Fleet Rental 2014
29
Fleet440,737 cars
Source: ABLA, Companies’ Financial Statements and estimates
7.8%
0.4%
6.9%
6.9%
5.7%4.9%3.6%
63.9%
Fragmented market with low entry barriers.
8.1%Franchising
Locamerica
JSL
Ouro VerdeUnidas
Others
ALD

30
1. Company overview
2. Main business divisions
Car Rental
Fleet Rental
Seminovos
3. Financials
Appendix: Earnings release 3Q15
Agenda

31Efficiency gain on car sales
# of points of sale
Car sales – operating data
5566 73 74 75 76
2010 2011 2012 2013 2014 9M15
47,285 50,77256,664
62,64170,621
49,258
2010 2011 2012 2013 2014 9M15
# Number of cars sold (quantity)
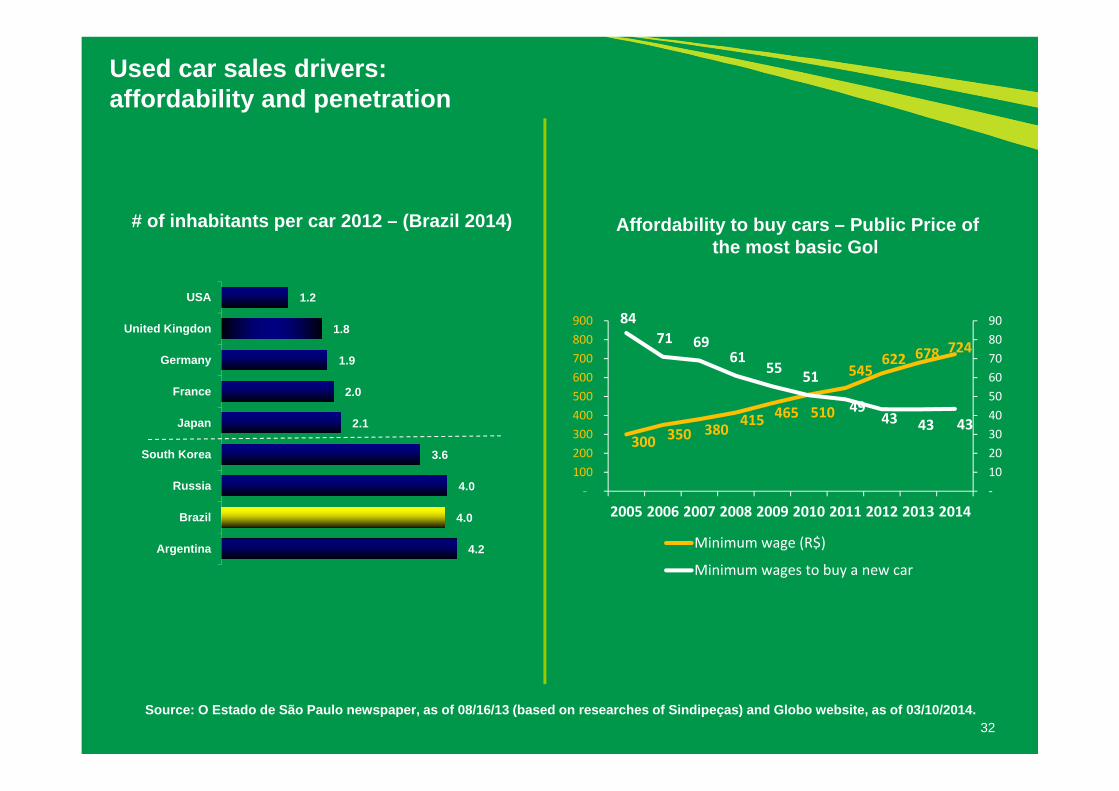
32Source: O Estado de São Paulo newspaper, as of 08/16/13 (based on researches of Sindipeças) and Globo website, as of 03/10/2014.
Used car sales drivers: affordability and penetration
# of inhabitants per car 2012 – (Brazil 2014)
4.2
4.0
4.0
3.6
2.1
2.0
1.9
1.8
1.2
Argentina
Brazil
Russia
South Korea
Japan
France
Germany
United Kingdon
USA
Affordability to buy cars – Public Price of the most basic Gol
300 350 380 415
465 510
545 622 678
724
84 71 69
61 55 51
49 43 43 43
‐ 10 20 30 40 50 60 70 80 90
‐ 100 200 300 400 500 600 700 800 900
2005 2006 2007 2008 2009 2010 2011 2012 2013 2014
Minimum wage (R$)
Minimum wages to buy a new car
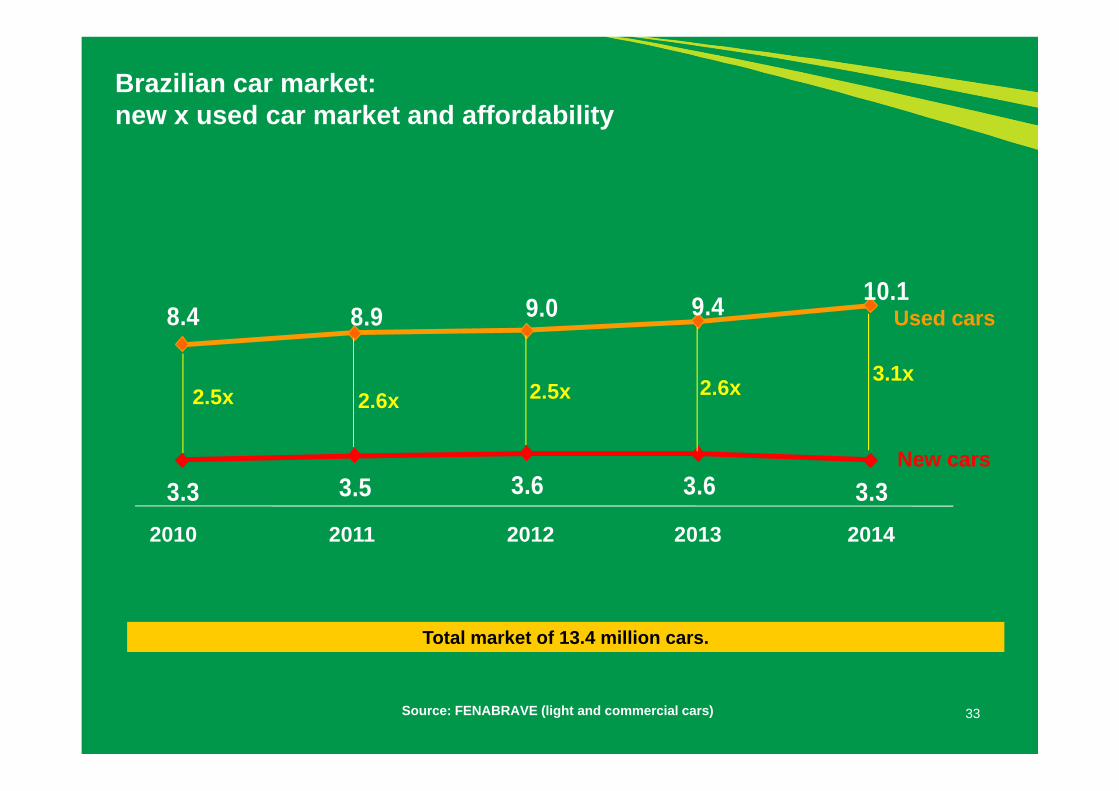
8.4 8.9 9.0 9.4 10.1
3.3 3.5 3.6 3.6 3.3
33
2.5x 2.5x
2010 2011 2012 2013 2014
2.6x
Brazilian car market: new x used car market and affordability
New cars
Used cars
Source: FENABRAVE (light and commercial cars)
2.6x
Total market of 13.4 million cars.
3.1x
34
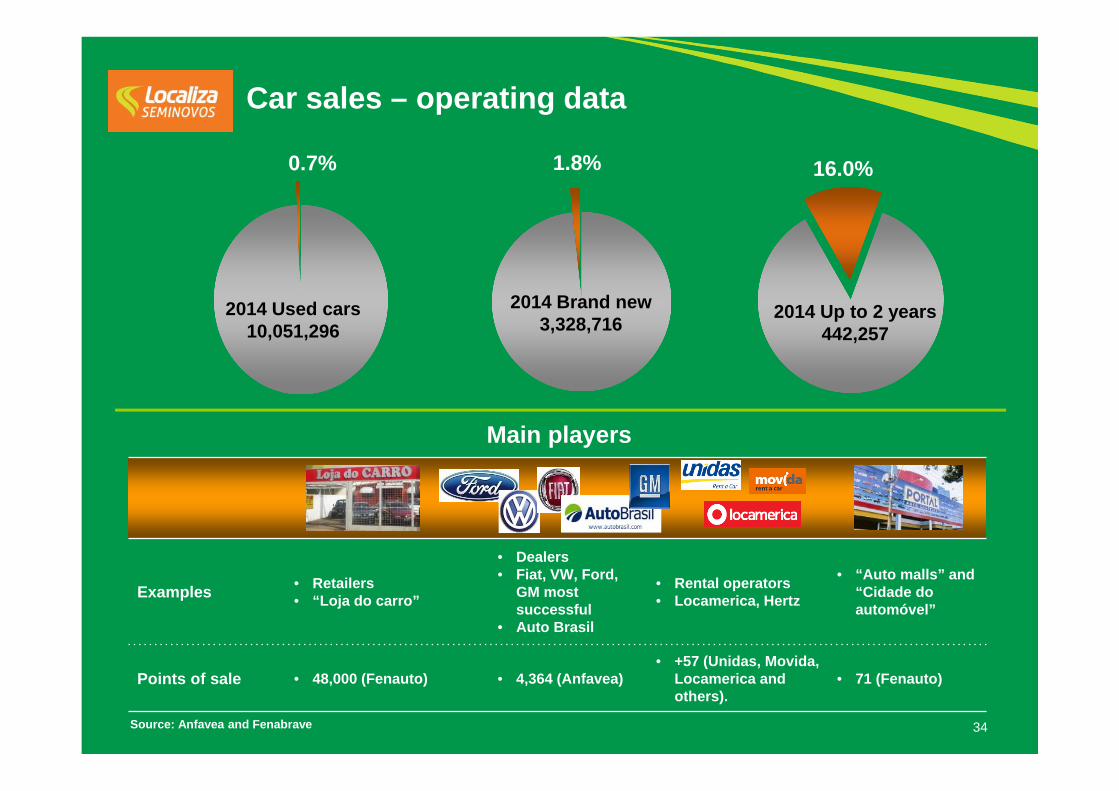
2014 Up to 2 years442,257
2014 Brand new3,328,716
2014 Used cars10,051,296
0.7% 1.8% 16.0%
Car sales – operating data
Source: Anfavea and Fenabrave
Examples • Retailers• “Loja do carro”
• Dealers• Fiat, VW, Ford,
GM most successful
• Auto Brasil
• Rental operators• Locamerica, Hertz
• “Auto malls” and “Cidade do automóvel”
Points of sale • 48,000 (Fenauto) • 4,364 (Anfavea)• +57 (Unidas, Movida,
Locamerica and others).
• 71 (Fenauto)
Main players

35
1. Company overview
2. Main business divisions
Car Rental
Fleet Rental
Seminovos
3. Financials
Appendix: Earnings release 3Q15
Agenda

802.2980.7 1,093.7 1,163.5 1,284.4
953.1 923.5
325.1 317.1
2010 2011 2012 2013 2014 9M14 9M15 3Q14 3Q15
36
Net Revenues (R$ million)
# Daily Rentals (thousands)
Car Rental
Investment in business intelligence contributed to capture the demand in specific segments offsetting reduced volumes in those sectors sensitive to adverse scenario
10,734 12,794 13,749 14,242 15,416 11,518 11,455
3,880 3,871
2010 2011 2012 2013 2014 9M14 9M15 3Q14 3Q15

Average daily rental evolution – Car RentalIn R$
87.06 86.11 88.23 89.39
85.26 81.85
85.93
1Q14 2Q14 3Q14 4Q14 1Q15 2Q15 3Q15
The increase in the average daily rental compared with 2Q15 is mainly due to the participation of segments with the highest rate in the fleet mix even with the promotional bias
37
+5%

69.1%
68.9%
70.8%
66.8%
69.9%
66.3%
69.0%70.7%
2010 2011 2012 2013 2014 1Q15 2Q15 3Q15
38
Utilization rate evolution – Car Rental
3Q15 utilization rate was 70.7%, 1.7p.p. above the rate of 2Q15

234 247 272 286 304 314
181 202 202 193 172 17661 47 50 63 64 67
2010 2011 2012 2013 2014 9M15
Car Rental network evolution
17 new corporate locations were added to the network in 9M15
# of car rental locations (Brazil and abroad)
Localiza´s branches - Brazil Franchisees´ branches - Brazil Franchisses´ branches - abroad
476 496 524 542 540
+10
+3557
+4

361.1455.0
535.7 575.9 571.9425.2 452.9
142.0 154.1
2010 2011 2012 2013 2014 9M14 9M15 3Q14 3Q15
8,0449,603 10,601 10,844 10,363
7,720 8,199
2,567 2,709
2010 2011 2012 2013 2014 9M14 9M15 3Q14 3Q15
40
Net Revenues (R$ million)
# Daily Rentals (thousands)
Fleet Rental
The growth reflects the Company´s commercial intelligence in exploring market opportunities

647.3 676.3
724.3
808.3 870.6 868.8 885.8
1Q14 2Q14 3Q14 4Q14 1Q15 2Q15 3Q15
Contracted revenue evolution – Fleet Rental(R$ million)
The contracted revenue increased 22.3% in 3Q14 vs 3Q15

1,910.4 1,776.5 1,618.82,026.2
2,483.2
1,605.8 1,440.7
584.2 539.3
1,321.9 1,468.1 1,520.01,747.3
2,018.2
1,465.2 1,545.7
535.9 502.5
2010 2011 2012 2013 2014 9M14 9M15 3Q14 3Q15Purchases (includes accessories) Used car sales net revenues
Cars purchased Cars sold
42
Net investmentFleet Expansion* (quantity)
The 5.5% Seminovos net revenue growth in 9M15 was due to the increase of 11.6% in the average price, compensating the reduction of 5.6% in the number of cars sold
Net Investment in Fleet (R$ million)
65,934 59,950 58,65569,744
79,804
52,73842,372
17,674 15,521
47,285 50,772 56,64462,641
70,621
52,153 49,258
18,815 15,738
2010 2011 2012 2013 2014 9M14 9M15 3Q14 3Q15
9,178 2,0117,10318,649
308.4 98.8588.5 278.9
* It does not include theft / crashed cars.
9,183
465.0
585 (6,886)
(1,141) (217)
140.6 (105.0)
48.3 36.8

43
End of period fleetQuantity
Car Rental Division’s fleet was reduced by 6.459 cars when compared to 12/31/2014 to adjust the fleet size to demand
61,445 64,688 65,086 70,717 77,573 70,491 71,114
26,615 31,629 32,104 32,809 34,312 33,072 33,16010,652 12,958 14,545 14,233 13,33912,800 13,175
2010 2011 2012 2013 2014 9M14 9M15
98,712109,275 111,735 117,759 125,224
Car Rental Fleet Rental Franchising
116,363 117,449

1,175.3 1,450.0 1,646.7 1,758.9 1,874.0 1,391.8 1,388.8 471.5 475.5
1,321.9 1,468.1 1,520.0 1,747.3 2,018.2 1,465.2 1,545.7
535.9 502.5
2010 2011 2012 2013 2014 9M14 9M15 3Q14 3Q15
Consolidated net revenuesR$ million
Consolidated net revenues grew 2.7% in 9M15 when compared with 9M14
Rental Used car sales
2,918.13,506.2
3,892.2
2,497.23,166.7
2,857.0 2,934.5
1,007.4 978.0

45
Consolidated EBITDA R$ million
649.5821.3 875.6 916.5 969.8
732.2 706.7
241.5 238.8
2010 2011 2012 2013 2014 9M14 9M15 3Q14 3Q15
(*)From 2012 on, accessories and freight of new cars have been accounted directly in the cost line, impacting EBITDA but reducing depreciation costs.(**) The SG&A of this Division was positively impacted in 3Q14 by R$7.0 million due to the new appropriation criteria of the overhead to Seminovos.
Divisions 2010* 2011* 2012 2013 2014 9M14 9M15 3Q14 3Q15
Car Rental 45.3% 46.9% 40.9% 36.8% 38.7% 39.3%** 32.4% 39.6%** 32.4%
Fleet Rental 68.0% 68.6% 66.4% 65.5% 60.0% 61.5% 61.6% 61.1% 62.6%
Rental Consolidated 52.3% 53.8% 49.3% 46.5% 45.3% 46.3% 42.0% 46.3% 42.3%
Used Car Sales 2.6% 2.8% 4.2% 5.7% 6.0% 6.0% 8.0% 4.4% 7.5%
Car Rental EBITDA margin in 3Q15 was 2.4p.p. higher than 2Q15 margin

46
Average depreciation per carin R$
Car Rental
The reduction of depreciation expense is a result of the increase in new cars prices that reflects in the used cars prices
492 939
333 1,169
2,577
1,536 1,684
1,896 1,452 1,270
558
24,345 25,837 25,648
27,740 26,572 27,174 27,942
25,769 27,785
29,412 31,373
15,000
17,000
19,000
21,000
23,000
25,000
27,000
29,000
31,000
33,000
‐
1,000
2,000
3,000
4,000
5,000
6,000
7,000
2005 2006 2007 2008 2009 2010 2011 2012 2013 2014 9M15
Annualized average depreciation per car (R$) Average price of cars purchased ‐ Car Rental
1,377IPI Effect
2,546 2,076IPI Effect
3,972
Stable car priceRising car price Rising car price

47
Average depreciation per carin R$
Fleet Rental
2,981 2,383 2,396
4,372 3,510
4,133 4,592 4,202 3,921
32,106 33,190 33,754 34,192
30,741
35,414 33,315
35,025 35,693
38,346
45,602
15,000
20,000
25,000
30,000
35,000
40,000
45,000
‐
2,000
4,000
6,000
8,000
10,000
2005 2006 2007 2008 2009 2010 2011 2012 2013 2014 9M15
Annualized average depreciation per car (R$) Average price of cars purchased ‐ Fleet Rental
2,280IPI Effect
5,083 1,097IPI Effect
5,408
Stable car priceRising car price Rising car price
The reduction in depreciation reflects new car prices’ increase and the change in the fleet mix
2,803
4,311
48
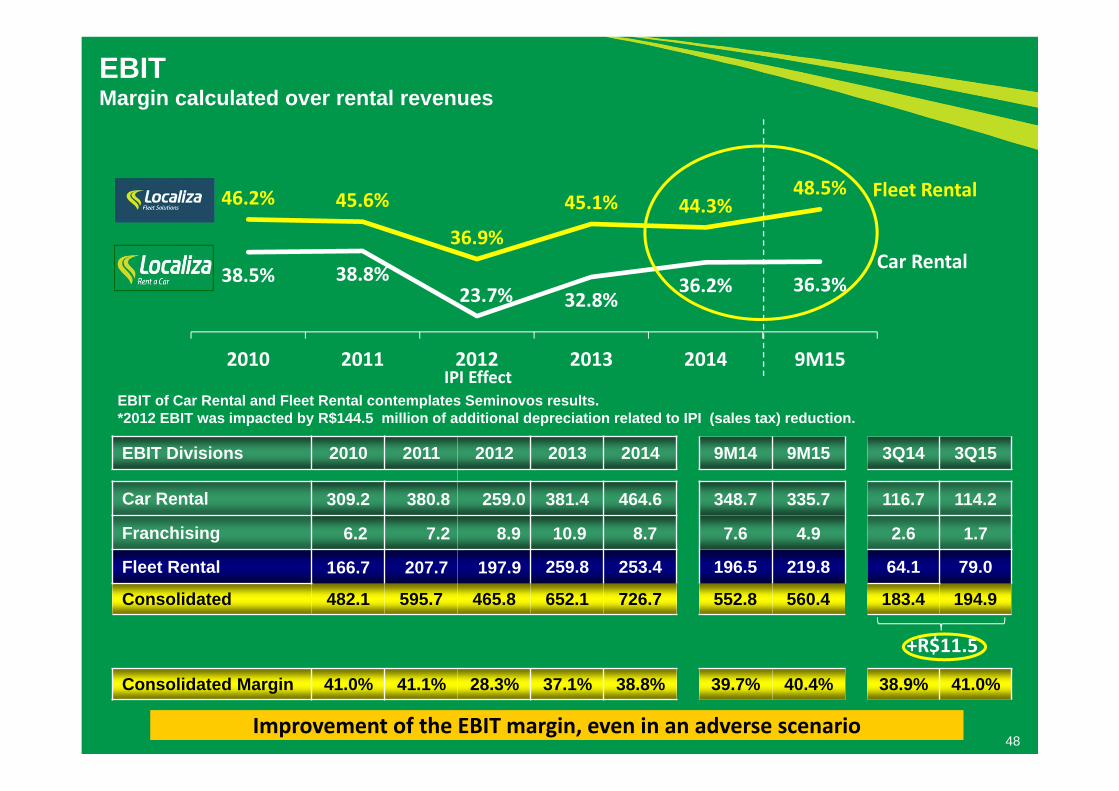
EBIT Divisions 2010 2011 2012 2013 2014 9M14 9M15 3Q14 3Q15
Car Rental 309.2 380.8 259.0 381.4 464.6 348.7 335.7 116.7 114.2
Franchising 6.2 7.2 8.9 10.9 8.7 7.6 4.9 2.6 1.7
Fleet Rental 166.7 207.7 197.9 259.8 253.4 196.5 219.8 64.1 79.0
Consolidated 482.1 595.7 465.8 652.1 726.7 552.8 560.4 183.4 194.9
Consolidated Margin 41.0% 41.1% 28.3% 37.1% 38.8% 39.7% 40.4% 38.9% 41.0%
38.5% 38.8%23.7% 32.8%
36.2% 36.3%
46.2% 45.6%
36.9%
45.1% 44.3%48.5%
2010 2011 2012 2013 2014 9M15
Car Rental
Fleet Rental
EBIT of Car Rental and Fleet Rental contemplates Seminovos results.*2012 EBIT was impacted by R$144.5 million of additional depreciation related to IPI (sales tax) reduction.
EBIT Margin calculated over rental revenues
Improvement of the EBIT margin, even in an adverse scenario
IPI Effect
+R$11.5

250.5291.6
240.9
384.3 410.6
308.3 296.5
101.9 102.9
2010 2011 2012 2013 2014 9M14 9M15 3Q14 3Q15
49
Consolidated net incomeR$ million
* Pro forma 2012 net income excluding additional depreciation related to the IPI tax reduction, net of income tax.
336.3 *
The 3Q15 consolidated net income grew 1.0%

50
Free cash flow - FCFFree cash flow - R$ million 2010 2011 2012 2013 2014 9M15
Ope
ratio
nsEBITDA 649.5 821.3 875.6 916.5 969.8 706.7
Used car sale revenue, net from taxes (1,321.9) (1,468.1) (1,520.0) (1,747.3) (2,018.2) (1,545.7)
Depreciated cost of cars sold 1,203.2 1,328.6 1,360.2 1,543.8 1,777.0 1,322.5
(-) Income tax and social contribution (57.8) (83.0) (100.9) (108.5) (113.1) (72.5)
Change in working capital 54.5 (83.9) 37.1 2.9 (27.1) (53.7)
Cash provided by rental operations 527.5 514.9 652.0 607.4 588.4 357.3
Cap
ex -
Ren
ewal
s
Used car sale revenue, net from taxes 1,321.9 1,468.1 1,520.0 1,747.3 2,018.2 1,329.7
Fleet renewal investment (1,370.1) (1,504.5) (1,563.3) (1,819.7) (2,197.7) (1,440.7)
Net investment for fleet renewal (48.2) (36.4) (43.3) (72.4) (179.5) (111.0)
Fleet renewal – quantity 47,285 50,772 56,644 62,641 70,621 42,372
Investment, other property and intangibles investments (50.6) (59.9) (77.8) (47.5) (46.3) (18.1)
Free cash flow before growth, new headquarters and interest 428.7 418.6 530.9 487.5 362.6 228.2
Cap
ex -
Gro
wth
Fleet growth investment (540.3) (272.0) (55.5) (209.4) (286.8) -
Cash generated by fleet reduction - - - - - 216.0
Change in accounts payable to car suppliers 111.3 32.7 (116.9) 89.7 334.4 (257.6)
Fleet growth (429.0) (239.3) (172.4) (119.7) 47.6 (41.6)
Fleet increase / (reduction) – quantity 18,649 9,178 2,011 7,103 9,183 (6,886)
Free cash flow after growth, and before interest and new HQ (0.3) 179.3 358.5 367.8 410.2 186.6
Cap
ex–
HQ
Investment in the construction of the new HQ (0.5) (3.1) (2.4) (6.5) (55.7) (86.2)
Marketable securities – new HQ - - - - (92.6) 92.6
New headquarters construction (0.5) (3.1) (2.4) (6.5) (148.3) 6.4
Free cash flow before interest (0.8) 176.2 356.1 361.3 261.9 193.0

51
- 1,425.7
(146.5)Interest
Net debt09/30/2015
Cash generation beforeinterest193.0
-1,322.3
Net debt12/31/2014
(109.8)Dividends
Changes in net debt R$ million
The increase in net debt is due to dividends payment and share repurchases
(27.5)Treasuryshares
purchased
(12.6)Mark tomarket -
MTM

2,446.7 2,681.7 2,547.6
2,797.9 3,296.3 3,285.2
2010 2011 2012 2013 2014 9M15
52
Debt - ratiosNet debt + OEMs vs. Fleet value
BALANCE AT THE END OF PERIOD 2010(*) 2011 2012 2013 2014 9M15
Net debt + OEMs / Fleet value 68% 66% 60% 61% 62% 57%
Net debt / Fleet value 52% 51% 48% 48% 40% 43%
Net debt / EBITDA** 2.0x 1.7x 1.4x 1.5x 1.4x 1.5x
Net debt / Equity 1.4x 1.2x 0.9x 1.0x 0.8x 0.8xEBITDA / Net financial expenses 5.0x 4.6x 6.3x 8.3x 6.4x 4.4x
(*) 2010 ratios based on USGAAP financial statements**Annualized
OEMs Net debt Fleet value
Comfortable debt ratios
1,281.1 1,363.4 1,231.2 1,332.8 1,322.3 1,425.7 372.6 405.3 288.4 378.1 712.5 454.9
1,653.7 1,768.7 1,519.6 1,710.9 2,034.8 1,880.6

66.2 318.8 394.0
221.1
594.5 595.0 447.5
2015 2016 2017 2018 2019 2020 2021
53
Debt maturity profile (principal)R$ million
Strong cash position and comfortable debt profile
Cash
1,000.1
As of September 30, 2015
1,287.2

54
Localiza Level I ADR
Ticker Symbol: LZRFY CUSIP: 53956W300ISIN: US53956W3007Ratio: 1 Common Share : 1 ADRExchange: OTCDepositary bank: Deutsche Bank Trust Company AmericasADR broker helpline: +1 212 250 9100 (New York)
+44 207 547 6500 (London) E-mail: [email protected] website: www.adr.db.comDepositary bank’s local custodian: Banco Bradesco S/A, Brazil

55
Disclaimer
Website: www.localiza.com/ir E-mail: [email protected] Phone: 55 31 3247-7024
Roberto MendesCFO and IR
Nora LanariHead of IR
Eugênio MattarCEO
The material presented is a presentation of general background information about LOCALIZA as of the date of the presentation. It is information in summaryform and does not purport to be complete. It is not intended to be relied upon as advice to potential investors. No representation or warranty, express orimplied, is made concerning, and no reliance should be placed on, the accuracy, fairness, or completeness of the information presented herein.
This presentation contains statements that are forward-looking within the meaning of Section 27A of the Securities Act of 1933 and Section 21E of theSecurities Exchange Act of 1934. Such forward-looking statements are only projections and are not guarantees of future performance. Investors are cautionedthat any such forward-looking statements are and will be, as the case may be, subject to many risks, uncertainties and factors relating to the operations andbusiness environments of LOCALIZA and its subsidiaries that may cause the actual results of the companies to be materially different from any future resultsexpressed or implied in such forward-looking statements.
Although LOCALIZA believes that the expectations and assumptions reflected in the forward-looking statements are reasonable based on informationcurrently available to LOCALIZA’s management, LOCALIZA cannot guarantee future results or events. LOCALIZA expressly disclaims a duty to update any ofthe forward-looking statement.
Securities may not be offered or sold in the United States unless they are registered or exempt from registration under the Securities Act of 1933.
This presentation does not constitute an offer, invitation or solicitation of an offer to subscribe to or purchase any securities. Neither this presentation nor anythingcontained herein shall form the basis of any contract or commitment whatsoever.
Maria Carolina CostaIR Manager
Mariana CampolinaIR Manager