institutional effectiveness report card
TRANSCRIPT

Office of Institutional Effectiveness and AnalyticsJuly 12, 2018
Institutional Effectiveness Report CardSummer 2018
1 = Data indicated are from the academic year, 2 = Data indicated are from the calendar year
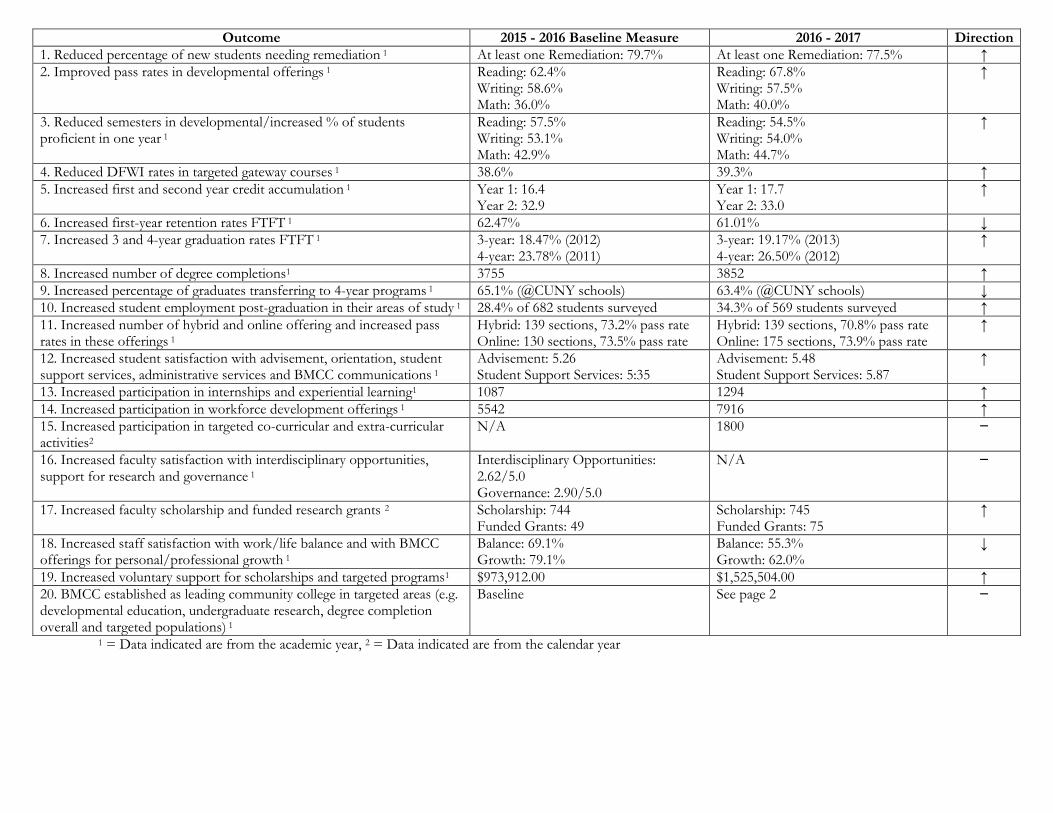
Outcome 2015 - 2016 Baseline Measure 2016 - 2017 Direction
1. Reduced percentage of new students needing remediation 1 At least one Remediation: 79.7% At least one Remediation: 77.5% ↑
2. Improved pass rates in developmental offerings 1 Reading: 62.4% Writing: 58.6% Math: 36.0%
Reading: 67.8% Writing: 57.5% Math: 40.0%
↑
3. Reduced semesters in developmental/increased % of students proficient in one year 1
Reading: 57.5% Writing: 53.1% Math: 42.9%
Reading: 54.5% Writing: 54.0% Math: 44.7%
↑
4. Reduced DFWI rates in targeted gateway courses 1 38.6% 39.3% ↑
5. Increased first and second year credit accumulation 1 Year 1: 16.4 Year 2: 32.9
Year 1: 17.7 Year 2: 33.0
↑
6. Increased first-year retention rates FTFT 1 62.47% 61.01% ↓
7. Increased 3 and 4-year graduation rates FTFT 1 3-year: 18.47% (2012) 4-year: 23.78% (2011)
3-year: 19.17% (2013) 4-year: 26.50% (2012)
↑
8. Increased number of degree completions1 3755 3852 ↑
9. Increased percentage of graduates transferring to 4-year programs 1 65.1% (@CUNY schools) 63.4% (@CUNY schools) ↓
10. Increased student employment post-graduation in their areas of study 1 28.4% of 682 students surveyed 34.3% of 569 students surveyed ↑
11. Increased number of hybrid and online offering and increased pass rates in these offerings 1
Hybrid: 139 sections, 73.2% pass rate Online: 130 sections, 73.5% pass rate
Hybrid: 139 sections, 70.8% pass rate Online: 175 sections, 73.9% pass rate
↑
12. Increased student satisfaction with advisement, orientation, student support services, administrative services and BMCC communications 1
Advisement: 5.26 Student Support Services: 5:35
Advisement: 5.48 Student Support Services: 5.87
↑
13. Increased participation in internships and experiential learning1 1087 1294 ↑
14. Increased participation in workforce development offerings 1 5542 7916 ↑
15. Increased participation in targeted co-curricular and extra-curricular activities2
N/A 1800 −
16. Increased faculty satisfaction with interdisciplinary opportunities, support for research and governance 1
Interdisciplinary Opportunities: 2.62/5.0 Governance: 2.90/5.0
N/A −
17. Increased faculty scholarship and funded research grants 2 Scholarship: 744 Funded Grants: 49
Scholarship: 745 Funded Grants: 75
↑
18. Increased staff satisfaction with work/life balance and with BMCC offerings for personal/professional growth 1
Balance: 69.1% Growth: 79.1%
Balance: 55.3% Growth: 62.0%
↓
19. Increased voluntary support for scholarships and targeted programs1 $973,912.00 $1,525,504.00 ↑
20. BMCC established as leading community college in targeted areas (e.g. developmental education, undergraduate research, degree completion overall and targeted populations) 1
Baseline See page 2 −

20. BMCC established as leading community college in targeted areas (e.g. developmental education, undergraduate research, degree completion overall
and targeted populations) 1
Community College Week:
4th among 2-year colleges in number of Associate Degrees in Business, Management, Marketing and Related Support Services
5th among 2-year colleges in number of Associate Degrees in Education
5th among 2-year colleges awarding Associate Degrees in All Disciplines – Minority
3rd among 2-year colleges awarding Associate Degrees in All Disciplines – African American
3rd among 2-year colleges in number of Associate Degrees in Communication Technologies/Technicians & Support Services
3rd among 2-year colleges in number of Associate Degrees in Computer and Information Sciences & Support Services
2nd among 2-year colleges in number of Associate Degrees in Criminal Justice and Corrections
2nd among 2-year colleges in number of Associate Degrees in Homeland Security, Law Enforcement, Firefighting and Related Protective
Services