institutional presentation 1q16
TRANSCRIPT

1
R 000
G 070
B 145
R 235
G 000
B 040
R 000
G 081
B 135
R 000
G 110
B 184
R 000
G 156
B 222
R 244
G 209
B 000
R 243
G 150
B 016
R 231
G 055
B 140
R 220
G 104
B 075
R 158
G 004
B 073
R 197
G 189
B 193
R 116
G 175
B 039
R 000
G 000
B 000
Institutional Presentation
TIM Participações
TIM Brasil Institutional Presentation
1st QTR 2016

2
R 000
G 070
B 145
R 235
G 000
B 040
R 000
G 081
B 135
R 000
G 110
B 184
R 000
G 156
B 222
R 244
G 209
B 000
R 243
G 150
B 016
R 231
G 055
B 140
R 220
G 104
B 075
R 158
G 004
B 073
R 197
G 189
B 193
R 116
G 175
B 039
R 000
G 000
B 000
Institutional Presentation
TIM Participações
Telecom Landscape 4
TIM Brasil 9
TIM’s Strategy 14
Portfolio 19
Quality & Network Evolution 23
Regulatory Update 28
Financial Data 30
Perspectives 34
Agenda
*Click on the page number to access the section

3
R 000
G 070
B 145
R 235
G 000
B 040
R 000
G 081
B 135
R 000
G 110
B 184
R 000
G 156
B 222
R 244
G 209
B 000
R 243
G 150
B 016
R 231
G 055
B 140
R 220
G 104
B 075
R 158
G 004
B 073
R 197
G 189
B 193
R 116
G 175
B 039
R 000
G 000
B 000
Institutional Presentation
TIM Participações
Telecom Landscape

4
R 000
G 070
B 145
R 235
G 000
B 040
R 000
G 081
B 135
R 000
G 110
B 184
R 000
G 156
B 222
R 244
G 209
B 000
R 243
G 150
B 016
R 231
G 055
B 140
R 220
G 104
B 075
R 158
G 004
B 073
R 197
G 189
B 193
R 116
G 175
B 039
R 000
G 000
B 000
Institutional Presentation
TIM Participações
ARPU Ranking
(US$)
Service Revenues Ranking
Mobile Penetration Ranking Customer Base Ranking
(Mln lines)
49
43
38
37
34
5
182
139
53
24
23
18
1.305
700
356
276
259
Telecom Landscape
Source: Merrill Lynch - Global Wireless Matrix 4Q15 (3Q15 data) | Top 5 + Brazil
Brazilian market is reaching maturity but there is still room for user profitability and the main opportunity is in data
4th (= vs. 3Q15)
17th (-2 vs. 3Q15)
39th (= vs. 3Q15) 9th (-2 vs. 3Q15)
182%
177%
172%
171%
164%
138%
(%)
(US$ bln)
China
India
USA
Brazil
Indonesia
Finland
Arab. Emir.
Russia
Hong Kong
Portugal
Brazil
USA
China
Japan
UK
India
Brazil
Canada
USA
Switzerland
Norway
Qatar
Brazil

5
R 000 G 070 B 145
R 235 G 000 B 040
R 000 G 081 B 135
R 000 G 110 B 184
R 000 G 156 B 222
R 244 G 209 B 000
R 243 G 150 B 016
R 231 G 055 B 140
R 220 G 104 B 075
R 158 G 004 B 073
R 197 G 189 B 193
R 116 G 175 B 039
R 000 G 000 B 000
Institutional Presentation
TIM Participações 5
Brazil 2016-18: meeting the challenges
1.8% 2.7%
0.1%
-3.5% -3.8%
0.0%
1.7%
2012 2013 2014 2015E 2016E 2017E 2018E
5.8% 5.9% 6.4%
10.7%
7.0% 5.4% 5.0%
2012 2013 2014 2015 2016E 2017E 2018E
2.04 2.34 2.66
3.90 4.25 4.30 4.31
2012 2013 2014 2015 2016E 2017E 2018E
Source: latest IMF estimates for GDP; Internal Estimates for Exchange Rates forecast, Inflation, MTR Value, SIM/user and market revenues trend
Protecting results in a tougher Macroeconomic Scenario…
…and adapting fast to capture opportunities in a reshaped industry context
0.34 0.30
0.23 0.16
0.10 0.06 0.03 0.02
2012 2013 2014 2015 2016 2017 2018 2019
1.65 1.72
1.81 1.89
2.03 2.00 1.96 1.94
2007 2008 2009 2010 2011 2012 2013 2014 2015 2016 2017 2018
Real GDP Growth (% YoY)
Inflation Rate (% YoY)
Exchange Rate (R$/USD)
MTR Glide Path (R$/min)
SIM / Unique User
Mobile Market Revenues (R$ bln)
2.7 10.5 23.0
39.7 33.8
45.7
36.5
25.1
36.5
50.8 61.7
64.8
2007 2011 2015e 2018e
Voice
Data
6 Institutional Presentation
TIM Participações
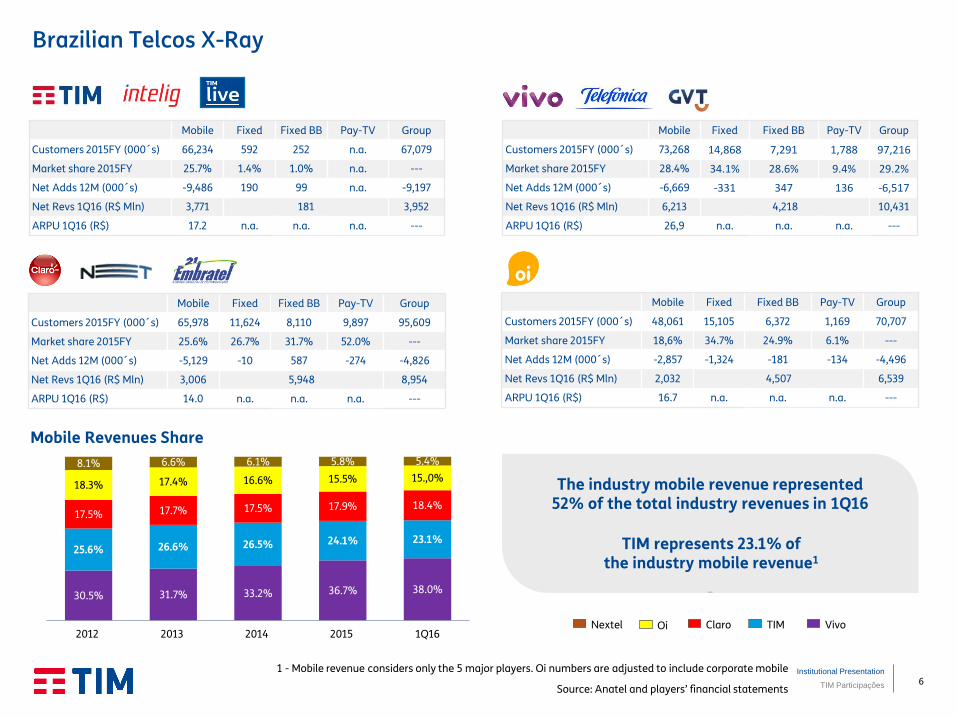
The industry mobile revenue represented 52% of the total industry revenues in 1Q16
Mobile Fixed Fixed BB Pay-TV Group
Customers 2015FY (000´s) 66,234 592 252 n.a. 67,079
Market share 2015FY 25.7% 1.4% 1.0% n.a. ---
Net Adds 12M (000´s) -9,486 190 99 n.a. -9,197
Net Revs 1Q16 (R$ Mln) 3,771 181 3,952
ARPU 1Q16 (R$) 17.2 n.a. n.a. n.a. ---
Mobile Fixed Fixed BB Pay-TV Group
Customers 2015FY (000´s) 73,268 14,868 7,291 1,788 97,216
Market share 2015FY 28.4% 34.1% 28.6% 9.4% 29.2%
Net Adds 12M (000´s) -6,669 -331 347 136 -6,517
Net Revs 1Q16 (R$ Mln) 6,213 4,218 10,431
ARPU 1Q16 (R$) 26,9 n.a. n.a. n.a. ---
Mobile Fixed Fixed BB Pay-TV Group
Customers 2015FY (000´s) 65,978 11,624 8,110 9,897 95,609
Market share 2015FY 25.6% 26.7% 31.7% 52.0% ---
Net Adds 12M (000´s) -5,129 -10 587 -274 -4,826
Net Revs 1Q16 (R$ Mln) 3,006 5,948 8,954
ARPU 1Q16 (R$) 14.0 n.a. n.a. n.a. ---
Mobile Fixed Fixed BB Pay-TV Group
Customers 2015FY (000´s) 48,061 15,105 6,372 1,169 70,707
Market share 2015FY 18,6% 34.7% 24.9% 6.1% ---
Net Adds 12M (000´s) -2,857 -1,324 -181 -134 -4,496
Net Revs 1Q16 (R$ Mln) 2,032 4,507 6,539
ARPU 1Q16 (R$) 16.7 n.a. n.a. n.a. ---
TIM represents 23.1% of the industry mobile revenue1
1 - Mobile revenue considers only the 5 major players. Oi numbers are adjusted to include corporate mobile
Source: Anatel and players’ financial statements
Mobile Revenues Share
Nextel Oi Claro TIM Vivo
Brazilian Telcos X-Ray
30.5% 31.7% 33.2% 36.7% 38.0%
25.6% 26.6% 26.5% 24.1% 23.1%
17.5% 17.7% 17.5% 17.9% 18.4%
18.3% 17.4% 16.6% 15.5% 15.,0%
8.1% 6.6% 6.1% 5.8% 5.4%
2012 2013 2014 2015 1Q16

7
R 000
G 070
B 145
R 235
G 000
B 040
R 000
G 081
B 135
R 000
G 110
B 184
R 000
G 156
B 222
R 244
G 209
B 000
R 243
G 150
B 016
R 231
G 055
B 140
R 220
G 104
B 075
R 158
G 004
B 073
R 197
G 189
B 193
R 116
G 175
B 039
R 000
G 000
B 000
Institutional Presentation
TIM Participações
A5: PR/SC
* Population 18.1 Mln
* Mobile base 22.9 Mln
* Penetration 126.5%
* TIM’s Market Share 52.4%
A6: RS
* Population 11.3 Mln
* Mobile base 14.8 Mln
* Penetration 131.5%
* TIM’s Market Share 12.4%
Mobile market: Regional overview
Penetration per Estate
(Mar/16)
A1 e A2 A3
A4
A5
A6
A7
A8
A9
A10
Source: Anatel, IBGE
A1 e A2: SP
* Population 44.7 Mln
* Mobile base 64.5 Mln
* Penetration 144.3%
* TIM’s Market Share 26.1%
A3: RJ/ES
* Population 20.6 Mln
* Mobile base 27.0 Mln
* Penetration 131.4%
* TIM’s Market Share 14.1%
A4: MG
* Population 21.0 Mln
* Mobile base 24.6 Mln
* Penetration 117.5%
* TIM’s Market Share 24.8%
A7: CO
* Population 19.7 Mln
* Mobile base 26.6 Mln
* Penetration 135.1%
* TIM’s Market Share 15.1%
A8: NO
* Population 20.4 Mln
* Mobile base 19.2 Mln
* Penetration 93.8%
* TIM’s Market Share 30.1%
A9: BA/SE
* Population 17.5 Mln
* Mobile base 19.1 Mln
* Penetration 108.9%
* TIM’s Market Share 20.9%
A10: NE
* Population 32.4 Mln
* Mobile base 39.1 Mln
* Penetration 120.9%
* TIM’s Market Share 33.0%
64.5 24.6 23.0 16.8 14.8 14.3 11.8 10.8 8.2
8.0 8.5 6.2
.,1
4.7
4.0
4.2 4.2 3.7 3.4 3.9 3.7 2.3
2.2 1.9 0.8 0.7 0.5
144%
118%
139%
110%
131% 128% 126% 121%
99%
120% 124%
209%
88% 117% 101% 127% 121%
92%
127% 122% 111% 101%
121% 123% 99%
95% 93%
SP MG RJ BA RS PR PE CE PA GO SC DF MA PB ES MT RN AM MS PI AL SE RO TO AC AP RR
Base Móvel (MM) Penetração (base/pop)
TIM: Market share leader
TIM: 2nd position in market share
Mobile base (mln)
Penetration (base/pop)

8
R 000
G 070
B 145
R 235
G 000
B 040
R 000
G 081
B 135
R 000
G 110
B 184
R 000
G 156
B 222
R 244
G 209
B 000
R 243
G 150
B 016
R 231
G 055
B 140
R 220
G 104
B 075
R 158
G 004
B 073
R 197
G 189
B 193
R 116
G 175
B 039
R 000
G 000
B 000
Institutional Presentation
TIM Participações
TIM Brasil

9
R 000
G 070
B 145
R 235
G 000
B 040
R 000
G 081
B 135
R 000
G 110
B 184
R 000
G 156
B 222
R 244
G 209
B 000
R 243
G 150
B 016
R 231
G 055
B 140
R 220
G 104
B 075
R 158
G 004
B 073
R 197
G 189
B 193
R 116
G 175
B 039
R 000
G 000
B 000
Institutional Presentation
TIM Participações
A solid history of growth
TIM’s Position
1998 2003 2009 2016
Purpose
To connect and take care of every customer, so everyone can do more
Care about the costumer
Transparency
Commitment
Innovation
Agility
Values
New Position & New Brand Shareholders’ Structure
TIM Celular S.A. Intelig
TIM Brasil Serv. e Part. S.A. Free Float
Telecom Italia
100%
TIM Participações S.A.
ON: 33% (808,249,935) ON: 67% (1,611,969,946)
100% 100%

10
R 000
G 070
B 145
R 235
G 000
B 040
R 000
G 081
B 135
R 000
G 110
B 184
R 000
G 156
B 222
R 244
G 209
B 000
R 243
G 150
B 016
R 231
G 055
B 140
R 220
G 104
B 075
R 158
G 004
B 073
R 197
G 189
B 193
R 116
G 175
B 039
R 000
G 000
B 000
Institutional Presentation
TIM Participações
Knowing TIM better
67 million customers (26% of share)
183 own stores
15 Customer Care Centers
~12 thousand employees
Presence in Brazil since 1998
18th largest Private Company in Brazil (Exame Magazine - 2015)
Approximately R$16 billion of Market Capitalization
15,000 km fiber optical backbone
5,500 km fiber optical backhauling
Growth via Acquisiton
2nd Player Market & Revenue
Share
95% of urban pop. coverage
(3,460 cities)
Leader in 4G coverage
(439 cities)
>9 million 4G users
5%
27% 29% 35%
45% 48%
2010 2011 2012 2013 2014 2015
4.2 4.7
5.1 5.2 5.5 5.4
2010 2011 2012 2013 2014 2015
20.3
24.8 27.8
29.7 29.0 25.8
2010 2011 2012 2013 2014 2015
Gross Revenues (R$ bln)
Data Penetration (over customer base)
EBITDA (R$ bln)
CAGR+5% CAGR
+5%

11
R 000 G 070 B 145
R 235 G 000 B 040
R 000 G 081 B 135
R 000 G 110 B 184
R 000 G 156 B 222
R 244 G 209 B 000
R 243 G 150 B 016
R 231 G 055 B 140
R 220 G 104 B 075
R 158 G 004 B 073
R 197 G 189 B 193
R 116 G 175 B 039
R 000 G 000 B 000
Institutional Presentation
TIM Participações
Statutory Audit Committee:
• Report to Board of Directors
• Oversight Financial reporting
• Analyze anonymous complaints
Compensation Board and Internal Control and Risk Board
operate indefinitely and act independently
Whistleblower channel website: www.tim.com.br/canal-
denuncia
Brazilian Law “Lei das S.A”
Legal Requirements
Demand for transparency
and disclosures
Highest level of Corporate
Governance Requirement of protection for
minority shareholders
Unique Telco company listed on the Novo Mercado
Committees to Reinforce and Guarantee Solid Corporate Governance
10 members (3 independents)
3 members (1 independent)
3 members (3 independents)
3 members
5 members (2 independents)
8 members
Equal rights: vote, dividends and tag along
Higher liquidity
• Single class of share (ordinary shares)
Greater independence of Board of Directors (at least 30%)
Strict disclosure policy
Corporate Governance

12
R 000
G 070
B 145
R 235
G 000
B 040
R 000
G 081
B 135
R 000
G 110
B 184
R 000
G 156
B 222
R 244
G 209
B 000
R 243
G 150
B 016
R 231
G 055
B 140
R 220
G 104
B 075
R 158
G 004
B 073
R 197
G 189
B 193
R 116
G 175
B 039
R 000
G 000
B 000
Institutional Presentation
TIM Participações
Corporate Social Responsibility
Founded in July, 2013
MISSION: We are committed to creating and strengthening resources and strategies for the
democratization of science and innovation that promote human development in Brazil, with mobile
technology as one of the main facilitators.
Joined UN Global Compact in 2008
Member of ISE (Sustainability Index) for
8 consecutive years
Member of ICO2 (Efficient Carbon Index) for 6 consecutive years
ISO 14001 certified since 2010, 1st Brazilian
telco Sustainability
TIM Stands out in Sustainability
In public schools
185,000 children and 6,300 professors
In museums and science and technology centers
More than 70,000 people
R$2.5 million in funding
In public administration
Participatory Urban Caretaker
o 4 municipalities
Cultural maps
o 7 municipalities and RS & CE government
In the federal institutions of professional and technological education
TIM Tec
o MOOC platform
Partnership with 5 federal institutes
Commitment with the 2014-16 Social Investment Plan: R$45 million
13
R 000
G 070
B 145
R 235
G 000
B 040
R 000
G 081
B 135
R 000
G 110
B 184
R 000
G 156
B 222
R 244
G 209
B 000
R 243
G 150
B 016
R 231
G 055
B 140
R 220
G 104
B 075
R 158
G 004
B 073
R 197
G 189
B 193
R 116
G 175
B 039
R 000
G 000
B 000
Institutional Presentation
TIM Participações
TIM’s Strategy

14
R 000 G 070 B 145
R 235 G 000 B 040
R 000 G 081 B 135
R 000 G 110 B 184
R 000 G 156 B 222
R 244 G 209 B 000
R 243 G 150 B 016
R 231 G 055 B 140
R 220 G 104 B 075
R 158 G 004 B 073
R 197 G 189 B 193
R 116 G 175 B 039
R 000 G 000 B 000
Institutional Presentation
TIM Participações 14
Strategic Guidelines
Telecom industry transformation from Voice to Data
Market maturity and user behavior change impacting Customer Base and Positioning
Challenging Macroeconomic Scenario
Infrastructure requirements evolving with Data and 4G
Context Changes Key Strategic Priorities
Reset positioning: Network Quality / Offer Innovation / Customer Experience
Protect value of Prepaid base: From Market Share to Revenue Share
Increase share of Mid/High Value customers: focus on higher value
Stabilize Corporate Business: accelerate Top /Enterprise and turnaround SMB
Sustain Network Investment with prioritized approach and focus on 4G
Focus on Efficiency: as a structural element
I
II
III
IV
V
VI

15
R 000 G 070 B 145
R 235 G 000 B 040
R 000 G 081 B 135
R 000 G 110 B 184
R 000 G 156 B 222
R 244 G 209 B 000
R 243 G 150 B 016
R 231 G 055 B 140
R 220 G 104 B 075
R 158 G 004 B 073
R 197 G 189 B 193
R 116 G 175 B 039
R 000 G 000 B 000
Institutional Presentation
TIM Participações
98
210
07 08 09 10 11 12 13 14 15e 16e 17e 18e
0.41 0.42 0.42 0.42 0.42 0.36 0.32 0.24
0.16 0.10 0.06 0.03 0.02
07 08 09 10 11 12 13 14 15e 16e 17e 18e 19e
64
602
14 15e 16e 17e 18e 19e
Community Era
MTR
Stabilization Market
conditions require a new
STRATEGY
Multiple SIM cycle
Prepaid segment to follow SIM
card cycle
Data traffic booming
Data overcoming voice
revenues by 2016
Expansion Consolidation
07 08 09 10 11 12 13 14 15 16e 17e 18e 11 12 13 14 15e 16e 17e
Brazil Mobile Traffic (PB)
Mln customers
82 min
07 08 09 10 11 12 13 14 15e 16e
Voice slowdown
Avg Market MOU(min)
Source: Internal estimates and BofA ML Global Matrix
< 117 min
Data Era
R$
Reality Check: Transition Phase
Transition
Industry Evolution Path

16
R 000 G 070 B 145
R 235 G 000 B 040
R 000 G 081 B 135
R 000 G 110 B 184
R 000 G 156 B 222
R 244 G 209 B 000
R 243 G 150 B 016
R 231 G 055 B 140
R 220 G 104 B 075
R 158 G 004 B 073
R 197 G 189 B 193
R 116 G 175 B 039
R 000 G 000 B 000
Institutional Presentation
TIM Participações
o Volume Driven (market share)
o Base of Pyramid
o Offer Based on Community
o Handset leadership (focus on volume)
o Mass Channels
o Mobile + B2C
o Value Driven (value share)
o Big Middle of Pyramid + Value Clients
o Bundle of Voice + Data + Off-net
o Handset Support (focus on value)
o Value Channels
o Mobile + B2C + B2B + selective convergence
15 16 17 18 19
OLD go2market
NEW go2market
Commercial Strategy Evolution
Recurring billing
Protection of data value
Customer spending
concentration
Voice + data bundles
On-net + off-net voice
NEW PORTFOLIO
MODEL

17
R 000 G 070 B 145
R 235 G 000 B 040
R 000 G 081 B 135
R 000 G 110 B 184
R 000 G 156 B 222
R 244 G 209 B 000
R 243 G 150 B 016
R 231 G 055 B 140
R 220 G 104 B 075
R 158 G 004 B 073
R 197 G 189 B 193
R 116 G 175 B 039
R 000 G 000 B 000
Institutional Presentation
TIM Participações
Fast reaction in multiple fronts, positioned for recovery path
Keep investment focus
+394 new cities with 4G vs. 1Q15
4G leadership position
Increasing customer base value
Off-net to all plans & focus on
mobile bundle
Defending results from tax impact
Actions to offset
ICMS increase
Workforce Restructuring program
Adapting to market reality
Company repositioning
New brand launch: quality,
innovation, customer experience
~10% of customer base in the new
portfolio
Price repositioning to
compensate tax
Rightsizing workforce
On track with Efficiency Plan
> R$ 1 bln in efficiency (2015-17)
~40% of program achieved in 1Q16
New phase launched in 2Q16
Infrastructure Offer Portfolio Efficiency Actions Positioning

18
R 000
G 070
B 145
R 235
G 000
B 040
R 000
G 081
B 135
R 000
G 110
B 184
R 000
G 156
B 222
R 244
G 209
B 000
R 243
G 150
B 016
R 231
G 055
B 140
R 220
G 104
B 075
R 158
G 004
B 073
R 197
G 189
B 193
R 116
G 175
B 039
R 000
G 000
B 000
Institutional Presentation
TIM Participações
Portfolio

19
R 000 G 070 B 145
R 235 G 000 B 040
R 000 G 081 B 135
R 000 G 110 B 184
R 000 G 156 B 222
R 244 G 209 B 000
R 243 G 150 B 016
R 231 G 055 B 140
R 220 G 104 B 075
R 158 G 004 B 073
R 197 G 189 B 193
R 116 G 175 B 039
R 000 G 000 B 000
Institutional Presentation
TIM Participações
28% market share
Data reaccelerating, driven by 4G
Fast growing on 4G
Changing
revenue profile
Data penetration increase Traffic acceleration
(BOU: bytes of use per data customers) (million users)
4G penetration
3G penetration
Innovative Revenues
(R$ bln; YoY growth) (R$; YoY growth)
Source: Anatel
340
502
1Q15 2Q15 3Q15 4Q15 1Q16
26% 48% YoY Growth
(3G & 4G user over customer base)
Source: Anatel
Data ARPU
1.0
1.3
1Q15 1Q16
5.7
7.4
1Q15 1Q16
68% +13pp YoY
Smartphone
penetration
+29% +26%
3.0
9.2
1Q15 2Q15 3Q15 4Q15 1Q16
~55%
~14%
1Q15 1Q16

20
R 000 G 070 B 145
R 235 G 000 B 040
R 000 G 081 B 135
R 000 G 110 B 184
R 000 G 156 B 222
R 244 G 209 B 000
R 243 G 150 B 016
R 231 G 055 B 140
R 220 G 104 B 075
R 158 G 004 B 073
R 197 G 189 B 193
R 116 G 175 B 039
R 000 G 000 B 000
Institutional Presentation
TIM Participações
POSTPAID PREPAID
Portfolio evolution: a better experience leading to higher ARPU
TIM PRÉ 150 R$7/week recurring
150MB + 100min off-net + SMS
TIM PRÉ 500 R$10/week
recurring 500MB + 100min off
+ Deezer
TIM PRÉ Classic R$8/week
recurring 250MB + unlimited
on-net + SMS
TIM PRÉ 1GB R$35/month
recurring 1GB + 400 min off-
net + SMS
CONTROLE
TIM CONTROLE R$50/month
1.5GB + 500min off-net + WhatsApp
TIM PÓS R$139/month
5GB + 1,000min off-net + WhatsApp
Recurrence as base of all
propositions
VALUE BASE
Offer segmentation to
improve convenience
Better customer experience
for higher ARPU
New Portfolio Evolution
TIM PRÉ 300 R$10/week recurring 300MB + 100min off-
net + SMS
TIM PRÉ 150 R$7/week
recurring 150MB + 100min off-
net + SMS
TIM CONTROLE R$50/month
1GB + 500min off-net + WhatsApp
TIM PÓS R$99/month
2GB + 1,000min off-net + WhatsApp
New Portfolio
at launch
Upselling to improve
profitability

21
R 000 G 070 B 145
R 235 G 000 B 040
R 000 G 081 B 135
R 000 G 110 B 184
R 000 G 156 B 222
R 244 G 209 B 000
R 243 G 150 B 016
R 231 G 055 B 140
R 220 G 104 B 075
R 158 G 004 B 073
R 197 G 189 B 193
R 116 G 175 B 039
R 000 G 000 B 000
Institutional Presentation
TIM Participações
Base New OfferBase New Offer
New portfolio presenting positive results
Mobile number portability update
Improving Quality of Revenues…
ARPU improvement
in all segments 10% of total
base in the new offer
% of new offers over gross adds
Prepaid ARPU Postpaid ARPU
(postpaid users)
(R$) (R$)
17%
20%
1Q15 1Q16
Postpaid mix
63%
65%
nov/dec-15 1Q16
(postpaid and control users)

22
R 000
G 070
B 145
R 235
G 000
B 040
R 000
G 081
B 135
R 000
G 110
B 184
R 000
G 156
B 222
R 244
G 209
B 000
R 243
G 150
B 016
R 231
G 055
B 140
R 220
G 104
B 075
R 158
G 004
B 073
R 197
G 189
B 193
R 116
G 175
B 039
R 000
G 000
B 000
Institutional Presentation
TIM Participações
Quality & Network Evolution

23
R 000 G 070 B 145
R 235 G 000 B 040
R 000 G 081 B 135
R 000 G 110 B 184
R 000 G 156 B 222
R 244 G 209 B 000
R 243 G 150 B 016
R 231 G 055 B 140
R 220 G 104 B 075
R 158 G 004 B 073
R 197 G 189 B 193
R 116 G 175 B 039
R 000 G 000 B 000
Institutional Presentation
TIM Participações
63
439
1,414 1,860
1Q15 1Q16
Infrastructure deployment towards data continues unabated
Coverage
Capacity
Quality
82% of urban
population with 3G
and 60% with 4G
#1 in 4G coverage
89% of total sites
within our own
infrastructure
Continuously
improving network
quality
Sites
Connected
with Fiber
Cities Sites (000)
194 Cities with MBB Project
94%
97%
95%
Feb-15 May-15 Aug-15 Nov-15 Feb-16
90% 97%
80%
Feb-15 May-15 Aug-15 Nov-15 Feb-16
Mobile
Broadband
Instant
Speed1
Mobile
Broadband
Average
Speed2
1 SMP10: Measures connection speed at any given time
above Anatel’s target. Minimum required of 95% of
measurements above target.
2 SMP11: Average connection speed registered within
the month. Required to provide at least 80% of the
contracted speed.
Anatel’s target
+32%
~3,800 ~4,800
1Q15 1Q16
+26%
10.7
12.5
1Q15 1Q16
4G
3G +17%
4G
3G
7x 4.0
8.0 2x

24
R 000 G 070 B 145
R 235 G 000 B 040
R 000 G 081 B 135
R 000 G 110 B 184
R 000 G 156 B 222
R 244 G 209 B 000
R 243 G 150 B 016
R 231 G 055 B 140
R 220 G 104 B 075
R 158 G 004 B 073
R 197 G 189 B 193
R 116 G 175 B 039
R 000 G 000 B 000
Institutional Presentation
TIM Participações 24
Capex Cycle: Accelerating 3G and 4G Data Coverage
3.9
4.7
2014 2015 2016e 2017e 2018e
After the 2015-16 cycle, Capex intensity* to gradually decline
4G coverage to overtake 3G
*Excluding Spectrum
• Fast transition from 3G to 4G: better quality and more efficient
• FTTS to support 4G reaching >80% of total traffic
Urban Population Covered
Capex per Technology
>14 bln
<14 bln
2014
2015
2016e
2017e
2018e
4G 3G 2G
• Leadership in 4G Coverage and match 3G coverage in 2 years
• Competitive 3G coverage in all states
• Refarming of 1.8 GHz as a short-term competitive advantage
Number of Sites (000)
36%
59%
79% 82%
~90%
2014 2015 2016e 2017e 2018e
4G
3G
Capex Plan (R$)
4G
Total Sites 12.5
13.3
15.0 16.4
17.7 19.5
2013 2014 2015 2016e 2017e 2018e
Other
Capex/Sales 20% 27%

25
R 000
G 070
B 145
R 235
G 000
B 040
R 000
G 081
B 135
R 000
G 110
B 184
R 000
G 156
B 222
R 244
G 209
B 000
R 243
G 150
B 016
R 231
G 055
B 140
R 220
G 104
B 075
R 158
G 004
B 073
R 197
G 189
B 193
R 116
G 175
B 039
R 000
G 000
B 000
Institutional Presentation
TIM Participações
Transforming the fixed infrastructure
SP
RJ
National fiber Backbone: 10 POPs and 14,500 km
National Voice Backbone: 9 switching voice centrals
and 150 interconnection points
International Interconnection: two nodes in RJ and
SP managing international traffic
Satelite networks links in 9 cities
AES Atimus acquisition in 2011, later called TIM Fiber
Extensive optical fiber network with 5.5 thousand km
Coverage in metropolitan areas of RJ and SP
Potential market of 8.5 million households and 550
thousand companies in 21 cities
Intelig Atimus
Central Switch Fiber Network Satelite Station Central ATM and IP network Submarine cable MAN – Metropolitan Network Presence

26
R 000
G 070
B 145
R 235
G 000
B 040
R 000
G 081
B 135
R 000
G 110
B 184
R 000
G 156
B 222
R 244
G 209
B 000
R 243
G 150
B 016
R 231
G 055
B 140
R 220
G 104
B 075
R 158
G 004
B 073
R 197
G 189
B 193
R 116
G 175
B 039
R 000
G 000
B 000
Institutional Presentation
TIM Participações
Asset Optimization
2013a 2014a 2015e 2016e 2017e Indoor coverage increase in cities already covered with LTE
% of urban population covered with 4G
4G with 1.8
4G with 2.5 only
+6 p.p.
+7 p.p.
Refarming to be applied in other cities
Towers Sale: Largely supporting capex
increase
Possible Technologies
850 MHz
Band 900 MHz
1800 MHz
2100 MHz
2500 MHz
700 MHz
2G 3G
2G 3G
2G 4G
3G 4G 4G
Efficient use of spectrum portfolio
to… Towers sold
Asset optimization
Estimated value of the deal
Towers to be transferred to
American Tower
3 Closings in 2015 (April, September and December)
Cash in from towers sale
From…
Refarming 1,800MHz

27
R 000
G 070
B 145
R 235
G 000
B 040
R 000
G 081
B 135
R 000
G 110
B 184
R 000
G 156
B 222
R 244
G 209
B 000
R 243
G 150
B 016
R 231
G 055
B 140
R 220
G 104
B 075
R 158
G 004
B 073
R 197
G 189
B 193
R 116
G 175
B 039
R 000
G 000
B 000
Institutional Presentation
TIM Participações
Regulatory Update

28
R 000 G 070 B 145
R 235 G 000 B 040
R 000 G 081 B 135
R 000 G 110 B 184
R 000 G 156 B 222
R 244 G 209 B 000
R 243 G 150 B 016
R 231 G 055 B 140
R 220 G 104 B 075
R 158 G 004 B 073
R 197 G 189 B 193
R 116 G 175 B 039
R 000 G 000 B 000
Institutional Presentation
TIM Participações 28
Main regulatory topics
2Q16
May June
New regulatory model (1/3) • MiniCom Public
consultation.closed on Jan. 15th.
Net Neutrality • Minister of Justice
launched Public Consultation with the Decree proposal (pubished on May)..
Digital TV • New Analog TV
Switch Off Schedule Approval
• Approval of EAD’s 2nd Payment 1-year postponement to 31/1/2017.
Auction • Resuming Auction of
remaining 1.800, 1.900 and 2.500 MHz spectrum, with local blocks.
Digital TV • Feb 29th - Rio
Verde’s TV Analog Switch Off
Condecine • The Justice granted
preliminary suspension Condecine tax for companies affiliated SinditeleBrasil
April
1Q16
February March January
Auction • Expected Terms
signature of the Auction of remaining 1.800, 1.900 and 2.500 MHz spectrum, with local blocks.
New regulatory model (3/3) • Expected final
ANATEL decision on fixed concession conditions to 2016-2020 review.
Pay TV • New Regulation of
SeAC (Pay TV) under Public Consultation until June.
Condecine • The Supreme Court
determines the obligatory payment of Condecine and suspends the preliminary decision.
Broadband • Fixed data-capped
plans temporarily banned, until ANATEL’s decision
700 MHz • LTE deployment
approval in Rio Verde (expected June).
Res. 664/2016 • ANATEL postponed
(Dec/16) the review of concession contracts and universalization goals.
New regulatory framework (2/3) • MiniCom final report
with competition diagnosis and guideline for ANATEL's actions
Net Neutrality • Presidential Decree
published on May 11th including topics as Traffic discrimination, Transparency, Personal Data and Business Models (Zero Rating).
Brasil Inteligente • Lauched targets to
promote universal internet access (2019)

29
R 000
G 070
B 145
R 235
G 000
B 040
R 000
G 081
B 135
R 000
G 110
B 184
R 000
G 156
B 222
R 244
G 209
B 000
R 243
G 150
B 016
R 231
G 055
B 140
R 220
G 104
B 075
R 158
G 004
B 073
R 197
G 189
B 193
R 116
G 175
B 039
R 000
G 000
B 000
Institutional Presentation
TIM Participações
Financial Data

R 000 G 070 B 145
R 235 G 000 B 040
R 000 G 081 B 135
R 000 G 110 B 184
R 000 G 156 B 222
R 244 G 209 B 000
R 243 G 150 B 016
R 231 G 055 B 140
R 220 G 104 B 075
R 158 G 004 B 073
R 197 G 189 B 193
R 116 G 175 B 039
R 000 G 000 B 000
30 Institutional Presentation
TIM Participações
Revenue transformation continues
Business Generated Revs Mix Data Revenues Mix
Data Growth Reacceleration
21% 21%
17%
9%
14%
1Q15 2Q15 3Q15 4Q15 1Q16
(%YoY)
SMS
Innovative Services +26 %
-37 %
39% 47%
61%
53%
1Q15 2Q15 3Q15 4Q15 1Q16
Data
Voice
(% of business generated net revenues)
1Q15 1Q16
(VAS net revenues mix; % YoY)
Service Net Revenues
(%YoY)
-4% -5%
-7%
-8% -8%
1Q15 2Q15 3Q15 4Q15 1Q16
Trend stopped
31
R 000
G 070
B 145
R 235
G 000
B 040
R 000
G 081
B 135
R 000
G 110
B 184
R 000
G 156
B 222
R 244
G 209
B 000
R 243
G 150
B 016
R 231
G 055
B 140
R 220
G 104
B 075
R 158
G 004
B 073
R 197
G 189
B 193
R 116
G 175
B 039
R 000
G 000
B 000
Institutional Presentation
TIM Participações
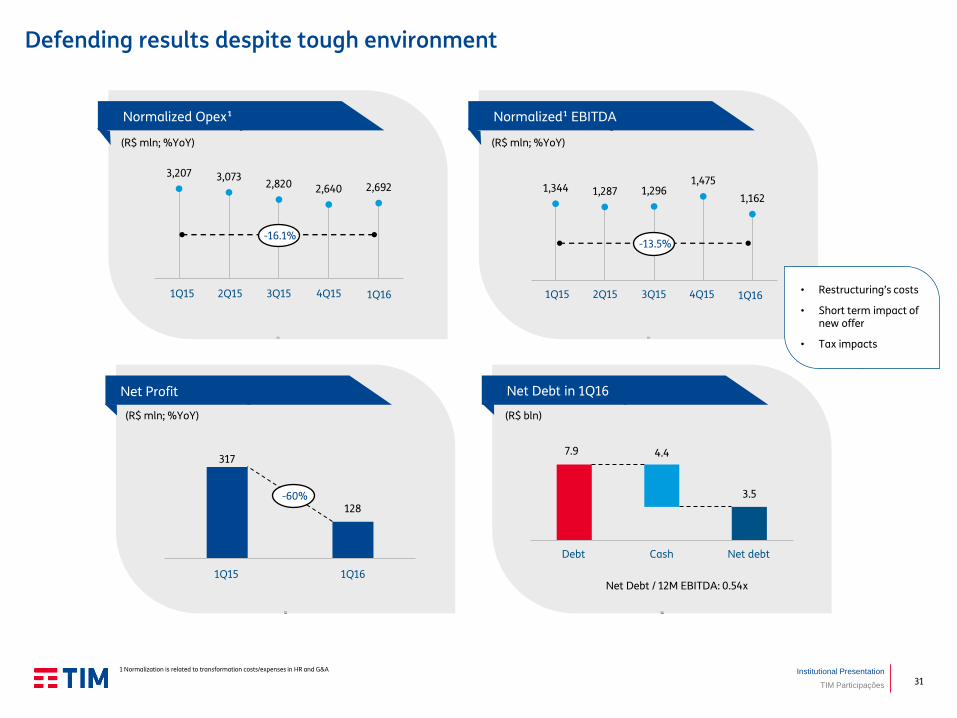
Defending results despite tough environment
1 Normalization is related to transformation costs/expenses in HR and G&A
317
128
Net Profit
(R$ mln; %YoY)
1Q15 1Q16
Net Debt in 1Q16
7.9
3.5
4.4
(R$ bln)
Net Debt / 12M EBITDA: 0.54x
Debt Cash Net debt
Normalized¹ EBITDA
(R$ mln; %YoY)
1Q15 2Q15 3Q15 4Q15 1Q16 • Restructuring’s costs
• Short term impact of new offer
• Tax impacts
Normalized Opex¹
(R$ mln; %YoY)
3,207 3,073 2,820 2,640 2,692
1Q15 2Q15 3Q15 4Q15 1Q16
-16.1%
1,344 1,287 1,296 1,475
1,162
-13.5%
-60%

32
R 000 G 070 B 145
R 235 G 000 B 040
R 000 G 081 B 135
R 000 G 110 B 184
R 000 G 156 B 222
R 244 G 209 B 000
R 243 G 150 B 016
R 231 G 055 B 140
R 220 G 104 B 075
R 158 G 004 B 073
R 197 G 189 B 193
R 116 G 175 B 039
R 000 G 000 B 000
Institutional Presentation
TIM Participações
Process Improvement
Digging deeper into cost reduction – Efficiency Program 2.0
Optimization / Control
Strategic Sourcing
Organization/ Rightsizing
and Efficiency
Process Improvement
Business Model
Changes
> R$1 bln in savings
Jan/15 Dec/17
Business Model
Changes
• 3 years program
• Between R$ 300-350 mln per year
Mar/16
Corporate Efficiency Plan
Additional Efficiency & Cost Restructuring
• Enhancement of corporate efficiency program;
• Additional efforts in Sales & Marketing (commissioning
model and advertising);
• Full cash cost approach;
+ Sales & MKT
New Approach
Optimization / Control
+
Strategic Sourcing
+
Organization/ Rightsizing
and Efficiency
+
~ 40%

33
R 000
G 070
B 145
R 235
G 000
B 040
R 000
G 081
B 135
R 000
G 110
B 184
R 000
G 156
B 222
R 244
G 209
B 000
R 243
G 150
B 016
R 231
G 055
B 140
R 220
G 104
B 075
R 158
G 004
B 073
R 197
G 189
B 193
R 116
G 175
B 039
R 000
G 000
B 000
Institutional Presentation
TIM Participações
Perspectives

34
R 000 G 070 B 145
R 235 G 000 B 040
R 000 G 081 B 135
R 000 G 110 B 184
R 000 G 156 B 222
R 244 G 209 B 000
R 243 G 150 B 016
R 231 G 055 B 140
R 220 G 104 B 075
R 158 G 004 B 073
R 197 G 189 B 193
R 116 G 175 B 039
R 000 G 000 B 000
Institutional Presentation
TIM Participações
Conclusion & Outlook
Less impact from
MTR
-8.7% -9.2%
4Q15 1Q16 2Q16 3Q16 4Q16
-5.3%
-13.5%
4Q15 1Q16 2Q16 3Q16 4Q16
Mobile Service Net Revenues (%YoY)
Normalized¹ EBITDA (%YoY)
1 Normalization is related to transformation costs/expenses in HR and G&A
Headwinds should gradually reduce…
Traditional business
stabilization
Data services
resuming growth
Better customer
base mix
Continuous cost
efficiency program
intensified
Keeping focus on
Infrastructure

35
R 000 G 070 B 145
R 235 G 000 B 040
R 000 G 081 B 135
R 000 G 110 B 184
R 000 G 156 B 222
R 244 G 209 B 000
R 243 G 150 B 016
R 231 G 055 B 140
R 220 G 104 B 075
R 158 G 004 B 073
R 197 G 189 B 193
R 116 G 175 B 039
R 000 G 000 B 000
Institutional Presentation
TIM Participações 35
Guidance Summary
Targets reaffirm commitment to long term value creation for all shareholders
KPIs Targets
> R$1 bln in savings between 2015-17 Opex
Margin expansion for every year between 2016-18 EBITDA Margin
< R$14 bln between 2016-18 Capex*
Data as main revenue component from 2016, focus on Revenue Share Service Revenues
*Excluding Spectrum

36
R 000
G 070
B 145
R 235
G 000
B 040
R 000
G 081
B 135
R 000
G 110
B 184
R 000
G 156
B 222
R 244
G 209
B 000
R 243
G 150
B 016
R 231
G 055
B 140
R 220
G 104
B 075
R 158
G 004
B 073
R 197
G 189
B 193
R 116
G 175
B 039
R 000
G 000
B 000
Institutional Presentation
TIM Participações
Safe Harbor
TIM on the Web
Statements in this presentation, as well as oral statements made by the
management of TIM Participações S.A. (the “Company”, or “TIM”), that are not
historical fact constitute “forward looking statements” that involve factors that
could cause the actual results of the Company to differ materially from historical
results or from any results expressed or implied by such forward looking
statements. The Company cautions users of this presentation not to place undue
reliance on forward looking statements, which may be based on assumptions
and anticipated events that do not materialize.
TIM website: www.tim.com.br
Investor Relations website: www.tim.com.br/ir
TIM on Twitter: @TIMBrasil
Investor Relations Twitter: @TIM_RI
TIM on Facebook: www.facebook.com/timbrasil
TIM on YouTube: www.youtube.com/timbrasil

37
R 000
G 070
B 145
R 235
G 000
B 040
R 000
G 081
B 135
R 000
G 110
B 184
R 000
G 156
B 222
R 244
G 209
B 000
R 243
G 150
B 016
R 231
G 055
B 140
R 220
G 104
B 075
R 158
G 004
B 073
R 197
G 189
B 193
R 116
G 175
B 039
R 000
G 000
B 000
Institutional Presentation
TIM Participações 37