presentation 1q16 2t11 - apimecv4-usiminas.infoinvest.com.br/enu/5145/apresentao institucional...
TRANSCRIPT

Apresentação Usiminas
2T11 - APIMEC
Classification of the information: Confidential
Presentation
1Q16

Agenda
Usiminas and its
business units
Market
Outlook
Financial
Results
Usiminas
Profile
2

Company Profile
3
Complete solution for products and services
Steel company with the largest number of patents rights in Latin America
Largest Research Center in the steel sector in Latin America
First Brazilian steel company to have its quality system certified by ISO 9001 in 1992
First Brazilian steel company and second in the world to achieve the ISSO 14001 environmental
management certificate in 1996
Founded of the most enduring environmental education project of the private sector since 1984

Timeline
Operation
Start Up
Cosipa
privatization
Listing on
ADR I on
the OTC
Market
(New York)
•Acquisition
of iron ore
mines
•Acquisition
of
Zamprogna
•Creation of Soluções Usiminas
•One CNPJ: Usiminas
incorporates Cosipa
•Creation of Mineração Usiminas
•Acquisition of Codeme
and Metform stake
Automotiva
Usiminas
Divestment
•Selling of
Ternium stake
•Joint Mining
Agreements
with MBL e
Ferrous
Entrance of
Ternium /
Tenaris into
Usiminas
Control Group
(New
shareholders
agreement)
•Usiminas
privatization
•Listing on
BOVESPA
4
Listing on
LATIBEX
stock
exchange
section
Friables
Project
conclusion on
Mining
(increasing
the capacity
to 12 million
tons/year )
2011
2012 1962
2005
1994
2013
1991
2008
2010
2009
1993
2014 2015
Temporary
shutdown
of the
primary
areas in
Cubatão
2016
Approval of
the R$ 1
billion
capital
increase

Shareholding Composition
5
Usiminas shares are traded on BM&FBovespa (São Paulo), on the OTC
Market (New York) and on a LATIBEX exchange section (Madrid).
ON 49.84% 505,260,684
Voting Capital
Total Capital
1,013,786,190
PN 50.16% 508,525,506
Control Group (63.86%)
29.45%
27.66% 6.75%
36.14% Nippon Group
Ternium / Tenaris
Usiminas Pension Fund
Free Float

6
Complete Solution for Products and Services
Business Units
Mineração Usiminas
Mining
Steel
Ipatinga Plant
Cubatão Plant
Unigal Usiminas
Steel Processing
Soluções Usiminas
Capital Goods
Usiminas Mecânica
DOWNSTREAM UPSTREAM

Mining
Steel
Steel Processing
Capital Goods
Strategically Located
7

Note: The prices are adjusted by removing the effects of events such as Bonus and Unfolding 8
Shares’ Quotation on BM&FBOVESPA
R$/share - Up to 03/31/2016
2.59 3.67
6.15
12.40
17.53
21.78
25.13
21.41
11.62
10.55
12.30
4.02 4.09
6.72
8.81
11.80
24.44
18.26
22.21 21.93
10.45
10.12
10.52
5.05 1.55
1.81
2004 2005 2006 2007 2008 2009 2010 2011 2012 2013 2014 2015 1Q16
USIM3 USIM5

Agenda
Usiminas and its
business units
Market
Outlook
Financial
Results
Usiminas
Profile
9

World Crude Steel Market in 2015
Million Tons
Source: World Steel Association 10
Capacity
2,351
Production
1,647
Excess of Capacity 704
22.9
33.2
31.5
42.7
71.1
69.7
89.6
78.9
105.2
803.8
Ukraine
Brazil
Turkey
Germany
Russia
South Korea
India
USA
Japan
China

10% 2%
8%
7%
3% 1%
50%
18%
World Crude Steel Production
971 million tons 1,665 million tons
11 Source: World Steel Association
2014 2003
*Except China
20%
2%
12%
13%
4% 2%
23%
24% European Union
Europe (Others)
Others
North America
South America
Africa
China
Asia and Oceania *

Largest Producers in 2014
Source: World Steel Association/ Instituto Aço Brasil 12
Brazilian Flat Steel Producers World Crude Steel Producers
1 ArcelorMittal
2 Nippon Steel & Sumitomo Metal Corporation
3 Hebei Steel Group
4 Baosteel Group
5 Wuhan Steel Group
6 POSCO
7 Shagang Group
8 Ansteel Group
9 Shougang Group
10 JFE
62 Usiminas
Thousand Tons
6,054
5,368
4,456
745
34
Usiminas ArcelorMittal CSN Aperam Gerdau

Brazilian Flat Steel Market
13
Million Tons
Source: Instituto Aço Brasil / Usiminas – Excludes Slabs
15.7
14.3
11.9
15.2 14.3
14.9 15.0 14.3
13.4 12.5
13.1
10.2
14.5 13.6 14
14.8
13.2
10.7
5% 7%
11%
22%
14% 13% 12% 15% 15%
2007 2008 2009 2010 2011 2012 2013 2014 2015
Production Consumption Imports

Auto Industry
and Autoparts Oil and Gas Pipelines
Agricultural and
Road Machinery
Heavy Plates and
Hot Rolled
Civil
Construction
Household
Appliances
Cold Rolled and
Galvanized
14
Flat Steel Consumption Markets
Hot Rolled,
Cold Rolled and
Galvanized
Heavy Plates,
Hot Rolled,
Cold Rolled and
Galvanized
Heavy Plates and
Hot Rolled
Heavy Plates and
Hot Rolled

Agenda
Usiminas and its
business units
Market
Outlook
Financial
Results
Usiminas
Profile
15

HDG Placas Laminados a
Quente
Eletrogalvanizados
2,200
Optimized
Rolling
Capacity
4,200 1,900 1,020 350
Cubatão Plant - 1,200 -
3,700 Nominal
Capacity 8,000 2,000* 9,500* 1,050 360
-
Ipatinga Plant 1,050 360 2,500 3,600 1,000 5,000
Flat Steel Capacity of Production
16
Thousand Tons
Slabs Hot Coils Cold Coils Heavy Plates Slab Caster EG
Galvanized
* Temporary shutdown of the primary areas of Cubatão
2,100 ** 1,000** 4,500*
2.300
** Temporary shutdown of the rolling mills

Sales Volume
Steel Business Unit – Thousand Tons
17
12%
88%
15%
85%
24%
76%
19%
81%
12%
88%
88%
67% 64%
73% 84%
12%
33%
36%
27%
16%
1,256 1,275
1,179 1,205
903
1Q15 2Q15 3Q15 4Q15 1Q16
Domestic Market Exports

18
Steel Business Unit
Exports – Main Markets
25%
20%
19%
10%
7%
6%
5% 2%
2% 5%
1Q16
Argentina Germany USA Taiwan India
Spain Mexico Italy Portugal Others
18%
16%
13%
13%
11%
6%
5%
5%
5%
8%
4T15
China Turkey
United Kingdom Vietnam

18.9%
13.1%
12.6%
11.0%
9.2%
8.9%
8.3%
8.0%
6.6%
3.4%
1T16
Labor (direct and indirect) Coal and Coke Other Raw Materials Energy and Fuels
Inventories Variation Iron Ore and Pellets Depreciation Structural Expenses
Spare Parts Others
18.8%
14.8%
12.7%
10.9%
10.0%
10.3%
7.8%
7.1%
5.3% 2.3%
4Q15
Steel Business Unit
19
Cost of Goods Sold - COGS

337
206
(82)
(179)
46
13%
9%
-4%
-8%
3%
1Q15 2Q15 3Q15 4Q15 1Q16
Steel Business Unit – R$ Million
Adjusted EBITDA and EBITDA Margin
20
19
31 6
1
(6)
(52) (2)
72
(37)
Adjusted EBITDA
Margin
Adjusted EBITDA Sales of Surplus
Electric Energy
Assets Sale/
Write-off

Capacity increase to generate finished products
7.2 million t 9.7 million t
(2010) (2014)
Investments
21
Steel Business Unit
Slabs
Heavy Plates
Hot Rolled Cold Rolled
Hot dip galvanized Electrogalvanized

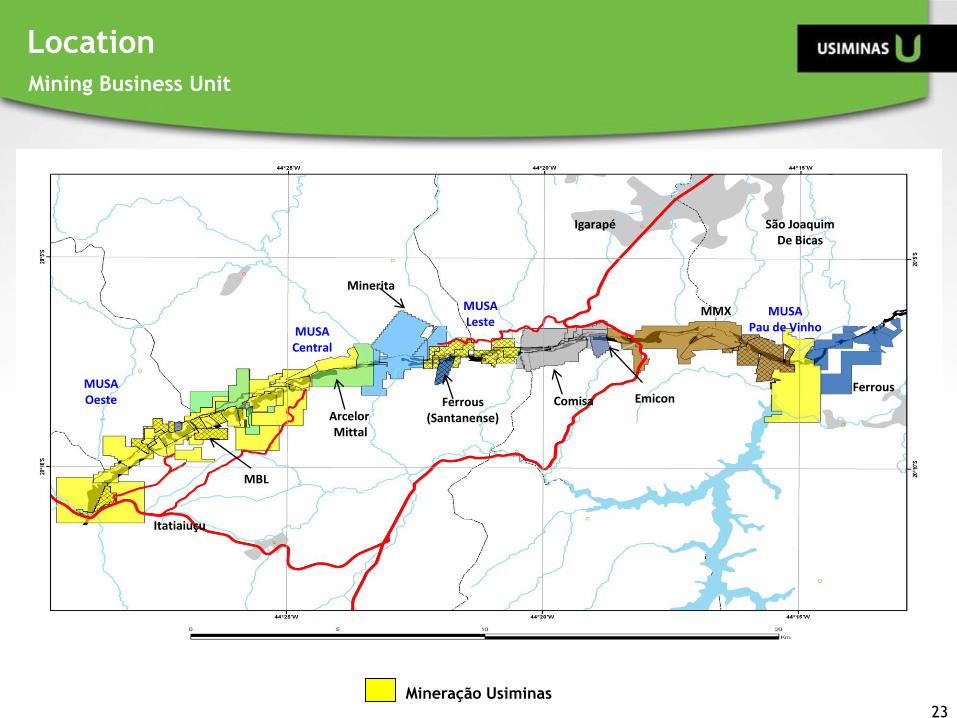
o Located in Serra Azul/Minas Gerais state
o 4 mining sites, acquired from J. Mendes in February, 2008
o Reserves of 2.6 billion tons of iron ore
o It has 20% of voting shares of MRS Logistica, being part of the Control Group
o Retroarea in Itaguaí Port
Description
22
Mining Business Unit
70%
30%
Shareholder Composition Production Capacity
Lump 2 million
Sinter Feed
4 million
Pellet Feed
6 million
MBL
Arcelor Mittal
Ferrous (Santanense)
Comisa Emicon
MMX
Ferrous
MUSA Pau de Vinho
MUSA Leste
Minerita
MUSA Central
MUSA Oeste
Itatiaiuçu
Igarapé São Joaquim De Bicas
Mineração Usiminas
Location
Mining Business Unit
23

Mining Business Unit
Retroarea in Itaguai Port
24

25
Mining Business Unit – Thousand Tons
Sales Volume
1,048 1,071
734 658 615
91 135
41
12 16
344
1,139
1,206
775
670
975
1Q15 2Q15 3Q15 4Q15 1Q16
Sales to Usiminas Sales to 3rd parties - Domestic Market Exports

Iron Ore Price – PLATTS (62% Fe CFR China)
US$/ton
26
62 58
55
47 48
1Q15 2Q15 3Q15 4Q15 1Q16

27
Adjusted EBITDA and EBITDA Margin
Mining Business Unit – R$ million
43
(6) (24)
(102)
(12)
36%
-5%
-27%
-119%
-11%
1Q15 2Q15 3Q15 4Q15 1Q16
Adjusted EBITDA Adjusted EBITDA Margin

o 8 industrial units in different Brazilian states:
MG, SP, RS, ES, BA and PE
o Processing capacity of 2 million tons of
steel/year
o Net Revenue of R$1.9 billion in 2015
Description
Soluções Usiminas - Steel Processing
28
Porto Alegre
São Paulo Guarulhos
Taubaté
Recife
Serra
Betim
Santa Luzia

o Facilities in Ipatinga/Minas Gerais state, Congonhas/Minas Gerais state and in
Cubatão/São Paulo state
o Market Segments: Steel Structures, Shipbuilding and Offshore, Oil and Gas, Industrial
Assembly and Equipment, Foundry and Railcars
o Net Revenue of R$869 million in 2015
Usiminas Mecânica - Capital Goods
Description
29
Brasília 3rd Bridge
29
Steel Structures

Agenda
Usiminas and its
business units
Market
Data
Financial
Results
Usiminas
Profile
30

31
Adjusted EBITDA and EBITDA Margin Consolidated – R$ million
380
227
(65)
(250)
52
14%
8%
-3%
-10%
3%
1Q15 2Q15 3Q15 4Q15 1Q16
(50) (11)
28
41 4
(2) (1) 72
(41)
Adjusted EBITDA
Margin
Adjusted EBITDA Sales of Surplus
Electric Energy
Assets Sale/
Write-off

32
Comparing Adjusted and CVM 527 EBITDA Consolidated – R$ Thousand

1,595
1,166 1,187
336
934
316
13 11 30
140
610 580
1,479
75
545
0 0 0
Caixa 2016 2017 2018 2019 2020 2021 2022 a partir de 2023
Moeda Local Moeda Estrangeira
1.736 1.768
1.009
861
13 11
30
1.815
Debt Duration: R$: 28 meses
US$: 24 meses 1.776
Cash Position and Debt Profile
33
Consolidated – R$ million

2,621 2,889 2,397 2,024 1,736
4,402 4,584 5,577
5,681 5,547
7,023 7,473
7,974
7,705 7,282
1Q15 2Q15 3Q15 4Q15 1Q16
Gross Debt Net Debt Cash
Cash and Indebtedness Consolidated - R$ million
34

CAPEX
35
Consolidated - R$ million
976
600
964
622
64
555
317
94
112
4
112
64
52
50
2
1,643
981
1,110
784
70
2012 2013 2014 2015 1Q16
Others Mining Steel

Consolidated - R$ million
G&A Evolution
36
122
108 101
109
90
4.6%
4.0% 4.2%
4.5% 4.4%
1Q15 2Q15 3Q15 4Q15 1Q16
G&A G&A/Net Revenues

Working Capital
Consolidated – R$ billion
37
2.7 2.7 2.4 2.3
2.2
1Q15 2Q15 3Q15 4Q15 1Q16

933 911
747
639
485
1Q15 2Q15 3Q15 4Q15 1Q16
48
38
Inventory
turnover
(days)
Thousand Tons
Working Capital – Steel Inventories
67 64 57 48

Income Statement Per Business Unit – R$ million
Note: All intercompany transactions are made at arm´s length basis 39

40
Financial Reconfiguration
Standstill agreement with the main creditors signed in March/16 for
120 days;
Capital increase duly approved at R$1 billion;
Access to Usiminas Mining cash (Intercompany Loan / capital reduction);
Debt renegotiation for a new profile of the principal and maturities to
the generation of the Company's cash;
Sale of assets.

Declarations relative to business and perspectives of the Company, operating
and financial results and projections, and references to the growth of the
Company constitute mere forecasts and were based on Management´s
expectations in relation to future performance, these expectations are highly
dependent on market behavior, on Brazil´s economic situation, on the industry
and on international markets, and are therefore subject to change.
ADR
Level I
www.usiminas.com/ri
Cristina Morgan C. Drumond Head of IR
Phone: 55-31-3499-8772
Fax: 55-31-3499-9357
Renata Costa Couto IR Analyst
Phone: 55-31-3499-8619
Leonardo Karam Rosa IR Manager
Phone: 55-31-3499.8550
Diogo Dias Gonçalves IR Manager
Phone: 55-31-3499-8710