insurance information institute february 25, 2009
DESCRIPTION
Impacts of the US Economic Stimulus Package on the P/C Insurance Industry American Recovery & Reinvestment Act of 2009. Insurance Information Institute February 25, 2009. Robert P. Hartwig, Ph.D., CPCU, President Insurance Information Institute 110 William Street New York, NY 10038 - PowerPoint PPT PresentationTRANSCRIPT

Impacts of the US Economic Stimulus
Package on the P/C Insurance Industry
American Recovery & Reinvestment Act of 2009
Robert P. Hartwig, Ph.D., CPCU, PresidentInsurance Information Institute 110 William Street New York, NY 10038
Tel: (212) 346-5520 [email protected] www.iii.org
Insurance Information Institute
February 25, 2009

Summary of Short-Run Impacts of Stimulus Package on P/C Insurance
• No Stimulus Provisions Specifically Address P/C Insurance• Spending, Aid and Tax Reductions benefit other industries, state and local
governments, as well as individual and some corporate taxpayers • Stimulus Package is Unlikely to Increase Net Premiums Written by More
Than 1% or Approximately $4.5 Bill. by Year-End 2010 • “Direct” Impact to P/C Insurers Results Primarily from Increased
Demand for Commercial Insurance• Primarily the result of increased infrastructure spending and the resulting need to insure
workers, property and protect against liability risks• Because the primary objective of the stimulus is employment related, workers compensation
will be the p/c line that benefits the most• Assuming the target of 3.5 million jobs created or preserved is achieved, private workers comp
NPW (new and preserved) could amount to as much as $1.1 billion• Other commercial lines to benefit: surety, commercial auto, inland marine
• Other “Direct” P/C Demand Benefits Will Be Minimal• Tax provisions providing incentives to buy cars and homes and accelerate the depreciation of
equipment will have little net impact on exposure• Some additional premium may be generated as older cars and equipment are replaced with
new and more valuable (and therefore more expensive to insure)

Summary of Short-Run Impacts of Stimulus Package on P/C Insurance (cont’d)
• “Indirect” Impacts: Limited Gains for P/C Insurers• If stimulus is successful at increasing disposable and corporate income
via tax reductions and “multiplier” income and employment effects, then spending could rise and produce some additional insurable exposure growth for p/c insurers
• Investment Portfolio Impacts• It is impossible to discern what, if any, impact the stimulus will have on
stock and bond performance• If successful, the stimulus package (along with other initiatives) should
help stabilize and reinvigorate the economy, increasing stock prices and bolstering the value of corporate and asset-backed bonds
• The stimulus could be viewed as inflationary. Combined with existing large deficits and other spending initiatives, an expectation of inflation could push interest rates upward

THE ECONOMIC STORM
Current Economic Situation & The Administration’s Case for
Stimulus Spending

3.7
%
0.8
% 1.6
% 2.5
% 3.6
%
3.1
%
2.9
%
0.1
%
4.8
%
4.8
%
0.9
%
2.8
%
-0.5
%
-1.5
%
0.8
% 2.0
%
2.4
%
2.9
%
3.1
%
3.1
%
-4.9%
-3.8%
-0.2%
-6%
-4%
-2%
0%
2%
4%
6%
2
00
0
2
00
1
2
00
2
2
00
3
2
00
4
2
00
5
2
00
6
07
:1Q
07
:2Q
07
:3Q
07
:4Q
08
:1Q
08
:2Q
08
:3Q
08
:4Q
09
:1Q
09
:2Q
09
:3Q
09
:4Q
10
:1Q
10
:2Q
10
:3Q
10
:4Q
Real GDP Growth*
*Yellow bars are Estimates/Forecasts from Blue Chip Economic Indicators.Source: US Department of Commerce, Blue Economic Indicators 2/09; Insurance Information Institute.
Recession began in December 2007. Economic toll of credit crunch, housing
slump, labor market contraction is growing
The Q4:2008 decline was the steepest since the
Q1:1982 drop of 6.4%

Length of US Recessions,1929-Present*
43
13
811 10
810 11
16
6
16
8 8
14
0
5
10
15
20
25
30
35
40
45
50
Aug.1929
May1937
Feb.1945
Nov.1948
July1953
Aug.1957
Apr.1960
Dec.1969
Nov.1973
Jan.1980
Jul.1981
Jul.1990
Mar.2001
Dec.2007
* As of February 2009
Sources: National Bureau of Economic Research; Insurance Information Institute.
Current recession began in Dec. 2007 and is already the
longest since 1981. If it extends beyond April, it will become the longest recession since the Great Depression.
Months in Duration
3.0
3.5
4.0
4.5
5.0
5.5
6.0
6.5
7.0
7.5
8.0
Jan
-00
Jan
-01
Jan
-02
Jan
-03
Jan
-04
Jan
-05
Jan
-06
Jan
-07
Jan
-08
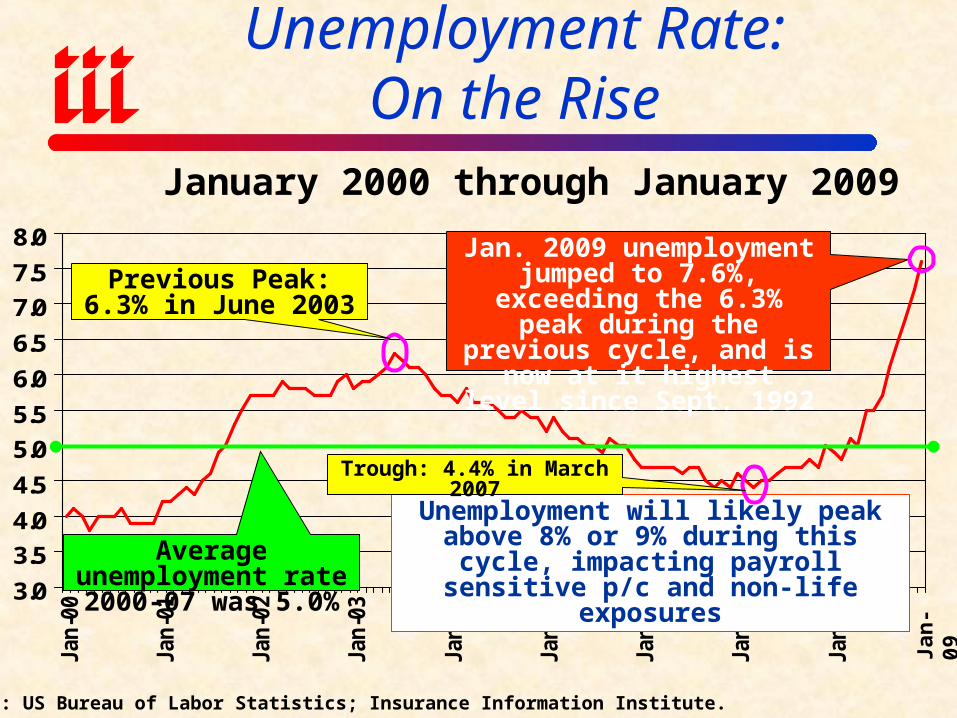
January 2000 through January 2009
Unemployment will likely peak above 8% or 9% during this cycle, impacting payroll
sensitive p/c and non-life exposures
Source: US Bureau of Labor Statistics; Insurance Information Institute.
Jan. 2009 unemployment jumped to 7.6%, exceeding the 6.3% peak during the previous cycle, and is now at it highest
level since Sept. 1992
Unemployment Rate:On the Rise
Average unemployment rate 2000-07 was 5.0%
Previous Peak: 6.3% in June 2003
Trough: 4.4% in March 2007
Jan
-09

U.S. Unemployment Rate,(2007:Q1 to 2010:Q4F)*
4.5%
4.5% 4.6% 4.
8% 4.9%
5.4%
6.1%
6.9%
7.6%
8.2%
8.6%
8.8%
8.8%
8.8%
8.6%
8.5%
4.0%
4.5%
5.0%
5.5%
6.0%
6.5%
7.0%
7.5%
8.0%
8.5%
9.0%
07:Q1 07:Q2 07:Q3 07:Q4 08:Q1 08:Q2 08:Q3 08:Q4 09:Q1 09:Q2 09:Q3 09:Q4 10:Q1 10:Q2 10:Q3 10:Q4
* Blue bars are actual; Yellow bars are forecastsSources: US Bureau of Labor Statistics; Blue Chip Economic Indicators (2/09); Insurance Info. Inst.
Rising unemployment will erode payrolls
and workers comp’s exposure base.
Unemployment is expected to peak at
nearly 9% in late 2009 into 2010.

Years With Job Losses: 1939-2009*(Thousands)
-2,974-2,750
-2,128
-1,762-1,512
-886 -857-598 -545 -540 -462 -450 -432 -378 -371 -297
-52
-3,500
-3,000
-2,500
-2,000
-1,500
-1,000
-500
0
2008 1945 1982 2001 1949 1944 1991 2009* 1957 2002 1953 1970 1960 1974 1954 1958 1981
The US has seen net job
losses in only 16 of the 70 years since
1939
*Through January 2009.Source: Insurance Information Institute research fromUS Bureau of Labor Statistics data: http://www.bls.gov/ces/home.htm.
2008’s job losses even exceeded those in 1945, at the conclusion of WW II
Losses through January 2009 already rank the year as the 8th worst in
the post WW II era

New Private Housing Starts,1990-2010F (Millions of Units)
2.07
1.80
1.36
0.90
0.66
0.88
1.48
1.351.
46
1.29
1.20
1.01
1.19
1.47
1.62 1.64
1.57 1.60 1.
71
1.85
1.96
0.60.70.80.91.01.11.21.31.41.51.61.71.81.92.02.1
90 91 92 93 94 95 96 97 98 99 00 01 02 03 04 05 06 07 08 09F 10F
Exposure growth forecast for HO insurers is dim for 2009 with some
improvement in 2010.
Impacts also for comml. insurers with construction risk exposure
New home starts plunged 34%
from 2005-2007; Drop through 2009 trough is 68% (est.)—a
net annual decline of 1.41 million units, lowest since
record began in 1959
I.I.I. estimates that each incremental 100,000 decline in housing starts costs
home insurers $87.5 million in new exposure (gross premium). The net
exposure loss in 2009 vs. 2005 is estimated at about $1.2 billion.
Source: US Department of Commerce; Blue Chip Economic Indicators (2/09); Insurance Information Inst.
11
SD
NDMT
ID
NV
CA
OR
WA
UT
WY
NE
CO
OK
TXLA
FL
MN
IA
IL
ME
AZNM
KS
WI
OH
MINY
VT
IN
MO
AR
KY
TN
NH
PA
RI
MS AL
SC
NC
GA
VAWV
MA
CT
AK
HI
NJ
DE
MD
DC
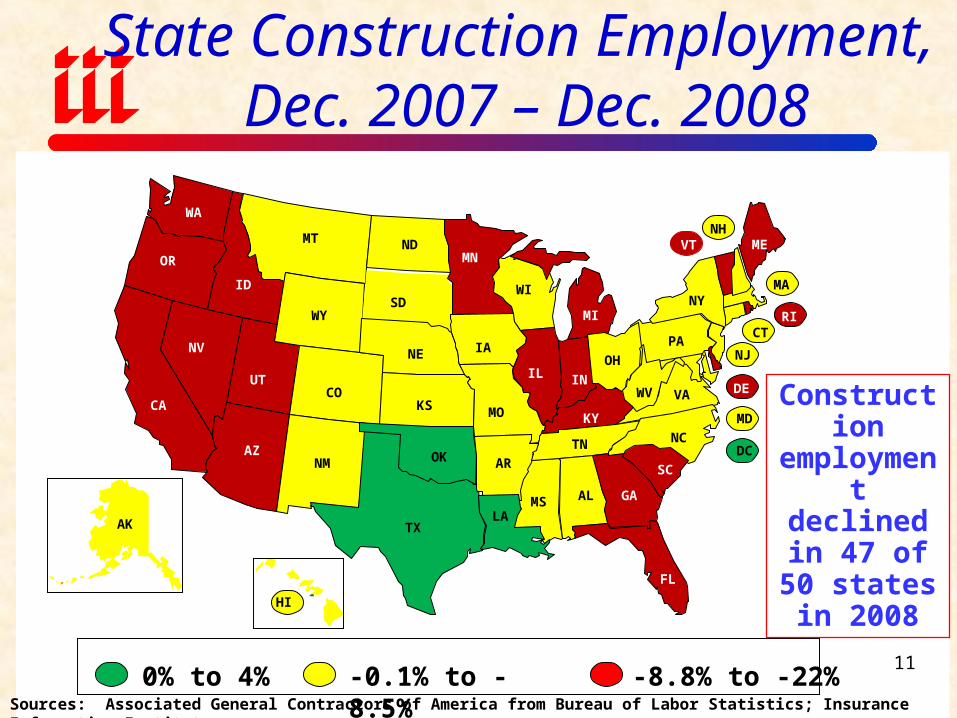
State Construction Employment, Dec. 2007 – Dec. 2008
0% to 4%
-0.1% to -8.5%
-8.8% to -22%
AK
11
Construction employment declined in
47 of 50 states in
2008
Sources: Associated General Contractors of America from Bureau of Labor Statistics; Insurance Information Institute.

16.916.916.6
17.117.5
17.817.4
16.516.1
13.1
10.9
12.7
10
11
12
13
14
15
16
17
18
19
99 00 01 02 03 04 05 06 07 08 09F 10F
Weakening economy, credit crunch are hurting auto sales; Gas prices less of a factor now.
New auto/light truck sales are expected to experience a net drop of 6.0 million units annually by 2009 compared
with 2005, a decline of 35.5% and the lowest level
since the late 1960s
Impacts of falling auto sales will have a less pronounced effect on auto insurance exposure growth
than problems in the housing market will on home insurers
Auto/Light Truck Sales,1999-2010F (Millions of Units)
Source: US Department of Commerce; Blue Chip Economic Indicators (2/09); Insurance Information Inst.

THE $787 BILLION ECONOMIC STIMULUS
Sectoral Impacts & Implications for P/C
Insurance
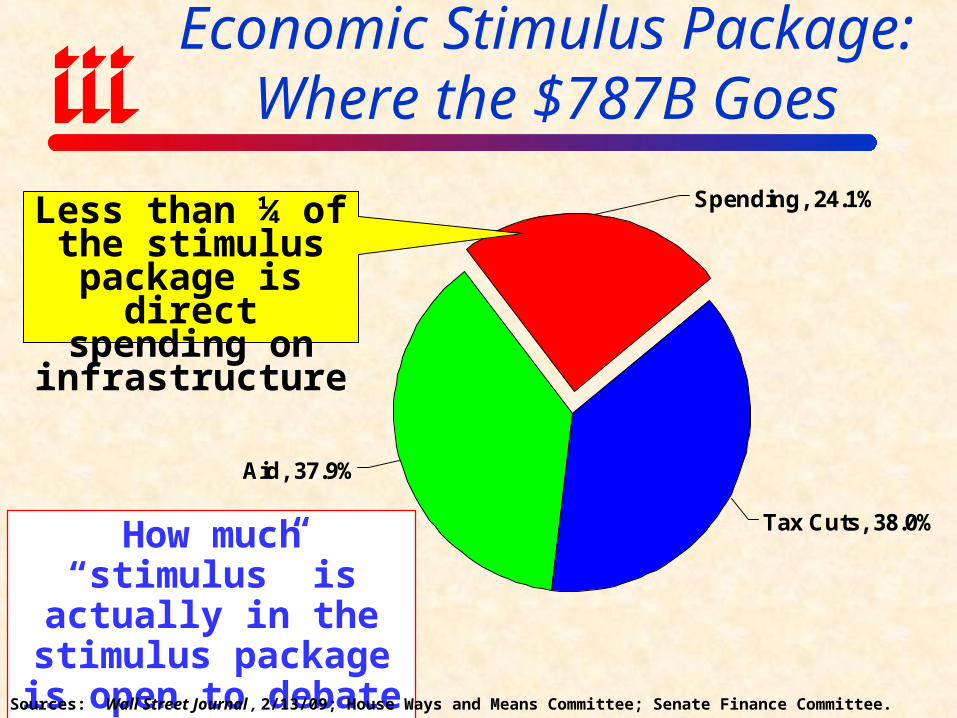
Economic Stimulus Package: Where the $787B Goes
Tax Cuts, 38.0%
Aid, 37.9%
Spending, 24.1%
How much “stimulus” is actually in the stimulus
package is open to debate and dispute
Sources: Wall Street Journal , 2/13/09; House Ways and Means Committee; Senate Finance Committee.
Less than ¼ of the stimulus package is direct spending on
infrastructure

Economic Stimulus Package: Where the $787B Goes
Tax Relief, $288 , 38%
State & Local Fiscal Relief, $144 , 18%
Infrastructure & Science, $111 , 14%
Protecting the Vulnerable, $81 , 10%
Health Care, $59 , 7% Education & Training, $53 , 7%
Energy, $43 , 5%
Other, 8, 1%
Tax relief and aid to state and local
government account for 56% of stimulus. Actual
spending accounts for only about 25%
Source: http://www.recovery.gov/ accessed 2/18/09; Insurance Information Institute.
$ BillionsObjective is to create or preserve 3.5 million jobs

$30
$19
$9$5
$8
$18
$8
$29
$6
$0
$5
$10
$15
$20
$25
$30
$35
Elec
tric
Grid
Heal
th In
fo.
Tech
nolo
gy
NIH
Rese
arch
Hom
eW
eath
eriza
tion
Fed.
Hou
sing
Ener
gyUp
grad
es
High
way
Infra
stru
ctur
e
Publ
ic tr
ansi
t
High
-spe
ed ra
il
Envi
ro. g
rant
s&
loan
s
24.1% or $132.2B of the stimulus package is
allocated toward direct spending. This is the
component that will most directly benefit p/c
insurers.
Lines Most Likely to Benefit:
Workers Comp Commercial Auto
Inland Marine Commercial Property &
Liability Surety
U.S. Economic $787B Stimulus Package: Major Spending Components
Sources: Wall Street Journal , 2/13/09; House Ways and Means Committee; Senate Finance Committee; Ins. Info. Inst.
Objective is to create or preserve 3.5 million jobs
$ Billions

Economic Stimulus Package: $143.4 in Construction Spending
Transportation Infrastructure, 49.3, 32%
Water & Environmental Infrastructure, 21.4, 14%
Building Infrastructure, 29.6, 20%
Other, 0.2, 0%
Workforce Development & Safety, 4.3, 3%
Energy & Technology, 29.8, 20% School Building, 9.2, 6%
Other, 8.0, 5%
There is approximately $140B in new construction spending
in the stimulus package, about 1/3 of it for transportation.
Source: Associated General Contractors at http://www.agc.org/cs/rebuild_americas_future (2/18/09); Insurance Info. Inst..
$ Billions

$5.1 $6.6
$116.1
$69.8
$0
$20
$40
$60
$80
$100
$120
Business deductions Refundable Tax creditfor 1st-time
homeowners
Tax credit to low incomeworkers & married
couples
Middle-income taxexemption
U.S. Economic $787B Stimulus Package: Major Tax Cut Components
Sources: The Wall Street Journal 2/13/09; Speaker of the House; House Ways and Means Committee; Senate Finance Committee; Insurance Information Institute.
$ Billions38% or $288 of the stimulus package is earmarked for tax relief. There are virtually no direct impacts for insurers.
Secondary impacts could benefit auto and home insurers if
consumer spending rises and real estate markets and residential
construction improve.
Business tax deductions geared toward firms with physical capital

$40.6
$87.0
$2.0$8.0
$1.4
$17.2
$0.20
$27
$0
$10
$20
$30
$40
$50
$60
$70
$80
$90
$100
State aid Medicaid Foreclosedproperty
investments
Publicsafety
Educationtax credit
Student aid Collegeprograms
Joblessbenefits
U.S. Economic $787B Stimulus Package: Major Aid Components
$ Billions
38% or $288B of the stimulus package is earmarked for aid, mostly to the states. It is the largest component of the package and the
least likely to have any stimulus impact. There is few direct benefits to p/c insurers,
other than making ongoing funding available for public works projects. Most of the
dollars will plug state budget gaps.
Sources: The Wall Street Journal 2/13/09; Speaker of the House; House Ways and Means Committee; Senate Finance Committee; Insurance Information Institute.

State-by-State Infrastructure
SpendingBigger States Get More, Should Benefit
Commercial Insurer Exposure

Infrastructure Stimulus Spending by State (Total = $38.1B)
State Allocation State Allocation State AllocationAL $603,871,807 LA $538,575,876 OK $535,407,908
AK $240,495,117 ME $174,285,111 OR $453,788,475
AZ $648,928,995 MD $704,863,248 PA $1,525,011,979
AR $405,531,459 MA $890,333,825 RI $192,902,023
CA $3,917,656,769 MI $1,150,282,308 SC $544,291,398
CO $538,669,174 MN $668,242,481 SD $213,511,174
CT $487,480,166 MS $415,257,720 TN $701,516,776
DE $158,666,838 MO $830,647,063 TX $2,803,249,599
DC $267,617,455 MT $246,599,815 UT $292,231,904
FL $1,794,913,566 NE $278,897,762 VT $150,666,577
GA $1,141,255,941 NV $270,010,945 VA $890,584,959
HI $199,866,172 NH $181,678,856 WA $739,283,923
ID $219,528,313 NJ $1,335,785,100 WV $290,479,108
IL $1,579,965,373 NM $299,589,086 WI $716,457,120
IN $836,483,568 NY $2,774,508,711 WY $186,111,170
IA $447,563,924 NC $909,397,136 U.S. Territories
$238,045,760
KS $413,837,382 ND $200,318,301
KY $521,153,404 OH $1,335,600,553 Total $38,101,898,173
Sources: USA Today, 2/17/09; House Transportation and Infrastructure Committee; the Associated Press.

Infrastructure Stimulus Spending By State: Top 25 States ($ Millions)
$890
.6$8
90.3
$836
.5$8
30.6
$739
.3$7
16.5
$704
.9$7
01.5
$668
.2
$648
.9$6
03.9
$544
.3$5
38.7
$538
.6
$1,3
35.8
$1,5
80.0
$909
.4$1
,141
.3
$1,1
50.3
$1,3
35.6
$1,5
25.0
$2,8
03.2
$2,7
74.5
$1,7
94.9
$3,9
17.7
$0
$500
$1,000
$1,500
$2,000
$2,500
$3,000
$3,500
$4,000
$4,500
CA TX NY FL IL PA NJ OH MI GA NC VA MA IN MO WA WI MD TN MN AZ AL SC CO LA
Stim
ulus
Dol
lars
($ M
ill)
Sources: USA Today 2/19/09; House Transportation and Infrastructure Committee; the Associated Press.
Infrastructure spending is in the stimulus package total
$38.1B, allocated largely by population size

Infrastructure Stimulus Spending By State: Bottom 25 States ($ Millions)
$278
.9$2
70.0
$267
.6$2
46.6
$240
.5$2
38.0
$219
.5$2
13.5
$200
.3$1
99.9
$192
.9$1
86.1
$181
.7$1
74.3
$158
.7$1
50.7
$413
.8
$447
.6
$290
.5$2
92.2
$299
.6$405
.5
$415
.3$521
.2$4
87.5
$453
.8$535
.4
$0
$100
$200
$300
$400
$500
$600
OK KY
CT
OR IA MS
KS
AR
NM UT
WV NE
NV
DC
MT
AK
U.S
. Ter
r. ID SD
ND HI
RI
WY
NH
ME
DE
VT
Stim
ulus
Dol
lars
($ M
ill)
Sources: USA Today 2/19/09; House Transportation and Infrastructure Committee; the Associated Press.
Infrastructure spending is in the stimulus package total
$38.1B, allocated largely by population size
Expected Number of Jobs Gained or
Preserved by Stimulus Spending
Larger States = More JobsWorkers Comp Benefits

Estimated Job Effect of Stimulus: Jobs Created/Saved By State = 3.5 Mill Total
State Jobs Created State Jobs Created State Jobs CreatedAL 52,000 LA 50,000 OK 40,000
AK 8,000 ME 15,000 OR 44,000
AZ 70,000 MD 66,000 PA 143,000
AR 32,000 MA 79,000 RI 12,000
CA 396,000 MI 109,000 SC 50,000
CO 60,000 MN 66,000 SD 10,000
CT 41,000 MS 30,000 TN 71,000
DE 11,000 MO 69,000 TX 269,000
DC 12,000 MT 11,000 UT 32,000
FL 207,000 NE 23,000 VT 8,000
GA 107,000 NV 34,000 VA 93,000
HI 16,000 NH 16,000 WA 75,000
ID 17,000 NJ 100,000 WV 20,000
IL 148,000 NM 22,000 WI 70,000
IN 75,000 NY 215,000 WY 8,000
IA 37,000 NC 105,000
KS 33,000 ND 9,000
KY 48,000 OH 133,000 Total 3,467,000
Sources: http://www.recovery.gov/; Council of Economic Advisers; Insurance Information Institute.
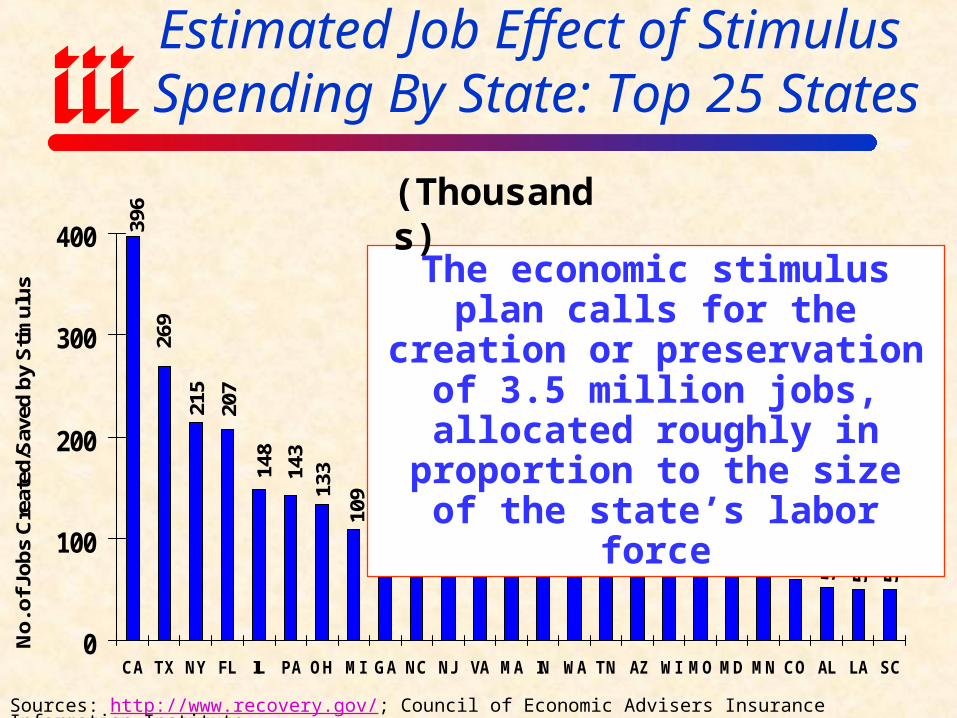
Estimated Job Effect of Stimulus Spending By State: Top 25 States
9379 75 75 71 70 70 69 66 66 60 52 50 50
13314
8
100
105
107
109
143
269
215
207
396
0
100
200
300
400
CA TX NY FL IL PA OH MI GA NC NJ VA MA IN WA TN AZ WI MO MD MN CO AL LA SC
No.
of J
obs
Cre
ated
/Sav
ed b
y S
timul
us
Sources: http://www.recovery.gov/; Council of Economic Advisers Insurance Information Institute.
The economic stimulus plan calls for the creation or preservation of 3.5 million jobs, allocated roughly
in proportion to the size of the state’s labor force
(Thousands)
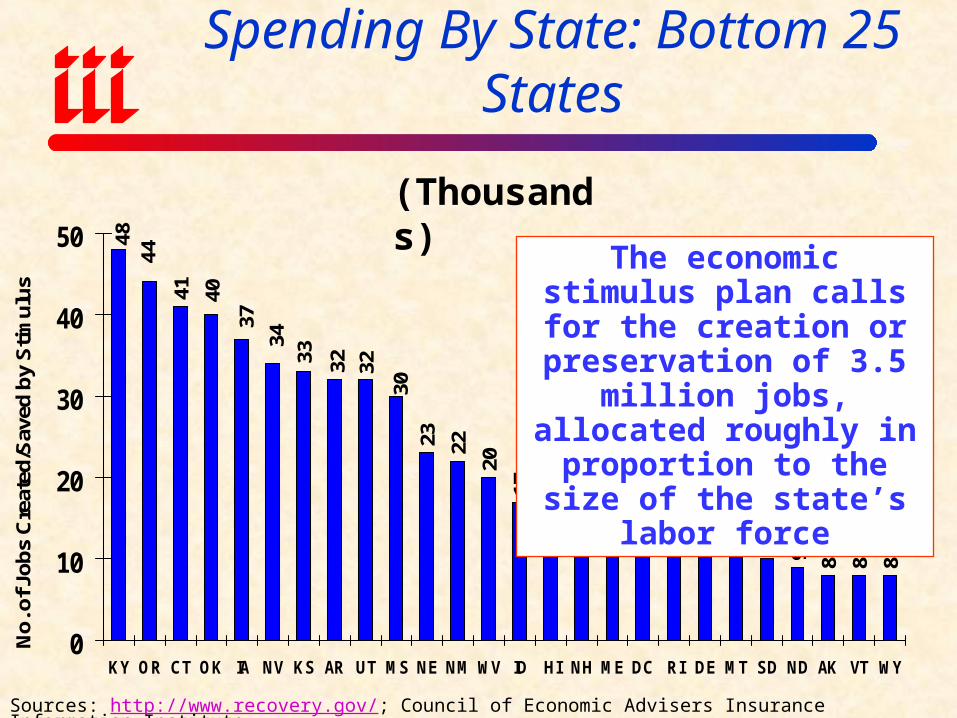
2220
17 16 16 1512 12 11 11 10 9 8 8 8
33
37
2330
3232
34
44
41 40
48
0
10
20
30
40
50
KY OR CT OK IA NV KS AR UT MS NE NM WV ID HI NH ME DC RI DE MT SD ND AK VT WY
No.
of J
obs
Cre
ated
/Sav
ed b
y S
timul
usEstimated Job Effect of Stimulus
Spending By State: Bottom 25 States
(Thousands)
Sources: http://www.recovery.gov/; Council of Economic Advisers Insurance Information Institute.
The economic stimulus plan calls for the creation or
preservation of 3.5 million jobs, allocated roughly in
proportion to the size of the state’s labor force

Stimulus: Reading The Economic Tea Leaves for the Next 4 to 8 Years
Source: Insurance Information Institute
• Growing Role of Government: 2009 Stimulus Package and Other Likely Spending Initiatives Guarantee that Government Will Play a Much Larger Role Than at Any Other Time in Recent History Every industry, including insurance, will and must attempt to
maximize direct and indirect benefits from this paradigm shift• Obama Administration Priorities: Stimulus Package
Acts as “Economic Tea Leaf” on the Administration’s Fiscal Priorities for the Next Several Years
• These Include: Alternative Energy Health Care Education Aging/New Infrastructure Aid to States
• Stimulus is Only One Leg of the Stool (1) Stimulus; (2) Housing, and (3) Financial Services Reform

FINANCIAL STRENGTH & CAPACITY
Industry Has Weathered the Storms Well; Insurers Have Capacity to Accommodate
Stimulus Spending

Summary of A.M. Best’s P/C Insurer Ratings Actions in 2008*
Under Review, 63 , 4.3%
Upgraded, 59 , 4.0%
Initial, 41 , 2.8%
Other, 59 , 4.0%
Affirm, 1,183 , 81.0%
Downgraded, 55 , 3.8%
*Through December 19.Source: A.M. Best.
30
Despite financial market turmoil, high cat losses and a soft market in 2008, 81% of ratings actions by A.M. Best
were affirmations; just 3.8% were downgrades
and 4.0% upgrades
P/C insurance is by design a resilient in business. The dual threat of financial
disasters and catastrophic losses are
anticipated in the industry’s risk
management strategy.
$0
$50
$100
$150
$200
$250
$300
$350
$400
$450
$500
$550
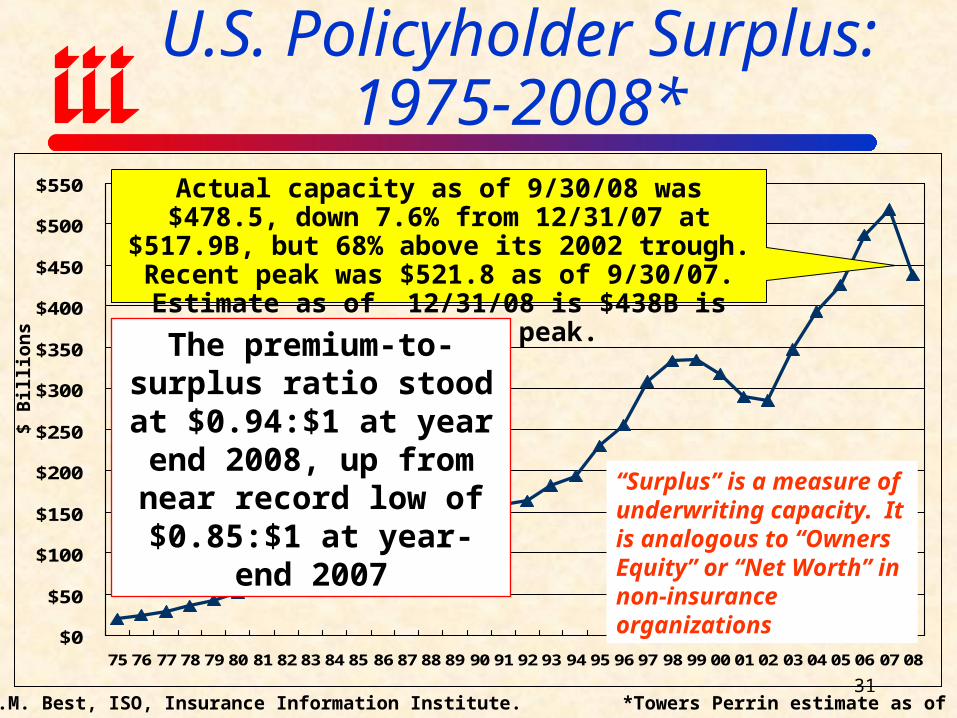
75 76 77 78 79 80 81 82 83 84 85 86 87 88 89 90 91 92 93 94 95 96 97 98 99 00 01 02 03 04 05 06 07 08
U.S. Policyholder Surplus: 1975-2008*
Source: A.M. Best, ISO, Insurance Information Institute. *Towers Perrin estimate as of 12/31/08
$ B
illi
ons
“Surplus” is a measure of underwriting capacity. It is analogous to “Owners Equity” or “Net Worth” in non-insurance organizations
Actual capacity as of 9/30/08 was $478.5, down 7.6% from 12/31/07 at $517.9B, but 68% above its 2002
trough. Recent peak was $521.8 as of 9/30/07. Estimate as of 12/31/08 is $438B is 16% below 2007
peak.
The premium-to-surplus ratio stood at $0.94:$1 at year end 2008, up from
near record low of $0.85:$1 at year-end 2007
31
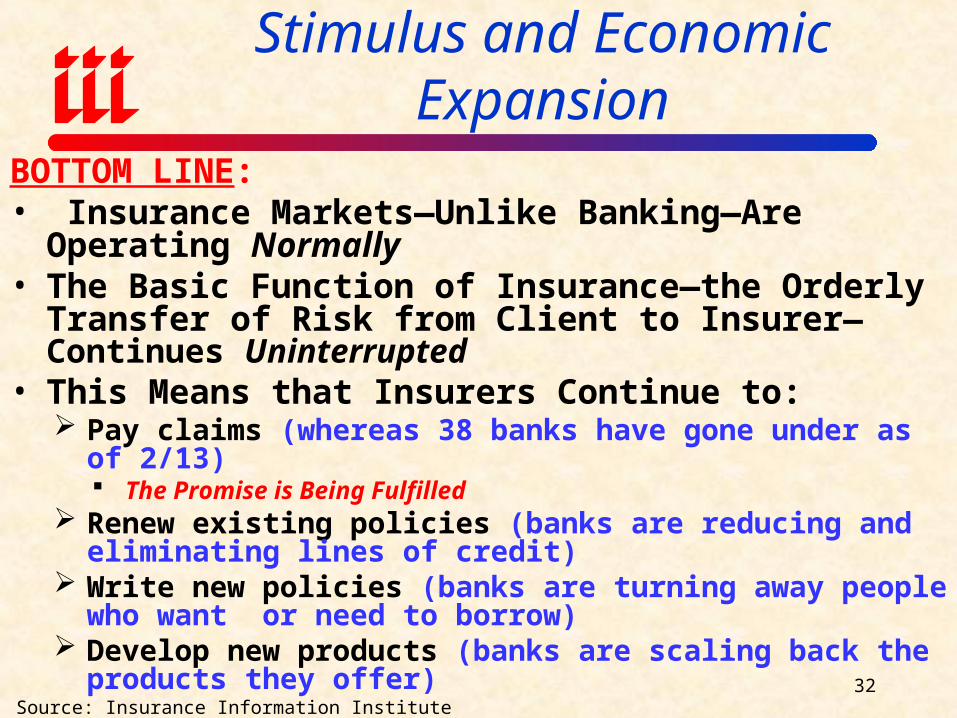
Insurers Can Accommodate Stimulus and Economic Expansion
BOTTOM LINE:• Insurance Markets—Unlike Banking—Are Operating
Normally• The Basic Function of Insurance—the Orderly Transfer
of Risk from Client to Insurer—Continues Uninterrupted• This Means that Insurers Continue to:
Pay claims (whereas 38 banks have gone under as of 2/13) The Promise is Being Fulfilled
Renew existing policies (banks are reducing and eliminating lines of credit)
Write new policies (banks are turning away people who want or need to borrow)
Develop new products (banks are scaling back the products they offer)
Source: Insurance Information Institute32

Insurance Information Institute On-Line
33