insurtech sector report - gca advisors · publicly traded insurtech companies are up 20% over the...
TRANSCRIPT

INSURTECH SECTOR REPORTQ1 2018

2
Strong sector and product expertise across InsurTechGCA INSURANCE TECHNOLOGY OVERVIEW
Companies that focus on customer engagement, e.g., customer acquisition, sales and marketing, mobile solutions and other direct-to-consumer insurance channels, or other solutions that improve distribution or facilitate contact with the end consumer.
DISTRIBUTION & CUSTOMER ENGAGEMENT
RECENT INSURTECH TRANSACTIONS
REPRESENTATIVE FOCUS AREAS FINTECH TEAM
This tends to mean, actual insurance companies that are tech-enabled in some way. These insurers bring technology to traditionally low-tech areas by using newer or superior core systems and/or online/ mobile offerings.
INNOVATIVE PRODUCTS, PRICING & UNDERWRITING
Insurance is behind the curve in enterprise-level core technology, and InsurTech companies help modernize these operating systems, in particular policy, claims, and billing software systems.
POLICY ADMINISTRATION, CLAIMS & BACK OFFICE
This includes companies that provide analytic capabilities to insurance companies to help them operate more efficiently and/or make better underwriting decisions.DATA & ANALYTICS
Strategic Investment
We Advised ControlExpert We Advised AWL
Acquired by
We Advised INS Web
Acquisition of
We Advised Finanzen.de
Acquired by
Sold
To
We Advised RGI Shareholders
Tender Offer for
Asahi Fire & MarineInsurance Co.
We Advised Asahi (close pending)
Acquired by
We Advised INS Web
Preferred Stock Investmentfrom
Financial Advisor
SEAN MINNIHANManaging DirectorHead of [email protected]
STEVE FLETCHERManaging DirectorHead of [email protected]
CHRIS GOUGHManaging DirectorM&A/Real Estate & Mortgage [email protected]
KEGAN [email protected] 415.318.3686
DAVID KRUEGERVice PresidentCapital Markets [email protected]
We Advised BlackFin
Sold
To

3
CASE STUDY: SALE OF FINANZEN GROUP TO ELI GLOBAL
GCA advised the shareholders of Finanzen Group on its sale to Eli Global
GCA Value-Add
• GCA acted as exclusive financial adviser to BlackFin Capital Partners and the founders on the sale of Finanzen to Eli Global
• GCA advised on all aspects of the transaction, coordinating multiple highly interested strategic and financial investors and maintaining a competitive dynamic throughout the process
• Eli Global evolved as the most attractive partner due to a global footprint in the insurance sector
• Eli Global is a federation of over 100 independent technology, insurance, financial services and healthcare portfolio companies across 18 countries
Background
• Headquartered in Berlin, Germany, Finanzen Group (“Finanzen” or the “Company”) connects lead generators, such as online price comparison sites, with lead buyers, such as independent financial advisors and insurance agents
• Finanzen’s online marketplace allows leads to be traded in real-time, bridging the gap between online insurance consumers and the offline sales organizations of European carriers and brokers
• Additionally, the Company acts as an online broker for certain insurance products
Transaction Rationale / Details
• Finanzen and its majority shareholder, BlackFin Capital Partners, sought a strategic partner with an international footprint and relevant InsurTech experience to accelerate the Company’s growth
• Company shareholders aimed to realize a valuation reflecting Finanzen‘s strong growth, significant market potential and unique competitive positioning
Transaction DateFebruary 2018
Deal TypeM&A
IndustryInsurTech
To
Sold
GCA Advised BlackFin and the founders

4
EXECUTIVE SUMMARYQ1 2018 InsurTech wrap-up
• InsurTech key themes
• Market update and analysis
• Sector and transaction data
We take a deep dive into the numbers to understand what is
driving deal dynamics in the InsurTech sector.
In this report we cover:
Key Themes Commentary
…As do innovative partnerships
between InsurTechs and disruptors across multiple
categories
While incumbent M&A activity has
skyrocketed…
• So far this year, six of seven announced transactions above $1Bn in value among U.S. financial services firms involved insurers
• Total value of $27.4Bn in Q1 ‘18, surpassing values for all of ’16 and ‘17*
…But financings and corporate venture
capital activity abound…
• Over 50 financings in Q1 ’18, on pace with ~200 in ‘17• 120 corporate venture deals in ‘17, ~30% of which happened in Q4 ‘17
- AXA and MassMutual lead the pack with 8 InsurTech investments each, followed by XL and Munich Re with 6 each
- Non-insurers like Softbank, Google Ventures, Salesforce continue to invest in InsurTech
• Partnerships across complimentary technologies and ecosystems continue, including real estate (Hippo / Roostify), smart home (Ring / Roost), cyber risk (Cyence / Zeguro), travel (AIG / Expedia) and auto (Chubb / Grab)
• A number of insurers are partnering with car subscription and sharing programs in certain markets, with the goal of maximizing convenience and eliminating the need to choose and manage “ancillary” services like insurance
Notes:Source: CB Insights.*Excludes health insurance deals.
• A recent CB Insights / Willis Towers survey revealed that only 12% of insurance professionals with knowledge of their company's innovation strategy believe acquisitions are their organization's primary outlet for innovation, while 48% highlighted a build strategy and 40% highlighted a partnership strategy
• As the InsurTech landscape is evolving rapidly, insurers prefer to build nimble partnerships and monitor what will happen next vs. committing to technologies via M&A
• The investor base of a traditional insurer tends to be risk averse regarding “testing the waters” of new technologies
…InsurTechs have not been playing a
major role in M&A…

5
IoT / Telematics
Online DistributionPolicy Management Tools / Software
Innovative / Specialty Insurance
Claims Management Tools / Software
Employee Benefits Admin / InsuranceExchange Technology
Data / Analytics Peer-to-Peer (“P2P”)
Sales, Marketing & Engagement
Customer Origination
Mobile
Distribution / Comparison Health Insurance Carrier Affiliated / New Carriers
Auto Health
Home
EXECUTIVE SUMMARYInsurTech landscape/ ecosystem – selected, representative companies Le
gend
Distribution & CustomerEngagement
Products, Pricing & Underwriting
Data & AnalyticsPolicy Admin, Claims & Back Office
Insurance Value Chain
DISCLAIMER: This is only a representative list and may not include all relevant companies. If your company is not on the list and would like to be added for future publications, kindly shoot us a note at [email protected] and we would be happy to consider.

6
EXECUTIVE SUMMARY2018 is off to a great start for insurance M&A
Notes:Source: CB Insights.

7
Most Active Insurance Technology Investors
Accelerators / Seed
Venture Capital / Private Equity
Corporate Investors
Alternative Investors
Ventures
EXECUTIVE SUMMARYSelected active investors in InsurTech
Notes:Source: CB Insights, Pitchbook.

8
EXECUTIVE SUMMARYCorporate venture capital is on the rise
Notes:Source: CB Insights.

9
EXECUTIVE SUMMARYMost active InsurTech investors – corporate venture capital
CurrentInsurTech
Investments
#8 8 6 6
5 5 45 4 3
Healthcare
Good Doctor
6*
Notes:Source: Wall Street Research, Capital IQ, Pitchbook.* Softbank rumored talks with PolicyBazaar and Swiss Re.

10
BankTech & InsurTech
Drones PropertyMgmt.
Smart Home Cyber Risk
Partnerships across complimentary technologies and ecosystemsEXECUTIVE SUMMARY
Retail * TravelInsurance
Auto
Notes:Source: Wall Street Research, Capital IQ, Pitchbook.* Softbank rumored talks with PolicyBazaar and Swiss Re; Walmart rumored talks with Humana.

11
InsurTech is blending into and integrating with the real estate industryEXECUTIVE SUMMARY
Partnering with apartments,
agencies
Partnering with large property
developers
Partnering with mortgage platforms
Landlord / Tenant Startups in title insurance
Notes:Source: CB Insights.

12
Insurers and car subscriptionsEXECUTIVE SUMMARY
Automakers
Non-automakers / Startups
» Central to the convenience with these programs is eliminating the need to choose and manage ancillary services like insurance
» These services are mostly piloting in a limited number of markets for the time being. But such experiments are worth keeping an eye on for the broader P&C insurance industry
Insurers Partnering with US Car Sub and Sharing ProgramsUS programs as of February 2, 2018*
Notes:Source: CB Insights.*Graphic is illustrative, not exhaustive.

13
INSURTECH DEAL DASHBOARD
Notes:Source: CB Insights, Pitchbook. CapIq. GCA Deal Database.Market data as of 3/31/18.(1) Includes private company equity financings.(2) Represents unweighted average, except for S&P 500.
Publicly traded InsurTech companies are up 20% over the LTM period, as compared to 12% for the S&P 500. Both financing volumeand number of transactions for Q1 ‘18 are up vs. Q3 & Q4 ’17
Lege
nd
P&C Life Health Distribution & CustomerEngagement
Products, Pricing & Underwriting
Data & AnalyticsPolicy Admin, Claims & Back Office
Insurance Segment Insurance Value Chain
Percent Change(2) Select Q1 Financing Transactions ($MM)
Subsector LTM 3 Years Date Company Selected Investors Amt. Sub-Sector
27% 52%
15% 38%
16% 42%
11% 28%
6% 7%
30% 57%
16% 34%
11% 13%
46% 61%
InsurTech Deal Volume by Stage Aggregate InsurTech Market 20% 37%
S&P 500 12% 24%
3/28/18 $165
3/27/18
2/28/18 $110
Insurance Technology Deal Dashboard(1) Industry Stock Market Performance$2.5 Bn | 207 Deals
LTM InsurTech Financing Volume(1)
Trends in InsurTech
2/20/18 $60
Quarterly InsurTech Financing Activity ($MM)(1)
1/10/18 $30
$51
$398 $230 $271 $283
$985
$312
$521
$718
Q2-16 Q3-16 Q4-16 Q1-17 Q2-17 Q3-17 Q4-17 Q1-18
Benefits Administration/Payroll
Property & Casualty
Health
Insurance Technology
Life
Brokerage & Distribution
Information Services
Financial SaaS
IT & BPO Services
1
2
8
9
7
6
5
4
3
51
64
$6.5$15.4$7.4$6.3$6.1$11.7 $14.1
34 3843
38
48
Average Deal Amount ($MM)
45
$11.6
41% 42% 48% 50%38%
19% 23% 19% 26%36%
16% 15% 10%12% 18%24% 20% 23% 12% 8%
2014 2015 2016 2017 Q1 2018
Seed/Angel Series A Series B Series C+

14
INSURTECH SELECTED PUBLIC COMPANY LANDSCAPESelected InsurTech subsectors and key operating stats ($Bn)
Notes:Source: CapIq.Revenue growth and EBITDA margins shown are median values for comp group.Market data as of 3/31/18.
Benefits Administration/Payroll
Combined Market Cap.: $10218/17 Rev. Growth: 13%18 EBITDA Margin: 21%
2Insurance Technology
Combined Market Cap.: $3318/17 Rev. Growth: 16% 18 EBITDA Margin: 13%
1 Brokerage & Distribution
Combined Market Cap.: $12318/17 Rev. Growth: 9%18 EBITDA Margin: 23%
3
Property & Casualty
Combined Market Cap.: $41418/17 Rev. Growth: 5% 18 EBITDA Margin: 13%
4 Life
Combined Market Cap.: $41818/17 Rev. Growth: 4% 18 EBITDA Margin: 14%
5 Health
Combined Market Cap.: $43818/17 Rev. Growth: 6%18 EBITDA Margin: 7%
6
Information Services
Combined Market Cap.: $32618/17 Rev. Growth: 7% 18 EBITDA Margin: 30%
7 IT & BPO Services
Combined Market Cap.: $60218/17 Rev. Growth: 9% 18 EBITDA Margin: 17%
8 Financial SaaS
Combined Market Cap.: $11718/17 Rev. Growth: 19%18 EBITDA Margin: 20%
9

15
INSURTECH STOCK PRICE PERFORMANCE
3 Year Share Price Performance
LTM Share Price Performance
Notes:Source: CapIq. Market data as of 3/31/18.
InsurTech shows strong performance over the last three years and the LTM period
6) Health1) Insurance Technology 2) Benefits Administration/Payroll
3) Brokerage & Distribution 5) Life4) Property & Casualty 7) Information Services 8) IT & BPO Services 9) Financial SaaS

16
-5%
0%
5%
10%
15%
20%
0.0x 1.0x 2.0x 3.0x 4.0x 5.0x 6.0x 7.0x 8.0x0.0x
3.0x
6.0x
9.0x
2015 2016 2017 2018 (NTM)
0.0x
3.0x
6.0x
9.0x
2015 2016 2017 2018 (LTM)
INSURTECH PUBLIC COMPANY VALUATIONInsurTech is trading at 2.2x NTM revenues, despite having a stronger growth profile than other subsectors
Notes:Source: CapIq.Market data as of 3/31/18.Lines display median multiples across comp groups for given year.
Enterprise Value / LTM RevenueEnterprise Value / LTM Revenue
Median NTM Revenue Growth to EV / NTM Revenue MultipleEnterprise Value / NTM Revenue
1
2
3
4
5
6 78
9
2.0x 2.2x 2.1x 2.2x
2.0x 2.1x2.5x 2.2x
6) Health1) Insurance Technology 2) Benefits Administration/Payroll
3) Brokerage & Distribution 5) Life4) Property & Casualty 7) Information Services 8) IT & BPO Services 9) Financial SaaS

17
0%
5%
10%
15%
20%
25%
30%
35%
0.0x 6.0x 12.0x 18.0x 24.0x 30.0x0.0x
5.0x
10.0x
15.0x
20.0x
25.0x
30.0x
2015 2016 2017 2018 (NTM)
0.0x
7.0x
14.0x
21.0x
28.0x
35.0x
2015 2016 2017 2018 (LTM)
INSURTECH PUBLIC COMPANY VALUATION (CONT’D)On an EBITDA basis, InsurTech has performed very well on both an EV/ LTM EBITDA and EV/ NTM EBITDA basis
Notes:Source: CapIq.Market data as of 3/31/18.Lines display median multiples across comp groups for given year.
Enterprise Value / LTM EBITDAEnterprise Value / LTM EBITDA
Median NTM EBITDA Growth to EV / NTM EBITDA MultipleEnterprise Value / NTM EBITDA
1
23
4
5
68
7
9
9.3x11.5x
13.5x12.7x
9.2x10.0x
12.3x 12.2x
6) Health1) Insurance Technology 2) Benefits Administration/Payroll
3) Brokerage & Distribution 5) Life4) Property & Casualty 7) Information Services 8) IT & BPO Services 9) Financial SaaS

18
Long-term growth is not necessarily correlated with public company P/E multiples or PEG ratios(1)
INSURTECH PUBLIC COMPANY VALUATION (CONT’D)
Notes: (1) PEG ratio defined as 2018E price/earnings ratio divided by estimated long-term EPS growth rate.Figures represent medians of sub-sectors.Market data as of 3/31/18.Long-term EPS growth covers last 5 years.
25.0%
18.5%
13.5%
11.2%
12.6%
9.9%
14.2%
10.5%
9.5%
1.9
2.1
2.2
2.1
1.4
1.7
1.2
1.3
1.3
2018 P/E Multiple 2018 PEG Ratio
Long-Term EPS Growth
Life5
Benefits Admin/Payroll2
Financial SaaS9
Information Services7
Insurance Technology1
Health6
IT & BPO Services8
Property & Casualty4
Brokerage & Distribution3
9.3x
12.5x
15.2x
17.4x
17.9x
21.2x
26.0x
27.4x
37.7x
0.0x 5.0x 10.0x 15.0x 20.0x 25.0x 30.0x 35.0x 40.0x

19
3/28/188VC, Brian Singerman, capitalG, Fidelity Investments, Founders Fund, General
Catalyst, Khosla Ventures, Thrive Capital, Verily Life SciencesSeries D $165.0
3/28/18 Bank Hapoalim, D.E. Shaw & Co., Moneta Seeds, Vertex Ventures Israel Series A $5.0
3/27/18 Redpoint Ventures, Ribbit Capital, Scale Venture Partners, Silicon Valley Bank Series C $51.0
3/26/18 AMP New Ventures, OneVentures, SEEK Series B $6.2
3/23/18Black Pearls VC, Concentric, London Co-Investment Fund, National Centre for
Research and DevelopmentSeries A $3.1
3/22/18Bloomberg Beta, Fenbushi Capital, Fidelity Investments, FuturePerfect
Ventures, GMP Securities, Graphene Ventures, Rakuten VenturesSeries A $10.4
3/15/18 Undisclosed Series A $5.2
3/14/18 HCS Capital Partners Series B $4.0
3/11/18 ClearSky Security, MassMutual Ventures, Glilot Capital Series A $11.0
3/7/18 8VC, Barry Sternlicht, Bienville Capital, Menlo Ventures Series B $33.0
3/6/18 Aegon NV VC $7.6
3/6/18Bain Capital Ventures, FirstMark Capital, Index Ventures, Redpoint Ventures,
Thrive CapitalSeries D $40.0
3/1/18Core Innovation Capital, Green Visor Capital, Jean Chatzky, Kairos Society
Ventures, NextView VenturesSeed VC $2.8
2/28/18Founders Fund, Google Ventures, Maverick Ventures, Mubadala Investment
Co, New Enterprise Associates, Sun Life FinancialSeries D $110.0
2/28/18 Deep Nishar, Ribbit Capital, Sam Altman, Valor Equity Partners, VY Capital Series A $10.0
2/21/18A Capital, Canvas Ventures, Correlation Ventures, Northwestern Mutual Future
Ventures, Project A Ventures, Securian Financial GroupSeries A $9.5
2/20/18Aflac Corporate Ventures, BlueCross BlueShield Venture Partners, MassMutual
VenturesSeries B $4.0
SELECTED RECENT GROWTH EQUITY & VC ACTIVITY
Notes: Source: CapIq. Pitchbook.Selected deals from Q1 2018.
Date
Announced Target Investors Type Amount ($MM)

20
2/20/18 Lemhi Ventures Series A $60.0
2/16/18500 Startups, August Capital, Chicago Ventures, Commerce Ventures, Omidyar
Network, Portag3 VenturesSeries A $13.1
2/14/18Aspect Ventures, Fintech71, LOUD Capital, NCT Ventures, Pete Kight, Precursor
Ventures, Rev1 Ventures, Revolution, Social CapitalSeries A $3.0
2/14/18 HanFor Holdings Series A - II $3.2
2/13/18 Sinai Ventures Series A $5.9
2/1/18 Sound Ventures Series B $39.3
1/23/18500 Startups, CVC Capital Partners, Nikko Asset Management, Tokio Marine
CapitalSeries B $13.3
1/22/18 Comcast Ventures, Fifth Wall Ventures, Plug and Play Ventures Series B $25.0
1/16/18 American Discovery Capital Series A - II $6.0
1/16/18 Elephant Venture Capital, Simon Nixon Series A $12.0
1/10/18Canaan Partners, Lightspeed Venture Partners, Nyca Partners, RRE Ventures,
Thomvest VenturesSeries B $30.0
1/9/18Hangzhou Win-Light Investment, Legend Star, Neovision Capital, Origins
Capital, QF Capital, Yonyou Happiness Capital ManagementSeries A - II $7.7
1/8/18 Andy Homer, Force Over Mass Capital, Pentech Ventures Series A $2.7
1/3/18 NextView Ventures, Plug and Play Ventures Series A $3.3
1/2/18 500 Startups, 8VC, Compound, Merus Capital Series A $6.0
1/2/18 Oak HC/FT Partners Series A $11.5
SELECTED RECENT GROWTH EQUITY & VC ACTIVITY (CONT’D)
Date
Announced Target Investors Type Amount ($MM)
Notes: Source: CapIq. Pitchbook.Selected deals from Q1 2018.

21
SELECTED M&A ACTIVITY
Notes: Source: CapIq. Pitchbook.
Date Enterprise EV / Revenue EV / EBITDA
Announced Acquirer Target Value ($MM) LTM LTM
Cynosure Software
4/4/2018 NA NA NA
3/22/2018 $33 1.7x NA
3/5/2018 $15,157 1.3x 13.8x
2/7/2018 $22 NA NA
1/29/2018 $18 ~5.0x NA
1/29/2018 $37 NA NA
1/29/2018 $414 NA NA
1/22/2018 $155 NA NA
1/16/2018 $51 NA NA
1/9/2018 NA NA NA
12/11/2017 $2,178 2.0x NA
11/30/2017 $280 NA NA
10/18/2017 $2,488 NA NA
10/6/2017 $275 NA NA
10/2/2017 $63 NA NA
9/28/2017 $1,741 1.5x NA
9/21/2017 $3,031 NA NA
9/6/2017 $60 NA NA

22
8/24/2017 $151 NA NA
8/21/2017 Sequel $324 9.8x 21.3x
8/4/2017 $490 7.5x 49.3x
7/27/2017 $107 NA NA
7/27/2017 $919 NA NA
6/8/2017 NA NA NA
5/24/2017 $95 2.4x NA
5/15/2017 NA NA NA
5/8/2017 $560 NA NA
4/27/2017 $115 NA NA
4/6/2017 $50 NA NA
4/4/2017 $225 4.7x NA
3/31/2017 $102 1.3x NA
2/16/2017 $160 3.9x NA
2/9/2017 $50 NA NA
1/9/2017 $150 2.5x NA
Median 2.4x 21.3x
SELECTED M&A ACTIVITY (CONT’D)
Notes: Source: CapIq. Pitchbook.
Date Enterprise EV / Revenue EV / EBITDA
Announced Acquirer Target Value ($MM) LTM LTM

23
SELECTED PUBLIC COMPANY DETAIL
Notes: Source: CapIq. Pitchbook.Multiples based on CapIq Consensus Estimates. Multiples <0 and >100 considered NM.
Bnft
s Adm
in./
Payr
oll
Insu
ranc
e Te
ch.
Brok
erag
e &
Dis
trib
.
Insurance TechnologyVerisk Analytics, Inc. $104.00 $17,162 $20,025 12% 2.2 7% 11% 4% 10% 49% 9.4x 8.5x 19.2x 17.5x 32.7x 26.0xGuidewire Software, Inc. $80.83 $6,459 $5,954 8% 10.6 26% 19% 30% 11% 20% 10.5x 8.8x 50.3x 45.2x 91.5x 84.7xHealthEquity, Inc. $60.54 $3,690 $3,450 33% 1.8 28% 24% 31% 33% 39% 15.2x 12.3x 42.0x 31.6x 91.5x 59.8xEbix, Inc. $74.50 $2,346 $2,665 15% 1.3 19% 24% 10% 33% 37% 7.5x 6.0x 21.7x 16.3x 23.8x 19.8xCorVel Corporation $50.55 $954 $901 NA NA 3% NA 4% NA NA 1.7x NM 12.6x NM 30.1x NMBenefitfocus, Inc. $24.40 $764 $824 25% NA 10% 8% NA 46% 10% 3.2x 3.0x 45.4x 31.0x NM NMCrawford & Company $8.22 $460 $631 NA NA 2% (1%) (6%) 8% 11% 0.6x 0.6x 5.3x 4.9x 10.6x 10.2xSapiens International Corporation N.V. $8.53 $424 $431 5% 4.4 26% 10% (14%) 60% 15% 1.6x 1.4x 15.3x 9.6x NM 21.9xeHealth, Inc. $14.31 $271 $231 NA NA (9%) 29% NM NA 3% 1.4x 1.1x NM 30.3x NM NMMajesco $5.06 $185 $187 NA NA (0%) 19% (12%) 126% 8% 1.5x 1.3x 34.9x 15.4x NM 50.6xSymbility Solutions Inc. $0.31 $75 $69 NA NA 19% 14% NM 14% 6% 1.7x 1.5x 26.7x 23.3x NM NM
Median 14% 2.2 10% 16% 4% 33% 13% 1.7x 2.2x 24.2x 20.4x 31.4x 26.0x
Benefits Administration/PayrollAutomatic Data Processing, Inc. $113.48 $50,302 $50,528 14% 1.9 6% 8% (3%) 12% 21% 4.0x 3.7x 19.4x 17.4x 30.1x 25.5xPaychex, Inc. $61.59 $22,128 $21,764 9% 2.6 6% 8% 8% 2% 41% 6.7x 6.2x 15.4x 15.2x 26.8x 23.3xThe Ultimate Software Group, Inc. $243.70 $7,451 $7,296 26% 2.0 20% 19% 16% 28% 25% 7.8x 6.6x 34.0x 26.6x 67.4x 53.7xPaycom Software, Inc. $107.39 $6,343 $6,333 26% 2.7 31% 26% 41% 25% 31% 14.7x 11.7x 47.7x 38.0x 85.2x 69.6xHealthEquity, Inc. $60.54 $3,690 $3,450 33% 1.8 28% 24% 31% 33% 39% 15.2x 12.3x 42.0x 31.6x 91.5x 59.8xTriNet Group, Inc. $46.32 $3,245 $3,332 20% 1.9 7% 10% (15%) 18% 6% 1.0x 0.9x 17.6x 14.9x 48.3x 37.7xInsperity, Inc. $69.55 $2,921 $2,670 17% 1.4 12% 13% 23% 13% 5% 0.8x 0.7x 15.3x 13.5x 29.5x 22.9xPaylocity Holding Corporation $51.23 $2,695 $2,584 27% 2.2 30% 23% 98% 32% 20% 8.6x 7.0x 46.0x 34.8x 76.5x 60.3xWageWorks, Inc. $45.20 $1,792 $1,144 15% 1.5 32% 9% 35% 14% 32% 2.4x 2.2x 7.8x 6.9x 25.4x 22.2xBenefitfocus, Inc. $24.40 $764 $824 25% NA 10% 8% NA 46% 10% 3.2x 3.0x 45.4x 31.0x NM NMCastlight Health, Inc. $3.65 $494 $406 25% NA 28% 24% NA NA (7%) 3.1x 2.5x NM NM NM NM
Median 25% 1.9 20% 13% 23% 22% 21% 4.0x 3.7x 26.7x 22.0x 48.3x 37.7x
Brokerage & DistributionMarsh & McLennan Companies, Inc. $82.59 $41,924 $46,206 12% 1.6 5% 7% 9% 6% 24% 3.3x 3.1x 13.5x 12.7x 21.8x 19.0xAon plc $140.33 $34,564 $39,341 13% 1.3 (15%) 8% (5%) 13% 27% 4.0x 3.7x 15.6x 13.8x 21.5x 17.5xWill is Towers Watson Public Limited Company $152.19 $20,122 $23,627 11% 1.4 3% 5% 9% 11% 25% 2.9x 2.8x 12.2x 11.0x 18.1x 15.5xArthur J. Gallagher & Co. $68.73 $12,512 $14,964 15% 1.3 8% 10% 9% 12% 17% 2.5x 2.2x 14.6x 13.1x 23.0x 19.2xBrown & Brown, Inc. $25.44 $7,025 $7,403 (11%) NA 4% 5% 1% 2% 31% 4.0x 3.8x 12.7x 12.4x 27.4x 21.4xJardine Lloyd Thompson Group plc $17.99 $3,805 $4,334 13% 1.4 18% 12% NA 9% 21% 2.4x 2.1x 11.0x 10.1x 22.7x 18.2xMoneysupermarket.com Group PLC $4.03 $2,158 $2,111 6% 3.1 16% 5% 17% 2% 37% 4.7x 4.4x 12.1x 11.9x 18.0x 17.4xQuinStreet, Inc. $12.77 $590 $548 25% 2.0 8% 17% NM 57% 8% 1.7x 1.4x 26.7x 17.0x NM 49.7xeHealth, Inc. $14.31 $271 $231 NA NA (7%) 27% NA NA 9% 1.3x 1.0x NM 11.2x NM 14.8xiSelect Limited $0.78 $168 $142 NA NA 18% 9% 27% 14% 16% 0.9x 0.9x 5.9x 5.2x 13.0x 10.8x
Median 13% 1.4 7% 9% 9% 11% 23% 2.7x 2.5x 12.7x 12.2x 21.6x 17.9x
($MM, except per share data)Stock EPS Operating Metrics Trading MetricsPrice Equity Enterprise Long Term Revenue Growth EBITDA Growth EBITDA Margin EV / Revenue EV / EBITDA Price / EPS
Company 3/31/18 Value Value Growth PEG 17E/16A 18E/17E 17E/16A 18E/17E 18E 17E 18E 17E 18E 17E 18E
24
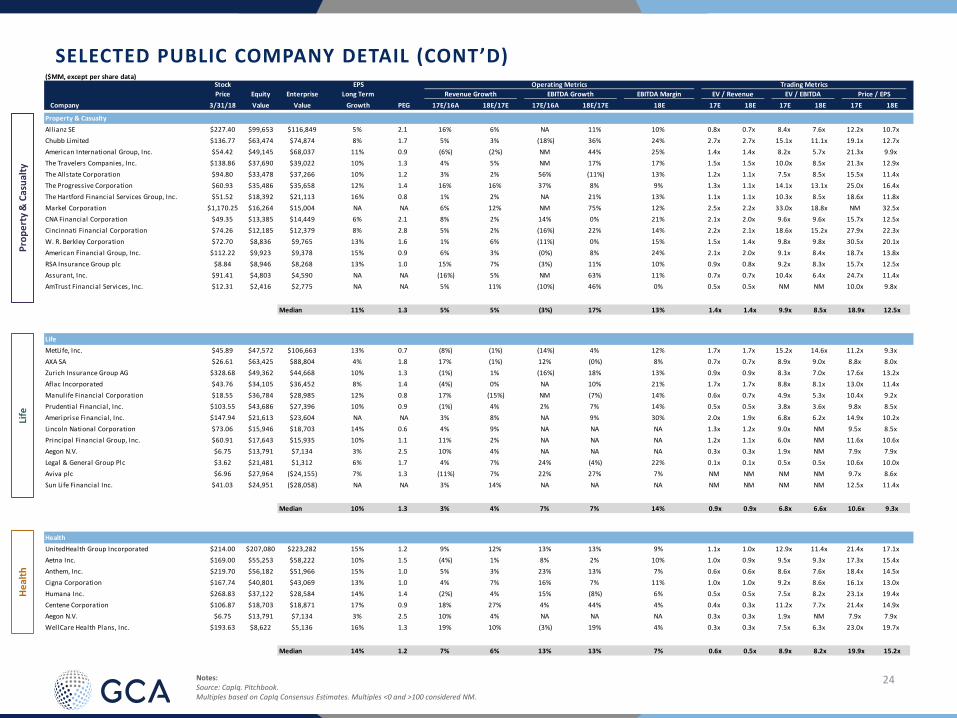
SELECTED PUBLIC COMPANY DETAIL (CONT’D)
Notes: Source: CapIq. Pitchbook.Multiples based on CapIq Consensus Estimates. Multiples <0 and >100 considered NM.
Prop
erty
& C
asua
ltyLi
feHe
alth
Property & CasualtyAllianz SE $227.40 $99,653 $116,849 5% 2.1 16% 6% NA 11% 10% 0.8x 0.7x 8.4x 7.6x 12.2x 10.7xChubb Limited $136.77 $63,474 $74,874 8% 1.7 5% 3% (18%) 36% 24% 2.7x 2.7x 15.1x 11.1x 19.1x 12.7xAmerican International Group, Inc. $54.42 $49,145 $68,037 11% 0.9 (6%) (2%) NM 44% 25% 1.4x 1.4x 8.2x 5.7x 21.3x 9.9xThe Travelers Companies, Inc. $138.86 $37,690 $39,022 10% 1.3 4% 5% NM 17% 17% 1.5x 1.5x 10.0x 8.5x 21.3x 12.9xThe Allstate Corporation $94.80 $33,478 $37,266 10% 1.2 3% 2% 56% (11%) 13% 1.2x 1.1x 7.5x 8.5x 15.5x 11.4xThe Progressive Corporation $60.93 $35,486 $35,658 12% 1.4 16% 16% 37% 8% 9% 1.3x 1.1x 14.1x 13.1x 25.0x 16.4xThe Hartford Financial Services Group, Inc. $51.52 $18,392 $21,113 16% 0.8 1% 2% NA 21% 13% 1.1x 1.1x 10.3x 8.5x 18.6x 11.8xMarkel Corporation $1,170.25 $16,264 $15,004 NA NA 6% 12% NM 75% 12% 2.5x 2.2x 33.0x 18.8x NM 32.5xCNA Financial Corporation $49.35 $13,385 $14,449 6% 2.1 8% 2% 14% 0% 21% 2.1x 2.0x 9.6x 9.6x 15.7x 12.5xCincinnati Financial Corporation $74.26 $12,185 $12,379 8% 2.8 5% 2% (16%) 22% 14% 2.2x 2.1x 18.6x 15.2x 27.9x 22.3xW. R. Berkley Corporation $72.70 $8,836 $9,765 13% 1.6 1% 6% (11%) 0% 15% 1.5x 1.4x 9.8x 9.8x 30.5x 20.1xAmerican Financial Group, Inc. $112.22 $9,923 $9,378 15% 0.9 6% 3% (0%) 8% 24% 2.1x 2.0x 9.1x 8.4x 18.7x 13.8xRSA Insurance Group plc $8.84 $8,946 $8,268 13% 1.0 15% 7% (3%) 11% 10% 0.9x 0.8x 9.2x 8.3x 15.7x 12.5xAssurant, Inc. $91.41 $4,803 $4,590 NA NA (16%) 5% NM 63% 11% 0.7x 0.7x 10.4x 6.4x 24.7x 11.4xAmTrust Financial Services, Inc. $12.31 $2,416 $2,775 NA NA 5% 11% (10%) 46% 0% 0.5x 0.5x NM NM 10.0x 9.8x
Median 11% 1.3 5% 5% (3%) 17% 13% 1.4x 1.4x 9.9x 8.5x 18.9x 12.5x
LifeMetLife, Inc. $45.89 $47,572 $106,663 13% 0.7 (8%) (1%) (14%) 4% 12% 1.7x 1.7x 15.2x 14.6x 11.2x 9.3xAXA SA $26.61 $63,425 $88,804 4% 1.8 17% (1%) 12% (0%) 8% 0.7x 0.7x 8.9x 9.0x 8.8x 8.0xZurich Insurance Group AG $328.68 $49,362 $44,668 10% 1.3 (1%) 1% (16%) 18% 13% 0.9x 0.9x 8.3x 7.0x 17.6x 13.2xAflac Incorporated $43.76 $34,105 $36,452 8% 1.4 (4%) 0% NA 10% 21% 1.7x 1.7x 8.8x 8.1x 13.0x 11.4xManulife Financial Corporation $18.55 $36,784 $28,985 12% 0.8 17% (15%) NM (7%) 14% 0.6x 0.7x 4.9x 5.3x 10.4x 9.2xPrudential Financial, Inc. $103.55 $43,686 $27,396 10% 0.9 (1%) 4% 2% 7% 14% 0.5x 0.5x 3.8x 3.6x 9.8x 8.5xAmeriprise Financial, Inc. $147.94 $21,613 $23,604 NA NA 3% 8% NA 9% 30% 2.0x 1.9x 6.8x 6.2x 14.9x 10.2xLincoln National Corporation $73.06 $15,946 $18,703 14% 0.6 4% 9% NA NA NA 1.3x 1.2x 9.0x NM 9.5x 8.5xPrincipal Financial Group, Inc. $60.91 $17,643 $15,935 10% 1.1 11% 2% NA NA NA 1.2x 1.1x 6.0x NM 11.6x 10.6xAegon N.V. $6.75 $13,791 $7,134 3% 2.5 10% 4% NA NA NA 0.3x 0.3x 1.9x NM 7.9x 7.9xLegal & General Group Plc $3.62 $21,481 $1,312 6% 1.7 4% 7% 24% (4%) 22% 0.1x 0.1x 0.5x 0.5x 10.6x 10.0xAviva plc $6.96 $27,964 ($24,155) 7% 1.3 (11%) 7% 22% 27% 7% NM NM NM NM 9.7x 8.6xSun Life Financial Inc. $41.03 $24,951 ($28,058) NA NA 3% 14% NA NA NA NM NM NM NM 12.5x 11.4x
Median 10% 1.3 3% 4% 7% 7% 14% 0.9x 0.9x 6.8x 6.6x 10.6x 9.3x
HealthUnitedHealth Group Incorporated $214.00 $207,080 $223,282 15% 1.2 9% 12% 13% 13% 9% 1.1x 1.0x 12.9x 11.4x 21.4x 17.1xAetna Inc. $169.00 $55,253 $58,222 10% 1.5 (4%) 1% 8% 2% 10% 1.0x 0.9x 9.5x 9.3x 17.3x 15.4xAnthem, Inc. $219.70 $56,182 $51,966 15% 1.0 5% 3% 23% 13% 7% 0.6x 0.6x 8.6x 7.6x 18.4x 14.5xCigna Corporation $167.74 $40,801 $43,069 13% 1.0 4% 7% 16% 7% 11% 1.0x 1.0x 9.2x 8.6x 16.1x 13.0xHumana Inc. $268.83 $37,122 $28,584 14% 1.4 (2%) 4% 15% (8%) 6% 0.5x 0.5x 7.5x 8.2x 23.1x 19.4xCentene Corporation $106.87 $18,703 $18,871 17% 0.9 18% 27% 4% 44% 4% 0.4x 0.3x 11.2x 7.7x 21.4x 14.9xAegon N.V. $6.75 $13,791 $7,134 3% 2.5 10% 4% NA NA NA 0.3x 0.3x 1.9x NM 7.9x 7.9xWellCare Health Plans, Inc. $193.63 $8,622 $5,136 16% 1.3 19% 10% (3%) 19% 4% 0.3x 0.3x 7.5x 6.3x 23.0x 19.7x
Median 14% 1.2 7% 6% 13% 13% 7% 0.6x 0.5x 8.9x 8.2x 19.9x 15.2x
($MM, except per share data)Stock EPS Operating Metrics Trading MetricsPrice Equity Enterprise Long Term Revenue Growth EBITDA Growth EBITDA Margin EV / Revenue EV / EBITDA Price / EPS
Company 3/31/18 Value Value Growth PEG 17E/16A 18E/17E 17E/16A 18E/17E 18E 17E 18E 17E 18E 17E 18E

25
SELECTED PUBLIC COMPANY DETAIL (CONT’D)
Notes: Source: CapIq. Pitchbook.Multiples based on CapIq Consensus Estimates. Multiples <0 and >100 considered NM.
Info
rmat
ion
Serv
ices
Information ServicesS&P Global Inc. $191.06 $47,643 $48,421 15% 1.5 6% 8% 14% 11% 49% 8.1x 7.5x 16.8x 15.2x 28.7x 22.4xRELX PLC $20.56 $40,771 $47,225 7% 2.4 18% 4% 19% 5% 35% 4.7x 4.5x 13.5x 12.9x 18.9x 17.5xMoody's Corporation $161.30 $30,826 $35,183 12% 1.8 14% 14% 19% 17% 49% 8.6x 7.5x 18.0x 15.4x 27.0x 20.9xThomson Reuters Corporation $38.61 $27,397 $33,697 8% 1.9 1% 1% 8% 1% 30% 3.0x 2.9x 9.9x 9.7x 15.8x 14.9xExperian plc $21.58 $19,556 $23,021 9% 2.3 (5%) 12% (1%) 8% 34% 5.4x 4.8x 15.1x 14.0x 24.1x 20.6xIHS Markit Ltd. $48.24 $18,441 $22,565 12% 1.8 30% 9% 40% 10% 39% 6.3x 5.8x 16.3x 14.8x 23.5x 21.2xVerisk Analytics, Inc. $104.00 $17,162 $20,025 12% 2.2 7% 11% 4% 10% 49% 9.4x 8.5x 19.2x 17.5x 32.7x 26.0xNielsen Holdings plc $31.79 $11,338 $19,123 8% 1.6 4% 4% 5% 1% 30% 2.9x 2.8x 9.4x 9.3x 12.1x 12.1xWolters Kluwer N.V. $53.21 $14,803 $17,287 8% 2.3 17% 0% 21% (0%) 27% 3.2x 3.2x 12.0x 12.0x 19.7x 18.2xEquifax Inc. $117.81 $14,152 $16,520 9% 2.1 6% 4% 9% (4%) 34% 4.9x 4.7x 13.4x 13.9x 19.9x 19.9xMSCI Inc. $149.47 $13,434 $14,622 14% 2.0 11% 13% 16% 19% 55% 11.5x 10.2x 22.1x 18.7x 39.0x 28.5xGartner, Inc. $117.62 $10,684 $13,424 16% 1.8 35% 26% 53% 11% 19% 4.1x 3.2x 19.2x 17.3x 34.1x 30.2xTransUnion $56.78 $10,441 $12,768 12% 2.1 12% 11% 17% 12% 39% 6.7x 6.0x 17.1x 15.4x 30.5x 24.6xInforma plc $10.09 $8,307 $10,163 4% 3.5 41% 5% 44% 6% 34% 4.3x 4.1x 13.0x 12.3x 16.1x 14.9xFactSet Research Systems Inc. $199.42 $7,782 $8,092 11% 2.1 11% 8% 14% (1%) 34% 6.4x 5.9x 17.2x 17.5x 26.5x 22.9xNews Corporation $15.80 $9,212 $7,637 14% 2.0 1% 1% 0% 4% 12% 0.9x 0.9x 8.2x 7.8x 35.8x 28.2xFair Isaac Corporation $169.37 $5,093 $5,663 16% 1.7 5% 7% 10% 21% 27% 6.0x 5.6x 24.8x 20.6x 34.2x 26.7xThe Dun & Bradstreet Corporation $117.00 $4,339 $5,575 8% 1.8 3% 1% 2% 4% 29% 3.2x 3.1x 11.1x 10.7x 16.3x 14.3xCoreLogic, Inc. $45.23 $3,688 $5,323 8% 2.2 (5%) 0% (6%) 1% 26% 2.9x 2.9x 11.4x 11.2x 19.4x 17.4xMorningstar, Inc. $95.52 $4,059 $3,886 NA NA 7% 4% (7%) 12% 29% 4.5x 4.3x 16.7x 14.9x 40.6x 33.6xEuromoney Institutional Investor PLC $17.18 $1,844 $2,065 NA NA 14% 3% 17% 4% 27% 3.6x 3.5x 13.4x 12.9x 16.7x 16.0xAcxiom Corporation $22.71 $1,787 $1,839 13% 3.5 6% 12% 15% 18% 21% 2.0x 1.8x 9.7x 8.2x NM 43.7xcomScore, Inc. $24.07 $1,316 $1,287 5% 1.9 11% 11% 35% 32% 16% 2.7x 2.4x 19.8x 15.0x 12.2x 9.7xNational Research Corporation $49.83 $1,221 $1,188 NA NA 8% 8% 10% 10% 33% 10.0x 9.3x 30.6x 27.8x 56.6x 52.5xForrester Research, Inc. $41.45 $749 $615 14% 2.2 2% 7% (3%) 5% 11% 1.9x 1.7x 16.1x 15.3x 34.3x 29.3x
Median 11% 2.1 7% 7% 14% 8% 30% 4.5x 4.3x 16.1x 14.8x 25.3x 21.2x
($MM, except per share data)Stock EPS Operating Metrics Trading MetricsPrice Equity Enterprise Long Term Revenue Growth EBITDA Growth EBITDA Margin EV / Revenue EV / EBITDA Price / EPS
Company 3/31/18 Value Value Growth PEG 17E/16A 18E/17E 17E/16A 18E/17E 18E 17E 18E 17E 18E 17E 18E

26
SELECTED PUBLIC COMPANY DETAIL (CONT’D)
Notes: Source: CapIq. Pitchbook.Multiples based on CapIq Consensus Estimates. Multiples <0 and >100 considered NM.
IT &
BPO
Ser
vice
s
IT & BPO ServicesInternational Business Machines Corporation $153.43 $141,335 $175,611 (0%) NA (2%) 2% 0% 2% 24% 2.2x 2.2x 9.2x 9.0x 11.1x 11.1xAccenture plc $153.50 $98,714 $95,144 11% 2.1 7% 12% 4% 16% 17% 2.7x 2.4x 16.3x 14.0x 25.6x 22.7xTata Consultancy Services Limited $43.78 $83,812 $78,095 10% 2.0 10% 5% 6% 5% 26% 4.1x 3.9x 15.6x 14.8x 21.2x 19.9xCognizant Technology Solutions Corporation $80.50 $47,338 $43,155 15% 1.2 10% 10% 9% 20% 21% 2.9x 2.7x 15.0x 12.5x 21.7x 17.7xDXC Technology Company $100.53 $28,720 $34,334 8% 1.4 NM 20% NM 30% 21% 1.7x 1.4x 8.8x 6.8x 15.1x 11.3xInfosys Limited $17.39 $37,799 $34,184 8% 2.0 9% 4% 7% 2% 26% 3.1x 3.0x 11.7x 11.5x 17.5x 16.6xCapgemini SE $124.68 $20,891 $22,561 7% 2.4 16% 4% 17% 4% 14% 1.5x 1.4x 10.5x 10.1x 17.5x 16.6xHCL Technologies Limited $14.88 $20,723 $19,972 12% 1.2 19% 4% 15% 6% 23% 2.5x 2.4x 11.4x 10.8x 15.0x 15.3xNTT Data Corporation $10.66 $14,949 $18,320 8% 2.8 30% 11% 17% 12% 15% 1.0x 0.9x 6.9x 6.2x 28.1x 22.9xCGI Group Inc. $57.62 $16,367 $17,698 10% 1.8 10% 2% 8% 3% 18% 2.0x 2.0x 11.2x 10.9x 19.3x 17.5xWipro Limited $4.33 $19,461 $16,996 9% 1.7 6% 2% 10% (3%) 21% 2.0x 2.0x 9.3x 9.5x 15.3x 14.9xAtos SE $136.87 $14,387 $14,018 7% 1.9 24% 1% 38% 3% 14% 0.9x 0.9x 6.6x 6.4x 13.7x 12.7xNomura Research Institute, Ltd. $47.46 $10,663 $10,146 9% 2.7 13% 14% 9% 13% 20% 2.5x 2.2x 12.3x 10.9x 28.1x 24.6xTech Mahindra Limited $9.81 $9,615 $8,460 11% 1.4 13% 5% (1%) 24% 16% 1.8x 1.7x 13.1x 10.6x 18.5x 16.0xGenpact Limited $31.99 $6,189 $6,900 10% 1.9 6% 9% 7% 10% 17% 2.5x 2.3x 15.2x 13.8x 20.0x 18.5xEPAM Systems, Inc. $114.52 $6,074 $5,517 19% 1.4 25% 25% 23% 25% 18% 3.8x 3.0x 21.6x 17.2x 33.5x 27.9xConduent Incorporated $18.64 $3,923 $5,326 NA NA (6%) (3%) 5% 9% 13% 0.9x 0.9x 8.0x 7.3x 23.0x 17.3xCapita plc $2.02 $1,346 $4,215 (0%) NA (6%) 1% (7%) (18%) 10% 0.7x 0.7x 5.7x 7.0x 3.2x 4.9xSyntel, Inc. $25.53 $2,118 $2,354 8% 1.8 (7%) 4% (18%) 3% 25% 2.6x 2.5x 10.4x 10.1x 13.7x 13.7xPresidio, Inc. $15.64 $1,438 $2,301 7% 1.6 NA 4% NA (2%) 8% 0.8x 0.8x 9.6x 9.8x 12.4x 11.0xWNS (Holdings) Limited $45.33 $2,280 $2,175 14% 2.2 23% 13% 16% 39% 23% 3.2x 2.8x 17.2x 12.3x 48.8x 29.8xMphasiS Limited $12.97 $2,506 $2,122 8% 2.3 9% 9% (5%) 16% 16% 2.2x 2.0x 14.0x 12.1x 21.4x 17.7xMindtree Limited $11.89 $1,950 $1,853 16% 1.4 8% 10% (10%) 31% 15% 2.2x 2.0x 18.1x 13.8x 27.9x 22.1xGlobant S.A. $51.54 $1,814 $1,759 NA NA 26% 23% (0%) 32% 17% 4.3x 3.5x 27.0x 20.6x 39.6x 32.5xExlService Holdings, Inc. $55.77 $1,907 $1,703 15% 1.3 11% 11% 10% 15% 18% 2.2x 2.0x 13.1x 11.4x 21.2x 20.2xHexaware Technologies Limited $5.79 $1,719 $1,635 12% 1.6 19% 10% 24% 8% 17% 2.6x 2.4x 15.6x 14.4x 22.0x 20.0xLuxoft Holding, Inc. $40.95 $1,385 $1,316 NA NA 17% 12% 2% 13% 15% 1.5x 1.3x 9.8x 8.7x 14.8x 13.5xVirtusa Corporation $48.46 $1,426 $1,263 21% 1.1 19% 25% 82% 39% 8% 1.3x 1.0x 18.5x 13.4x 32.8x 22.6xPerficient, Inc. $22.92 $798 $847 NA NA (7%) 6% 9% 10% 16% 1.9x 1.8x 12.1x 11.0x 18.9x 15.4xPersistent Systems Limited $10.61 $849 $715 13% 1.1 14% 10% 14% 17% 17% 1.5x 1.4x 9.6x 8.3x 16.7x 14.4x
Median 10% 1.7 10% 9% 9% 11% 17% 2.2x 2.0x 11.9x 10.9x 19.7x 17.4x
($MM, except per share data)Stock EPS Operating Metrics Trading MetricsPrice Equity Enterprise Long Term Revenue Growth EBITDA Growth EBITDA Margin EV / Revenue EV / EBITDA Price / EPS
Company 3/31/18 Value Value Growth PEG 17E/16A 18E/17E 17E/16A 18E/17E 18E 17E 18E 17E 18E 17E 18E

27
SELECTED PUBLIC COMPANY DETAIL (CONT’D)
Notes: Source: CapIq. Pitchbook.Multiples based on CapIq Consensus Estimates. Multiples <0 and >100 considered NM.
Fina
ncia
l Saa
S
Financial SaaSIntuit Inc. $173.35 $44,397 $44,774 16% 1.9 12% 10% 8% 10% 37% 8.2x 7.5x 22.4x 20.4x 38.1x 31.6xWorkday, Inc. $127.11 $26,947 $25,171 35% 3.4 35% 25% 91% 24% 16% 11.8x 9.4x 75.3x 60.8x 131.0x 118.8xSS&C Technologies Holdings, Inc. $53.64 $11,084 $13,065 11% 2.1 10% 6% 13% 9% 43% 7.8x 7.4x 18.9x 17.3x 27.8x 23.6xThe Sage Group plc $8.97 $9,714 $10,704 10% 1.9 19% 14% 16% 12% 30% 4.6x 4.1x 15.4x 13.7x 22.2x 18.9xPaycom Software, Inc. $107.39 $6,343 $6,333 26% 2.7 31% 26% 41% 25% 31% 14.7x 11.7x 47.7x 38.0x 85.2x 69.6xXero Limited $25.71 $3,531 $3,473 NA NA 33% 48% NA NA 15% 13.7x 9.3x NM 63.6x NM NMEnvestnet, Inc. $57.30 $2,563 $2,743 15% 2.1 18% 21% 22% 26% 19% 4.0x 3.3x 22.5x 17.9x 44.0x 31.2xPaylocity Holding Corporation $51.23 $2,695 $2,584 27% 2.2 30% 23% 98% 32% 20% 8.6x 7.0x 46.0x 34.8x 76.5x 60.3xCoupa Software Incorporated $45.62 $2,583 $2,333 NA NA 36% 23% NA NA (5%) 12.8x 10.5x NM NM NM NMFinancial Engines, Inc. $35.00 $2,207 $1,983 15% 1.3 14% 8% 18% 8% 33% 4.1x 3.8x 12.5x 11.6x 25.4x 19.2xQ2 Holdings, Inc. $45.55 $1,914 $1,815 20% NA 29% 21% NA 108% 9% 9.4x 7.7x NM NM NM NMBlucora, Inc. $24.60 $1,149 $1,427 19% 0.8 10% 8% 6% 7% 20% 2.8x 2.6x 14.3x 13.3x 17.7x 14.8xAlfa Financial Software Holdings PLC $4.82 $1,446 $1,404 NA NA 18% 17% 15% 18% 48% 11.8x 10.0x 24.8x 21.0x 0.4x 0.3xBenefitfocus, Inc. $24.40 $764 $824 25% NA 10% 8% NA 46% 10% 3.2x 3.0x 45.4x 31.0x NM NM
Median 19% 2.1 19% 19% 17% 21% 20% 8.4x 7.4x 22.5x 20.7x 33.0x 27.4x
($MM, except per share data)Stock EPS Operating Metrics Trading MetricsPrice Equity Enterprise Long Term Revenue Growth EBITDA Growth EBITDA Margin EV / Revenue EV / EBITDA Price / EPS
Company 3/31/18 Value Value Growth PEG 17E/16A 18E/17E 17E/16A 18E/17E 18E 17E 18E 17E 18E 17E 18E

28
A leading, independent global investment bankGCA OVERVIEW
San Francisco I New York I Manchester I London I Milan I Zurich I Frankfurt I Munich I Tel AvivMumbai I New Delhi I Singapore I Shanghai I Osaka I Tokyo I Ho Chi Minh City I Taipei I Nagoya
GLOBAL
Global reach with 18 offices in 10 key markets, with deep local roots to ensure hands-on support for our clients
TECH FOCUS
Leading technology advisor with strong networks in key tech hubs globally
GROWTHCOMPANIES
Expert advisor for cross-border transactions – ~33% of our deals involve cross-border outcomes
CROSS-BORDER
Strong expertise in advising growth companies and leading corporations in capital raising and M&A
400+
Over 400 M&A bankers and growth company experts in the U.S., Europe, and Asia
350+
Over 350 deals closed over the last 3 years

29
Selected FinTech experienceGCA OVERVIEW
We Advised TSYS
Acquisition of
Financial Advisor
Growth Investment
Sale of
Financial Advisor
to
Payments
Banking & Lending Tech Payments
We Advised GP Net
We Advised CHX
Acquired by
We Advised Blucora
Acquisition of
We Advised AWL
Acquired by
Preferred Stock Investmentfrom
Financial Advisor
Investment Technology Insurance Technology
Insurance Technology Payments
Liquidity Venues
Acquired by
We Advised INS WebWe Advised Simple
Acquired by
We Advised Capsilon
Growth Investmentfrom
We Advised Skyslope
Majority sale to
Insurance Technology
Real Estate Tech
Banking & Lending Tech
Real Estate Tech
We Advised INS Web
Acquisition of
We Advised Finanzen.de
Acquired by
Insurance Technology Insurance Technology
Real Estate Tech
Payments
We Advised Market Leader
Acquired by
We Advised Radius
Financing from
Payments
Acquisition of
We Advised TSYS
Acquired by
Growth InvestmentFor Blockchain Technology
Financial Advisor
Information Services
Acquired by
We Advised WorkMarket
Financial SaaS
Sold
To
We Advised RGI Shareholders
Insurance Technology
Tender Offer for
Asahi Fire & MarineInsurance Co.
We Advised Asahi (close pending)
Insurance TechnologyWe Advised BlackFin
Sold
Insurance Technology
To
Payments
Acquired by
Fairness Opinion to Clearent
We Advised Vindicia
Acquired by
We Advised Edo
Acquired byStrategic Investment
We Advised ControlExpert
Insurance Technology Payments Payments
Financial Advisor
Growth Investment
Payments
We Advised Commissions Inc
Acquired by
Real Estate Tech
Notes:The above transactions represent a compilation of deals that GCA entities, including GCA Advisors, LLC, GCA Corporation and GCA Altium, have advised on.