int. j. of geology & earth sci., 2019 fidelis a. abija
TRANSCRIPT

73
Int. J. of Geology & Earth Sci., 2019 Fidelis A. Abija, 2019
Geomechanical Property Evolutionand the Mechanics of Growth Faulting
in a Niger Delta oilfield, Nigeria
Fidelis A. Abija1,2
Subsurface rocks’ response to stress and the attendant deformation is a function of thegeomechanical properties under in situ pore pressure conditions. Understanding rock behaviorin vertical and lateral successions, the effects of stress on the rock sequences which oftencause compartmentalization and defining fluid communication within the basin is necessary foroptimizing drilling, completion and production. Rock cores are seldom available for laboratorytest hence use of dynamic method. The mechanical properties and local deformation in a depthinterval of 1500m and 4500m have been using wireline logs. Results shows that the mechanicalproperty evolution was influenced by rock mineralogy, porosity, depth of burial, pore pressure,effective stress, tectonics and temperature. Increase depth of burial and effective vertical stressfavoured syndepositional compaction and paleotectonic stresses greater the rock strengthinduced tensile fracturing and faulting culminating in kinematic translation and creation of adepositional centre in the middle of the field. Rapid progradation of sandstones and shalessequences due to marine incursion created both stratigraphic and structuralcompartmentalization. This accompanied by low rate of fluids diffusion and imposition ofoverburden load on the pore fluids, vertical transfer along the faults, grain sliding in shear; reductionin the rock compressibility and pore volume; and destruction of cement bonding causingcompaction disequilibrium and generating excess pore pressure in the shales. Re - orientationof the tectonic stresses led to elastic stretching of the ductile and high elasticity shales andmicrofracturing of the brittle sandstones forming growth faults and rollover anticlines that favouredhydrocarbon migration from the lower Akata source rock into the porous reservoirs and shalecapping and smearing on the fault limbs providing the trapping mechanism..
Keywords: Petrophysical logs, mechanical properties, rock deformation, growth fault, rollover anticlines
*Corresponding Author: Fidelis A. Abija [email protected]
1 Centre for Geomechanics, Energy and Environmental Sustainability, Port Harcourt, Nigeria.2 B. J. Anderson Engineering Ltd, Km 20, Airport Road, Port Harcourt, Nigeria.
ISSN 2395-647X www.ijges.comVol. 5, No. 2, June 2019
doi:10.32937/IJGES.5.2.2019.73-95© 2019 IJGES. All Rights Reserved
Int. J. of Geology & Earth Sci., 2019
Research Paper
Received on: 18th April, 2019 Accepted on: 22nd May, 2019

74
Int. J. of Geology & Earth Sci., 2019 Fidelis A. Abija, 2019
IntroductionStresses in the earth cause rock deformationsresulting to change of shape, size and or volumewhether in a simple subsiding basin or at collidingplate boundaries (Cook et al 2007). A rock’sresponse to stress depends on its compositionwhich gives it characteristic mechanicalproperties. Understanding present day crustalstresses is critical to interpretations of continentalscale plate tectonic induced deformations andgeomechanics is concerned with the mechanicalresponse of all geological materials to these forcefields and their hazards (Turner et al 2017). Themechanical properties of a rock in the earth arethose characteristics which determine itsbehavior under different conditions of stress andare classified into elastic and anelastic based ontheir elasticity. Rock deformation which is eitherelastic or plastic may be caused by tension,compression or shear and this can result incompaction, extension, translation or rotationeventually ending in shearing, fracturing orfaulting. Elastic deformation can be restoredwhen the rock is relived of the applied stress whileplastic deformation is permanent when thecritical threshold value of the rock strength isexceeded in the ductile field thus leavingpermanent alteration in the rock’s volume, shapeand fluid flow path (Fjaer et al 2008).
Rock response to stress depend oncomposition, cementation, porosity and burialdepth and could result in alteration of rock volume,geometry, permeability, porosity, rock strength,elasticity and paths of fluid flow. Rocks ruptureunder brittle deformation and most rockmechanics applications are based on linearelasticity. However, most sedimentary rocksexhibit plastic behavior and creep (Fjaer et al2008).
The mode of geological force and type ofgeological media to a large extent determine theeffects of the force and the behavior of the rock.Consequently, four types of rock behavior andcorresponding deformations may occur as wellas three elastic moduli that correspond to eachtype of deformation. Geomechanical propertiesof rock formations evolve over time during theprocess of deposition and sedimentation underthe influence of gravitational and tectonic stresses,f luid pressure, thermal stress, and postdepositional diagenetic reactions within thecement bonds. These processes are importantin oil/gas field evolution, hydrocarbon sourcemigration and accumulation as they determinerock structures such as folding, fracturing,faulting, diapirism, and post depositionalcompaction.
Geomechanics has found wide application inPetroleum exploration and production includingbut not limited to pressure prediction, wellborestability, sand control and management, reservoirproduction management, geosteering, horizontalwell design (Abija and Tse 2016), fracturepermeability, stage placement of hydraulicfracture, multilateral wells and multiple wellcompletions, drill cutting re-injection and effluentsubsurface storage design, geosequestration andcarbon emissions control, reservoir compactionand subsidence prediction (Pietro et al 2010),modeling fault zone hydrogeomechanical couplingand hydrocarbon migration into groundwateraquifers. Extending the life of oil and gas field andderiving optimal benefit from the investment isassured through proactive geomechanical fieldevaluation and design (Zoback et al 2003).Thecomplexity and cost of oil/gas well planning anddevelopment in terms of geometry (reach andlength) and access to deep, high-temperature,

75
Int. J. of Geology & Earth Sci., 2019 Fidelis A. Abija, 2019
over pressured and high-stress regimes requiresintegrating geology and the mechanics of tectonicprocesses for a more economic field planningand design. Characterizat ion of thegeomechanical responses of rocks to stress isbased on critical understanding of the processesthat act within the earth, their interactions andeffects on in situ rocks throughout the geologicevolution of the basin and this is required for fieldplanning and development. Rock compressibilityfor example is essential for compaction andsubsidence evaluation, reservoir drivedetermination, reserve estimation, reservoirpressure maintenance, casing collapse analysisand production forecasting (Geerstma 1973, Wolfet al 2005), Bruno 2001), Poisson ratio is an inputparameter in hydraulic fracture design(Schlumberger 1989, Anderson 2006, Cleary1958), stress path and reservoir depletionanalysis, rock strength for sand prediction andwellbore strengthening analysis (Schlumberger1989) etc.. Induced stress changes caused bydrilling, injection, fracturing and production causesre-orientation of the principal stresses thusaffecting the rock properties, wellbore stressesand rock responses capable of causing shear,tensile and compressive failures. This researchwas carried out to evaluate the geomechanicalproperties in the oilfield, their responses to stressgravitational and tectonic stresses during thebasin evolution through to the present day andtheir impacts on the petroleum system.
Study Area
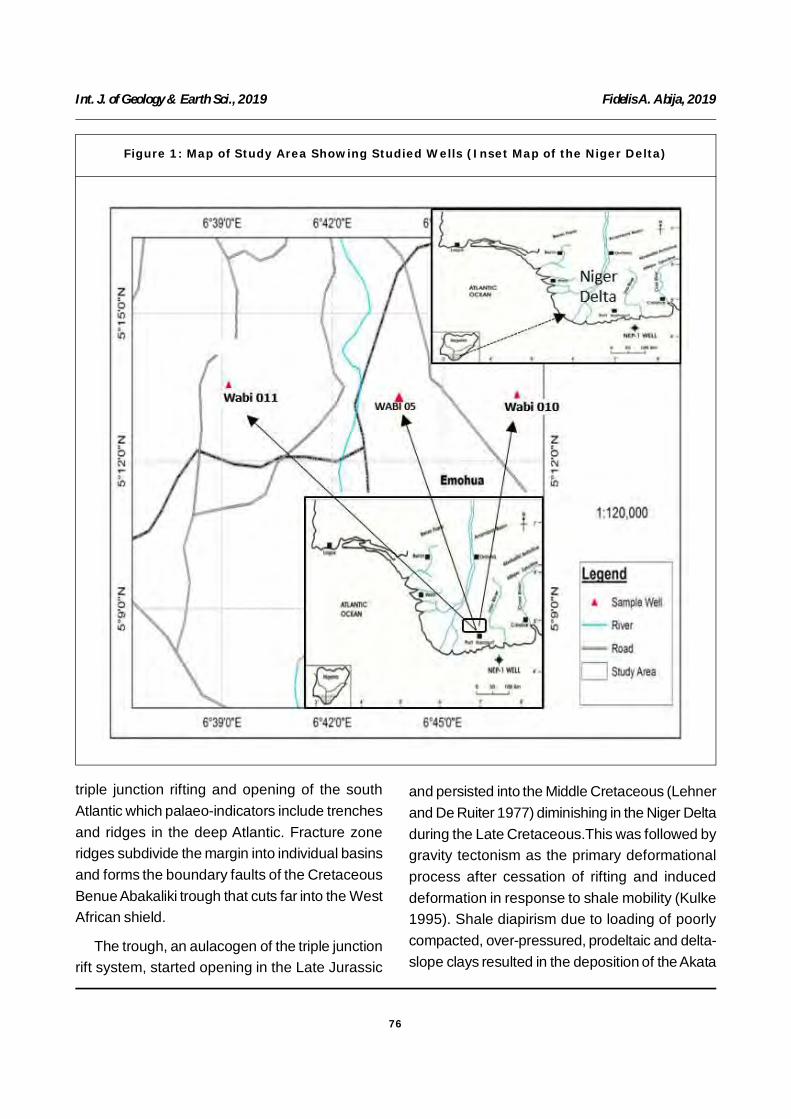
Location and Geologic SettingThe study area is located in the onshore coastalswamp within 05 13.2208°N and 006 41.0107°Esituated in the Gulf of Guinea (Figure 1). The basin,one of the largest regressive deltas, is estimated
to cover an area of 300,000 km2 with a sedimentvolume of 500,000 km3 (Hospers 1965), and asediment thickness of over 10 km in thedepocenter (Kaplan et al 1994). A southwestwardprogradation during basin evolution formeddepobelts that represent the most active portionsof the delta at each stage of its evolution (Doustand Omatsola 1990, Kulke 1995). Estimates ofrecoverable hydrocarbons are about 34.5 billionbarrels of oil and 93.8 trillion cubic feet of gas(14.9 billion barrels of oil equivalent) per unitvolume of basin-fill. The stratigraphic sequencesof the basin are subdivided into three units namelyAkata, Agbada and Benin formations each ofwhich range from Tertiary to Recent (Short andStauble 1965).
The onshore portion of the Niger DeltaProvince is delineated by the geology of southernNigeria and southwestern Cameroon. The Beninflank, an East-North East trending hinge line southof the West Africa basement massif marks theboundary north-westward while Cretaceousoutcrops of the Abakaliki High forms thenortheastern boundary. The Calabar flank, a hingeline bordering the adjacent Precambrian, formsthe East-South-East limit of the basin. Offshore,the basin is bounded by the Cameroon volcanicline to the east, the eastern boundary of theDahomey basin (the eastern-most West Africantransform-fault passive margin) to the west, andthe two-kilometer sediment thickness contour orthe 4000m bathymetric contour in areas wheresediment thickness is greater than two kilometersto the south and southwest. This forms thegeologic extent of the Tertiary Niger Delta (Akata-Agbada) Petroleum System.
Geotectonic SettingTectonically, basin evolution was controlled byCretaceous fracture zones formed during the
76
Int. J. of Geology & Earth Sci., 2019 Fidelis A. Abija, 2019
Figure 1: Map of Study Area Showing Studied Wells (Inset Map of the Niger Delta)
triple junction rifting and opening of the southAtlantic which palaeo-indicators include trenchesand ridges in the deep Atlantic. Fracture zoneridges subdivide the margin into individual basinsand forms the boundary faults of the CretaceousBenue Abakaliki trough that cuts far into the WestAfrican shield.
The trough, an aulacogen of the triple junctionrift system, started opening in the Late Jurassic
and persisted into the Middle Cretaceous (Lehnerand De Ruiter 1977) diminishing in the Niger Deltaduring the Late Cretaceous.This was followed bygravity tectonism as the primary deformationalprocess after cessation of rifting and induceddeformation in response to shale mobility (Kulke1995). Shale diapirism due to loading of poorlycompacted, over-pressured, prodeltaic and delta-slope clays resulted in the deposition of the Akata

77
Int. J. of Geology & Earth Sci., 2019 Fidelis A. Abija, 2019
Formation, the continental intercalaire by thehigher density delta-front sands of the AgbadaFormation. This was followed by slope instabilitycaused by lack of lateral basinward support forthe under-compacted delta slope clays of theAkata Formation. Gravity tectonics indexed bystructures such as shale diapirs, roll-overanticlines, collapsed growth fault crests, back-to-back features, and steeply dipping closelyspaced flank faults (Evamy et al 1978) completedthe pro-deltaic deposition before deposition of theBenin Formation. These faults mostly offsetdifferent parts of the Agbada Formation and flatteninto detachment planes near the top of the AkataFormation. Deposition of the formations inofflapping siliciclastic sedimentation cycles 30-60Km wide, prograde southwestward 250Kmover oceanic crust into the Gulf of Guinea(Stacher 1995) and synsedimentary faultingoccurred in response to variable rates ofsubsidence and sediment supply (Weber andDaokoru 1977). Subsidence and supply ratesinterplay resulted in deposition of discretedepobelts. When further crustal subsidencecould no longer be accommodated, the centre ofsediment deposition shifted seaward forming newdepobelt each marking a break in regional dip ofthe delta bounded landward by growth faults andseaward by large counter regional faults or thegrowth fault of the next seaward belt (Evamy etal 1978). Each depobelt is a separate unitrecognized by its own sedimentation,deformation, and petroleum history. Doust andOmatsola (1990) describe three depobeltprovinces based on structure. The northern deltaprovince which overlies relatively shallowbasement has the oldest growth faults that aregenerally rotational, evenly spaced with increasesteepness seaward. The central delta province
has depobelts with well-defined structures suchas successively deeper rollover crests that shiftseaward for any given growth fault. The distaldelta province is the most structurally complexdue to internal gravity tectonics on the moderncontinental slope.
Study Materials andMethodologyThe materials used include wireline log datanamely density, sonic, resistivity and gamma rayprovided by Total E&P Nig. Ltd, through theDepartment of Petroleum Resources, (DPR),Port Harcourt, Nigeria. The dynamic method ofproperty determination was employed.Geotechnical properties of rocks are traditionallydetermined from laboratory testing of coredsamples. However, in oil and gas wells, theseare seldom available for pre-drilling testing anddesign. petrophysical logs usually available in alloffset wells are utilized for the determination ofrock properties empirical equations that utilizerock density, sonic compressional (ÄTC) andshear (ÄTS) slownesses. The derived empiricalequations applied in this research are based onthe fact that, the factors which affect the formationparameters such as velocity, porosity and elasticmoduli equally affect rock strength and othergeomechanical properties (Sinha et al 2008). Thetheory of derivation is based on the principles ofacoustoelasticity effects in which changes in rockelastic wave velocities are caused by changes inpre-stress in the propagating medium. Theseempirical relations employ one or more of P - wavevelocity or interval transit time which is directlymeasured in sonic logging, elastic modulusderived from velocity of P - wave and density -porosity usually derived from densitymeasurements using rock matrix and fluid

78
Int. J. of Geology & Earth Sci., 2019 Fidelis A. Abija, 2019
densities (Sinha et al 2008, Chang et al 2006). Itis noteworthy that dynamic properties requirecalibration to static in situ conditions using coregeomechanical laboratory test results. In thisstudy, cores were not available for this tests thusa limitation in calibration of the model results. Inthe field of study, shear slowness data were notavailable in well 05 necessitating the calculationof P-wave velocity from the compressiveslowness and results used to derive the shearwave velocity. This was achieved using therelationships in the equations (1), (2), (3) and (4)(Crain and Holgate 2004, Greenberg andCastagna 1993).
cn T
V
610
...(1)
ss T
V
610
...(2)
ÄTS
Vs = (0.804 x Vp) – 0.856 (sand) ...(3)
Vs = (0.769 x Vp) – 0.0.867 (shale) ...(4)
The derived empirical relations are especiallyuseful where cores are not available formechanical tests and modeling are performedbased on empirical correlations from measurablephysical properties obtainable from wireline logsnormally available for all offset wells within thefield for pre-drilling analysis and design (Paul andZoback, 2008). They can also be used in earlystages of a new prospect, re-evaluating of oldassets, or simply as a preliminary tool prior todesigning a geomechanical test schedule (Aziziand Memarian, 2006). The results of this analysisare applicable in hydrocarbon as well asgeothermal energy development.
Each of the rock mechanical properties wascalculated using the equation for the parameteras defined.
Poisson Ratio (v)The Poisson ratio was computed from P and Swave velocities calculated from the acousticslownesses (ÄTc) and (ÄTs) using equation (5)(Jones et al 1992, Moos 2006).
v = 0.5(Vp/Vs)2 – 1/ (Vp/Vs)2 – 1 ...(5)
Shear Modulus (G)The shear modulus is the ratio of the shear stressto the shear strain which for a homogeneous,isotropic and elastic rock it’s given by equation(6) (Schlumberger 1989),.
G = 13464 x b/ TS ...(6)
where coefficient a = 13464, b= bulk density ing/cm3, Ts = Shear sonic transit time in S/ft.The unit of G is 106 psi which can be convertedto MPa.
Bulk Modulus (KB)The bulk modulus (Kb) is a static modulus but anequivalent dynamic modulus an was computedusing eqn. 7 from the sonic and density logs.
Kb = ab(1/TC2 - 4/3ÄTS
2) ...(7)
where coefficient a = 13464, b= bulk density ing/cm3, T = sonic transit times for compressionaland shear wave in S/ft. The unit of Kb is 106 psi.
Matrix/Grain Bulk Modulus(Km)
Km = KS ma/(1/TCma2 - 4/3TSma
2) ...(8)
where KS is constant and = 1000 if T is in s/mand 13400 s/ft,

79
Int. J. of Geology & Earth Sci., 2019 Fidelis A. Abija, 2019
Elastic Modulus (E)Elastic modulus was determined from therelationship between Young’s modulus, shearmodulus and Poisson ratio in equation (9).
E = 2G (1 + ) ...(9)
where G = shear modulus and = Poisson ratio.E is in psi.
Bulk Compressibility (Cb)With Porosity
Cb = 1/Kb ...(10)
Rock Compressibility (CR)ZERO POROSITY
Cr = 1/(alog(1/TCma2 – 4/3 TSma
2) ...(11)
BIOT CONSTANT ()Biot’s coefficient is a constant introduced intoTerzaghi’s effective stress and the uniaxial strainequation as a factor to account for resistance ofthe rock frame against deformation as porepressure changes (Biot, 1941). It describes howmuch of the stress and pore pressure changesis converted to effective stress change. It isdependent on compressibility, bulk modulus andporosity and varies in the range of porosity and 1.When it is one, Terzaghi’s original effective stressand the uniaxial strain equations are realized(Fjaer et al 2008). It was determined using theexpressions in equations (12) and (13).
It is expressed as
= 1 – Kb/Km ...(12)
in terms of bulk and grain modulus where Kb andkm are skeleton bulk and solid grain modulirespectively [28]. In terms of compressibility, it isexpressed as
= 1 – Cr/Cb ...(13)
where C r and Cb are grain and bulkcompressibility respectively.
Uniaxial CompressiveStrength (UCS)Equation (14) (McNally 1987) which is applicablein fine grained consolidated and unconsolidatedsandstones within all porosity ranges is suitedfor the Niger Delta basin and was applied.
UCS = 1200 exp(–0.036Tc) ...(14)
Lal (1999) proposed equation (15) for shalesbased on rock cores from the North Sea basin
UCS = 10(304.8/Tc – 1) ...(15)
where UCS = unconfined compressive strengthin psi, Tc = compressional wave transit time.
Cohesion (CO)The cohesive strength was determined using(Coates and Denoo 1981) equation (16)
Co = 5(Vp – 1)/0.5(Vp) ...(16)
Friction Angle(FA)Lal (1999) equation (17) which uses the velocityof compressional wave, was adopted for thedetermination of angle of friction.
= Sin–1(Vp – 1/Vp + 1) ...(17)
where is angle of friction, Vp is velocity ofp-wave.
Tensile Strength (To)Equation (18), (Coates and Denoo, 1981) wasused evaluating tensile strength.
To = Co/12 ...(18)
Shear StrengthThe initial shear strength was determined usingthe empirical relation (19) by (Schlumberger 1989).

80
Int. J. of Geology & Earth Sci., 2019 Fidelis A. Abija, 2019
i = 0.026E/Cb x 106{0.008Vsh
+ 0.0045(1 – Vsh) ...(19)
where E = Elastic modulus in psi, Cb = bulkcompressibility in psi-1 and Vsh = volume of shalein fraction,
Determination ofPetrophysical Parameters
Volume of ShaleThe shale volume is the bulk volume of thereservoir composed of clay minerals and claybound water. It was determined using equation(20) (Larinov 1962).
Vshale = 0.083(23.7Igr – 1) ...(20)
where Igr is the shale index (gamma ray index)which is defined in (21)
minmax
minlog
GRGR
GRGRI gr
...(21)
where, GRlog = measured gamma ray log readingat depth z, GRmin = minimum gamma ray log inclean sand, GRmax = maximum gamma logreading (in clean shale), Vshale= volume of shalein the formation at depth z.
PorosityPorosity is the total volume of a rock occupied bypores both connected and unconnected. It is theration of the pore volume to the bulk volumeexpressed as f ract ion or %. Porosity isdetermined from density, sonic, neutron logs.
The total porosity was determined from densitylog data which are weighted average densities ofthe rock and pore fluid using equation (22).
D = (ma – b)/(ma – fl) ...(22)
where D = total density porosity, ma = density
of rock matrix, b = measure density and ñfl =density of fluid. Shale corrected density wascalculated by application of volume of shale usingequation (23).
eff = (ma – b)/(ma - fl)
– Vsh(ma – sh)/(ma – fl) ...(23)
where sh is shale corrected density porosity, Vsh
is volume of shale and sh is density of shale.
The results of this analysis were plotted in logformat using Petrel 2010 and correlated acrossthe wells.
Results and Discussion
Mechanical Property EvolutionThe mechanical property evolution of the basin’sfield was influenced by the rocks’ mineralogy,porosity, depth of burial, pore pressure, effectivestress, tectonics and temperature. Increasedepth of burial and effective vertical stress due tooverburden loading favoured syndepositionalcompaction of the intervening sequences ofsandstone and shales, tectonic induced tensilefracturing and faulting culminating in kinematictranslation.
These processes imparted higher strength onthe rocks as seen in the uniaxial compressivestrength, cohesive strength, tensile strength andelastic modulus which vary from 20.21MPa,5.8MPa, 1.68MPa, and 6.69 x 10 -9 MParespectively at 1500m to 32.11MPa, 6.59MPa,2.69MPa and 1.47 x 10⁻⁹MPa at 2500m in the inthe shales formations of well 11, east of the field.The strength of sandstones was significantlyincreased from 38.7MPa, 7.14MPa, 2.89MPa and2.34 x 10 -8MPa respectively at 3000mto 78.44mPa, 7.35MPa, 6.64MPa and 2.96 x10⁻⁸ MPa for uniaxial compressive strength,

81
Int. J. of Geology & Earth Sci., 2019 Fidelis A. Abija, 2019
cohesive strength, tensile strength and elasticmodulus respectively (Table 1 and 2 and fig. 2a).The trend of increasing strength with depth wasalso visible in well 5 which constitute thedownthrown block with results ranging from15.39MPa, 9.99MPa, and 1.28MPa at 1500m to28.84MPa, 10.34MPa, and 2.40MPa at 2500m foruniaxial compressive strength, cohesive strength,and tensile strength in the shales but withdecrease in elastic modulus from and53,037.6MPa to 51,412.95MPa (Tables 1 and 2and Figure 2b). This decrease in elastic modulusis consistent with increase sediment loads, rapid
sedimentation rates, compaction disequilibriumand aquathermal effects. In well 10 west of thefield, the strength decreased respectively as24.95MPa, 6.45MPa, and 2.08MPa for uniaxialcompressive strength, cohesive strength, tensilestrength and elastic modulus in shales at 2000mto 23.99MPa, 6.78MPa and 1.99MPa for uniaxialcompressive strength, cohesive strength andtensile strength of shales at 3000m depictingreduction in the bulk density of the rock mineralsand reduced intensity of compaction. The elasticmodulus however increased from 18,644.8MPato 19382.5MPa. Overpressure generation in
Table 1: Rock Elastic Properties in the Field
Well Depth(m) Rock Type v Ko GMPa KbMpa EMpa CbMPa–1 CrMPa–1
Well 10 2000 Shale 0.33 0.49 7000.77 18,455.3 18,644.8 2.58 x 10- 9 5.96 x 10- 4 1
2500 Shale 0.34 0.52 8,717.91 253,312.8 23,466.1 1.87 x 10- 9 5.96 x 10- 4 1
3000 Shale 0.33 0.50 7,262.97 19,500 19,382.5 2.44 x 10- 9 5.96 x 10- 4 1
3500 Sandstone 0.21 0.27 2,877.3 4,112.19 7,003.8 1.15 x 10- 9 5.96 x 10- 4 1
4000 Sandstone 0.27 0.37 4,845.13 8,947.59 12,312.9 5.31E x 10- 9 6.0 x 10- 4 1
Well 5 1500 Shale 0.35 0.52 69 .8 188.4 53,037.6 2.52 x 10- 6 2.45 x 10- 6 0.9
2000 Shale 0.34 0.52 69.38 186.4 51,412.9 3.54 x 10- 4 -3.1 x 10- 3 0.9
2500 Shaly SST 0.33 0.48 68.13 180.99 54,769.9 3.33 x 10- 3 -9.65 x 10- 2 0.9
3000 Sandstone 0.26 0.35 58.86 148.42 55,167.5 2.91 x 10- 3 -1.31 x 10- 7 0.9
3500 Sandstone 0.22 0.29 58.99 145.1 55,413.4 2.64 x 10- 3 -1.72 x 10- 7 0.9
4000 Sandstone 0.27 0.37 59.96 152.49 55,390.5 2.97 x 10- 3 -0.0344 0.9
Well11 1500 Shale 0.37 0.60 2.43 x 10- 6 5.5 x 10- 10 6.69 x 10- 10 86,773.1 5.96 x 10- 4 1
2000 Shale 0.35 0.55 3.3 x 10- 9 8.8 x 10- 10 9.03 x 10- 9 545,787.1 5.96 x 10- 4 1
2500 Shaly SST 0.32 0.47 5.6 x 10- 9 1.7 x 10- 9 1.47 x 10- 8 27,320.3 5.96 x 10- 4 1
3000 Sandstone 0.27 0.37 9.2E x 10- 9 4.7 x 10- 9 2.34 x 10- 8 13,380.6 5.96 x 10- 4 1
3500 Sandstone 0.25 0.33 1.1 x 10- 7 6.2 x 10- 9 2.89 x 10- 8 9,992.7 5.96E-4 1
4000 Sandstone 0.18 0.23 1.2 x 10- 8 6.2 x 10- 9 2.96 x 10- 8 7,749.2 5.96 x 10- 4 1
Note: v = Poisson ratio, Ko = v/1 – , G = modulus of rigidity, Kb = bulk modulus, Young’s modulus, Cb – bulk compressibility, Cr = graincompressibility, = Biot’s coefficient, SST = sandstone

Figure 2a: Well 11 Mechanical Property Log
DatumA_TopB_TopC_TopD_TopE_TopF_TopG_TopH_Top
Datum
A_Top
B_Top
C_TopD_TopE_Top
F_Top
G_Top
H_Top
-38.8
1000
2000
3000
4000
DatumA_TopB_TopC_TopD_TopE_TopF_TopG_TopH_Top
WABI-011 [SSTVD]SSTVD
1:48105 0.00 150.00gAPIGR
Color fillColor fill
1.6500 g/cm3 2.6500 RHOB
180.00 0.00us/ftDT
0.2000 ohm.m 2,000.0000
LLD
-10.5087 19.4819Vshale
-523.0956 6,627.2743 FA
692.31 1/bar 1,392.80To
0.08 0.101/barCo
1,347.4175 bar 19,506.0836
UCS(McNally)
-18 1 ,234,995 ,63 6,966 ,0 00.00 GPa 1 ,99 3,584,952,006,630,000.00
G
-1,133,644.93 GPa 12,201,190.84E
-260,976.30 GPa 2,348,482.66 Kb
0.00 0.001/barCr
-687,880.76 1/bar 6,615,626.74Cb
Figure 2b: Well 5 Mechanical Property Log
Datum
A_Top
B_Top
C_TopD_TopE_Top
F_Top
G_Top
H_Top
Datum
A_Top
B_Top
C_Top
D_Top
E_Top
F_Top
G_Top
H_Top
893.8
4237.8
1500
2000
2500
3000
3500
4000
Datum
A_Top
B_Top
C_TopD_TopE_Top
F_Top
G_Top
H_Top
WABI-05 [SSTVD]SSTVD
1:34722 0.00 150.00gAPIGR
Color fillColor fill
0.10 10.00bar/mPR
1.6500 g/cm3 2.6500 RHOB
180.00 0.00us/ftDT
0.2000 ohm.m 2,000.0000 LLD
-0.0989 1.0874Vshale
87.4492 88.5470FA
-95.90 1/bar 2,163.06To
1,449.67 1/bar 1,450.15 Co
-1,150.8510 bar 25,956.6786 UCS(McNally)
-7,775.82 GPa 38,206.75G
4,600,201.01 GPa 8,431,042.76Km
-12,486.60 GPa 81,748.24E
-5,195.37 GPa 23,320.99Kb
0.00 0.001/barCr
Cb

Figure 2c: Well 10 Mechanical Property Log
Datum
A_TopB_Top
C_TopD_TopE_TopF_Top
G_TopH_Top
Datum
A_Top
B_Top
C_Top
D_TopE_Top
F_Top
G_Top
H_Top
841.1
3902.8
1500
2000
2500
3000
3500
Datum
A_TopB_Top
C_TopD_TopE_TopF_Top
G_TopH_Top
WABI-010 [SSTVD]SSTVD
1:31790 0.00 150.00gAPIGR
Color fillColor fill
1.6500 g/cm3 2.6500 RHOB
180.00 0.00us/ftDT
0.2000 ohm.m 2,000.0000LLD
-0.1853 1.0424Vshale
18.3184 48.9250FA
-523.10 1/bar 6,627.27 To
692.31 1/bar 1,392.80 Co
-6,277.1476 bar 79,527.2943 UCS(McNally)
-260,976.30 GPa 2,348,482.66 G
-687,880.73 GPa 6,615,626.45 E
-1,133,644.93 GPa 12,201,190.84Kb
0.08 0.101/barCr
0.00 0.001/barCb
response to increase load and fluid trapping toredistribute the locked in stresses and achieveequilibrium is attributed as the causal factor forincrease elasticity of the ductile shales. Theuniaxial compressive and tensile strengths of thesandstones in well 10 decreased from 89.03MPa,and 7.42MPa at 3500m to 53.06MPa, and4.42MPa at 4000m respectively while thecohesive strength and elastic modulus increasedfrom 6.89MPa, and 7,003.8MPa at 3500m to7.52MPa, and 12,312.9MPa respectively at4000m (Tables 1 and 2 and Figure 2c). A decreasein bulk and grain compressibilities and shearmodulus is consistent with increasing depth inall the wells across the field. Poisson’s ratio wasinfluenced by rock mineralogy and the effect ofdepth was not significant on its value. Generallyall shales irrespective of depth has a Poisson ratioranging from 0.33 – 0.40, the value increasing
with decreasing sand volume. Poisson ratio alsoincreased with increase in elastic modulus inshale and decrease with increase in elasticmodulus (Figures 3a and b).
The effect of porosity was also strong on themechanical property evolution as high porosityrocks had lower strength in both shales andsandstones (Figures 4a and b). Rock strengthhas an indirect relationship with the shear modulusdecreasing in both sandstones and shales(Figures 5a and b) and also with the volume ofshale further asserting that shales are weakerrocks than sandstones (Figures 6 and 7). Elasticmodulus increases with increasing vertical stressand by implication the depth of burial (Figures 8aand b). Rock matrix, bulk modulus, modulus androck strength also increases with increase invertical stress (Figures 9, 10 and 11) respectivelywhile the rock compressibility decreases under

84
Int. J. of Geology & Earth Sci., 2019 Fidelis A. Abija, 2019
Table 2: Typical Rock Strength and Petrophysical Properties
Well Depth(m) Rock Strength Parameters Petrophysical Parameters
Well 10 Rock Type UCSMPa CoMPa ToMPa iMPa FA(Vp)(deg) Vsh(frac) eff(frac)
2000 Shale 24.95 6.45 2.08 8.60 14.5 0.60 0.22
2500 Shale 20.68 6.51 1.72 1.99E+15 15.5 0.27 0.10
3000 Shale 23.99 6.78 1.99 1.43E+15 14.8 0.54 0.20
3500 Sandstone 89.03 6.89 7.42 1.05E+15 0 0.43 0.07
4000 Sandstone 53.06 7.52 4.42 3.99E+14 7.4 0.42 0.0008
Well 11 1500 Shale 20.21 5.8 1.68 7.17E-14 16 0.19 0.26
2000 Shale 24.78 6.14 2.06 1.95E-13 17 0.59 0.23
2500 Shaly SST 32.11 6.59 2.69 4.51E-13 1 3 0.05 0.10
3000 Shaly SST 38.79 7.14 2.89 1.78E-13 7 0.33 0.12
3500 Sandstone 78.44 7.35 6.64 3.4E-13 4 0.64 0.09
4000 Sandstone 57.33 7.45 4.78 5.19E-13 2 0.59 0.17
Well 05 2000 Shale 15.39 9.99 1.28 5.52E-5 8 7 0.02 0.25
2500 Shale 28.84 10.34 2.40 5.0E-7 8 7 0.11 0.33
3000 Sandstone 52.32 10.34 4.36 4.27E-7 8 8 0.17 0.09
3500 Sandstone 67.22 9.99 5.60 4.5E-7 8 8 0.05 0.21
4000 Sandstone 57.13 9.99 4.76 4.93E-7 8 8 0.24 0.11
Note: SST = sandstone, UCS = unconfined compressive strength, Co = cohesive strength, To = tensile strength, i = initial shear strength, FA(NPHI)= angle of friction from neutron – porosity log, FA(Vp) = angle of friction from p-wave velocity, Vsh = volume of shale, eff = effectiveporosity.
the weight of the overlying rocks. Increasingdepth, bulk density and vertical stress due tooverburden loading led to higher degree ofcompaction resulting to higher mechanicalstrength as revealed by uniaxial compressivestrength, cohesive strength and tensile strengthin both shale and sandstones. Shales are moreelastic and consequently are not prone toaccidental fracturing relative to sandstones whichfail under tension at lower pressures of the mudweight during drilling. In hydraulic fracturingoperations, sandstones will propagate fracturesat a lower injection pressure than shale. On the
other hand, shales are more prone to shear failurethan sandstones due to their low strength andhigh elasticity. The shale cap rocks are ductile,stiffer, less compressible and more prone tocompressive shear failure. Mechanicalheterogeneity across the field was caused byporosity, pore pressure, compartmentalizationand depositional sequence.
Increase in effective overburden stress due togravity loading and fluids expulsion causes grainsliding in shear and compaction deformation withreduction in the bulk and grain compressibilitiesas well as the pore volume of the sediment with

85
Int. J. of Geology & Earth Sci., 2019 Fidelis A. Abija, 2019
Figure 3a: Typical Young’s Modulus Vs. Poisson Ratio Relationship in Shale
Young's modulus vsPoisson ration in shale at 4332.883m - 4360.925m depth in in high sand volume shale
y = -1847.8x + 3020R2 = 0.7151000
15002000250030003500
0.2 0.25 0.3 0.35 0.4 0.45 0.5
Poisson ratio
Elas
tic m
odlu
s (p
si)
Figure 3b: Typical Young’s Modulus Vs. Poisson Ratio Relationship in Reservoir Sandstone
Young's modulus vsPoisson ration in shale at 4332.883m - 4360.925m depth in in high sand volume shale
y = -1847.8x + 3020R2 = 0.7151000
15002000250030003500
0.2 0.25 0.3 0.35 0.4 0.45 0.5
Poisson ratio
Elas
tic m
odlu
s (p
si)
depth. Compaction lead to reduction in porosityand porosity changes even at very small strainsaffects the absolute permeability, wettability andcapillary pressure.
Grain to grain contact destroys the cementbonds and closes the packing of individual grainsby elastic distortions and strains. Since theimpermeable and saturated with an

incompressible fluid, elastic deformation ensuesand when there is disequilibrium compaction,abnormal pore pressures are generated asreported in most fields in the Niger Delta (Opara
2011, O’Conor et al 2011). Young tertiarysedimentary rocks deform primarily bycompaction resulting in progressive loss ofporosity with increasing depth of burial (Barnejee
Figure 4a: Typical Porosity - Uniaxial Compressive Strength Bivariate Relationship in Shale
Figure 4b: Typical Porosity - Uniaxial Compressive Strength Bivariate Relationship in Sandstone
porosity - UCS plot for 2034.235 - 2039.416m shale facies
y = -6.5641Ln(x) + 69.833R2 = 0.6665
1012141618202224
1500 2000 2500 3000 3500 4000
UCS (psi)
Poro
sity
%
Porosity - UCS plot for 2039.569m - 2046.427m sandstone facies
y = -10.22Ln(x) + 103.49R2 = 0.6301
05
1015202530
3000 5000 7000 9000 11000 13000 15000 17000 19000 21000
UCs (psi)
poro
sity
%

and Muhiri 2013).The mechanisms of over-pressures generation in the shale is believed to bedue to compressional inversion, tensile failure linked
to gas generation at peak burial, shale diapirismand compaction disequilibrium where rapid burialleads to partial dewatering during diagenesis.
Figure 5a: Typical Variation of Uniaxial Compressive Strength With Shear Modulus in Shale
UCS vs shear modulus for 2034.235 - 2039.416m depth shale facies
y = -19.414x + 43.777R2 = 0.8942
5
10
15
20
25
30
1 1.1 1.2 1.3 1.4 1.5 1.6 1.7 1.8 1.9 2
Shear nodulus (MPa)
Unia
xial
com
pres
sive
st
reng
th (M
Pa)
Figure 5b: Typical Variation Of Uniaxial Compressive Strength With Shear Modulus in Sandstone
Uniaxial compressive strength vs shear modulius for 2039.569 - 2046.427m depth sandstone facies
y = -74.631x + 116.34R2 = 0.6088
020406080
100120140160
0 0.2 0.4 0.6 0.8 1 1.2 1.4 1.6 1.8 2
Shear modlus (MPa)
UCS
(MPa
)

88
Int. J. of Geology & Earth Sci., 2019 Fidelis A. Abija, 2019
Correlation of the properties across the field(Figure 12) shows higher values of elastic, bulkand rigidity moduli in the east direction and a lateral
decrease in the magnitude of the rigidity modulusfrom well 10 on the east to well 11 on the westdepicting decrease in present day deformation.
Figure 8a: Typical Variation Of Vertical Stress With Young's Modulus In Shale
Figure 8b: Typical Variation Of Vertical Stress With Young's Modulus In Sandstone
Vertical stress vs Young's modulus for 2034.235 - 2039.416m depth shale facies
y = 0.0069x + 0.9316R2 = 0.5739
0.940.9450.95
0.9550.96
0.9650.97
0.975
2.5 3 3.5 4 4.5 5 5.5
Young's modulus (MPa)
Verti
cal s
tress
(Psi
/ft)
Vertical stress vs Young's modulus for 2039.569 - 2046.427m depth sandstone facies
y = 0.025x + 0.9076R2 = 0.2607
0.80.850.9
0.951
1.051.1
0 1 2 3 4 5 6
Young's modulus (MPa)
Verti
cal s
tress
(psi
/ft)

89
Int. J. of Geology & Earth Sci., 2019 Fidelis A. Abija, 2019
Mechanics of Growth Faulting andHydrocarbon TrappingRocks are very sensitive in their mechanicalresponse to stress and stress causes them to
have different strengths under tension andcompression. They fracture through crackpropagation when small strains are applied onthem consequently most rocks are brittle. A
Figure 10: Typical Variation Of Vertical Stress With Tensile Strength In Sandstone
Reservoir A, well 05 tensile strength vs vertical streey = 0.0003x + 0.9054
R2 = 0.9796
0.9
0.92
0.94
0.96
0.98
1
1.02
0 50 100 150 200 250 300 350 400 450
Tensile strength (Psi)
Verti
cal s
tress
(Psi
/ft)
Figure 9a: Typical Variation Of Vertical Stress With Rock Matrix Modulus In Sandstone
Reservoir A, well 05 matrix modulus vs vertical stressy = 1E-07x + 0.1716
R2 = 0.6731
0.90.920.940.960.98
11.02
7300000 7400000 7500000 7600000 7700000 7800000 7900000 8000000 8100000
Matrix modulus (Psi)
verti
cal s
tress
(P
si/ft
)
Reservoir A, well 05 matrix modulus vs vertical stressLinear (Reservoir A, well 05 matrix modulus vs vertical stress)

90
Int. J. of Geology & Earth Sci., 2019 Fidelis A. Abija, 2019
Figure 11: Typical Variation Vertical Stress With Rock Grain Compressibility in Sandstone Stone
Reservoir A, Well 05 rock grain compressibility vs vertical stress
y = -4355.1x + 0.9288R2 = 0.5887
0.90.920.940.960.98
11.021.04
-2.50E-05 -2.00E-05 -1.50E-05 -1.00E-05 -5.00E-06 0.00E+00
Cr (Psi-)
Sv (P
si/ft
)
Cr vs Sv Linear (Cr vs Sv)
Figure 12: 1D Geomechanical Model and Facies Correlation in the Field
Datum
A_Top
B_TopC_TopD_TopE_Top
F_Top
G_Top
H_Top
Datum
A_Top
B_Top
C_Top
D_Top
E_Top
F_Top
G_Top
H_Top
347.3
4208.1
500
1000
1500
2000
2500
3000
3500
4000
Datum
A_Top
B_Top
C_Top
D_Top
E_Top
F_Top
G_Top
H_Top
308.5
4169.2
500
1000
1500
2000
2500
3000
3500
4000
567.1
4427.9
1000
1500
2000
2500
3000
3500
4000
Datum
A_TopB_Top
C_TopD_TopE_TopF_Top
G_TopH_Top
WABI-011 [SSTVD]SSTVD
1:28935 0.00 gAPI 150.00 GR
Color fillColor fill
1.6500 g/cm3 2.6500 RHOB
180.00 us/ft 0.00 DT
0.2000 ohm.m 2,000.0000
LLD
-10.5087 19.4819Vshale
-523.0956 6,627.2743FA
692.31 1/bar 1,392.80 To
0.08 1/bar 0.10 Co
1,347.4 175 bar 19,506.0836
UCS(McNally)
- 181, 234,995, 636, 966, 000.00 G Pa 1, 993, 584, 952,006, 630, 000.00
G
-1,133,644.93 GPa 12,201,190.84
E
-260,976.30 GPa 2,348,482.66 Kb
0.00 1/bar 0.00 Cr
-6 87,880.76 1/bar 6,615,626.74 Cb
WABI-05 [SSTVD]SSTVD
1:28935 0.00 gAPI 150.00 GR
Color fillColor fill
0.10 bar/m 10.00 PR
1.6500 g/cm3 2.6500 RHOB
180.00 us/ft 0.00 DT
0.2000 ohm.m 2,000.0 000
LLD
-0.0989 1.0874 Vshale
87.4492 88.5470FA
-95.90 1/bar 2,163.06 To
1,449.67 1/bar 1,450.15 Co
-1,150.8 510 bar 2 5,956.6786
UCS(McNally)
-7,775.82 GPa 38,206.75
G
4,600,201.01 GPa 8,4 31,042.76 Km
-12,486.60 GPa 81,748.24
E
-5,195.37 GPa 23,320.99
Kb
0.00 1/bar 0.00 Cr
Cb
WABI-010 [SSTVD]SSTVD
1:28935 0.00 gAPI 150.00 GR
Color fillColor fill
1.6500 g/cm3 2.6500 RHOB
180.00 us/ft 0.00 DT
0.2000 ohm.m 2,000.000 0
LLD
-0.1853 1.0424 Vshale
18.3184 48.9250FA
-523.10 1/bar 6,627.27To
692.31 1/bar 1,392.80 Co
- 6,277.14 76 bar 79 ,527.2943
UCS(McNally)
-260,976.30 GPa 2,348,4 82.66 G
-687,880.73 GPa 6,615,6 26.45 E
-1,133,644.93 GPa 12,201,190.84
Kb
0.08 1/bar 0.10 Cr
0.00 1/bar 0.00 Cb
Fence alignment : Bot t omDistance: 1608 m .
Fence alignment : Bot tomDistance: 2067 m .

91
Int. J. of Geology & Earth Sci., 2019 Fidelis A. Abija, 2019
Figure 13: Depth Structure Map of the Field
Source: Total E&P Ltd.
characteristic strain softening behavior occurs inwhich gradual decrease in strength withdeformation leads to reduction in volume,distortion of shape and dilation at dense initialparking that follows the law of plasticity(Runesson 2006). In the field of study, tectonicinduced tensile fracturing and faulting in responseto directed stress at magnitudes higher than theyield strength of the rocks, on the flanks of the
field created NE – SW and NW – SE trendinglistric faults followed by synkinematicdownwarping of the downwthrown block andforming a grabben. This processes and actionscreated a depositional centre that wasaccompanied by rapid sedimentation of offlapingcycles of siliciclastic materials as reported in thebasin wide delta scenario (Stacher 1995),depositing intervening sequences of marine

92
Int. J. of Geology & Earth Sci., 2019 Fidelis A. Abija, 2019
shales and sands. Increasing depth of burial andeffective vertical stress accompanied by low rateof fluids diffusion, imposition of most of theoverburden load on; and being borne by the porefluids caused shear enhanced compactionaccompanied by vertical fluid transfer along thefaults and centroid effects in which initially flatsandstone beds surrounded by overpressuredshales were loaded asymmetrically and tilted,creating a hydrostatic pressure in the sandstoneand migration of hydrocarbons into the porousreservoir. Shales are impermeable and whensaturated with incompressible fluids, elasticdeformation is prevented thus generating excesspore pressures which top vary across the fieldfrom 1976m to 2248m, with the depocentre havinga shallower depth. Increasing deposition andburial depth enhanced grain sliding in shear;reduction in the rock compressibility and porevolume, destruction of cement bonding in thereservoirs sands. At the same time, postdepositional diagenetic reactions within theoverpressured shales favoured undercompactioncreating a disequilibrium that was facilitated bytectonic compaction induced by syndepositionalre-orientation of the tectonic stresses during theOligocene to Early Miocene. Continuous and rapidprogradation in the depocentre further increasedthe bed thickness, effective vertical stresstogether with the tectonic stress re-orientation;anisotropy induced greater stress variations anddifferential mechanical response between theshales and the sand units. The imposed verticalstress and re-orientation of the horizontalstresses resulted in increased shale elasticity anddestruction in cement bonding due to tensilemicrofracturing and closer packing of the sandunits. This process caused a change in theazimuth of the NE-SW and NW-SE normal faults
at greater depth due to elastic deformation undershear, forcing the faults to dilate and spread outlaterally under gravity and developing into growthfaults at depths of 3520 – 3600m. Line and shapestructural restoration of the f ie ld andmeasurements depicted the growth index ofthese faults to average 1.99 and 1.11 on east andwest respectively (table 1, figs. 12 and 13). Shalediapirism due to loading of poorly compactedshales from the lower Akata Formation, thecontinental intercalaire is also a causal factor thatfavours growth faulting and these faults continueto grow until they are constrained by adjacentformations.
The accompanying changes in rock volumeand structural style depend on the rockmechanical properties of the specific lithologicunit, its porosity, cementation and burial depth.
Enhanced rapid deposition after the gravityfaulting, syndepositional compressive and shearstresses acting within the formation causes arotational movement of the beds and leading tothe formation of rollover structures on the armand tilting towards the growth faults. Thesequences of the sand beds on these rolloveranticlinal structures forms the reservoirs whilethe shale beds form the cap rocks and smearson the faults providing containment of thehydrocarbon within the sands. Doust andOmatsola (1990) observed that gravity faultingmostly offset different parts of the AgbadaFormation and flatten into detachment planesnear the top of the Akata Formation and thisfaulting style is reportedly prevalent in the basin(Weber and Daokoru 1977) as seen in the fieldof study, causing the downthrown block to remainan active sedimentation centre after theirformation.

93
Int. J. of Geology & Earth Sci., 2019 Fidelis A. Abija, 2019
ConclusionThe geomechanical responses during the basinevolution has created porous and permeablesandstone reservoirs and stratigraphic as wellstructural traps during the synsedimentarycompaction and tectonic deformation of theAgbada paralic sequence in response toincreasing instability of the under-compacted,over-pressured shales and hydrocarbonmigration into the sandstone tertiary petroleumsystem. The depositional environment so createdoffers conditions favourable for hydrocarbonsmigration from the basal Akata Formation, themajor source rock of the basin through the faultconduits into the reservoir sand units while theshale provide capping above and sealing of thefault limbs thus providing good trappingmechanism for containment.
AcknowledgmentThe author would like to thank Total Explorationand production Nigeria Ltd and the Departmentof petroleum Resources, Port Harcourt, Nigeriafor providing data for this research.
References1. Abija F A and Tse A C (2016), “In Situ Stress
Magnitude and Orientation in an OnshoreField, Eastern Niger Delta: Implications forDirectional Drilling”, SPE 184234-MS, pp. 1-15.
2. Anderson T L (2006), Fracture Mechanics:Fundamentals and Applications, 3rd Edition,Boca Raton, CRC Press, Florida.
3. Azizi V and Memarian H (2006), “Estimationof Geomechanical Parameters of ReservoirRocks, Using Conventional Porosity Log”,4th Asian Rock Mechanics Symposium,
Rock Mechanics in UndergroundConstruction.
4. Banerjee S and Muhuri S (2013),“Applications of Geomechanics: BasedRestoration in Structural Analysis AlongPassive Margin Settings, Deep Water NigerDelta Example”, in New Understanding ofthe Petroleum System of ContinentalMargins of the World.
5. Biot M A (1941), “General Theory of ThreeDimensional Consolidation”, J. Appl. Phys.,Vol. 12, No. 2, pp. 155-164. http://dx.doi.org/10.1063/1.1712886.
6. Bruno M S (2001), “GeomechanicalAnalysis and Decision Analysis for MitigatingCompaction Related Casing Damage”, SPE71695, pp. 1-13.
7. Chang C, Zoback M and Khalsar A (2006),“Empirical Relations Between Rock Strengthand Physical Properties in SedimentaryRocks”, Journal of Petroleum Science andEngineering, Vol. 51, pp. 223-237.
8. Cleary J M (1958), “Hydraulic FractureTheory: Part 1 – Mechanics of Materials”,Illinois State Geological Survey Circular 251,pp. 1-25.
9. Coates G R and Denoo S A (1981),“Mechanical Properties Programme UsingBorehole Analysis and Mohr Circle”,SPWLA, 22nd Annual Logging Symposium.
10. Cook J, Rene A F, Hasbo K, Green S, JudzisA, Martiu J W, Suarez-Rivera R, Jorg H,Hooyman P, Lee D, Noerth S, Sayers C,Koutsabelloulis N, Marsden R, Stage M Gand Tan C P (2007), “Rocks Matter: GroundTruth in Geomechanics”, Oil Review, pp. 36-55.

94
Int. J. of Geology & Earth Sci., 2019 Fidelis A. Abija, 2019
11. Crain E R and Holgate D (2004), “Digital Logto Mechanical Rock Properties forStimulation Design”, Focus, pp. 1-9,Geoconvention.
12. Doust H and Omatsola E (1990), “NigerDelta”, in J D Edwards and P A Santogrossi(Eds.), Divergent/passive Margin Basins,pp. 239-248, AAPG Memoir 48, Tulsa, AAPG.
13. Evamy B D, Haremboure J, Kamerling P,Knaap W A, Molloy F A and Rowlands P H(1978), “Hydrocarbon Habitat of Tertiary NigerDelta”, AAPG Bull., Vol. 62, pp. 277-298.
14. Fjaer E, Holt R M, Horsrud P, Raaen A Mand Risnes R (2008), Petroleum RelatedRock Mechanics, Amsterdam, Elsevier.
15. Geerstma J (1973), “Land SubsidenceAbove Compacting Oil and Gas Reservoirs”,J. of Petroleum Technology, Vol. 25, pp. 734-744.
16. Greenberg M L and Castagna J P (1993),“Shear Wave Velocity Estimation in PorousRocks”, Theoretical formulations:Preliminary Verification and Application.Geophysical Prospecting, Vol. 40, pp. 195-209.
17. Hospers J (1965), “Gravity Field andStructure of the Niger Delta, Nigeria, WestAfrica”, Geological Society of AmericanBulletin, Vol. 76, pp. 407-422.
18. Hudson J A and Harrison J P (1997),Engineering Rock Mechanics; AnIntroduction to the Principles, ElservierScience Ltd., p. 444, Oxford.
19. Jones M E, Leddra M J, Goldsmith A S andEdwards D (1992), “The GeomechanicalCharacteristics of Reservoirs and Reservoir
Rocks”, HSE - Offshore Technology Report,OTH 90, 333, pp. 1-202.
20. Kaplan A, Lusser C U and Norton I O (1994),“Tectonic Map of the World, Panel 10”, Tulsa,American Association of PetroleumGeologists, Scale 1:10,000,000.
21. Kulke H (1995), “Nigeria”, in H Kulke (Ed.)“Regional Petroleum Geology of the World.Part II: Africa, America, Australia andAntarctica, pp. 143-172, GebrüderBorntraeger, Berlin.
22. Lal M (1999), “Shale Stability: Drilling FluidInteraction and Shale Strength”, SPE AsiaPacif ic Oil and Gas Conference andExhibition, SPE 54356, pp. 20-22.
23. Larinov V (1962), Borehole Radiometry,USSR Nedra, Moscow.
24. Lehner P and De Ruiter P A C (1977),“Structural History of Atlantic Margin ofAfrica”, American Association of PetroleumGeologists Bulletin, Vol. 61, pp. 961-981.
25. McNally G H (1987), “Estimation of CoalMeasures Rock Strength Using Sonic andNeutron Logs”, Geoexploration, Vol. 24, pp.381-395.
26. Moos D (2006), “Geomechanics Applied toDrilling Engineering”, in W L Lake, and R FMitchel (Eds.), Drilling Engineering, Vol. II,p. 173.
27. O’Connor S, Swarbrick R, Pindar B, LucasO, Adesanya F, Adedayo A, NwankwoaguK, Edwards A, Heller J and Kelly P (2011),“Pore Pressure Prediction in the Niger Delta– Lessons Learnt From Regional Analysis”,NAPE, Lagos Conference Paper ExtendedAbstract.

95
Int. J. of Geology & Earth Sci., 2019 Fidelis A. Abija, 2019
28. Opara A I (2011), “Estimation of MultipleSources of Overpressures Using VerticalEffective Stress Approach: A Case Study ofNiger Delta”, Petroleum and Coal, Vol. 53,No. 4, pp. 302-314.
29. Paul P and Zoback M (2008), “WellboreStability Study for the SAFOD BoreholeThrough the San Andreas Fault”, SPE102781, pp. 394-408.
30. Pietro T, Giuseppe G, Massimiliano F,Anthony S and Dale W (2010), “Land UpliftDue to Subsurface Injection”, Journal ofGeodynamics, Vol. 51, No. 1, pp. 1-17.
31. Runesson K (2006), “Constitutive Modelingof Engineering Materials – Theory andComputation, the Primer”, Lecture Notes,Department of Applied Mechanics, CalmersUniversity of Technology, Goteborg.
32. Schlumberger (1989), Log Interpretation:Principles/Applications, pp. 1-1 – 13-19,Schlumberger Educational Services,Houston.
33. Sinha B K, Wang J, Kisra S, Li J, Pistre V,Bratton T and Sanders M (2008), “Estimationof Formation Stresses Using BoreholeSonic Data”, Society of Petrophysist andWell Log Analyst 49 th Annual LoggingSymposium, pp. 1-16.
34. Short K C and Stäuble A J (1965), “Outlineof geology of Niger Delta”, American
Association of Petroleum GeologistsBulletin, Vol. 51, pp. 761-779.
35. Stacher P (1995), “Present Understandingof the Niger Delta Hydrocarbon Habitat, inM N Oti and G Postma (Eds.), Geology ofDeltas, pp. 257-267, A.A. Balkema,Rotterdam.
36. Turner J P, Healy D, Hillis R R and Welch MJ (2017), “Geomechanics and Geology:Introduction”, in Geomechanics andGeology, Vol. 458, pp. 7-29, GeologicalSociety of London Special Publication.DOI:10.1144/SP 458.15
37. Wolf C, Russell C and Luis N (2005), “LogBased Pore Volume Compressibility – ADeep Water GoM Case Study”, SPE 95545.pp. 1-10.
38. Weber K J and Daukoru E M (1975),“Petroleum Geology Aspects of the NigerDelta”, Proceedings of the Ninth WorldPetroleum Congress, Volume 2, pp. 210-221, Geology, Applied Science Publishers,Ltd., London.
39. Zoback M D, Barton C A, Budy M, Castillo DA, Finkbeinerr T, Grollimund B R, Moos DB, Peska P, Ward C D and Wiprut D J (2003),“Determination of Stress Orientation andMagnitude in Deep Wells”, InternationalJournal of Rock Mechanics and MiningSciences. Vol. 40, pp. 1049-1076.