integrative medicine report
TRANSCRIPT
Integrative Medicine Report
2011 A review of the emerging role of integrative medicine in the U.S. healthcare market and an analysis of markets, trends, competition and strategy in the practitioner channel

NBJ’s Integrative Medicine Report 2011
2 www.nutritionbusinessjournal.com ©2011 Penton Media, Inc.
2.1. ACKNOWLEDGEMENTS ................................................................................................................................................... 13 2.2. RESEARCH METHODOLOGY ............................................................................................................................................. 13
2.2.1. Disclaimer ........................................................................................................................................................ 14 2.2.2. Copyright ......................................................................................................................................................... 14
2.3. DEFINITIONS ................................................................................................................................................................. 14
3.1. U.S. NUTRITION INDUSTRY ............................................................................................................................................. 17 3.1.1. Product Categories .......................................................................................................................................... 17 3.1.2. Channel Sales ................................................................................................................................................... 18 3.1.3. Growth & Forecast ........................................................................................................................................... 19
3.2. U.S. SUPPLEMENT INDUSTRY ........................................................................................................................................... 20 3.2.1. Product Categories .......................................................................................................................................... 20 3.2.2. Channel Sales ................................................................................................................................................... 22 3.2.3. Growth & Forecast ........................................................................................................................................... 24
4.1. U.S. HEALTHCARE EXPENDITURES .................................................................................................................................... 27 4.2. PRACTITIONER POPULATION ............................................................................................................................................ 31 4.1. SUPPLEMENT SALES ....................................................................................................................................................... 33 4.2. THERAPY/SERVICE REVENUES .......................................................................................................................................... 35 4.3. A BRIEF HISTORY OF INTEGRATIVE MEDICINE ...................................................................................................................... 37 4.4. TRENDS ....................................................................................................................................................................... 41
4.4.1. Nutrition Education Programs Offer Vocational Knowledge in Integrative Medicine ..................................... 41 4.4.2. Misinformation Abounds about Interactions between Supplements and Drugs ............................................. 44 4.4.3. One Man’s Quest for Integrated Health .......................................................................................................... 47 4.4.4. Corporate Wellness Programs Sprout Up as Companies Face Higher Healthcare Costs ................................. 48
5.1. ACUPUNCTURE ............................................................................................................................................................. 53 5.1.1. Acupuncture Practitioner Population .............................................................................................................. 53 5.1.2. Supplement Sales ............................................................................................................................................. 54 5.1.3. Therapy/Service Revenues ............................................................................................................................... 56 5.1.4. Trends .............................................................................................................................................................. 57
5.2. AYURVEDA ................................................................................................................................................................... 58 5.2.1. Ayurvedic Practitioner Population ................................................................................................................... 58 5.2.2. Supplement Sales ............................................................................................................................................. 59 5.2.3. Therapy/Service Revenues ............................................................................................................................... 60 5.2.4. Trends .............................................................................................................................................................. 61
5.3. CHIROPRACTIC .............................................................................................................................................................. 63 5.3.1. Chiropractic Practitioner Population ............................................................................................................... 63 5.3.2. Supplement Sales ............................................................................................................................................. 64 5.3.3. Therapy/Service Revenues ............................................................................................................................... 66 5.3.4. Trends .............................................................................................................................................................. 67
5.4. HOMEOPATHY .............................................................................................................................................................. 70 5.4.1. Homeopathic Practitioner Population ............................................................................................................. 70 5.4.2. Supplement Sales ............................................................................................................................................. 71
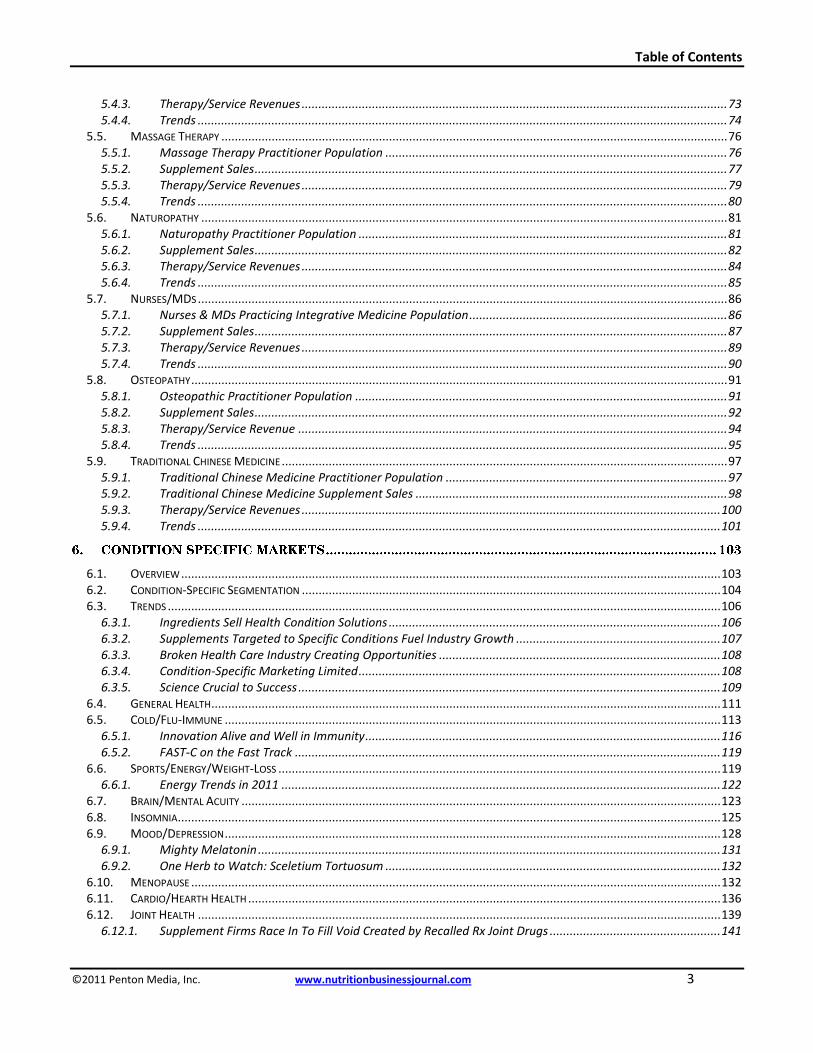
Table of Contents
©2011 Penton Media, Inc. www.nutritionbusinessjournal.com 3
5.4.3. Therapy/Service Revenues ............................................................................................................................... 73 5.4.4. Trends .............................................................................................................................................................. 74
5.5. MASSAGE THERAPY ....................................................................................................................................................... 76 5.5.1. Massage Therapy Practitioner Population ...................................................................................................... 76 5.5.2. Supplement Sales ............................................................................................................................................. 77 5.5.3. Therapy/Service Revenues ............................................................................................................................... 79 5.5.4. Trends .............................................................................................................................................................. 80
5.6. NATUROPATHY ............................................................................................................................................................. 81 5.6.1. Naturopathy Practitioner Population .............................................................................................................. 81 5.6.2. Supplement Sales ............................................................................................................................................. 82 5.6.3. Therapy/Service Revenues ............................................................................................................................... 84 5.6.4. Trends .............................................................................................................................................................. 85
5.7. NURSES/MDS .............................................................................................................................................................. 86 5.7.1. Nurses & MDs Practicing Integrative Medicine Population ............................................................................. 86 5.7.2. Supplement Sales ............................................................................................................................................. 87 5.7.3. Therapy/Service Revenues ............................................................................................................................... 89 5.7.4. Trends .............................................................................................................................................................. 90
5.8. OSTEOPATHY ................................................................................................................................................................ 91 5.8.1. Osteopathic Practitioner Population ............................................................................................................... 91 5.8.2. Supplement Sales ............................................................................................................................................. 92 5.8.3. Therapy/Service Revenue ................................................................................................................................ 94 5.8.4. Trends .............................................................................................................................................................. 95
5.9. TRADITIONAL CHINESE MEDICINE ..................................................................................................................................... 97 5.9.1. Traditional Chinese Medicine Practitioner Population .................................................................................... 97 5.9.2. Traditional Chinese Medicine Supplement Sales ............................................................................................. 98 5.9.3. Therapy/Service Revenues ............................................................................................................................. 100 5.9.4. Trends ............................................................................................................................................................ 101
6.1. OVERVIEW ................................................................................................................................................................. 103 6.2. CONDITION-SPECIFIC SEGMENTATION ............................................................................................................................. 104 6.3. TRENDS ..................................................................................................................................................................... 106
6.3.1. Ingredients Sell Health Condition Solutions ................................................................................................... 106 6.3.2. Supplements Targeted to Specific Conditions Fuel Industry Growth ............................................................. 107 6.3.3. Broken Health Care Industry Creating Opportunities .................................................................................... 108 6.3.4. Condition-Specific Marketing Limited ............................................................................................................ 108 6.3.5. Science Crucial to Success .............................................................................................................................. 109
6.4. GENERAL HEALTH ........................................................................................................................................................ 111 6.5. COLD/FLU-IMMUNE .................................................................................................................................................... 113
6.5.1. Innovation Alive and Well in Immunity .......................................................................................................... 116 6.5.2. FAST-C on the Fast Track ............................................................................................................................... 119
6.6. SPORTS/ENERGY/WEIGHT-LOSS .................................................................................................................................... 119 6.6.1. Energy Trends in 2011 ................................................................................................................................... 122
6.7. BRAIN/MENTAL ACUITY ............................................................................................................................................... 123 6.8. INSOMNIA .................................................................................................................................................................. 125 6.9. MOOD/DEPRESSION .................................................................................................................................................... 128
6.9.1. Mighty Melatonin .......................................................................................................................................... 131 6.9.2. One Herb to Watch: Sceletium Tortuosum .................................................................................................... 132
6.10. MENOPAUSE .............................................................................................................................................................. 132 6.11. CARDIO/HEARTH HEALTH ............................................................................................................................................. 136 6.12. JOINT HEALTH ............................................................................................................................................................ 139
6.12.1. Supplement Firms Race In To Fill Void Created by Recalled Rx Joint Drugs ................................................... 141

NBJ’s Integrative Medicine Report 2011
4 www.nutritionbusinessjournal.com ©2011 Penton Media, Inc.
6.12.2. Primus Pharmaceuticals Takes Medical Food Route to Help Osteoarthritis Sufferers .................................. 144 6.13. SEXUAL HEALTH .......................................................................................................................................................... 145 6.14. BONE HEALTH ............................................................................................................................................................ 147 6.15. GASTROINTESTINAL HEALTH .......................................................................................................................................... 150
6.15.1. As Digestive Problems Bloom, So Do Sales of Probiotics And Other Gut Supplements.................................. 153 6.15.2. Using Star Power to Broach Gut Health......................................................................................................... 154 6.15.3. Getting Probiotics Down to a Science ............................................................................................................ 154 6.15.4. Smooth Move Moving Well ........................................................................................................................... 155 6.15.5. Enzymes Remain a Digestive-Health Staple................................................................................................... 155 6.15.6. Jigsaw Pieces Together Solutions for Chronic Pain Sufferers ......................................................................... 156
6.16. DIABETES ................................................................................................................................................................... 157 6.16.1. With Obesity Rates Growing, Nutrition Firms Vie for Their Piece of the Diabetes Pie ................................... 160 6.16.2. Chromium Used for Diabetes Treatment ....................................................................................................... 162 6.16.3. DSM Bringing Back Forbidden Foods with InsuVital ...................................................................................... 163 6.16.4. Promising Diabetes-Specific Supplements ..................................................................................................... 164
6.17. CANCER PREVENTION ................................................................................................................................................... 165 6.17.1. Supplement Use High Among People Looking to Treat, Prevent Cancer, Study Shows ................................. 168
6.18. HAIR/SKIN/NAILS ....................................................................................................................................................... 172 6.19. VISION/EYE HEALTH .................................................................................................................................................... 175 6.20. ANTI-AGING ............................................................................................................................................................... 176
6.20.1. Adding Life to Your Years ............................................................................................................................... 178 6.20.2. LifeVantage Corp. Aims for a Sales Comeback With its Anti-Aging Pill, Protandim ...................................... 179
7.1. CONSUMER SUPPLEMENT USAGE & SPENDING ................................................................................................................. 183 7.2. CHILDREN’S SUPPLEMENT USAGE ................................................................................................................................... 184 7.3. TOP SUPPLEMENTS USED BY ADULTS VIA PRACTITIONERS.................................................................................................... 185 7.4. CONSUMER SUPPLEMENT SURVEY .................................................................................................................................. 185
7.4.1. Supplement Users .......................................................................................................................................... 185 7.4.2. Non-Users ...................................................................................................................................................... 191
7.5. TRENDS ..................................................................................................................................................................... 192 7.5.1. Recession Makes Wellness a More Urgent Priority for Most Consumer Groups ........................................... 192
8.1. NUTRITION INDUSTRY PRACTITIONER SALES ...................................................................................................................... 199 8.1.1. Nutrition: Channel Comparison ..................................................................................................................... 200 8.1.2. Nutrition: Product Sales ................................................................................................................................. 203
8.2. SUPPLEMENT PRACTITIONER SALES ................................................................................................................................. 204 8.2.1. Supplements: Channel Comparison ............................................................................................................... 205 8.2.2. Supplements: Product Sales ........................................................................................................................... 207 8.2.3. Supplements: Growth and Forecast ............................................................................................................... 209
Top Supplement Companies in the Practitioner Channel ................................................................................... 211 8.3. PRACTITIONER SURVEY ................................................................................................................................................. 212 8.4. PRACTITIONER TRENDS ................................................................................................................................................. 219
8.4.1. Should Doctors Be Selling Supplements to Patients? ..................................................................................... 219 8.4.2. Emerson Ecologics Works to Break Down Barriers Separating Practitioners and Dietary Supplements ....... 222 8.4.3. How to Achieve Practitioner Channel Success ............................................................................................... 225 8.4.4. Whither Goes the Wise Woman .................................................................................................................... 226 8.4.5. Diversified Natural Products Adds Thorne Research to Growth Mix ............................................................. 227 8.4.6. Case Study: Using Practitioner Endorsement to Increase Online Sales.......................................................... 227
9.1. WHAT DOES THE FUTURE HOLD FOR INTEGRATIVE MEDICINE? ............................................................................................ 231
Table of Contents
©2011 Penton Media, Inc. www.nutritionbusinessjournal.com 5
9.2. MULLIN: YOU’RE SEEING A NEW GENERATION OF DOCTORS THAT IS MORE OPEN TO SUPPLEMENTS .......................................... 236 9.3. HARTMAN GROUP: CONSUMERS EMBRACE HOLISTIC VIEW OF HEALTH AND WELLNESS ........................................................... 237 9.4. METAGENICS CEO: WE NEED ALTICOR’S BACKING TO MAKE A DENT IN CHRONIC ILLNESS EPIDEMIC .......................................... 239 9.5. GUARNERI: THERE'S A TIME FOR FISH OIL, AND THERE'S A TIME FOR BYPASS SURGERY ............................................................ 242
10.1. COMPANY PROFILES .................................................................................................................................................... 247 10.1.1. Abbott Labs/Ross Products (Ensure, EAS) ...................................................................................................... 247 10.1.2. Alcon Labs ...................................................................................................................................................... 249 10.1.3. Allergy Research (KI NutriCare) ..................................................................................................................... 250 10.1.4. Applied Nutrition Inc. (Nature's Secret, Irwin Naturals) ................................................................................ 251 10.1.5. Atrium Innovations (Pure Encapsulations, Douglas Labs) ............................................................................. 252 10.1.6. Bausch & Lomb .............................................................................................................................................. 255 10.1.7. Designs for Health ......................................................................................................................................... 256 10.1.8. Emerson Ecologics, Inc. .................................................................................................................................. 258 10.1.9. Enzymedica .................................................................................................................................................... 260 10.1.10. Futurebiotics .................................................................................................................................................. 261 10.1.11. Herbalist & Alchemist .................................................................................................................................... 262 10.1.12. Martek (Amerifit Brands) ............................................................................................................................... 263 10.1.13. Metabolic Maintenance Products .................................................................................................................. 265 10.1.14. Metagenics .................................................................................................................................................... 267 10.1.15. Mushroom Wisdom, Inc. (formerly Maitake Products) ................................................................................. 269 10.1.16. Nordic Naturals .............................................................................................................................................. 270 10.1.17. Pioneer Nutritional Formulas Inc. .................................................................................................................. 272 10.1.18. Progressive Laboratories, Inc. ........................................................................................................................ 273 10.1.19. Real Health Laboratories ............................................................................................................................... 274 10.1.20. Schwabe North America (Enzymatic Therapy, Integrative Therapeutics) ..................................................... 275 10.1.21. Standard Process ........................................................................................................................................... 276 10.1.22. SuperNutrition ............................................................................................................................................... 278 10.1.23. Theralogix ...................................................................................................................................................... 279 10.1.24. Thorne Research, Inc...................................................................................................................................... 280 10.1.25. Vibrant Health ............................................................................................................................................... 282 10.1.26. Xymogen, Inc. ................................................................................................................................................ 283
10.2. INTEGRATIVE HEALTHCARE ORGANIZATIONS ..................................................................................................................... 285 10.2.1. Alternative Medicine Integration Group ........................................................................................................ 285 10.2.2. American Association of Acupuncture and Oriental Medicine ...................................................................... 285 10.2.3. American Association of Naturopathic Physicians......................................................................................... 285 10.2.4. American Chiropractic Association ................................................................................................................ 285 10.2.5. American Dental Association ......................................................................................................................... 286 10.2.6. American Massage Therapy Association ....................................................................................................... 286 10.2.7. American Medical Association ....................................................................................................................... 286 10.2.8. American Nurses Association ........................................................................................................................ 286 10.2.9. American Osteopathic Association ................................................................................................................ 286 10.2.10. National Ayurvedic Medical Association ....................................................................................................... 287 10.2.11. National Center for Complementary and Alternative Medicine .................................................................... 287 10.2.12. National Center for Homeopathy .................................................................................................................. 287 10.2.13. National Certification Commission for Acupuncture and Oriental Medicine ................................................. 287 10.2.14. North American Society of Homeopaths ....................................................................................................... 288

NBJ’s Integrative Medicine Report 2011
6 www.nutritionbusinessjournal.com ©2011 Penton Media, Inc.
Figure 1-1 U.S. Practitioner Supplement Sales Growth by Modality in 2009.......................................................... 11 Figure 3-1 U.S. Nutrition Industry Sales by Product , 1999-2009 ............................................................................ 17 Figure 3-2 U.S. Nutrition Industry Sales Growth by Product, 1999-2009 ............................................................... 18 Figure 3-3 U.S. Total Nutrition Industry Sales by Channel in 2009 ......................................................................... 18 Figure 3-4 U.S. Nutrition Industry Sales & Growth by Channel in 2009 .................................................................. 19 Figure 3-5 U.S. Nutrition Industry Sales by Product, 2010e-2017e ......................................................................... 19 Figure 3-6 U.S. Nutrition Industry Sales Growth by Product, 2010e-2017e ........................................................... 20 Figure 3-7 U.S. Dietary Supplement Sales by Product , 1999-2009 ........................................................................ 21 Figure 3-8 U.S. Dietary Supplement Sales Growth by Product , 1999-2009 ........................................................... 21 Figure 3-9 U.S. Dietary Supplement Sales by Product as % of Total , 1999-2009 ................................................... 22 Figure 3-10 U.S. Dietary Supplement Sales by Channel in 2009 ............................................................................. 23 Figure 3-11 U.S. Dietary Supplement Sales and Annual Growth by Channel, 2006-2009 ...................................... 23 Figure 3-12 U.S. Dietary Supplements Product Category Sales Growth, 2000-2017e ............................................ 24 Figure 3-13 U.S. Dietary Supplements vs. Total Nutrition Industry Sales Growth, 2000-2017e ............................. 25 Figure 4-1 U.S. Healthcare Industry Expenditures, 2003-2010e ............................................................................. 28 Figure 4-2 U.S. Gross Domestic Product vs. National Healthcare Expenditures Growth, 2000-2010e................... 29 Figure 4-3 U.S. Prescription Drug, OTC and Supplement Product Sales Growth, 2000-2010e ............................... 30 Figure 4-4 U.S. Integrative Licensed, Lay, Student & Part-Time Practitioner Population & Growth, 2000-2017e . 31 Figure 4-5 U.S. Practitioner Population by Modality , 2000-2009........................................................................... 32 Figure 4-6 U.S. Practitioner Population by Modality , 2010e-2017e....................................................................... 33 Figure 4-7 U.S. Integrative Medicine Supplement Sales & Growth, 2000-2017e ................................................... 34 Figure 4-8 U.S. Practitioner Supplement Sales by Modality , 2000-2009 ............................................................... 34 Figure 4-9 Forecasted U.S. Practitioner Supplement Sales by Modality , 2010e-2017e ......................................... 35 Figure 4-10 U.S. Integrative Medicine Service Revenues & Growth, 2000-2017e .................................................. 36 Figure 4-11 U.S. Practitioner Service Revenues by Modality , 2000-2009 .............................................................. 36 Figure 4-12 Forecasted U.S. Practitioner Service Revenues by Modality , 2010e-2017e ....................................... 37 Figure 5-1 U.S. Acupuncture Professional Population & Growth, 2000-2017e ...................................................... 53 Figure 5-2 U.S. Acupuncturist Population, Licensed vs. Lay, 2000-2009 ................................................................. 53 Figure 5-3 U.S. Acupuncture Supplement Sales & Growth, 2000-2017e ................................................................ 54 Figure 5-4 U.S. Acupuncturist Supplement Sales & Growth, 2000-2009 ................................................................ 54 Figure 5-5 U.S. Acupuncturist Supplement Forecast Sales & Growth, 2010e-2017e ............................................. 55 Figure 5-6 U.S. Acupuncturist Supplement Sales as a % of Total Practitioner Supplement Sales in 2009 ............. 55 Figure 5-7 U.S. Acupuncture Service Revenues & Growth, 2000-2017e................................................................. 56 Figure 5-8 U.S. Acupuncturist Service Revenues & Growth, 2000-2009 ................................................................. 56 Figure 5-9 U.S. Acupuncturist Forecast Service Revenues & Growth, 2010e-2017e .............................................. 57 Figure 5-10 U.S. Ayurvedic Practitioner Population & Growth, 2000-2017e .......................................................... 58 Figure 5-11 U.S. Ayurvedic Population, Licensed vs. Lay, 2000-2009 ..................................................................... 58 Figure 5-12 U.S. Ayurveda Supplement Sales & Growth, 2000-2017e ................................................................... 59 Figure 5-13 U.S. Ayurveda Supplement Sales & Growth, 2000-2009 ..................................................................... 59 Figure 5-14 U.S. Ayurveda Supplement Forecast Sales & Growth, 2010e-2017e ................................................... 60 Figure 5-15 U.S. Ayurveda Service Revenues & Growth, 2000-2017e .................................................................... 60 Figure 5-16 U.S. Ayurveda Service Revenues & Growth, 2000-2009 ...................................................................... 61 Figure 5-17 U.S. Ayurveda Forecast Service Revenues & Growth, 2010e-2017e ................................................... 61 Figure 5-18 U.S. Chiropractic Practitioner Population & Growth, 2000-2017e ...................................................... 63 Figure 5-19 U.S. Chiropractic Practitioner Population, Licensed vs. Lay, 2000-2009 .............................................. 63
Index of Figures
©2011 Penton Media, Inc. www.nutritionbusinessjournal.com 7
Figure 5-20 U.S. Chiropractic Supplement Sales & Growth, 2000-2017e ............................................................... 64 Figure 5-21 U.S. Chiropractic Supplement Sales & Growth, 2000-2009 ................................................................. 64 Figure 5-22 U.S. Chiropractic Supplement Forecast Sales & Growth, 2010e-2017e .............................................. 65 Figure 5-23 U.S. Chiropractic Supplement Sales as a % of Total Practitioner Supplement Sales in 2009 .............. 65 Figure 5-24 U.S. Chiropractic Service Revenues & Growth, 2000-2017e ................................................................ 66 Figure 5-25 U.S. Chiropractic Service Revenues & Growth, 2000-2009 .................................................................. 66 Figure 5-26 U.S. Chiropractic Forecast Service Revenues & Growth, 2010e-2017e ............................................... 67 Figure 5-27 U.S. Homeopathic Practitioner Population & Growth, 2000-2017e .................................................... 70 Figure 5-28 U.S. Homeopathic Practitioner Population, Licensed vs. Lay, 2000-2009 ........................................... 70 Figure 5-29 U.S. Homeopathic Supplement Sales & Growth, 2000-2017e ............................................................. 71 Figure 5-30 U.S. Homeopathic Supplement Sales & Growth, 2000-2009 ............................................................... 71 Figure 5-31 U.S. Homeopathic Supplement Forecast Sales & Growth, 2010e-2017e ............................................ 72 Figure 5-32 U.S. Homeopathic Supplement Sales as a % of Total Practitioner Supplement Sales in 2009 ............ 72 Figure 5-33 U.S. Homeopathic Service Revenues & Growth, 2000-2017e.............................................................. 73 Figure 5-34 U.S. Homeopathic Service Revenues & Growth, 2000-2009 ............................................................... 73 Figure 5-35 U.S. Homeopathic Forecast Service Revenues & Growth, 2010e-2017e ............................................. 74 Figure 5-36 U.S. Massage Therapy Practitioner Population & Growth, 2000-2017e .............................................. 76 Figure 5-37 U.S. Massage Therapy Practitioner Population, Licensed vs. Lay, 2000-2009 ..................................... 76 Figure 5-38 U.S. Massage Therapy Supplement Sales & Growth, 2000-2017e ...................................................... 77 Figure 5-39 U.S. Massage Therapy Supplement Sales & Growth, 2000-2009 ........................................................ 77 Figure 5-40 U.S. Massage Therapy Supplement Forecast Sales & Growth, 2010e-2017e ...................................... 78 Figure 5-41 U.S. Massage Therapy Supplement Sales as a % of Total Practitioner Supplement Sales in 2009 ...... 78 Figure 5-42 U.S. Massage Therapy Service Revenues & Growth, 2000-2017e ....................................................... 79 Figure 5-43 U.S. Massage Therapy Service Revenues & Growth, 2000-2009 ......................................................... 79 Figure 5-44 U.S. Massage Therapy Forecast Service Revenues & Growth, 2010e-2017e ...................................... 80 Figure 5-45 U.S. Naturopathy Practitioner Population & Growth, 2000-2017e ..................................................... 81 Figure 5-46 U.S. Naturopathy Practitioner Population, Licensed vs. Lay, 2000-2009 ............................................. 81 Figure 5-47 U.S. Naturopathy Supplement Sales & Growth, 2000-2017e .............................................................. 82 Figure 5-48 U.S. Naturopathy Supplement Sales & Growth, 2000-2009 ................................................................ 82 Figure 5-49 U.S. Naturopathy Supplement Forecast Sales & Growth, 2010e-2017e ............................................. 83 Figure 5-50 U.S. Naturopathy Supplement Sales as a % of Total Practitioner Supplement Sales in 2009 ............. 83 Figure 5-51 U.S. Naturopathy Service Revenues & Growth, 2000-2017e ............................................................... 84 Figure 5-52 U.S. Naturopathy Service Revenues & Growth, 2000-2009 ................................................................. 84 Figure 5-53 U.S. Naturopathy Forecast Service Revenues & Growth, 2010e-2017e .............................................. 85 Figure 5-54 U.S. Nurse/MD Practitioner Population & Growth, 2000-2017e ......................................................... 86 Figure 5-55 U.S. Nurse/MD Practitioner Population, Licensed vs. Lay, 2000-2009 ................................................ 86 Figure 5-56 U.S. Nurse/MD Supplement Sales & Growth, 2000-2017e .................................................................. 87 Figure 5-57 U.S. Nurse/MD Supplement Sales & Growth, 2000-2009 .................................................................... 87 Figure 5-58 U.S. Nurse/MD Supplement Forecast Sales & Growth, 2010e-2017e ................................................. 88 Figure 5-59 U.S. Nurse/MD Supplement Sales as a % of Total Practitioner Supplement Sales in 2009 ................. 88 Figure 5-60 U.S. Nurse/MD Service Revenues & Growth, 2000-2017e .................................................................. 89 Figure 5-61 U.S. Nurse/MD Service Revenues & Growth, 2000-2009 .................................................................... 89 Figure 5-62 U.S. Nurse/MD Forecast Service Revenues & Growth, 2010e-2017e .................................................. 89 Figure 5-63 U.S. Osteopathic Practitioner Population & Growth, 2000-2017e ...................................................... 91 Figure 5-64 U.S. Osteopathic Practitioner Population, Licensed vs. Lay, 2000-2009 .............................................. 91 Figure 5-65 U.S. Osteopathic Supplement Sales & Growth, 2000-2017e ............................................................... 92 Figure 5-66 U.S. Osteopathic Supplement Sales & Growth, 2000-2009 ................................................................. 92

NBJ’s Integrative Medicine Report 2011
8 www.nutritionbusinessjournal.com ©2011 Penton Media, Inc.
Figure 5-67 U.S. Osteopathic Supplement Forecast Sales & Growth, 2010e-2017e .............................................. 93 Figure 5-68 U.S. Osteopathic Supplement Sales as a % of Total Practitioner Supplement Sales in 2009 .............. 93 Figure 5-69 U.S. Osteopathic Service Revenues & Growth, 2000-2017e ................................................................ 94 Figure 5-70 U.S. Osteopathic Service Revenues & Growth, 2000-2009 .................................................................. 94 Figure 5-71 U.S. Osteopathic Forecast Service Revenues & Growth, 2010e-2017e ............................................... 95 Figure 5-72 U.S. TCM Practitioner Population & Growth, 2000-2017e .................................................................. 97 Figure 5-73 U.S. TCM Practitioner Population, Licensed vs. Lay, 2000-2009 .......................................................... 97 Figure 5-74 U.S. TCM Supplement Sales & Growth, 2000-2017e ........................................................................... 98 Figure 5-75 U.S. TCM Supplement Sales & Growth, 2000-2009 ............................................................................. 98 Figure 5-76 U.S. TCM Supplement Forecast Sales & Growth, 2010e-2017e ........................................................... 99 Figure 5-77 U.S. TCM Supplement Sales as a % of Total Practitioner Supplement Sales in 2009 ........................... 99 Figure 5-78 U.S. TCM Service Revenues & Growth, 2000-2017e .......................................................................... 100 Figure 5-79 U.S. TCM Service Revenues & Growth, 2000-2009 ............................................................................ 100 Figure 5-80 U.S. TCM Forecast Service Revenues & Growth, 2010e-2017e ......................................................... 101 Figure 6-1 U.S. Supplement Sales by Condition in 2009 ....................................................................................... 103 Figure 6-2 U.S. Dietary Supplement Sales & Growth by Condition Specific Market, 2005-2009 .......................... 104 Figure 6-3 U.S. Healthcare Product Sales by Market, 1999-2009 ......................................................................... 105 Figure 6-4 U.S. Healthcare Product Sales by Top 17 Conditions, 1999-2009 ........................................................ 105 Figure 6-5 U.S. Condition Specific Supplement, OTC and Rx Sales in 2009 ........................................................... 106 Figure 6-6 U.S. General Health Condition Specific Supplement Sales by Product in 2009 ................................... 111 Figure 6-7 U.S. General Health Condition Specific Supplement Sales & Growth, 1999-2009............................... 112 Figure 6-8 U.S. General Health Condition Specific Supplement Sales, 1999-2009 ............................................... 113 Figure 6-9 U.S. Cold/Flu-Immune Condition Specific Supplement Sales by Product in 2009 ............................... 114 Figure 6-10 U.S. Cold/Flu-Immune Condition Specific Supplement Sales & Growth, 1999-2009 ........................ 115 Figure 6-11 U.S. Cold/Flu-Immune Condition Specific Sales by Market, 1999-2009 ............................................ 115 Figure 6-12 U.S. Sports/Energy/Weight-Loss Condition Specific Supplement Sales by Product in 2009 ............. 120 Figure 6-13 U.S. Sports/Energy/Weight-Loss Condition Specific Supplement Sales & Growth, 1999-2009 ......... 121 Figure 6-14 U.S. Sports/Energy/Weight-Loss Condition Specific Sales by Market, 1999-2007 ............................ 121 Figure 6-15 U.S. Sports/Energy/Weight-Loss Condition Specific Supplement Sales, 1999-2009 ......................... 122 Figure 6-16 U.S. Brain/Mental Acuity Condition Specific Supplement Sales by Product in 2009 ......................... 123 Figure 6-17 U.S. Brain/Mental Acuity Condition Specific Supplement Sales & Growth, 1999-2009 .................... 124 Figure 6-18 U.S. Brain/Mental Acuity Condition Specific Sales by Market, 2003-2009 ........................................ 125 Figure 6-19 U.S. Brain/Mental Acuity Condition Specific Supplement Sales, 1999-2009 .................................... 125 Figure 6-20 U.S. Insomnia Condition Specific Supplement Sales by Product in 2009 ........................................... 126 Figure 6-21 U.S. Insomnia Condition Specific Supplement Sales & Growth, 1999-2009 ...................................... 127 Figure 6-22 U.S. Insomnia Condition Specific Sales by Market, 1999-2009 .......................................................... 127 Figure 6-23 U.S. Insomnia Condition Specific Supplement Sales, 1999-2009 ....................................................... 128 Figure 6-24 U.S. Mood/Depression Condition Specific Supplement Sales by Product in 2009 ............................ 129 Figure 6-25 U.S. Mood/Depression Condition Specific Supplement Sales & Growth, 1999-2009........................ 130 Figure 7-27 U.S. Mood/Depression Condition Specific Sales by Market, 1999-2009 ........................................... 130 Figure 7-28 U.S. Mood/Depression Condition Specific Supplement Sales, 1999-2009 ........................................ 131 Figure 7-29 U.S. Menopause Condition Specific Supplement Sales by Product in 2009 ...................................... 133 Figure 6-29 U.S. Menopause Condition Specific Supplement Sales & Growth, 1999-2009 .................................. 134 Figure 6-30 U.S. Menopause Condition Specific Sales by Market, 1999-2009 ..................................................... 134 Figure 6-31 U.S. Menopause Condition Specific Supplement Sales, 1999-2009 .................................................. 135 Figure 6-32 U.S. Cardio/Heart Health Condition Specific Supplement Sales by Product in 2009 ......................... 136 Figure 6-33 U.S. Cardio/Heart Health Condition Specific Supplement Sales & Growth, 1999-2009 .................... 137 Figure 6-34 U.S. Cardio/Heart Health Condition Specific Sales by Market, 1999-2009 ........................................ 137
Index of Figures
©2011 Penton Media, Inc. www.nutritionbusinessjournal.com 9
Figure 6-35 U.S. Cardio/Heart Health Condition Specific Supplement Sales, 1999-2009 ..................................... 138 Figure 6-36 U.S. Joint Health Condition Specific Supplement Sales by Product in 2009 ...................................... 139 Figure 7-38 U.S. Joint Health Condition Specific Supplement Sales & Growth, 1999-2009.................................. 140 Figure 7-39 U.S. Joint Health Condition Specific Sales by Market, 1999-2009 ..................................................... 140 Figure 7-40 U.S. Joint Health Condition Specific Supplement Sales, 1999-2009 .................................................. 141 Figure 6-40 U.S. Sexual Health Condition Specific Supplement Sales by Product in 2009.................................... 145 Figure 6-41 U.S. Sexual Health Condition Specific Supplement Sales & Growth, 1999-2009 ............................... 146 Figure 6-42 U.S. Sexual Health Condition Specific Sales by Market, 1999-2009 ................................................... 146 Figure 6-43 U.S. Sexual Health Condition Specific Supplement Sales, 1999-2009 ................................................ 147 Figure 6-44 U.S. Bone Health Condition Specific Supplement Sales by Product in 2009 ...................................... 148 Figure 6-45 U.S. Bone Health Condition Specific Supplement Sales & Growth, 1999-2009 ................................. 149 Figure 6-46 U.S. Bone Health Condition Specific Supplement Sales, 1999-2009 .................................................. 149 Figure 6-47 U.S. Gastrointestinal Health Condition Specific Supplement Sales by Product in 2009 .................... 150 Figure 6-48 U.S. Gastrointestinal Health Condition Specific Supplement Sales & Growth, 1999-2009 ............... 151 Figure 6-49 U.S. Gastrointestinal Health Condition Specific Sales by Market, 1999-2009 ................................... 152 Figure 6-50 U.S. Gastrointestinal Health Condition Specific Supplement Sales, 1999-2009 ................................ 153 Figure 6-51 U.S. Diabetes Condition Specific Supplement Sales by Product in 2009 ........................................... 158 Figure 6-52 U.S. Diabetes Condition Specific Supplement Sales & Growth, 1999-2009 ....................................... 159 Figure 6-53 U.S. Diabetes Health Condition Specific Sales by Market, 1999-2009 ............................................... 159 Figure 6-54 U.S. Diabetes Health Condition Specific Supplement Sales, 1999-2009 ............................................ 160 Figure 6-55 U.S. Cancer Prevention Condition Specific Supplement Sales by Product in 2009 ............................ 165 Figure 6-56 U.S. Cancer Prevention Condition Specific Supplement Sales & Growth, 1999-2009 ....................... 166 Figure 6-57 U.S. Cancer Prevention Condition Specific Sales by Market, 1999-2009 ........................................... 166 Figure 6-58 U.S. Cancer Prevention Condition Specific Supplement Sales, 1999-2009 ........................................ 167 Figure 6-59 U.S. Hair/Skin/Nails Condition Specific Supplement Sales by Product in 2009 ................................. 173 Figure 6-60 U.S. Hair/Skin/Nails Condition Specific Supplement Sales, 2006-2009 ............................................. 173 Figure 6-61 U.S. Vision Condition Specific Supplement Sales by Product in 2009 ................................................ 175 Figure 6-62 U.S. Vision Condition Specific Supplement Sales, 2006-2009 ............................................................ 176 Figure 6-63 U.S. Anti-Aging Condition Specific Supplement Sales by Product in 2009 ......................................... 177 Figure 6-64 U.S. Anti-Aging Condition Specific Supplement Sales, 2006-2009 ..................................................... 178 Figure 7-1 U.S. Consumer Use of Dietary Supplements in 2009 ........................................................................... 183 Figure 7-2 U.S. Consumer Use of Dietary Supplements in 1999 ........................................................................... 183 Figure 7-3 U.S. Children’s Nonvitamin, Nonmineral Supplement Usage, 2007 .................................................... 184 Figure 7-4 U.S. Adult Nonvitamin, Nonmineral Supplement Usage, 2007 ............................................................ 185 Figure 7-5 NBJ Survey: Top Factors When Choosing Which Supplements to Purchase ....................................... 186 Figure 7-6 NBJ Survey: Recession’s Effect on Supplement Usage ......................................................................... 187 Figure 7-7 NBJ Survey: Top Factors When Choosing Where to Purchase Supplements ....................................... 188 Figure 7-8 NBJ Survey: Top Children’s Supplements ............................................................................................. 189 Figure 7-9 U.S. Dietary Supplement Sales by Channel, 1999-2009 ....................................................................... 190 Figure 7-10 U.S. Dietary Supplement Sales and Annual Growth by Channel, 2006-2009 .................................... 190 Figure 7-11 NBJ Survey: Reasons for Not Taking Supplements ............................................................................. 191 Figure 7-12 NBJ Survey: Convincing Non-Users to Use Supplements Regularly ................................................... 192 Figure 8-1 U.S. Nutrition Industry Practitioner Channel S.W.O.T. Analysis........................................................... 197 Figure 8-2 U.S. Nutrition Industry Practitioner Sales & Growth, 1997-2009 ........................................................ 199 Figure 8-3 U.S. Nutrition Industry Practitioner Sales as a % of Total Nutrition Industry Sales in 2009 ................ 200 Figure 8-4 U.S. Practitioner Nutrition Sales as a % of Direct Nutrition Sales in 2009 ........................................... 200 Figure 8-5 U.S. Nutrition Industry Practitioner vs. Total Direct Sales and Growth, 1999-2009 ............................ 201
NBJ’s Integrative Medicine Report 2011
10 www.nutritionbusinessjournal.com ©2011 Penton Media, Inc.
Figure 8-6 U.S. Nutrition Industry Practitioner vs. Total Direct Sales and Growth, 2010e-2017e ........................ 201 Figure 8-7 U.S. Nutrition Industry Practitioner Sales & Growth, 2000-2017e ...................................................... 202 Figure 8-8 U.S. Nutrition Industry Practitioner Sales by Product, 1999 vs. 2009 .................................................. 203 Figure 8-9 U.S. Nutrition Practitioner Sales by Product, 1997-2009 ..................................................................... 204 Figure 8-10 U.S. Practitioner Supplement Sales & Growth, 1999-2009 ................................................................ 204 Figure 8-11 U.S. Practitioner Supplement Sales as a % of Total Supplement Sales in 2009 ................................. 205 Figure 8-12 U.S. Practitioner Supplement Sales as a % of Direct Supplement Sales in 2009 ............................... 206 Figure 8-13 U.S. Supplement Practitioner vs. Total Direct Sales and Growth, 1999-2009 ................................... 206 Figure 8-14 U.S. Supplement Practitioner vs. Total Direct Sales and Growth, 2010e-2017e ............................... 207 Figure 8-15 U.S Practitioner Supplement Sales by Product, 1999 vs. 2009 .......................................................... 207 Figure 8-16 U.S. Practitioner Supplement Sales by Product, 1999-2009 .............................................................. 208 Figure 8-17 U.S. Practitioner Supplement Sales Growth by Product, 2000-2009 ................................................. 208 Figure 8-18 U.S. Practitioner Supplement Sales by Product as % of Total, 1999-2009 ......................................... 209 Figure 8-19 U.S. Practitioner Supplement Sales & Growth, 2000-2017e .............................................................. 209 Figure 8-20 U.S. Practitioner Supplement Sales by Product, 2010e-2017e .......................................................... 210 Figure 8-21 U.S. Practitioner Supplement Sales Growth by Product, 2010e-2017e ............................................. 210 Figure 8-22 U.S. Practitioner Supplement Sales by Product as % of Total, 2010e-2017e ..................................... 210 Figure 8-23 Top Companies – U.S. Supplement Sales in the Healthcare Practitioner Sales Channel in 2009 ...... 211 Figure 8-24 How Knowledgeable Are You About Supplements? .......................................................................... 212 Figure 8-25 Do You Sell Supplements in Your Office? ........................................................................................... 213 Figure 8-26 Where Practitioners Not Selling Supplements Recommend Patients Go to Buy Supplements ........ 214 Figure 8-27 NBJ Practitioner Survey: Percentage of Patients Buying Supplements in Practitioner Office ........... 215 Figure 8-28 NBJ Practitioner Survey: Where Do You Buy the Supplements You Sell Patients? ............................ 215 Figure 8-29 NBJ Practitioner Survey: Breakdown of Supplement Sales by Product Category .............................. 216 Figure 8-30 NBJ Practitioner Survey: Factors Affecting Which Supplement Brands are Stocked ......................... 216 Figure 8-31 NBJ Practitioner Survey: Dollar Amount of Average Supplement Sale .............................................. 217 Figure 8-32 NBJ Practitioner Survey: Supplement Sales in 2009 vs. 2008 ............................................................ 218 Figure 10-1 Atrium Innovations S.W.O.T. Analysis ................................................................................................ 253 Figure 10-2 Designs for Health S.W.O.T. Analysis ................................................................................................. 257 Figure 10-3 Emerson Ecologics S.W.O.T. Analysis ................................................................................................. 259 Figure 10-4 Amerifit Brands S.W.O.T. Analysis ...................................................................................................... 264 Figure 10-5 Metabolic Maintenance S.W.O.T. Analysis ........................................................................................ 266 Figure 10-6 Metagenics S.W.O.T. Analysis ............................................................................................................ 268 Figure 10-7 Nordic Naturals S.W.O.T. Analysis ...................................................................................................... 271 Figure 10-8 Standard Process S.W.O.T. Analysis ................................................................................................... 277 Figure 10-9 Thorne S.W.O.T. Analysis ................................................................................................................... 281 Figure 10-10 Xymogen S.W.O.T. Analysis .............................................................................................................. 284
1 Executive Summary
©2011 Penton Media, Inc. www.nutritionbusinessjournal.com 1-11
With passage of the Patient Protection and Affordable Care Act in 2010, the cards are now on the proverbial table for healthcare reform in the United States. Funding levels for a public trust long championed by Senator Tom Harkin (D-IA) increase from $500 million in 2010 to $2 billion annually starting in 2015, totaling $15 billion over the next ten years. There’s no clearer evidence that integrative medicine has entered the mainstream discussion of health and wellness, as well as the often heated public debate about ways to meaningfully address an escalating healthcare crisis.
“For the first time in history, we have decided not just to pay lip service to wellness and prevention, but actually to invest in wellness and prevention in a very robust way,” said Senator Harkin in a September floor statement. While the ultimate presentation of healthcare reform to the American public and final authorization levels remain uncertain, especially in light of recent state court decisions to overturn the individual mandate as unconstitutional, one thing is very clear. “This law, for the first time, directly and explicitly includes the concepts and language of integrative healthcare, integrative healthcare practitioners, and complementary and alternative medicine,” said John Weeks, publisher and editor of the Integrator Blog. “That’s a change.”
Specific language in the law does give reference to “integrative health” in delineating the top priorities of a health council tasked with enacting the law. President Obama himself is also tasked with the establishment of an advisory panel to guide the council, defined as “a diverse group of licensed health professionals, including integrative health practitioners” with experience in, among other disciplines, preventive medicine. The power brokers in Washington have clearly warmed to integrative approaches to healthcare, and the industry stands poised to dramatically benefit from its mounting contribution to public health in the United States.
This sea change in public attitudes toward medicine bodes well for practitioners of alternative healthcare, and also for dietary supplements. “We know that practitioners of alternative medicine are very much interested in our product,” said Steve Mister, CEO of the Council for Responsible Nutrition. “If you elevate their stature and give them more options to be included in insurance coverage, by default you get a healthcare community more favorable to supplements.” The current legislative language calls out supplements with health claims—
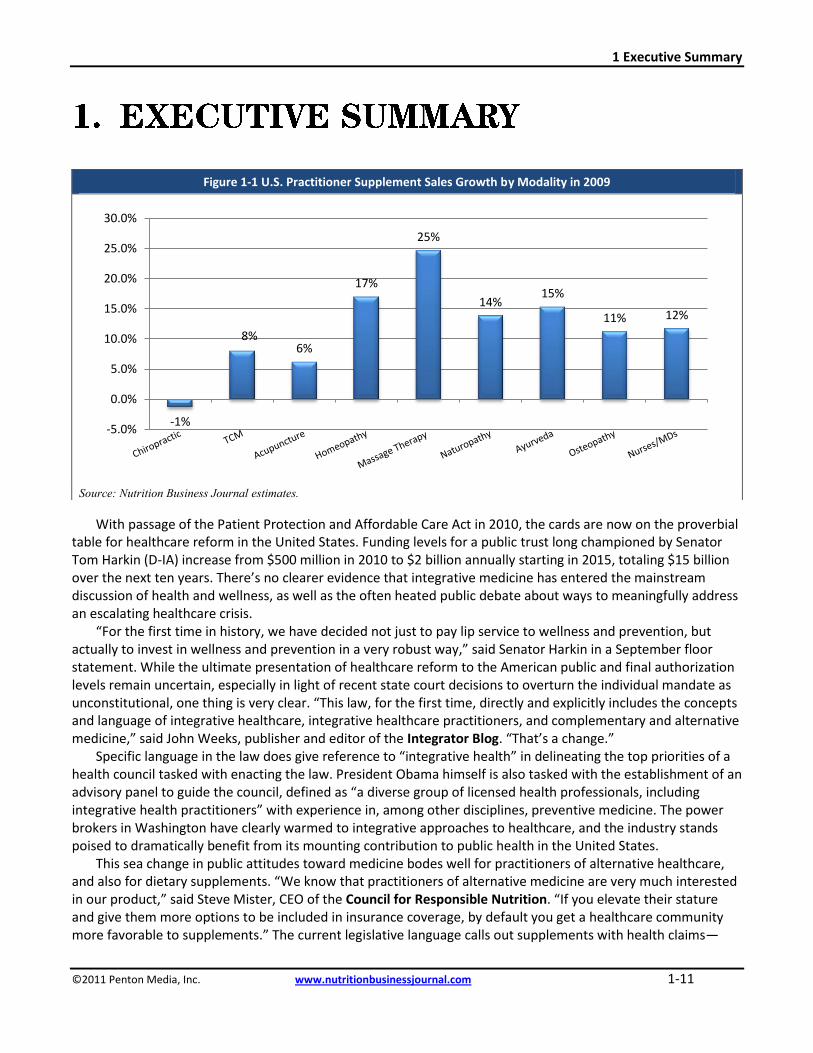
Figure 1-1 U.S. Practitioner Supplement Sales Growth by Modality in 2009
Source: Nutrition Business Journal estimates.
-1%
8%6%
17%
25%
14%15%
11% 12%
-5.0%
0.0%
5.0%
10.0%
15.0%
20.0%
25.0%
30.0%
NBJ’s Integrative Medicine Report 2011
1-12 www.nutritionbusinessjournal.com ©2011 Penton Media, Inc.
think of vitamin D and calcium for osteoporosis, omega-3s for heart health, and folic acid for neural tube birth defects—specifically in defining personalized health plans developed as pilot programs for certain at-risk populations.
The obstacles facing even broader acceptance of integrative practice are substantial and ingrained, but increasingly weakened by macroeconomic trends promoting thrift and patient dissatisfaction with the status quo. Experts continue to describe the current system of healthcare as a system of “sickcare,” with the economics incentivizing reimbursement rather than evidence; with a too-strong bias toward drugs and technology; with a too-weak bias toward nutrition and prevention; with providers, rather than patients, in charge. Integrative approaches gain traction in the marketplace by flipping the deck on much of this construct. “The future of medicine is pointed toward team delivery with the patient at the center,” said Penny George of the Bravewell Collaborative.
As supplements begin to flavor more and more of the discussion between doctors and patients, the condition-specific approach to their marketing has caught hold. “It makes so much sense to consumers,” said Todd Runestad, editor of Functional Ingredients magazine. Supplements targeting cognition, insomnia and mood disorders performed especially well in 2009, with the economic recession, rising unemployment and high levels of stress verily baked into the modern work- and lifestyle as clear causes. Supplements targeting beauty also performed well in 2009, as Baby Boomers search for natural solutions to stem the tides of aging.
NBJ’s 2011 Integrative Medicine report features an in-depth analysis of the U.S. integrative medicine market in an environment still populated with consumers looking for less-expensive alternatives to conventional healthcare. This report focuses on 10 primary modalities—Chiropractic, Traditional Chinese Medicine, Acupuncture, Homeopathy, Massage Therapy, Naturopathy, Ayurveda, Osteopathy, MDs and Nurses—and includes discussion of the key trends affecting each of these modalities and the integrative medicine industry as a whole. It also capitalizes on 13 continuous years of data, including market size, growth, revenue estimates for therapies and services, and practitioner channel supplement sales. In addition, the report includes consumer healthcare spending estimates and an analysis of the condition-specific supplement, OTC and prescription drug markets in 17 categories, ranging from anti-aging to vision.