intellectual property rights intensive industries and …...intellectual property rights intensive...
TRANSCRIPT

Intellectual property rights intensive industries and economic performance in the European Union Industry-Level Analysis Report, October 2016, Second editionExecutive Summary
A joint project between the European Patent Office and the European Union Intellectual Property Office
Foreword 3
Foreword
Innovation is a key focus of “Europe 2020”, the ten year growth strategy adopted by the European Union with a view to creating a more competitive economy with higher employment. Achieving this goal depends on several different factors, but an efficient system of intellectual property rights (IPR) undoubtedly ranks among the most important, given IP’s capacity to encourage creativity and innovation throughout the economy.
Europe already has a long tradition in this area: member states of both the EU and the European Patent Organisation have played a major role in shaping a modern and balanced system of IPR which not only guarantees innovators their due reward but also stimulates a competitive market. In today’s world of increasingly globalised markets and the knowledge economy, it is vital to ensure that this system remains an effective means of implementing new innovation policies. To assist us in that task, it is essential that all those involved have access to accurate facts and figures. Only then can we ensure that debate on IP’s role in supporting innovation and creativity is based on sound evidence.
In response to this clear need, the European Union Intellectual Property Office (EUIPO) and the European Patent Office (EPO) joined forces in 2013 to carry out a study that quantified the contribution made by IPR-intensive industries to the EU economy. The findings revealed that such industries accounted for 39% of the EU’s economic output and 26% of employment during the period 2008-2010, attesting to the value of IP to the European economy.
To give this exercise enduring value, both the EUIPO and the EPO are committed to ensuring that the most recent figures and findings are available to all those who need to understand the importance of IPR for Europe. This present study is the first update since the original report and covers the period 2011-2013. There are some significant new features which provide a substantially improved overview of the situation of IPR-intensive industries in Europe. Firstly, the scope has been widened to take account of new developments such as the accession of Croatia in 2013 and to include another IP right, plant varieties, in the analysis. Secondly, the report reflects the contemporary focus of policymakers in Europe and beyond, with a new chapter on the economic importance of climate change mitigation technologies (CCMTs).
In this updated study IPR-intensive industries have once again been found to be integral to GDP, employment and trade. Furthermore, the results indicate that the contribution of these industries to the European economy has grown since the first study. In addition, IPR-intensive industries appear to have coped better with the severe economic crisis than the economy as a whole.
Intellectual property rights intensive industries and economic performance in the European Union Industry-Level Analysis Report, October 2016, Second editionExecutice Summary
A joint project between the European Patent Office and the European Union Intellectual Property Office
About this study 54 Foreword
EUIPO EPO
Nathan Wajsman, Chief Economist Yann Ménière, Chief Economist Michał Kazimierczak, Economist Ilja Rudyk, Senior EconomistCarolina Arias Burgos, Economist Karin Terzić, AssistantAdéla Dvořáková, Trainee
Joint Project Team
Acknowledgements
In the course of the preparation of this report, useful input and data was received from the Community Plant Variety Office (CPVO).
The statistical office of the European Union, Eurostat, and the statistical offices of France, Germany, Spain and the United Kingdom provided valuable assistance in filling in the gaps in the published statistics.
The authors are also grateful for comments on the draft report from the European Commission’s Directorate General Internal Market, Industry, Entrepreneurship and SMEs; Laurence Joly, Institut National de la Propriété Industrielle; Dr Christian Rammer, Centre for European Economic Research, Mannheim; Dr Ardith Spence, US Government Accountability Office; and Professor Beth Webster, Centre for Transformative Innovation, Swinburne University.
About this study
One of the mandates of the European Observatory on Infringements of Intellectual Property Rights (“the Observatory”)1 is to provide evidence-based data on the impact, role and public perception of intellectual property in the economy of the European Union (EU). In order to meet that objective, the Observatory is conducting a programme of socio-economic studies. Similarly, the European Patent Office (EPO) aims to raise awareness about the economic and social importance of the patent system.
The present report, drawn up as a joint project between the EUIPO and the EPO, and benefiting from input from other IP offices, European Commission services and international organisations, is the second major study resulting from this collaboration, following a first study published by the two Offices in 2013.2 It aims to provide an updated, credible assessment of the combined contribution of industries that make intensive use of the various types of intellectual property rights (IPR) to the economies of the EU as a whole and of the individual Member States.
The study covers a broad range of IP rights3 — trade marks, patents, designs, copyright, geographical indications (GIs) and plant variety rights (PVRs) — and considers a variety of economic indicators, in particular gross domestic product (GDP), employment, external trade and wages. It makes no policy recommendations, as this is not within its scope. Instead, it is designed to provide evidence that can be used by policymakers in their work, and to serve as a basis for raising IP awareness among Europe’s citizens.
The 2013 study covered the period 2008-2010. The present study considers the more recent period 2011-2013. In order to ensure comparability between the two studies, the methodology used in 2013 has been retained. However, a number of improvements have been made as regards the underlying data and the methodology. In particular, data for Croatia is now included; a sixth IP right, PVRs, has been included in the analysis; and the definition of copyright-intensive industries has been brought more closely into line with the widely accepted WIPO classification.
Moreover, given the increasing focus of policymakers and business leaders in Europe and beyond on developing technologies to deal with climate change, a chapter on the economic importance of climate change mitigation technologies (CCMTs) has been added. In this chapter, the economic weight of industries engaged in development of those technologies is analysed in greater detail, based on data on patent filings at the EPO.
1 The Observatory was transferred to the Office for Harmonization in the Internal Market (OHIM) under Regulation (EU) No 386/2012 of the European Parliament and of the Council of 19 April 2012, which entered into force on 5 June 2012. OHIM was renamed the European Union Intellectual Property Office (EUIPO) following the entry into force of Regulation (EU) 2015/2424 on 23 March 2016. Except in bibliographical references, its new name is used throughout this report.2 OHIM/EPO: „Intellectual property rights intensive industries: contribution to economic performance and employment in the European Union“, September 2013.3 It may be helpful to define more clearly some of the IP related terms used in this report. „IP“ is usually, but not always, a result of innovation. However, it is a broader term than „IPR“, as it includes other types of knowledge, such as trade secrets or business methods. In this study, „IPR“ is used to refer to the six rights included in the analysis: patents, trade marks, registered designs, copyright, geographical indications and plant variety rights.
These are significant findings that serve to underline further the contribution of IPR-intensive industries to Europe’s prosperity and competitiveness. It is our hope that, equipped with this updated study, all readers can draw on the information it contains to ensure the continuing strength of not just our IP system but also the European economy, in which it has been found to play such a vital part.
António Campinos Benoît BattistelliExecutive Director, EUIPO President, EPO
Executive summary 7
IPR-intensive industries in the EU economy
IPR-intensive industries are defined 4 as those having an above-average use of IPR per employee, as compared with other IPR-using industries. As is shown in Chapters 6 and 7, these industries are concentrated in manufacturing, technology and business services sectors.
It should be emphasised, however, that most industries use IP rights to some extent. By focusing only on the IPR-intensive industries, this study depicts only the part of the European economy to which IP rights contribute most.5
The contribution of IPR-intensive industries to the two principal economic indicators, employment and output, is summarised in tables 1 and 2 below.6
IPR-intensive industries are shown to have generated 27.8% of all jobs in the EU during the period 2011-2013, with 21% in trade mark-intensive industries, 12% in design-intensive industries, 10% in patent-intensive industries, and smaller proportions in copyright-intensive, GI-intensive and PVR- intensive industries.7 On average over this period, 60 million Europeans were employed by IPR-intensive industries, out of a total employment figure of approximately 216 million. In addition, another 22 million jobs were generated in industries that supply goods and services to the IPR-intensive industries. Taking indirect jobs into account, the total number of IPR dependent jobs rises to 82.2 million (38.1%).
In addition to their direct employment contribution, IPR-intensive industries also generate employment in other, non IPR-intensive industries which supply them with goods and services as inputs to their production processes. Using the EU Input-Output Tables,8 published by Eurostat, it is possible to calculate this indirect effect on employment in non-IPR-intensive industries. The result is summarised in table 1, which shows a breakdown by direct and indirect employment.
4 See Chapter 5 on „Methodology“.5 It should, however, be borne in mind that large parts of the economy, especially the public sector, cannot be considered IPR-intensive.6 In order to minimise the impact of data gaps in the economic statistics and avoid attaching undue importance to one particular year,
the economic indicators were calculated as an average for the years 2011-2013.7 The total contribution of IPR-intensive industries is less than the sum of the individual contributions of trade mark-intensive,
patent-intensive, design-intensive, copyright-intensive, PVR-intensive and GI-intensive industries because many industries are intensive in respect of more than one IP right. However, the study methodology ensures that there is no double-counting of industry contributions.
8 Input-output tables show the flows of goods and services between all the industries in the economy.
6 Executive summary
Executive Summary
Main findings
➔ IPR-intensive industries generated 27.8% of all jobs in the EU during the period 2011-2013. On average over this period, 60 million Europeans were employed by IPR-intensive industries. In addition, another 22 million jobs were generated in industries that supply goods and services to the IPR intensive industries. Taking indirect jobs into account, the total number of IPR dependent jobs rises to 82.2 million (38.1%).
➔ Over the same period, IPR-intensive industries generated more than 42% of total economic activity (GDP) in the EU, worth € 5.7 trillion. They also accounted for most of the
EU’s trade with the rest of the world and generated a trade surplus, thus helping to keep the EU’s external trade in balance.
➔ IPR-intensive industries pay significantly higher wages than other industries, with a wage premium of 46% over other industries. This is consistent with the fact that the value added per worker is higher in IPR-intensive industries than elsewhere in the economy.
➔ IPR-intensive industries have proved most resilient to the economic crisis. Comparing the results of this study with those of the 2013 study reveals that the relative contribution of these industries to the EU economy slightly increased between the two periods 2008-2010 (2013 study) and 2011-2013 (2016 study).
➔ The detailed analysis of the economic weight of industries engaged in the development of climate change mitigation technologies (CCMTs) shows that they account for 1.2% of employment and 2.1% of economic output in the EU. They generated a substantial trade surplus for the EU and, despite a small drop in employment, were able to increase their GDP contribution between the two periods 2008-2010 and 2011-2013.
8 Executive summary Executive summary 9
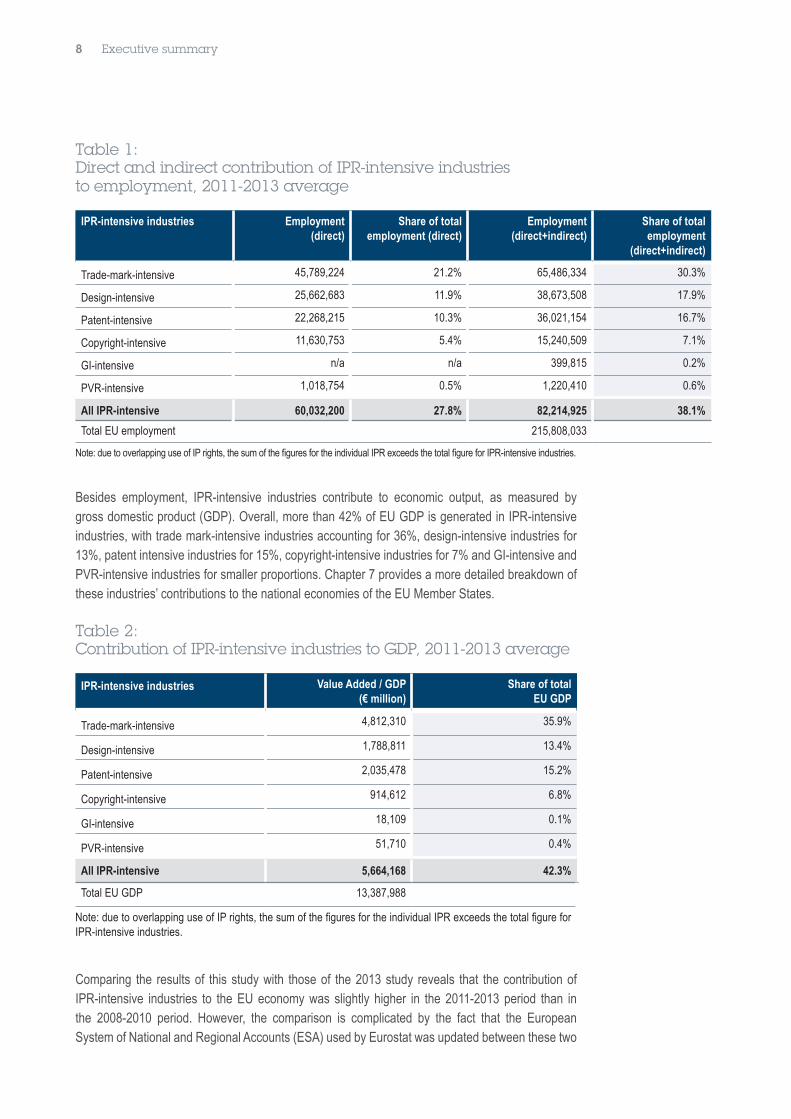
Table 1:Direct and indirect contribution of IPR-intensive industries to employment, 2011-2013 average
IPR-intensive industries Employment(direct)
Share of total employment (direct)
Employment(direct+indirect)
Share of total employment
(direct+indirect)
Trade-mark-intensive 45,789,224 21.2% 65,486,334 30.3%
Design-intensive 25,662,683 11.9% 38,673,508 17.9%
Patent-intensive 22,268,215 10.3% 36,021,154 16.7%
Copyright-intensive 11,630,753 5.4% 15,240,509 7.1%
GI-intensive n/a n/a 399,815 0.2%
PVR-intensive 1,018,754 0.5% 1,220,410 0.6%
All IPR-intensive 60,032,200 27.8% 82,214,925 38.1%
Total EU employment 215,808,033
Note: due to overlapping use of IP rights, the sum of the figures for the individual IPR exceeds the total figure for IPR-intensive industries.
Besides employment, IPR-intensive industries contribute to economic output, as measured by gross domestic product (GDP). Overall, more than 42% of EU GDP is generated in IPR-intensive industries, with trade mark-intensive industries accounting for 36%, design-intensive industries for 13%, patent intensive industries for 15%, copyright-intensive industries for 7% and GI-intensive and PVR-intensive industries for smaller proportions. Chapter 7 provides a more detailed breakdown of these industries’ contributions to the national economies of the EU Member States.
Table 2:Contribution of IPR-intensive industries to GDP, 2011-2013 average
IPR-intensive industries Value Added / GDP (€ million)
Share of total EU GDP
Trade-mark-intensive 4,812,310 35.9%
Design-intensive 1,788,811 13.4%
Patent-intensive 2,035,478 15.2%
Copyright-intensive 914,612 6.8%
GI-intensive 18,109 0.1%
PVR-intensive 51,710 0.4%
All IPR-intensive 5,664,168 42.3%
Total EU GDP 13,387,988
Note: due to overlapping use of IP rights, the sum of the figures for the individual IPR exceeds the total figure for IPR-intensive industries.
Comparing the results of this study with those of the 2013 study reveals that the contribution of IPR-intensive industries to the EU economy was slightly higher in the 2011-2013 period than in the 2008-2010 period. However, the comparison is complicated by the fact that the European System of National and Regional Accounts (ESA) used by Eurostat was updated between these two
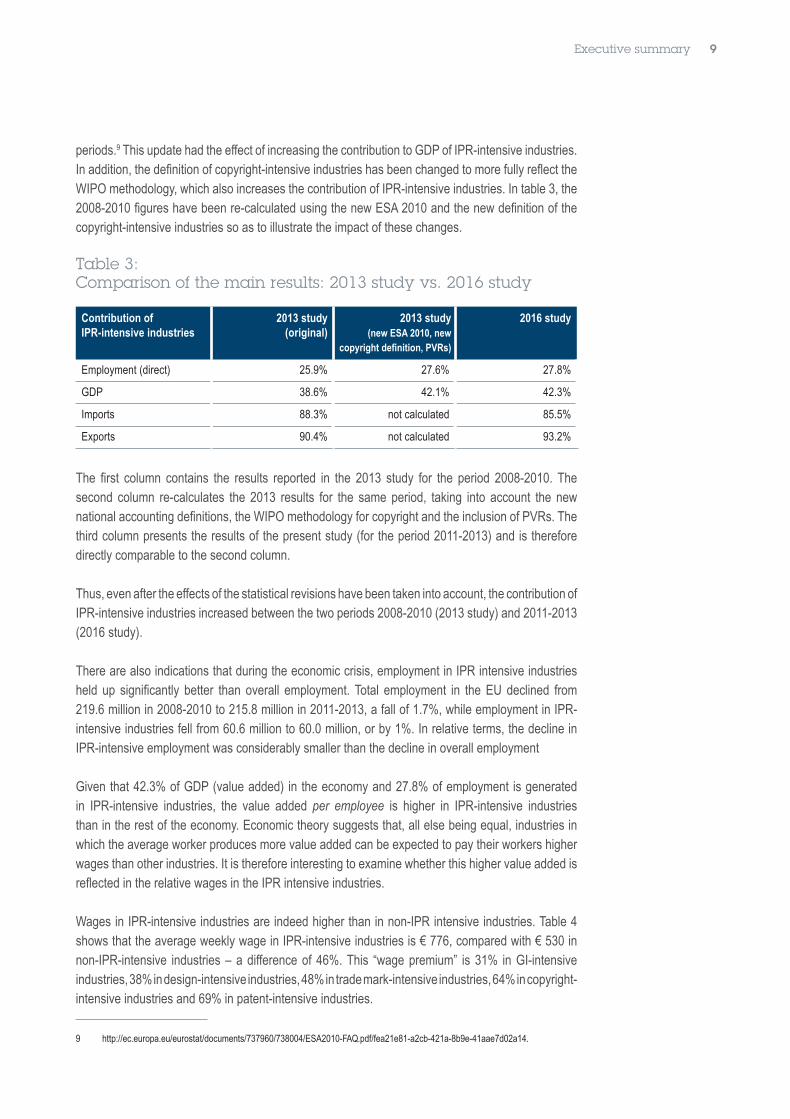
periods.9 This update had the effect of increasing the contribution to GDP of IPR-intensive industries. In addition, the definition of copyright-intensive industries has been changed to more fully reflect the WIPO methodology, which also increases the contribution of IPR-intensive industries. In table 3, the 2008-2010 figures have been re-calculated using the new ESA 2010 and the new definition of the copyright-intensive industries so as to illustrate the impact of these changes.
Table 3: Comparison of the main results: 2013 study vs. 2016 study
Contribution of IPR-intensive industries
2013 study(original)
2013 study(new ESA 2010, new
copyright definition, PVRs)
2016 study
Employment (direct) 25.9% 27.6% 27.8%
GDP 38.6% 42.1% 42.3%
Imports 88.3% not calculated 85.5%
Exports 90.4% not calculated 93.2%
The first column contains the results reported in the 2013 study for the period 2008-2010. The second column re-calculates the 2013 results for the same period, taking into account the new national accounting definitions, the WIPO methodology for copyright and the inclusion of PVRs. The third column presents the results of the present study (for the period 2011-2013) and is therefore directly comparable to the second column.
Thus, even after the effects of the statistical revisions have been taken into account, the contribution of IPR-intensive industries increased between the two periods 2008-2010 (2013 study) and 2011-2013 (2016 study).
There are also indications that during the economic crisis, employment in IPR intensive industries held up significantly better than overall employment. Total employment in the EU declined from 219.6 million in 2008-2010 to 215.8 million in 2011-2013, a fall of 1.7%, while employment in IPR-intensive industries fell from 60.6 million to 60.0 million, or by 1%. In relative terms, the decline in IPR-intensive employment was considerably smaller than the decline in overall employment
Given that 42.3% of GDP (value added) in the economy and 27.8% of employment is generated in IPR-intensive industries, the value added per employee is higher in IPR-intensive industries than in the rest of the economy. Economic theory suggests that, all else being equal, industries in which the average worker produces more value added can be expected to pay their workers higher wages than other industries. It is therefore interesting to examine whether this higher value added is reflected in the relative wages in the IPR intensive industries.
Wages in IPR-intensive industries are indeed higher than in non-IPR intensive industries. Table 4 shows that the average weekly wage in IPR-intensive industries is € 776, compared with € 530 in non-IPR-intensive industries – a difference of 46%. This “wage premium” is 31% in GI-intensive industries, 38% in design-intensive industries, 48% in trade mark-intensive industries, 64% in copyright-
9 http://ec.europa.eu/eurostat/documents/737960/738004/ESA2010-FAQ.pdf/fea21e81-a2cb-421a-8b9e-41aae7d02a14.
intensive industries and 69% in patent-intensive industries.
8 Executive summary Executive summary 9
Table 1:Direct and indirect contribution of IPR-intensive industries to employment, 2011-2013 average
IPR-intensive industries Employment(direct)
Share of total employment (direct)
Employment(direct+indirect)
Share of total employment
(direct+indirect)
Trade-mark-intensive 45,789,224 21.2% 65,486,334 30.3%
Design-intensive 25,662,683 11.9% 38,673,508 17.9%
Patent-intensive 22,268,215 10.3% 36,021,154 16.7%
Copyright-intensive 11,630,753 5.4% 15,240,509 7.1%
GI-intensive n/a n/a 399,815 0.2%
PVR-intensive 1,018,754 0.5% 1,220,410 0.6%
All IPR-intensive 60,032,200 27.8% 82,214,925 38.1%
Total EU employment 215,808,033
Note: due to overlapping use of IP rights, the sum of the figures for the individual IPR exceeds the total figure for IPR-intensive industries.
Besides employment, IPR-intensive industries contribute to economic output, as measured by gross domestic product (GDP). Overall, more than 42% of EU GDP is generated in IPR-intensive industries, with trade mark-intensive industries accounting for 36%, design-intensive industries for 13%, patent intensive industries for 15%, copyright-intensive industries for 7% and GI-intensive and PVR-intensive industries for smaller proportions. Chapter 7 provides a more detailed breakdown of these industries’ contributions to the national economies of the EU Member States.
Table 2:Contribution of IPR-intensive industries to GDP, 2011-2013 average
IPR-intensive industries Value Added / GDP (€ million)
Share of total EU GDP
Trade-mark-intensive 4,812,310 35.9%
Design-intensive 1,788,811 13.4%
Patent-intensive 2,035,478 15.2%
Copyright-intensive 914,612 6.8%
GI-intensive 18,109 0.1%
PVR-intensive 51,710 0.4%
All IPR-intensive 5,664,168 42.3%
Total EU GDP 13,387,988
Note: due to overlapping use of IP rights, the sum of the figures for the individual IPR exceeds the total figure for IPR-intensive industries.
Comparing the results of this study with those of the 2013 study reveals that the contribution of IPR-intensive industries to the EU economy was slightly higher in the 2011-2013 period than in the 2008-2010 period. However, the comparison is complicated by the fact that the European System of National and Regional Accounts (ESA) used by Eurostat was updated between these two
periods.9 This update had the effect of increasing the contribution to GDP of IPR-intensive industries. In addition, the definition of copyright-intensive industries has been changed to more fully reflect the WIPO methodology, which also increases the contribution of IPR-intensive industries. In table 3, the 2008-2010 figures have been re-calculated using the new ESA 2010 and the new definition of the copyright-intensive industries so as to illustrate the impact of these changes.
Table 3: Comparison of the main results: 2013 study vs. 2016 study
Contribution of IPR-intensive industries
2013 study(original)
2013 study(new ESA 2010, new
copyright definition, PVRs)
2016 study
Employment (direct) 25.9% 27.6% 27.8%
GDP 38.6% 42.1% 42.3%
Imports 88.3% not calculated 85.5%
Exports 90.4% not calculated 93.2%
The first column contains the results reported in the 2013 study for the period 2008-2010. The second column re-calculates the 2013 results for the same period, taking into account the new national accounting definitions, the WIPO methodology for copyright and the inclusion of PVRs. The third column presents the results of the present study (for the period 2011-2013) and is therefore directly comparable to the second column.
Thus, even after the effects of the statistical revisions have been taken into account, the contribution of IPR-intensive industries increased between the two periods 2008-2010 (2013 study) and 2011-2013 (2016 study).
There are also indications that during the economic crisis, employment in IPR intensive industries held up significantly better than overall employment. Total employment in the EU declined from 219.6 million in 2008-2010 to 215.8 million in 2011-2013, a fall of 1.7%, while employment in IPR-intensive industries fell from 60.6 million to 60.0 million, or by 1%. In relative terms, the decline in IPR-intensive employment was considerably smaller than the decline in overall employment
Given that 42.3% of GDP (value added) in the economy and 27.8% of employment is generated in IPR-intensive industries, the value added per employee is higher in IPR-intensive industries than in the rest of the economy. Economic theory suggests that, all else being equal, industries in which the average worker produces more value added can be expected to pay their workers higher wages than other industries. It is therefore interesting to examine whether this higher value added is reflected in the relative wages in the IPR intensive industries.
Wages in IPR-intensive industries are indeed higher than in non-IPR intensive industries. Table 4 shows that the average weekly wage in IPR-intensive industries is € 776, compared with € 530 in non-IPR-intensive industries – a difference of 46%. This “wage premium” is 31% in GI-intensive industries, 38% in design-intensive industries, 48% in trade mark-intensive industries, 64% in copyright-
9 http://ec.europa.eu/eurostat/documents/737960/738004/ESA2010-FAQ.pdf/fea21e81-a2cb-421a-8b9e-41aae7d02a14.
intensive industries and 69% in patent-intensive industries.
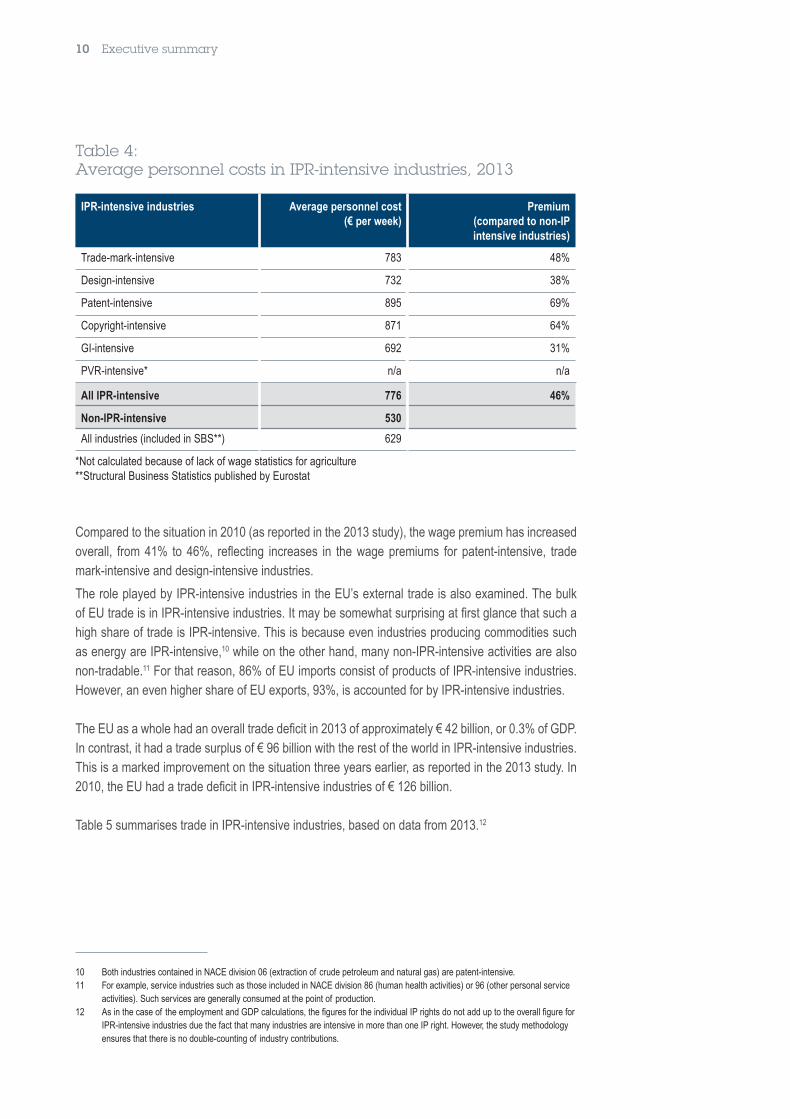
Table 4: Average personnel costs in IPR-intensive industries, 2013
IPR-intensive industries Average personnel cost (€ per week)
Premium(compared to non-IP intensive industries)
Trade-mark-intensive 783 48%
Design-intensive 732 38%
Patent-intensive 895 69%
Copyright-intensive 871 64%
GI-intensive 692 31%
PVR-intensive* n/a n/a
All IPR-intensive 776 46%
Non-IPR-intensive 530
All industries (included in SBS**) 629
*Not calculated because of lack of wage statistics for agriculture**Structural Business Statistics published by Eurostat
Compared to the situation in 2010 (as reported in the 2013 study), the wage premium has increased overall, from 41% to 46%, reflecting increases in the wage premiums for patent-intensive, trade mark-intensive and design-intensive industries.
The role played by IPR-intensive industries in the EU’s external trade is also examined. The bulk of EU trade is in IPR-intensive industries. It may be somewhat surprising at first glance that such a high share of trade is IPR-intensive. This is because even industries producing commodities such as energy are IPR-intensive,10 while on the other hand, many non-IPR-intensive activities are also non-tradable.11 For that reason, 86% of EU imports consist of products of IPR-intensive industries. However, an even higher share of EU exports, 93%, is accounted for by IPR-intensive industries.
The EU as a whole had an overall trade deficit in 2013 of approximately € 42 billion, or 0.3% of GDP. In contrast, it had a trade surplus of € 96 billion with the rest of the world in IPR-intensive industries. This is a marked improvement on the situation three years earlier, as reported in the 2013 study. In 2010, the EU had a trade deficit in IPR-intensive industries of € 126 billion.
Table 5 summarises trade in IPR-intensive industries, based on data from 2013.12
10 Both industries contained in NACE division 06 (extraction of crude petroleum and natural gas) are patent-intensive.11 For example, service industries such as those included in NACE division 86 (human health activities) or 96 (other personal service activities). Such services are generally consumed at the point of production.12 As in the case of the employment and GDP calculations, the figures for the individual IP rights do not add up to the overall figure for IPR-intensive industries due the fact that many industries are intensive in more than one IP right. However, the study methodology ensures that there is no double-counting of industry contributions.
Table 5:EU external trade in IPR-intensive industries, 2013
IPR-intensive industries Exports (€ million)
Imports (€ million)
Net exports (€ million)
Trade-mark-intensive 1,275,472 1,261,002 14,470
Design-intensive 945,084 701,752 243,332
Patent-intensive 1,231,966 1,157,909 74,057
Copyright-intensive 119,554 102,389 17,165
GI-intensive 12,923 1,335 11,588
PVR-intensive 5,065 5,369 -304
Total IPR-intensive 1,605,516 1,509,099 96,417
Non-IPR-intensive 117,561 256,048 -138,487
Total EU Trade 1,723,077 1,765,147 -42,069
Note: due to overlapping use of IP rights, the sum of the figures for the individual IPR exceeds the total figure for IPR-intensive industries.
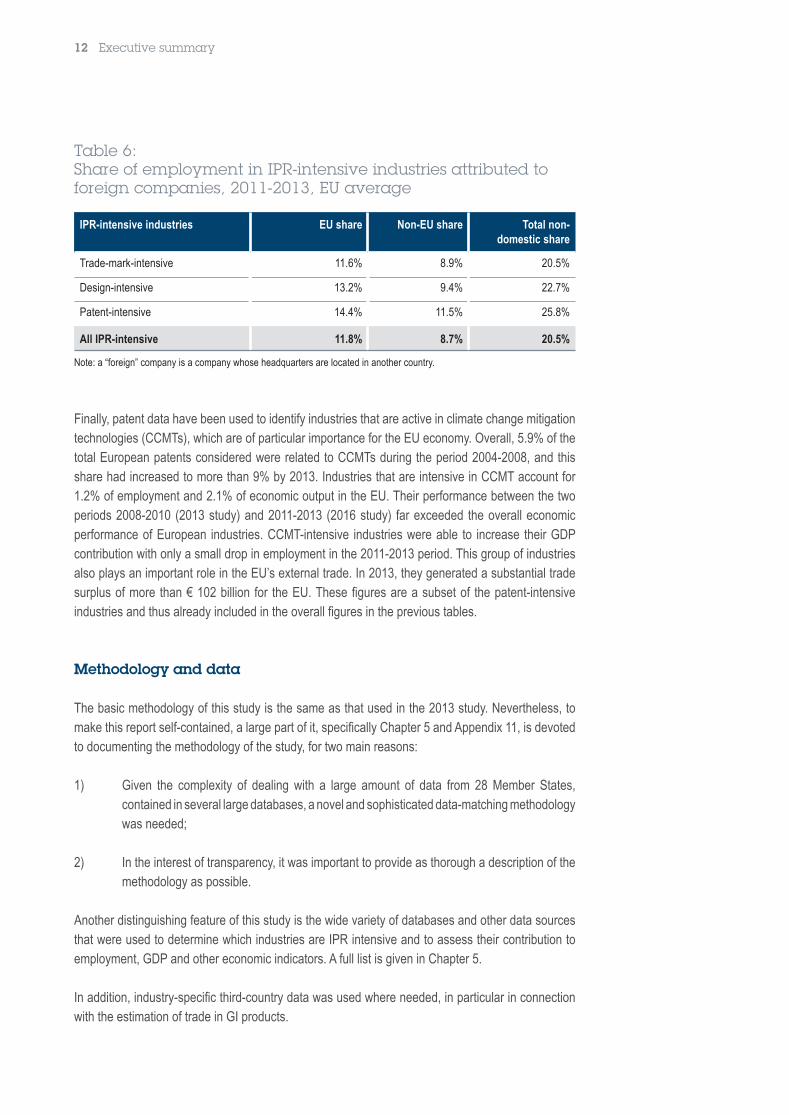
The improvement in the EU’s trade balance is explained by a 27% increase in exports between 2010 and 2013, while imports increased by only 15% during the same period. For IPR-intensive industries, exports increased by 30%, while imports increased by 11%. The design-intensive industries show the highest increase in net exports and are the industries with the highest trade surplus. A closer look at the activity of IPR-intensive industries within the EU Single Market reveals a division of labour between EU Member States. Countries like Austria, Belgium, Denmark, Finland, France, Germany, Italy, Luxembourg, Malta, the Netherlands and Sweden are above the EU average in terms of IPR creation per employee. IPR-intensive industries in other EU Member States, such as Hungary, Romania, the Czech Republic, Slovakia and Ireland have a high proportion of jobs that are attributed to companies based in other countries. As shown in table 6, overall, 20.5% of EU jobs in IPR-intensive industries are generated in subsidiaries of foreign companies, a majority of which originate from another EU country. This proportion is even higher in trade mark, design and patent-intensive industries.
10 Executive summary Executive summary 11
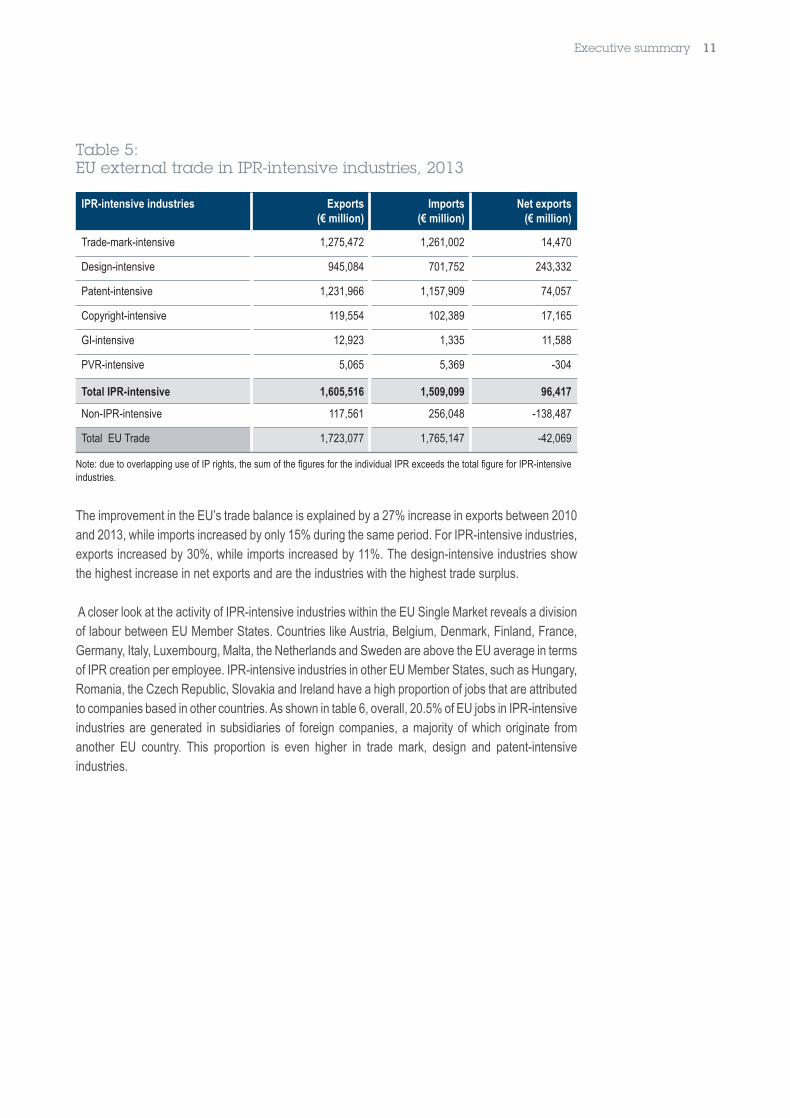
Table 4: Average personnel costs in IPR-intensive industries, 2013
IPR-intensive industries Average personnel cost (€ per week)
Premium(compared to non-IP intensive industries)
Trade-mark-intensive 783 48%
Design-intensive 732 38%
Patent-intensive 895 69%
Copyright-intensive 871 64%
GI-intensive 692 31%
PVR-intensive* n/a n/a
All IPR-intensive 776 46%
Non-IPR-intensive 530
All industries (included in SBS**) 629
*Not calculated because of lack of wage statistics for agriculture**Structural Business Statistics published by Eurostat
Compared to the situation in 2010 (as reported in the 2013 study), the wage premium has increased overall, from 41% to 46%, reflecting increases in the wage premiums for patent-intensive, trade mark-intensive and design-intensive industries.
The role played by IPR-intensive industries in the EU’s external trade is also examined. The bulk of EU trade is in IPR-intensive industries. It may be somewhat surprising at first glance that such a high share of trade is IPR-intensive. This is because even industries producing commodities such as energy are IPR-intensive,10 while on the other hand, many non-IPR-intensive activities are also non-tradable.11 For that reason, 86% of EU imports consist of products of IPR-intensive industries. However, an even higher share of EU exports, 93%, is accounted for by IPR-intensive industries.
The EU as a whole had an overall trade deficit in 2013 of approximately € 42 billion, or 0.3% of GDP. In contrast, it had a trade surplus of € 96 billion with the rest of the world in IPR-intensive industries. This is a marked improvement on the situation three years earlier, as reported in the 2013 study. In 2010, the EU had a trade deficit in IPR-intensive industries of € 126 billion.
Table 5 summarises trade in IPR-intensive industries, based on data from 2013.12
10 Both industries contained in NACE division 06 (extraction of crude petroleum and natural gas) are patent-intensive.11 For example, service industries such as those included in NACE division 86 (human health activities) or 96 (other personal service activities). Such services are generally consumed at the point of production.12 As in the case of the employment and GDP calculations, the figures for the individual IP rights do not add up to the overall figure for IPR-intensive industries due the fact that many industries are intensive in more than one IP right. However, the study methodology ensures that there is no double-counting of industry contributions.
Table 5:EU external trade in IPR-intensive industries, 2013
IPR-intensive industries Exports (€ million)
Imports (€ million)
Net exports (€ million)
Trade-mark-intensive 1,275,472 1,261,002 14,470
Design-intensive 945,084 701,752 243,332
Patent-intensive 1,231,966 1,157,909 74,057
Copyright-intensive 119,554 102,389 17,165
GI-intensive 12,923 1,335 11,588
PVR-intensive 5,065 5,369 -304
Total IPR-intensive 1,605,516 1,509,099 96,417
Non-IPR-intensive 117,561 256,048 -138,487
Total EU Trade 1,723,077 1,765,147 -42,069
Note: due to overlapping use of IP rights, the sum of the figures for the individual IPR exceeds the total figure for IPR-intensive industries.
The improvement in the EU’s trade balance is explained by a 27% increase in exports between 2010 and 2013, while imports increased by only 15% during the same period. For IPR-intensive industries, exports increased by 30%, while imports increased by 11%. The design-intensive industries show the highest increase in net exports and are the industries with the highest trade surplus. A closer look at the activity of IPR-intensive industries within the EU Single Market reveals a division of labour between EU Member States. Countries like Austria, Belgium, Denmark, Finland, France, Germany, Italy, Luxembourg, Malta, the Netherlands and Sweden are above the EU average in terms of IPR creation per employee. IPR-intensive industries in other EU Member States, such as Hungary, Romania, the Czech Republic, Slovakia and Ireland have a high proportion of jobs that are attributed to companies based in other countries. As shown in table 6, overall, 20.5% of EU jobs in IPR-intensive industries are generated in subsidiaries of foreign companies, a majority of which originate from another EU country. This proportion is even higher in trade mark, design and patent-intensive industries.
10 Executive summary Executive summary 11
12 Imprint Foreword 13
Table 6: Share of employment in IPR-intensive industries attributed to foreign companies, 2011-2013, EU average
IPR-intensive industries EU share Non-EU share Total non- domestic share
Trade-mark-intensive 11.6% 8.9% 20.5%
Design-intensive 13.2% 9.4% 22.7%
Patent-intensive 14.4% 11.5% 25.8%
All IPR-intensive 11.8% 8.7% 20.5%
Note: a “foreign” company is a company whose headquarters are located in another country.
Finally, patent data have been used to identify industries that are active in climate change mitigation technologies (CCMTs), which are of particular importance for the EU economy. Overall, 5.9% of the total European patents considered were related to CCMTs during the period 2004-2008, and this share had increased to more than 9% by 2013. Industries that are intensive in CCMT account for 1.2% of employment and 2.1% of economic output in the EU. Their performance between the two periods 2008-2010 (2013 study) and 2011-2013 (2016 study) far exceeded the overall economic performance of European industries. CCMT-intensive industries were able to increase their GDP contribution with only a small drop in employment in the 2011-2013 period. This group of industries also plays an important role in the EU’s external trade. In 2013, they generated a substantial trade surplus of more than € 102 billion for the EU. These figures are a subset of the patent-intensive industries and thus already included in the overall figures in the previous tables.
Methodology and data
The basic methodology of this study is the same as that used in the 2013 study. Nevertheless, to make this report self-contained, a large part of it, specifically Chapter 5 and Appendix 11, is devoted to documenting the methodology of the study, for two main reasons:
1) Given the complexity of dealing with a large amount of data from 28 Member States, contained in several large databases, a novel and sophisticated data-matching methodology was needed;
2) In the interest of transparency, it was important to provide as thorough a description of the methodology as possible.
Another distinguishing feature of this study is the wide variety of databases and other data sources that were used to determine which industries are IPR intensive and to assess their contribution to employment, GDP and other economic indicators. A full list is given in Chapter 5.
In addition, industry-specific third-country data was used where needed, in particular in connection with the estimation of trade in GI products.
12 Executive summary Executive summary 13
In order to determine which industries are IPR-intensive, the register databases of the EUIPO, the EPO and the CPVO were matched with the commercial database ORBIS.13 The resulting matched database contains data on approximately 240,000 companies, including the number of EU trade marks, registered Community designs, patents and CPVRs applied for by each company and subsequently granted, along with the industry classification and various financial and economic variables for each one, providing a set of data that can be used in future, more detailed studies.
Using this database, the number of trade marks, designs, patents and PVRs per employee was calculated for each industry, and the industries which were above average according to this measure were considered to be IPR intensive. This calculation was performed at the level of the EU, no account being taken of national filings by the companies in the database. This approach, partly made necessary by data limitations, is nevertheless justified by the assumption that an industry which is defined as IPR-intensive based on its registration of EU-level IP rights would also be deemed IPR-intensive if national IP rights per employee were included as well.14
A fundamental assumption behind the methodology employed in the present study is that the degree to which an industry is IPR-intensive is an intrinsic characteristic of that industry, regardless of where it is located.15 In assessing the contribution of each industry to the economy, what is being measured are the jobs and GDP generated by that industry in each Member State and in the EU, and not the origin of the underlying IPR.
For example, if a car company based in country A builds an assembly plant in country B, then the jobs and value added created as a result accrue to the economy of country B. Therefore, no conclusions as to how innovative a particular country is can be drawn on the basis of the country-level contributions of IPR-incentive industries alone. In the above example, the higher contribution of patent–intensive industries in country B is the result of decisions on where to site the production of vehicles, but the underlying R&D could have been performed in country A or indeed another country altogether.
To shed some light on this issue, Chapter 8 shows in which countries the patents, trade marks, designs and PVRs in the database used for this study originate and presents statistics on the proportion of jobs in IPR-intensive industries in each Member State that are created in companies based in other Member States or outside the EU.
For copyright-intensive industries, the WIPO methodology was applied more fully than it was in the body of the 2013 study. In order to achieve comparability with an earlier study published by the United States Patent and Trademark Office (USPTO), only a subset of industries considered by WIPO to be copyright-intensive was included in that previous study (results based on the full WIPO methodology were provided in an annex). In contrast, in the present study, the WIPO classification is applied more fully, so that in addition to the industries classified by WIPO as “core copyright industries”, a number of “partially dedicated” industries are also included, namely those for which at least 20%
13 ORBIS is a database of financial information on European companies, provided by Bureau van Dijk and based on data obtained from company filings in company registers or similar records in the various countries. It thus includes data on all companies, whether listed on a stock exchange or not (as would typically be the case for SMEs).14 This assumption was maintained for the sake of comparability with the 2013 study. However, the issue of national versus EU-level rights could be addressed in future studies to examine whether the inclusion of national rights would yield different results.15 The exception is GI, which is analysed on a country-by-country basis.
14 Imprint Foreword 15
16 The total value added in these industries is scaled using WIPO‘s factors so as to exclude non-copyright-related activities.
14 Executive summary
of their value added can be attributed to copyright-related activities.16 The net effect is that the number of copyright-intensive industries has increased by 46 (from 33 in the 2013 study to 79 now), while the total number of IPR-intensive industries has increased by 21, from 321 in the previous study to 342 in this one. The methodology for copyright-intensive industries is explained fully in section 5.6.
Similarly, due to the particular nature of GIs and PVRs and the unavailability of disaggregated statistical data at a European level, these two IP rights had to be analysed using bespoke methodologies, which are described in sections 5.7 and 5.8, respectively.
The full report is available for download at www.epo.org/ipr-intensive-industrieswww.euipo.europa.eu/ipcontribution
Published and edited by the EPO and the EUIPO Munich, Germany, and Alicante, Spainwww.epo.orgwww.euipo.europa.euDesign: EPO Graphic Design, Munich