intensive support amount (isa) guidelines for school … · student-focused funding intensive...
TRANSCRIPT
Student-Focused Funding
Intensive Support Amount (ISA)
Guidelinesfor School Boards
Spring 2001Ministry of Education
Une publication équivalente est disponible en français sous le titre suivant : Allocation d’aide spécialisée (AAS) : Lignes directrices à l’intention des conseils scolaires
This publication is available on the Ministry of Education’swebsite at http://www.edu.gov.on.ca.
This publication supersedes the2000-2001 Resource Manual forthe Special Education GrantIntensive Support Amount (ISA):Guidelines for School Boards.
Intensive Amount Support (ISA) Guidelines for School Boards i
Table of Contents
Special Education Funding . . . . . . . . . . . . . . . . . . . . . . . . . . . . . . . . . . . . . . . . . . . . . . . 1Overview . . . . . . . . . . . . . . . . . . . . . . . . . . . . . . . . . . . . . . . . . . . . . . . . . . . . . . . . . . . 1Ongoing Refinement of the Special Education Grant . . . . . . . . . . . . . . . . . . . . . . . . . 3Funding Directions for 2001–02 and 2002–03 . . . . . . . . . . . . . . . . . . . . . . . . . . . . . . 4
ISA Level 1 Specialized Equipment Funding . . . . . . . . . . . . . . . . . . . . . . . . . . . . . . . . 5General Information for District School Boards . . . . . . . . . . . . . . . . . . . . . . . . . . . . . 5General Information for School Authorities in Children’s Hospitals . . . . . . . . . . . . . 8Equipment Deductible and District School Boards . . . . . . . . . . . . . . . . . . . . . . . . . . . 9Leasing of Equipment . . . . . . . . . . . . . . . . . . . . . . . . . . . . . . . . . . . . . . . . . . . . . . . . . 9Eligible Specialized Equipment . . . . . . . . . . . . . . . . . . . . . . . . . . . . . . . . . . . . . . . . . 9Portability of Specialized Equipment . . . . . . . . . . . . . . . . . . . . . . . . . . . . . . . . . . . . 14Ministry of Health and Long-Term Care Assistive Devices Program . . . . . . . . . . . . 14
ISA Level 2 and ISA Level 3 . . . . . . . . . . . . . . . . . . . . . . . . . . . . . . . . . . . . . . . . . . . . . 15Approach for 2001–02 and 2002–03 . . . . . . . . . . . . . . . . . . . . . . . . . . . . . . . . . . . . . 15ISA Level 2 and Level 3 Portability . . . . . . . . . . . . . . . . . . . . . . . . . . . . . . . . . . . . . . 15
ISA Level 4 . . . . . . . . . . . . . . . . . . . . . . . . . . . . . . . . . . . . . . . . . . . . . . . . . . . . . . . . . . . 17
Special Incidence Portion (SIP) . . . . . . . . . . . . . . . . . . . . . . . . . . . . . . . . . . . . . . . . . . 18Eligibility Criteria for SIP . . . . . . . . . . . . . . . . . . . . . . . . . . . . . . . . . . . . . . . . . . . . . 18
Appendix A: Staff Support Worksheets for Special Incidence Portion . . . . . . . . . . 25
Appendix B: ISA Status Form . . . . . . . . . . . . . . . . . . . . . . . . . . . . . . . . . . . . . . . . . . . 31
Appendix C: Special Incidence Portion Application Form 2001–02 . . . . . . . . . . . . . 33
Appendix D: Ministry District Offices . . . . . . . . . . . . . . . . . . . . . . . . . . . . . . . . . . . . . 35
Appendix E: Future Direction for ISA Level 2 and 3 Claim Process . . . . . . . . . . . . 37
Appendix F: Results of the 2000 Claim and Audit Process . . . . . . . . . . . . . . . . . . . . 41
Intensive Amount Support (ISA) Guidelines for School Boardsii
Glossary of Terms
ADP Assistive Devices ProgramFM frequency modulationFTE full-time equivalentIEP Individual Education PlanIPRC Identification, Placement, and Review CommitteeISA Intensive Support AmountOEN Ontario Education NumberOSR Ontario Student RecordPAAC on SEAC Provincial Parent Association Advisory Committee on Special
Education Advisory Committees PSIE program Personalized, Special Instructional Equipment programSEAC Special Education Advisory CommitteeSEPPA Special Education Per Pupil AmountSIP Special Incidence Portion
* A school board’s envelope of protected special education funding is the lesser of its special education fundingenvelope in 2000-01, as calculated per the Student-Focused Funding – Legislative Grants for 2000-01 or its specialeducation funding envelope in 2001-02, as calculated per the Student Focused Funding – Legislative Grants for 2001-02.
Intensive Amount Support (ISA) Guidelines for School Boards 1
Special Education Funding
Overview
The government is committed to funding school boards so that each student in Ontariohas access to a high-quality education regardless of the student’s background or where thestudent lives. Student-focused funding ensures that the government meets thatcommitment.
Funding for services and supports for students with special needs is provided throughseveral grants that are part of student-focused funding. The Foundation Grant provides forcosts associated with the basic requirements of all students, including those with specialneeds. The Special Education Grant provides funding to meet the incremental costs ofspecial education programs and supports (that is, the costs above the basic costs ofeducation associated with all students). In addition, boards also use funding from otherspecial purpose grants – grants such as the Transportation Grant and the TeacherCompensation Grant – to help meet needs of students with special needs.
The Special Education Grant comprises two components:
• the Special Education Per Pupil Amount (SEPPA), which is a standard per-pupilamount based on each board’s total enrolment; and
• the Intensive Support Amount (ISA), which is a variable amount based on eachboard’s share of students with very high needs.
The current level of special education funding continues to be protected in 2001-02. Aspart of the government’s commitment to increase board’s flexibility to address localpriorities, boards have flexibility in how they spend any increase in their specialeducation funding in 2001-02.* Boards may continue to direct additional funding tospecial education programs and supports.
Intensive Amount Support (ISA) Guidelines for School Boards2
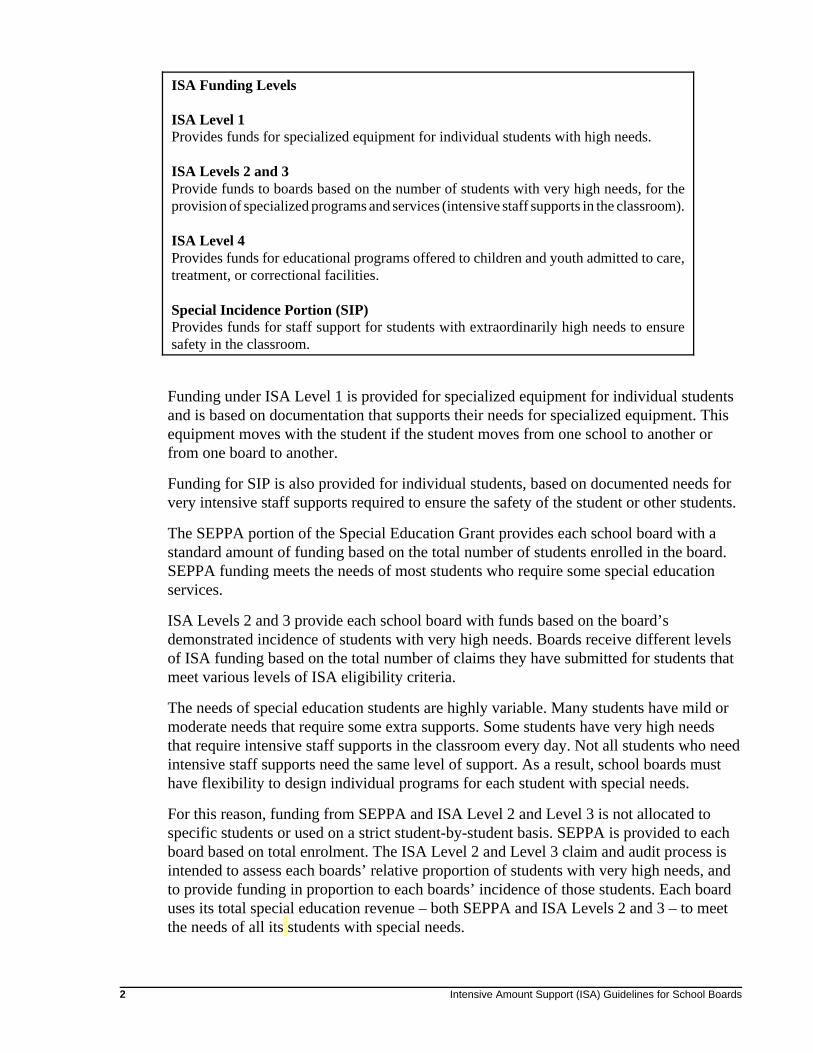
ISA Funding Levels
ISA Level 1Provides funds for specialized equipment for individual students with high needs.
ISA Levels 2 and 3 Provide funds to boards based on the number of students with very high needs, for theprovision of specialized programs and services (intensive staff supports in the classroom).
ISA Level 4 Provides funds for educational programs offered to children and youth admitted to care,treatment, or correctional facilities.
Special Incidence Portion (SIP)Provides funds for staff support for students with extraordinarily high needs to ensuresafety in the classroom.
Funding under ISA Level 1 is provided for specialized equipment for individual studentsand is based on documentation that supports their needs for specialized equipment. Thisequipment moves with the student if the student moves from one school to another orfrom one board to another.
Funding for SIP is also provided for individual students, based on documented needs forvery intensive staff supports required to ensure the safety of the student or other students.
The SEPPA portion of the Special Education Grant provides each school board with astandard amount of funding based on the total number of students enrolled in the board.SEPPA funding meets the needs of most students who require some special educationservices.
ISA Levels 2 and 3 provide each school board with funds based on the board’sdemonstrated incidence of students with very high needs. Boards receive different levelsof ISA funding based on the total number of claims they have submitted for students thatmeet various levels of ISA eligibility criteria.
The needs of special education students are highly variable. Many students have mild ormoderate needs that require some extra supports. Some students have very high needsthat require intensive staff supports in the classroom every day. Not all students who needintensive staff supports need the same level of support. As a result, school boards musthave flexibility to design individual programs for each student with special needs.
For this reason, funding from SEPPA and ISA Level 2 and Level 3 is not allocated tospecific students or used on a strict student-by-student basis. SEPPA is provided to eachboard based on total enrolment. The ISA Level 2 and Level 3 claim and audit process isintended to assess each boards’ relative proportion of students with very high needs, andto provide funding in proportion to each boards’ incidence of those students. Each boarduses its total special education revenue – both SEPPA and ISA Levels 2 and 3 – to meetthe needs of all its students with special needs.
Intensive Amount Support (ISA) Guidelines for School Boards 3
Funding for ISA Level 4 is provided to boards to support educational programs providedby boards in correctional, care, and treatment facilities operated by other Ontariogovernment ministries or community agencies. This funding allows boards to provideteachers, teaching assistants, learning materials, and classroom supplies and equipmentfor children and youth in these facilities.
Ongoing Refinement of the Special Education Grant
We have increased special education funding levels every year since the governmentintroduced student-focused funding.
The ISA approach to special education funding was first implemented in 1998–99. Theministry has continued to refine this approach over the past three years. Interim measureswere put in place to support program stability and to avoid adverse impacts on programsthat would result from a reduction in special education revenue.
In 1998–99, school boards received funding based on the results of the 1998 claim andaudit process or on ministry projections made at the time of the announcement of student-focused funding in 1998, whichever was higher. In 1999–2000, boards received the samelevel of funding for ISA Level 2 and 3 as they received in 1998–99.
For the 2000–01 school year, to ensure stability of programs, the ministry continues toprovide funding for stability based on the funding results of past years. Boards arefunded on the basis of their highest result in 1998, 1999, or 2000. This means that manyboards are receiving funding in addition to the level generated by eligible claims in 2000.
For the 2001-02 school year, the ministry will continue to provide funding for stabilitybased on boards’ final ISA Level 2 and 3 allocation in 2000-01. In addition, funding forstudent-focused funding has been increased and district school boards have been giventhe flexibility to use this funding increase to address local priorities. Boards can use theirshare of this funding to address cost pressures for supports for students with specialneeds.
The ISA Working Group
In November 2000, the ministry established an ISA working group with a mandate todevelop recommendations to support ongoing improvements to ISA funding. The groupincludes a wide range of provincial associations including representatives from trustees,supervisory officers, business officials, special education administrators, the Minister’sAdvisory Committee on Special Education, the Ontario Parents Council, and theProvincial Parent Association Advisory Committee on Special Education AdvisoryCommittees (PAAC on SEAC).
In January 2001, the ISA working group recommended a number of integrated strategiesto improve ISA funding. The strategies focus on making the process more predictable,
Intensive Amount Support (ISA) Guidelines for School Boards4
more responsive to need, and less administratively burdensome. The ministry hascommitted to a multi-year strategy to improve the ISA funding approach based on therecommendations of the ISA working group. A more detailed outline of futurerefinements to ISA Levels 2 and 3 funding is provided in Appendix E.
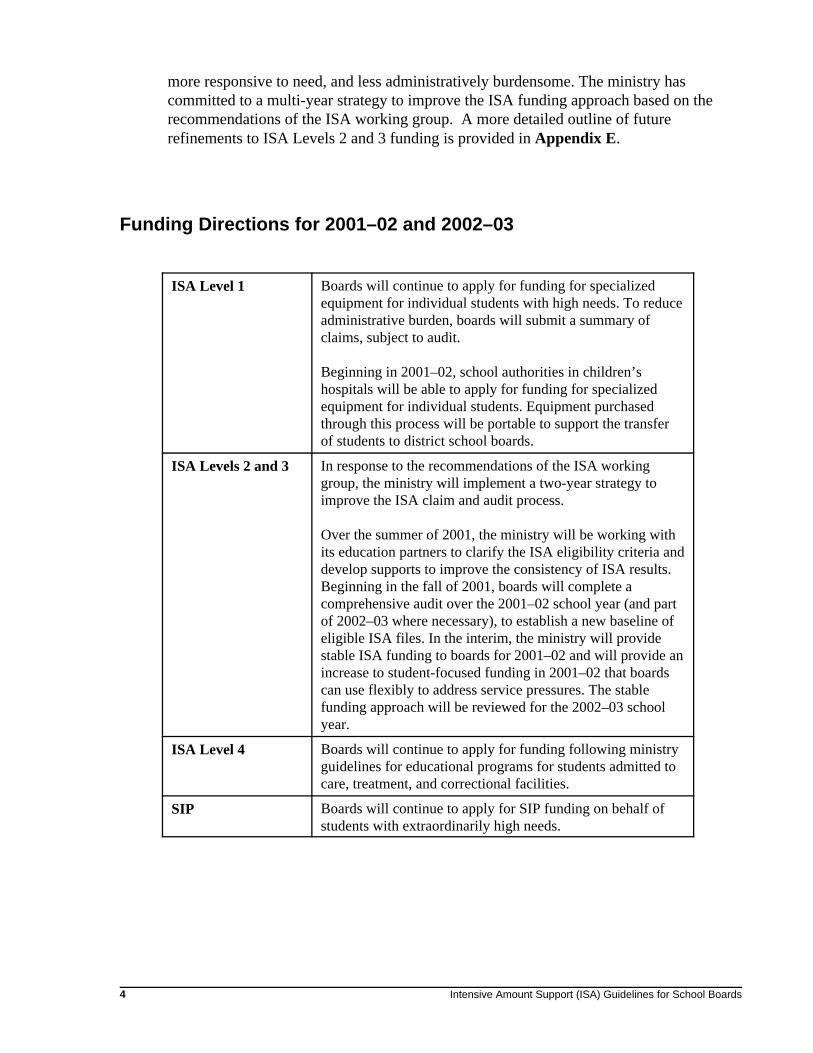
Funding Directions for 2001–02 and 2002–03
ISA Level 1 Boards will continue to apply for funding for specializedequipment for individual students with high needs. To reduceadministrative burden, boards will submit a summary ofclaims, subject to audit.
Beginning in 2001–02, school authorities in children’shospitals will be able to apply for funding for specializedequipment for individual students. Equipment purchasedthrough this process will be portable to support the transferof students to district school boards.
ISA Levels 2 and 3 In response to the recommendations of the ISA workinggroup, the ministry will implement a two-year strategy toimprove the ISA claim and audit process.
Over the summer of 2001, the ministry will be working withits education partners to clarify the ISA eligibility criteria anddevelop supports to improve the consistency of ISA results.Beginning in the fall of 2001, boards will complete acomprehensive audit over the 2001–02 school year (and partof 2002–03 where necessary), to establish a new baseline ofeligible ISA files. In the interim, the ministry will providestable ISA funding to boards for 2001–02 and will provide anincrease to student-focused funding in 2001–02 that boardscan use flexibly to address service pressures. The stablefunding approach will be reviewed for the 2002–03 schoolyear.
ISA Level 4 Boards will continue to apply for funding following ministryguidelines for educational programs for students admitted tocare, treatment, and correctional facilities.
SIP Boards will continue to apply for SIP funding on behalf ofstudents with extraordinarily high needs.
Intensive Amount Support (ISA) Guidelines for School Boards 5
ISA Level 1 Specialized Equipment Funding
General Information for District School Boards
An ISA Level 1 claim may be put forward by a school board to meet the needs of studentswho require a total expenditure on specialized equipment in excess of $800, includingfreight and taxes, for the school year.
There will be a spring and a fall cycle of ISA Level 1 claims, which will be incorporatedinto the board’s regular budget cycle.
The spring cycle allows boards to purchase equipment and have it in place for the start ofthe 2001–02 school year. The fall cycle allows boards to meet their in-year equipmentneeds.
An ISA Level 1 claim may be submitted for any student with special needs enrolled in aboard, whether or not a claim is being made for ISA Level 2 or 3 funding.
Boards are required to complete, on a ministry claim form, a summary of all of their ISALevel 1 claims.
Claim documentation, except for claims over $6000, is not submitted to the districtoffices but is retained by the boards for ministry audit purposes.
For ISA Level 1 claims exceeding $6000, the board must seek pre-approval from theMinistry of Education district office to confirm that other less costly options have beenexplored and are not appropriate. Once approved, boards may include the claim on theISA Level 1 summary claim form. To complete the equipment claim process forindividual claims exceeding $6000, boards must provide invoices indicating the actualcost to the district office of the Ministry of Education.
ISA Level 1 summary claim forms must be prepared according to ministry instructionsand must be verified and signed by the board’s supervisory officer responsible for thespecial education program before being submitted to the district office for processing.
As part of the ISA Level 1 funding process, the ministry provides boards with thesummary claim form submitted in the previous claim cycle to allow boards anopportunity to adjust equipment costs reported as estimates to reflect actual costs. Theadjusted summary claim form is submitted along with the current cycle’s summary claimform for processing. The ministry adjusts boards’ ISA Level 1 equipment fundingallocation to reflect actual costs, if necessary.
* Boards will co-ordinate the application process, including submission deadlines, with the appropriate Ministry ofEducation district office. Planning for the submission with the district office can begin before the student enrols inSeptember.
Intensive Amount Support (ISA) Guidelines for School Boards6
Beginning in 2001-02, boards may submit an early ISA Level 1 claim for students whowere attending a provincial or demonstration school and have enrolled in a district schoolboard for the 2001-02 school year. This will ensure that boards have the specializedequipment in place for these students with special needs at the beginning of the schoolyear and will ensure continuity in service delivery.*
To be complete, documentation for each ISA Level 1 claim must be maintained by theboard and must include the required assessment and quote or invoice.
Boards are encouraged to use the spring cycle to ensure that equipment is operational andin place for students’ first day of school.
The board should ensure that equipment purchased for students whose enrolment is notconfirmed is returnable.
* Subject to confirmation of submission deadlines for Estimates for the 2001–02 student-focused fundingcycle.
** Subject to confirmation of submission deadlines for Revised Estimates for the 2001–02 student-focusedfunding cycle.
Intensive Amount Support (ISA) Guidelines for School Boards 7
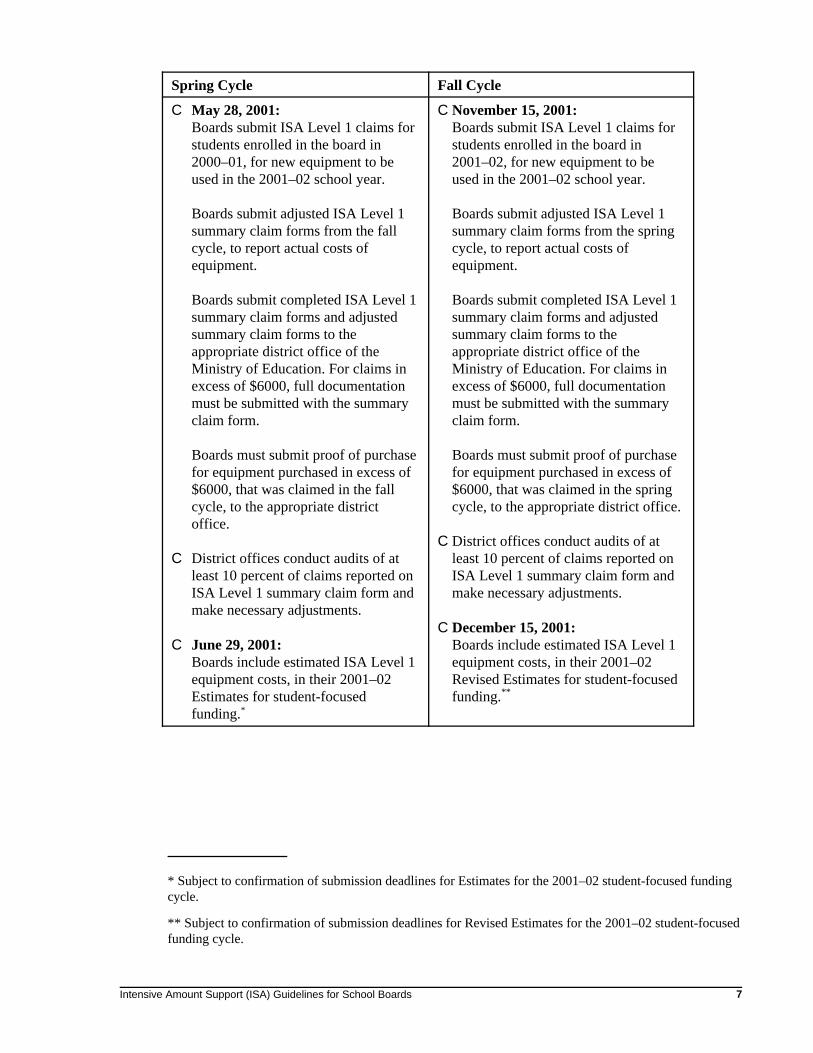
Spring Cycle Fall Cycle
C May 28, 2001: Boards submit ISA Level 1 claims forstudents enrolled in the board in2000–01, for new equipment to beused in the 2001–02 school year.
Boards submit adjusted ISA Level 1summary claim forms from the fallcycle, to report actual costs ofequipment.
Boards submit completed ISA Level 1summary claim forms and adjustedsummary claim forms to theappropriate district office of theMinistry of Education. For claims inexcess of $6000, full documentationmust be submitted with the summaryclaim form.
Boards must submit proof of purchase for equipment purchased in excess of$6000, that was claimed in the fallcycle, to the appropriate districtoffice.
C District offices conduct audits of atleast 10 percent of claims reported onISA Level 1 summary claim form andmake necessary adjustments.
C June 29, 2001: Boards include estimated ISA Level 1equipment costs, in their 2001–02Estimates for student-focusedfunding.*
C November 15, 2001: Boards submit ISA Level 1 claims forstudents enrolled in the board in2001–02, for new equipment to beused in the 2001–02 school year.
Boards submit adjusted ISA Level 1summary claim forms from the springcycle, to report actual costs ofequipment.
Boards submit completed ISA Level 1summary claim forms and adjustedsummary claim forms to theappropriate district office of theMinistry of Education. For claims inexcess of $6000, full documentationmust be submitted with the summaryclaim form.
Boards must submit proof of purchase for equipment purchased in excess of$6000, that was claimed in the springcycle, to the appropriate district office.
C District offices conduct audits of atleast 10 percent of claims reported onISA Level 1 summary claim form andmake necessary adjustments.
C December 15, 2001: Boards include estimated ISA Level 1equipment costs, in their 2001–02Revised Estimates for student-focusedfunding.**
Intensive Amount Support (ISA) Guidelines for School Boards8
General Information for School Authorities in Children’s Hospitals
Beginning in 2001–02, school authorities in children’s hospitals may apply for funding topurchase, for individual students, specialized equipment that costs in excess of $800,through a claim process that will be part of their annual budget process.
In preparing claims for specialized equipment funding, school authorities in children’shospitals should include documentation that outlines the full cost of the equipmentincluding an estimate of taxes, installation, and delivery charges. Each claim must includethe required assessment and quote or invoice.
School authorities in children’s hospitals may only submit a claim, for individualstudents, for specialized equipment that costs in excess of $800. There will not be an$800 deductible for specialized equipment for individual students purchased by schoolauthorities in children’s hospitals, since school authorities do not receive the specialeducation funding that district school boards use to pay the deductible.
The Ministry of Education will provide detailed guidelines to school authorities inchildren’s hospitals on the specialized equipment claim process, as part of their budgetapproval instructions.
What’s new under ISA Level 1?
ISA Level 1 claims in the spring of 2001 will not be validated by the ministry. Instead,boards will submit a summary of claims (as introduced in the winter of 2000–01).Boards no longer have to submit the required documentation for ISA Level 1 claims tothe ministry, unless the equipment claimed costs in excess of $6000. Funding will flowto boards as part of the regular board budget cycle.
Beginning in 2001–02, school authorities in children’s hospitals will be able to applyfor funding to purchase, for individual students, specialized equipment that costs inexcess of $800. The claim process for equipment will be part of their annual budgetprocess. School authorities in children’s hospitals will be required to submit allrequired documentation to the Ministry of Education District office for the claims tobe processed. This equipment will be portable.
In 2001-02, a board may submit an early ISA Level 1 claim for students who wereattending a provincial or demonstration school but have enrolled in a district schoolboard for the 2001-02 school year.
Intensive Amount Support (ISA) Guidelines for School Boards 9
Equipment Deductible and District School Boards
Equipment costs are cumulative for any given student. The ministry will deduct $800from the total amount of ISA Level 1 funding claimed for a student in a board in a givenschool year.
In preparing claims for ISA Level 1 funding, school boards should include documentationthat outlines the full cost of equipment including an estimate of taxes, installation, anddelivery charges. The $800 deduction will be made by the ministry.
The ministry will not deduct $800 from the cost of each piece of equipment claimed foreach board student. For example, if one student requires three pieces of equipmenttotalling $7200, the ministry will deduct a total of $800 once in 2001–02 for that student.If three separate students require $2400 each for equipment (totalling $7200), the ministrywill deduct a total of $2400 for the equipment (3 x $800).
It is expected that boards will use other special education funding to cover the $800deducted from the ISA Level 1 claim.
Leasing of Equipment
Some equipment is extremely costly. Boards and school authorities in children’s hospitalsare encouraged to make leasing arrangements that provide for maintenance and substituteequipment.
When leasing arrangements are made, the entire cost of the lease should be claimed inthe first year – not as a pro-rated cost over the life of the lease. For example, a three-yearlease at $1000 per year would be claimed as $3000 in the first year of the lease.
Eligible Specialized Equipment
All equipment claims must be for specialized equipment for individual students for use atthe school or school authority.
Examples of such equipment are:
• speech analysers
• FM systems
• print enlargers for students with low vision
• amplification systems
Intensive Amount Support (ISA) Guidelines for School Boards10
• computer hardware/software
• individually modified desks or work tables
• adjustable desks or computer tables
• braille writers
• symbol or letter voice translators
• insulated booths and study carrels
• communication aids, for example, Boardmaker7, speech synthesizers
• positioning devices for sitting, standing, and lying
• other equipment that is required at school for the personal use of specific students tofacilitate an approved course of study
Costs claimed may include the cost of equipment; insurance; warranty agreements;service agreements; and peripherals such as computer cables, batteries, and softwarerequired to make the equipment work.
Boards and school authorities in hospitals must ensure that specialized equipmentpurchased in Ontario meets Canadian safety standards, where applicable.
Radio-frequency equipment, optical aids, electronic devices, and positioning equipmentoften become damaged, obsolete, or outgrown. Approval for the same or a similar pieceof equipment for the same student may be given after three calendar years when therequest is accompanied by appropriate documentation.
If more expensive versions of equipment are purchased, there should be an explanatorynote to justify the preference, such as compatibility with other components already on-site, or ease of use for a particular student’s cognitive or manual abilities.
Boards and school authorities in children’s hospitals must be able to show that due carehas been taken to minimize costs (for example, protect devices from theft, reduceinsurance costs, solicit competitive quotes for service agreements).
Where equipment is shared, the cost should be assigned to one student and the otherstudents sharing it should be noted. An example of equipment that might be shared is abraille printer. If the student who claimed the cost of the equipment moves, the equipmentmay be left in the school to support the remaining students.
If a student receives equipment as part of an insurance settlement or benefit, the board orschool authority in children’s hospitals must not make an ISA Level 1 claim, as no costswill have been incurred by the board.
If a cost-sharing arrangement has been made, the board or school authority in a children’shospital may claim its share of the cost if its share exceeds $800.It is expected that if an on-site visit were to be made in-year:
• the equipment would be found with the student for whom the cost was claimed,
• the equipment would be found in good repair, and
Intensive Amount Support (ISA) Guidelines for School Boards 11
• the student and/or staff would be able to operate the equipment.
Required Documentation
Each ISA Level 1 claim must be documented by:
1. an assessment on file from an appropriately qualified professional,2. a copy of the invoice(s) or proof of cost of equipment to be purchased, and3. a current copy of the student’s IEP.
Documentation should include the board’s student number of the student assigned theequipment.
The first two requirements are expanded below.
1. An Assessment on File from an Appropriately Qualified Professional
The appropriately qualified professional will vary depending upon the nature of thestudent’s disability and the purpose and function of the equipment. Regardless of whoperformed the assessment, it should indicate:
• that the particular device is essential in order for the student to benefit frominstruction, and
• the disability that the device will help to ameliorate.
a) Braille Devices
When claims are made for braille equipment and/or software, there should be evidencethat the claims are made for a student who is blind and that the equipment and/or softwareare required to ensure that the student can have access to his or her educational program.The vision assessment should be performed by an ophthalmologist; however, anassessment or letter of reference from a Provincial School for the Blind, verifying theneed for braille and hence for braille equipment, will also be accepted.
b) Communication Devices
When a communication device (such as a speech synthesizer) is purchased, it willnormally be purchased for a student who is nonverbal and/or multi-handicapped and/orautistic and/or developmentally disabled. The assessment on file should make referenceto the disability for which the communication device is required and state how thisparticular device will ensure that the student can have access to his or her educational
Intensive Amount Support (ISA) Guidelines for School Boards12
program and/or assist the student in communicating with others at school. The assessmentmay have been done by an augmentative communication therapist, a speech therapist, oranother knowledgeable person who serves as a consultant or resource to the board.
Students with some learning disabilities or severe physical disabilities may require othercommunication aids such as voice-activated software. Boards are expected to meet theseneeds while attending to cost-efficiency. For example, if a widely available voice-activated package will meet the student’s needs, it should be obtained before investing inmore expensive, specialty software.
c) FM Systems or Similar Devices
When an FM device is purchased, there should be evidence that it is for a student who isdeaf or hard of hearing, and that this particular device is required to ensure that thestudent can have access to his or her educational program. The hearing assessment shouldbe performed by an audiologist; however, an assessment or letter of reference from aProvincial School for the deaf, verifying the need for the equipment, would also beaccepted.
When such devices are being considered for students with central auditory processingneeds, a six-month trial period is recommended prior to making a claim.
Clear sound fields may be purchased for:
• students who are assessed as being hard of hearing by an audiologist, or
• students who are assessed by an appropriately qualified professional as requiring asound field for other purposes.
d) Computer Hardware
Claims may not be made for computer hardware when all students in the class wouldordinarily be provided with a computer. However, a claim for specialized equipment foran individual student may be made for computer hardware when the equipment is themost effective way of providing the students with a means of communicating his or herknowledge (for example, when the student has severely limited or nonexistent verbalcommunication, or a physical disability that makes writing extraordinarily difficult orimpossible).
e) Mobility Devices
When a personal mobility or lifting device is purchased, it will usually be for a studentwith physical or developmental disabilities. The assessment on file should make referenceto the disability for which the mobility device is required, and to the fact that thisparticular device is required to provide personal care for the student while at school. Anoccupational therapist is usually the qualified person who assesses and recommendsspecific equipment. In instances where the equipment was purchased with the assistanceof the Ministry of Health and Long-Term Care’s (MOHLTC) Assistive Devices Program(ADP) for home use, a parent’s note indicating that this is the equipment used at homewill also suffice, since this purchase would most likely have required a prior assessmentby an occupation therapist.
Intensive Amount Support (ISA) Guidelines for School Boards 13
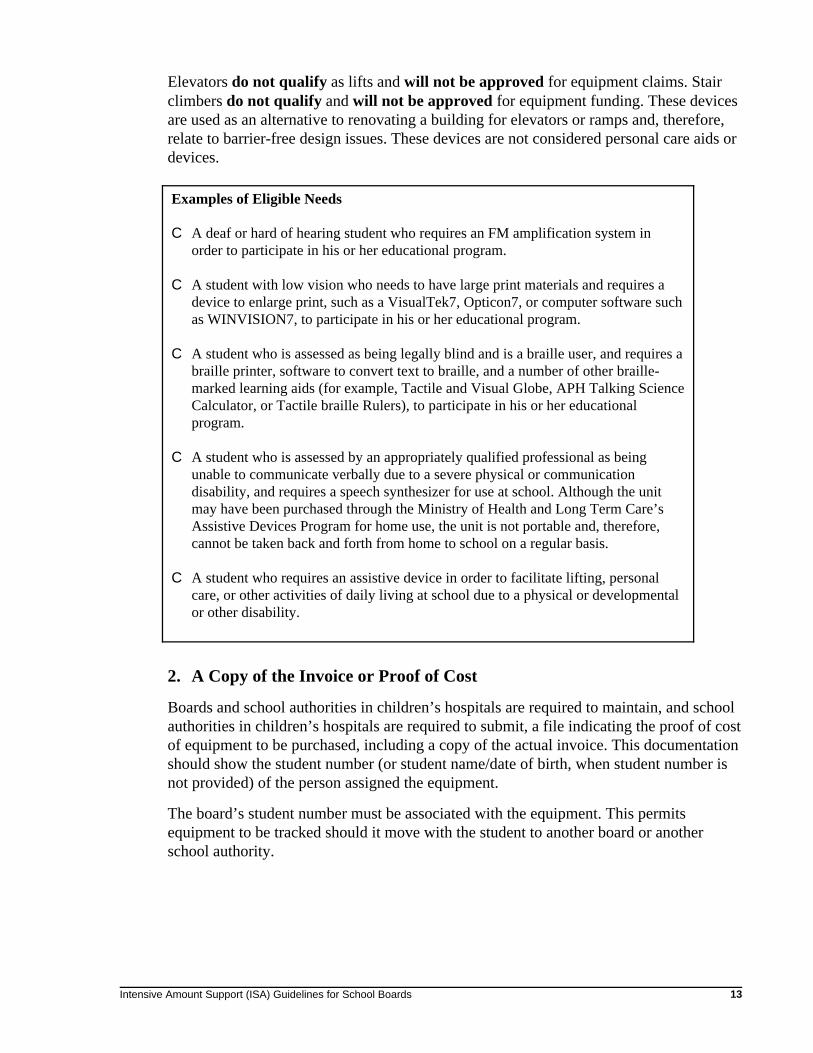
Elevators do not qualify as lifts and will not be approved for equipment claims. Stairclimbers do not qualify and will not be approved for equipment funding. These devicesare used as an alternative to renovating a building for elevators or ramps and, therefore,relate to barrier-free design issues. These devices are not considered personal care aids ordevices.
Examples of Eligible Needs
C A deaf or hard of hearing student who requires an FM amplification system inorder to participate in his or her educational program.
C A student with low vision who needs to have large print materials and requires adevice to enlarge print, such as a VisualTek7, Opticon7, or computer software suchas WINVISION7, to participate in his or her educational program.
C A student who is assessed as being legally blind and is a braille user, and requires abraille printer, software to convert text to braille, and a number of other braille-marked learning aids (for example, Tactile and Visual Globe, APH Talking ScienceCalculator, or Tactile braille Rulers), to participate in his or her educationalprogram.
C A student who is assessed by an appropriately qualified professional as beingunable to communicate verbally due to a severe physical or communicationdisability, and requires a speech synthesizer for use at school. Although the unitmay have been purchased through the Ministry of Health and Long Term Care’sAssistive Devices Program for home use, the unit is not portable and, therefore,cannot be taken back and forth from home to school on a regular basis.
C A student who requires an assistive device in order to facilitate lifting, personalcare, or other activities of daily living at school due to a physical or developmentalor other disability.
2. A Copy of the Invoice or Proof of Cost
Boards and school authorities in children’s hospitals are required to maintain, and schoolauthorities in children’s hospitals are required to submit, a file indicating the proof of costof equipment to be purchased, including a copy of the actual invoice. This documentationshould show the student number (or student name/date of birth, when student number isnot provided) of the person assigned the equipment.
The board’s student number must be associated with the equipment. This permitsequipment to be tracked should it move with the student to another board or anotherschool authority.
Intensive Amount Support (ISA) Guidelines for School Boards14
Portability of Specialized Equipment
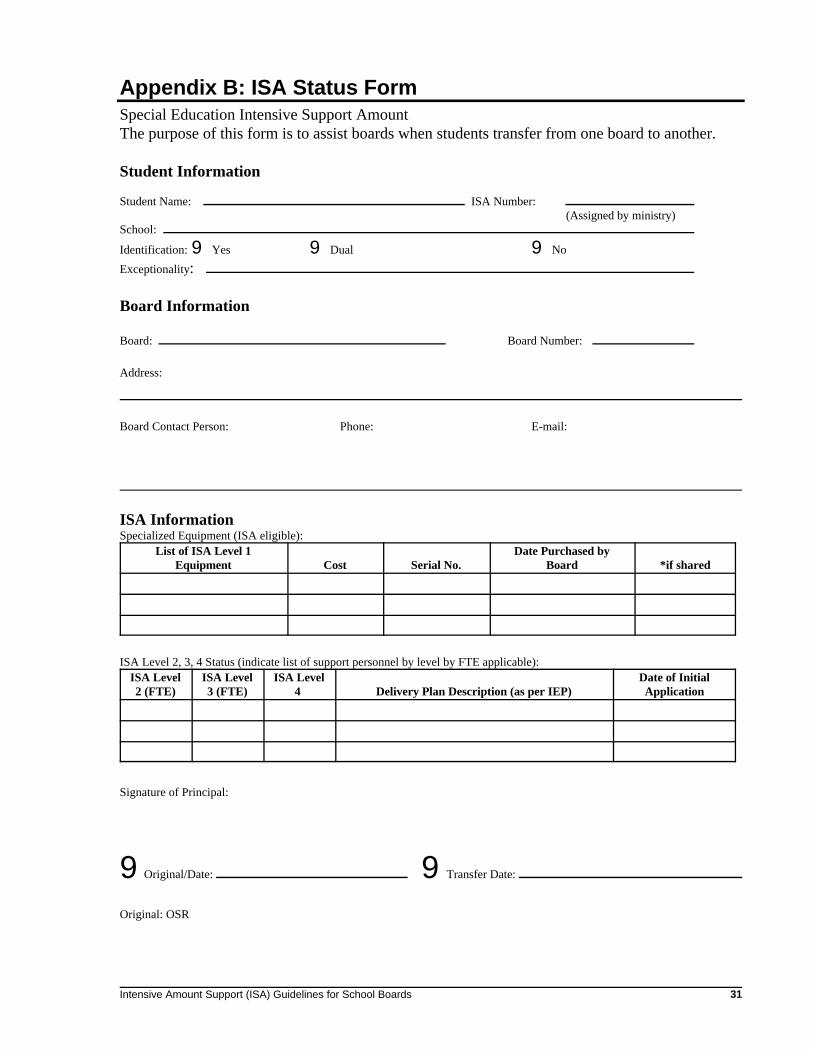
Equipment purchased by a district school board with ISA funding is portable and moveswith the student from school to school or from board to board. District school boardsmust use the ISA Status Form (Appendix B) to facilitate this process. The student’ssending board does not get reimbursed by the ministry for the $800, although boards maymake an agreement to reimburse the $800 to the sending board. However, the student’sreceiving board will be responsible for any shipping or handling costs associated with thetransfer of equipment.
Equipment purchased previously under the provisions of the ministry’s formerPersonalized, Special Instructional Equipment (PSIE) program may remain the propertyof the board unless the board opts to transfer the equipment with the student.
Specialized equipment for individual students purchased by school authorities inchildren’s hospitals through the equipment claim process is portable. As with specializedequipment purchased with ISA Level 1 funding in district school boards, specializedequipment purchased by a school authority in a children’s hospital will move with thestudent to another board or another school authority.
School authorities in children’s hospitals will use a separate form, to be provided by theMinistry of Education, to facilitate equipment tracking.
Ministry of Health and Long-Term Care Assistive Devices Program
The Ministry of Health and Long-Term Care’s (MOHLTC) Assistive Devices Program(ADP) provides partial funding to individuals for some equipment intended for useprimarily in the home. By its nature, some of this equipment is portable and, therefore,can be used at both home and school. Cost-sharing arrangements are encouraged and maybe claimed when the boards’ share surpasses $800 for the student in the school year.Where a duplicate piece of equipment is needed because it is not portable between homeand school, the board may submit a claim for the duplicate piece of equipment used atschool.
An ISA claim may not be made for the portion of the equipment cost eligible for fundingassistance under ADP. For further information about the ADP please contact theMOHLTC - ADP through the blue pages of your local telephone directory.
Intensive Amount Support (ISA) Guidelines for School Boards 15
ISA Level 2 and ISA Level 3
Approach for 2001–02 and 2002–03
Over the spring and summer of 2001, the ministry and its education partners will work torefine the ISA Level 2 and Level 3 eligibility profiles. Starting in the fall of 2001, andending October 31, 2002, school boards will establish a new baseline of eligible files bycompleting a comprehensive audit of ISA files.
After a new baseline of eligible files is established, boards will claim only new files eachyear. The intended effect is to reduce the annual administrative effort required in futureyears.
While the baseline is being established, boards will receive stable ISA funding in 2001-02(the final amount of ISA Level 2 and 3 funding allocated in 2000–01, adjusted forportability). Boards will also receive increased funding through enhancements to student-focused funding in 2001-02, which boards can use to address cost pressures for supportsfor students with special needs. The stable funding approach will be reviewed for the2002–03 school year.
For a more detailed outline of the future direction of ISA Level 2 and 3 funding, seeAppendix E.
ISA Level 2 and Level 3 Portability
To help ensure that boards’ funding matches their relative share of high needs students,ISA funding is adjusted when a student for whom a claim was filed in the 2000 ISA auditmoves between boards. Portability will adjust each board’s ISA Level 2 and 3 allocationto reflect the transfer of ISA files among school boards.
To facilitate the portability of ISA funding, the Ministry of Education will assign an ISAnumber to each student for whom an ISA Level 2 and or Level 3 claim was made in the2000 audit and to each student for whom a new claim is made.
Intensive Amount Support (ISA) Guidelines for School Boards16
ISA Numbers
Beginning in the spring of 2000–01, the Ministry of Education will assign numbersfor identification purposes to students for whom an ISA claim was submitted in2000. The ministry will also assign numbers for new files claimed in thecomprehensive review beginning in 2001–02.
The ministry will ensure that the assignment of these numbers is done incoordination with the Ontario Education Number (OEN) system of studentnumbers that is currently being established by the ministry.
To support the portability process for 2001–02, each board will receive a spreadsheetlisting students claimed for ISA Level 2 and Level 3 in 2000–01. This list will correspondto the ISA claims list used by boards and the ministry in the 2000 ISA audit, with theaddition of ISA numbers for each claim.
To apply for portability funding, each board is required to fill out a form, provided by theministry, identifying, by ISA number, each student for whom an ISA Level 2 and 3 claimwas made in 2000 who came from another board and has enrolled in the board as ofOctober 31, 2001. Boards will have to obtain the ISA number for each of the newstudents from their sending boards. The Ministry of Education will not provide thesenumbers.
Boards will submit the completed form, including the ISA numbers, to the ministry.
• For the 2001–02 school year, claims are due November 2001.
The Ministry of Education will adjust boards’ final ISA Level 2 and 3 allocations, usingthe receiving boards’ validation rate in 2000, to reflect portability. To give boards anopportunity to identify any errors affecting their allocation, the ministry will provide eachboard with a portability funding summary, including a list of ISA numbers for incomingand outgoing students, and the portability adjustment to their ISA Level 2 and 3allocations.
The portability adjustment formula will remain the same as used in the past two schoolyears:
[(net gain or loss ISA level 2 students x $12,000) + (net gain or loss of ISA Level 3students x $27,000)] x receiving board validation rate in 2000
Portability adjustments will be made to all boards to reflect the portability claims,regardless of whether the affected boards submitted a claim.
The Ministry of Education will issue the portability forms that will be used in the claimprocess in the spring of 2001.
Intensive Amount Support (ISA) Guidelines for School Boards 17
ISA Level 4
As in past years, guidelines for ISA Level 4 will be issued by the ministry in a separatedocument for the 2001–02 school year.
Intensive Amount Support (ISA) Guidelines for School Boards18
Special Incidence Portion (SIP)
Continuing in 2001–02, school boards may apply to their Ministry of Education districtoffice for funding through the Special Incidence Portion (SIP), for students who haveextraordinarily high needs related to their disabilities for staff support to ensure the safetyof themselves or others in the classroom.
Where approved, the ministry will grant up to a maximum of an additional $27,000 perstudent.
Beginning in 2001–02, there will be both a fall and a spring cycle of SIP claims, whichwill be incorporated as part of the board’s regular budget cycle.
The spring cycle of SIP claims will allow boards to reapply for funding for additionalstaff supports in 2001–02, for students who received SIP funding in the 2000–01 schoolyear. Boards may also apply for funding for students in 2001-02 for whom additional staffsupports were provided after the fall application process in 2000.
The fall cycle of SIP claims will allow boards to apply for funding for additional staffsupports for students who have been provided with additional staff supports beginning in2001-02 (new claims).
Eligibility Criteria for SIP
Safety
School boards may bring forward SIP applications on behalf of students who requiremore than two full-time staff for the safety of the applicant student or other students.Typically, this additional support will be provided by a teaching or behavioural assistant.
The student may be enrolled in either a self-contained or an integrated/resourcewithdrawal setting to be eligible for SIP.
Staff Support
SIP is intended to offset incremental staff costs for a student who already has at least twofull-time staff providing intensive support according to the formula outlined in the staffsupport worksheets (Appendix A).
Intensive Amount Support (ISA) Guidelines for School Boards 19
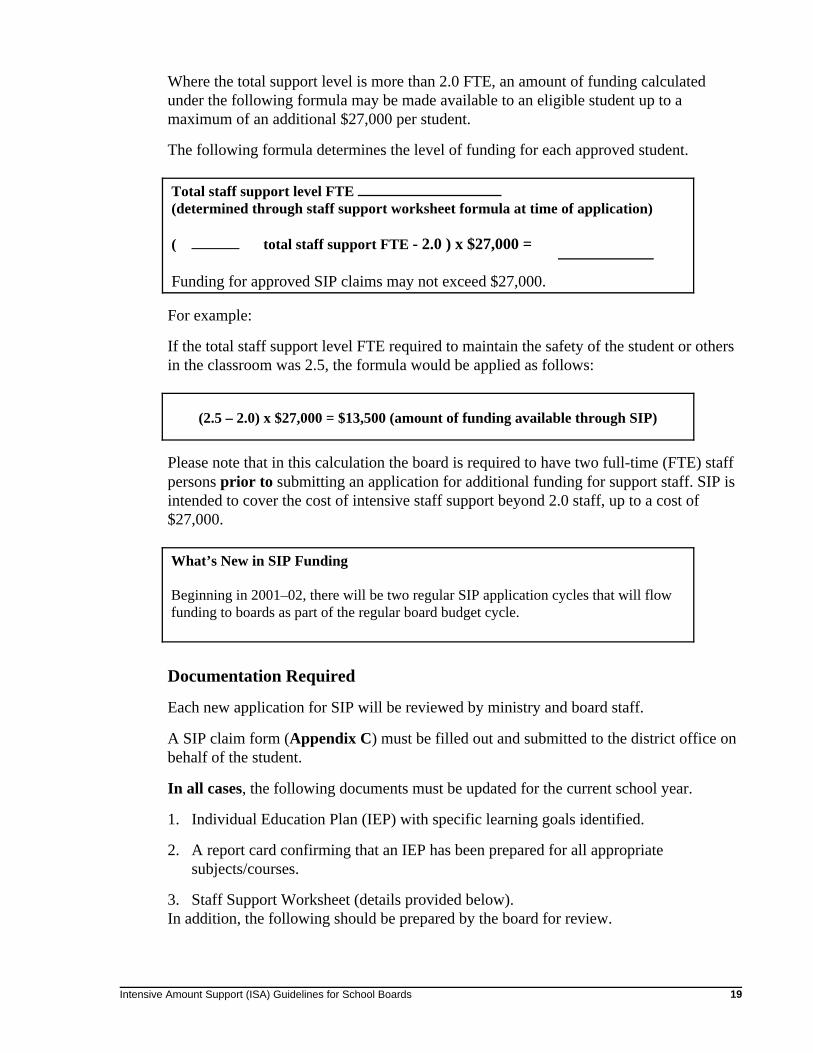
Where the total support level is more than 2.0 FTE, an amount of funding calculatedunder the following formula may be made available to an eligible student up to amaximum of an additional $27,000 per student.
The following formula determines the level of funding for each approved student.
Total staff support level FTE (determined through staff support worksheet formula at time of application)
( total staff support FTE - 2.0 ) x $27,000 =
Funding for approved SIP claims may not exceed $27,000.
For example:
If the total staff support level FTE required to maintain the safety of the student or othersin the classroom was 2.5, the formula would be applied as follows:
(2.5 – 2.0) x $27,000 = $13,500 (amount of funding available through SIP)
Please note that in this calculation the board is required to have two full-time (FTE) staffpersons prior to submitting an application for additional funding for support staff. SIP isintended to cover the cost of intensive staff support beyond 2.0 staff, up to a cost of$27,000.
What’s New in SIP Funding
Beginning in 2001–02, there will be two regular SIP application cycles that will flowfunding to boards as part of the regular board budget cycle.
Documentation Required
Each new application for SIP will be reviewed by ministry and board staff.
A SIP claim form (Appendix C) must be filled out and submitted to the district office onbehalf of the student.
In all cases, the following documents must be updated for the current school year.
1. Individual Education Plan (IEP) with specific learning goals identified.
2. A report card confirming that an IEP has been prepared for all appropriatesubjects/courses.
3. Staff Support Worksheet (details provided below).In addition, the following should be prepared by the board for review.
Intensive Amount Support (ISA) Guidelines for School Boards20
• A current description and assessment of the behavioural issues of the student thathave led the board to submit a SIP claim. Where relevant, a description of the safetyrisks the student may pose to other classmates or to self should be included.
• A management/instruction plan for behaviour modification. Please note that staffshould be under the supervision of a psychologist or psychiatrist for the plan to beconsidered adequate.
• Cost projections for implementation of the plan.
• A description of interministerial involvement in the overall intervention plans for thestudent (for example, children’s treatment centre contact, other services purchasedand in place for the student that are funded by other ministries, transitional plans if thestudent is at the secondary school level).
• Timetables for the staff assigned to the student.
For students for whom an ISA claim was made in 2000–01, documents gathered in thedevelopment of a student’s ISA claim (including the appropriate assessments, stafftimetables, IEPs, and report cards) should also be brought forward for ministry review.(In 2001–02, most students found eligible for SIP funding will have been claimed underISA Level 3 in 2000–01.)
Boards may also put forward SIP claims on behalf of the students who were not claimedin 2000–01 but who would otherwise meet the SIP criteria. For students for whom an ISAclaim was not made in 2000–01, documents gathered in the development of the student’sIdentification, Placement, and Review Committee (IPRC), including the appropriateassessments and staff timetables, should also be brought forward at the review meeting.
* Subject to confirmation of submission deadlines for Estimates for the 2001–02 student-focused fundingcycle.
** Subject to confirmation of submission deadlines for Revised Estimates for the 2001–02 student-focusedfunding cycle.
Intensive Amount Support (ISA) Guidelines for School Boards 21
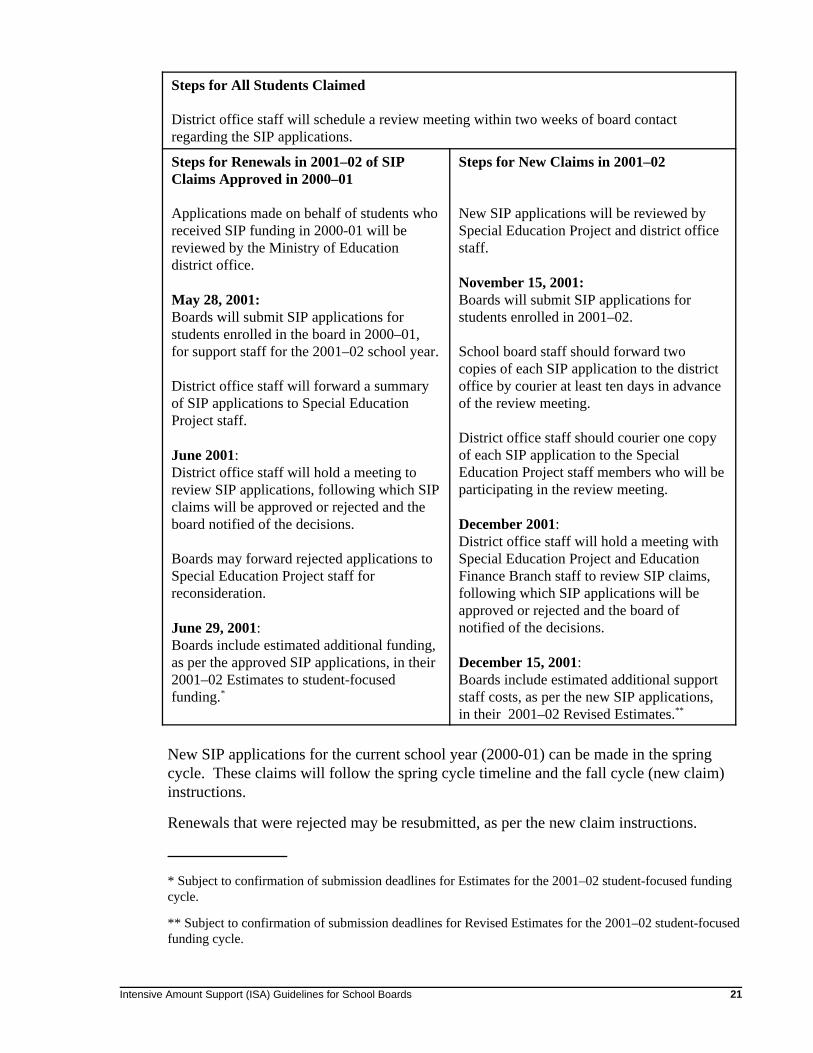
Steps for All Students Claimed
District office staff will schedule a review meeting within two weeks of board contactregarding the SIP applications.
Steps for Renewals in 2001–02 of SIPClaims Approved in 2000–01
Applications made on behalf of students whoreceived SIP funding in 2000-01 will bereviewed by the Ministry of Educationdistrict office.
May 28, 2001: Boards will submit SIP applications forstudents enrolled in the board in 2000–01,for support staff for the 2001–02 school year.
District office staff will forward a summaryof SIP applications to Special EducationProject staff.
June 2001: District office staff will hold a meeting toreview SIP applications, following which SIPclaims will be approved or rejected and theboard notified of the decisions.
Boards may forward rejected applications toSpecial Education Project staff forreconsideration.
June 29, 2001: Boards include estimated additional funding,as per the approved SIP applications, in their2001–02 Estimates to student-focusedfunding.*
Steps for New Claims in 2001–02
New SIP applications will be reviewed bySpecial Education Project and district officestaff.
November 15, 2001: Boards will submit SIP applications forstudents enrolled in 2001–02.
School board staff should forward twocopies of each SIP application to the districtoffice by courier at least ten days in advanceof the review meeting.
District office staff should courier one copyof each SIP application to the SpecialEducation Project staff members who will beparticipating in the review meeting.
December 2001: District office staff will hold a meeting withSpecial Education Project and EducationFinance Branch staff to review SIP claims,following which SIP applications will beapproved or rejected and the board ofnotified of the decisions.
December 15, 2001: Boards include estimated additional supportstaff costs, as per the new SIP applications,in their 2001–02 Revised Estimates.**
New SIP applications for the current school year (2000-01) can be made in the springcycle. These claims will follow the spring cycle timeline and the fall cycle (new claim)instructions.
Renewals that were rejected may be resubmitted, as per the new claim instructions.
Intensive Amount Support (ISA) Guidelines for School Boards22
Boards are reminded that regardless of the outcome of their SIP applications, all specialeducation students should receive the services and supports outlined in their IEPs.
Staff Support Worksheets
As part of each SIP claim, boards are required to complete an accurate Staff SupportWorksheet that details the level of support being offered to the student.
Accompanying the Staff Support Worksheet should be a timetable. Timetables will proveuseful to board staff in calculating support for the Staff Support Worksheet for each claimand to ministry staff reviewing the SIP claim.
There is a Staff Support Worksheet for each of the following:
• students in integrated or integrated/resource withdrawal programs;
• students in self-contained settings;
• students who are deaf, blind, or deaf-blind in integrated/resource withdrawal; and
• students who are deaf, blind, or deaf-blind in self-contained settings.
Time spent by teaching and behavioural assistants, child and youth workers, and otherequivalent classroom assistants can be included on the worksheets, provided that thesestaff are spending regularly scheduled time with students. Staff counted in the StaffSupport Worksheets must be spending at least ten percent of the student’s instructionalhours during a week with the student, on a regularly scheduled basis, for the entire schoolyear.
The Staff Support Worksheets should not include time spent by professional supports. Inmost instances, professional supports are provided on a consulting basis over a limitednumber of sessions with the student, varying in frequency over the year. Only inexceptional circumstances, where the board can document that a student’s programincludes a significant level of regular interactions (exceeding a total of ten percent ofinstructional hours during a week) that continue over the school year, can these supportsbe included in the worksheets.
If small group interaction is part of the student’s plan, the time that the student spendswith other students can be counted as part of the claimed level of support, as long as thesupport person is in attendance.
Time spent by special education teachers may also be counted as intensive support forstudents in self-contained classrooms or resource withdrawal arrangements.
Classroom teacher time can be counted as intensive support only where the teacher is aspecial education teacher:
• in a self-contained classroom or
• providing resource withdrawal.
Intensive Amount Support (ISA) Guidelines for School Boards 23
Teacher time in a regular classroom is not counted in the calculation of intensive supportin integrated settings, because funding for the teacher’s salary is generated through theFoundation Grant.

Intensive Amount Support (ISA) Guidelines for School Boards 25
Appendix A: Staff Support Worksheets for Special IncidencePortion(SIP)
Staff Support Worksheet 1: Integrated or Integrated/Resource-Withdrawal Program Setting
Staff Support Worksheet 2: Self-Contained Program Setting
Staff Support Worksheet 3: Programs for Deaf, Blind or Deaf-Blind Students in Integrated orIntegrated/Resource Withdrawal Settings
Staff Support Worksheet 4: Programs for Deaf, Blind or Deaf-Blind Students in Self-ContainedSettings

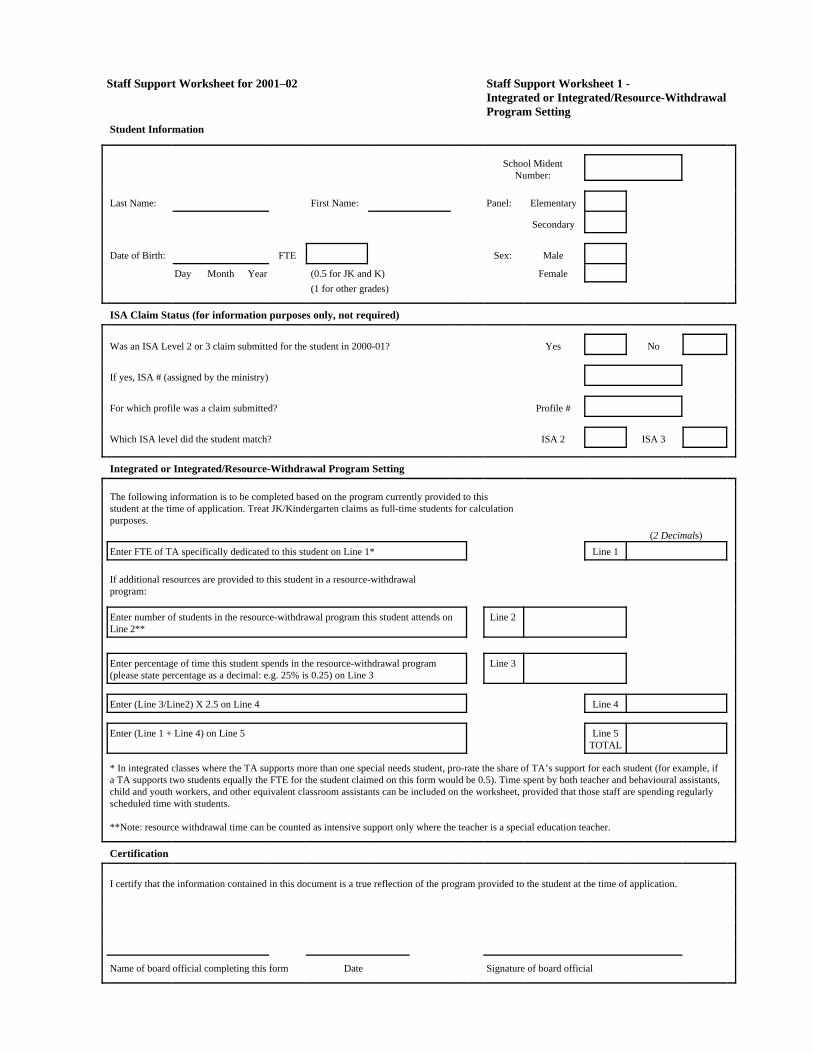
Staff Support Worksheet for 2001–02 Staff Support Worksheet 1 -Integrated or Integrated/Resource-WithdrawalProgram Setting
Student Information
School MidentNumber:
Last Name: First Name: Panel: Elementary
Secondary
Date of Birth: FTE Sex: Male
Day Month Year (0.5 for JK and K) Female(1 for other grades)
ISA Claim Status (for information purposes only, not required)
Was an ISA Level 2 or 3 claim submitted for the student in 2000-01? Yes No
If yes, ISA # (assigned by the ministry)
For which profile was a claim submitted? Profile #
Which ISA level did the student match? ISA 2 ISA 3
Integrated or Integrated/Resource-Withdrawal Program Setting
The following information is to be completed based on the program currently provided to thisstudent at the time of application. Treat JK/Kindergarten claims as full-time students for calculationpurposes.
(2 Decimals)
Enter FTE of TA specifically dedicated to this student on Line 1* Line 1
If additional resources are provided to this student in a resource-withdrawalprogram:
Enter number of students in the resource-withdrawal program this student attends onLine 2**
Line 2
Enter percentage of time this student spends in the resource-withdrawal program(please state percentage as a decimal: e.g. 25% is 0.25) on Line 3
Line 3
Enter (Line 3/Line2) X 2.5 on Line 4 Line 4
Enter (Line 1 + Line 4) on Line 5 Line 5TOTAL
* In integrated classes where the TA supports more than one special needs student, pro-rate the share of TA’s support for each student (for example, ifa TA supports two students equally the FTE for the student claimed on this form would be 0.5). Time spent by both teacher and behavioural assistants,child and youth workers, and other equivalent classroom assistants can be included on the worksheet, provided that those staff are spending regularlyscheduled time with students.
**Note: resource withdrawal time can be counted as intensive support only where the teacher is a special education teacher.
Certification
I certify that the information contained in this document is a true reflection of the program provided to the student at the time of application.
Name of board official completing this form Date Signature of board official
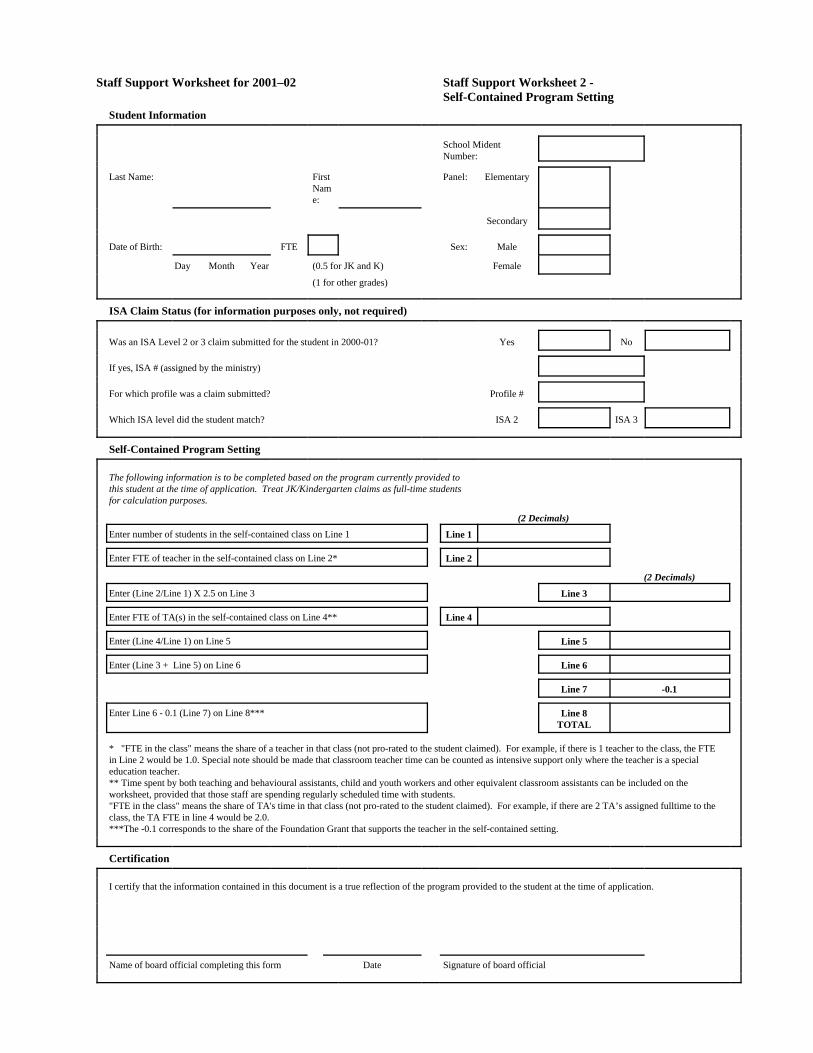
Staff Support Worksheet for 2001–02 Staff Support Worksheet 2 -Self-Contained Program Setting
Student Information
School MidentNumber:
Last Name: FirstName:
Panel: Elementary
Secondary
Date of Birth: FTE Sex: Male
Day Month Year (0.5 for JK and K) Female
(1 for other grades)
ISA Claim Status (for information purposes only, not required)
Was an ISA Level 2 or 3 claim submitted for the student in 2000-01? Yes No
If yes, ISA # (assigned by the ministry)
For which profile was a claim submitted? Profile #
Which ISA level did the student match? ISA 2 ISA 3
Self-Contained Program Setting
The following information is to be completed based on the program currently provided tothis student at the time of application. Treat JK/Kindergarten claims as full-time studentsfor calculation purposes.
(2 Decimals)
Enter number of students in the self-contained class on Line 1 Line 1
Enter FTE of teacher in the self-contained class on Line 2* Line 2
(2 Decimals)
Enter (Line 2/Line 1) X 2.5 on Line 3 Line 3
Enter FTE of TA(s) in the self-contained class on Line 4** Line 4
Enter (Line 4/Line 1) on Line 5 Line 5
Enter (Line 3 + Line 5) on Line 6 Line 6
Line 7 -0.1
Enter Line 6 - 0.1 (Line 7) on Line 8*** Line 8TOTAL
* "FTE in the class" means the share of a teacher in that class (not pro-rated to the student claimed). For example, if there is 1 teacher to the class, the FTEin Line 2 would be 1.0. Special note should be made that classroom teacher time can be counted as intensive support only where the teacher is a specialeducation teacher.** Time spent by both teaching and behavioural assistants, child and youth workers and other equivalent classroom assistants can be included on theworksheet, provided that those staff are spending regularly scheduled time with students."FTE in the class" means the share of TA's time in that class (not pro-rated to the student claimed). For example, if there are 2 TA’s assigned fulltime to theclass, the TA FTE in line 4 would be 2.0.***The -0.1 corresponds to the share of the Foundation Grant that supports the teacher in the self-contained setting.
Certification
I certify that the information contained in this document is a true reflection of the program provided to the student at the time of application.
Name of board official completing this form Date Signature of board official
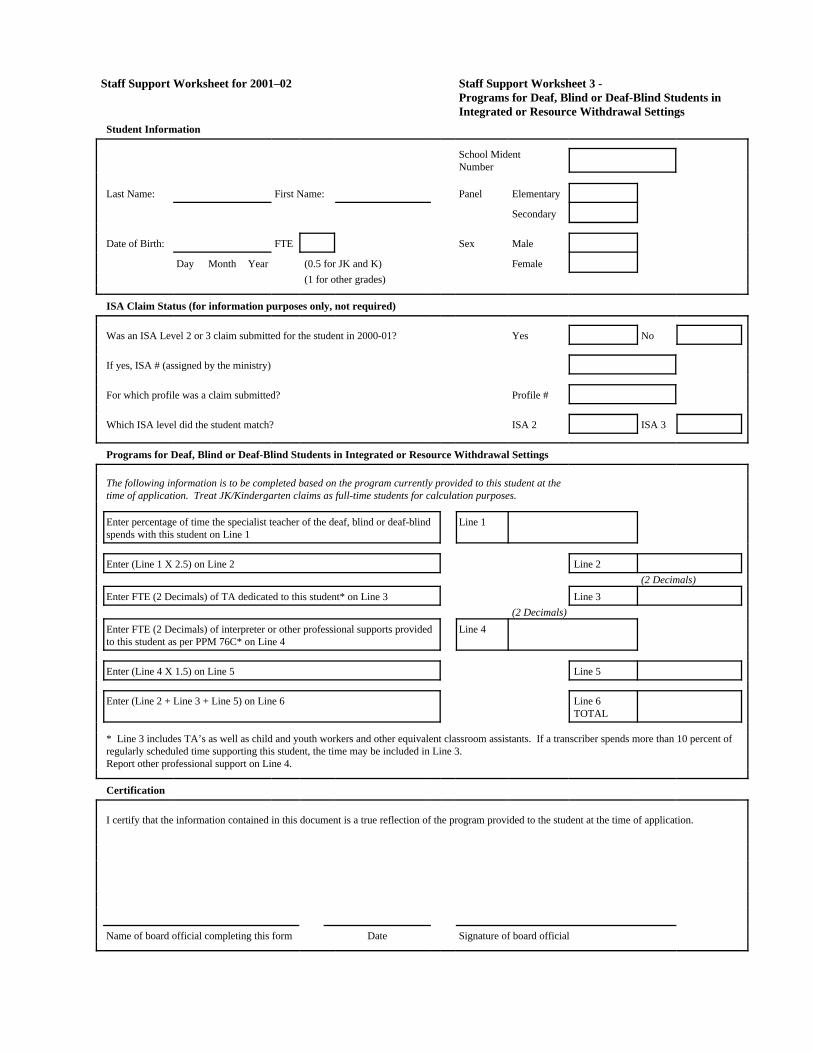
Staff Support Worksheet for 2001–02 Staff Support Worksheet 3 - Programs for Deaf, Blind or Deaf-Blind Students inIntegrated or Resource Withdrawal Settings
Student Information
School MidentNumber
Last Name: First Name: Panel Elementary
Secondary
Date of Birth: FTE Sex Male
Day Month Year (0.5 for JK and K) Female(1 for other grades)
ISA Claim Status (for information purposes only, not required)
Was an ISA Level 2 or 3 claim submitted for the student in 2000-01? Yes No
If yes, ISA # (assigned by the ministry)
For which profile was a claim submitted? Profile #
Which ISA level did the student match? ISA 2 ISA 3
Programs for Deaf, Blind or Deaf-Blind Students in Integrated or Resource Withdrawal Settings
The following information is to be completed based on the program currently provided to this student at thetime of application. Treat JK/Kindergarten claims as full-time students for calculation purposes.
Enter percentage of time the specialist teacher of the deaf, blind or deaf-blindspends with this student on Line 1
Line 1
Enter (Line 1 X 2.5) on Line 2 Line 2(2 Decimals)
Enter FTE (2 Decimals) of TA dedicated to this student* on Line 3 Line 3(2 Decimals)
Enter FTE (2 Decimals) of interpreter or other professional supports providedto this student as per PPM 76C* on Line 4
Line 4
Enter (Line 4 X 1.5) on Line 5 Line 5
Enter (Line 2 + Line 3 + Line 5) on Line 6 Line 6TOTAL
* Line 3 includes TA’s as well as child and youth workers and other equivalent classroom assistants. If a transcriber spends more than 10 percent ofregularly scheduled time supporting this student, the time may be included in Line 3.Report other professional support on Line 4.
Certification
I certify that the information contained in this document is a true reflection of the program provided to the student at the time of application.
Name of board official completing this form Date Signature of board official
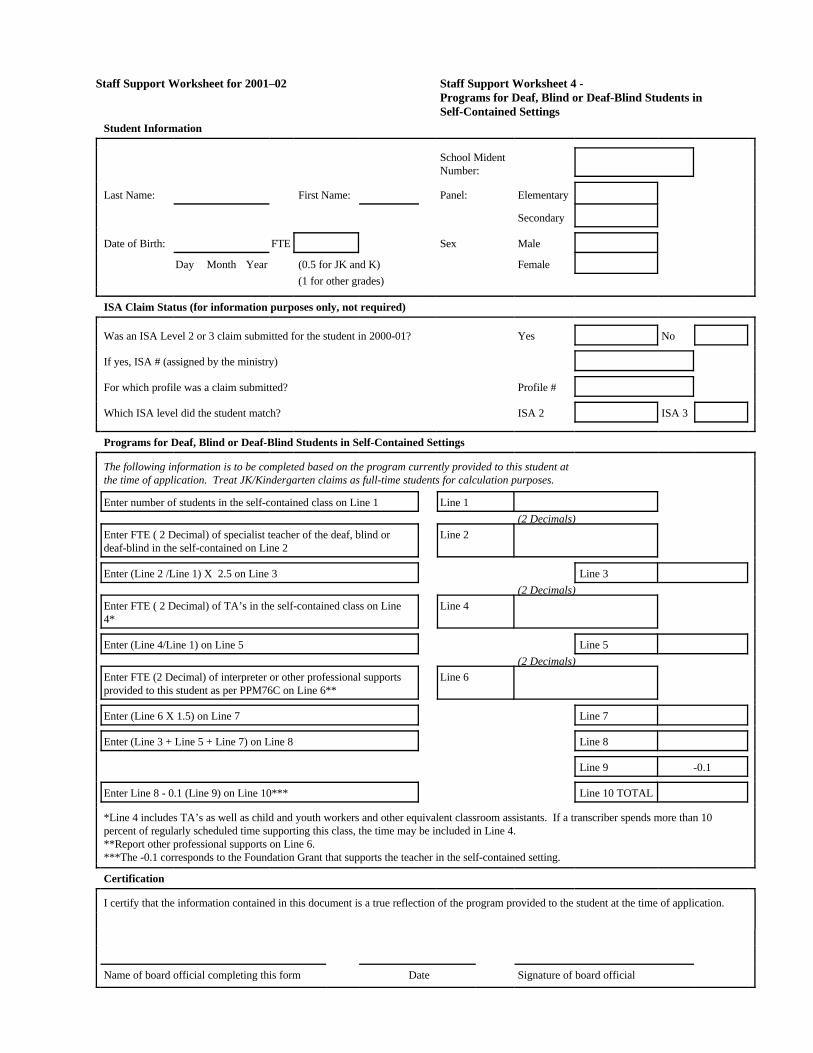
Staff Support Worksheet for 2001–02 Staff Support Worksheet 4 - Programs for Deaf, Blind or Deaf-Blind Students inSelf-Contained Settings
Student Information
School MidentNumber:
Last Name: First Name: Panel: Elementary
Secondary
Date of Birth: FTE Sex Male
Day Month Year (0.5 for JK and K) Female(1 for other grades)
ISA Claim Status (for information purposes only, not required)
Was an ISA Level 2 or 3 claim submitted for the student in 2000-01? Yes No
If yes, ISA # (assigned by the ministry)
For which profile was a claim submitted? Profile #
Which ISA level did the student match? ISA 2 ISA 3
Programs for Deaf, Blind or Deaf-Blind Students in Self-Contained Settings
The following information is to be completed based on the program currently provided to this student atthe time of application. Treat JK/Kindergarten claims as full-time students for calculation purposes.
Enter number of students in the self-contained class on Line 1 Line 1(2 Decimals)
Enter FTE ( 2 Decimal) of specialist teacher of the deaf, blind ordeaf-blind in the self-contained on Line 2
Line 2
Enter (Line 2 /Line 1) X 2.5 on Line 3 Line 3(2 Decimals)
Enter FTE ( 2 Decimal) of TA’s in the self-contained class on Line4*
Line 4
Enter (Line 4/Line 1) on Line 5 Line 5(2 Decimals)
Enter FTE (2 Decimal) of interpreter or other professional supportsprovided to this student as per PPM76C on Line 6**
Line 6
Enter (Line 6 X 1.5) on Line 7 Line 7
Enter (Line 3 + Line 5 + Line 7) on Line 8 Line 8
Line 9 -0.1
Enter Line 8 - 0.1 (Line 9) on Line 10*** Line 10 TOTAL
*Line 4 includes TA’s as well as child and youth workers and other equivalent classroom assistants. If a transcriber spends more than 10percent of regularly scheduled time supporting this class, the time may be included in Line 4.**Report other professional supports on Line 6.***The -0.1 corresponds to the Foundation Grant that supports the teacher in the self-contained setting.
Certification
I certify that the information contained in this document is a true reflection of the program provided to the student at the time of application.
Name of board official completing this form Date Signature of board official
Intensive Amount Support (ISA) Guidelines for School Boards 31
Appendix B: ISA Status FormSpecial Education Intensive Support AmountThe purpose of this form is to assist boards when students transfer from one board to another.
Student Information
Student Name: ISA Number: (Assigned by ministry)
School:
Identification: 9 Yes 9 Dual 9 No
Exceptionality:
Board Information
Board: Board Number:
Address:
Board Contact Person: Phone: E-mail:
ISA InformationSpecialized Equipment (ISA eligible):
List of ISA Level 1Equipment Cost Serial No.
Date Purchased byBoard *if shared
ISA Level 2, 3, 4 Status (indicate list of support personnel by level by FTE applicable):ISA Level2 (FTE)
ISA Level3 (FTE)
ISA Level4 Delivery Plan Description (as per IEP)
Date of InitialApplication
Signature of Principal:
9 Original/Date: 9 Transfer Date:
Original: OSR

Intensive Amount Support (ISA) Guidelines for School Boards 33
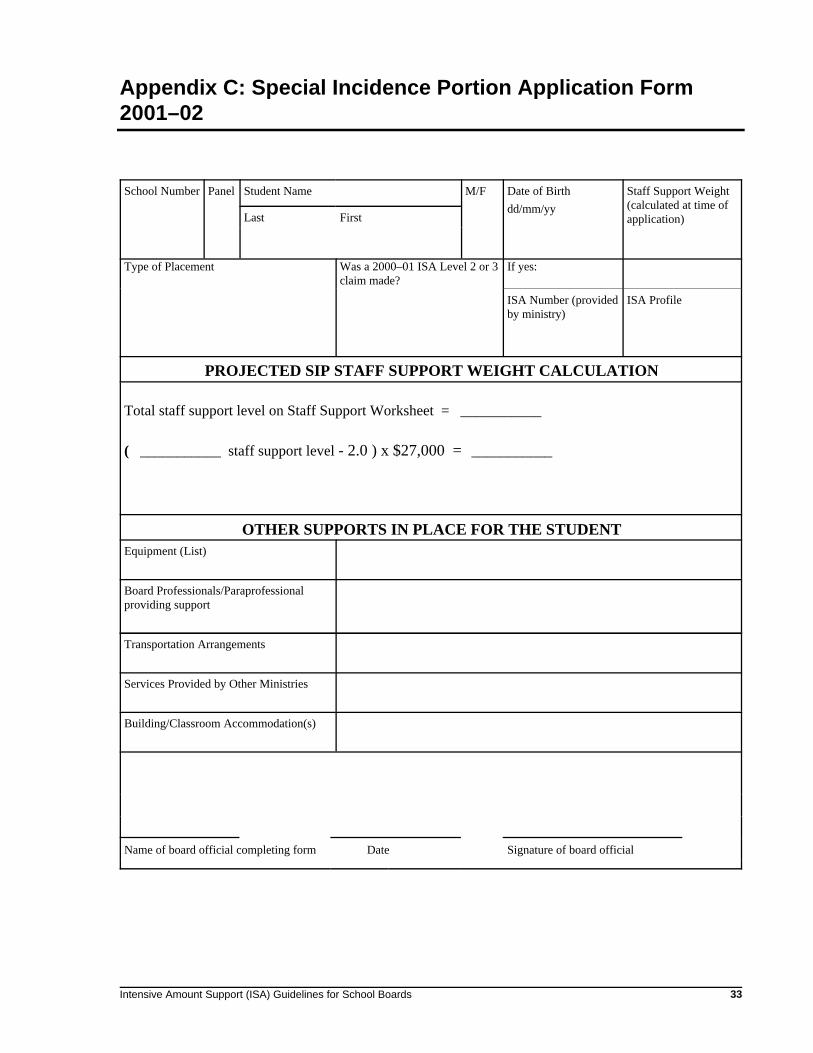
Appendix C: Special Incidence Portion Application Form2001–02
School Number Panel Student Name M/F Date of Birthdd/mm/yy
Staff Support Weight(calculated at time ofapplication)Last First
Type of Placement Was a 2000–01 ISA Level 2 or 3claim made?
If yes:
ISA Number (providedby ministry)
ISA Profile
PROJECTED SIP STAFF SUPPORT WEIGHT CALCULATION
Total staff support level on Staff Support Worksheet = ___________
( ___________ staff support level - 2.0 ) x $27,000 = ___________
OTHER SUPPORTS IN PLACE FOR THE STUDENTEquipment (List)
Board Professionals/Paraprofessionalproviding support
Transportation Arrangements
Services Provided by Other Ministries
Building/Classroom Accommodation(s)
Name of board official completing form Date Signature of board official

Intensive Amount Support (ISA) Guidelines for School Boards 35
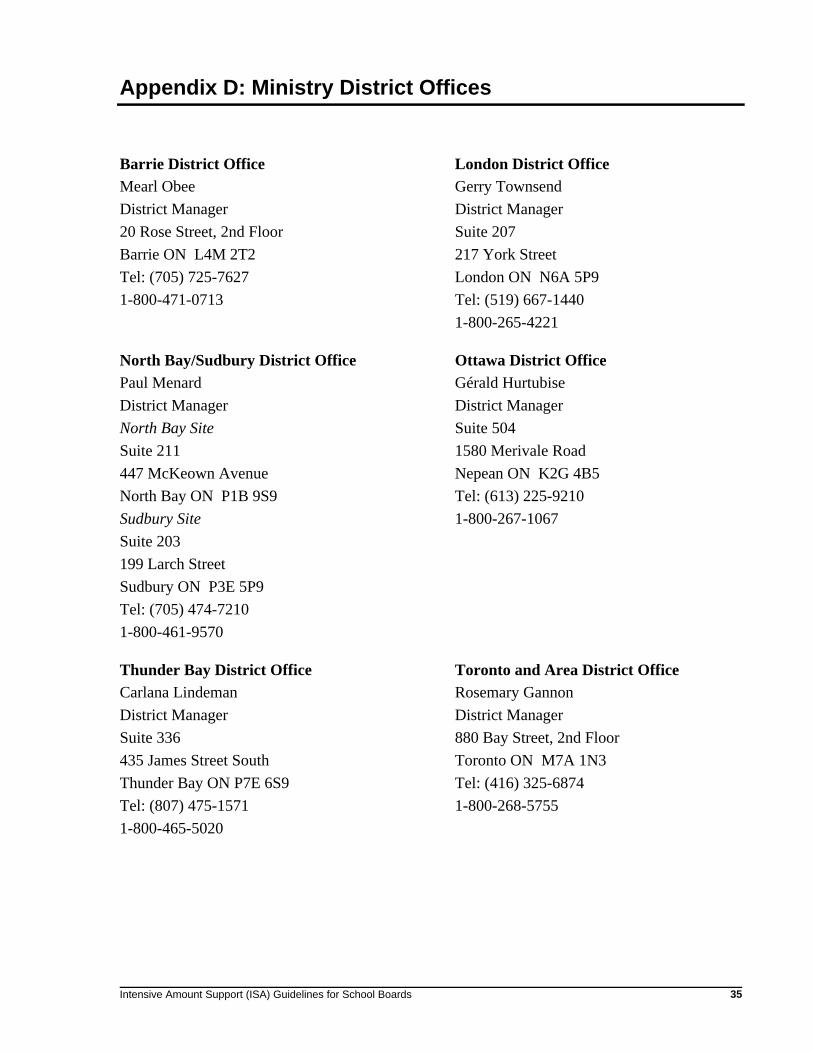
Appendix D: Ministry District Offices
Barrie District OfficeMearl ObeeDistrict Manager 20 Rose Street, 2nd FloorBarrie ON L4M 2T2Tel: (705) 725-76271-800-471-0713
London District OfficeGerry TownsendDistrict ManagerSuite 207217 York StreetLondon ON N6A 5P9Tel: (519) 667-1440 1-800-265-4221
North Bay/Sudbury District OfficePaul MenardDistrict ManagerNorth Bay SiteSuite 211447 McKeown AvenueNorth Bay ON P1B 9S9Sudbury SiteSuite 203 199 Larch StreetSudbury ON P3E 5P9Tel: (705) 474-72101-800-461-9570
Ottawa District OfficeGérald HurtubiseDistrict ManagerSuite 5041580 Merivale RoadNepean ON K2G 4B5Tel: (613) 225-9210 1-800-267-1067
Thunder Bay District OfficeCarlana LindemanDistrict ManagerSuite 336435 James Street SouthThunder Bay ON P7E 6S9Tel: (807) 475-15711-800-465-5020
Toronto and Area District OfficeRosemary GannonDistrict Manager880 Bay Street, 2nd FloorToronto ON M7A 1N3Tel: (416) 325-68741-800-268-5755

Intensive Amount Support (ISA) Guidelines for School Boards 37
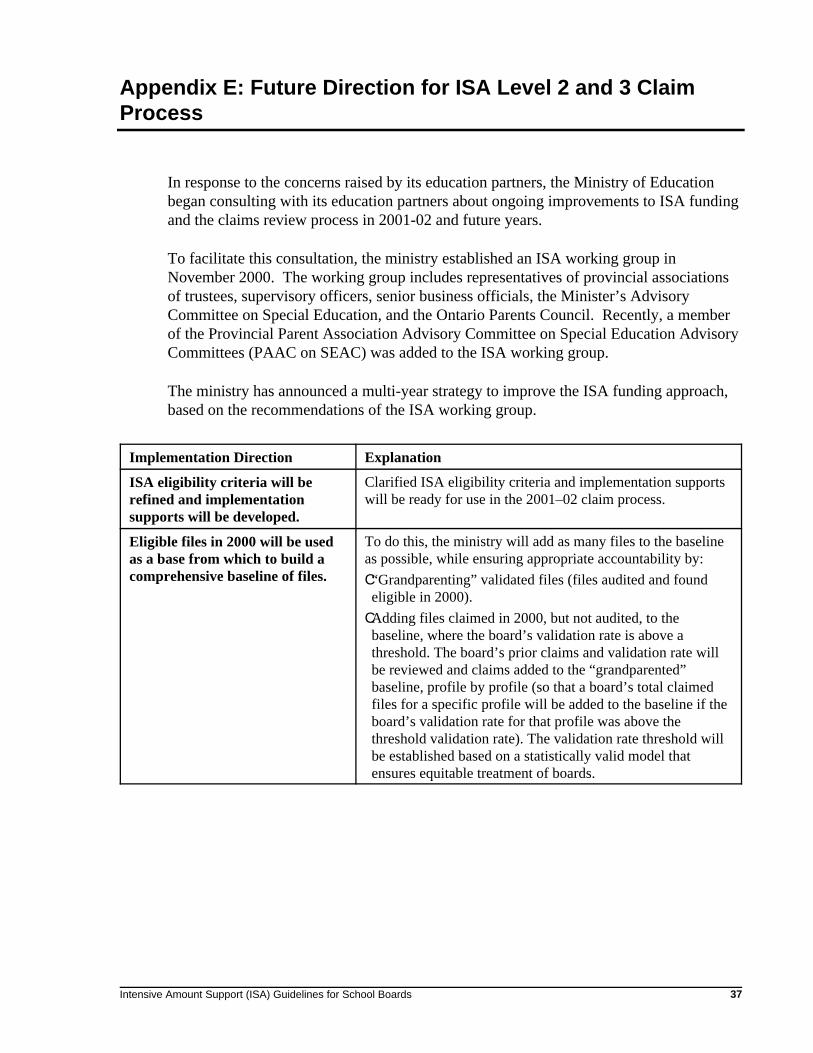
Appendix E: Future Direction for ISA Level 2 and 3 ClaimProcess
In response to the concerns raised by its education partners, the Ministry of Educationbegan consulting with its education partners about ongoing improvements to ISA fundingand the claims review process in 2001-02 and future years.
To facilitate this consultation, the ministry established an ISA working group inNovember 2000. The working group includes representatives of provincial associationsof trustees, supervisory officers, senior business officials, the Minister’s AdvisoryCommittee on Special Education, and the Ontario Parents Council. Recently, a memberof the Provincial Parent Association Advisory Committee on Special Education AdvisoryCommittees (PAAC on SEAC) was added to the ISA working group.
The ministry has announced a multi-year strategy to improve the ISA funding approach,based on the recommendations of the ISA working group.
Implementation Direction Explanation
ISA eligibility criteria will berefined and implementationsupports will be developed.
Clarified ISA eligibility criteria and implementation supportswill be ready for use in the 2001–02 claim process.
Eligible files in 2000 will be usedas a base from which to build acomprehensive baseline of files.
To do this, the ministry will add as many files to the baselineas possible, while ensuring appropriate accountability by:C“Grandparenting” validated files (files audited and foundeligible in 2000).CAdding files claimed in 2000, but not audited, to thebaseline, where the board’s validation rate is above athreshold. The board’s prior claims and validation rate willbe reviewed and claims added to the “grandparented”baseline, profile by profile (so that a board’s total claimedfiles for a specific profile will be added to the baseline if theboard’s validation rate for that profile was above thethreshold validation rate). The validation rate threshold willbe established based on a statistically valid model thatensures equitable treatment of boards.
Implementation Direction Explanation
Intensive Amount Support (ISA) Guidelines for School Boards38
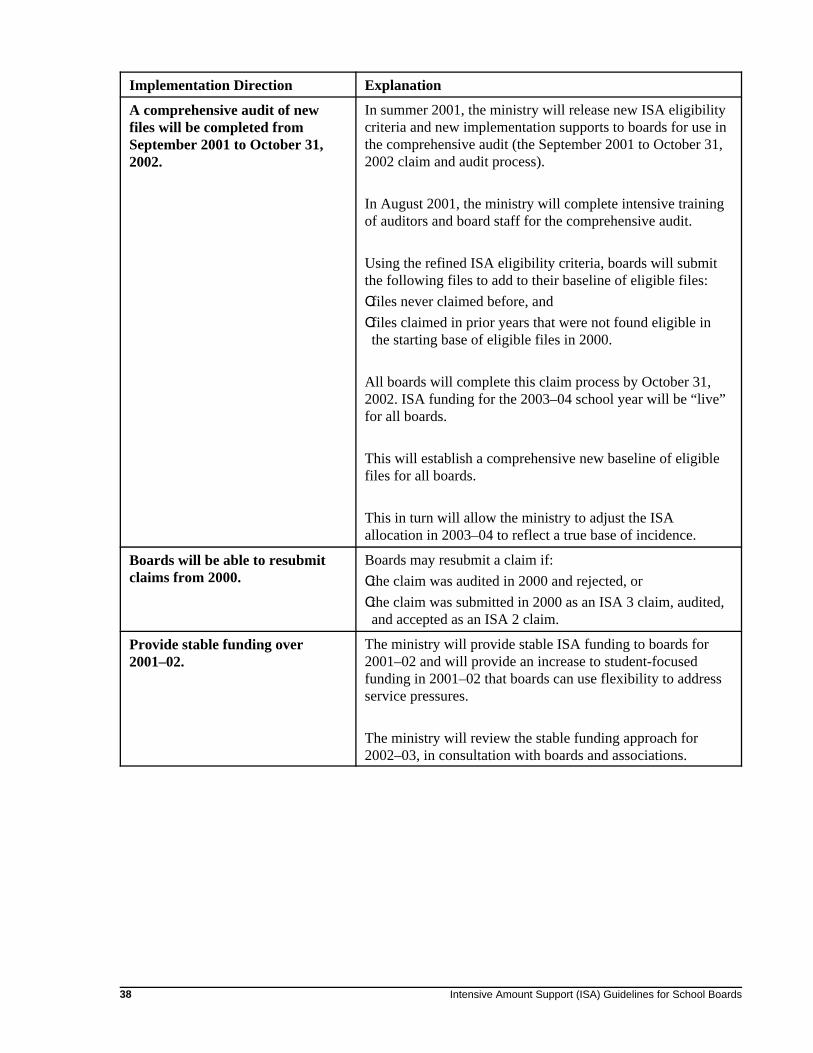
A comprehensive audit of newfiles will be completed fromSeptember 2001 to October 31,2002.
In summer 2001, the ministry will release new ISA eligibilitycriteria and new implementation supports to boards for use inthe comprehensive audit (the September 2001 to October 31,2002 claim and audit process).
In August 2001, the ministry will complete intensive trainingof auditors and board staff for the comprehensive audit.
Using the refined ISA eligibility criteria, boards will submitthe following files to add to their baseline of eligible files:Cfiles never claimed before, and Cfiles claimed in prior years that were not found eligible inthe starting base of eligible files in 2000.
All boards will complete this claim process by October 31,2002. ISA funding for the 2003–04 school year will be “live”for all boards.
This will establish a comprehensive new baseline of eligiblefiles for all boards.
This in turn will allow the ministry to adjust the ISAallocation in 2003–04 to reflect a true base of incidence.
Boards will be able to resubmitclaims from 2000.
Boards may resubmit a claim if:Cthe claim was audited in 2000 and rejected, or Cthe claim was submitted in 2000 as an ISA 3 claim, audited,and accepted as an ISA 2 claim.
Provide stable funding over2001–02.
The ministry will provide stable ISA funding to boards for2001–02 and will provide an increase to student-focusedfunding in 2001–02 that boards can use flexibility to addressservice pressures.
The ministry will review the stable funding approach for2002–03, in consultation with boards and associations.
Implementation Direction Explanation
Intensive Amount Support (ISA) Guidelines for School Boards 39
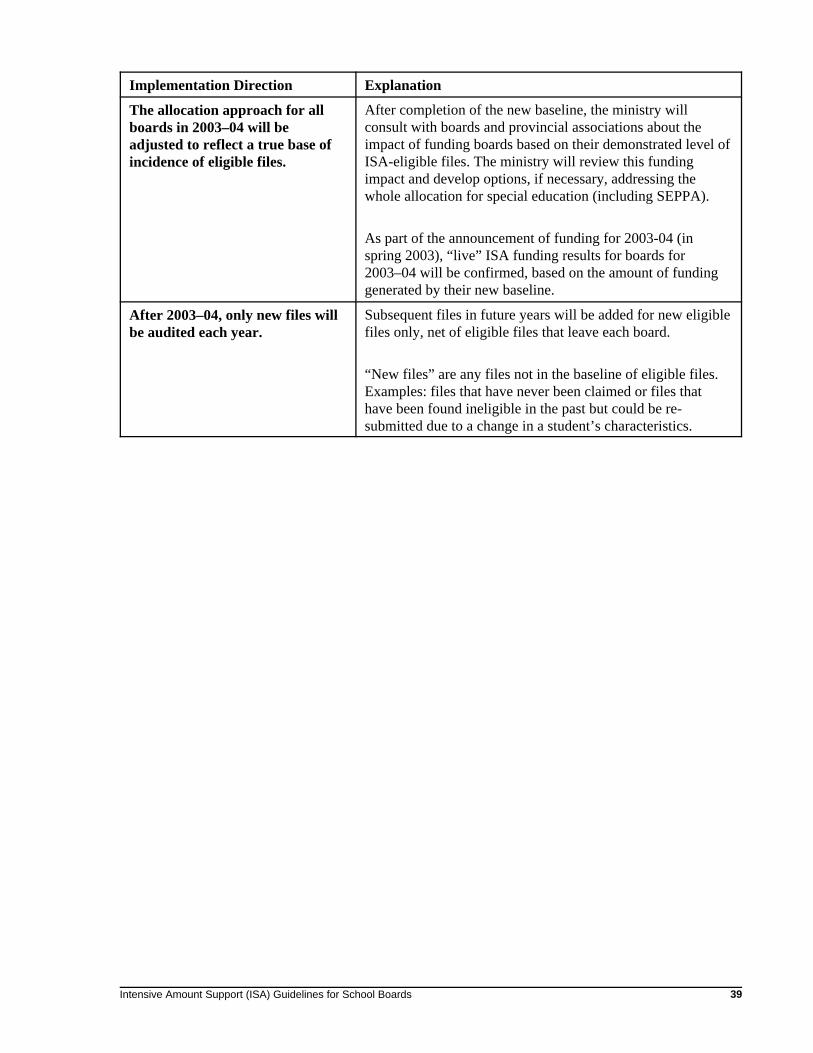
The allocation approach for allboards in 2003–04 will beadjusted to reflect a true base ofincidence of eligible files.
After completion of the new baseline, the ministry willconsult with boards and provincial associations about theimpact of funding boards based on their demonstrated level ofISA-eligible files. The ministry will review this fundingimpact and develop options, if necessary, addressing thewhole allocation for special education (including SEPPA).
As part of the announcement of funding for 2003-04 (inspring 2003), “live” ISA funding results for boards for2003–04 will be confirmed, based on the amount of fundinggenerated by their new baseline.
After 2003–04, only new files willbe audited each year.
Subsequent files in future years will be added for new eligiblefiles only, net of eligible files that leave each board.
“New files” are any files not in the baseline of eligible files.Examples: files that have never been claimed or files thathave been found ineligible in the past but could be re-submitted due to a change in a student’s characteristics.

Intensive Amount Support (ISA) Guidelines for School Boards 41
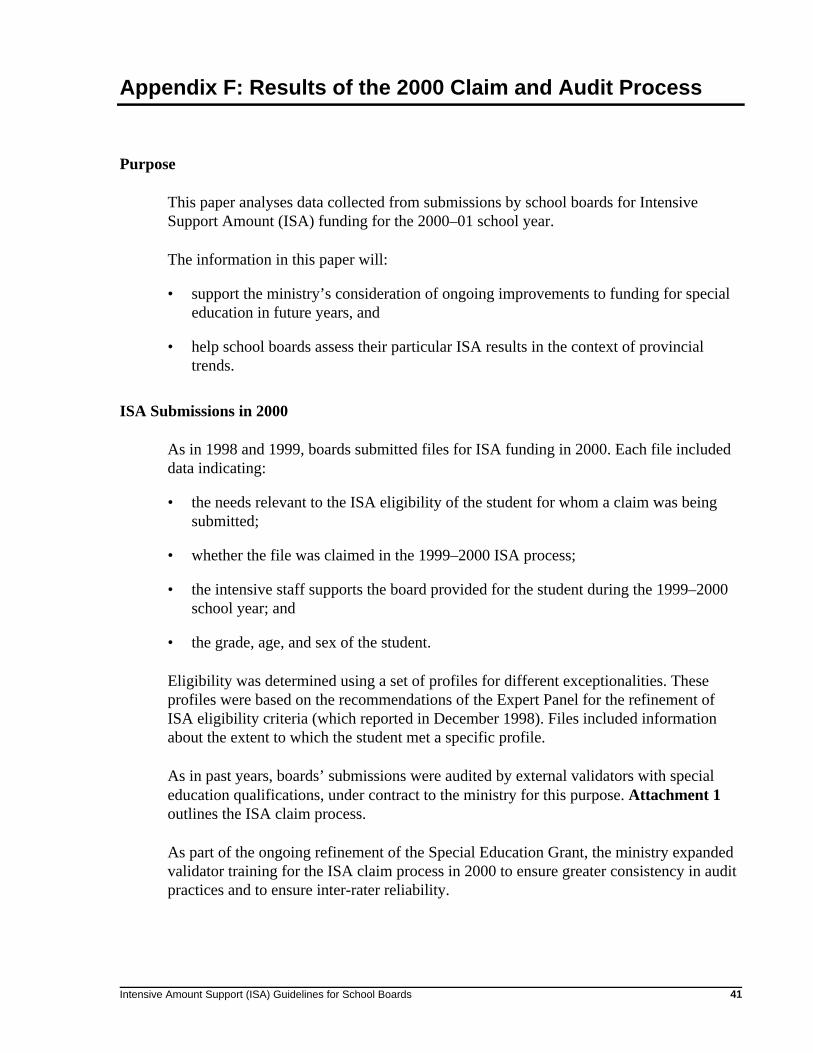
Appendix F: Results of the 2000 Claim and Audit Process
Purpose
This paper analyses data collected from submissions by school boards for IntensiveSupport Amount (ISA) funding for the 2000–01 school year.
The information in this paper will:
• support the ministry’s consideration of ongoing improvements to funding for specialeducation in future years, and
• help school boards assess their particular ISA results in the context of provincialtrends.
ISA Submissions in 2000
As in 1998 and 1999, boards submitted files for ISA funding in 2000. Each file includeddata indicating:
• the needs relevant to the ISA eligibility of the student for whom a claim was beingsubmitted;
• whether the file was claimed in the 1999–2000 ISA process;
• the intensive staff supports the board provided for the student during the 1999–2000school year; and
• the grade, age, and sex of the student.
Eligibility was determined using a set of profiles for different exceptionalities. Theseprofiles were based on the recommendations of the Expert Panel for the refinement ofISA eligibility criteria (which reported in December 1998). Files included informationabout the extent to which the student met a specific profile.
As in past years, boards’ submissions were audited by external validators with specialeducation qualifications, under contract to the ministry for this purpose. Attachment 1outlines the ISA claim process.
As part of the ongoing refinement of the Special Education Grant, the ministry expandedvalidator training for the ISA claim process in 2000 to ensure greater consistency in auditpractices and to ensure inter-rater reliability.
Intensive Amount Support (ISA) Guidelines for School Boards42
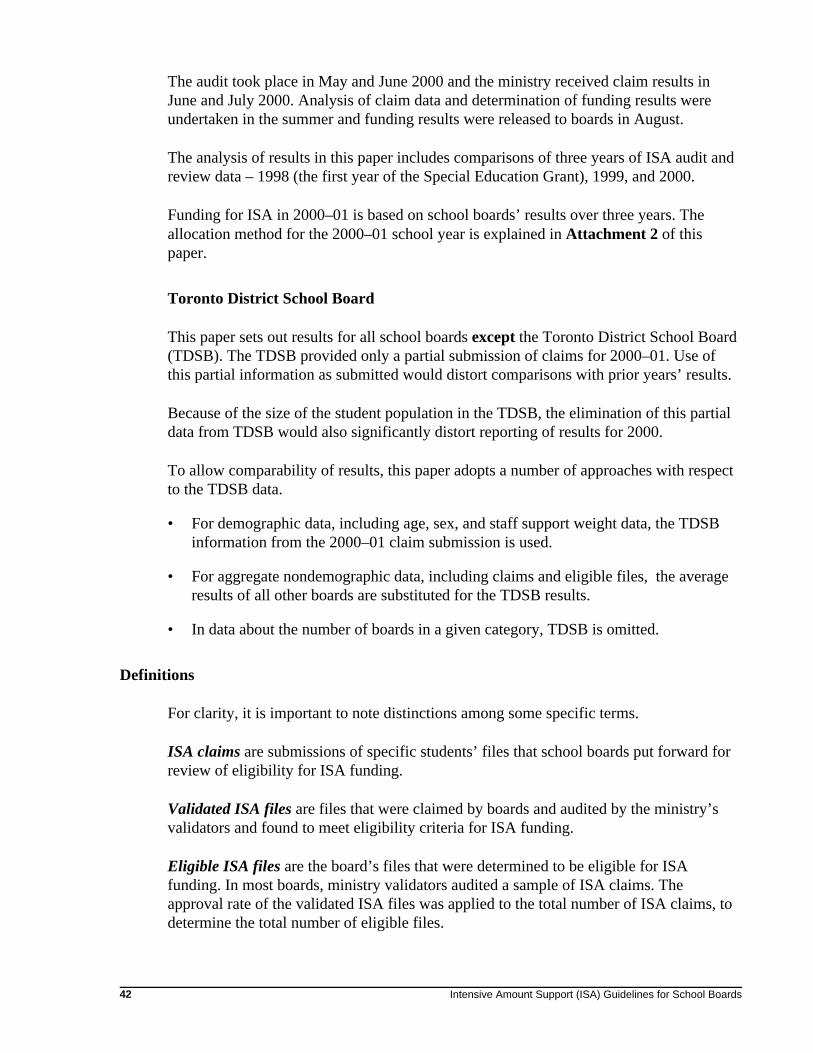
The audit took place in May and June 2000 and the ministry received claim results inJune and July 2000. Analysis of claim data and determination of funding results wereundertaken in the summer and funding results were released to boards in August.
The analysis of results in this paper includes comparisons of three years of ISA audit andreview data – 1998 (the first year of the Special Education Grant), 1999, and 2000.
Funding for ISA in 2000–01 is based on school boards’ results over three years. Theallocation method for the 2000–01 school year is explained in Attachment 2 of thispaper.
Toronto District School Board
This paper sets out results for all school boards except the Toronto District School Board(TDSB). The TDSB provided only a partial submission of claims for 2000–01. Use ofthis partial information as submitted would distort comparisons with prior years’ results.
Because of the size of the student population in the TDSB, the elimination of this partialdata from TDSB would also significantly distort reporting of results for 2000.
To allow comparability of results, this paper adopts a number of approaches with respectto the TDSB data.
• For demographic data, including age, sex, and staff support weight data, the TDSBinformation from the 2000–01 claim submission is used.
• For aggregate nondemographic data, including claims and eligible files, the averageresults of all other boards are substituted for the TDSB results.
• In data about the number of boards in a given category, TDSB is omitted.
Definitions
For clarity, it is important to note distinctions among some specific terms.
ISA claims are submissions of specific students’ files that school boards put forward forreview of eligibility for ISA funding.
Validated ISA files are files that were claimed by boards and audited by the ministry’svalidators and found to meet eligibility criteria for ISA funding.
Eligible ISA files are the board’s files that were determined to be eligible for ISAfunding. In most boards, ministry validators audited a sample of ISA claims. Theapproval rate of the validated ISA files was applied to the total number of ISA claims, todetermine the total number of eligible files.
Intensive Amount Support (ISA) Guidelines for School Boards 43
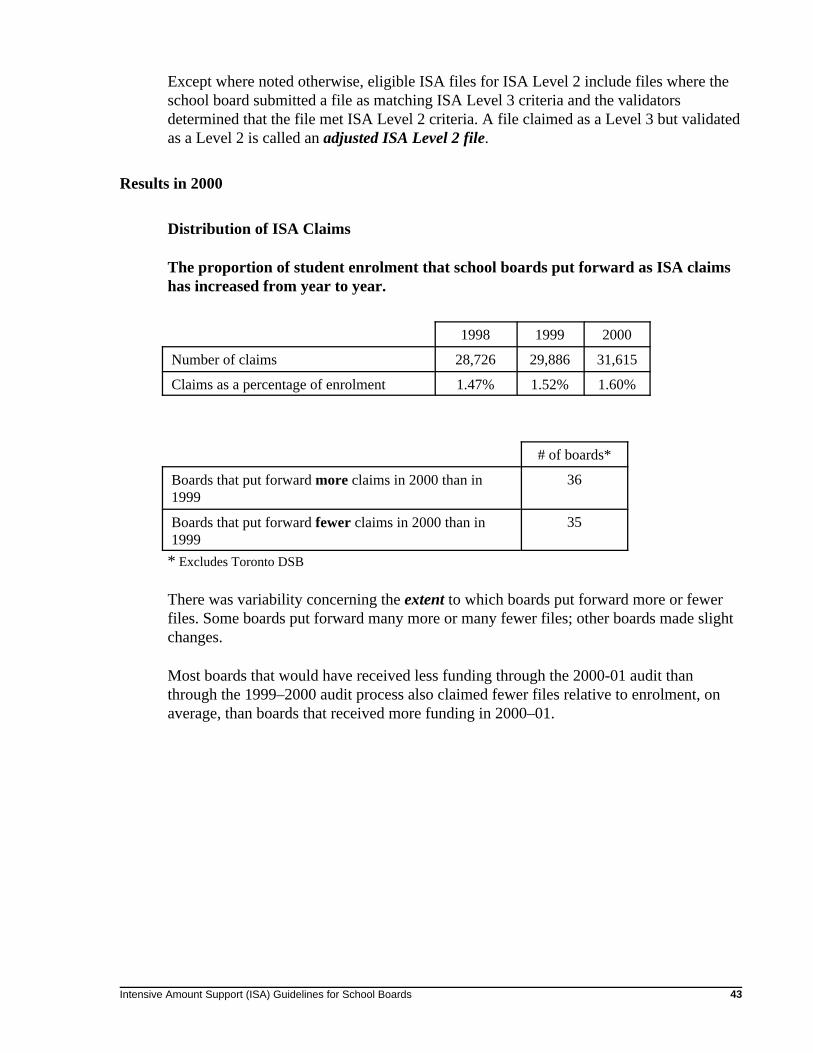
Except where noted otherwise, eligible ISA files for ISA Level 2 include files where theschool board submitted a file as matching ISA Level 3 criteria and the validatorsdetermined that the file met ISA Level 2 criteria. A file claimed as a Level 3 but validatedas a Level 2 is called an adjusted ISA Level 2 file.
Results in 2000
Distribution of ISA Claims
The proportion of student enrolment that school boards put forward as ISA claimshas increased from year to year.
1998 1999 2000
Number of claims 28,726 29,886 31,615
Claims as a percentage of enrolment 1.47% 1.52% 1.60%
# of boards*
Boards that put forward more claims in 2000 than in1999
36
Boards that put forward fewer claims in 2000 than in1999
35
* Excludes Toronto DSB
There was variability concerning the extent to which boards put forward more or fewerfiles. Some boards put forward many more or many fewer files; other boards made slightchanges.
Most boards that would have received less funding through the 2000-01 audit thanthrough the 1999–2000 audit process also claimed fewer files relative to enrolment, onaverage, than boards that received more funding in 2000–01.

Intensive Amount Support (ISA) Guidelines for School Boards44
The proportion of student enrolment that meets ISA eligibility criteria has beenconsistent.
1998** 1999 2000
Number of eligible claims 24,919 22,487 23,126
Eligible claims as a percentage of enrolment 1.28% 1.15% 1.17%
1998** 1999 2000
Approval Rates(number of eligible claims/number of claims)
86.5% 75.2% 73.1%
** 1998 eligible files include conditional approvals
Strict comparisons between 1998 and the other years is not possible because the 1998approval rates included conditional approvals. In 1998, because the ISA process was new,validators gave conditional approval to incomplete files where available documentationsupported eligibility. Conditional approvals were not granted in 1999 or 2000.
Thirty-eight boards had lower approval rates year over year (a lower rate in 1999 than in1998, and a lower rate in 2000 than in 1999).
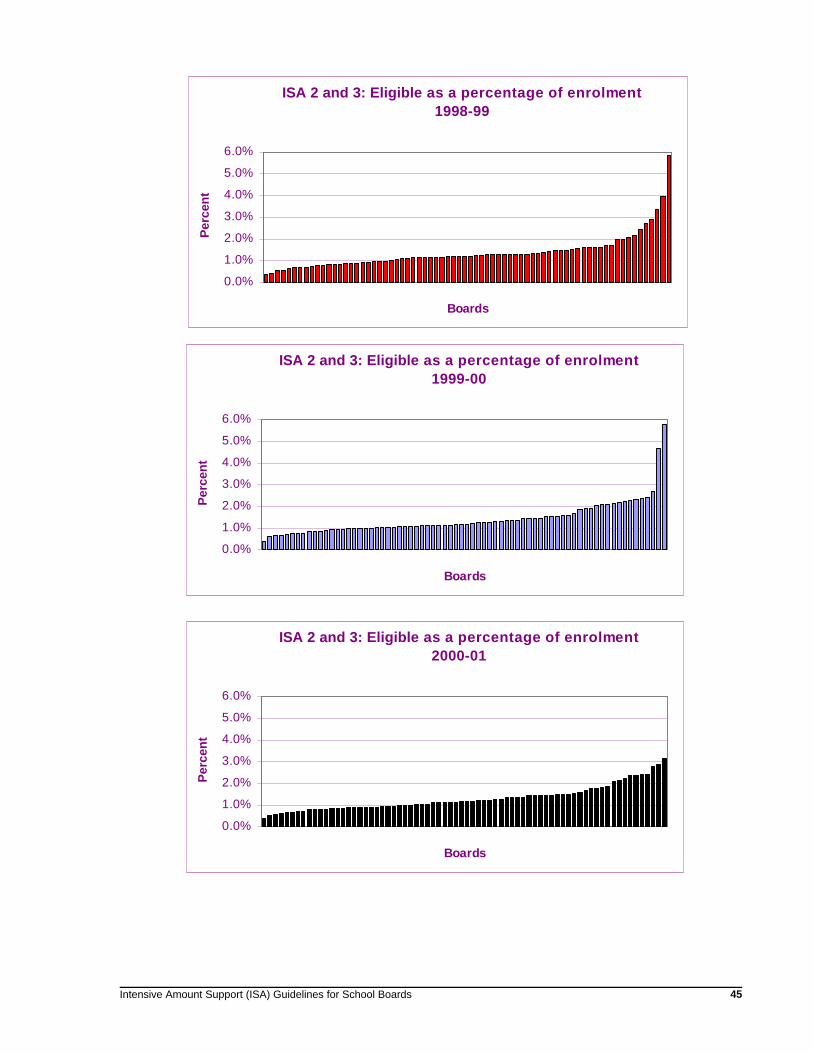
There continues to be a significant variance in the proportion of ISA eligible files indifferent boards.
ISA 2 1998 1999 2000
Highest proportion of eligible files, as apercentage of board's enrolment
5.11% 3.69% 1.94%
Lowest proportion of eligible files, as apercentage of board's enrolment
0.12% 0.18% 0.18%
ISA 3 1998 1999 2000
Highest proportion of eligible files, as apercentage of board's enrolment
2.65% 2.11% 1.54%
Lowest proportion of eligible files, as apercentage of board's enrolment
0.18% 0.19% 0.17%
Intensive Amount Support (ISA) Guidelines for School Boards 45
ISA 2 and 3: Eligible as a percentage of enrolment1998-99
0.0%
1.0%
2.0%
3.0%
4.0%
5.0%
6.0%
Boards
Per
cen
t
ISA 2 and 3: Eligible as a percentage of enrolment1999-00
0.0%
1.0%
2.0%
3.0%
4.0%
5.0%
6.0%
Boards
Per
cen
t
ISA 2 and 3: Eligible as a percentage of enrolment2000-01
0.0%
1.0%
2.0%
3.0%
4.0%
5.0%
6.0%
Boards
Per
cen
t
Intensive Amount Support (ISA) Guidelines for School Boards46
As in each of the two previous cycles of ISA claims and audit, the results in 2000continue to show that boards have different incidences of files that meet ISA eligibilitycriteria. Since ISA funding is designed to meet the cost of providing supports to studentswith very high needs, this means that boards have varying costs for special educationprograms that are not strictly proportional to total enrolment.
In 2000, the range of variability narrowed significantly. This “flatter” distribution isbecause a few boards with extremely high proportions of eligible students showed lowerresults. Once again, this result is likely due to greater consistency in the auditing of files.
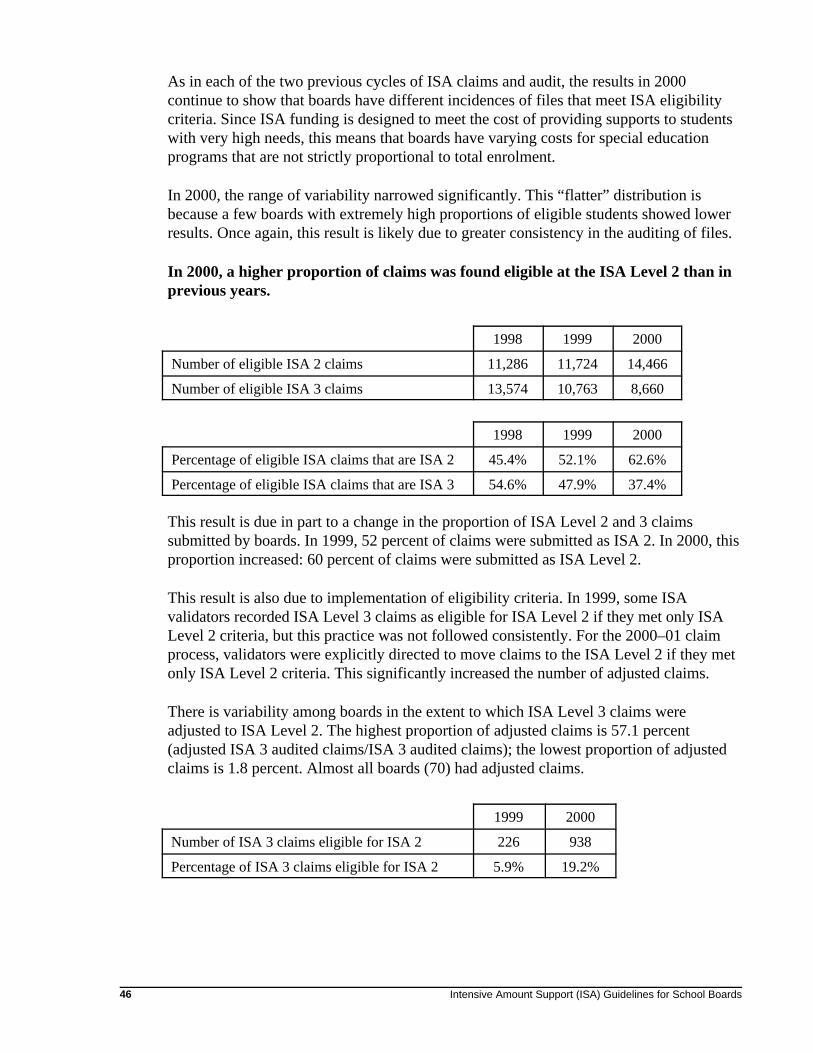
In 2000, a higher proportion of claims was found eligible at the ISA Level 2 than inprevious years.
1998 1999 2000
Number of eligible ISA 2 claims 11,286 11,724 14,466
Number of eligible ISA 3 claims 13,574 10,763 8,660
1998 1999 2000
Percentage of eligible ISA claims that are ISA 2 45.4% 52.1% 62.6%
Percentage of eligible ISA claims that are ISA 3 54.6% 47.9% 37.4%
This result is due in part to a change in the proportion of ISA Level 2 and 3 claimssubmitted by boards. In 1999, 52 percent of claims were submitted as ISA 2. In 2000, thisproportion increased: 60 percent of claims were submitted as ISA Level 2.
This result is also due to implementation of eligibility criteria. In 1999, some ISAvalidators recorded ISA Level 3 claims as eligible for ISA Level 2 if they met only ISALevel 2 criteria, but this practice was not followed consistently. For the 2000–01 claimprocess, validators were explicitly directed to move claims to the ISA Level 2 if they metonly ISA Level 2 criteria. This significantly increased the number of adjusted claims.
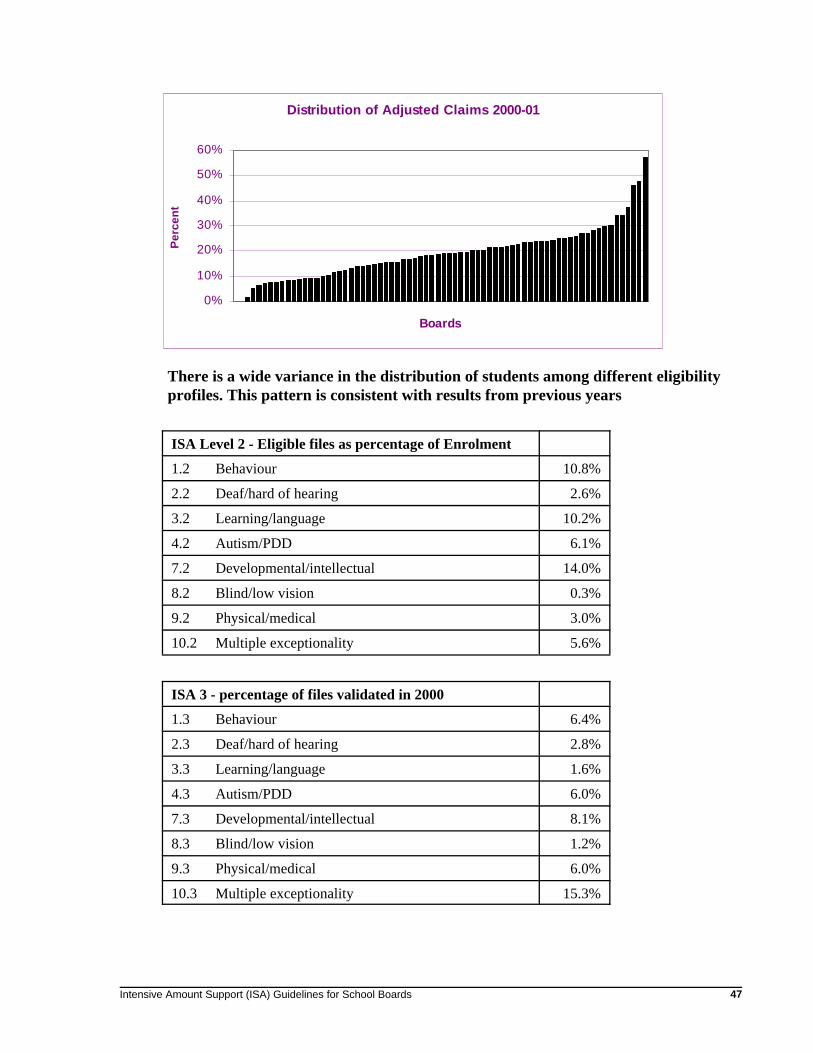
There is variability among boards in the extent to which ISA Level 3 claims wereadjusted to ISA Level 2. The highest proportion of adjusted claims is 57.1 percent(adjusted ISA 3 audited claims/ISA 3 audited claims); the lowest proportion of adjustedclaims is 1.8 percent. Almost all boards (70) had adjusted claims.
1999 2000
Number of ISA 3 claims eligible for ISA 2 226 938
Percentage of ISA 3 claims eligible for ISA 2 5.9% 19.2%
Intensive Amount Support (ISA) Guidelines for School Boards 47
Distribution of Adjusted Claims 2000-01
0%
10%
20%
30%
40%
50%
60%
Boards
Per
cen
t
There is a wide variance in the distribution of students among different eligibilityprofiles. This pattern is consistent with results from previous years
ISA Level 2 - Eligible files as percentage of Enrolment
1.2 Behaviour 10.8%
2.2 Deaf/hard of hearing 2.6%
3.2 Learning/language 10.2%
4.2 Autism/PDD 6.1%
7.2 Developmental/intellectual 14.0%
8.2 Blind/low vision 0.3%
9.2 Physical/medical 3.0%
10.2 Multiple exceptionality 5.6%
ISA 3 - percentage of files validated in 2000
1.3 Behaviour 6.4%
2.3 Deaf/hard of hearing 2.8%
3.3 Learning/language 1.6%
4.3 Autism/PDD 6.0%
7.3 Developmental/intellectual 8.1%
8.3 Blind/low vision 1.2%
9.3 Physical/medical 6.0%
10.3 Multiple exceptionality 15.3%
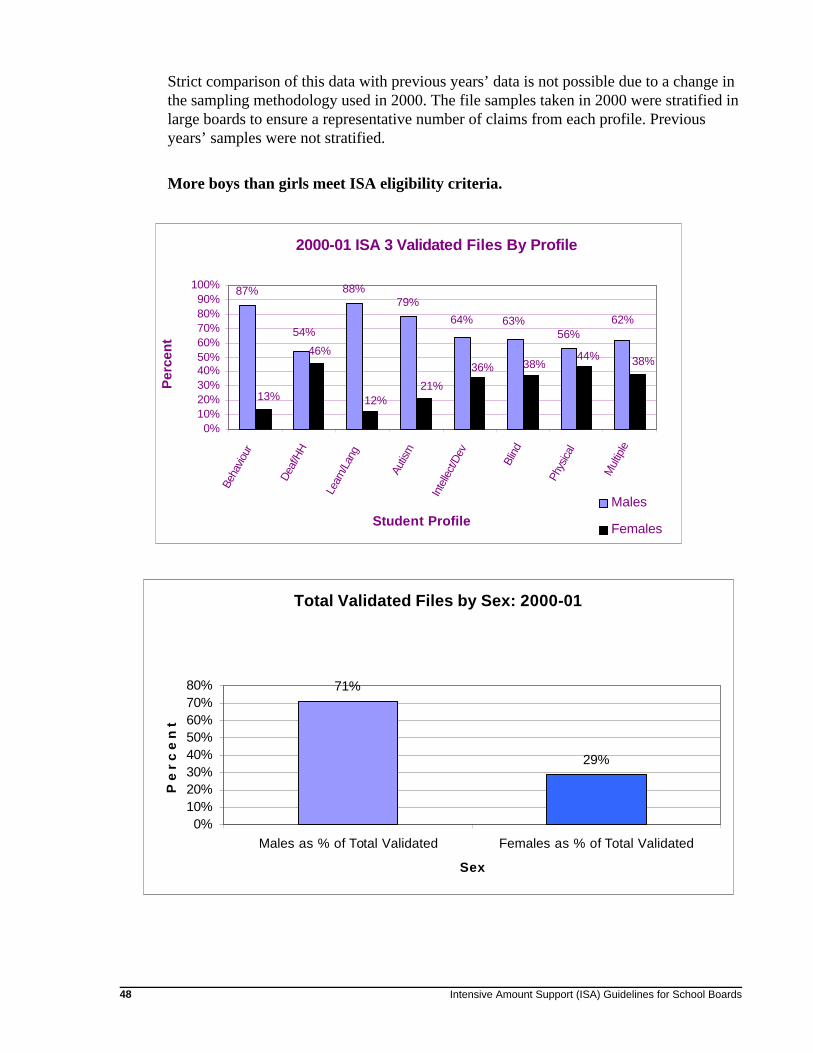
Intensive Amount Support (ISA) Guidelines for School Boards48
Total Validated Files by Sex: 2000-01
71%
29%
0%10%20%30%40%50%60%70%80%
Males as % of Total Validated Females as % of Total Validated
Sex
P e
r c
e n
t
2000-01 ISA 3 Validated Files By Profile
87% 88%79%
56%64% 63% 62%
54%
38%44%38%36%
21%12%
46%
13%
0%10%20%30%40%50%60%70%80%90%
100%
Beha
viour
Deaf
/HH
Lear
n/La
ng
Autis
m
Inte
llect
/Dev
Blin
d
Phys
ical
Mul
tiple
Student Profile
Per
cen
t
Males
Females
Strict comparison of this data with previous years’ data is not possible due to a change inthe sampling methodology used in 2000. The file samples taken in 2000 were stratified inlarge boards to ensure a representative number of claims from each profile. Previousyears’ samples were not stratified.
More boys than girls meet ISA eligibility criteria.
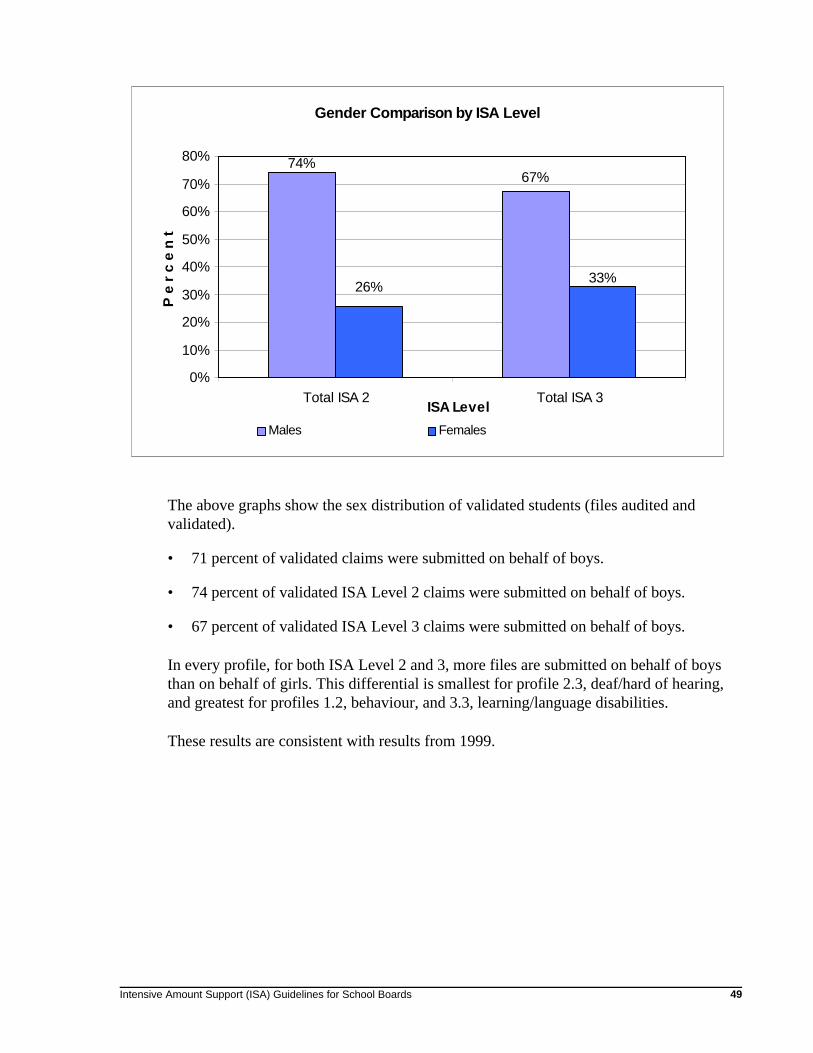
Intensive Amount Support (ISA) Guidelines for School Boards 49
Gender Comparison by ISA Level
67%74%
33%26%
0%
10%
20%
30%
40%
50%
60%
70%
80%
Total ISA 2 Total ISA 3ISA Level
P e
r c
e n
t
Males Females
The above graphs show the sex distribution of validated students (files audited andvalidated).
• 71 percent of validated claims were submitted on behalf of boys.
• 74 percent of validated ISA Level 2 claims were submitted on behalf of boys.
• 67 percent of validated ISA Level 3 claims were submitted on behalf of boys.
In every profile, for both ISA Level 2 and 3, more files are submitted on behalf of boysthan on behalf of girls. This differential is smallest for profile 2.3, deaf/hard of hearing,and greatest for profiles 1.2, behaviour, and 3.3, learning/language disabilities.
These results are consistent with results from 1999.
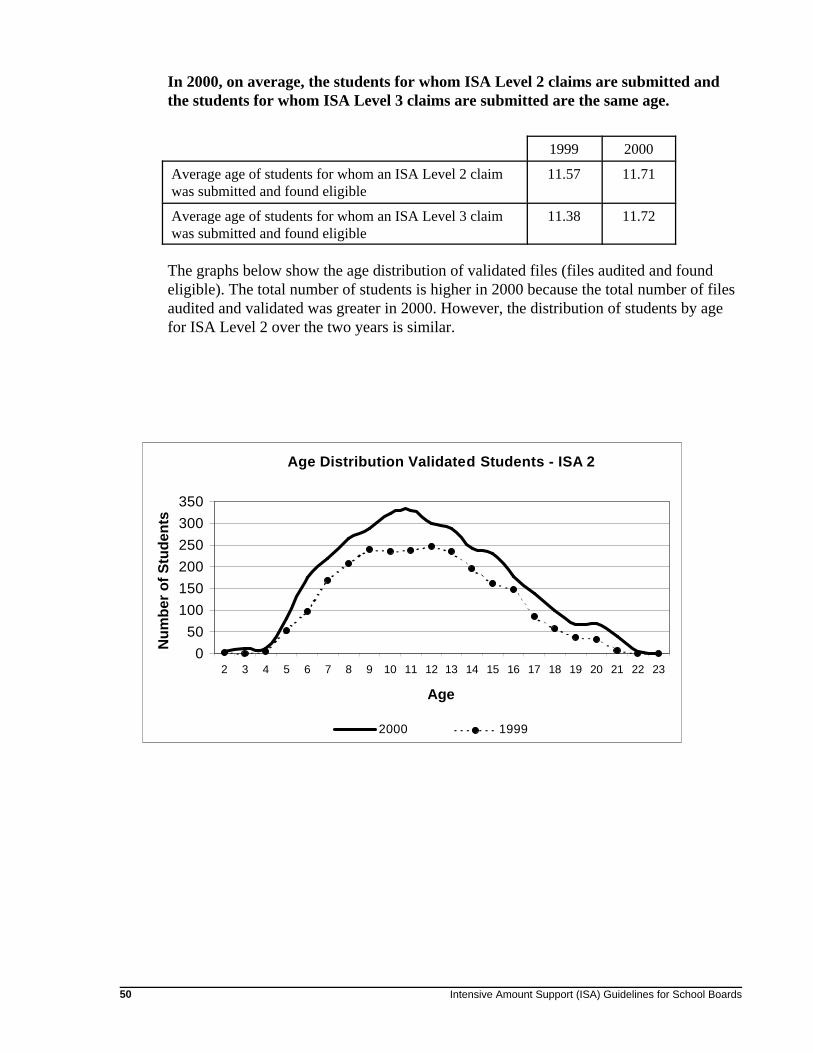
Intensive Amount Support (ISA) Guidelines for School Boards50
Age Distribution Validated Students - ISA 2
050
100150200250300350
2 3 4 5 6 7 8 9 10 11 12 13 14 15 16 17 18 19 20 21 22 23
Age
Nu
mb
er o
f S
tud
ents
2000 1999
In 2000, on average, the students for whom ISA Level 2 claims are submitted andthe students for whom ISA Level 3 claims are submitted are the same age.
1999 2000
Average age of students for whom an ISA Level 2 claimwas submitted and found eligible
11.57 11.71
Average age of students for whom an ISA Level 3 claimwas submitted and found eligible
11.38 11.72
The graphs below show the age distribution of validated files (files audited and foundeligible). The total number of students is higher in 2000 because the total number of filesaudited and validated was greater in 2000. However, the distribution of students by agefor ISA Level 2 over the two years is similar.
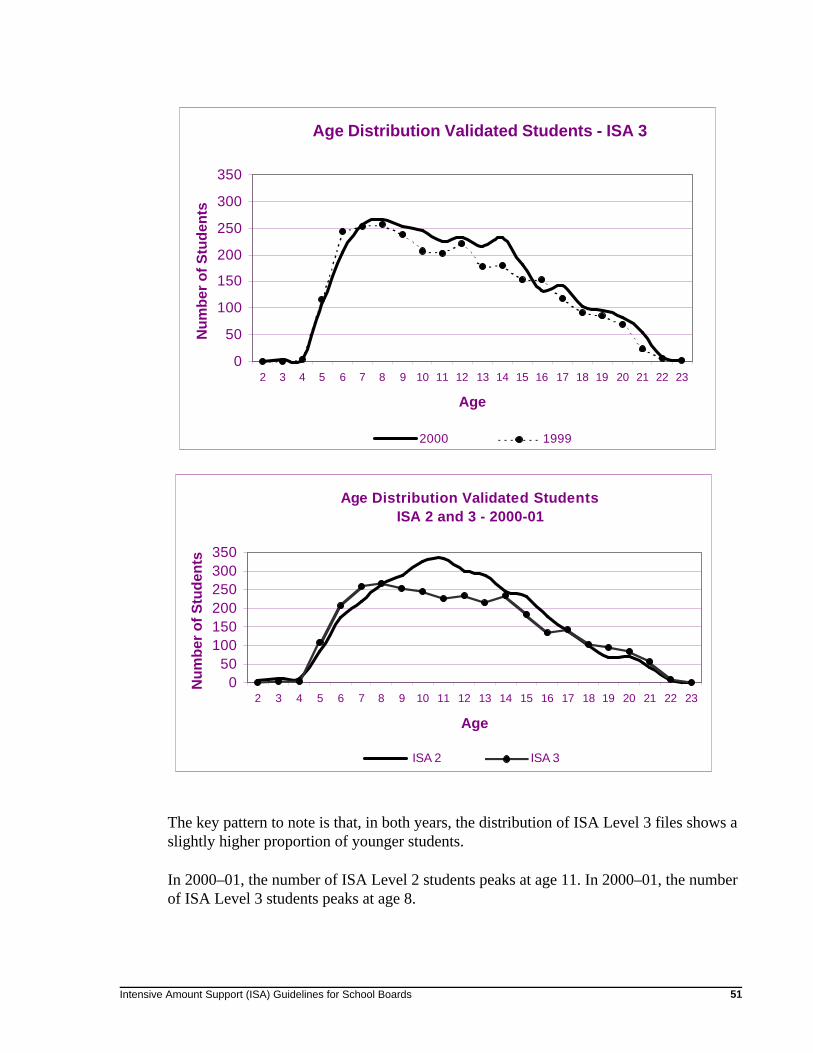
Intensive Amount Support (ISA) Guidelines for School Boards 51
Age Distribution Validated Students - ISA 3
0
50
100
150
200
250
300
350
2 3 4 5 6 7 8 9 10 11 12 13 14 15 16 17 18 19 20 21 22 23
Age
Nu
mb
er o
f S
tud
ents
2000 1999
Age Distribution Validated StudentsISA 2 and 3 - 2000-01
050
100150200250300350
2 3 4 5 6 7 8 9 10 11 12 13 14 15 16 17 18 19 20 21 22 23
Age
Nu
mb
er o
f S
tud
ents
ISA 2 ISA 3
The key pattern to note is that, in both years, the distribution of ISA Level 3 files shows aslightly higher proportion of younger students.
In 2000–01, the number of ISA Level 2 students peaks at age 11. In 2000–01, the numberof ISA Level 3 students peaks at age 8.
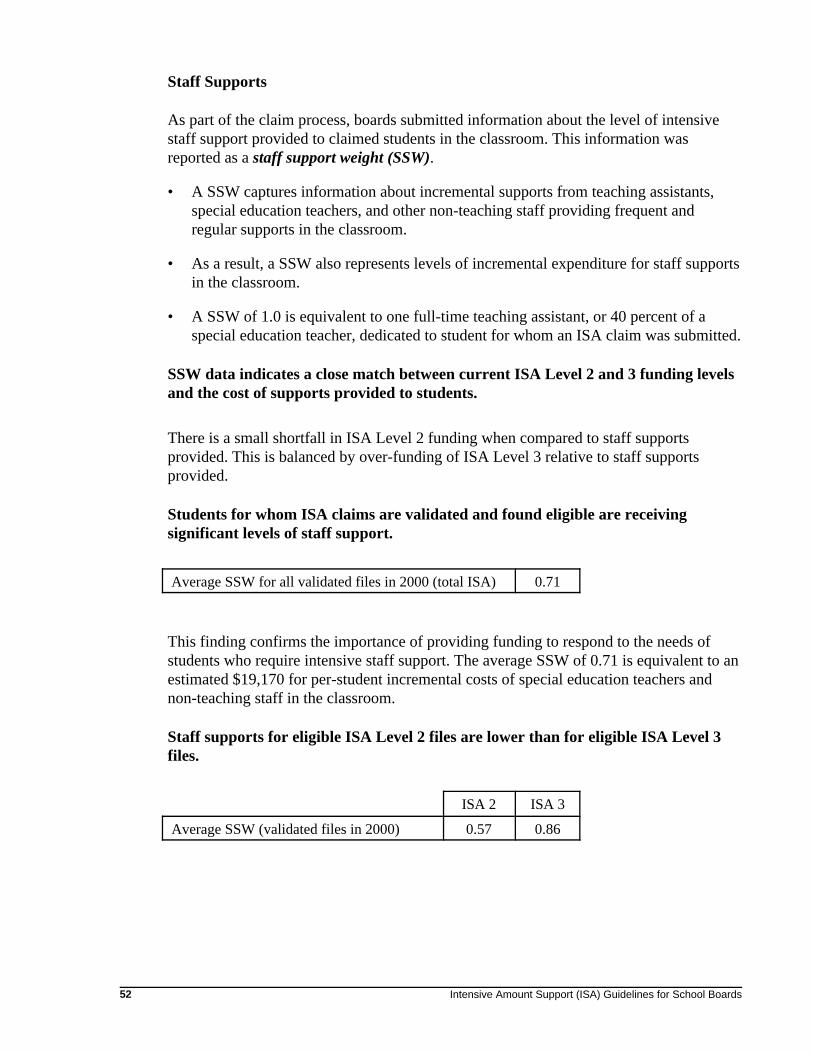
Intensive Amount Support (ISA) Guidelines for School Boards52
Staff Supports
As part of the claim process, boards submitted information about the level of intensivestaff support provided to claimed students in the classroom. This information wasreported as a staff support weight (SSW).
• A SSW captures information about incremental supports from teaching assistants,special education teachers, and other non-teaching staff providing frequent andregular supports in the classroom.
• As a result, a SSW also represents levels of incremental expenditure for staff supportsin the classroom.
• A SSW of 1.0 is equivalent to one full-time teaching assistant, or 40 percent of aspecial education teacher, dedicated to student for whom an ISA claim was submitted.
SSW data indicates a close match between current ISA Level 2 and 3 funding levelsand the cost of supports provided to students.
There is a small shortfall in ISA Level 2 funding when compared to staff supportsprovided. This is balanced by over-funding of ISA Level 3 relative to staff supportsprovided.
Students for whom ISA claims are validated and found eligible are receivingsignificant levels of staff support.
Average SSW for all validated files in 2000 (total ISA) 0.71
This finding confirms the importance of providing funding to respond to the needs ofstudents who require intensive staff support. The average SSW of 0.71 is equivalent to anestimated $19,170 for per-student incremental costs of special education teachers andnon-teaching staff in the classroom.
Staff supports for eligible ISA Level 2 files are lower than for eligible ISA Level 3files.
ISA 2 ISA 3
Average SSW (validated files in 2000) 0.57 0.86

* It should be noted that some profiles have eligibility criteria that include a minimum level of staffsupport: students with blindness and hearing impairments, students with physical or medical conditions,and students with multiple exceptionalities.
Intensive Amount Support (ISA) Guidelines for School Boards 53
This finding confirms the validity of using two levels of ISA funding. On average,students meeting ISA Level 2 criteria are receiving less support than students meetingISA Level 3 students. Overall, the SSW reflects boards’ decisions about levels of supportrequired,* and thus the level of students’ needs.
There is significant variability in staff support levels for different profiles.
Average SSW by profile (validated files in2000) ISA 2 ISA 3 Total
1. Behaviour 0.52 0.73 0.60
2. Deaf/hard of hearing 0.82 0.92 0.87
3. Learning/language 0.45 0.74 0.49
4. Autism/PDD 0.66 0.86 0.76
7. Developmental/intellectual 0.56 0.72 0.62
8. Blind/low vision 1.15 1.76 1.65
9. Physical/medical 0.68 0.86 0.83
10.Multiple exceptionality 0.64 0.91 0.84
This finding suggests strongly that different exceptionalities require, on average, differentlevels of support.
Overall, eligible ISA files have higher staff supports than rejected files.
This finding reflects in part the eligibility requirement of a threshold for intensive staffsupports for some profiles. For example, claims made under profile 2.3 (deaf/hard-of-hearing) and under profile 8.3 (blind/low vision) must meet an eligibility requirement forintensive staff supports.
These findings confirm that ISA eligibility profiles identify students who requireintensive staff supports in the classroom, and that ISA funding is linked to a board’sproportion of students with high needs who require costly supports.
Even though eligible claims have higher SSW than rejected claims, the data provided byboards confirms that students who do not meet ISA eligibility criteria are also receivingintensive supports.
The Special Education Grant is designed with the recognition that most students withspecial needs do not require intensive staff supports. The ISA process is intended to
Intensive Amount Support (ISA) Guidelines for School Boards54
provide funding for staff supports in response to boards’ incidence of students with veryhigh needs. Some students that do not meet ISA eligibility criteria also have high needs,but funding for special education gives boards the flexibility they need to support allstudents.
• The Special Education Per Pupil Amount (SEPPA) of the Special Education Grant isintended to provide flexible funding to allow boards to provide programs andsupports for all their special education students.
• Changes to ISA funding for the 2000–01 school year also recognize the need toprovide flexibility. Boards receive ISA funding as part of their total special educationallocation and can use this funding to adjust programs and supports for all studentswith high needs.
The costs of the intensive staff support component for students in self-containedprograms are lower than costs for students integrated into regular classrooms.
This finding indicates that, on average, the incremental costs of staff supports in self-contained programs are lower than in integrated programs in regular classrooms.
A caution about this finding, however, should be noted. These relative SSWs may notreflect the relative costs of the program types.
• The SSWs quantify only the incremental costs of teachers and non teaching staffsupports in the classroom.
• There are other costs associated with self-contained programs, notably highertransportation costs.
It is not possible at this time to provide a comprehensive evaluation of the relativecosts of these alternative program types.
Intensive Amount Support (ISA) Guidelines for School Boards 55
Summary Tables:
The following tables showing board-by-board ISA results for three years (except wherenoted):
Table 1: Eligible claims: numbers
Table 2: Eligible claims: percentage of enrolment
Table 3: Number of claims submitted
Table 4: Three-Year Validation and approval rates
Table 5: Adjusted Files: ISA Level 3 to ISA Level 2

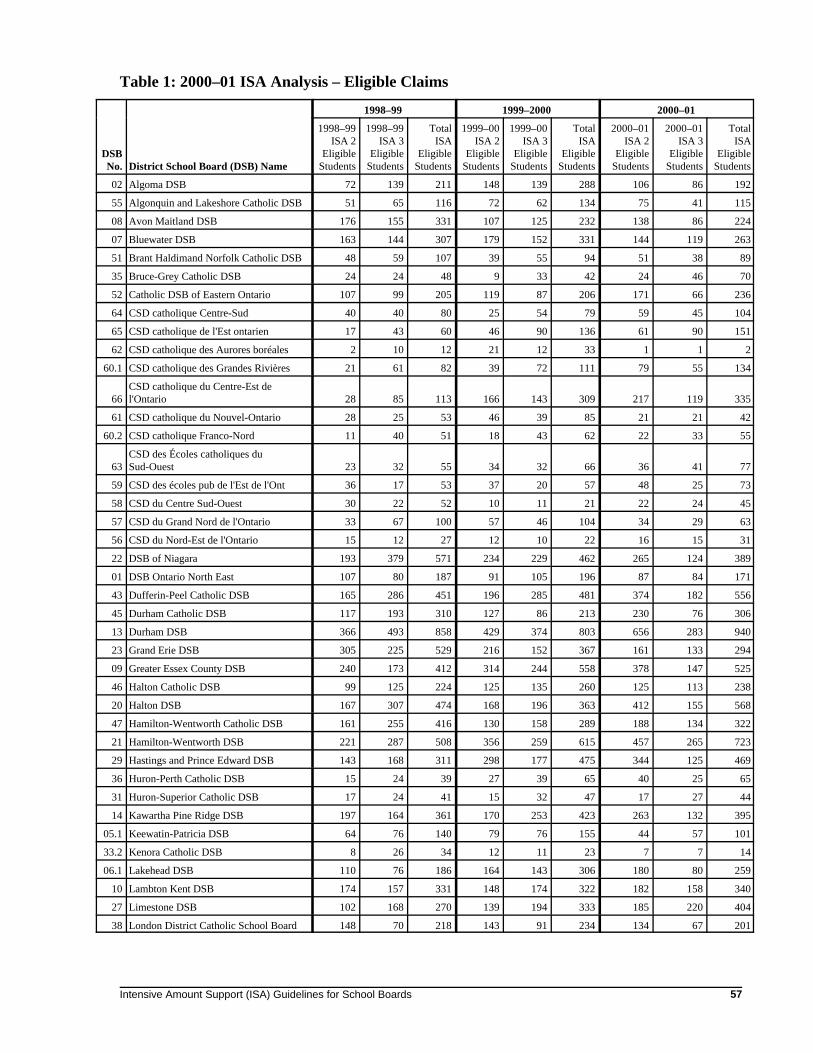
Intensive Amount Support (ISA) Guidelines for School Boards 57
Table 1: 2000–01 ISA Analysis – Eligible Claims
1998–99 1999–2000 2000–01
DSBNo. District School Board (DSB) Name
1998–99ISA 2
EligibleStudents
1998–99ISA 3
EligibleStudents
TotalISA
EligibleStudents
1999–00ISA 2
EligibleStudents
1999–00ISA 3
EligibleStudents
TotalISA
EligibleStudents
2000–01ISA 2
EligibleStudents
2000–01ISA 3
EligibleStudents
TotalISA
EligibleStudents
02 Algoma DSB 72 139 211 148 139 288 106 86 192
55 Algonquin and Lakeshore Catholic DSB 51 65 116 72 62 134 75 41 115
08 Avon Maitland DSB 176 155 331 107 125 232 138 86 224
07 Bluewater DSB 163 144 307 179 152 331 144 119 263
51 Brant Haldimand Norfolk Catholic DSB 48 59 107 39 55 94 51 38 89
35 Bruce-Grey Catholic DSB 24 24 48 9 33 42 24 46 70
52 Catholic DSB of Eastern Ontario 107 99 205 119 87 206 171 66 236
64 CSD catholique Centre-Sud 40 40 80 25 54 79 59 45 104
65 CSD catholique de l'Est ontarien 17 43 60 46 90 136 61 90 151
62 CSD catholique des Aurores boréales 2 10 12 21 12 33 1 1 2
60.1 CSD catholique des Grandes Rivières 21 61 82 39 72 111 79 55 134
66CSD catholique du Centre-Est del'Ontario 28 85 113 166 143 309 217 119 335
61 CSD catholique du Nouvel-Ontario 28 25 53 46 39 85 21 21 42
60.2 CSD catholique Franco-Nord 11 40 51 18 43 62 22 33 55
63CSD des Écoles catholiques duSud-Ouest 23 32 55 34 32 66 36 41 77
59 CSD des écoles pub de l'Est de l'Ont 36 17 53 37 20 57 48 25 73
58 CSD du Centre Sud-Ouest 30 22 52 10 11 21 22 24 45
57 CSD du Grand Nord de l'Ontario 33 67 100 57 46 104 34 29 63
56 CSD du Nord-Est de l'Ontario 15 12 27 12 10 22 16 15 31
22 DSB of Niagara 193 379 571 234 229 462 265 124 389
01 DSB Ontario North East 107 80 187 91 105 196 87 84 171
43 Dufferin-Peel Catholic DSB 165 286 451 196 285 481 374 182 556
45 Durham Catholic DSB 117 193 310 127 86 213 230 76 306
13 Durham DSB 366 493 858 429 374 803 656 283 940
23 Grand Erie DSB 305 225 529 216 152 367 161 133 294
09 Greater Essex County DSB 240 173 412 314 244 558 378 147 525
46 Halton Catholic DSB 99 125 224 125 135 260 125 113 238
20 Halton DSB 167 307 474 168 196 363 412 155 568
47 Hamilton-Wentworth Catholic DSB 161 255 416 130 158 289 188 134 322
21 Hamilton-Wentworth DSB 221 287 508 356 259 615 457 265 723
29 Hastings and Prince Edward DSB 143 168 311 298 177 475 344 125 469
36 Huron-Perth Catholic DSB 15 24 39 27 39 65 40 25 65
31 Huron-Superior Catholic DSB 17 24 41 15 32 47 17 27 44
14 Kawartha Pine Ridge DSB 197 164 361 170 253 423 263 132 395
05.1 Keewatin-Patricia DSB 64 76 140 79 76 155 44 57 101
33.2 Kenora Catholic DSB 8 26 34 12 11 23 7 7 14
06.1 Lakehead DSB 110 76 186 164 143 306 180 80 259
10 Lambton Kent DSB 174 157 331 148 174 322 182 158 340
27 Limestone DSB 102 168 270 139 194 333 185 220 404
38 London District Catholic School Board 148 70 218 143 91 234 134 67 201
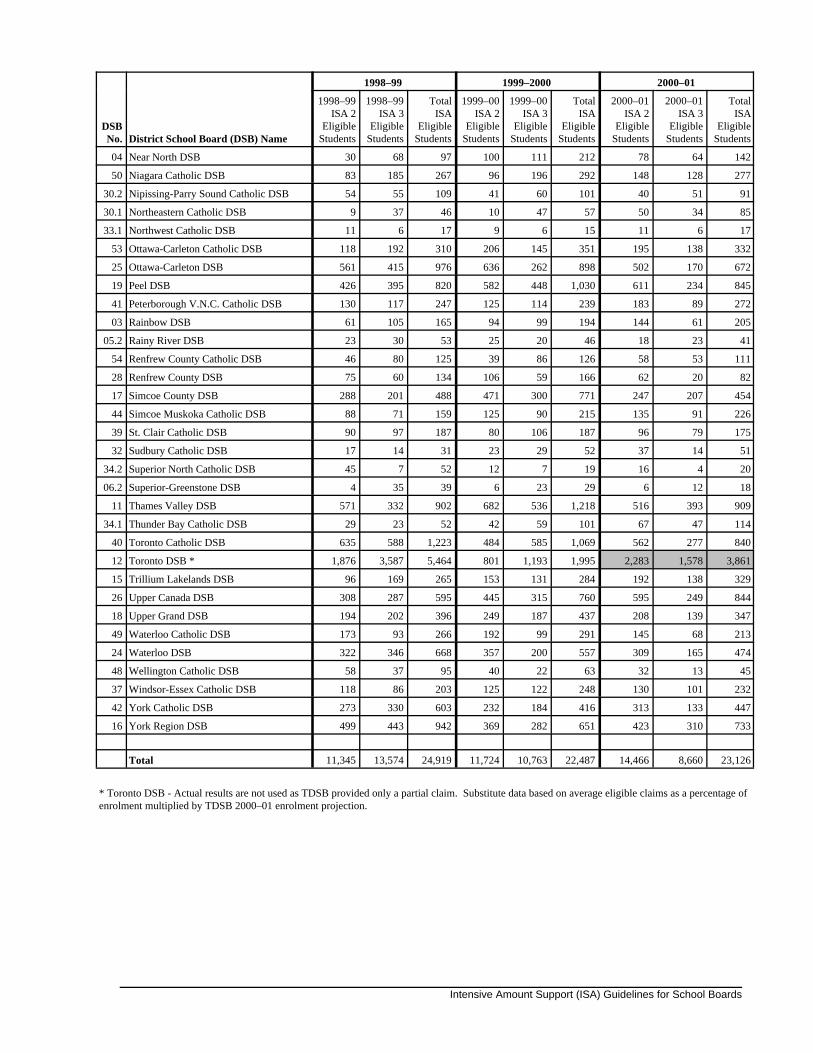
1998–99 1999–2000 2000–01
DSBNo. District School Board (DSB) Name
1998–99ISA 2
EligibleStudents
1998–99ISA 3
EligibleStudents
TotalISA
EligibleStudents
1999–00ISA 2
EligibleStudents
1999–00ISA 3
EligibleStudents
TotalISA
EligibleStudents
2000–01ISA 2
EligibleStudents
2000–01ISA 3
EligibleStudents
TotalISA
EligibleStudents
Intensive Amount Support (ISA) Guidelines for School Boards
04 Near North DSB 30 68 97 100 111 212 78 64 142
50 Niagara Catholic DSB 83 185 267 96 196 292 148 128 277
30.2 Nipissing-Parry Sound Catholic DSB 54 55 109 41 60 101 40 51 91
30.1 Northeastern Catholic DSB 9 37 46 10 47 57 50 34 85
33.1 Northwest Catholic DSB 11 6 17 9 6 15 11 6 17
53 Ottawa-Carleton Catholic DSB 118 192 310 206 145 351 195 138 332
25 Ottawa-Carleton DSB 561 415 976 636 262 898 502 170 672
19 Peel DSB 426 395 820 582 448 1,030 611 234 845
41 Peterborough V.N.C. Catholic DSB 130 117 247 125 114 239 183 89 272
03 Rainbow DSB 61 105 165 94 99 194 144 61 205
05.2 Rainy River DSB 23 30 53 25 20 46 18 23 41
54 Renfrew County Catholic DSB 46 80 125 39 86 126 58 53 111
28 Renfrew County DSB 75 60 134 106 59 166 62 20 82
17 Simcoe County DSB 288 201 488 471 300 771 247 207 454
44 Simcoe Muskoka Catholic DSB 88 71 159 125 90 215 135 91 226
39 St. Clair Catholic DSB 90 97 187 80 106 187 96 79 175
32 Sudbury Catholic DSB 17 14 31 23 29 52 37 14 51
34.2 Superior North Catholic DSB 45 7 52 12 7 19 16 4 20
06.2 Superior-Greenstone DSB 4 35 39 6 23 29 6 12 18
11 Thames Valley DSB 571 332 902 682 536 1,218 516 393 909
34.1 Thunder Bay Catholic DSB 29 23 52 42 59 101 67 47 114
40 Toronto Catholic DSB 635 588 1,223 484 585 1,069 562 277 840
12 Toronto DSB * 1,876 3,587 5,464 801 1,193 1,995 2,283 1,578 3,861
15 Trillium Lakelands DSB 96 169 265 153 131 284 192 138 329
26 Upper Canada DSB 308 287 595 445 315 760 595 249 844
18 Upper Grand DSB 194 202 396 249 187 437 208 139 347
49 Waterloo Catholic DSB 173 93 266 192 99 291 145 68 213
24 Waterloo DSB 322 346 668 357 200 557 309 165 474
48 Wellington Catholic DSB 58 37 95 40 22 63 32 13 45
37 Windsor-Essex Catholic DSB 118 86 203 125 122 248 130 101 232
42 York Catholic DSB 273 330 603 232 184 416 313 133 447
16 York Region DSB 499 443 942 369 282 651 423 310 733
Total 11,345 13,574 24,919 11,724 10,763 22,487 14,466 8,660 23,126
* Toronto DSB - Actual results are not used as TDSB provided only a partial claim. Substitute data based on average eligible claims as a percentage ofenrolment multiplied by TDSB 2000–01 enrolment projection.
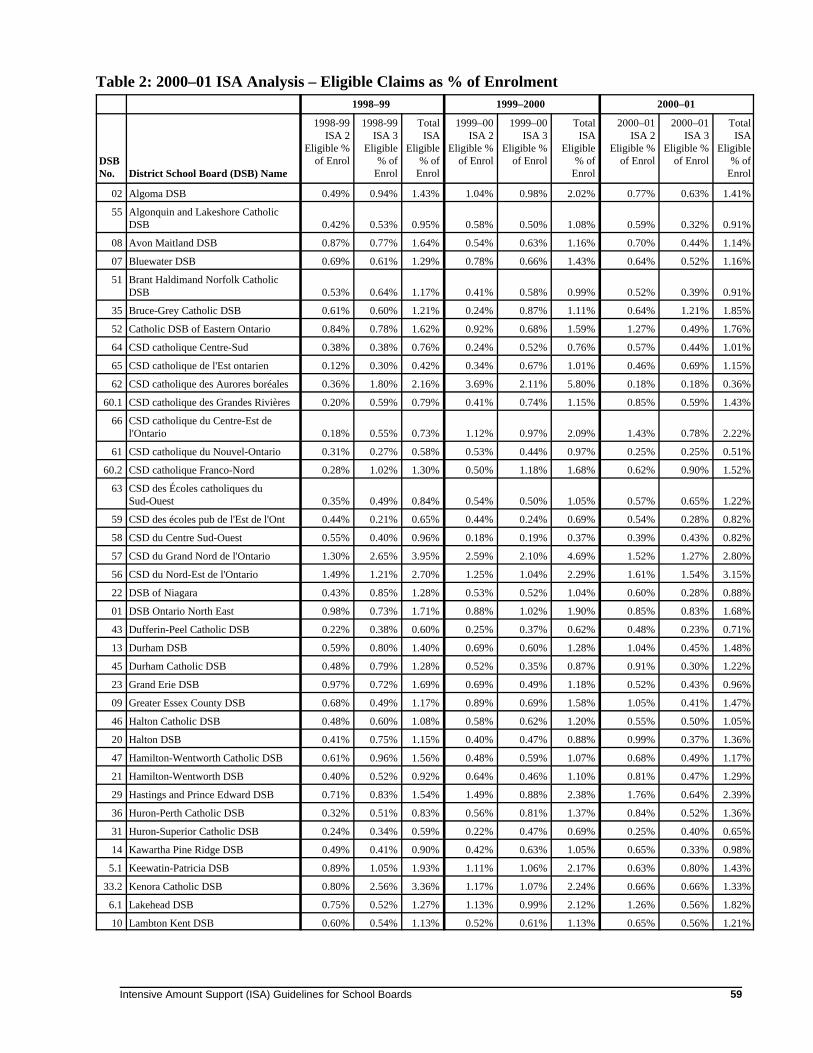
Intensive Amount Support (ISA) Guidelines for School Boards 59
Table 2: 2000–01 ISA Analysis – Eligible Claims as % of Enrolment1998–99 1999–2000 2000–01
DSBNo. District School Board (DSB) Name
1998-99ISA 2
Eligible %of Enrol
1998-99ISA 3
Eligible% of
Enrol
TotalISA
Eligible% of
Enrol
1999–00ISA 2
Eligible %of Enrol
1999–00ISA 3
Eligible %of Enrol
TotalISA
Eligible% of
Enrol
2000–01ISA 2
Eligible %of Enrol
2000–01ISA 3
Eligible %of Enrol
TotalISA
Eligible% of
Enrol
02 Algoma DSB 0.49% 0.94% 1.43% 1.04% 0.98% 2.02% 0.77% 0.63% 1.41%
55 Algonquin and Lakeshore CatholicDSB 0.42% 0.53% 0.95% 0.58% 0.50% 1.08% 0.59% 0.32% 0.91%
08 Avon Maitland DSB 0.87% 0.77% 1.64% 0.54% 0.63% 1.16% 0.70% 0.44% 1.14%
07 Bluewater DSB 0.69% 0.61% 1.29% 0.78% 0.66% 1.43% 0.64% 0.52% 1.16%
51 Brant Haldimand Norfolk CatholicDSB 0.53% 0.64% 1.17% 0.41% 0.58% 0.99% 0.52% 0.39% 0.91%
35 Bruce-Grey Catholic DSB 0.61% 0.60% 1.21% 0.24% 0.87% 1.11% 0.64% 1.21% 1.85%
52 Catholic DSB of Eastern Ontario 0.84% 0.78% 1.62% 0.92% 0.68% 1.59% 1.27% 0.49% 1.76%
64 CSD catholique Centre-Sud 0.38% 0.38% 0.76% 0.24% 0.52% 0.76% 0.57% 0.44% 1.01%
65 CSD catholique de l'Est ontarien 0.12% 0.30% 0.42% 0.34% 0.67% 1.01% 0.46% 0.69% 1.15%
62 CSD catholique des Aurores boréales 0.36% 1.80% 2.16% 3.69% 2.11% 5.80% 0.18% 0.18% 0.36%
60.1 CSD catholique des Grandes Rivières 0.20% 0.59% 0.79% 0.41% 0.74% 1.15% 0.85% 0.59% 1.43%
66 CSD catholique du Centre-Est del'Ontario 0.18% 0.55% 0.73% 1.12% 0.97% 2.09% 1.43% 0.78% 2.22%
61 CSD catholique du Nouvel-Ontario 0.31% 0.27% 0.58% 0.53% 0.44% 0.97% 0.25% 0.25% 0.51%
60.2 CSD catholique Franco-Nord 0.28% 1.02% 1.30% 0.50% 1.18% 1.68% 0.62% 0.90% 1.52%
63 CSD des Écoles catholiques duSud-Ouest 0.35% 0.49% 0.84% 0.54% 0.50% 1.05% 0.57% 0.65% 1.22%
59 CSD des écoles pub de l'Est de l'Ont 0.44% 0.21% 0.65% 0.44% 0.24% 0.69% 0.54% 0.28% 0.82%
58 CSD du Centre Sud-Ouest 0.55% 0.40% 0.96% 0.18% 0.19% 0.37% 0.39% 0.43% 0.82%
57 CSD du Grand Nord de l'Ontario 1.30% 2.65% 3.95% 2.59% 2.10% 4.69% 1.52% 1.27% 2.80%
56 CSD du Nord-Est de l'Ontario 1.49% 1.21% 2.70% 1.25% 1.04% 2.29% 1.61% 1.54% 3.15%
22 DSB of Niagara 0.43% 0.85% 1.28% 0.53% 0.52% 1.04% 0.60% 0.28% 0.88%
01 DSB Ontario North East 0.98% 0.73% 1.71% 0.88% 1.02% 1.90% 0.85% 0.83% 1.68%
43 Dufferin-Peel Catholic DSB 0.22% 0.38% 0.60% 0.25% 0.37% 0.62% 0.48% 0.23% 0.71%
13 Durham DSB 0.59% 0.80% 1.40% 0.69% 0.60% 1.28% 1.04% 0.45% 1.48%
45 Durham Catholic DSB 0.48% 0.79% 1.28% 0.52% 0.35% 0.87% 0.91% 0.30% 1.22%
23 Grand Erie DSB 0.97% 0.72% 1.69% 0.69% 0.49% 1.18% 0.52% 0.43% 0.96%
09 Greater Essex County DSB 0.68% 0.49% 1.17% 0.89% 0.69% 1.58% 1.05% 0.41% 1.47%
46 Halton Catholic DSB 0.48% 0.60% 1.08% 0.58% 0.62% 1.20% 0.55% 0.50% 1.05%
20 Halton DSB 0.41% 0.75% 1.15% 0.40% 0.47% 0.88% 0.99% 0.37% 1.36%
47 Hamilton-Wentworth Catholic DSB 0.61% 0.96% 1.56% 0.48% 0.59% 1.07% 0.68% 0.49% 1.17%
21 Hamilton-Wentworth DSB 0.40% 0.52% 0.92% 0.64% 0.46% 1.10% 0.81% 0.47% 1.29%
29 Hastings and Prince Edward DSB 0.71% 0.83% 1.54% 1.49% 0.88% 2.38% 1.76% 0.64% 2.39%
36 Huron-Perth Catholic DSB 0.32% 0.51% 0.83% 0.56% 0.81% 1.37% 0.84% 0.52% 1.36%
31 Huron-Superior Catholic DSB 0.24% 0.34% 0.59% 0.22% 0.47% 0.69% 0.25% 0.40% 0.65%
14 Kawartha Pine Ridge DSB 0.49% 0.41% 0.90% 0.42% 0.63% 1.05% 0.65% 0.33% 0.98%
5.1 Keewatin-Patricia DSB 0.89% 1.05% 1.93% 1.11% 1.06% 2.17% 0.63% 0.80% 1.43%
33.2 Kenora Catholic DSB 0.80% 2.56% 3.36% 1.17% 1.07% 2.24% 0.66% 0.66% 1.33%
6.1 Lakehead DSB 0.75% 0.52% 1.27% 1.13% 0.99% 2.12% 1.26% 0.56% 1.82%
10 Lambton Kent DSB 0.60% 0.54% 1.13% 0.52% 0.61% 1.13% 0.65% 0.56% 1.21%
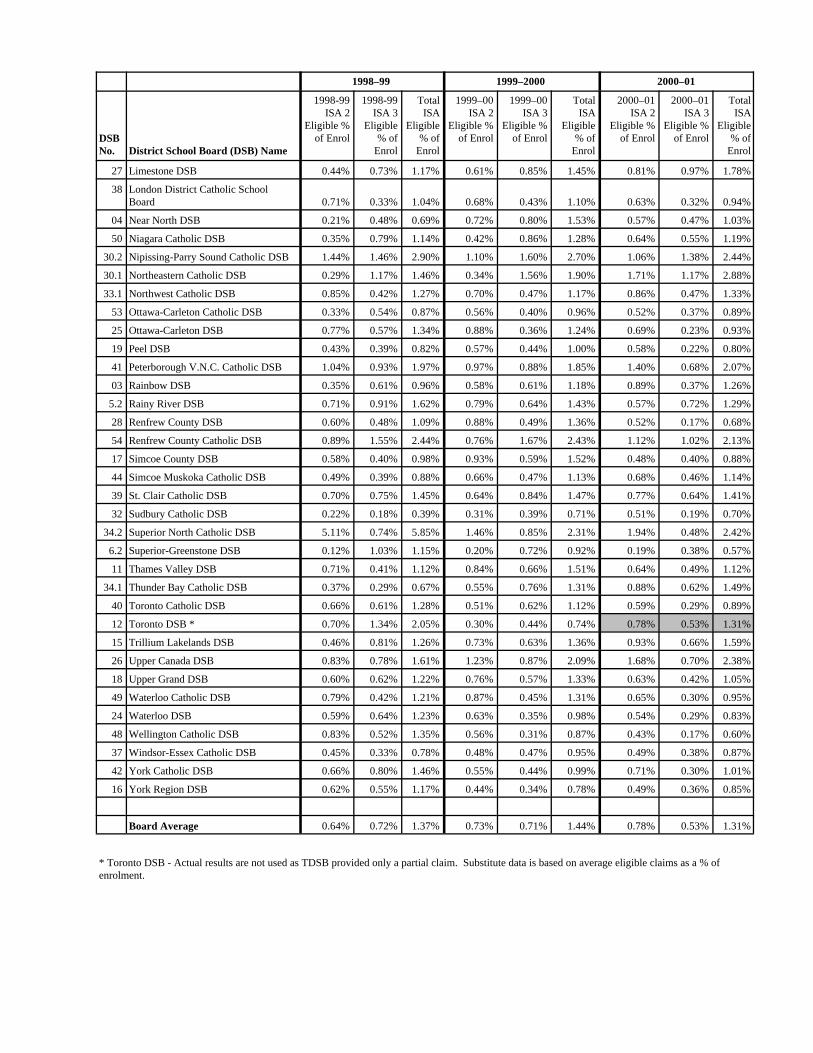
1998–99 1999–2000 2000–01
DSBNo. District School Board (DSB) Name
1998-99ISA 2
Eligible %of Enrol
1998-99ISA 3
Eligible% of
Enrol
TotalISA
Eligible% of
Enrol
1999–00ISA 2
Eligible %of Enrol
1999–00ISA 3
Eligible %of Enrol
TotalISA
Eligible% of
Enrol
2000–01ISA 2
Eligible %of Enrol
2000–01ISA 3
Eligible %of Enrol
TotalISA
Eligible% of
Enrol
27 Limestone DSB 0.44% 0.73% 1.17% 0.61% 0.85% 1.45% 0.81% 0.97% 1.78%
38 London District Catholic SchoolBoard 0.71% 0.33% 1.04% 0.68% 0.43% 1.10% 0.63% 0.32% 0.94%
04 Near North DSB 0.21% 0.48% 0.69% 0.72% 0.80% 1.53% 0.57% 0.47% 1.03%
50 Niagara Catholic DSB 0.35% 0.79% 1.14% 0.42% 0.86% 1.28% 0.64% 0.55% 1.19%
30.2 Nipissing-Parry Sound Catholic DSB 1.44% 1.46% 2.90% 1.10% 1.60% 2.70% 1.06% 1.38% 2.44%
30.1 Northeastern Catholic DSB 0.29% 1.17% 1.46% 0.34% 1.56% 1.90% 1.71% 1.17% 2.88%
33.1 Northwest Catholic DSB 0.85% 0.42% 1.27% 0.70% 0.47% 1.17% 0.86% 0.47% 1.33%
53 Ottawa-Carleton Catholic DSB 0.33% 0.54% 0.87% 0.56% 0.40% 0.96% 0.52% 0.37% 0.89%
25 Ottawa-Carleton DSB 0.77% 0.57% 1.34% 0.88% 0.36% 1.24% 0.69% 0.23% 0.93%
19 Peel DSB 0.43% 0.39% 0.82% 0.57% 0.44% 1.00% 0.58% 0.22% 0.80%
41 Peterborough V.N.C. Catholic DSB 1.04% 0.93% 1.97% 0.97% 0.88% 1.85% 1.40% 0.68% 2.07%
03 Rainbow DSB 0.35% 0.61% 0.96% 0.58% 0.61% 1.18% 0.89% 0.37% 1.26%
5.2 Rainy River DSB 0.71% 0.91% 1.62% 0.79% 0.64% 1.43% 0.57% 0.72% 1.29%
28 Renfrew County DSB 0.60% 0.48% 1.09% 0.88% 0.49% 1.36% 0.52% 0.17% 0.68%
54 Renfrew County Catholic DSB 0.89% 1.55% 2.44% 0.76% 1.67% 2.43% 1.12% 1.02% 2.13%
17 Simcoe County DSB 0.58% 0.40% 0.98% 0.93% 0.59% 1.52% 0.48% 0.40% 0.88%
44 Simcoe Muskoka Catholic DSB 0.49% 0.39% 0.88% 0.66% 0.47% 1.13% 0.68% 0.46% 1.14%
39 St. Clair Catholic DSB 0.70% 0.75% 1.45% 0.64% 0.84% 1.47% 0.77% 0.64% 1.41%
32 Sudbury Catholic DSB 0.22% 0.18% 0.39% 0.31% 0.39% 0.71% 0.51% 0.19% 0.70%
34.2 Superior North Catholic DSB 5.11% 0.74% 5.85% 1.46% 0.85% 2.31% 1.94% 0.48% 2.42%
6.2 Superior-Greenstone DSB 0.12% 1.03% 1.15% 0.20% 0.72% 0.92% 0.19% 0.38% 0.57%
11 Thames Valley DSB 0.71% 0.41% 1.12% 0.84% 0.66% 1.51% 0.64% 0.49% 1.12%
34.1 Thunder Bay Catholic DSB 0.37% 0.29% 0.67% 0.55% 0.76% 1.31% 0.88% 0.62% 1.49%
40 Toronto Catholic DSB 0.66% 0.61% 1.28% 0.51% 0.62% 1.12% 0.59% 0.29% 0.89%
12 Toronto DSB * 0.70% 1.34% 2.05% 0.30% 0.44% 0.74% 0.78% 0.53% 1.31%
15 Trillium Lakelands DSB 0.46% 0.81% 1.26% 0.73% 0.63% 1.36% 0.93% 0.66% 1.59%
26 Upper Canada DSB 0.83% 0.78% 1.61% 1.23% 0.87% 2.09% 1.68% 0.70% 2.38%
18 Upper Grand DSB 0.60% 0.62% 1.22% 0.76% 0.57% 1.33% 0.63% 0.42% 1.05%
49 Waterloo Catholic DSB 0.79% 0.42% 1.21% 0.87% 0.45% 1.31% 0.65% 0.30% 0.95%
24 Waterloo DSB 0.59% 0.64% 1.23% 0.63% 0.35% 0.98% 0.54% 0.29% 0.83%
48 Wellington Catholic DSB 0.83% 0.52% 1.35% 0.56% 0.31% 0.87% 0.43% 0.17% 0.60%
37 Windsor-Essex Catholic DSB 0.45% 0.33% 0.78% 0.48% 0.47% 0.95% 0.49% 0.38% 0.87%
42 York Catholic DSB 0.66% 0.80% 1.46% 0.55% 0.44% 0.99% 0.71% 0.30% 1.01%
16 York Region DSB 0.62% 0.55% 1.17% 0.44% 0.34% 0.78% 0.49% 0.36% 0.85%
Board Average 0.64% 0.72% 1.37% 0.73% 0.71% 1.44% 0.78% 0.53% 1.31%
* Toronto DSB - Actual results are not used as TDSB provided only a partial claim. Substitute data is based on average eligible claims as a % ofenrolment.
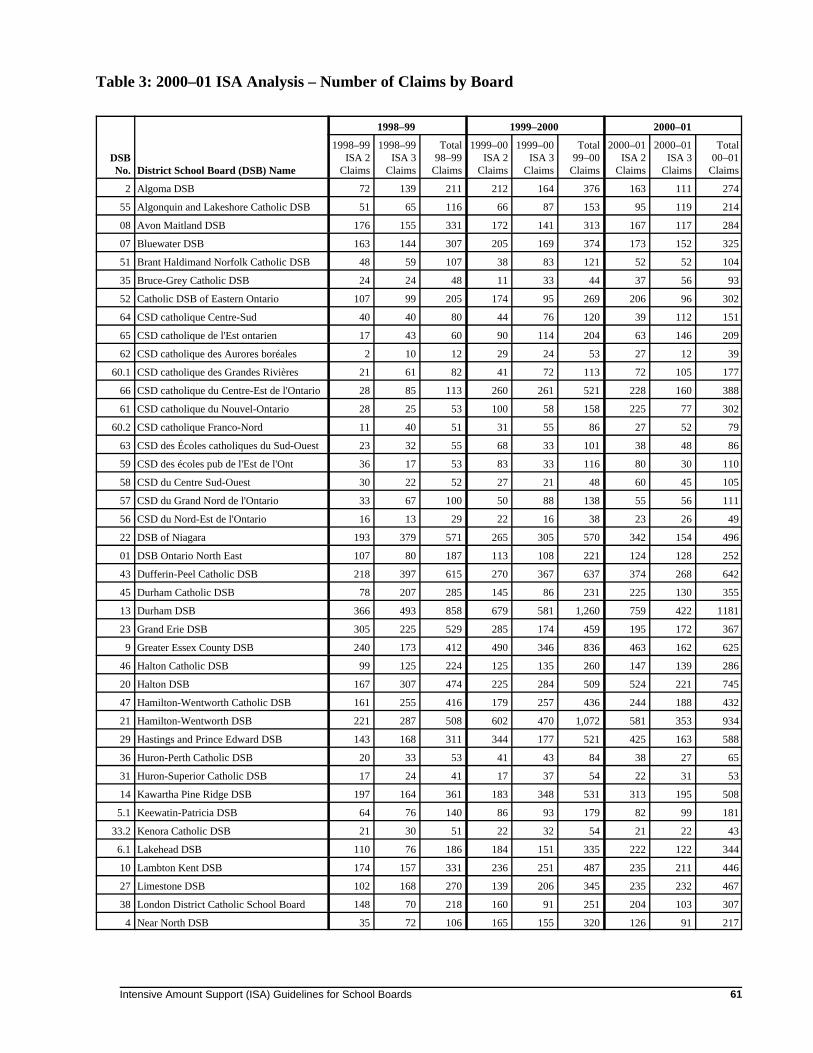
Intensive Amount Support (ISA) Guidelines for School Boards 61
Table 3: 2000–01 ISA Analysis – Number of Claims by Board
1998–99 1999–2000 2000–01
DSBNo. District School Board (DSB) Name
1998–99ISA 2
Claims
1998–99ISA 3
Claims
Total98–99
Claims
1999–00ISA 2
Claims
1999–00ISA 3
Claims
Total99–00
Claims
2000–01ISA 2
Claims
2000–01ISA 3
Claims
Total00–01
Claims
2 Algoma DSB 72 139 211 212 164 376 163 111 274
55 Algonquin and Lakeshore Catholic DSB 51 65 116 66 87 153 95 119 214
08 Avon Maitland DSB 176 155 331 172 141 313 167 117 284
07 Bluewater DSB 163 144 307 205 169 374 173 152 325
51 Brant Haldimand Norfolk Catholic DSB 48 59 107 38 83 121 52 52 104
35 Bruce-Grey Catholic DSB 24 24 48 11 33 44 37 56 93
52 Catholic DSB of Eastern Ontario 107 99 205 174 95 269 206 96 302
64 CSD catholique Centre-Sud 40 40 80 44 76 120 39 112 151
65 CSD catholique de l'Est ontarien 17 43 60 90 114 204 63 146 209
62 CSD catholique des Aurores boréales 2 10 12 29 24 53 27 12 39
60.1 CSD catholique des Grandes Rivières 21 61 82 41 72 113 72 105 177
66 CSD catholique du Centre-Est de l'Ontario 28 85 113 260 261 521 228 160 388
61 CSD catholique du Nouvel-Ontario 28 25 53 100 58 158 225 77 302
60.2 CSD catholique Franco-Nord 11 40 51 31 55 86 27 52 79
63 CSD des Écoles catholiques du Sud-Ouest 23 32 55 68 33 101 38 48 86
59 CSD des écoles pub de l'Est de l'Ont 36 17 53 83 33 116 80 30 110
58 CSD du Centre Sud-Ouest 30 22 52 27 21 48 60 45 105
57 CSD du Grand Nord de l'Ontario 33 67 100 50 88 138 55 56 111
56 CSD du Nord-Est de l'Ontario 16 13 29 22 16 38 23 26 49
22 DSB of Niagara 193 379 571 265 305 570 342 154 496
01 DSB Ontario North East 107 80 187 113 108 221 124 128 252
43 Dufferin-Peel Catholic DSB 218 397 615 270 367 637 374 268 642
45 Durham Catholic DSB 78 207 285 145 86 231 225 130 355
13 Durham DSB 366 493 858 679 581 1,260 759 422 1181
23 Grand Erie DSB 305 225 529 285 174 459 195 172 367
9 Greater Essex County DSB 240 173 412 490 346 836 463 162 625
46 Halton Catholic DSB 99 125 224 125 135 260 147 139 286
20 Halton DSB 167 307 474 225 284 509 524 221 745
47 Hamilton-Wentworth Catholic DSB 161 255 416 179 257 436 244 188 432
21 Hamilton-Wentworth DSB 221 287 508 602 470 1,072 581 353 934
29 Hastings and Prince Edward DSB 143 168 311 344 177 521 425 163 588
36 Huron-Perth Catholic DSB 20 33 53 41 43 84 38 27 65
31 Huron-Superior Catholic DSB 17 24 41 17 37 54 22 31 53
14 Kawartha Pine Ridge DSB 197 164 361 183 348 531 313 195 508
5.1 Keewatin-Patricia DSB 64 76 140 86 93 179 82 99 181
33.2 Kenora Catholic DSB 21 30 51 22 32 54 21 22 43
6.1 Lakehead DSB 110 76 186 184 151 335 222 122 344
10 Lambton Kent DSB 174 157 331 236 251 487 235 211 446
27 Limestone DSB 102 168 270 139 206 345 235 232 467
38 London District Catholic School Board 148 70 218 160 91 251 204 103 307
4 Near North DSB 35 72 106 165 155 320 126 91 217
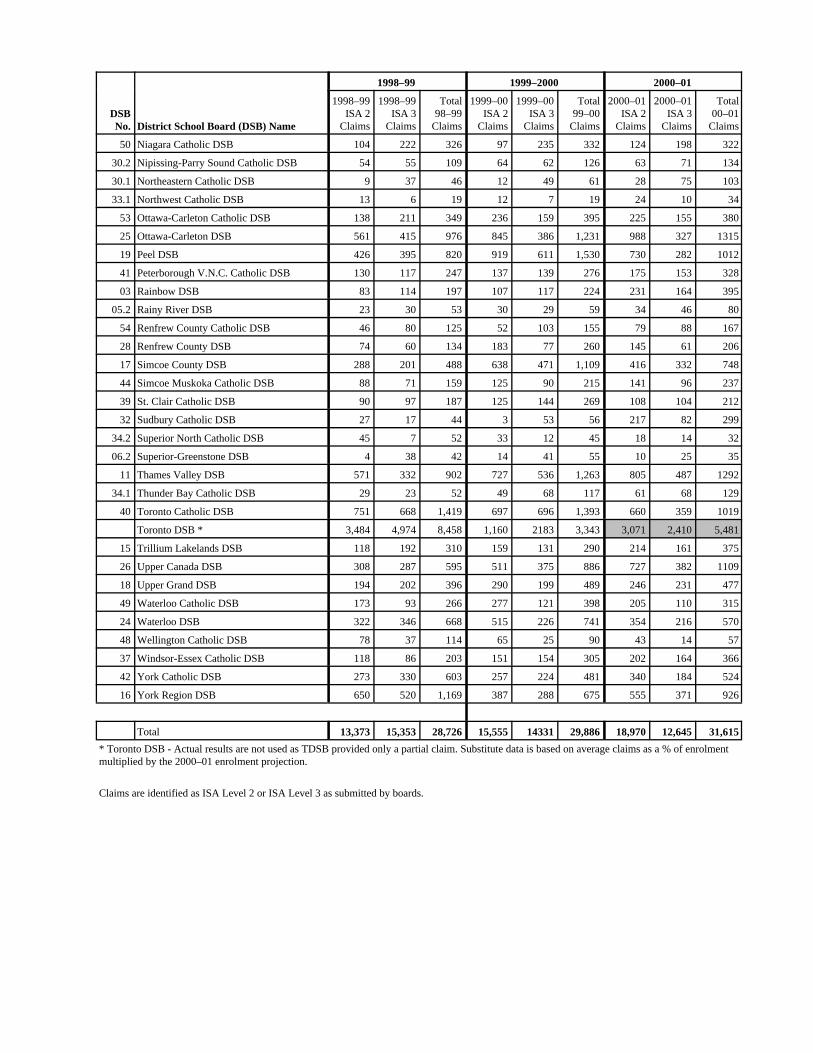
1998–99 1999–2000 2000–01
DSBNo. District School Board (DSB) Name
1998–99ISA 2
Claims
1998–99ISA 3
Claims
Total98–99
Claims
1999–00ISA 2
Claims
1999–00ISA 3
Claims
Total99–00
Claims
2000–01ISA 2
Claims
2000–01ISA 3
Claims
Total00–01
Claims
50 Niagara Catholic DSB 104 222 326 97 235 332 124 198 322
30.2 Nipissing-Parry Sound Catholic DSB 54 55 109 64 62 126 63 71 134
30.1 Northeastern Catholic DSB 9 37 46 12 49 61 28 75 103
33.1 Northwest Catholic DSB 13 6 19 12 7 19 24 10 34
53 Ottawa-Carleton Catholic DSB 138 211 349 236 159 395 225 155 380
25 Ottawa-Carleton DSB 561 415 976 845 386 1,231 988 327 1315
19 Peel DSB 426 395 820 919 611 1,530 730 282 1012
41 Peterborough V.N.C. Catholic DSB 130 117 247 137 139 276 175 153 328
03 Rainbow DSB 83 114 197 107 117 224 231 164 395
05.2 Rainy River DSB 23 30 53 30 29 59 34 46 80
54 Renfrew County Catholic DSB 46 80 125 52 103 155 79 88 167
28 Renfrew County DSB 74 60 134 183 77 260 145 61 206
17 Simcoe County DSB 288 201 488 638 471 1,109 416 332 748
44 Simcoe Muskoka Catholic DSB 88 71 159 125 90 215 141 96 237
39 St. Clair Catholic DSB 90 97 187 125 144 269 108 104 212
32 Sudbury Catholic DSB 27 17 44 3 53 56 217 82 299
34.2 Superior North Catholic DSB 45 7 52 33 12 45 18 14 32
06.2 Superior-Greenstone DSB 4 38 42 14 41 55 10 25 35
11 Thames Valley DSB 571 332 902 727 536 1,263 805 487 1292
34.1 Thunder Bay Catholic DSB 29 23 52 49 68 117 61 68 129
40 Toronto Catholic DSB 751 668 1,419 697 696 1,393 660 359 1019
Toronto DSB * 3,484 4,974 8,458 1,160 2183 3,343 3,071 2,410 5,481
15 Trillium Lakelands DSB 118 192 310 159 131 290 214 161 375
26 Upper Canada DSB 308 287 595 511 375 886 727 382 1109
18 Upper Grand DSB 194 202 396 290 199 489 246 231 477
49 Waterloo Catholic DSB 173 93 266 277 121 398 205 110 315
24 Waterloo DSB 322 346 668 515 226 741 354 216 570
48 Wellington Catholic DSB 78 37 114 65 25 90 43 14 57
37 Windsor-Essex Catholic DSB 118 86 203 151 154 305 202 164 366
42 York Catholic DSB 273 330 603 257 224 481 340 184 524
16 York Region DSB 650 520 1,169 387 288 675 555 371 926
Total 13,373 15,353 28,726 15,555 14331 29,886 18,970 12,645 31,615
* Toronto DSB - Actual results are not used as TDSB provided only a partial claim. Substitute data is based on average claims as a % of enrolmentmultiplied by the 2000–01 enrolment projection. Claims are identified as ISA Level 2 or ISA Level 3 as submitted by boards.
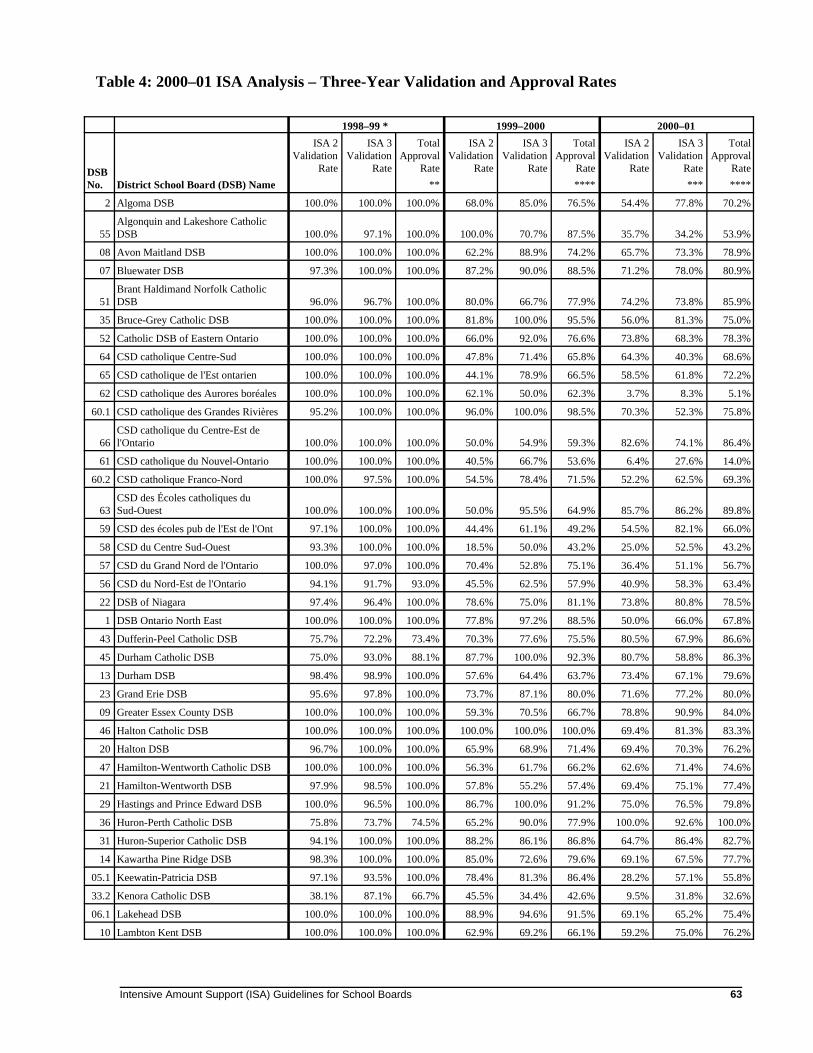
Intensive Amount Support (ISA) Guidelines for School Boards 63
Table 4: 2000–01 ISA Analysis – Three-Year Validation and Approval Rates
1998–99 * 1999–2000 2000–01
DSBNo. District School Board (DSB) Name
ISA 2Validation
Rate
ISA 3Validation
Rate
TotalApproval
Rate
**
ISA 2Validation
Rate
ISA 3Validation
Rate
TotalApproval
Rate
****
ISA 2Validation
Rate
ISA 3Validation
Rate
***
TotalApproval
Rate
****
2 Algoma DSB 100.0% 100.0% 100.0% 68.0% 85.0% 76.5% 54.4% 77.8% 70.2%
55Algonquin and Lakeshore CatholicDSB 100.0% 97.1% 100.0% 100.0% 70.7% 87.5% 35.7% 34.2% 53.9%
08 Avon Maitland DSB 100.0% 100.0% 100.0% 62.2% 88.9% 74.2% 65.7% 73.3% 78.9%
07 Bluewater DSB 97.3% 100.0% 100.0% 87.2% 90.0% 88.5% 71.2% 78.0% 80.9%
51Brant Haldimand Norfolk CatholicDSB 96.0% 96.7% 100.0% 80.0% 66.7% 77.9% 74.2% 73.8% 85.9%
35 Bruce-Grey Catholic DSB 100.0% 100.0% 100.0% 81.8% 100.0% 95.5% 56.0% 81.3% 75.0%
52 Catholic DSB of Eastern Ontario 100.0% 100.0% 100.0% 66.0% 92.0% 76.6% 73.8% 68.3% 78.3%
64 CSD catholique Centre-Sud 100.0% 100.0% 100.0% 47.8% 71.4% 65.8% 64.3% 40.3% 68.6%
65 CSD catholique de l'Est ontarien 100.0% 100.0% 100.0% 44.1% 78.9% 66.5% 58.5% 61.8% 72.2%
62 CSD catholique des Aurores boréales 100.0% 100.0% 100.0% 62.1% 50.0% 62.3% 3.7% 8.3% 5.1%
60.1 CSD catholique des Grandes Rivières 95.2% 100.0% 100.0% 96.0% 100.0% 98.5% 70.3% 52.3% 75.8%
66CSD catholique du Centre-Est del'Ontario 100.0% 100.0% 100.0% 50.0% 54.9% 59.3% 82.6% 74.1% 86.4%
61 CSD catholique du Nouvel-Ontario 100.0% 100.0% 100.0% 40.5% 66.7% 53.6% 6.4% 27.6% 14.0%
60.2 CSD catholique Franco-Nord 100.0% 97.5% 100.0% 54.5% 78.4% 71.5% 52.2% 62.5% 69.3%
63CSD des Écoles catholiques duSud-Ouest 100.0% 100.0% 100.0% 50.0% 95.5% 64.9% 85.7% 86.2% 89.8%
59 CSD des écoles pub de l'Est de l'Ont 97.1% 100.0% 100.0% 44.4% 61.1% 49.2% 54.5% 82.1% 66.0%
58 CSD du Centre Sud-Ouest 93.3% 100.0% 100.0% 18.5% 50.0% 43.2% 25.0% 52.5% 43.2%
57 CSD du Grand Nord de l'Ontario 100.0% 97.0% 100.0% 70.4% 52.8% 75.1% 36.4% 51.1% 56.7%
56 CSD du Nord-Est de l'Ontario 94.1% 91.7% 93.0% 45.5% 62.5% 57.9% 40.9% 58.3% 63.4%
22 DSB of Niagara 97.4% 96.4% 100.0% 78.6% 75.0% 81.1% 73.8% 80.8% 78.5%
1 DSB Ontario North East 100.0% 100.0% 100.0% 77.8% 97.2% 88.5% 50.0% 66.0% 67.8%
43 Dufferin-Peel Catholic DSB 75.7% 72.2% 73.4% 70.3% 77.6% 75.5% 80.5% 67.9% 86.6%
45 Durham Catholic DSB 75.0% 93.0% 88.1% 87.7% 100.0% 92.3% 80.7% 58.8% 86.3%
13 Durham DSB 98.4% 98.9% 100.0% 57.6% 64.4% 63.7% 73.4% 67.1% 79.6%
23 Grand Erie DSB 95.6% 97.8% 100.0% 73.7% 87.1% 80.0% 71.6% 77.2% 80.0%
09 Greater Essex County DSB 100.0% 100.0% 100.0% 59.3% 70.5% 66.7% 78.8% 90.9% 84.0%
46 Halton Catholic DSB 100.0% 100.0% 100.0% 100.0% 100.0% 100.0% 69.4% 81.3% 83.3%
20 Halton DSB 96.7% 100.0% 100.0% 65.9% 68.9% 71.4% 69.4% 70.3% 76.2%
47 Hamilton-Wentworth Catholic DSB 100.0% 100.0% 100.0% 56.3% 61.7% 66.2% 62.6% 71.4% 74.6%
21 Hamilton-Wentworth DSB 97.9% 98.5% 100.0% 57.8% 55.2% 57.4% 69.4% 75.1% 77.4%
29 Hastings and Prince Edward DSB 100.0% 96.5% 100.0% 86.7% 100.0% 91.2% 75.0% 76.5% 79.8%
36 Huron-Perth Catholic DSB 75.8% 73.7% 74.5% 65.2% 90.0% 77.9% 100.0% 92.6% 100.0%
31 Huron-Superior Catholic DSB 94.1% 100.0% 100.0% 88.2% 86.1% 86.8% 64.7% 86.4% 82.7%
14 Kawartha Pine Ridge DSB 98.3% 100.0% 100.0% 85.0% 72.6% 79.6% 69.1% 67.5% 77.7%
05.1 Keewatin-Patricia DSB 97.1% 93.5% 100.0% 78.4% 81.3% 86.4% 28.2% 57.1% 55.8%
33.2 Kenora Catholic DSB 38.1% 87.1% 66.7% 45.5% 34.4% 42.6% 9.5% 31.8% 32.6%
06.1 Lakehead DSB 100.0% 100.0% 100.0% 88.9% 94.6% 91.5% 69.1% 65.2% 75.4%
10 Lambton Kent DSB 100.0% 100.0% 100.0% 62.9% 69.2% 66.1% 59.2% 75.0% 76.2%
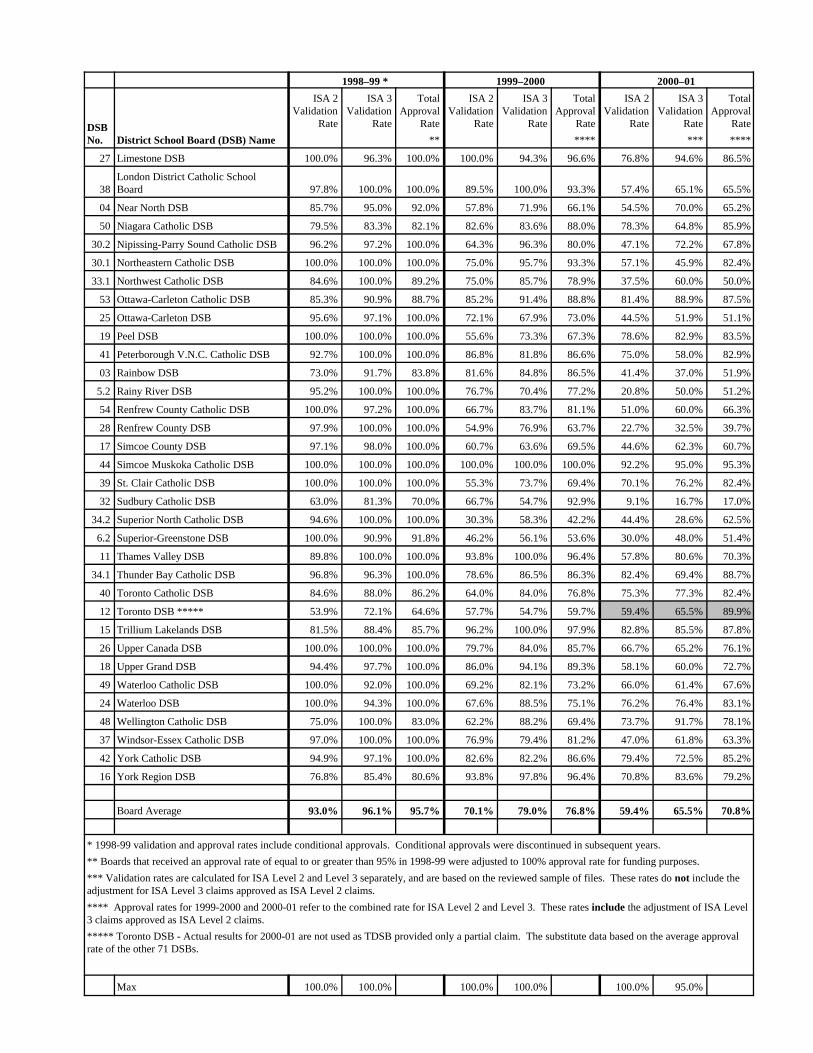
1998–99 * 1999–2000 2000–01
DSBNo. District School Board (DSB) Name
ISA 2Validation
Rate
ISA 3Validation
Rate
TotalApproval
Rate
**
ISA 2Validation
Rate
ISA 3Validation
Rate
TotalApproval
Rate
****
ISA 2Validation
Rate
ISA 3Validation
Rate
***
TotalApproval
Rate
****
27 Limestone DSB 100.0% 96.3% 100.0% 100.0% 94.3% 96.6% 76.8% 94.6% 86.5%
38London District Catholic SchoolBoard 97.8% 100.0% 100.0% 89.5% 100.0% 93.3% 57.4% 65.1% 65.5%
04 Near North DSB 85.7% 95.0% 92.0% 57.8% 71.9% 66.1% 54.5% 70.0% 65.2%
50 Niagara Catholic DSB 79.5% 83.3% 82.1% 82.6% 83.6% 88.0% 78.3% 64.8% 85.9%
30.2 Nipissing-Parry Sound Catholic DSB 96.2% 97.2% 100.0% 64.3% 96.3% 80.0% 47.1% 72.2% 67.8%
30.1 Northeastern Catholic DSB 100.0% 100.0% 100.0% 75.0% 95.7% 93.3% 57.1% 45.9% 82.4%
33.1 Northwest Catholic DSB 84.6% 100.0% 89.2% 75.0% 85.7% 78.9% 37.5% 60.0% 50.0%
53 Ottawa-Carleton Catholic DSB 85.3% 90.9% 88.7% 85.2% 91.4% 88.8% 81.4% 88.9% 87.5%
25 Ottawa-Carleton DSB 95.6% 97.1% 100.0% 72.1% 67.9% 73.0% 44.5% 51.9% 51.1%
19 Peel DSB 100.0% 100.0% 100.0% 55.6% 73.3% 67.3% 78.6% 82.9% 83.5%
41 Peterborough V.N.C. Catholic DSB 92.7% 100.0% 100.0% 86.8% 81.8% 86.6% 75.0% 58.0% 82.9%
03 Rainbow DSB 73.0% 91.7% 83.8% 81.6% 84.8% 86.5% 41.4% 37.0% 51.9%
5.2 Rainy River DSB 95.2% 100.0% 100.0% 76.7% 70.4% 77.2% 20.8% 50.0% 51.2%
54 Renfrew County Catholic DSB 100.0% 97.2% 100.0% 66.7% 83.7% 81.1% 51.0% 60.0% 66.3%
28 Renfrew County DSB 97.9% 100.0% 100.0% 54.9% 76.9% 63.7% 22.7% 32.5% 39.7%
17 Simcoe County DSB 97.1% 98.0% 100.0% 60.7% 63.6% 69.5% 44.6% 62.3% 60.7%
44 Simcoe Muskoka Catholic DSB 100.0% 100.0% 100.0% 100.0% 100.0% 100.0% 92.2% 95.0% 95.3%
39 St. Clair Catholic DSB 100.0% 100.0% 100.0% 55.3% 73.7% 69.4% 70.1% 76.2% 82.4%
32 Sudbury Catholic DSB 63.0% 81.3% 70.0% 66.7% 54.7% 92.9% 9.1% 16.7% 17.0%
34.2 Superior North Catholic DSB 94.6% 100.0% 100.0% 30.3% 58.3% 42.2% 44.4% 28.6% 62.5%
6.2 Superior-Greenstone DSB 100.0% 90.9% 91.8% 46.2% 56.1% 53.6% 30.0% 48.0% 51.4%
11 Thames Valley DSB 89.8% 100.0% 100.0% 93.8% 100.0% 96.4% 57.8% 80.6% 70.3%
34.1 Thunder Bay Catholic DSB 96.8% 96.3% 100.0% 78.6% 86.5% 86.3% 82.4% 69.4% 88.7%
40 Toronto Catholic DSB 84.6% 88.0% 86.2% 64.0% 84.0% 76.8% 75.3% 77.3% 82.4%
12 Toronto DSB ***** 53.9% 72.1% 64.6% 57.7% 54.7% 59.7% 59.4% 65.5% 89.9%
15 Trillium Lakelands DSB 81.5% 88.4% 85.7% 96.2% 100.0% 97.9% 82.8% 85.5% 87.8%
26 Upper Canada DSB 100.0% 100.0% 100.0% 79.7% 84.0% 85.7% 66.7% 65.2% 76.1%
18 Upper Grand DSB 94.4% 97.7% 100.0% 86.0% 94.1% 89.3% 58.1% 60.0% 72.7%
49 Waterloo Catholic DSB 100.0% 92.0% 100.0% 69.2% 82.1% 73.2% 66.0% 61.4% 67.6%
24 Waterloo DSB 100.0% 94.3% 100.0% 67.6% 88.5% 75.1% 76.2% 76.4% 83.1%
48 Wellington Catholic DSB 75.0% 100.0% 83.0% 62.2% 88.2% 69.4% 73.7% 91.7% 78.1%
37 Windsor-Essex Catholic DSB 97.0% 100.0% 100.0% 76.9% 79.4% 81.2% 47.0% 61.8% 63.3%
42 York Catholic DSB 94.9% 97.1% 100.0% 82.6% 82.2% 86.6% 79.4% 72.5% 85.2%
16 York Region DSB 76.8% 85.4% 80.6% 93.8% 97.8% 96.4% 70.8% 83.6% 79.2%
Board Average 93.0% 96.1% 95.7% 70.1% 79.0% 76.8% 59.4% 65.5% 70.8%
* 1998-99 validation and approval rates include conditional approvals. Conditional approvals were discontinued in subsequent years.
** Boards that received an approval rate of equal to or greater than 95% in 1998-99 were adjusted to 100% approval rate for funding purposes.
*** Validation rates are calculated for ISA Level 2 and Level 3 separately, and are based on the reviewed sample of files. These rates do not include theadjustment for ISA Level 3 claims approved as ISA Level 2 claims.
**** Approval rates for 1999-2000 and 2000-01 refer to the combined rate for ISA Level 2 and Level 3. These rates include the adjustment of ISA Level3 claims approved as ISA Level 2 claims.
***** Toronto DSB - Actual results for 2000-01 are not used as TDSB provided only a partial claim. The substitute data based on the average approvalrate of the other 71 DSBs.
Max 100.0% 100.0% 100.0% 100.0% 100.0% 95.0%
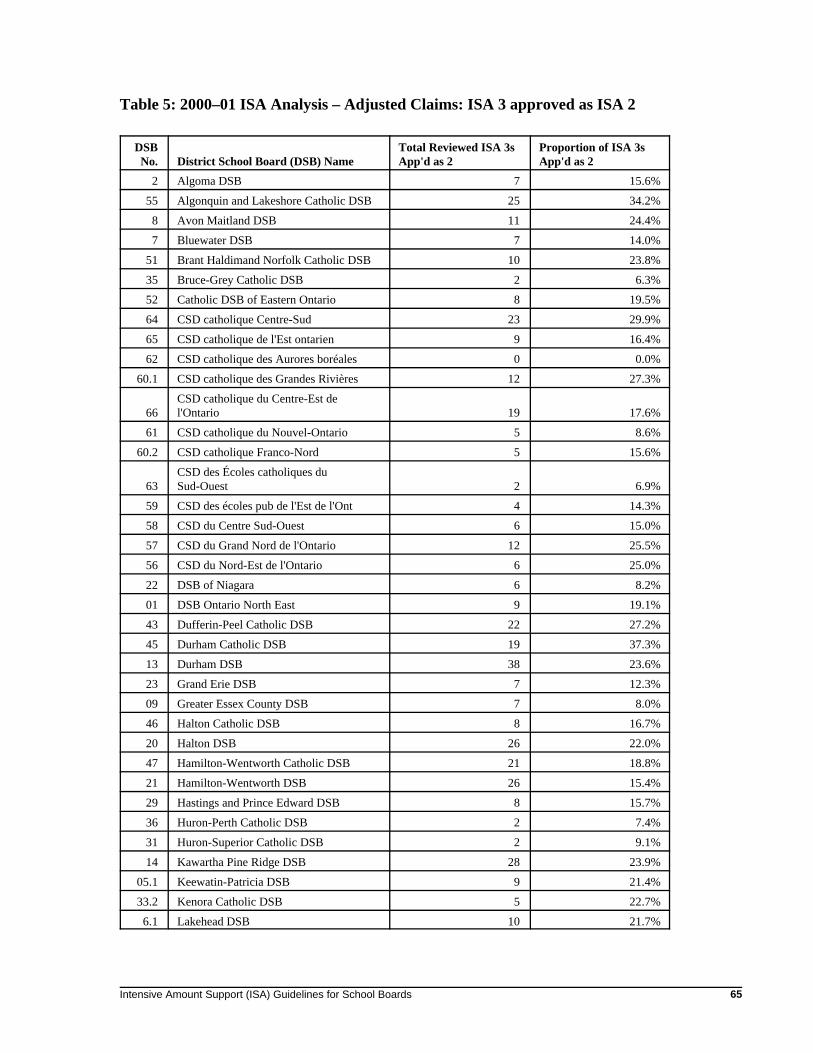
Intensive Amount Support (ISA) Guidelines for School Boards 65
Table 5: 2000–01 ISA Analysis – Adjusted Claims: ISA 3 approved as ISA 2
DSBNo. District School Board (DSB) Name
Total Reviewed ISA 3sApp'd as 2
Proportion of ISA 3sApp'd as 2
2 Algoma DSB 7 15.6%
55 Algonquin and Lakeshore Catholic DSB 25 34.2%
8 Avon Maitland DSB 11 24.4%
7 Bluewater DSB 7 14.0%
51 Brant Haldimand Norfolk Catholic DSB 10 23.8%
35 Bruce-Grey Catholic DSB 2 6.3%
52 Catholic DSB of Eastern Ontario 8 19.5%
64 CSD catholique Centre-Sud 23 29.9%
65 CSD catholique de l'Est ontarien 9 16.4%
62 CSD catholique des Aurores boréales 0 0.0%
60.1 CSD catholique des Grandes Rivières 12 27.3%
66CSD catholique du Centre-Est del'Ontario 19 17.6%
61 CSD catholique du Nouvel-Ontario 5 8.6%
60.2 CSD catholique Franco-Nord 5 15.6%
63CSD des Écoles catholiques duSud-Ouest 2 6.9%
59 CSD des écoles pub de l'Est de l'Ont 4 14.3%
58 CSD du Centre Sud-Ouest 6 15.0%
57 CSD du Grand Nord de l'Ontario 12 25.5%
56 CSD du Nord-Est de l'Ontario 6 25.0%
22 DSB of Niagara 6 8.2%
01 DSB Ontario North East 9 19.1%
43 Dufferin-Peel Catholic DSB 22 27.2%
45 Durham Catholic DSB 19 37.3%
13 Durham DSB 38 23.6%
23 Grand Erie DSB 7 12.3%
09 Greater Essex County DSB 7 8.0%
46 Halton Catholic DSB 8 16.7%
20 Halton DSB 26 22.0%
47 Hamilton-Wentworth Catholic DSB 21 18.8%
21 Hamilton-Wentworth DSB 26 15.4%
29 Hastings and Prince Edward DSB 8 15.7%
36 Huron-Perth Catholic DSB 2 7.4%
31 Huron-Superior Catholic DSB 2 9.1%
14 Kawartha Pine Ridge DSB 28 23.9%
05.1 Keewatin-Patricia DSB 9 21.4%
33.2 Kenora Catholic DSB 5 22.7%
6.1 Lakehead DSB 10 21.7%
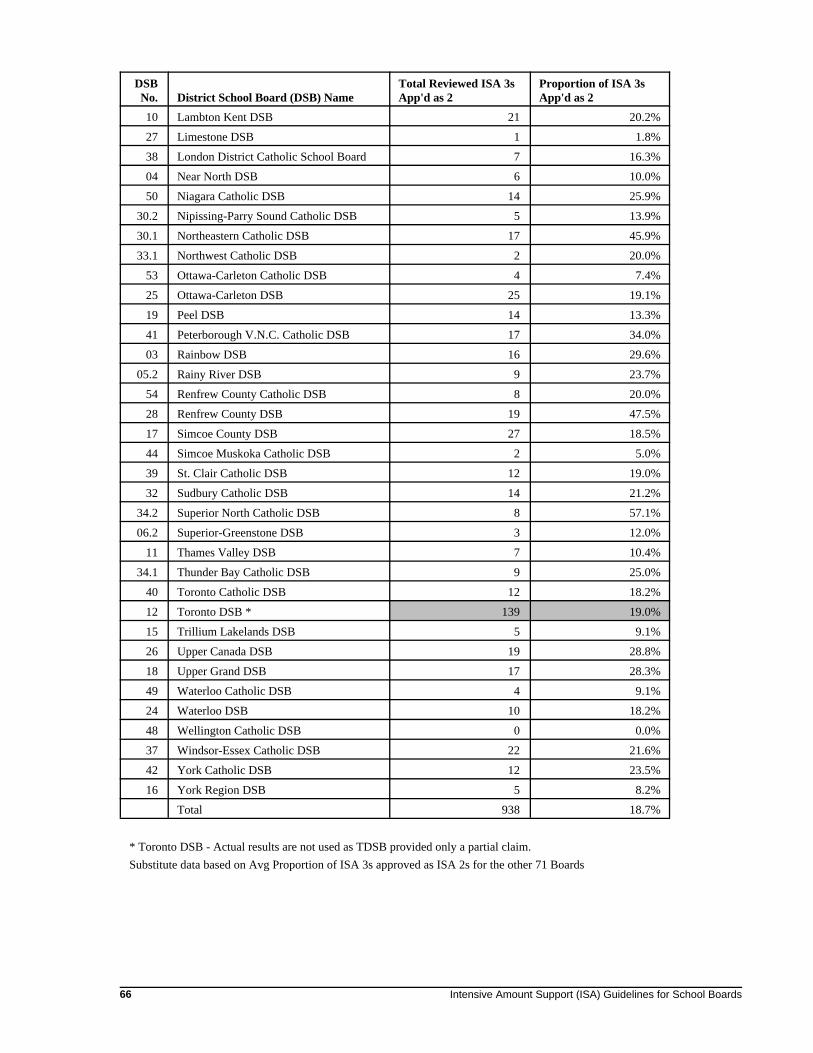
DSBNo. District School Board (DSB) Name
Total Reviewed ISA 3sApp'd as 2
Proportion of ISA 3sApp'd as 2
Intensive Amount Support (ISA) Guidelines for School Boards66
10 Lambton Kent DSB 21 20.2%
27 Limestone DSB 1 1.8%
38 London District Catholic School Board 7 16.3%
04 Near North DSB 6 10.0%
50 Niagara Catholic DSB 14 25.9%
30.2 Nipissing-Parry Sound Catholic DSB 5 13.9%
30.1 Northeastern Catholic DSB 17 45.9%
33.1 Northwest Catholic DSB 2 20.0%
53 Ottawa-Carleton Catholic DSB 4 7.4%
25 Ottawa-Carleton DSB 25 19.1%
19 Peel DSB 14 13.3%
41 Peterborough V.N.C. Catholic DSB 17 34.0%
03 Rainbow DSB 16 29.6%
05.2 Rainy River DSB 9 23.7%
54 Renfrew County Catholic DSB 8 20.0%
28 Renfrew County DSB 19 47.5%
17 Simcoe County DSB 27 18.5%
44 Simcoe Muskoka Catholic DSB 2 5.0%
39 St. Clair Catholic DSB 12 19.0%
32 Sudbury Catholic DSB 14 21.2%
34.2 Superior North Catholic DSB 8 57.1%
06.2 Superior-Greenstone DSB 3 12.0%
11 Thames Valley DSB 7 10.4%
34.1 Thunder Bay Catholic DSB 9 25.0%
40 Toronto Catholic DSB 12 18.2%
12 Toronto DSB * 139 19.0%
15 Trillium Lakelands DSB 5 9.1%
26 Upper Canada DSB 19 28.8%
18 Upper Grand DSB 17 28.3%
49 Waterloo Catholic DSB 4 9.1%
24 Waterloo DSB 10 18.2%
48 Wellington Catholic DSB 0 0.0%
37 Windsor-Essex Catholic DSB 22 21.6%
42 York Catholic DSB 12 23.5%
16 York Region DSB 5 8.2%
Total 938 18.7%
* Toronto DSB - Actual results are not used as TDSB provided only a partial claim. Substitute data based on Avg Proportion of ISA 3s approved as ISA 2s for the other 71 Boards
Intensive Amount Support (ISA) Guidelines for School Boards 67
Attachment 1: Method of ISA Audit and Analysis
Refinements in 2000
In 2000, refinements were made to the ISA audit implementation process to improveconsistency:
• The ministry expanded training for ISA validators and introduced inter-raterreliability testing.
• The ministry improved its sampling methods and expanded the sample size, toensure that results were more consistent.
• In 2000, the ministry audited a higher number of files to improve the statisticalvalidity of results. In 1999, validators audited 7,420 files (25 percent of claims). In2000, validators audited 9,768 files (31 percent of claims).
• The ministry also introduced more detailed requirements for documentation tosupport claims (notably concerning assessments).
These changes resulted in a more rigorous and consistent evaluation of ISA claims.
Audit Process in 2000
The ministry published the Resource Manual for the Special Education Grant IntensiveSupport Amount: Guidelines for School Boards 2000–2001. This resource manual waspublished in early March 2000, together with the grant regulations for school boardfunding in the 2000–01 school year.
The resource manual:
• explained the intent and process of the ministry’s audit of ISA eligibility criteria;
• set out eligibility criteria, including a prerequisite checklist and profiles for specificexceptionalities; and
• set out a method for calculating the level of intensive staff supports.
Ministry staff travelled throughout the province in March and April, providing training tospecial education staff of each school board concerning the intent, process, andrequirements of the audit.
In May and June, school boards used the prerequisite checklist and eligibility profiles (aspublished in the resource manual) to determine which students with special needs theywould submit a claim for under the refined criteria. Boards could claim students only ifthey were enrolled in the 1999–2000 school year.
Intensive Amount Support (ISA) Guidelines for School Boards68
For each file submitted, boards were required to provide documentation concerning thematch of the student to a specific profile. By matching students to these profiles, boardsidentified the students’ exceptionalities and level of need (ISA Level 2 or ISA Level 3).
Using the approved ministry form, boards also indicated, for each student claimed, thelevel of intensive staff support received by the student in the 1999–2000 school year.
ISA validators – special education experts under contract to the ministry – audited eachschool board’s claims.
Boards put forward claims for 31,615 students. It was not feasible or necessary to auditeach file. The validators audited sufficient numbers of each board’s claims to allowstatistically valid conclusions. In total, 9,768 files (31 percent of the total) were audited.
In small boards, the validators audited each file: in six boards (8 percent of boards), allfiles were audited.
In larger boards, the validators audited a statistically valid sample of files.
Methods Used to Determine Results
To develop the analysis of results of the audit, the ministry had to:
• project results from the samples of submissions audited by the validators to the entirepopulation of ISA files submitted by school boards, and
• adjust claims for files that would have been found eligible at a lower ISA level.
Projecting results from samples to the entire population:
In many boards, the ministry had validated data concerning only a sample of files claimed(the sample that the validators audited).
To support conclusions about the whole population of ISA files, the ministry had to useinformation from the audited samples to predict results for all the files submitted.
To reach conclusions about the number of eligible students, the ministry used validationrates of the audit samples for each board.
Adjusting claims for students eligible for a lower level of ISA:
In some instances, boards claimed that files met ISA Level 3 criteria, but validators notedthat although they did not meet Level 3 criteria, these files would have met the ISA Level2 criteria.

Intensive Amount Support (ISA) Guidelines for School Boards 69
Validators were authorized to approve these files as ISA Level 2. This direction affectedthe number of eligible files.

Intensive Amount Support (ISA) Guidelines for School Boards 71
Attachment 2: 2000–01 Funding Approach
The ministry has adapted its ISA funding approach for the 2000–01 school year toachieve two key objectives:
• to protect and improve programs and supports for students with special needs; and
• to ensure that funding is responsive to each board’s varying share of students withvery high needs.
In 1998–99, school boards received funding based on the results of the 1998 claim andaudit process or on ministry projections made at the time of the announcement of student-focused funding in 1998, whichever was higher. In 1999–2000, boards received the samelevel of funding for ISA Levels 2 and 3 as they received in 1998–99.
For the 2000–01 school year, to ensure stability of programs, the ministry continues toprovide funding for stability based on the funding results of past years. Boards arefunded on the basis of their highest result in 1998, 1999, or 2000. This means that manyboards are receiving funding in addition to the level generated by eligible claims in 2000.
This approach was implemented in all but five boards. These five boards had higherresults in 1999 than in 2000. However, funding on the full amount of their 1999 resultswould have meant funding these boards in excess of 100 percent approval of their claimsin 2000.
As these boards showed a higher level of need in 1999 than in 2000, as with other boards,the ministry recognized the higher level of need – but only up to the level claimed in2000.
These five boards were funded as if their claims in 2000 had been validated at 100percent. They have higher funding amounts in 2000–01 than they had in 1999–2000.
This 2000-01 approach to funding will generate approximately $47 million in additionalISA support for 2000–01.

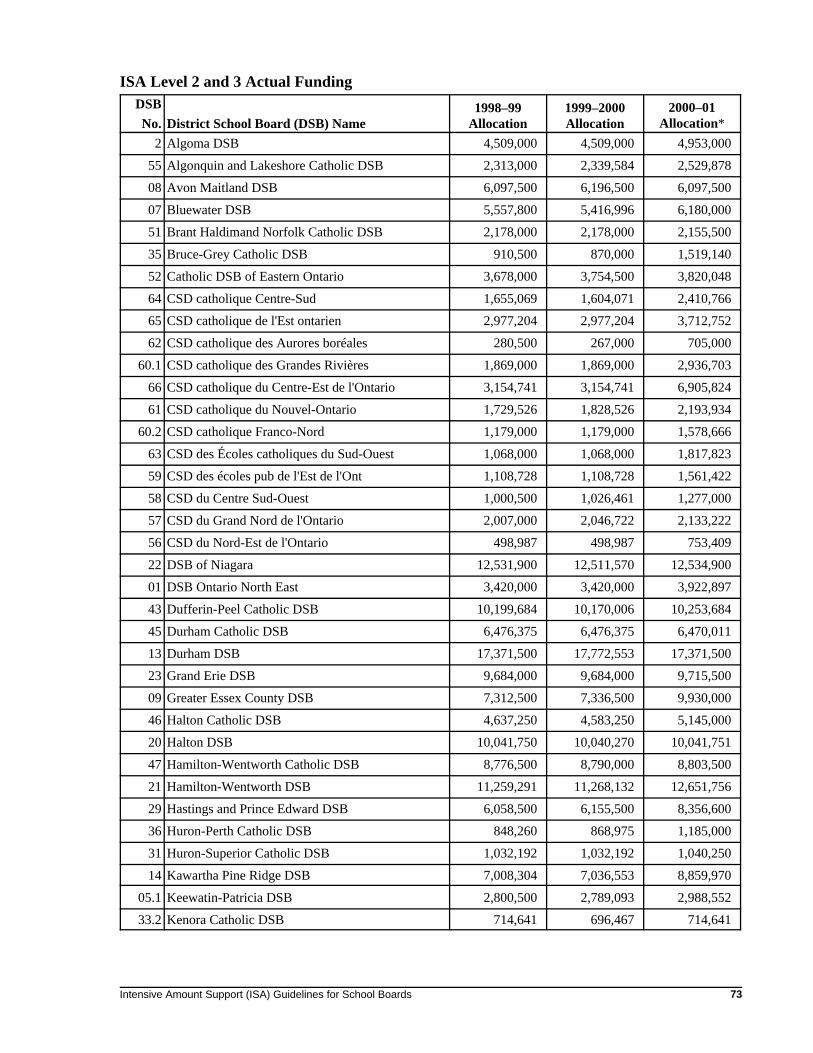
Intensive Amount Support (ISA) Guidelines for School Boards 73
ISA Level 2 and 3 Actual FundingDSBNo. District School Board (DSB) Name
1998–99Allocation
1999–2000Allocation
2000–01Allocation*
2 Algoma DSB 4,509,000 4,509,000 4,953,000
55 Algonquin and Lakeshore Catholic DSB 2,313,000 2,339,584 2,529,878
08 Avon Maitland DSB 6,097,500 6,196,500 6,097,500
07 Bluewater DSB 5,557,800 5,416,996 6,180,000
51 Brant Haldimand Norfolk Catholic DSB 2,178,000 2,178,000 2,155,500
35 Bruce-Grey Catholic DSB 910,500 870,000 1,519,140
52 Catholic DSB of Eastern Ontario 3,678,000 3,754,500 3,820,048
64 CSD catholique Centre-Sud 1,655,069 1,604,071 2,410,766
65 CSD catholique de l'Est ontarien 2,977,204 2,977,204 3,712,752
62 CSD catholique des Aurores boréales 280,500 267,000 705,000
60.1 CSD catholique des Grandes Rivières 1,869,000 1,869,000 2,936,703
66 CSD catholique du Centre-Est de l'Ontario 3,154,741 3,154,741 6,905,824
61 CSD catholique du Nouvel-Ontario 1,729,526 1,828,526 2,193,934
60.2 CSD catholique Franco-Nord 1,179,000 1,179,000 1,578,666
63 CSD des Écoles catholiques du Sud-Ouest 1,068,000 1,068,000 1,817,823
59 CSD des écoles pub de l'Est de l'Ont 1,108,728 1,108,728 1,561,422
58 CSD du Centre Sud-Ouest 1,000,500 1,026,461 1,277,000
57 CSD du Grand Nord de l'Ontario 2,007,000 2,046,722 2,133,222
56 CSD du Nord-Est de l'Ontario 498,987 498,987 753,409
22 DSB of Niagara 12,531,900 12,511,570 12,534,900
01 DSB Ontario North East 3,420,000 3,420,000 3,922,897
43 Dufferin-Peel Catholic DSB 10,199,684 10,170,006 10,253,684
45 Durham Catholic DSB 6,476,375 6,476,375 6,470,011
13 Durham DSB 17,371,500 17,772,553 17,371,500
23 Grand Erie DSB 9,684,000 9,684,000 9,715,500
09 Greater Essex County DSB 7,312,500 7,336,500 9,930,000
46 Halton Catholic DSB 4,637,250 4,583,250 5,145,000
20 Halton DSB 10,041,750 10,040,270 10,041,751
47 Hamilton-Wentworth Catholic DSB 8,776,500 8,790,000 8,803,500
21 Hamilton-Wentworth DSB 11,259,291 11,268,132 12,651,756
29 Hastings and Prince Edward DSB 6,058,500 6,155,500 8,356,600
36 Huron-Perth Catholic DSB 848,260 868,975 1,185,000
31 Huron-Superior Catholic DSB 1,032,192 1,032,192 1,040,250
14 Kawartha Pine Ridge DSB 7,008,304 7,036,553 8,859,970
05.1 Keewatin-Patricia DSB 2,800,500 2,789,093 2,988,552
33.2 Kenora Catholic DSB 714,641 696,467 714,641
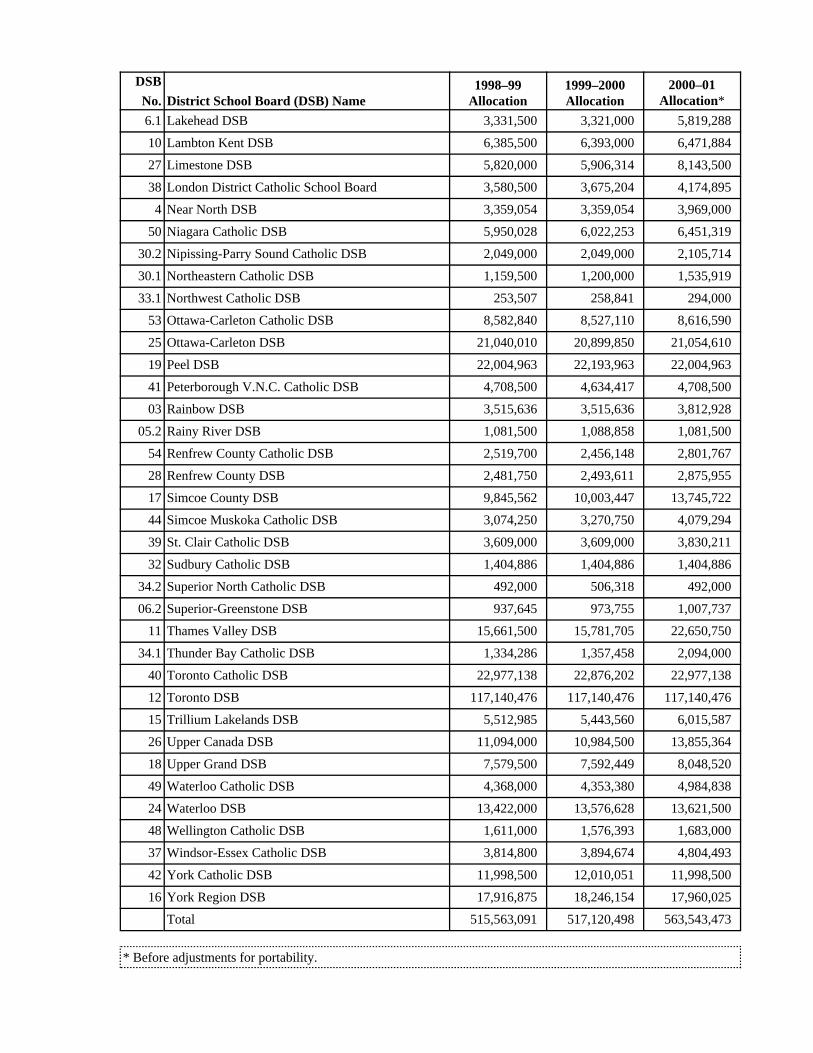
DSBNo. District School Board (DSB) Name
1998–99Allocation
1999–2000Allocation
2000–01Allocation*
6.1 Lakehead DSB 3,331,500 3,321,000 5,819,288
10 Lambton Kent DSB 6,385,500 6,393,000 6,471,884
27 Limestone DSB 5,820,000 5,906,314 8,143,500
38 London District Catholic School Board 3,580,500 3,675,204 4,174,895
4 Near North DSB 3,359,054 3,359,054 3,969,000
50 Niagara Catholic DSB 5,950,028 6,022,253 6,451,319
30.2 Nipissing-Parry Sound Catholic DSB 2,049,000 2,049,000 2,105,714
30.1 Northeastern Catholic DSB 1,159,500 1,200,000 1,535,919
33.1 Northwest Catholic DSB 253,507 258,841 294,000
53 Ottawa-Carleton Catholic DSB 8,582,840 8,527,110 8,616,590
25 Ottawa-Carleton DSB 21,040,010 20,899,850 21,054,610
19 Peel DSB 22,004,963 22,193,963 22,004,963
41 Peterborough V.N.C. Catholic DSB 4,708,500 4,634,417 4,708,500
03 Rainbow DSB 3,515,636 3,515,636 3,812,928
05.2 Rainy River DSB 1,081,500 1,088,858 1,081,500
54 Renfrew County Catholic DSB 2,519,700 2,456,148 2,801,767
28 Renfrew County DSB 2,481,750 2,493,611 2,875,955
17 Simcoe County DSB 9,845,562 10,003,447 13,745,722
44 Simcoe Muskoka Catholic DSB 3,074,250 3,270,750 4,079,294
39 St. Clair Catholic DSB 3,609,000 3,609,000 3,830,211
32 Sudbury Catholic DSB 1,404,886 1,404,886 1,404,886
34.2 Superior North Catholic DSB 492,000 506,318 492,000
06.2 Superior-Greenstone DSB 937,645 973,755 1,007,737
11 Thames Valley DSB 15,661,500 15,781,705 22,650,750
34.1 Thunder Bay Catholic DSB 1,334,286 1,357,458 2,094,000
40 Toronto Catholic DSB 22,977,138 22,876,202 22,977,138
12 Toronto DSB 117,140,476 117,140,476 117,140,476
15 Trillium Lakelands DSB 5,512,985 5,443,560 6,015,587
26 Upper Canada DSB 11,094,000 10,984,500 13,855,364
18 Upper Grand DSB 7,579,500 7,592,449 8,048,520
49 Waterloo Catholic DSB 4,368,000 4,353,380 4,984,838
24 Waterloo DSB 13,422,000 13,576,628 13,621,500
48 Wellington Catholic DSB 1,611,000 1,576,393 1,683,000
37 Windsor-Essex Catholic DSB 3,814,800 3,894,674 4,804,493
42 York Catholic DSB 11,998,500 12,010,051 11,998,500
16 York Region DSB 17,916,875 18,246,154 17,960,025
Total 515,563,091 517,120,498 563,543,473
* Before adjustments for portability.