interim performance presentation - beranda · interim performance presentation ... notes: • fy...
TRANSCRIPT
1
1
15-May-07 5:46 PM Unique id: 036458 Documentum: GARL-Pegasus-Main.ppt
Interim Performance PresentationQ1 2007 : quarter ended 31st March 2007
15th May 2007

2
2
SECTION 1 Executive Summary 3
SECTION 2 Financial Highlights 5
SECTION 3 Operational Highlights 11
SECTION 4 Sales Highlights 16
SECTION 5 Growth Strategy 21
SECTION 6 Key Developments 26
Table of Contents
Section 1Executive Summary

4
4
Executive Summary
EBITDA US$ 88mn
Average CPO Price (FOB Belawan)
Net income
US$ 546/ton
Interim Dividend
Equity Placement
Palm Products Production 412,000 ton
43%
12%
46%
US$ 219mn 63%
S$0.02
325.3mn shares S$ 800mn
�
Q1 2007 vs. Q1 2006

Section 2Financial Highlights
6
6
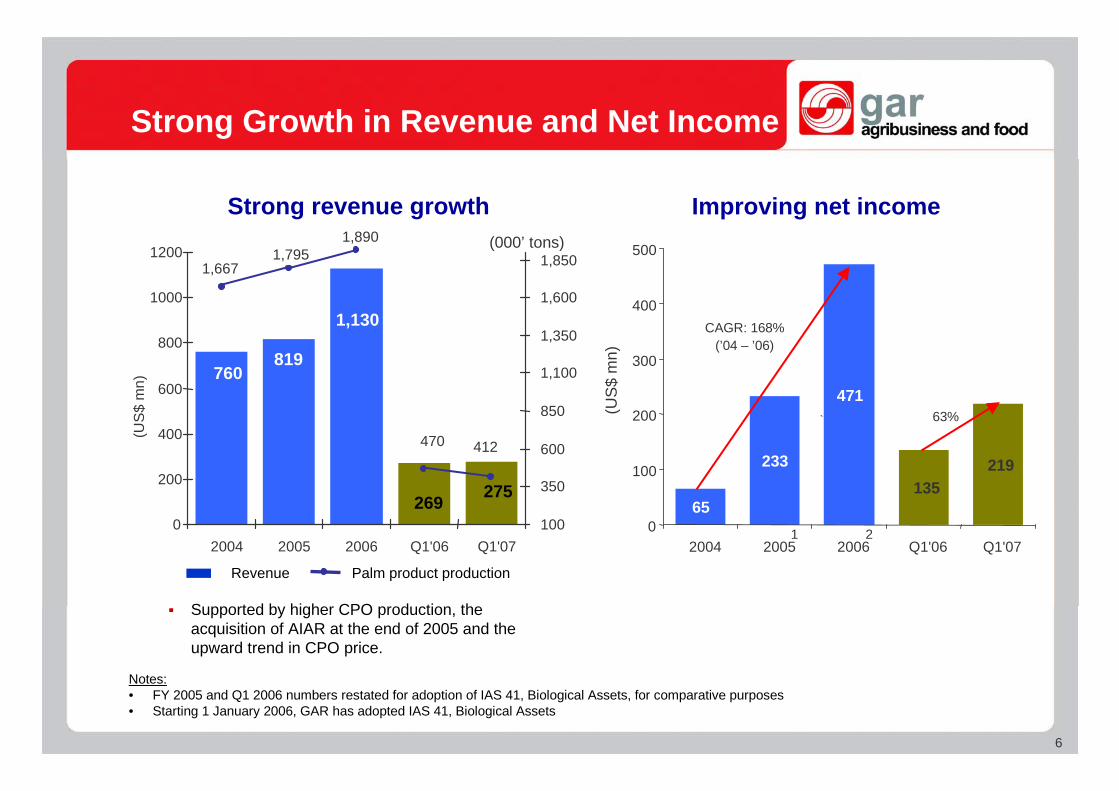
Strong revenue growth
Strong Growth in Revenue and Net Income
Supported by higher CPO production, theacquisition of AIAR at the end of 2005 and theupward trend in CPO price.
Notes:• FY 2005 and Q1 2006 numbers restated for adoption of IAS 41, Biological Assets, for comparative purposes• Starting 1 January 2006, GAR has adopted IAS 41, Biological Assets
Improving net income
65
233
471
219135
0
100
200
300
400
500
2004 2005 2006 Q1'06 Q1'07
(US
$ m
n)
`
CAGR: 168%(’04 – ’06)
21
63%
CAGR: 22%(’04 – ’06)
(US
$ m
n)
(000’ tons)
275269
1,130
819760
412470
1,8901,795
1,667
0
200
400
600
800
1000
1200
2004 2005 2006 Q1'06 Q1'07100
350
600
850
1,100
1,350
1,600
1,850
Revenue Palm product production

7
7
Revenue 268.7 275.3 2.5%Gross profit 67.6 102.7 51.9%Gross profit Margin 25.1% 37.3% 48.6%Net gain from biological assets 178.1 164.9 (7.4%)Operating income 224.9 242.2 7.7%EBITDA 61.6 88.2 43.3%Tax (56.2) (62.3) 10.9%Net profit attributable to the equity holders 134.7 219.3 62.8%EPS (in US$ cents) 6.2 10.1 62.8%Interim dividend per share (in S$) - 0.02 n.m.
Financial Performance
Note:• Starting 1 January 2006, GAR has adopted IAS 41, Agriculture. Q1 2006 numbers restated for adoption of IAS 41, Agriculture, for comparative
purposes.
(in US$ mn) Q1 Q1 %2006 1 2007
increase/(decrease)

8
8
Revenue 184.6 203.6 10.3% 84.2 71.7 (14.7%)
Gross Profit 60.0 89.9 49.7% 7.5 12.8 69.5%
Gross Profit Margin 32.5% 44.1% 35.7% 8.9% 17.8% 100.0%
EBITDA 55.7 76.4 37.1% 5.9 11.8 102.1%
Profit Before Tax 213.7 291.3 36.3% 3.6 10.3 184.5%
Net Income 131.1 209.1 59.5% 3.6 10.2 186.6%
Q1 ~ 2007 Financial Performance
(in US$ mn) Indonesia Operation China OperationQ1 2006 Q1 2007 % increase/ Q1 2006 Q1 2007 % increase/
decrease decrease

9
9
Total Assets 2,985.4 3,303.3 10.6%Cash 130.4 62.7 (51.9%)Short Term Investment 3.7 10.3 180.3%
Total Liabilities 1,064.1 1,142.5 7.4%Interest Bearing Debt 477.4 514.6 7.8%
Total Equity 1,921.3 2,160.8 12.5%
Debt2/Equity Ratio (x) 0.25 0.24Net Debt/Equity Ratio (x) 0.18 0.20
Financial Position
Notes:• Starting 1 January 2006, GAR has adopted IAS 41, Biological Assets. Q1 2006 results are restated for adoption of IAS 41, Biological Assets, for
comparative purposes.• Interest bearing debt
(in US$ mn) FY Q1 %2006 1 2007
increase/(decrease)
Continuous growth in total assets with a low gearing ratio

10
10
Dividend
1.0
2.12.0
0.0
0.5
1.0
1.5
2.0
2.5
FY 05 FY 06 Q1 07
S$
Cen
ts P
er S
hare
Dividend Per Share
GAR has been increasing the dividend payout to shareholders and will always evaluatethe optimum utilization of its income
1
1 Equivalent to US$ 0.014/share for FY 2006 dividend

Section 3Operational Highlights

12
12
Planted Area 306,851 293,145 338,185 15.4%Nucleus 226,185 213,365 257,507 20.7%Plasma 80,666 79,780 80,678 1.1%
Mature Area 271,140 275,436 292,609 6.2%Nucleus 192,903 197,213 213,828 8.4%Plasma 78,237 78,223 78,781 0.7%
Land Bank 200,000 120,000 1,300,0001 983.3%
Operational Performance ~ Area
Note:• Include land acquisition in progress of approximately 1,100,000ha (plantable area) located in Kalimantan (100,000ha) and Papua (1,000,000ha)
(in ha) 31 Dec Q1 Q1 Q1’06 – Q1’072006 2006 2007 %increase/(decrease)

13
13
Operational Performance ~ Production
(000’Tons) (Ton/Ha)
Drought condition due to El Nino effect caused a decrease in productivity during Q12007
In April’07, the production started to recover, hence higher production is expected in thefollowing quarters.
3,769 4,191 4,275 4,377
1,068 1,043
1,2031,463 1,595 1,624
394 337
0
1,000
2,000
3,000
4,000
5,000
6,000
7,000
2003 2004 2005 2006 Q1'06 Q1'07
FFB Production ~ Nucleus FFB Production ~ Plasma
(000’Tons)
FFB Production Palm Products Production
1,176
257
337386
1,4791,367
1,553
7584
337315299
5.31 4.72
22.1321.4320.23
18.37
-
250
500
750
1,000
1,250
1,500
1,750
2,000
2003 2004 2005 2006 Q1'06 Q1'07-
4
8
12
16
20
24
CPO (Ton) PK (Ton) FFB Yield (Ton/Ha)
14
14
1,225
1,392
1,5541,624
1,348 1,380
1,5671,462
1,699
-
200
400
600
800
1,000
1,200
1,400
1,600
1,800
Q1 2005 Q2 2005 Q3 2005 Q4 2005 Q1 2006 Q2 2006 Q3 2006 Q4 2006 Q1 2007
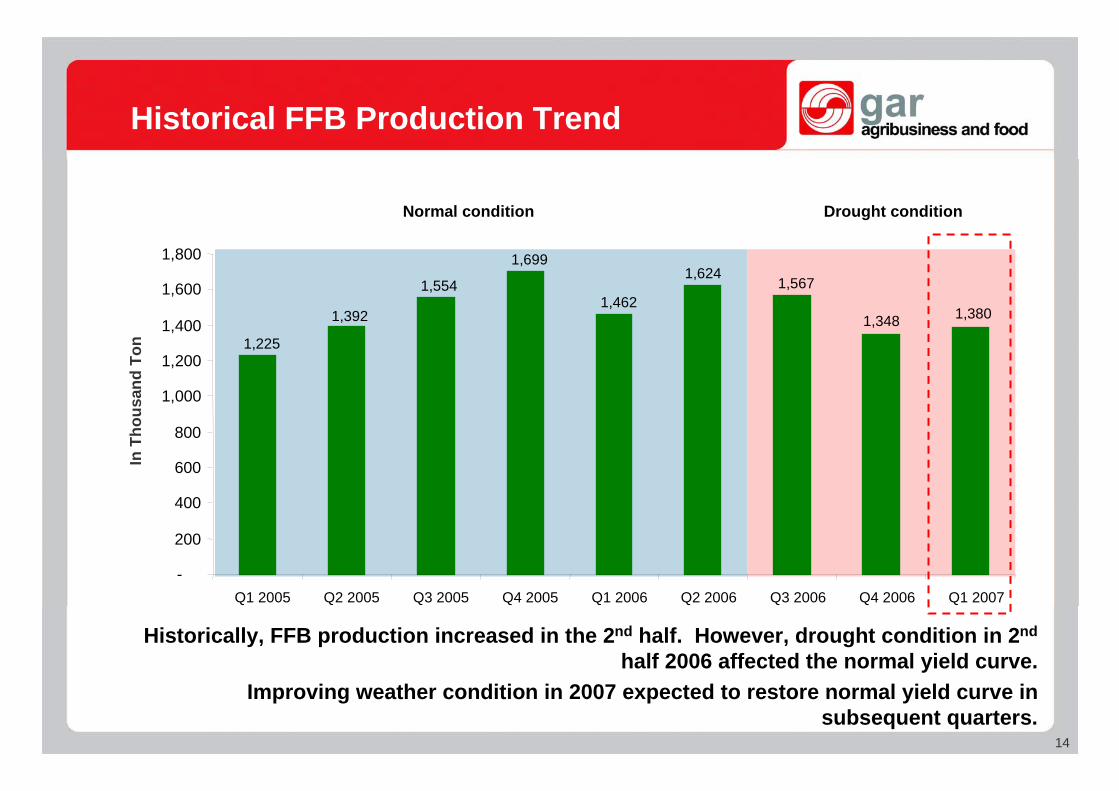
Historical FFB Production Trend
Normal condition Drought condition
In T
hous
and
Ton
Historically, FFB production increased in the 2nd half. However, drought condition in 2nd
half 2006 affected the normal yield curve.Improving weather condition in 2007 expected to restore normal yield curve in
subsequent quarters.

15
15
FFB Production (tons) 1,461,752 1,380,077 (5.6%)FFB Yield (ton/ha) 5.3 4.7 (11.1%)
Extraction RateOER 23.60% 23.62%KER 5.11% 5.24%
Palm Products Production (tons) 470,042 411,727 (12.4%)CPO (tons) 386,382 336,955 (12.8%)PK (tons) 83,660 74,772 (10.6%)
Utilization RateIndonesia Refinery 77.4% 69.2%China Refinery 57.7% 58.7%China Crushing 82.0% 54.0%
Soybean Processed (tons)Soybean Oil (tons) 37,006 24,534 (33.7%)Soybean Meal (tons) 166,023 110,135 (33.7%)
Operational Performance ~ Production
Q1 Q1 %2006 2007 increase/ (decrease)

Section 4Sales Highlights

17
17
Business Performance
Indonesia Operation ~ By Products
Revenue contribution
China Operation ~ By Products
China Local26% Indonesia
Local40%
Indonesia Export
34%
Unbranded palm products
35%
Branded products
11% PK 3%
CPO51%
Others1%
Soybean meal40%
Branded products
9%
Unbranded palm products
15%
Soybean oil35%
PK2%
Branded products
11%
Soybeanoil9%
Others1%
Unbranded palm product
30%
Soybeanmeal10%
CPO37%
Revenue contribution ~ By Products

18
18
Indonesia OperationCPO 247,000 225,000 (8.7%)PK 37,000 23,000 (38.1%)Refined Products 217,000 206,000 (5.1%)
BrandedCooking Oil 21,000 18,000 (14.4%)Margarine 11,000 13,000 15.5%
Unbranded 176,000 160,000 (9.1%)
China OperationBranded Cooking Oil 10,000 7,000 (30.0%)Unbranded:
Soybean Oil 44,000 30,000 (31.8%)Soybean Meal 172,000 106,000 (38.4%)Palm oil based 9,000 15,000 66.7%
Sales Volume
Q1 Q1 %2006 2007 increase/ (decrease)

19
19
$100
$200
$300
$400
$500
$600
$700
$800
$900
Jan-06
Feb-06
Mar-06
Apr-06
May-06
Jun-06
Jul-06
Aug-06
Sep-06
Oct-06
Nov-06
Dec-06
Jan-07
Feb-07
Mar-07
Apr-07
May-07
CPO (CIF Rotterdam) Soybean Oil (Dutch, FOB ex mill)
CPO Price Trend
Sources : Oil World & Reuters
China lifted quotaimport on palm oil
El-Nino effect reduceproduction
India’s CPO importtax reduced
New demand from bio-dieselUS$/Ton

20
20
Bio-diesel Capacity
Local market isheated in 1-2 years
New capacity in 2007 is at 1.6 million ton
Company Plant locationSize
(tonnes) Completion
date Company CommentSize
(tonnes) Completion
dateLipid Tech Sdn. Bhd Port Klang, Selangor 12,000 Jun 2008 Darmex Oil 200,000 n.aGolden Hope Banting, Selangor 35,000 Completed Sumi Asih Group 2,000 tonslyr and increase gradually 200,000 2009Carotech Chemor, Perak 48,000 n.a. Sari Dumai Sejati Part of larger company 100,000 naCaratino (JV with MPOB) Pasir Gudang, Johor 60,000 Completed Indo Bio Fuels Focus on biodiesel conversion tech. 100,000 n.aGolden Hope (JV with MPOB) Carey Island, Selangor 60,000 1H2007 Asianagro Part of Raja Garuda Mas. 150,000 naGolden Hope Pasir Gudang, Johor 60,000 2007 Molindo Raya Ind'IIPT PNX Increase from current 30,000 to 40,000T 40,000 2007IJM Plantations Sandakan, Sabah 90,000 Q4 2007 Eterindo Wahanatama Producing 22,000 T, supply to Pertamina 200,000 2008/2009PPB Group Pasir Gudang, Johor 100,000 early 2007 PT Mopoli 1 of 4 plants to start in 2007 (Apindo) 150,000 2007SPC Biodiesel Lahad Datu, Sabah 100,000 end-2007 Sinar Mas Citic 1 of 4 plants to start in 2007 (Apindo) 100,000 2007Mission Biotechnologies Kuantan, Pahang 100,000 July 2007 PT Musimas 1 of 4 plants to start in 2007 (Apindo) 100,000 2007Global Bonanza Sdn Bhd Kuching, Sarawak 100,000 June 2007 PT Sumiasih 1 of 4 plants to start in 2007 (Apindo) 60,000 2007GS Palm Sdn Bhd Masai, Johor 100,000 Q3 2007 Energi Alternative Indonesia 300 ProducingAchi Jaya Plantations Segamat, Johor 100,000 end-2007 PT Rekayasa and Pertamina 5,000 2006Pacific Bio-Energy Sdn Bhd Lahad Datu, Sabah 100,000 n.a. Astra Agra Trial stage for in-house use 5,000 2007Kulim (jv with Cremer) Pasir Gudang, Johor 100,000 2007 Wahana Abadi Tirta A clean water management company 30,000 n.aKulim (jv with Cremer) Singapore 100,000 2007 Anugerah Inti Gemanusa 50,000 naEmpee Industries Bhd Kuantan, Pahang 100,000 n.a. Artha Trans Jaya 1,200 naTSH Resources Sabah 100,000 n.a. Wilmar Bioenergi 150,000 T in 2007 250,000 2008Zurex Lahad Datu, Sabah 200,000 Q1 2008 Makindo related Potential for litigation 100,000 naHimpunan Sari Sdn. Bhd Kemamam, Terengganu 200,000 June 2007 Government projects 4x6,000 tons and 4x3,000 tons 36,000 n.aTotal Malaysia 1,865,000 Total Indonesia 1,877,500
Diesel Diesel(mn tonnes) Consumed for Transportation B5 B10
Malaysia 8.7 4.6 0.4 0.9 Indonesia 30.4 8.0 1.5 3.0 Total 39.1 12.6 1.9 3.9

Section 5Growth Strategy

22
22
Growth Strategy
Commitment to sound business strategies and continuous operationalexcellence will enable GAR to sustain growth and profitability
Food Industrial Bio-Fuel
Strong Plantation FoundationLargest in the world with 338,000 ha planted
ContinuedGrowth and Profitability
Future expansion of 1.3 mn ha land bank
23
23
Q1 2007 Growth Achievements and Targets
PlantationTarget planted area of 40,000 ha for FY 2007Achieved additional planted area of 31,000 ha during Q1 07
- 3,000 ha of new planting- 28,000 ha of acquired plantation
DownstreamCompleted new speciality fat factory in Ningbo, China with capacity of 44,000 ton/yearCompleted conversion of Surabaya and Medan refineries energy source from diesel to coal in April07New refinery in Tarjun, South Kalimantan with capacity of 300,000ton/year under constructionNew Cocoa Butter Substitute facility in Belawan, Indonesia with capacity of 30,000 ton/year underconstruction
Bio-dieselSigned a MOU with CNOOC and HK Energy to develop bio-diesel and bio-ethanol.Expected investment of US$ 5.5bn over 8 years.On May 3, 2007, signed a JV agreement with Fulcrum Biofuels LLC to establish a bio-diesel plant inDumai, Indonesia with USA as a market

24
24
Bio-diesel JV ~ Transaction Highlights
Parties : Blue Sky Golden Fulcrum Ltd (wholly owned subsidiary of GAR)~ (50%)
Fulcrum Biofuels LLC ~ (50%)
Purpose : To initially build and operate a bio-diesel plant in Dumai, Sumatra,Indonesia and market the bio-diesel in the US market
Capacity : 400,000MT per annum, expected to be fully operation in 2008
Cost : US$ 60m, include working capital

25
25
GAR Fulcrum
JV Co.
Biodiesel plant atDumai
End CustomersCalifornia, USA
50% 50%
Partnership to enter into growing US bio-diesel market
Strong synergies between GAR’s CPO supply advantage and Fulcrum’s Logistics andMarketing expertise
The JV will be entitled to the tax credit of approx. US$ 300/ton
Bio-diesel JV Structure
• 200,000 tons p.a. first 3yrs, then 100,000 tonsp.a. on year 4-5 at US$585/ton
• Additional 200,000 tonp.a. at floating price
• Logistics & marketing• Hedging & Risk
management• Guaranteed EBITDA/ton
of US$ 75/ton for200,000 ton p.a. for min.3 years

Section 6Key Developments

27
27
Equity Placement ~ Transaction Highlights
Deal type : Placement of new shares (Reg S only)
Placement price : S$ 2.4588 (7.22% discount to the closing price on 19th April2007)
Size of the deal : 325,300,000 new shares(representing 15% of pre-placement share capital)
S$ 800m or equivalent to US$ 530mn
Use of proceeds : To finance GAR’s capital expenditure and general corporatepurposes
Total institutional accounts : > 80
Placement date : 19th April 2007
Joint Bookrunner & : BNP Paribas (Singapore) Ltd, CIMB-GK Securities Pte. Ltd.Placement Agent and Oversea-Chinese Banking Corporation Limited

28
28
Equity Placement ~ Demand Analysis
Demand by investor type Demand by geography
Book of demand comprised mainly institutional investors with Long Funds dominating with63% contributionPrivate banking demand was mainly discretionarily managed portfoliosEurope and UK investors represented 63% buyers
Private bank13%
Hedge fund21%
Bank3%
Long fund63%
USA5% Others
3%
Singapore28%
HK1%
UK25%
Europe38%

29
29
Contact Us
Golden Agri-Resources Ltdc/o 3 Shenton Way#17-03 Shenton HouseSingapore 068805
Telephone : +65 62207720Facsimile : +65 62207020
Contact Person : Rafael B. Concepcion, Jr. ([email protected])Suwandy Chen ([email protected])
If you need further information, please contact: