international bank for reconstruci1on...
TRANSCRIPT
RESTRICTED
Report No. PA-64a
Thds report b for offidil use only by the lank Gioup and specifafly authotized orpnizationsor penonL t nmay not be pubiished, quoted or cited without Bank Group authorization. TheBank Group does not accept teaponsibRity for the accuracy or completeness of the report.
INTERNATIONAL BANK FOR RECONSTRUCI1ON AND DEVELOPMENT
INTERNATIONAL DEVELOPMENT ASSOCIATION
APPRAISAL OF
A WHEAT STORAGE PROJE
INDIA
June 15, 1971
Agriculture Projects Department
Pub
lic D
iscl
osur
e A
utho
rized
Pub
lic D
iscl
osur
e A
utho
rized
Pub
lic D
iscl
osur
e A
utho
rized
Pub
lic D
iscl
osur
e A
utho
rized
CURRENCY B2UIVALENTS
US$ 1.00 - Rupees (Rs) 7.50Rs1 = US$ 0.13Rs 1 million = US$ 133,333
WEIGHTS AND MEASURES
1 m ton = 1000 kg1 kg = 2.20 lb1 meter = 3.28 ft
ABBREVIATIONS
GOI = Government of IndiaFCI = Food Corporation of India

INDIA
WHEAT STORAGE PROJECT
TABLE OF CONTENTS
Page No.
SUMMARY AND CONCLUSIONS .............................- i
I. INTRODUCTION .................. . ........ 1 ...... 1
II. BACKGROUND ............................................ 1
A. Foodgrain Production Trends . .. 1B. Public Distribution of Foodgrains . . 4C. All-India Public Storage Requirements. 5
III. THE PROJECT AREA. 6
IV. THE PROJECT. 7
A. Project Description . . ...................... .. 7B. Technical Features .... 8
Site Selection.... 8Flat Storage (Godowns).... 8Silos.... 8Technical Training.... 9All-India Grain Storage and Distribution Study 9
C. Construction Schedule.... 9D. Cost Estimates ... 10E. Proposed Financing .... 11F. Procurement .... 11G. Disbursement . ... 12
V. ORGANIZATION AND MANAGEMENT .. 12
A. Operations of the Food Corporation of India 12B. Cost Control ... 13C. Accounts and Audit .14
VI. STORAGE, OPERATION AND DISTRIBUTION COSTS . .14
VII. BENEFITS AND JUSTIFICATION .15
A. Choice of Location .. 15B. Choice of Storage Method - Godown Versus Silo 16C. Economic Rate of Return .16
This report is based on the findings of an IDA mission in March/April 1970,composed of Messrs. L. Helmers, S. Reutlinger and Miss J. Noel (IDA); Messrs.R. Crofts and H. Heckman (IDA consultants); and L. Werin (Swedish Governmentconsultant).
-2-
Page No.
VIII. RECOMMENDATIONS ....................................... 18
ANNEXES
1. Gross Production of Foodgrains2. Net Production, Imports, Stock Changes and Consumption of Foodgrains3. Graph of Net Production and Consumption of Foodgrains4. Wholesale Price Index Numbers - Foodgrains and Manufactures5. Public Distribution of Foodgrains
Table 1 - Public Distribution, Local Procurement and ImportsTable 2 - Total Public Procurement and Public Distribution by
State and Main Foodgrains6. Total Public Storage Capacity and Stocks7. Analysis of Operational Storage Requirements
Table 1 - Storage Capacity Required for Operating Public Distri-bution System
8. Technical Specifications for Godowns and SilosFigure 1 - Example of Godown DesignFigure 2 - Example of Silo Design
9. Tentative Location of Godowns and Silos10. Site Selection Criteria11. All-India Grain Storage and Distribution Study12. Time Schedule, Godown and Silo Construction13. Construction Costs of Godowns and Silos14. Estimated Schedule of Disbursements15. The Food Corporation of India
Table 1 - Storage Capacity, Foodgrain Stocks and Sales of theFood Corporation of India
Table 2 - Balance Sheets of the Food Corporation of IndiaTable 3 - Profit and Loss Statements of the Food Corporation of
IndiaFigure 1 - Organization Chart of the Food Corporation of India
16. Storage and Distribution Cost17. Analysis of Godown Storage Versus Silo Storage18. Grain Storage Losses19. Incremental Return Analysis of Godown Storage Versus Silo Storage20. Economic Rate of Return of Proposed Facilities21. Economic Rate of Return of Facilities Used for Contingency Stock Opera-
tionsTable 1 - Benefits of Domestic SalesTable 2 - Import Price Savings
MAP - Location of Proposed Storage Facilities

INDIA
WHEAT STORAGE PROJECT
SUMMARY AND CONCLUSIONS
i. This report contains the appraisal of a wheat storage project which
would be the first Bank Group project for grain storage facilities in India.The total project cost is US$15.9 million. The Swedish Government hasoffered to contribute US$5.0 million and the proposed IDA credit would also
be for US$5.0 million. Although IDA and the Swedish Government would finance
different components, the Association would supervise the execution of the
entire project.
ii. Total foodgrain production in India is at present about 94 million
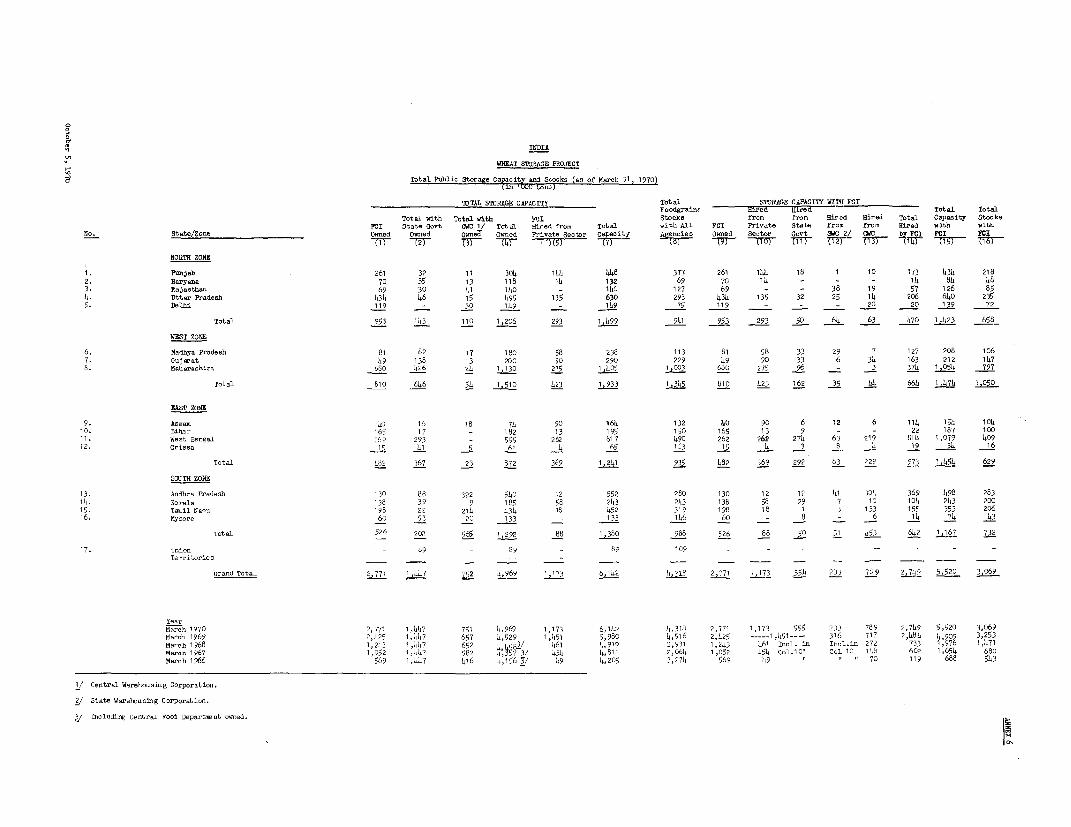
tons, of which about 35 million tons is marketed. Publicly owned storagecapacity (owned by Central and State Governments) total 5.0 million tons.
Privately owned storage capacity is not known. Estimates of grain losses
range between 7% and 12% of total production. However, as production in-creases, particularly of wheat, losses on the incremental production will be
much greater unless storage capacity expands equivalently.
iii. The project would help meet urgent storage needs resulting from
recent sharp increases in wheat production in North-west India and providethe basis for developing a more effective system for grain storage and dis-tribution throughout India. The project consists of (a) planning, designing,
constructing, and equipping 10 silos of 20,000 tons each and 10 flat storageunits of 10,000 tons each, providing a total capacity of 300,000 tons; (b)training silo personnel; and (c) conducting a study of India's foodgrain
storage and distribution.
iv. The proposed project storage facilities would be managed by theFood Corporation of India (FCI), which at present owns about 2.8 million tons
of storage capacity. Consultants would help FCI prepare the silo designs(FCI has acceptable designs for the flat storage units) and the tender docu-ments and wouldi supervise construction. The FCI, a public corporation, was
established in 1965 to operate storage facilities in connection with the Gov-
ernment's support price program and to undertake the interstate public dis-tribution of foodgrains. The Government is also considering having a 5-mil-lion-ton contingency stock operation in anticipation of the time when Indiabecomes self-sufficient in foodgrains. This stock would be used to meetshortfalls in marketable production during bad harvest years and would beoperated by FCI.
v. The IDA credit would help finance the construction of godowns,electrical and mechanical. equipment and the costs of consultants, trainingand the All India Grain Storage Study. The SIDA credit would help financethe construction of silos. Electrical and mechanical eqtuipment would be
procured under international competitive bidding and constitute the majorforeign exchange component of the project, about US$3.0 million allowingfor contingencies, representing about 19% of total project cost and 60%of the IDA credit.

- ii -
vi. As a result of the proJect, wheat losses during storage for oper-ational purposes would be reduced equivalent to a net saving in foreignexchange of about JS$3.0 million per annum. The economic rate of return ofthe project is estimated at 25%.
vii. The project is suitable for an IDA credit and a Swedish Govern-ment credit, each in the amount of US$5 million, on standard terms. Thecredits, totaling US$10 million, would cover the foreign exchange compon-ent of project costs and about 50% of local costs. The borrower would bethe Government of India. The IDA and Swedish Government credits would beonlent to FCI for 19 years, including 4 years' grace, at 7% interest. Theseare the normal terms for lending to state enterprises in India.

INDIA
WHEAT STORAGE PROJECT
I. INTRODUCTION
1.01 The Government of India (GOI) has requested IDA and Swedish Gov-ment financing for the establishment of modern grain storage and handlingfacilities to meet India's rapidly increasing storage requirements. Theproject would help meet the most urgent needs in North-west India broughtabout by the increase in wheat production. Ten flat storage units of10,000-ton capacity each and 10 silos of 20,000-ton capacity each would beconstructed, and there would be provision for training silo operators.A study would also be conducted to investigate ways of further improvingand expanding India's storage and handling facilities.
1.02 The total estimated cost of the project is US$15.9 millionequivalent. The proposed IDA credit would be for US$5 million. The Swed-ish Government would also contribute US$5 million on the same terms andconditions as IDA. GOT would supplement the IDA and SIDA funds with US$5.9million of its own funds and lend a total of US$15.9 million to the FoodCorporation of India, a public body charged with the interstate public dis-tribution of foodgrain, which would operate the facilities.
1.03 In June 1969, a Bank identification mission visited India todiscuss preparation of the project. FCI prepared the project and submittedits report to IDA in August 1969. This report is based on the findings ofan IDA appraisal mission in March/April 1970, composed of Messrs. L.Helmers, S. Reutlinger and Miss J. Noel (IDA); Messrs. R. Crofts andH. Heckman (IDA consultants); and L. Werin (Swedish Government consultant).
1.04 The total of past Bank Group lending for India's agricultureis nearly US$310 million as of June 30, 1971. Until 1969, most Bank Grouplending was for irrigation projects and the Bank Group is continuing tofinance such projects. Emphasis is now also being given to direct on-farminvestments and ancillary services. In the past financial year, there havebeen four Agricultural projects, three of which were for agricultural credit(Andra Pradesh, US$24.4 million, 226-IN; Haryana, US$25.0 million, 249-IN;Tamil Nadu, US$35.0 million, 250-IN). The other was for agricultural aviation(US$6.0 million, 230-IN).
II. BACKGROUND
A. Foodgrain Production Trends
2.01 The population of India, currently estimated at 550 million, hasbeen growing at an annual rate of about 2.5% during the last decade. The

- 2 -
growth of gross national product (GNP) over this period was about 3.5% perannum, or only about 1% per capita annually. This disappointing perform--ance was due mainly to the low average growth of agriculture, the largestsector, which grew at only 3% per annum. Agriculture produces nearlyhalf of GNP, employs about 70%.1 of the labor force and generates over halfthe foreign exchange earnings from the export of goods. Within the agri-cultural sector, the growth rate of foodgrains (75%U of the total croppedarea) was especially poor; at just under 2.5%, the rate of increase washardly equal to the rate of population growth during most of the lastdecade.
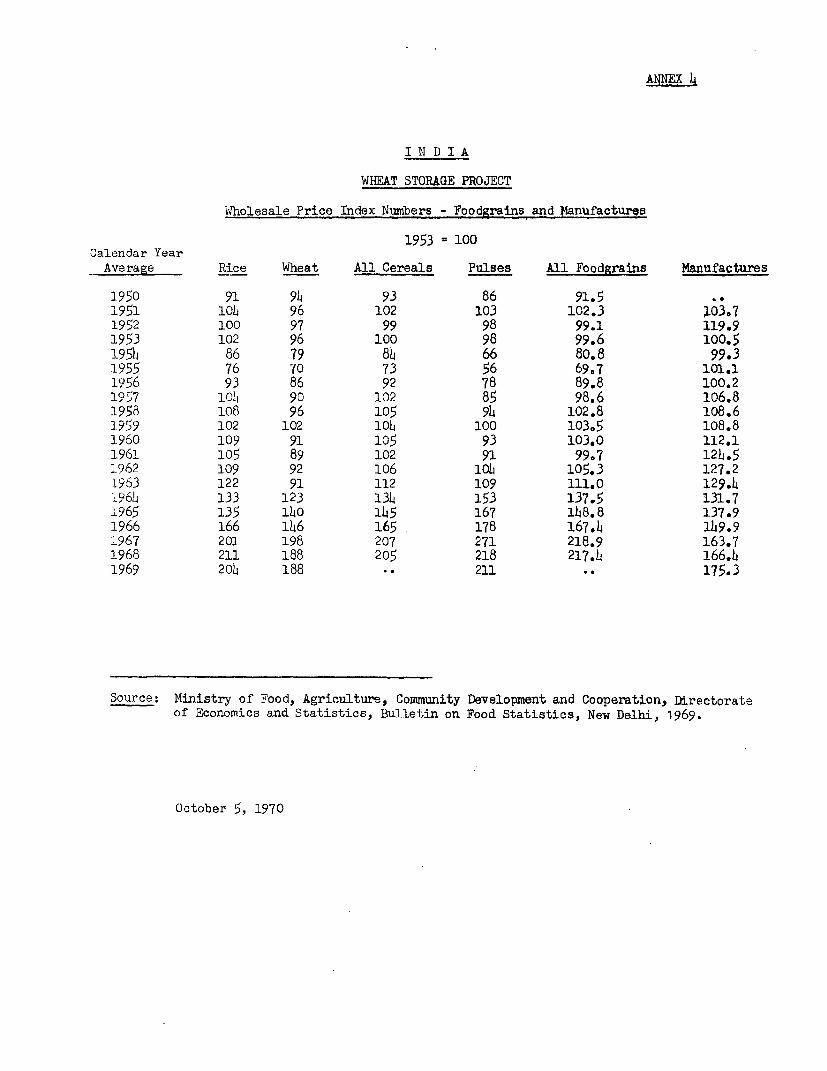
2.02 Foodgrain production and consumption statistics for the period1950 to 1969 are presented in Annexes 1 and 2 and a graphical presentationis in Annex 3. Net production 1/ of foodgrains grew from about 53 milliontons in 1950 to about 82 million tons in 1969, while net consumption offoodgrains grew from about 56 million tons to about 86 million tons duringthe same period. From 1950 to 1963, the average annual growth for foodgrainprices (especially those of wheat) lagged behind those of manufactured goods.It was not until 1964/65 that the price index for foodgrains rose above thatfor manufactures. Annex 4, showing the wholesale price indexes for food-grains and manufacture for the past 20 years, presents this price develop-ment. The policy of low agricultural prices weakened incentives to agricul-tural producers.
2.03 A new agricultural strategy was adopted in 1966 based on theconcentration of development efforts in priority areas. New high-yieldingvarieties of wheat and rice were imported; research was concentrated oncross-breeding between the imported and indigenous stock; and a major effortwas made to increase the availability and encourage the use of inputs, notablywater and fertilizer, along with improved seeds. The bad crop years of 1966and 1967 increased foodgrain prices relative to manufactured goods. TheGovernment had also instituted in 1965 a price support program that kept food-grain prices at the new higher level. The program's exact effect on food-grain production cannot be ascertained, but since its introduction, foodgrainproduction growth has increased from 2.3% to 2.9% per annum nationally and,in the North-west zone, wheat production has increased from just under 4% toabout 15% per annum.
2.04 India's net wheat production increased dramatically from 10.8million tons in 1965 to 16.4 million tons in 1969. This increase was notdue solely to good weather. Hligh producer prices (Annex 4) and the suc-cessful adaptation to Indian conditions of the high-yielding seed varietiesimported from Mexico provided the requisite economic inducements. Farmersin the wheat belt (especially in Punjab and Haryana) responded to the new
1/ According to GOT statistics, net production differs from gross produc-tion by the amount provided for feed, seed requirements and wastage,which is estimated at about 12.5% of the gross production of all food-grains. In 1969, gross production was about 94 million tons.
- 3 -
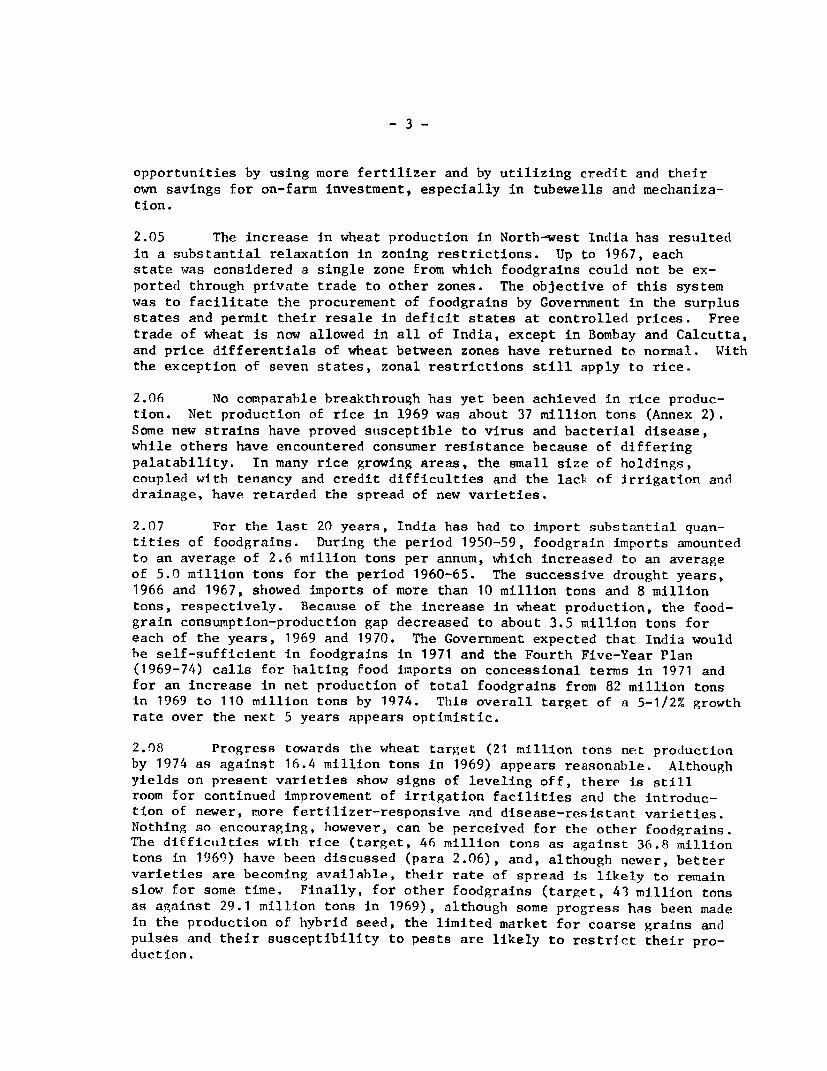
opportunities by using more fertilizer and by utilizing credit and theirown savings for on-farm investment, especially in tubewells and mechaniza-tion.
2.05 The increase in wheat production in North-west India has resultedin a substantial relaxation in zoning restrictions. Up to 1967, eachstate was considered a single zone from which foodgrains could not be ex-ported through private trade to other zones. The objective of this systemwas to facilitate the procurement of foodgrains by Government in the surplusstates and permit their resale in deficit states at controlled prices. Freetrade of wheat is now allowed in all of India, except in Bombay and Calcutta,and price differentials of wheat between zones have returned to normal. Withthe exception of seven states, zonal restrictions still apply to rice.
2.06 No comparable breakthrough has yet been achieved in rice produc-tion. Net production of rice in 1969 was about 37 million tons (Annex 2).Some new strains have proved susceptible to virus and bacterial disease,while others have encountered consumer resistance because of differingpalatability. In many rice growing areas, the small size of holdings,coupled with tenancy and credit difficulties and the lack of irrigation anddrainage, have retarded the spread of new varieties.
2.07 For the last 20 years, India has had to import substantial quan-tities of foodgrains. During the period 1950-59, foodgrain imports amountedto an average of 2.6 million tons per annum, which increased to an averageof 5.0 million tons for the period 1960-65. The successive drought years,1966 and 1967, showed imports of more than 10 million tons and 8 milliontons, respectively. Because of the increase in wheat production, the food-grain consumption-production gap decreased to about 3.5 million tons foreach of the years, 1969 and 1970. The Government expected that India wouldbe self-sufficient in foodgrains in 1971 and the Fourth Five-Year Plan(1969-74) calls for halting food imports on concessional terms in 1971 andfor an increase in net production of total foodgrains from 82 million tonsin 1969 to 110 million tons by 1974. This overall target of a 5-1/2% growthrate over the next 5 years appears optimistic.
2.08 Progress towards the wheat target (21 million tons net prodluctionby 1974 as against 16.4 million tons in 1969) appears reasonable. Althoughyields on present varieties show signs of leveling off, there i.8 stillroom for continued improvement of irrigation facilities and the introduc-tion of newer, more fertilizer-responsive and disease-resistant varieties.Nothing so encouraging, however, can be perceived for the other foodgrains.The difficulties with rice (target, 46 million tons as against 36.8 milliontons in 1969) have been discussed (para 2.06), and, although newer, bettervarieties are becoming available, their rate of spread is likely to remainslow for some time. Finally, for other foodgrains (target, 43 million tonsas against 29.1 million tons in 1969), although some progress has been madein the production of hybrid seed, the limited market for coarse grains andpulses and their susceptibility to pests are likely to restrict their pro-duction.

- 4 -
2.09 It is difficult to predict when India will become self-sufficientin foodgrains because this depends on the attainment of targets for the ex-pansion of the irrigated areas and the success of rice research currentlyunderway. As it is not possible to predict what the results of this researchwill be, projections concerning the actual date of self-sufficiency aresubject to a high margin of error. It is, however, quite clear that storagerequirements will increase because domestic supplies procured during peakperiods will continue to replace imports distributed evenly over the year.
B. Public Distribution of Foodgrains
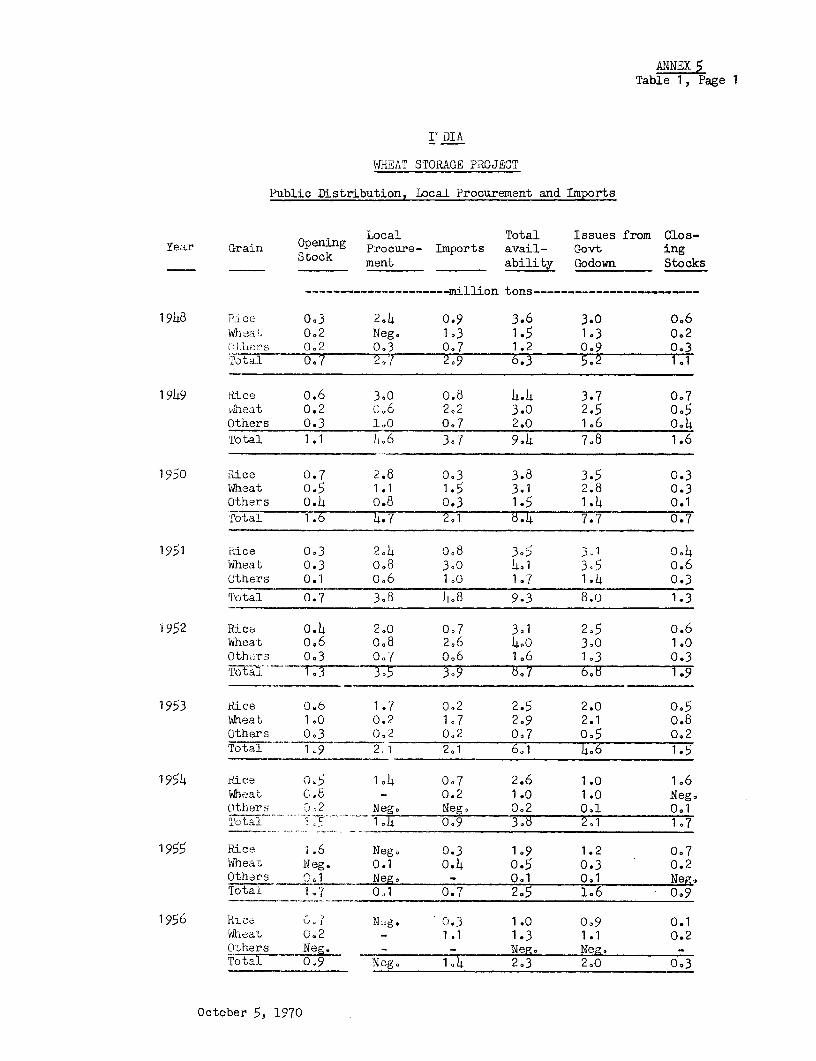
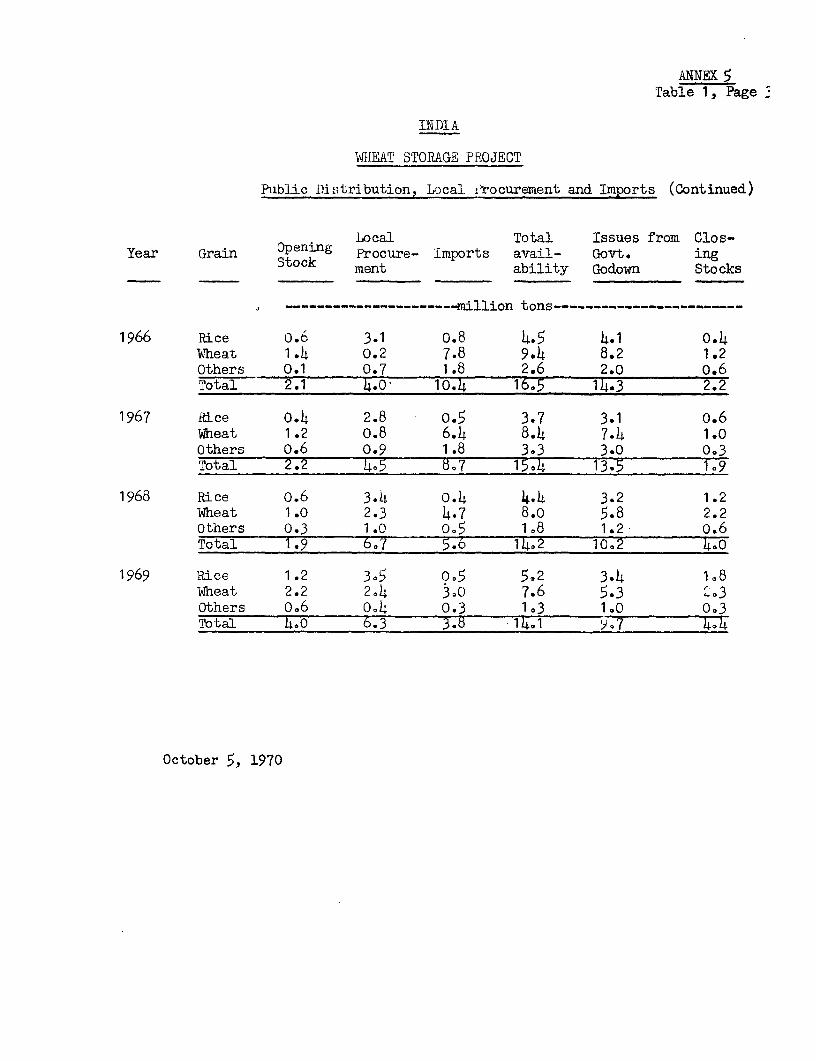
2.10 India's agriculture has always been subject to the vagaries ofthe weather, and large year-to-year fluctuations in foodgrain productionare common. There have been six distinct periods of famine since 1900.Under such conditions, the need for public distribution during periods ofshortfall is obvious. Since World War II and up to 1965, the responsibil-ity for public foodgrains procurement and distribution was shared betweenthe Food Department of the GOI, which was responsible for imports andtheir distribution to the states, and State Government agencies, whichwere handling local procurement and distribution within their respectivestates. Public distribution of foodgrains varied from as much as 1.6million tons in 1955 to 14 million tons in 1966. The background of thepresent situation in public distribution is outlined in Annex 5.
2.11 The new agricultural policy that evolved in the mid-1960's, withits emphasis on incentive and support prices to producers and the operationof a contingency stock (para 2.15) of foodgrains, necessitated the creationof a new, all-India executive agency. The Food Corporation of India (FCI)was therefore set up and began operations on January 1, 1965. FCI hasnow taken over all public distribution work of the Food Department and isresponsible for all interstate foodgrain movements. While the Food Depart-ment's task was mainly to take care of public distribution during periodsof serious shortfall, the FCI undertakes public distribution during normalyears as well. The function of the FCI is the procurement and storage offoodgrains and transport to its sales centers that supply the fair priceshops.
2.12 The fair price shops are owned by licensed private retailers.They were set up to provide foodgrains to the population during periods offamine, but they now also provide the lower quality foodgrains at controlledprices during normal years. In 1968, there were about 135,000 fair priceshops in India. Because the higher income consumers prefer to buy thebetter foodgrains on the open market, the system caters, during normalyears especially, to the lower income consumers. The total public distri-bution of foodgrains during normal years is now about 9.7 million tons.The rest of the marketable surplus (excess of net production over on-farmconsumption) in foodgrains, estimated at about 30% of total net production,or about 25 million tons, is distributed through private merchants.
2.13 While FCI's distribution price for rice covers the purchase priceand the direct storage and transport costs, such is not the case for wheat.

- 5 -
The difference between the price of domestically procured wheat and thecommon issue price at which FCI must sell does not allow sufficient margin
to show a profit or even break even (para 5.02). The deficit on locallyprocured wheat was covered in the past by the profits on imports, which werebought at a lower price but sold at the same issue price. Now, however, the
proportion of domestic purchases to imports is increasing, and, as a result,FCI incurred a deficit of Rs 230 million (US$30 million) in 1969/70, whichwas covered by the Government.
2.14 Government intends to pursue the public distribution policyuntil it is no longer necessary. It is willing to subsidize such distri-
bution because the high support prices promote an expansion of wheat pro-duction and because it considers the provision of low priced wheat to the
low income consumers essential. The program as it is now operating throughthe FCI and the fair price shops is relatively efficient and entails lessadministrative work than a system of direct rationing or money grants.
2.15 India has at present about 2 million tons of foodgrain contingencystocks that would be used when marked falls in foodgrain production occurduring a bad harvest year (para 2.16). Although grain production has in-
creased in the past few years, imports were available on concessionaryterms and most of the present contingency stocks have been built up fromimports. These stocks are at present stored mainly with the State Govern-ments. The Central Government has indicated that it intends to increasethe stock to about 5 million tons by the time India becomes self-sufficientand that FCI should then manage the operation.
C. All-India Public Storage Requirements
2.16 India's public storage requirements consist of facilities foroperational stocks and contingency stocks. Operational public stocks arethose that are stored following harvest (or import) and used to smoothpublic distribution of grains to consumers throughout the year. Contin-gency or emergency stocks are those that are placed in storage followinga surplus harvest (or import) and used to meet grain shortfalls in badharvest years, which may be 3 or 4 years later. Whereas foodgrains canbe stored in silos up to 3 years, foodgrains stored in flatstores must be
replaced every year or they deteriorate too much in quality. Thus, it isnot likely that the same foodgrains would remain stored for the entire con-tingency waiting period, making it impossible to earmark a certain physi-cal quantity of foodgrains as being contingency stocks. Operational stocksand contingency stocks are interchangeable, but it is the combined totalof the two that determines a country's storage requirement. Storage fa-
cilities containing contingency stocks at harvest time cannot be used tostore operational stocks at that time.
2.17 India has at present about 5.0 million tons of publicly ownedstorage facilities (Annex 6). The country's operational public storagereqtuirements are estimated to be about 3.9 million (Annex 7) and it hasa contingency stock of about 2.0 million tons. Its total public storagerequirement is therefore 5.9 million tons.

- 6 -
2.18 The deficit between available public facilities (5.0 milliontons) and reqtuired Public facilities (5.9 million tons) is covered byhiring storage capacity from the private sector. This, however, is alsoin short supply. Furthermore, a substantial part of the facilities (publicand private) appears to be located in the wrong areas and is of poor qual-ity, causing grain losses. Unfortunately, no exact data exist on theobsolescence of the existing facilities and no study has been made todetermine whether, in fact, the facilities are of the right type and lo-cated in the right areas (a study on this matter is proposed, as describedin para 4.11).
2.19 The UNDP/SF is at present investigating the best methods foron-farm storage. The project will end in 1972 and its findings should bevaluable in launching a national program for the improvement of on-farmstorage and handling procedures at a later stage.
2.20 When India becomes self-sufficient, the public distributionprogram may well be partly abolished. Probably at least as much storagecapacity would, however, still be necessary for the private trade. Thestorage capacity that would become available if public distribution wereabolished could be transferred to the private trade or the Central Ware-housing Corporation, a public organization whose main functions are toprovide improved storage facilities to the private trade and to issuenegotiable warehouse receipts. In the event that facilities financed byIDA were transferred, consultations with IDA would be required.
III. THE PROJECT AREA
3.01 The project would be located in the states of Punjab, Haryana,Rajasthan and Uttar Pradesh, which together constitute India's wheat belt.About 75% of India's wheat is produced in the area and nearly all publicprocurement takes place there. Such procurement in the area has grownfrom 400,000 tons in 1965, out of a net production of 8.3 million tons, to2.4 million tons in 1969, out of a net production of 14.0 million tons.Public procurement was expected to reach about 3.7 million tons in 1970.
3.02 Since farms have no adequate on-farm storage, the wheat has tobe delivered to the market, and about 85% of total wheat marketings takeplace during the post-harvest months of April to June. In 1969, therewere 1.2 million tons of public storage facilities in the project areawhere 1.6 million tons were required (Annex 7).
3.03 To accommodate the public procurement (para 3.01), additionalfacilities were hired from the private sector. These too, however, werein short supply, making it necessary to use buildings such as schools forstorage places. Some wheat was merely placed in heaps on the ground.
3.04 Losses during storage in these make-shift facilities were great;wheat stored in such manner was especially susceptible to substantial damagein the event of early monsoons. As a first-stage project, the Governmenthas asked IDA to finance 300,000 tons of storage facilities.

-7-
3.05 The proposed project storage facilities would lessen the strainon rail transport during the post-harvest period; minimize the need forany later cross-hauling; provide tangible assurances to farmers of theGovernment's ability to sustain support price buying operations, itselfa significant factor in the maintenance of increased production; and takeadvantage of the favorable climatic conditions that exist in the area,which would minimize storage losses.
3.06 Most estimates regarding the storage losses per annum for thecountry as a whole range between 7% and 12%. However, these estimates relateto the average losses and include grain stored in both the best storagefacilities and in the worst. Obviously, the proposed facilities would notsubstitute for the best or even the average of existing facilities but wouldbe located in areas where, under current practice, grain is kept under theworst possible conditions and where the greatest losses occur. Estimates oflosses incurred in such marginal facilities (including storage in holes andin the open) range to 50% and higher. A conservative estimate is that about25% of the incremental wheat marketings in North-west India in 1969 were lost.The study referred to in paragraph 4.11 would include investigation of actualfoodgrain losses, since no such survey has so far been made in India.
IV. THE PROJECT
A. Project Description
4.01 The proposed project forms part of an ongoing program of food-grain storage facility construction for both operational and contingencystock purposes. The project would consist of (a) planning, designing,constructing and equipping 10 silos of 20,000 tons each and 10 godowns(flatetores) of 10,000 tons each in North-west India (i.e., the states ofPunjab, Haryana, Rajasthan and Uttar Pradesh); (b) training silo personnel;and (c) conducting a study on India's foodgrain storage and distribution.The proposed facilities would be used for wheat storage and would beconstructed in about 3 years.
4.02 FCI has prepared outline designs for the godowns and would engagelocal consultants for the detailed design of the silos. Technical speci-fications and preliminary designs are shown in Annex 8. The local consult-ants would also prepare necessary tender documents and assist FCI'sengineering department in supervising construction of silos and godowns(para 5.05). A well qualified consultant firm with substantial experiencein the slipform method of silo construction would be contracted by the localconsultants to help in the designing of the silos if the local firm couldnot show evidence of such experience. Provision would also be made for tech-nical training of silo operators (para 4.10).
4.03 The silo part of the project is intended to serve as a model forfurther construction of 8ilo8 but has been limited to 200,000 tons becausethat is the maximum that FCI believes it can handle efficiently in the next

three years. Since there is an acute shortage of storage facilities, anadditional 100,000 tons of godowns, which also have a satisfactory rate ofreturn (para 7.07), have been included in the project.
B. Technical Features
Site Selection
4.04 Locations for the project storage facilities are shown in Annex 9.
The facilities would be built only on sites having road and rail access, and,in the case of silos, located in areas capable of receiving grain in bulk.Based on consideration of the factors outlined in Annex 10, FCI has presenteda detailed justification for the selection of specific sites and agreementon sites has been reached during negotiations.
4.05 Nearly all of the selected sites are owned by FCI. Acquisitionof the remaining sites would not take longer than about 3 months because thesites are single-owner holdings and are located in rural areas. It wouldbe a condition of effectiveness of the proposed IDA and Swedish Governmentcredits that all the sites had been acquired by PCI.
Flat Storage (Godowns)
4.06 Standard designs would be used for the flat storage units, whichwould be of conventional brick construction. Internal dimensions of asub-unit would be approximately 22 m by 130 m. Each would provide 5,000 tonscapacity and be divided into four compartments. Sub-units would be placed
either end to end or side by side, depending on the configuration of the plotand road and rail access requirements, to provide 10,000-ton capacity per
site.
4.07 Godowns would be designed to receive grain in bags. Under cur-rent FCI operational practice, no mechanical equipment would be required.However, since there has been some difficulty in getting laborers tostack to the height necessary to make full utilization of the stores, acontingency provision has been made in the project for bag stackers.
Silos
4.08 Project silos would be designed to receive grain in bulk. Grainwould be sampled and weighed before being emptied into receiving pits tofacilitate purchase at the silo. Provision would be made for baggingbefore dispatch from silos, since this is likely to continue for sometime as the main method of wheat delivery.
4.09 Project silos would be made up of 12 round bins, each having an
inside diameter of about 8 m and a height of 40 m. Interstice spaces betweenthe bins would also be used for storage. Provision has been made for founda-tion piling at all silo sites, and bins would be built of reinforced concreteby the slipform method. The slipform method is the best and most economicalmethod of silo construction because less construction material and foundation
- 9 -
work is needed and greater strength of the silos is obtained. Mechanicalequipment would be installed for cleaning the grain, for distributing itinto and between bins, and for aerating stored grain. In addition, equipmentfor fumigation, temperature indicators and baggers would have to be obtainedfrom abroad.
Technical Training
4.10 To provide the necessary level of technical superintendence ofsilos, 15 trainees (the required number for 10 silos) would be sent abroadfor a period of 6 months to study grain handling in theory and practice inappropriate centers in either Europe or North America. In addition, theforemen and shift supervisors, as well as shift operators, mechanics andelectricians, would be given training in India. This personnel would assistduring the installation and test runs of the equipment. Consultants (para4.02) would make the training arrangements abroad and would be responsiblefor the placement of overseas trainees and for the training program. Overseastrainees would sign a contract obligating them to stay 2 years with the FCI.Consultants would also be responsible for the local training arrangements.Assurances were obtained during negotiations that all training arrangementswould be mutually satisfactory to the Government and IDA.
All-India Grain Storage and Distribution Study
4.11 A nrovision has been made in the project for an All-India GrainStorage and Distribution Study. Assurances were obtained during negotiationsthat within six months of the date of the proposed credit agreements, India,Sweden and IDA would enter into discussions on the proposed study. Tentativeterms of reference (Annex 11), which will be discussed, cover the costs andbenefits of public distribution and contingency stock operations, a surveyof storage and rice processing facilities and grain losses, and the drawingup of programs for improvement of existing practices, rehabilitation ofexisting facilities and construction of new facilities. Government hasalready started carrying out several parts of the study which will be takeninto account during the discussions. It was also agreed during negotiationsthat the consultants who may be required to complete the study and theirterms of reference would be acceptable to IDA.
C. Construction Schedule
4.12 FCI already has considerable experience in the construction ofgodowns and there are many local contractors capable of undertaking thiswork. All godowns could probably be constructed in less than 1 year fromthe date of site selection. On the other hand, FCI has had little experi-ence with silo construction and there is, additionally, a lack of qualifiedcontractors and specialized building equipment. Silo construction wouldtake about 3 years. Annex 12 shows detailed construction time schedules.

- 10 -
D. Cost Estimates
4.13 Total cost of the project is estimated at Rs 119.3 million(US$15.9 million). The foreign exchange component of Rs 22.1 million(US$3.0 million) represents about 19% of total costs and includes specialsilo equipment, the cost of foreign consultants, the training of keysilo operators abroad and the foreign exchange costs of the materialsproduced in India and used for project construction. The following tablepresents a summary of the estimates (see Annex 13 for details).
Rs (thousands) US$ (thousands) ForeignItem Local Foreign Total Local Foreign Total Exchange
Land 1,610 - 1,610 214 - 214 -Railway Sidings 3,910 690 4,600 522 92 614 15Buildings 14,490 4,830 19,320 1,932 644 2,576 25Mechanical Equipment 590 100 690 78 14 92 15
20,600 5,620 26,220 2,746 750 3,496 21SilosLand 644 - 644 86 - 86 -Railway Sidings 3,910 690 4,600 522 92 614 15Buildings 39,431 3,432 42,863 5,258 456 5,714 8Mechanical Equipment 8,611 4,637 13,248 1,148 618 1,766 35Electrical Equipment 2,834 1,214 4,048 378 162 540 30
55,430 9,973 65,403 7,392 1,328 8,720 15Consultants andSupervision CostsConsultants 350 350 700 47 47 94 50Supervision ofContractors 400 - 400 53 - 53 -
750 350 1,100 100 47 147 32
Training 75 425 500 10 57 67 85
Storage Study 900 1,350 2,250 120 180 300 60
Sub-total 77,755 17,718 95,473 10,368 2,362 12,730 19
,.ontingencies, 25%Physical (15%) 11,664 2,657 14,321 1,555 354 1,910Price (10%) 7,775 1,772 9,547 1,037 236 1,273 19
Total Project Cost 97,194 22,147 119,341 12,960 2,952 15,912 19
4.14 The 25% contingency includes a provision for price escalation overthe 3-year construction period of about 10% of total cost; the remainder rep-resents a contingency against unforeseen equipment requirements, constructiondifficulties, and acts of nature. Estimates for imported equipment items are

- 11 -
based on current manufacturers' prices, while costs of land, railway sidings,buildings and locally produced equipment have been based on figures suppliedby FCI and verified during appraisal.
E. Proposed Financing
4.15 The following table represents the proposed financing of projectcosts:
Rs '000 US$'000 X
IDA Funds 37,500 5,000 31.4Swedish Government Funds 37,500 5,000 31.4GOI Funds 44,341 5,912 37.2
119,341 15,912 100.0
4.16 The Swedish Government and IDA would together provide a totalcredit of US$10 million, representing about 63X of project cost. GOIwould supplement Swedish Government and IDA funds with its own funds andonlend the total to FCI. Because of the small proportion of foreign costof the project, the IDA credit would finance local cost expenditure. Thecredits would cover the foreign exchange component of project costs andabout 50% of local costs. The borrower would be GOI and the onlending toFCI would be for 19 years, including 4 years' grace, to be repaid at 7%interest. These are the normal terms for lending to state enterprises.
P. Procurement
4.17 Contracts for the civil works for the silos would be financedby the Swedish Government and would be let by FCI, assisted by the engineer-ing consultants, on the basis of local competitive bidding. The civil worksfor the godowns would be financed by IDA. Since the godowna are scatteredover a wide area, contracts would not be suitable for international biddingand would be let on the basis of local tender. Experience in godown construc-tion is widespread throughout India and local construction cost is low. Pre-
qualification of prospective bidders for both the silos and the godowns wouldbe made to ensure that the works would be carried out by capable contractors.These would be divided into two categories - one for the construction of thesilos and the other for the construction of the godowns. In the case of theconstruction of the silos, contractors would have to show evidence of experi-
ence in the slipform method of construction or their association with firmsthat had done such work. Bidding for the silos as well as the godowns wouldbe by individual site, and bids might be made for any number. Separate bidswould be invited for the mechanical and electrical works and the civil works.Mechanical and electrical equipment, to be financed by IDA, would be procuredunder international bidding and, for purposes of bid evaluation, a 15% pref-erence or the import duty, whichever is less, would be allowed in favor ofdomestic equipment supplies.

- 12 -
4.18 Tenders would be evaluated by the technical staff of FCI, assistedby the consultant to determine conformity with tender invitations. Success-ful tenders would be subject to IDA approval. During negotiations, assuran-ces were obtained that procedures outlined in paragraph 4.17 and in thisparagraph would be followed.
G. Disbursement
4.19 The Swedish Government credit would be disbursed against the costof civil works for the construction of silos, covering up to 80% of thesecosts, making full allowance for contingencies. In the event that the totalamount of the Swedish credit is not required for this work, it would be dis-bursed against other components. The IDA credit would be disbursed against:
(a) 100% of the cost of mechanical and electrical equipment;
(b) 100% of foreign expenditures for engineering and otherconsulting services acquired outside India and of thecost of training outside India;
(c) 50% of local expenditures for consulting services inIndia and the cost of training in India; and
(d) 37% of the total cost of civil works for the constructionof godowns.
4.20 Disbursements would take place when FCI presents evidence ofpayment. A detailed disbursement schedule is presented in Annex 14.
V. ORGANIZATION AND MANAGEMENT
A. Operations of the Food Corporation of India
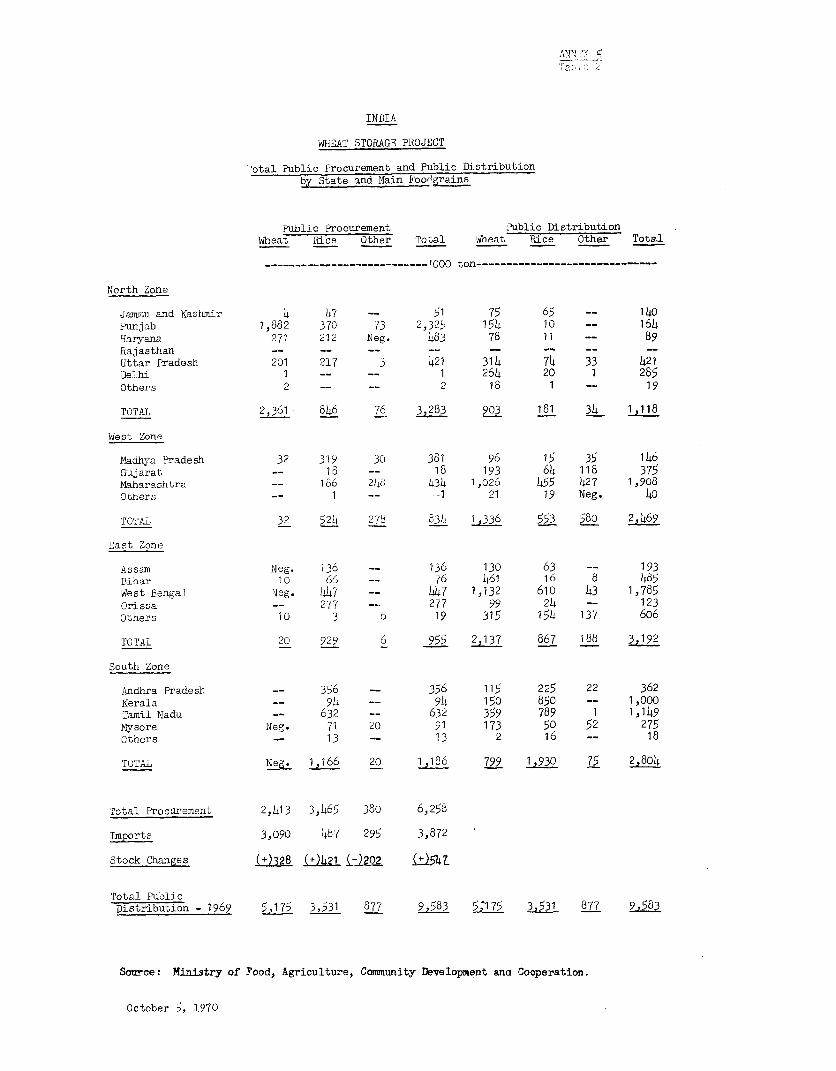
5.01 The project would be managed entirely by the FCI. The Corporation'soperations are discussed in detail in Annex 15, which also presents FCI'sbalance sheets, its profits and loss statements and its organization chart.The FCI distributed about 6.6 million tons of foodgrains in 1969 (4.0 millionprocured locally and 2.6 million imported), which represents nearly 70% ofall foodgrain distributed publicly (9.7 million tons). The states accountfor the remaining 30%. FCI employs some 25,000 people and owns storage fa-cilities w-ith a capacity of about 2.8 million tons. Its net profits in1968/69 were negligible, 0.3% of sales.
5.02 The main reason for FCI's low profits is that, under the Govern-s,ent's price support policy, it must buy domestically produced wheat atRs 760 per ton and sell it at Rs 780 per ton. The margin of Rs 20 per ton isnot sufficient to cover storage and distribution costs, which are about
- 13 -
Rs 200 per ton (para 6.01) for domestically procured wheat. FCI makes aprofit on imported wheat and locally procured rice and other foodgrains(para 2.13).
5.03 FCI is financed by 4-year GOI loans (Rs 2.2 billion as of March1969) at an interest rate of 5.75%; bank overdrafts (Rs 1.2 billion as ofMarch 1969), guaranteed by the GOI at an interest rate of 7%; and equitycapital held entirely by GOI (Rs 285 million as of March 1969). Any deficitsin FCI's operations are covered by the Government (para 2.13). The Govern-ment has opted for this financing plan instead of making the funds availableat a zero interest rate because it wants FCI to operate eventually as an un-subsidized corporation.
5.04 The management of the FCI is good and, on the whole, it is a rea-sonably well-run operation. An inventory of all stocks is made available toheadquarters on a semi-monthly basis within 2 weeks after the date that in-ventories have been taken. Pest and insect control can be improved. Thestudy proposed in paragraph 4.11 would investigate ways and means to improvequality control.
5.05 Because FCI's engineering department lacks experience, especiallyin silo design and construction, local engineering consultants would be en-gaged to assist it. These consultants would have to show evidence of experi-ence in the slipform method of silo construction or their association withfirms that had done such work. Proposals for consultancy services (includingevidence of association with firms with adequate qualifications) would be ob-tained from the local firms and appointments made on the basis of evidence ofprevious pertinent training and experience, with the approval of IDA. Theappointment of the engineering consultants would be a condition of effective-ness of the proposed credit.
B. Cost Control
5.06 FCI operates under the limitations set by the buying and sellingprices fixed annually by Government, and its performance cannot, therefore,be judged on the basis of its profit record. FCI has constantly attemptedto explore the possibilities of effecting cost reductions, but the majorfactors in costing are not susceptible to unilateral reductions on its part.Taxes, market charges, railway freight, bag prices, administration charges ofState Governments and interest charges on capital invested represent theseitems, which are fixed by other bodies. FCI's efforts at economy can, there-fore, be directed only internally at control of purchase, storage and hand-ling charges; storage and transit losses; and transport charges by ensuringmore efficient methods. FCI has a Planning and Research Department but theposition of Head of the Department is vacant. Assurances were obtained duringnegotiations that within six months of the signing of the proposed credit, aHead with satisfactory experience and qualification would be appointed.
5.07 There is also a Cost Control Unit in PCI that reviews, on the basisof the accounting data, the various cost categories. The Unit is directly
- 14 -
responsible to the Managing Director. Assurances were obtained during nego-tiations that it would be headed at all times by a person with satisfactoryexperience and qualifications.
C. Accounts and Audit
5.08 Assurances were obtained during negotiations that FCI would set upseparate project accounts reflecting investment costs, wheat flow, and oper-ating costs of the proposed project facilities. Assurances were also ob-tained that FCI would record the costs of its normal public distributionoperation and of its contingency stock operation so that the financial resultsof each can be analyzed separately.
5.09 The financial year of FCI ends on March 31, but in the past itiUas caken about a year before audited statements became available. Becausetimely information is essential, this time gap should be shortened. Theauditors of FCI are chartered accountants appointed from a list of auditorsapproved by the Central Government. Assurances were obtained during nego-tiations that an audited financial statement would be presented to IDAwithin 6 months of the close of FCI's financial year.
VI. STORAGE, OPERATION AND DISTRIBUTION COSTS
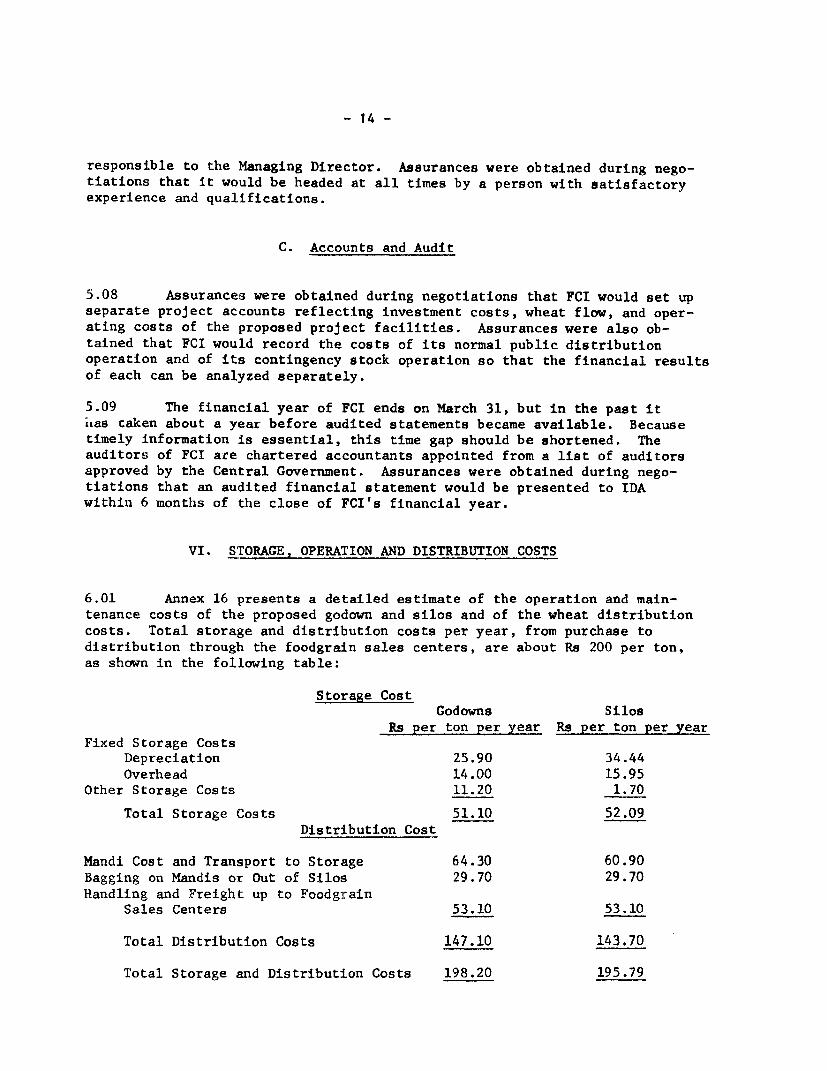
6.01 Annex 16 presents a detailed estimate of the operation and main-tenance costs of the proposed godown and silos and of the wheat distributioncosts. Total storage and distribution costs per year, from purchase todistribution through the foodgrain sales centers, are about Rs 200 per ton,as shown in the following table:
Storage CostGodowns Silos
Rs per ton per year Rs per ton per yearFixed Storage Costs
Depreciation 25.90 34.44Overhead 14.00 15.95
Other Storage Costs 11.20 1.70
Total Storage Costs 51.10 52.09Distribution Cost
Mandi Cost and Transport to Storage 64.30 60.90Bagging on Mandis or Out of Silos 29.70 29.70Handling and Freight up to Foodgrain
Sales Centers 53.10 53.10
Total Distribution Costs 147.10 143.70
Total Storage and Distribution Costs 198.20 195.79

- 15 -
6.02 Except for the silos, these costs are based on FCI records. Theyinclude the actual out-of-pocket expenses and depreciation charges incurredby FCI, but not the grain losses, since FCI sells the grain per bag, in-cluding the moisture uptake, which compensates for the loss in nutritionalvalue during the storage period. Silo costs are estimated to be about thesame as those for the godowns but would be lower in the future (para 7.05).
6.03 The total cost (excluding distribution costs) incurred by FCI forthe storage of about 300,000 tons of wheat for a year amounts to about Rs15 million, or about Rs 4.30 per ton per month. Going rates for privatestorage are about Rs 5 to Rs 6 per ton per month, but, even at that price,there is not sufficient space available for rent. Since FCI's totalstorage and distribution costs are only partly covered by its margin onsales, the financing of these costs would be provided through regularbudgetary allocations from the Central Government.
6.04 The proposed project would enable FCI to procure, store and dis-tribute an additional 300,000 tons of domestic wheat. Under present procure-ment and issue prices (para 5.02), FCI would incur a deficit of about RS 180per ton, or about Rs 54 million (US$7.2 million), on this wheat. Since suchprices are fixed by Central Government after discussion with the State Gov-ernments, it is impossible to predict FCI's future deficits. The CentralGovernment has confirmed that the cost of the subsidy would be borne by thebudget of the Government of India.
VII. BENEFITS AND JUSTIFICATION
A. Choice of Location
7.01 Location of the proposed facilities in North-west India has defi-nite advantages over location in the main consuming areas. These includeclimatological factors and the avoidance of railroad bottlenecks (85% of thewheat is procured in the 3 months following the harvest). The better climatein North-west India keeps foodgrain losses there lower than in the mainconsuming centers such as Bombay, Madras or Calcutta. The railroad bottle-necks occur in the broad-gauge system, which handles the bulk of the wheatbelt's production and which connects this area with the rest of India exceptthe western part. The latter is served by a meter-gauge system that hassome unused capacity. Location in the wheat belt or along the meter-gaugewould help reduce the bottlenecks in the broad-gauge system.
7.02 Establishing production-oriented storage facilities has thereforea definite advantage over placing them in the main consuming areas. Eighteenof the facilities would be located in the wheat belt; the remaining two wouldbe near consuming centers in the districts of Udaipur and AJmer in the stateof Haryana, which are served by the meter-gauge railroad. The location ofthe facilities is such that all would help reduce foodgrain losses and trans-port bottlenecks.
- 16 -
B. Choice of Storage Method - Godown Versus Silo
7.03 Godown construction cost, including contingencies, is about Rs 330per ton capacity while silo construction cost is about Rs 410 (Annex 16).On the other hand, operating costs are higher for godowns than for the silos,making the total fixed (including the capital recovery cost) and operatingcosts about the same. However, the main advantage of silos is that grainlosses are reduced substantially. A reduction in losses is, of course, abenefit to the economy. A detailed estimate of distributing and operatingcosts and losses for storage in godowns and silos for periods of up to 3years (the maximum period that the grain can be stored in silos withoutdeterioration) is presented in Annex 17.
7.04 The losses in North-west India under present conditions on the in-cremental marketed production, w!thout the project, are estimated to be atlca6c 25%. For tne wneat stored in the proposed project facilities, lossesare estimated to be about 8% for the godowns and 4% for the silos (assumingone turnover per annum). The losses under the project would be lower thanthose suffered in comparable facilities elsewhere in the world (for example,East Pakistan) because of the favorable climate for storage. Annex 18discusses grain storage losses in India.
7.05 Annex 19 analyzes the comparative advantages of silos and godowns.The incremental investment in a silo compared to a godown is compensated bythe silo's savings in operating costs and storage losses. The rate of returnon the incremental investment is about 12.5%. This rate of return computa-tion is based upon liberal cost estimates for the silos. Because the pro-posed method of silo construction (slipform construction) is new to India,it is expected that subsequent silos can be constructed at lower cost. Inaddition, further cost savings from handling grain in bulk, which is ex-pected to develop later but which has not been taken into account in thecalculation, can be realized from the silos. Thus, the rate of return onthe incremental inveistment quoted above should be considered a conservativeestimate. Silos are, therefore, the more economical storage facility.
7.06 As mentioned in paragraph 4.03, the silo program would be limitedto 200,000 tons. An additional 100,000 tons of godown storage has beenincluded in the proposed project to help meet the increasing need for space.The rate of return Is lower for the godowns than for the silos, but isnevertheless satisfactory (para. 7.07).
C. Economic Rate of Return
7.07 As wheat output continues to increase and the shortage of storagemounts, losses incurred on the incremental marketable production will becomegreater. A conservative estimate of such losses per annum, based on past ex-perience, is 25%. The main benefit of the proposed project is that theselosses would be reduced, as mentioned in paragraph 7.04. Annex 20 presentsa differential analysis of storage costs (including grain losses) with the
- 17 -
project versus the costs without the project. The overall rate of returnunder the project would be about 25%. The rate of return for the godownsis 20% and for the silos 28%.
7.08 A sensitivity analysis has also been made. If without-the-projectstorage losses were 15% per annum instead of 25% per annum (which is un-realistically low under the circumstances), the rate of return on the projectfacilities would be 15%. At a loss rate of 35% per annum, the rate of returnon the facilities would be about 40%.
7.09 The proposed storage facilities would be used to store operationalstocks. However, since the proposed project forms part of India's storageconstruction program, which includes facilities for contingency stocks, anattempt has been made in Annex 21 to evaluate the benefits of a 5-million-toncontingency stock operation (para 2.15). The direct benefits of such anoperation are two-fold. First, they derive from the fact that a ton of graincan be bought cheaply when supply is abundant and sold at a higher price whensupply is scarce. This is the financial return that FCI would make and thathas been calculated to be about 2%. Second, without a contingency stockoperation, India would have to procure wheat in world markets if it wanted toprovide consumers with the same level of foodgrain consumption as would pre-vail under the contingency stock operation. This additional demand wouldraise world market prices to a level that would be subst,antially higher thanthe price level under the contingency stock operation. Because of the con-tingency stock operation, the Indian Government would, consequently, not haveto procure wheat at the higher world market prices. The rate of return onthe investment, based upon these two direct benefits and assuming that all ofthe facilities would be used for contingency storage, is between 5% and 10%,which is marginal.
7.10 In addition to the two direct benefits, there are indirect bene-fits from contingency stock operations. First, a substantial part ofthe contingency stock may be used to meet emergencies (e.g., floods mayisolate areas or transportation breakdowns may occur). The benefit of astock used for this purpose is difficult to evaluate. Second, withoutthe contingency stock operation, it may sometimes not be possible to obtainwheat on world markets, especially when there would be a substantial Indiandemand. Third, because of the contingency stock operation, farmer priceswould be stabilized and such stabilization tends to increase farmers' pro-duction. Since these indirect benefits cannot be evaluated, it is there-fore not possible to state whether the contingency stock operation is justi-fied. The analysis presented here, therefore, should not be considereda definitive comment on India's contingency program. The all-India storagestudy (para 4.11) would provide data necessary for a complete evaluation,analyze cost and benefits and recommend the most economical level of thecontingency stock operations.
7.11 As has been mentioned, the proposed facilities would be used foroperational purposes and, as such, would have a rate of return of at least25% (para 7.07). The proposed project would also result in substantial for-eign exchange savings. If the reduction in foodgrain losses is evaluated

- 18 -
at a world market price of US$65 per ton, the foreign exchange savings (afterdebt service) would be about US$3.0 million per annum.
7.12 The proposed project has high priority. It would serve an area inIndia where the progress of foodgrain production has been most impressiveand where an absolute shortage of adequate storage facilities exists. Pro-vision of such facilities is urgently needed, not only to prevent losses butalso to help India in her efforts to become self-sufficient in the shortestpossible time.
VIII. RECOMMENDATIONS
8.01 During negotiations, assurances were obtained on the following.u- r.cipal point6:
(a) suitable training arrangements, mutually satisfactoryto the Government and IDA, would be made for silopersonnel (para 4.10); and
(b) audited financial statements would be presented to IDAwithin 6 months of the close of FCI's financial year(para 5.09).
8.02 Conditions of effectiveness of the credit would be that:
(a) FCI had acquired all the sites for the storage facilities(para 4.05); and
(b) well-qualified engineering consultants had been appointedto assist the engineering department of FCI (para 5.05).
8.03 The Project is suitable for an IDA credit and a Swedish Governmentcredit, each in the amount of US$5 million.
June 25, 1971

ANNEX 1
INDIA
WHEAT STORAGE PROJECT
Gross Production of Foodgrains('000 tons)
Rice Wheat Other Cereals Pulses Total Foodgrains
1949/50 25,108 6,755 18,769 10,021 60,6531950/51 22,070 6,829 16,841 9,182 514,9221951/52 22,622 6,343 17,436 9,107 55,5081952/53 24,305 7,613 19,933 9,822 61,6731953/54 29,778 8,106 23,193 11,109 72,1861954/55 26,564 9,146 23,2614 11,632 70,6061955/56 28,674 8,869 19,986 11,687 69,2161956/57 30,230 9,504 20,469 12,134 72,3371957/58 26,539 8,oo5 21,864 10,096 66,50141958/59 32,038 9,957 23,1490' 13,202 78,6871959/60 31,687 10,322 22,872 11,818 76,6991960/61 34,574 10,997 23,743 12,704 82,0181961/62 35,663 12,072 23,216 11,755 82,7061962/63 33,217 10,776 214,630 11,528 80,1511963/64 36,998 9,853 23,718 10,073 80,6421964/65 39,034 12,290 25,234 12,438 88,9961965/66 30,655 10,424 21,151 9,800 72,0301966/67 30,438 11,393 24,053 -8,347 74,2311967/68 37,610 16,540 28,800 12,100 95,0501968/69 39,760 18,650 25,180 10,420 9h,010
Source:- Mir.istry of Food, Agriculture, Community Development andCooperation - Directorate of Economics and Statistics;Estimates of Area.and Production of Principa.l Crops inIndia. (1968-1969), New Delhi, 1969.
- Ihid: Bulletin on Food Statistics, New Delhi, 1969.- Government of India: Economic Survey - 1969-1?70, New Delhi, 1970.
October 5, 1970


INDIA
C+ WWHET STORAGE PROJECT0
Net Production, Imports, Stock Changes and Consumption of Foodgrains
Net Production Net Imports Net Stock Changes Total Net Consumption
Xjheat Rice 2/2 2/ 2/o Wheat Rice Other- Total 'Wheat Rice Other-/ Total Wheat Rice Other- Total Wheat Rice Other- Total
----------------------------------------------------------------000 Ton-------------------------------------------------------
1950 5,938 23,200 23,933 53,071 1,429 359 371 2,159 -220 _354 -291 -865 7,587 23,913 24,595 56,0951951 6,003 20,393 21,661 48,057 3,063 761 977 4,801 +356 +70 +163 +589 8,710 21,084 22,475 52,2691952 5,575 20,903 22,092 48,570 2,551 734 641 3,926 +348 +218 +52 +618 7,778 21,419 22,681 51,878
1953 6,692 22,458 24,814 53,964 1,711 178 146 2,035 -168 -113 -202 -483 8,571 22,749 25,162 56,4821954 7,125 27,515 28,522 63,163 198 628 6 832 -778 +1,034 -54 +202 8,101 27,109 28,582 63,7931955 8,039 24,545 29,196 61,780 440 165 -92 513 +184 -868 -62 -746 8,295 25,578 29,166 63,0391956 7,796 26,495 26,273 60,564 1,104 287 -19 1,372 -50 -540 -12 -602 8,950 27,322 26,266 62,5381957 8,354 27,933 27,008 63,295 2,879 747 -6 3,620 +643 +145 +68 +856 10,590 28,535 26,934 66,0591958 7,036 24,522 26,633 58,191 2,709 396 105 3,210 -307 +8 +30 -269 10,052 24,910 26,708 61,6701959 8,752 29,603 30,496 68,851 3,543 295 13 3,851 +171 +380 -59 +492 12,124 29,518 30,568 72,2101960 9,073 29,279 28,760 67,112 4,376 699 43 5,119 +1,057 +351 -5 +1,403 12,392 29,627 28,809 70,8281961 9,666 31,946 30,154 71,766 3,090 384 12 3,486 -20 -121 -24 -165 12,776 32,451 30,190 75,4171962 10,611 32,953 28,804 72,368 3,249 390 -10 3,629 -42 -303 -10 -355 13,902 33,646 28,804 76,3521963 9,472 30,693 29,967 70,132 4,071 480 -15 4,536 +179 -201 - -22 13,364 31,374 29,952 74,6901964 8,661 34,186 27,715 70,562 5,621 642 -11 6,252 -1,297 +47 +7 1,243 15,579 34,781 27,697 78,o571965 10,803 36,067 31,001 77,872 6,572 780 87 7,439 +858 +89 +116 +1,063 16,517 36,758 30,972 84,2411966 9,163 28,325 25,538 63,026 7,827 776 1,708 10,311 -214 -107 +458 +137 17,204 29,208 26,788 73,2001967 10,014 28,125 26,814 64,952 6,400 448 1,810 8,659 -237 +201 -246 -282 16,651 28,372 28,870 73,8931968 14,562 34,981 34,097 83,640 4,766 443 467 5,676 +1,240 +518 +236 +1,994 18,088 34,906 34,328 87,322196 9(est.) 16,394 36,739 29,128 82,261 3,090 476 270 3,836 +144 +565 -242 +467 19,340 36,650 29,640 85,630
1/ According to GOI statistics, net production u-iffers from gross produaction (Annex 1) by theesmount provided for feed, seed requtreme-ts and \rastage,which i£ estimated at 12.5t- of the grossproduction of all foodgrains.
2/ Other = other cereals and pulses.
Source: Ministry of Food, Agriculture, Community Developrent and Cooperation, Directorateof Economics and Statistics Bulletin of Import Statistics - New Delhi, 1969.


INDIA: WHEAT STORAGE PROJECT ANNEX 3
NET PRODUCTION AND CONSUMPTION OF FOODGRAINS(MILLIONS OF TONS)
120 1 1 1 1 1 1 1 1 1 I 120
FOURTH PLAN'SNET PRODUCTION TARGET /
100 100
80 80
TOTAL CCONSUMP T10IO\N
TOTAL NET PRODUCTION
60 6~~~~~~~~~~~~~0
IFOURTH PLAN 'S NETr PRODUCTION TARGET_v
40 19516016 16 940
FOURTH PLA5NRS_. .. ~~~~~~~~~~ET PRODUCTION TARGET--,,_
20 *fi20
D W _/ASWF I~~~W EAT (PRODUCTION)
O 0 t I -J ll O1950 1955 1960 1965 1969 1974
IBoRD-5000(2R)

ANNEX 4
I N D IA
WHEAT STORAGE PROJECT
Wholesale Price Index Nuibers - Foodgrains and annufactures
1953 = 100Calendar Year
Average Rice Wheat All Cereals Pulses All Foodgrains Manufactures
1950 91 94 93 86 91.51951 lob 96 102 103 102.3 1Q3,71952 100 97 99 98 99.1 119.91953 102 96 100 98 99.6 100.5195h 86 79 84 66 80.8 99.31955 76 70 73 56 69.7 101.11956 93 86 92 78 89.8 100.2192'7 lo, 90 102 85 98.6 106.81958 108 96 105 9b 102.8 108.61959 102 102 10l 100 103.5 108.81960 109 91 105 93 103.0 112.11961 105 89 102 91 99.7 124.51962 109 92 106 lob 105.3 127.21t963 122 91 112 109 111.0 129.4196h 133 123 134 153 137.5 131.7
1965 135 140 145 167 148.8 137.91966 166 146 165 178 167.4 149.91967 201 198 207 271 218.9 163.71968 211 188 205 218 217.4 166.41969 204 188 . 211 175.3
Source: Ministry of Food, Agriculture, Community Development and Cooperation, Directorateof Economics and Statistics, Bulletin on Food Statistics, New Delhi, 1969.
October 5, 1970

INDIA
WHEAT STORAGE PROJECT
Public Distribution of Foodgrains
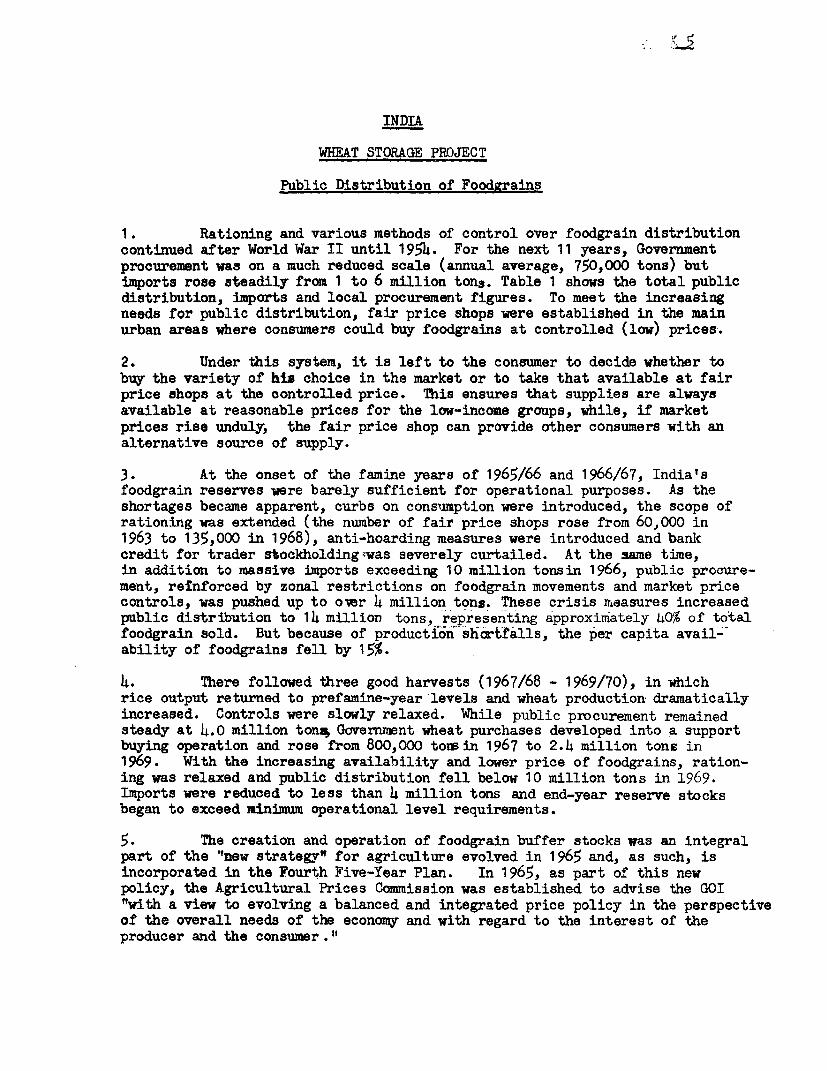
1. Rationing and various methods of control over foodgrain distributioncontinued after World War II until 1954. For the next 11 years, Governmentprocurement was on a much reduced scale (annual average, 750,000 tons) butimports rose steadily from 1 to 6 million tons. Table 1 shows the total publicdistribution, imports and local procurement figures. To meet the increasingneeds for public distribution, fair price shops were established in the mainurban areas where consumers could buy foodgrains at controlled (low) prices.
2. Under this system, it is left to the consumer to decide whether tobuy the variety of his choice in the market or to take that available at fairprice shops at the controlled price. This ensures that supplies are always
available at reasonable prices for the low-income groups, while, if marketprices rise unduly, the fair price shop can provide other consumers with analternative source of supply.
3. At the onset of the famine years of 1965/66 and 1966/67, India'sfoodgrain reserves were barely sufficient for operational purposes. As theshortages became apparent, curbs on consuimption were introduced, the scope ofrationing was extended (the number of fair price shops rose from 60,000 in1963 to 135,000 in 1968), anti-hoarding measures were introduced and bankcredit for trader stockholding;was severely curtailed. At the same time,in addition to massive imports exceeding 10 million tonsin 1966, public procure-ment, reTnforced by zonal restrictions on foodgrain movements and market pricecontrols, was pushed up to oxer 4 million tons. These crisis measures increasedpublic distribution to 14 million tons, representing approximately 40% of totalfoodgrain sold. But because of production shortfalls, the per capita avail-_ability of foodgrains fell by 15%.
4. There followed three good harvests (1967/68 - 1969/70), in whichrice output returned to prefamine-year levels and wheat production dramaticallyincreased. Controls were slowly relaxed. While public procurement remainedsteady at 4.0 million tonq Gcvernment wheat purchases developed into a supportbuying operation and rose from 800,000 tow in 1967 to 2.4 million tons in1969. With the increasing availabil-ity and lower price of foodgrains, ration-ing was relaxed and public distribution fell below 10 million tons in 1969.Imports were reduced to less than 4 million tons and end-year reserve stocksbegan to exceed minimum operational level requirements.
5. The creation and operation of foodgrain buffer stocks was an integralpart of the 'now strategy" for agriculture evolved in 1965 and, as such, isincorporated in the Fourth Five-Year Plan. In 1965, as part of this newpolicy, the Agricultural Prices Commission was established to advise the GOI"with a view to evolving a balanced and integrated price policy in the perspectiveof the overall needs of the economy and with regard to the interest of theproducer and the consumer."
AI]NFX 5Page 2
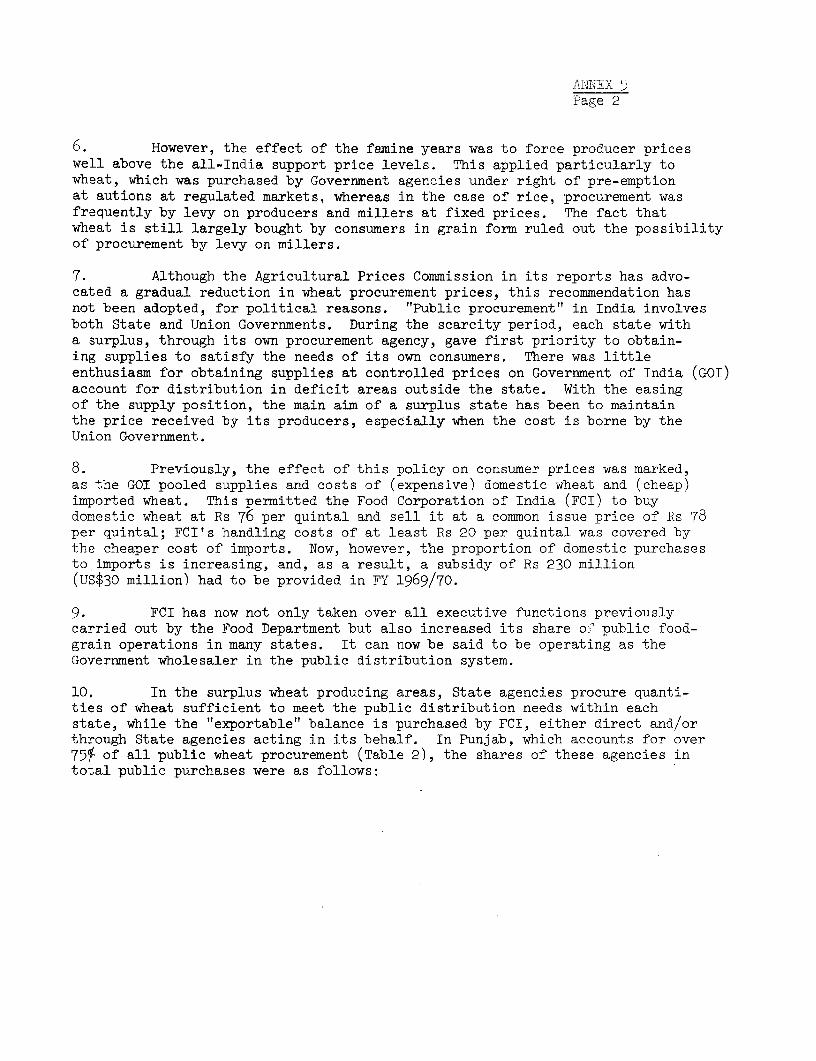
6. However, the effect of the famine years was to force producer priceswell above the all-India support price levels. This applied particularly towheat, which was purchased by Government agencies under right of pre-emptionat autions at regulated markets, whereas in the case of rice, procurement wasfrequently by levy on producers and millers at fixed prices. The fact thatwheat is still largely bought by consumers in grain form ruled out the possibilityof procurement by levy on millers.
7. Although the Agricultural Prices Commission in its reports has advo-cated a gradual reduction in wheat procurement prices, this recommendation hasnot been adopted, for political reasons. "Public procurement" in India involvesboth State and Union Governments. During the scarcity period, each state witha surplus, through its own procurement agency, gave first priority to obtain-ing supplies to satisfy the needs of its own consumers. There was littleenthusiasm for obtaining supplies at controlled prices on Government of India (GOI)account for distribution in deficit areas outside the state. With the easingof the supply position, the main aim of a surplus state has been to maintainthe price received by its producers, especially when the cost is borne by theUnion Government.
8. Previously, the effect of this policy on consumer prices was marked,as the GOI pooled supplies and costs of (expensive) domestic wheat and (cheap)imported wheat. This permitted the Food Corporation of India (FCI) to buydomestic wheat at Rs 76 per quintal and sell it at a common issue price of Rs 78per quintal; FCI's handling costs of at least Rs 20 per quintal was covered bythe cheaper cost of imports. Now, however, the proportion of domestic purchasesto imports is increasing, and, as a result, a subsidy of Rs 230 million(US$30 million) had to be provided in FY 1969/70.
9. FCI has now not only taken over all executive functions previouslycarried out by the Food Department but also increased its share of public food-grain operations in many states. It can now be said to be operating as theGovernment wholesaler in the public distribution system.
10. In the surplus wheat producing areas, State agencies procure quanti-ties of wheat sufficient to meet the public distribution needs within eachstate, while the "exportable" balance is purchased by FCI, either direct and/orthrough State agencies acting in its behalf. In Punjab, which accounts for over75% of all public wheat procurement (Table 2), the shares of these agencies intotal public purchases were as follows:

ANNEX 5Page 3
1969/70 1968/69Purchases Percentage Purchases Percentage
to End of Total to End of TotalJuly Purchases July Purchases'OOOT 'OOOT '
Procurement Agency
Punjab Civil SuppliesDepartment
(purchases for distributionwithin Punjab only) 307 17.o 309 24.0
FCI Interstate Distribution
Own purchases 734 40.0 498 38.5
Purchases +through agencyof Punjab CooperativeSupply and MarketingFederation 783 43.0 488 37.5
1,824 100.0 1,295 100.0
Purchases by the Punjab Civil Supplies Department remained at about the
same level, so that the residual purchase by or on behalf,of FRI increased withthe growth of the marketed surpluses.
11. Public sector buying agencies operate through the markets (mandis),using the traditional channels of buying and selling agents and public auction.The absence of standardized grading leads to visual assessment of each lot forprice differentials of only Rs 0.2r up or down on the basic purchase price ofRs 76 per quintal.
12. Harvesting of wheat in the surplus producing areas of North-west India(mainly Punjab, Haryana and Western Uttar Pradesh) takes place between mid-Apriland early July. Marketed surpluses have increased at an even faster rate thanproduction, as evidenced by the public procurement figures given below:

ANTNE X 5Page 4
Wheat 1.268/69 1967/68 1966 6
_________________- '000 tons)-----------
Production 20,000 18,650 16,567 11,528
Public procurement 3,700 2,386 2,262 815
Public procurement inpercentage of production 18.5 12.8 13.7 7.1
IEstimates.
At the same tine, the proportion of w1-eat marketings during the post-harvestmonths of April/June to annual marketings rose from about 65% to over 85%.This new marketing pattern was due to such factors as producers' fears thatGovernment agencies would not be able to sustain prices under pressure oflarger crops; doubts as to the storage capacity of the new varieties; thespread of mechanical threshers and irrigation, making possible increasedcropping intensity; and the shortage of on-farm storage.
October 5, 1970
ANNEX 5Table 1, Page 1
I' DIA
WHEAT STOiRAGE PROJECT
Public Distribution, Local Procurement and Imports
Op J Local Total Issues from Clos-Year Grain Openlng Procure- Imports avail- Govt ing
Stock ment ability Godown Stocks
--------------------imillion tons------------------------
1948 Rice 0.3 2.4 0.9 3.6 3.0 o.6
Wlh.a 0.2 Neg. 1,3 1.5 1,3 0,2Others 0.2 0.3 0.7 1.2 0.9 0.3Thtal °07 2.7 2.9 6.3 5.2 1.1
1949 Rice o.6 3.0 0.8 4.4 3.7 0.7heat 0.2 CO6 2.2 3.0 2.5 0.5Others 0.3 1.0 0.7 2.0 1.6 004
Total 1.1 Lt6 3.7 9.4 7.8 1.6
1950 Rice 0.7 2.8 0.3 3.8 3.5 0.3Wheat 0,5 1.1 1.5 3.1 2.8 0.3Others 0.4 0.8 0.3 1.5 1.4 0.1
Total 1.6 4.7 2.1 8.4 7.7 0.7
1951 Rtice 0.3 244 08 365 3.1 0.4Wheat 0.3 0O8 3.0 4.1 3.5 o.6Others 0.l oO6 1.0 1.7 144 0.3
Total 0.7 3.8 4.8 9.3 8.o 1.3
1952 Rice 0.4 2.0 0.7 3,1 2,5 o.6Wheat o.6 0,8 2.6 4.0 3,0 1.0Oth-t-r7 0.3 0O7 0,6 1.6 1,3 0.3
Total t 3a5 3,9 9,7 6.5 1.9
1953 Rice 0.6 1.7 0.2 2.5 2.0 0.5I*aeat 1.0 0.2 1.7 2.9 2.1 0.8Others 0.3 0.2 0.2 0,7 065 0,2Total 1,9 2.i 2,1 6.1 4.6 1.5
1954 Rice -. 1,4 0.7 2.6 1.0 1,6Wheat , 6 - 0.2 1.0 1.0 Neg.others ?.2 Neg. Neg. 0,2 0O1 01Total 114 0.9 3.5 2,1 1.7
1955 Rice 1.6 Neg. 0.3 109 1.2 0.7lWheat Neg. 0.1 0.4 0.5 0.3 0.2Othars 0.1 1 Neg. - 001 01 Neg,Total 1I.7 0,1 0.7 2,5 1.6 0.9
1956 R3ao N,g. 0.3 1.0 0.9 0.1Whlleat 0.2 - 1.1 1.3 1.1 0.2(Oters Neg. - Neg. Neg. -
Total 0.9 Neg. 1.4 2,3 2,0 0.3
October 5, 1970

ANNiX 5_e 1, Page 2
INDIA
WHEAT STORAGE PROJECT
Puolic Distribution, Local 'rocurement and Imports (Continued)
Local Total Issues from Clos-Year Grain Spockg Procure- Imports avail- Govt ingStack ment ability Codown Stocks
…-nmillion tons---------------------
1957 Rice 0.1 0.2 0.8 1.1 0.8 0.3Wheat 0.2 - 2.8 3.0 2.2 0.8Others - 0.1 - 0.1 Neg. 0.1Total 0.3 0.3 3.6 4.2 3.0 1T2
1958 ?ice 0.3 0.5 0.4 1.2 0.9 0.3Waheat 0.8 - 2.7 3,5 3.0 0.5Others 0.1 Neg. 0.1 0.2 0.1 0.1Total 1.2 0.5 3.2 t49 4.0 009
1959 Rice 0.3 1.5 0,3 2.1 1.4 0.7Wheat 0.5 0.3 3.5 4.3 3.6 0.7Others 0.1 Neg. Neg. 0.1 0.1 Neg.Total 0o9 1-, 3.7 6.5 5.1
1960 Rice 0.7 o.8 0.7 2.2 1.2 1.0Wheat 0.7 0.4 4,3 5.4 3.7 1.7Others Neg. Ne* _ 0.1 0.1 0.1 Neg.Total 1.'- 1.,' 5.-1 7.7 5.0 2.7
1961 Rice 1.0 0.5 0.4 1.9 1.0 0.9-Wheat 1.7 Neg. 3.0 4,7 3.0 1.7Others Neag. Neg. Neg. Neg. Neg. Neg.Total 2,7 0L5 3,4 6,6 4.0 2.6
1962 Rice o.9 0.5 0.4 1,8 1.2 o.6Wheat 1.7 Neg. 3.2 4.9 3.2 1.7Others Ney. Neg. - Neg. Neg. Neg,Total 2.6 005 3,6 6.7 4,4 2,3
1963 Rice o,6 0,7 0.5 1.8 1.4 0.4Wheat 1.7 Neg. 4.0 5.7 3.8 1.lOthers Neg. aeg, Neg. Neg. Neg.Total 2,3 0.7 o_ 7 5 5.2 2,3
1964 Rice 0.4 1,3 o.6 2,3 1.9 0,4Wheat 10° Neg. 5.6 7.5 6.9 o.6Others Neg. Neg. - Neg. Neg. Neg.Total T 103 9.5 Mo. 1.0
1965 Rica 0.4 2.9 0.8 4,1 3,5 o.6,dheat 01' 0. 4 6.6 7.6 6,2 1.4Others Ngeu. 007 0,1 oO8 0.7 0.1Tota 1 o 75 1225 10.L ; 2-1
October 5, 1970
ANNEX5Table 1, Page _
INDIA
WHEAT STORAGE PROJECT
Public iDistribution, Local R>rocurement and Imports (Continued)
Local Total Issues from Clos-Year Grain Opening Procure- Imports avail- Govt. ing
Stock ment ability Godown Stocks
--- n-illion tons----------------------
1966 Rice o.6 3.1 0.8 4.5 4.1 0.4Wheat 1.4 0.2 7.8 9.4 8.2 1.2Others 0.1 0.7 1.8 2.6 2.0 o.6Total 2.1 4.0 10.4 16,5 143 2.2
1967 Rice 0.4 2.8 0.5 3.7 3.1 o.6WJheat 1.2 0.8 6.4 8.4 7.4 1.0Others o.6 0.9 1.8 3,3 3.0 0.3Total 2.2 4,5 807 15.4 13.5 1.9
1968 Rice o.6 3.4 0.4 4.4 3.2 1.2Wheat 1.0 2.3 4.7 8.0 5.8 2.2Others 0.3 1.0 0.5 1.8 1.2 o.6Total 1.9 6.7 5.6 14.2 10.2 4.0
1969 Rice 1.2 3°5 0.5 5.2 3.4 1o8Wlheat 2.2 2.4 3.O 7.6 5.3 203Others o.6 04 0.3 1,3 1.0 0.3Total 4.0 6.3 3.8 14.1 ).7 474
October 5, 1970
AN 'T f:
INDIA
WHEAT STORAGE PROJECT
otal Public Procurement and Public Distributionby State and Main Foodgrains
Public Procurement Public DistributionWheat _ice Other To Dal Wheat Rice Other Total
--------------- ---------- '000 ton------------------------------
North Zone
Jammu and Kashmir 4 47 -- 51 75 65 -- 140Punjab 1,882 370 73 2,325 154 10 -- 164Haryana 271 212 Neg. 483 78 11 __ 89Rajasthan __ -- -- -- -- -_ --Uttar Pradesh 201 217 3 421 314 74 33 421Delhi 1 -- -- 1 264 20 1 285Others 2 -- -- 2 18 1 -- 19
TOTAL 2,361 846 76 3,283 903 181 34 1,118
West Zone
Madhya Pradesh 32 319 30 381 96 15 35 146Gujarat -- 18 -- 18 193 64 118 375Maharashtra -- 186 248 434 1,026 455 427 1,908Others -- 1 -- -1 21 19 Neg. 40
TOTAL 32 524 278 834 1,336 553 580 2,469
East Zone
Assam Neg. 136 -- 136 130 63 -- 193Bihar 10 66 -- 76 461 16 8 485West Bengal Neg. 447 -- 447 1,132 610 43 1,785Orissa -- 277 __ 277 99 24 -- 123Others 10 3 6 19 315 154 137 606
TOTAL 20 929 6 955 2,137 867 188 3,192
South Zone
Andhra Pradesh -- 356 356 115 225 22 362Kerala 94 -- 94 150 850 -- 1,000Tamil Nadu __ 632 __ 632 359 789 1 1,149Yiysore Neg. 71 20 91 173 50 52 275Others __ 13 -- 13 2 16 -- 18
TOTAL Neg 1,166 20 1,136 799 1,930 75 2,804
Total Procurement 2,413 3,465 380 6,258
Inports 3,090 487 29$ 3,872
Stock Changes (J)328 (J+)21 £-)202 Lt54?.
Total PublicDistribution - 1969 5,175 3,531 877 9,583 5, 175 3,531 877 9,583
Sonrce: Ministry of Food, Agriculture, Community Development ana Cooperation.
October 5, 1970
va5 ~~~~~~~~~~~~~~~~~~~~~~~~~~~~~INDIA
WHEAT STORAGE PROJECT
Total Public Storage Ca02r4tcandS;oeks (as of March 31, 1970)
TDTaD STORAGE CAPACITY Total STORAGE CAPACITY WITT FCIFoodgrainc Hired Hired Total Total
Total with Total sith FGI Stocks from from Hired Hired Total Capacity StocksPCI State Govt CWC 1/ Total Hired frb,, Total- ith All FCI Private State from from Hired with with
Nc. Stats/Zone OGaed Osmed Omrea Owned Private Sector CaPacity Aguncies Owned Sector Govt SWC 2/ CNO b CI FCI FCI(2) 727(T5) (7) -79- 7--7) -MT) (11) 77 TT37' $F 7(177 T
!NORTH ZONS
1. Pomjab 261 32 11 3Q4 144 448 377 261 144 18 1 10 173 434 2182. Haryana 70 35 13 118 14 132 69 70 14 - - - 14 84 483. Rajacsthac 69 30 41 140 - 140 127 69 - - 38 19 57 126 854. Uttar Pradesh 034 46 15 495 135 630 293 434 135 32 25 14 206 640 2355. Delhi 119 30 149 - 149 75 119 - C - 90 20 139 72
Total 953 143 110 1,206 293 1,499 941 953 293 50 64 63 470 1,423 658
WEST ZONE
6. Madhya Pradesh 81 82 17 180 58 238 113 81 58 33 29 7 127 208 1067. Gujarat 49 138 13 200 90 290 229 49 90 33 6 34 163 212 1478. Mrhsrashtrr 680 426 24 1,130 275 1,405 1,003 680 275 96 - 3 374 1,054 797
Total 810 646 54 1,510 423 1,933 1.345 810 423 162 35 44 664 1 ,474 1 050
EAST ZONE
9. Asesm 40 16 18 74 90 164 132 bo 90 6 12 6 114 154 10410. Bihar 165 17 - 182 13 195 150 165 13 9 - - 22 187 10011. West BRngal 2G2 293 - 555 262 817 490 262 262 274 63 219 818 1,079 40912. Orissa 125 41 5 61 4 65 1 3 15 4 3 8 14 19 34 16
Total 482 367 23 872 369 1,241 935 482 369 292 63 229 973 '1,454 629
SOTh ZONE
13. Andhra Pradech 130 88 322 540 12 552 280 130 12 12 41 3°4 369 498 28314.E.Yeralo 138 39 9 185 58 243 243 138 58 29 7 10 104 243 20015. Tamil NHd, 198 22 214 434 18 452 319 198 18 1 3 133 155 353 2066. Yysore 60 53 20 133 - 133 146 60 _ - _ 6 14 74 43
octal 526 202 565 1,292 88 ,380 988 526 88 50 51 453 642 1,167 732
17. Union - 89 - 89 - 89 109 _ - - - --Territories _
Grand Total 2,771 1,447 252 4,969 1,173 6,142 4,31P 2,771 1,173 5514 333 _9 2,749 5,520 3,069
YearMarch 1970 2,771 1,447 751 4,969 1,171 6,142 4,318 2,771 1,173 555 233 789 2,719 5,520 3,069March 1969 2,4 25 1,447 657 4,529 1,451 5,980 4,516 2,125 ----- 1,451---- 316 717 2,484 4,909 3,253March 1968 1,243 1,447 652 3 .cg3/ 461 4,919 2,031 1,243 461 Incl. in I-cl.in 272 733 1,976 1,471March 1967 1,052 1582 52 15'7r 3 454 14811 2,064 1,052 454 001.1C" Ccl 10 148 602 1,654 680March 1966 569 1,447 416 4,156 !/ 49 4,205 3,274 569 49 " I' 70 119 688 543
4/ Central Wrrehonsing Corporation.
2/ State Warehousing Corporation.
3/ Includirg CentraL Food Departeerc or.ed.


INDIA
WHEAT STORAGE PROJECT
Analysis of Operational Storage Requirements
1. Operational public foodgrain stocks are defined to consist of grainheld in storage as a prerequisite for operating India's normal public distri-bution system of foodgrain. The amount of grain handled by the public distribu-tion system can be regarded as a deliberate policy decision, which is independ-ent of year-to-year fluctuations in grain production. These latter fluctuationsare off set by varying imports or contingency stocks (Annex 21). Therefore, in add-tion to the overall magnitude of the public distribution system, the monthlyprocurements and issues and the extent to which storage facilities can be usedto meet requirements are the major determinants of storage capacity requiredfor operational purposes.
2. Public distribution was about 9.7 million tons in 1969. This year canbe regarded as a normal year during which additional distribution, because ofshortfalls in production, did not take place. Normal public distribution isassumed, therefore, to consist of about 9.7 million tons, evenly distributedthroughout the year. About 30% of the foodgrain publicly distributed wasimported, while the remainder was procured domestically. Domestic procurementis distributed unevenly throughout the year. For instance, nearly 85% of the totalwheat requirements is procured from May to July; consequently, more storagecapacity is needed than if the wheat were imported.
3. Table 1 presents an analysis of operational stock requirements forcases in which:
(a) 70% of all foodgrain is procured domestically; and(b) 100% of all foodgrain is procured domestically.
4. Assumptions for the calculations are as follows:
(a) annual sales must equal annual purchases, thus abstractingcompletely from contingency stocks;
(b) month-end stocks amount-to 1 month's sales. In reality,such stocks are higher, thus leading to a higher storagecapacity; and
(c) imports are distributed evenly throughout the year, thusabstracting from varying imports. This is a reasonable assump-tion, because it takes many months before imports arrive and amore or less regular flow of imports must therefore be maintained.
5. The analysis in Table 1 shows that a storage capacity of about 3.9million tons is needed if only 70% of the foodgrain distributed is procureddomestically and that about 5.7 uiillion tons capacity is needed if the publicdistribution system depends 100% on domestic procurement.
October 9, 1970

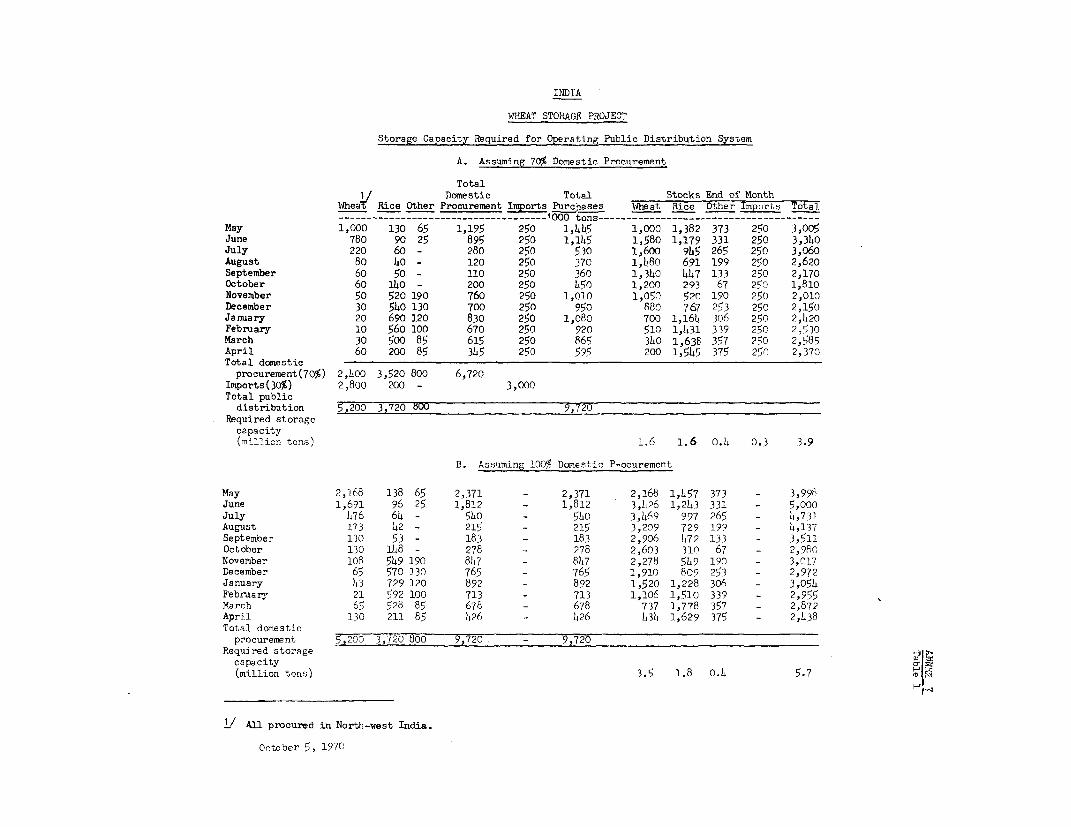
INDIA
WHEAT STORAGE PROJECT
Storage Capacity Required for Operating Public Distribution System
A. Assuming 70% Domestic Procurement
Total1/ Domestic Total Stocks End of Month
WheaT Rice Other Procurement Imports Purc,hases Wheat Rice Other Imports Total
------------------------------------- 1000 tons---------------------------------------
May 1,000 130 65 1,195 250 1,445 1,000 1,382 373 250 3,005
June 780 90 25 895 250 1,145 1,580 1,179 331 250 3,340
July 220 60 - 280 250 530 1,600 945 265 250 3,060
August 80 40 - 120 250 370 1,480 691 199 250 2,620
September 60 50 - 110 250 360 1,340 447 133 250 2,170
October 60 140 - 200 250 l,50 1,200 293 67 250 1,810
November 50 520 190 760 250 1,010 1,050 520 190 250 2,010
December 30 540 130 700 250 950 880 767 253 250 2,150
January 20 690 120 830 250 1,080 700 1,161 306 250 2,420
February 10 560 100 670 250 920 510 1,h131 339 250 2,530
March 30 500 85 615 250 865 340 1,636 357 250 2,585
April 60 200 85 345 250 595 200 1,545 375 250 2,370
Total domesticprocurement(70%) 2,400 3,520 800 6,720
Imports(30%) 2,800 200 - 3,000
Total publicdistribution 5,200 3,720 UOO 9,720
Required storagecapacity(million tons) 1.6 1.6 o.4 0.3 3.9
B. Assuming 100% Domestic Procurement
May 2,168 138 65 2,371 - 2,371 2,168 1,457 373 - 3,998June 1,691 96 25 1,812 - 1,812 3,4126 1,243 331 - 5,000
July 476 64 - 540 - 540 3,469 997 265 - 1,731August 173 42 - 215 - 215 3,209 729 199 - 1,137September 130 53 - 183 - 183 2,906 172 133 - 3,511
October 130 148 - 278 - 278 2,603 310 67 - 2,98O
November 108 549 190 847 - 847 2,278 519 190 - 3,017December 65 570 130 765 - 765 1,910 809 253 - 2,972
January 43 729 120 892 - 892 1,520 1,228 306 - 3,054
February 21 592 100 713 - 713 1,106 1,510 339 - 2,955March 65 528 85 678 - 678 737 1,778 357 - 2,872April 130 211 85 126 - 126 131 1,629 375 - 2,438
Total domesticprocurement 5,2^o 3,720 800 9,720 - 9,720
Required storagecapacity(million tons) 3.5 1.8 0.4 5.7 ID
/ All procured in North-west India.
October 5, 1970


.rNX 8fage 1
INDIA
WHEAT STORAGE PROJECT
Technical Specifications for Godowns and Silos
A. General
1. The technical specifications outlined in this annex serve only toprovide basic requirements. It would be essential to ensure that detaileddesigns and specifications be drawn up for each site for tender documents.Since FCI has limited experience in silo construction, consultants ofproven capacity in this field would be appointed to assist FCI's TechnicalEngineering Department.
2. Tentative site locations are shown in Annex 9 and on the attachedmap but these would be confirmed in the light of more detailed studies oflikely wheat flows. As soon as specific sites are selected and title tothem acquired, complete surveys would be made to delineate exact boundariesand topographical features.
3. After site surveys have been completed, general soil conditions ateach site would be investigated by a competent soils engineer to determinethe best foundation design. Preliminary indications are that piles would berequired at all silo locations. If th3 soil investigation for any particularsite indicates unusual conditions or an undue lack of uniformity, additionalsurveys would be made of the areas within the site boundaries on which thestructure9 would be built.
Before inviting tenders, it would be necessary to draw up separateprequalifications for prospective bidders for godown and silo construction.Tender documents would be prepared by consultants in cooperation with theTechnical Engineering Department of the FCI; tenders would define in detailthe work to be executed and would serve as a basis for the preparation of work-ing drawings by the successful tenderer.
5. Tenders received from prequalified contractors would be evaluated bythe technical staff of the FCI, with the assistance of the consultant, todetermine the conformity with tender invitations. Selection of successfultejderers would be in accordance with standard procedures. Successfultenderers would be awarded construction contracts in conformity with FCI standardprocedures.
6. Supervision of construction and equipment installation of all unitsto assure conformity with all tender requirements would be provided by theconsultant, who would be responsible to the technical department of FCT.
ANNEX _Page 2
B. Godowns
General
7. Godown construction and site layout would be based on the receiptof grain in bags by any means of conveyance - bullock cart, tractor trailer,and truok. Site development cost estimates include the cost of provision ofaccess roads, railway sidings, an office and a weighbridge, although actualneeds can only be determined when specific sites are acquired.
8. No provision is made for mechanical equipment, although considerationmay have to be given at a later stage to the use of mechanical bag stackersin godowns if laborers resist stacking bags to the desired height.
9. It is assumed that operating supplies will be drawn from normal FCIsources, and that no utility connections would be required other than water,electricity and sanitary facilities for the office building.
Construction
10. Standard design of flat stores, measuring approximately 21.6 metersby 129.5 meters internally, divided into four compartments and rated at 5,000tons capacity for wheat storage, would constitute the basic unit. Placedeither end to end or side by side, according to the configuration of theplot and road and rail access needs, two such units would make up a 10,000_tonstore (Figure 1).
11. Foundations would be of reinforced concrete construction, withfloors of plain concrete poured on well compacted fill to prevent settlementunder load. The top layer of fill would be of a granular material to preventthe migration of moisture to the slab by capillary action.
12. Platforms along each side of the godowns would nominally be 3 meterswide on rail side and 2.5 meters wide on road side, of plain concrete, pouredon compacted fill with a granular layer immediately below the slab. Plat-form slabs would be sloped to provide drainage. Platforms would be approximately1 meter above ground level to prevent rodents from entering the godowns, withno permanent stairs to platform level and with wooden buffers at road accesspoints.
13. Columns and beams in the main building frames would be of reinforcedconcrete, wall panels between the columns and beams being of conventional brickconstruction, covered inside and outside with cement plaster and with bothsides protected with suitable masonry paint.
Page 3
14. Roofs of the godowns and platform covers would be of eithercorrugated asbestos or galvanised corrugated steel sheets, dependingon availability and price. They would be supported by fabricated steeltrusses to give a clear height fram floor to bottom chord of roof trussesof approximately 6 meters. It would be necessary to make adequate provisionfor ventilation, with all openings screened to keep out birds and rodents.
15. Manually operated doors of the rolling shutter type, with reinforcedconcrete lintels and space for the rolling shutter cage, would be provided.All doors would be fitted with a lightweight, steel framed, screen panel inWhich would be mounted a swinging, screened access door; panels would befabricated so as to be readily removable, but capable of preventing the entryof birds and rodents when they are in place.
16. Platform covers would have continuous gatters along their outsideedgqs, discharging into downspouts connected to a drainage system to lead theiwater away from the godown and into natural drainage channels. Gutters anddownspouts would be of metal or asbestos, depending on availability and price.
C. Silos
General
17. For silo design,it is assumed that grain would be received in bulkby bullock cart, tractor trailer and truck, and that, in the future, FCIwould effect purchases direct from producers at silos, thu- bypassing thetraditional market and reducing handling costs. In view of the consumerpreference for grain, it must, however, be expected that dispatches willbe in bags, although some growth in bulk movements between silos in producingand consuming areas is possible.
Construction of Silo and Headhouse
18. Silos would be constructed in 20,000-ton units, made up of 12 roundbins, each of approximately 8 meters inside diameter and 40 meters high,separated by approximately 1½ meters to provide space for the reclaim conveyor.Interstice spaces would be util.zed for storage by constructing an overheadbin bottom slab (Figure 2). The reclaim conveyor would be located in a trench builbelow the level of the top of the main foundation slab. The 20,000-toncapacity is based on wheat weighing 750 kg per cubic meter, with an allowancefor sloping hoppering at the bottom to the discharge openings at the side of thecell adjacent to the reclaim conveyor, an allowance at the top for the naturalangle of repose of the grain from the point of filling, and a factor for thepacking effect of the grain in the bins. This packing factor is assumed to be5% in the round bins and 2% in interstice spaces. Should it be decided toeliminate the sloping hopper fill in favor of flat bottom bins, the storagecapacity would be increased by approximately 100 tons for each of the roundbins. It would be possible to install the hopper fill at a later date if itis excluded from the original construction. The interstice spaces would behoppered in the original ph-se as the amount of fill required is quite smalland the effect on total cat. i1ty is not appreciable.

ANNEX 8Page 4
19. Silos would be designed to be built of reinforced concreteand by the slip form method. The time schedule in Annex 12 is basedon the assumption that the 12 round bins would be divided into two groups of6 eachJfor construction purposes. Should it be necessary, because ofconstruction equipment limitations, to divide the total of 12 into threegroups of 4 each, the time schedule would be extended about 2 months.
20. Cost estimates have been based on the assumption that the silofoundation would be a slab supported on piles. It would be the respon-sibility of the consultant to determine the most economical arrangement,based on the site investigations.
21. The silo roof would be of reinforced concrete adequately supportedto carry the loads imposed by the equipment located within the gallery,together with an allowance for live load such as could be created by spillageof grain.
22. The silo gallery would be a lightweight, steel-framed structurecovered with corrugated asbestos or galvanized corrugated steel siding androofing, with windows for light and ventilation.
23. The headhouse would be approximately 7.5 x 10 meters and 50 meterstall, with the top of its foundation slab at an elevation sufficiently belowthe storage foundation slab to permit the reclaim conveyor to discharge intothe main elevator boots by gravity. The foundation slab would be of reinforcedconcrete supported on piles; the foundation walls to the ground floor levelwould also be of reinforced concrete and would be waterproofed to eliminateseepage caused by high groundwater levels. The headhouse above the foundationwalla would have a reinforced column frame and brick panels, plastered andpainted. Floors and roof will be of reinforced concrete. A stair from thetop of the foundation slab to the top floor in the headhouse, together withaccess doors and adequate windows to provide light and ventilation, would beinstalled.
Other Civil Engineering
24. Pits for receiving grain from trucks and tractor trailers would havea capacity of approximately 7 tons, and pits for receiving grain from bullockcarts would have a capacity of approximately 2 tons, both measured on a water-level full basis. AUl pits would have grating tops, and those for bullock cartswould have grating covers to allow the bullocks to travel over them. All pits,as well as the tunnels connecting them to the headhouse,would be of reinforcedconcrete construction and waterproofed against groundwater leakage.
25. Bagging platforms would be provided on both sides of the silos andheadhouse, of appropriate height to serve trucks on the road side of the silosand to serve railroad wagons on the rail side. They would be constructed withbrick retaining walls and plain concrete slab on compacted fill. The exactarrangement of these platforms would be determined in the detailed engineeringphase by the consultant to suit the requirements of each specific site. A totalof 2,000 m2 of platform has been included in the cost estimates.

ANNEX 8Page 5
26. It would be necessary to provide sheds over the receiving pits anda roof over the bagging platforms. These would have structural steel franesand either corrugated asbestos or galvanized, corrugated steel covering.
27. Miscellaneous structures such as office buildings, storehouses,workshops, lavatory blocks, watchman's quarters, fence and gatehousewould be included as required for each specific site. Their constructionwould be in accordance with conventional designs and would be of materials usuallyutilized for similar structures.
Mechanical Equipment
28. Weighbridges with 3-meter-x-9-meter platforms and a capacity of20 tons, would be installed, complete with indicating dial and ticket printer.
29. Truck lifts would be of the cradle type, with a lifting capacityof 5 tons. The lifting mechanism would be mounted on a frame, equipped withwheels, 80 that it could be moved on rails to accommodate vehicles of differentlengths. Supports for the rails would be provided in the framing of the shedsthat cover the pits. Lifts would have electric motor and drive.
30. Conveyors would be either belts or drags, with a capacity of 100 tonsper hour, with the final determination of the type of anveyor to be used depend-ing on conditions prevailing at the time the detailed engineering is completed.All conveyors would have electric motors and drives, and, if belt conveyorswere used, movable trippers would be supplied for the distributing conveyors.
31. Bucket elevators, with a capacity of 100 tons per hour, would be ofsteel and designed to discharge fully at recommended operating speeds. Theywould be fastened to rubber-covered belting of the proper number of piles, withbelting ends jointed by mechanical fasteners. Pulleys, shafts, bearings andtakeups would be supplied as part of the bucket elevator assembly, togetherwith motors and drives.
32. Grain cleaners would be the oscillating screen type,with a capacityof 50 tons per hour. Cleaners would be designed to remove materials, bothcoarser and finer than the grain itself, and be equipped with aspirationconnections at both the feed and discharge ends to remove particles thatfloat above the grain mass.
33. Bagging machines would be of the portable type and capable of makingfour weighings of 100 kg per minute when fed by a continous stream of grain.Each bagging machine would be complete with its own sewing conveyor and bagstitching machine, all of which would be electrically operated.
34. Equipment would be needed to funigate grain stored in the siloin the event of insect infestation. This could be either liquid or pelletedfumigant, as recommended by the consultant.
35. In the round bins, aeration equipment of the pull-through type toenhance the effectiveness of the fumigation process and with a capacity of 1/10cfm per bushel would be installed.

ANNEX 8Page 6
36. Temperature-indicating cables would be instua_ Ltid 'u all bins, withsensing points spaced at 3-meter intervals. Cables would be suspended fromthe silo roof slab and be connected to lead wires that terminate in a manuallyoperated reading instrument located at an appropriate point in the headhouse.
37. Dust collection equipment would be installed as required, withdeductions at every point where dust is generated by a moving stream ofgrain, except at the receiving pits.
38. Miscellaneous mechanical work would include the iiecessary spouting,supports and all other items required to create a fully operational installation.
Electrical Installations
39. Electrical work would begin at the point where thb connection wasmade to the high tension transmission line of the State Electricity Board.It is estimated that the size of the primary feeder would be approximately150 kw.
40 A main switch of approximately Ii kw would be supplied ahead of thetransformer bank to reduce the primary voltage to secondary level of 400/216,together with main distribution switches and wiring.
41. Adequate lighting of all operating areas would be provided, includ-ing general lighting and aircraft obstruction lights, and grounding and light-ningprotection as required.
42. There would be straight line, sequenice interlocking of electricallydriven components, and provision would be made for a flow panel to be locatedin an appropriate spot in the headhouse. This panel would indicate only theposition or operating condition of any piece of equipment in the silo; it wouldnot provide remote control of any item.
43. The estimates include the furnishing and installing oif a two-manpassenger lift in the headhouse, together with a machinery hoist of 1-toncapacity and all miscellaneous electrical items required to create a fullyoperable electrical system.
D. Time Schedules
Godowns
44. Since adequate drawings of godowns are already available, the timeneeded for the preparation of tender documents is short. Moreover, as thistype of civil engineering construction is within the capacity of local contractors,work on all 10 godowns could proceed simultaneously, and, as shown by thetime schedule in Annex la all godowns could be ready within 1 year of siteselection.
Silos
45. As will be seen from the time schedule, it is considered that,because of the nature of the preparatory work (selecting and checking sites,

ANNEX 8Page 7
land and soil surveys, preparation of tender documents and bidding procedures),construction viU comence some 15 months after the date of site selection.
46. A further constraint wiU be the availability of specialized equip-ment, especially for slip form construction of the concrete bins. If onecontractor uses the same equipment for two silos, they can both be in operation34 months after site selection.
October 5, 1970

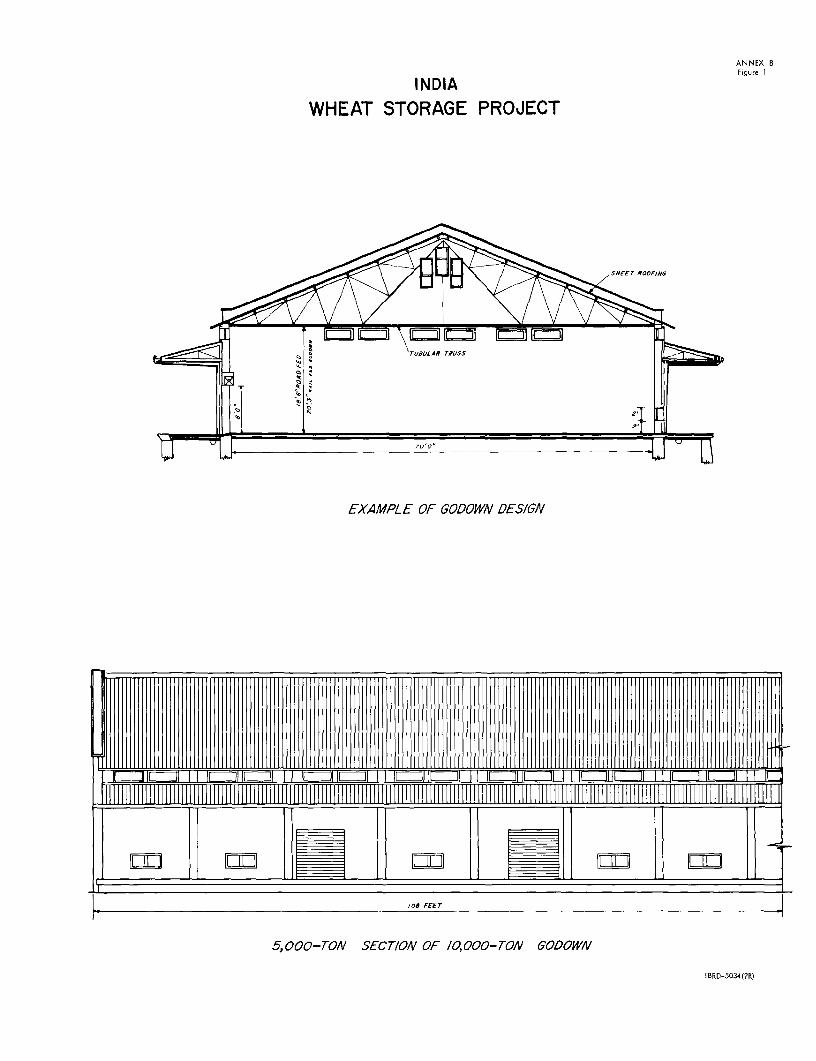
ANNEX 8Figure I
INDIA
WHEAT STORAGE PROJECT
,X~~~~~~~~~~~~~~~~~~~~~~~~~~~~~~~~~~~'
X ~~~~~~~~~~~~~~~~~~~~~~SE r TROOFING1
1~~~~~~~~~~~~~~~~~~~~~~~~1
EXAMPLE OF 600WN! DESIGN/
l1 1= LT I Xrl ii 1 1 l . l 1= 1 I I 1= 1 1= 1 II 1= 1 lI IIIII llll lllllllll llhllllllllIE llllllIIIIIIIlIIIIUI[II II 1IIIl1IB 11111 Bll _____ ___________ullllllllllllllllllllllllllllll
F os~b FEF rK __
5,000-TON SECT/ON OF /0,000-TON GODOWW
1 3RD-5034(2R)

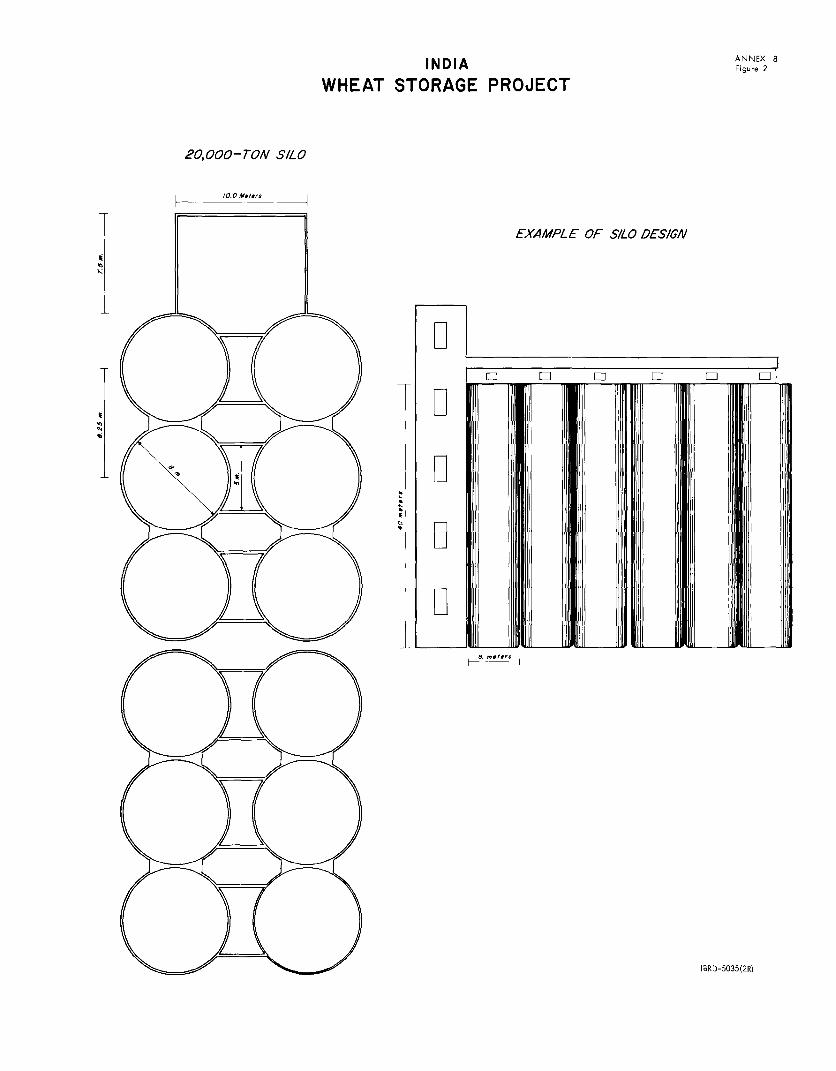
ANNEX 8INDIA Figure 2
WHEAT STORAGE PROJECT
20,000-TON SILO
I /0.0 M¢eIersI
EXAMPLE OF SILO DES/GN
l l [:] C] E z CZ z I~~~~~~~~~~~~~El F-
m_I


ANE1X 9
I N D I A
WHEAT SrORAGE FROJECT
Tentative Location of Godowns and Silos
Storage Proposed MarketState District Location of (in metric tons) Arrivals
Site Silo Conventional (in metric tons)
I. Punjab Ferozepur Moga 20,000 - 64,000
Ferozepur Ajitwal - 10,000 20,000 2.
Ludhiana Jagraon 20,000 - 71,000
Bhatinda Bhatinda 20,000 - 40,000 2.Bhatinda Faridkot 20,000 - 35,000 1/Patiala Gobindgarh 20,000 - 50,000 2/
Jullundur Bhogpur - 10,000 20,000 2'Amritsar Mehta - 10,000 16,000
Ludhiana Sultanpur - 10,000 16,000
Total 100,000 40,000
II. Haryana Rohtak Gohana - 10,000 12,000
Total - 10,000
I- Rajasthan Ajmer Ajiser 20,000 - 100,000
Jaipur Jaipur 20,000 - 40,000
Ganganagar Hanumangarh - 10,000 75,000
Udaipur lUaipur - 10,000 66,000Total 40,000 20,000
IV. Uttar Pradesh Lucknow Lucknaw 20,000 - 75,000
Bulandshahr Khurja 20,000 - 50,000
Bulandshahr Ghaziabad 20,000 35,000
Bulandshahr Bulandshahr - 10,000 20,000
Moradabad Moradabad - 10,000 50,000
Mathura Kosikalan - 10,000 25, 000
Total 60,000 30,000
Grand Total 200,000 100,000
2/ Irmluding overflow of nearby mandis.
October 5, 1970
ANNEX 10
INDIA
WHEAT STORAGE PROJECT
Site Selection Criteria
1. The Food Corporation of India has tentatively selected 20 sites forthe construction of 300,000 tonsof grain storage facilities in India's wheat belt(North-west India), 10 of which are intended for flat storage (10,000 tons each)and 10 for silos (20,000 tons each). The following factors have been takeninto account in the evaluation of possible sites:
(a) existing storage facilities of the FCI in theproposed procurement area;
(b) location of the wheat markets in the proposedarea;
(c) market arrivals;
(d) expected procurement by FCI in the proposedarea;
(e) whether bag or bulk delivery would be possible;silos should be located only in areas wheregrain can be delivered in bulk;
(f) estimated transportation cost from market toproposed site;
(g) the proposed destination of the stored wheat(consumer area);
(h) presence of good access- roads and railroadconnections;
(i) utility connections; each site would be solocated that a connection to commercial powerlines could be made, that a water supply couldbe connected and that sanitary sewerage disposalwould be possible; and
(j) the estimated cost of acquisition for each siteand the estimated soil improvement cost.
June 8, 1971

ANNEX 11
INDIA
WHEAT STORAGE PROJECT
All-India Grain Storage and Distribution Study
A. Summary Terms of Reference
1. The Food Department would hire consultants to undertake an All-India Grain Storage and Distribution Study, which would consist of fourparts, as described in the following paragraphs.
Public Distribution of Foodgrains
2. Consultants would make demand and supply projections for foodgrainsfor the next 10 years and describe the Governmentts objectives. The flow ofmarketed grains would be analyzed under varying assumptions on:
(a) Domestic production;
(b) Imports;and
(c) Private versus public marketing of grains.
Minimum storage requirements by 1975 and 1980 would be analyzed under differentassumptions on the year-to-year fluctuations in production, imports and theseasonal fluctuation in the grain flow.
3. Within the framework of alternative policy objectives, consultantswould present a study of the costs and benefits of the public distribution offoodgrains. The study in particular would make estimates of the deficits FCIwould incur because of the fixed procurement and issue prices of foodgrainsand would make estimates, based on alternative policy objectives, of FCI'sfinancial positions.
4. With regard to FCI's existing operations, consultants would determine:
(a) alternative purchasing channels under supportbuying operations (deliveries directly by farmto storage sites instead of through mandis);
(b) the effectiveness of marketing operations tocounteract undue rises in prices;
(c) possible ways and means of encouraging sale inbulk; and
(d) ways and means of ensuring that publicly procuredgrains would be cleaned after storage and before sale.
ANNEX 11Page 2
5. Consultants would also make a study of FCI's proposed contingencystock operation and make recommendations regarding the following points:
(a) cost and benefits of contingency stocks,compared to fluctuating imports;
(b) total level of contingency stocks;
(c) the presently available facilities thatcould be used to store contingency stocks; and
(d) type and location of new facilities for con-tingency stock storage.
Survey of Existing Storage Facilities and Grain Storage Losses
6. A survey would be made of existing public storage facilities (FCItsand State Government's) to determine:
(a) the total available storage capacity;
(b) the degree of obsolescence of the avail-able facilities;
(c) the location of the facilities;
(d) the type of facilities (godown, silo, portsilo, bins, etc); and
(e) the total required storage capacity foroperational purposes.
7. A study would be made to determine the total grain losses duringstorage and handling of public foodgrains. Data would be acquired on thefollowing points:
(a) amount of total losses (dry weight losses) andquality deterioration (loss in nutritional value)in each type of facility (silo, godown, bin, etc.)attributable to rodents, insects, birds, waterdamage, and the like; losses would be related tolength of storage and would be analyzed for eachstage of the procurement, storage, transport anddistribution process; and
(b) measures underway to control these losses.
8. Consultants would also survey private storage facilities (represent-ative sample) and grain losses incurred by the pri-vate trade. A comparativeanalysis would be made between public and private operations. This study wouldtake into consideration the preliminary results of the FAO on-farm storage studycurrently underway and would draw up recommendations for an investment programin on-farm storage.
ANNEX 11Page 3
Recommendations to Improve Storage Operations
9. Consultants would make recommendations for improving the effectiveutilization of existing storage. In particular, attention would be paid to:
(a) inventory control;
(b) pest and insect control;
(c) quality control; and
(d) handling practices.
10. Consultants would make recommendations with regard to the improvementof the available storage capacity and the extent and type of the new facilitiesto be constructed. These recommendations would include:
(a) the degree and type of rehabilitationrequired in the existing facilities; and
(b) amount of replacement of existing facilities.
11. Consultants would draw up a rehabilitation program and make recommen-dations regarding the location and type of the new facilities. These recommen-dations would be based upon a detailed investigation of investment and operatingcosts and storage losses of the different types of facilities.
12. Consultants would draw up an investment program for the public andprivate sector covering the next 10 years, including rehabilitation costs(specifying degree and type of rehabilitation), construction costs of projected
new facilities (specifying types and locations of proposed facilities) and costsof improving existing practices (specifying costs of improving inventory control,pest and insect control etc.).
Survey of Rice Processing Facilities
13. Consultants would survey existing public rice processing facilities.Specifically, the following factors would be taken into account:
(a) the degree of utilization of existing mills;
(b) investment cost and operating cost of the mills; and
(c) milling capacity in relation to storage capacity.
1h. Consultants would advise as to the adequacy of existing facilities,whether they should be improved and what type of new facilities should beconstructed.
15. Consultants would also survey ( a representative sample) the privateprocessing industry and make recommendations to improve operations. Consultantswould present examples based on throughput, location and markets of typicaloperations. Based on these examples, consultants would draw up models of
ANNEX 11Page 4
efficient operations. In particular, consultants would determine which typeof mill and what capacity would be the most efficient for each situation.
B. Personnel Requirements
16. The study would take about 1 year to complete. It would be under-taken by consultants. Specialists in the following fields would be required:
(a) storage engineers;
(b) milling engineers;
(c) quality control experts;
(d) marketing experts;
(e) financial analysts; and
(f) economists.
The number of man-months required is estimated at 72, of which 36 would be forforeign consultants. The total costs are as follows:
36 man-months @ Rs 15,000 Rs 540,000 US$ 72,000
36 man-months @ US$ 5,000 - 180,000
US$ 252,0O0
Overheads, miscellaneous and travel costs 48,000
Us$ 300,C)O0
Contingency, 25% 75,000
US$ 375,100
October 9, 1970

I NDIAWHEAT STORAGE PROJECT
TIME SCHEDULE, GODOWN AND SILO CONSTRUCTIONGODOWNS (10 GODOWNS OF 10,000 TONS CAPACITY EACH) MONTH
1 2 3 4 5 6 7 8 9 10 11 12
1 SELECTING SITES2 CHECKING SITES3 PREP. OF TENDER DOC.4 BIDDING5 EXAM. OF TENDERS6 CONTRACT SIGN.7 CIV. ENG. WORKS
SILOS (FIRST 5 SILOS OF 20,000 TONS CAPACITY EACH)
1 2 3 4 5 6 7 8 9 10 11 12 13 14 15 16 17 18 19 20 21 22 23 24 25 26 27 28 29 | 30 31 132 33 34 35 36
I SELECTING SITES2 CHECKING SITES3 LAND SURVEYING4 SOIL INVESTIGATIONS5 PREP. OF TENDER DOC.- - - -
6 BIDDING7 EXAMINATION OF TENDERS _ -i
8 CONTRACT SIGN,9 PREP. FOR CIV. WORKS
10 PILING1 1 FOUNDATION SLAB
12 SILO BINS13 HEADHOUSE14 GALLERY1 5 MACHIN. PROD.16 ELECTR. PROD.17 MACHIN. INST.18 ELECTR. INST.19 RUNNING IN
SILOS (REMAINING 5 SILOS OF 20,000 TONS CAPACITY EACH)
1 20- 39 4ILING TO 617NING 8N 9 10 11 12 13 14 15 l S |6 17 | 18 19 2 Z0 |~ 22 Z | Z3 2 Z4 25 2S |Z6 | 27 8 23 | Z9 | 30 | 31 |3 33 34 |35 36 |
10o- 19 PILING TO RUNNING IN ......... 11 ......... I 5
IBRD - 5004(2R) ;~

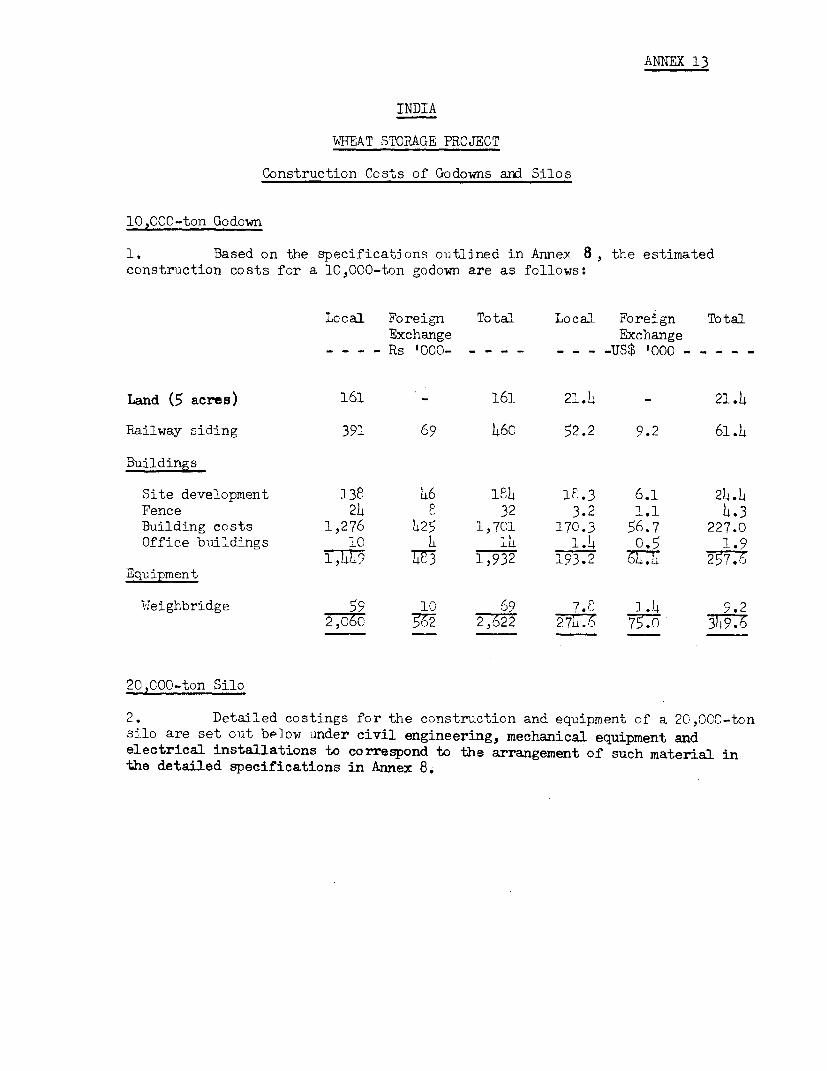
ANNEX 13
INDIA
WHEAT STORAGE PROJECT
Construction Costs of Godowns and Silos
10,000-ton Godown
1. Based on the specifications outlined in Annex 8, the estimatedconstruction costs for a lC,000-ton godown are as follows:
Local Foreign Total Local Foreign TotalExchange Exchange
- - - - Rs '000- - - - - - -US$ t0ooo -
Land (5 acres) 161 - 161 21.4 - 21.4
Railway siding 391 69 460 52.2 9.2 61.L
Buildings
Site development 13e h6 1FL 1P.3 6.1 2h.4
Fence 2h F 32 3.2 1.1 4.3Building costs 1,276 425 1,701 170.3 56.7 227.0
Office buildings 10 4 14 I.4 0.5 1.91,1049 ;E 1,932 193.2 4 257.6
Equipment
Weighbridge 59 10 69 7.; 1.4 9.22,060 m 2 6 27 75.0 _3_9.
20,CO-ton Silo
2. Detailed costings for the construction and equipment of a 20,0CC-tonsilo are set out below under civil engineering, mechanical equipment andelectrical installations to correspond to the arrangement of such material inthe detailed specifications in Annex 8.
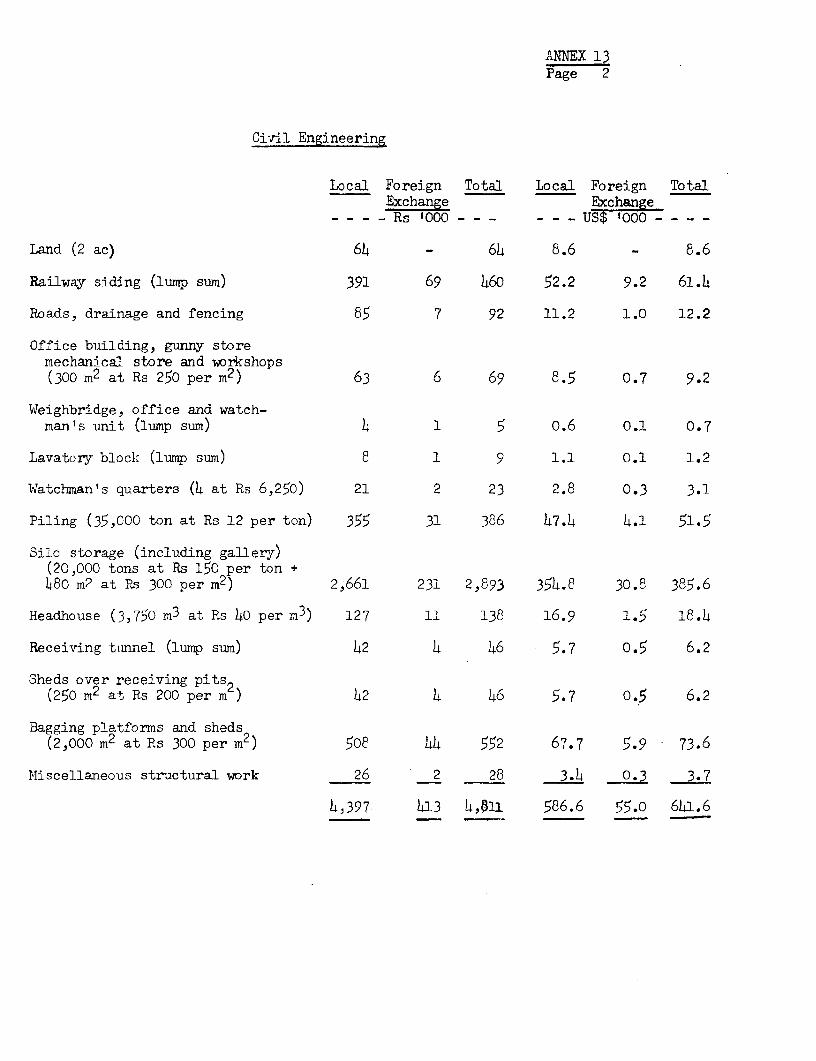
ANNEX 13Page 2
Civil Engineering
Local Foreign Total Local Foreign TotalExchange Exchan
- - - - ' -000 ---
Land (2 ac) 64 - 64 8.6 - 8.6
Railway siding (lump sum) 391 69 460 52.2 9.2 61.4
Roads, drainage and fencing 85 7 92 11.2 1.0 12.2
Office building, gunny storemechanical store and wrkshops(300 m2 at Rs 250 per m2) 63 6 69 8.5 0.7 9.2
Weighbridge, office and watch-man's unit (lump sum) L 1 5 0.6 0.1 0.7
Lavatory block (lump sum) 8 1 9 1.1 0.1 1.2
Watchman's quarters (4 at Rs 6,250) 21 2 23 2.8 0.3 3.1
Piling (35,000 ton at Rs 12 per ton) 355 31 386 47.4 4.1 51.5
Silo storage (including gallery)(20,000 tons at Rs 150 per ton +480 m2 at Rs 300 per m2) 2,661 231 2,893 354.8 30.8 385.6
Headhouse (3,750 m3 at Rs 40 per n3 ) 127 11 138 16.9 1.5 18.4
Receiving tunnel (lump sum) 42 4 46 5.7 0.5 6.2
Sheds over receiving pits2(250 m2 at Rs 200 per m) 42 4 46 5.7 0.5 6.2
Bagging platforms and sheds(2,000 m2 at Rs 300 per m2) 508 44 552 67.7 5.9 73.6
Miscellaneous structural work 26 2 28 3.4 0.3 3-7
4,397 413 4,u11 586.6 55.o 641.6

ANNEX 13Page 3
Mechanical Equipment
Local Foreign Total Local Foreign TotalExchange Exchange
- - - Rs t3 - - - - - US$ 7000 - - - -
Weighbridge 41 23 64 5.6 2.9 8.5
Receiving hoppers (2 fortrucks, 3 for bullbck carts) 21 11 32 2.9 1.5 4.4
Truck lifts (2) 18 9 27 2.4 1.3 3.7
Intake conveyor ( 1 at 100 tonsper hour capacity) 45 24 69 6.0 3.2 9.2
Stub elevator (1 at 100 tonsper hour capacity) 24 13 37 3.1 1.7 4.8
Cleaners (2 at 50 tons perhour capacity) 60 32 92 7.9 4.3 12.2
Main elevators (2 at 100 tonsper hour capacity) 167 91 258 22.4 12.1 314.5
Distributing conveyors (2 at100 tons per hour capacity) 144 77 221 19.1 10.3 29.4
Reclaim conveyor (1 at 100 tonsper hour capacity) 66 35 101 8.8 4.7 13.5
Aerating system 36 19 55 4.8 2.6 7.4
Fumigation system (pellet dispenser) 6 4 10 0.8 o.4 1.2
Temperature indicatlng system 45 24 69 6.o 3.2 9.2
Baggers (6) 144 77 221 19.0 10.4 29.4
Dust collection 45 24 69 6.o 3.2 9.2
862 463 1,325 114.8 61.8 176.6
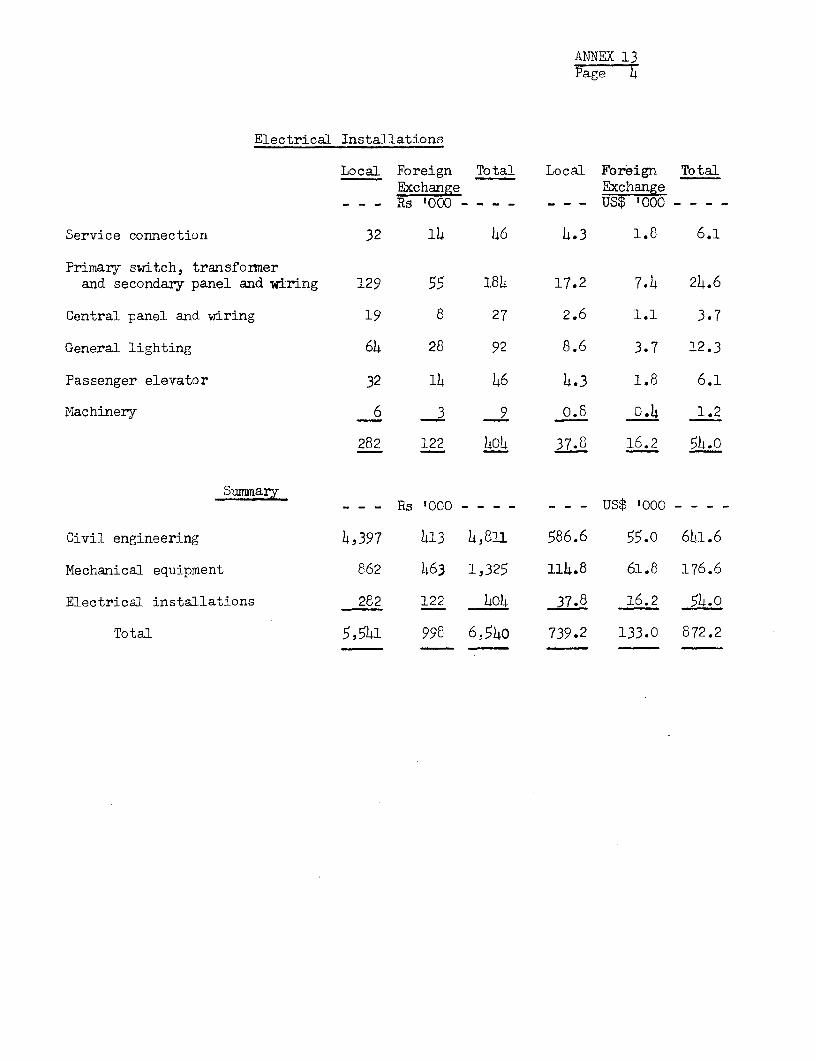
ANNEX 13Page h
Electrical Installations
Local Foreign Total Local Foreign TotalExchange Exchange
- - Rs '000 - -- - US '000 - --
Service connection 32 14 46 4.3 1.8 6.1
Primary switch, transformerand secondary panel and wiring 129 55 184 17.2 7.4 24.6
Central panel and wiring 19 8 27 2.6 1.1 3.7
General lighting 64 28 92 8.6 3.7 12.3
Passenger elevator 32 lk 46 4.3 1.8 6.1
Machinery 6 3 9 o.8 0.4 1.2
282 122 h04 37.8 16.2 5h.0
r - - Rs '000 --- - - -Us$ 000--- _
Civil engineering 4,397 413 4,811 586.6 55.o 641.6
Mechanical equipment 862 h63 1,325 114.8 61.8 176.6
Electrical installations 282 122 W40 37.8 16.2 54.o
Total 5,541 998 6,540 739.2 133.0 872.2

ANNEX 13Page 5
Consultancy and Supervision Costs
3. It has been assumed that, to provide the required standardsof servicesin investigation and preparation of specifications and drawings for tender documentsand analysis of tenders for silos, the services of an overseas expert would berequired for 8 months. This would be in addition to the cost of local consultants.For supervision, it is estimated that 1½ man-months per silo would be needed overa period of 1 year and could be provided by local consultants.
4. On this basis, consultancy and supervision costs for silos would beas follows:
Local Foreign Total Local Foreizn TotalExchange ExchangeAs _UU _ KSlW - - - - US$ | 000---
Consultancy
Local consultant (lump sum) 350 - 350 46.7 - 46.7Overseaa consultant (8 months'fee
at US$5,ooo per month) - 300 300 - 40.0 40.0
Travel - 50 50 - 6.7 6.7
3.5 3 700 46.7 7 X
Supervision
Salary - Rs2,000 per month at1½ x 10 x 12 360 _ 360 48.o 4 48.0Travel and contingencies -.4.0 _ 5.3 5.3.
400 _ 400 _ X

ANNEX 1 3Page 6
Costs of All-India Grain Storage Stud
5. To assure the most efficient use of the existing and proposed facil-ities a study of foodgrain storage and distribution in India would be made.The estimated cost o. the study is detailed bel:w
Local consultants -
3S manimonths -is 15,000 = Rs 5ho,ooo = US$72,00D
Foreign consultants -
36 man-months us USE5,000 = 180,000
US$232, 000
Overhead, miscellaneous and travel costs 40,030
USzv3DO, 000
Contingency (233) = 75,000
US$373, 000

ANNEX XiPage 7
Training Costs
6. To provide the necessary level of technical superintendence at silos,it has been assumed that 15 trainees should be sent abroad for a period of 6months to study grain handling in theory and practice in appropriate cenuersin either Europe or North America. Estimates of the costs of providing suchtraining are set out below
Local Forei7n Total Local Foreig TotalExchanZe Exchange
s-- as -000---- ----- US$1000 -----
Traini'ng
Salaries of trainees15 x 6 months xRs 800 per month 75 - 75 10.0 _ 10.0Travel costs - 189 18C9 - 25.2 25.2Living allowances15 x 6 x US$350 per month - 236 236 - 31.5 31 .5
75 425 500 10.0 56.7 66.7
l>3rnaaE
7. Total project investment costs are summarized below
Local Forei f 1 Total Local boreign TotalExchanL ExchngLe
----- Rs'000 ----- ___ ------- USX 000---
Godowns 20,600 5,620 26,220 2,746 75o 3,496Silos 55,, 430 9,973 65,403 7,392 1,328 8,720Consultants 750 350 1,100 100 47 147Training 75 425 500 10 57 67Study 900 1,350 2,250 120 160 300
77,755 17,725 95,473 10,368 2,362 12,730
Contingencies 19,439 4,431 23,868 2,592 5z 3,162
97,194 22,147 119,341 12,960 2,952 15,912

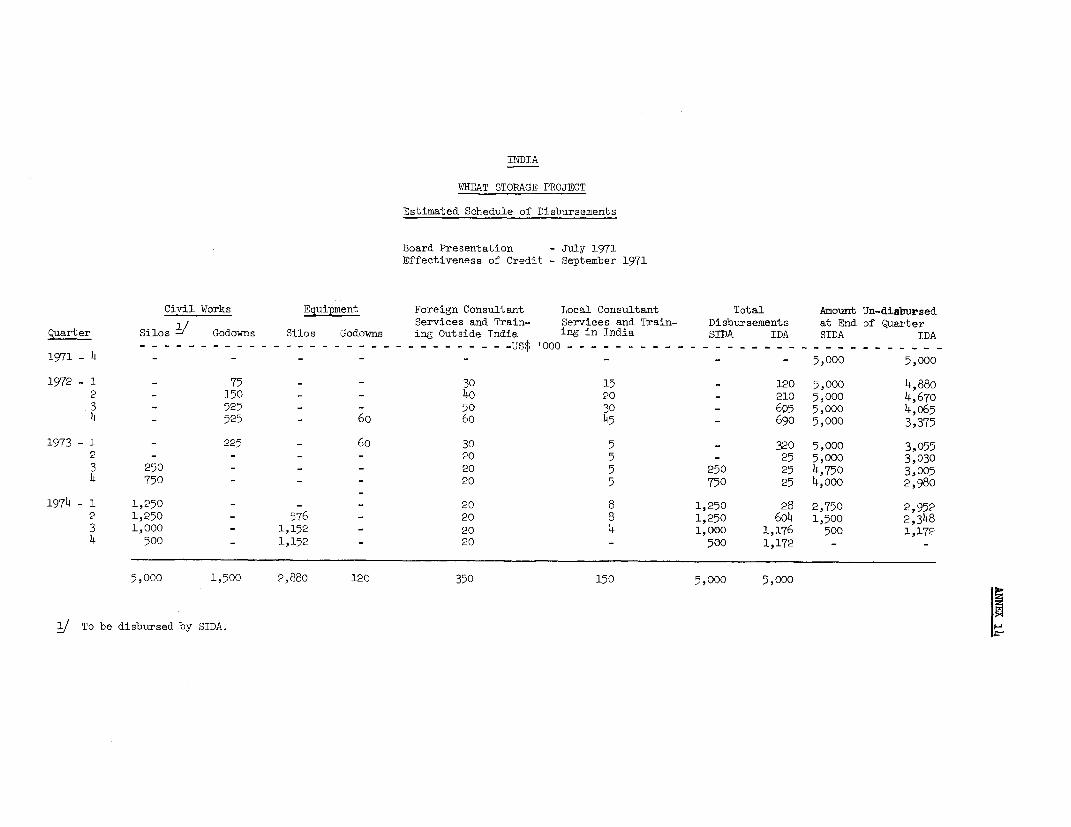
INDIA
WHEAT STORAGE PROJECT
Estimated Schedule of Disbursements
Board Presentation - July 1971Effectiveness of Credit - September 1971
Civil Works Equipment Foreign Consultant Local Consultant Total Amount Un-disbursed
Services and Train- Services and Train- Disbursements at End of Quarter
Quarter Silos Godowns Silos Godowns ing Outside India ing in India SIDA IDA SIDA IDA
- - - - - - - - - - - - - - - - - - - - - _ - - - - - - - us$ tooo - - - - - - - - - - - - - - - - - - - - - - - - - - - - - - -
1971-4 -4 _ - - - 5,000 5,000
1972 -1 - 75 - - 30 15 - 120 5,000 4,88o
2 - 150 - - 4o 20 - 210 5,000 4,670
3 - 525 - - 50 30 - 6 p5 5,ooo 4,o65
4 - 525 - 6o 60 45 - 690 5,000 3,375
1973 - 1 - 225 - 6o 30 5 - 320 5,000 3,055
2 - - - 20 5 - 25 5,000 3,030
3 250 - - - 20 5 250 25 4,750 3,005
4 750 - - - 20 5 750 25 4,ooo 2,980
1974 - 1 1,250 - - - 20 8 1,250 28 2,750 2,952
2 1,250 - 576 - 20 8 1,250 604 1,500 2,348
3 1,000 - 1,152 - 20 4 1,000 1,176 500 1,172
4 500 - 1,152 - 20 - 500 1,172 - _
5,000 1,500 2,880 120 350 150 5,000 5,000
To be disbursed by SIDA.

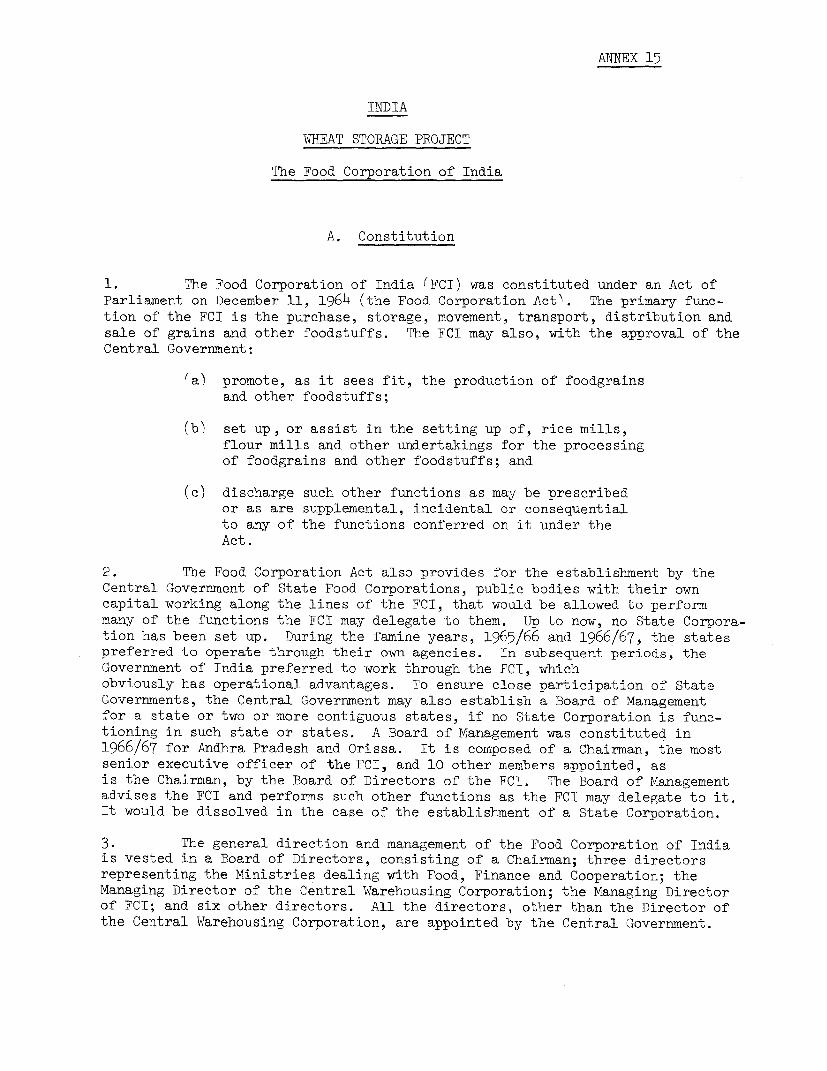
ANNEX 15
INDIA
WHEAT STORAGE PROJECT
The Food Corporation of India
A. Constitution
1. The Food Corporation of India (FCI) was constituted under an Act ofParliament on December 11, 1964 (the Food Corporation Act). The primary func-tion of the FCI is the purchase, storage, movement, transport, distribution andsale of grains and other foodstuffs. The FCI may also, with the approval of the
Central Government:
(a) promote, as it sees fit, the production of foodgrainsand other foodstuffs;
(b) set up, or assist in the setting up of, rice mills,flour mills and other undertakings for the processingof foodgrains and other foodstuffs; and
(c) discharge such other functions as may be prescribedor as are supplemental, incidental or consequentialto any of the functions conferred on it under theAct.
2. The Food Corporation Act also provides for the establishment by theCentral Government of State Food Corporations, public bodies with their owncapital working along the lines of the FCI, that would be allowed to performmany of the functions the FCI may delegate to them. Up to now, no State Corpora-tion has been set up. During the famine years, 1965/66 and 1966/67, the statespreferred to operate through their own agencies. In subsequent periods, theGovernment of India preferred to work through the FCI, whichobviously has operational advantages. To ensure close participation of StateGovernments, the Central Government may also establish a Board of Managementfor a state or two or more contiguous states, if no State Corporation is func-tioning in such state or states. A Board of Management was constituted in1966/67 for Andhra Pradesh and Orissa. It is composed of a Chairman, the mostsenior executive officer of the FCI, and 10 other members appointed, asis the Chairman, by the Board of Directors of the FCI. The Board of Managementadvises the FCI and performs such other functions as the FCI may delegate to it.It would be dissolved in the case of the establishment of a State Corporation.
3. The general direction and management of the Food Corporation of Indiais vested in a Board of Directors, consisting of a Chairman; three directorsrepresenting the Ministries dealing with Food, Finance and Cooperation; theManaging Director of the Central Warehousing Corporation; the Managing Directorof FCI; and six other directors. All the directors, other than the Director ofthe Central Warehousing Corporation, are appointed by the Central Government.
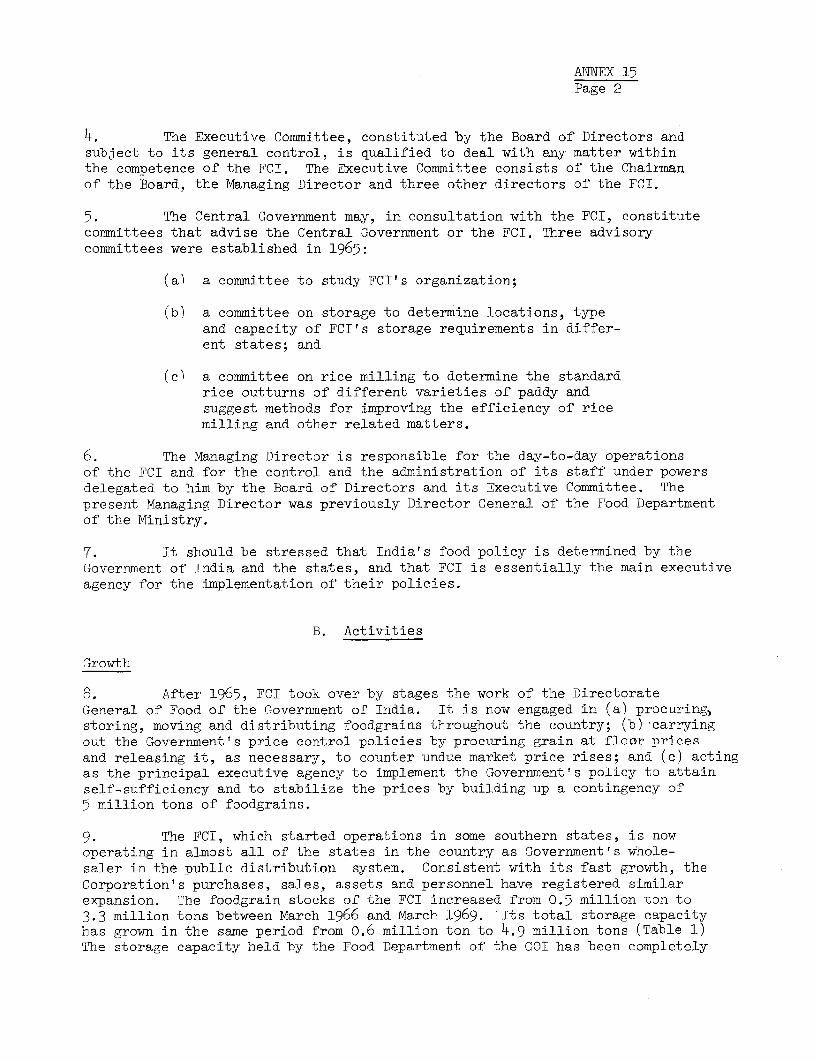
ANNEX 15Page 2
4. The Executive Committee, constituted by the Board of Directors andsubject to its general control, is qualified to deal with any matter withinthe competence of the FCI. The Executive Committee consists of the Chairmanof the Board, the Managing Director and three other directors of the FCI.
5. The Central Government may, in consultation with the FCI, constitutecommittees that advise the Central Government or the FCI. Three advisorycommittees were established in 1965:
(a) a committee to study FCI's organization;
(b) a committee on storage to determine locations, typeand capacity of FCIT's storage requirements in differ-ent states; and
(c) a committee on rice milling to determine the standardrice outturns of different varieties of paddy andsuggest methods for improving the efficiency of ricemilling and other related matters.
6. The Managing Director is responsible for the day-to-day operationsof the FCI and for the control and the administration of its staff under powersdelegated to him by the Board of Directors and its Executive Committee. Thepresent Managing Director was previously Director General of the Food Departmentof the Ministry.
7. It should be stressed that India's food policy is determined by theGovernment of India and the states, and that FCI is essentially the main executiveagency for the implementation of their policies.
B. Activities
Growth
8. After 1965, FCI took over by stages the work of the DirectorateGeneral of Food of the Government of India. It is now engaged in (a) procuring,storing, moving and distributing foodgrains throughout the country; (b) carryingout the Government's price control policies by procuring grain at floor pricesand releasing it, as necessary, to counter undue market price rises; and (c) actingas the principal executive agency to implement the Government's policy to attainself-sufficiency and to stabilize the prices by building up a contingency of5 million tons of foodgrains.
9. The FCI, which started operations in some southern states, is nowoperating in almost all of the states in the country as Government's whole-saler in the public distribution system. Consistent with its fast growth, theCorporation's purchases, sales, assets and personnel have registered similarexpansion. The foodgrain stocks of the FCI increased from 0.5 million ton to3.3 million tons between March 1966 and March 1969. Its total storage capacityhas grown in the same period from 0.6 million ton to 4.9 million tons (Table 1)The storage capacity held by the Food Department of the GOI has been completely
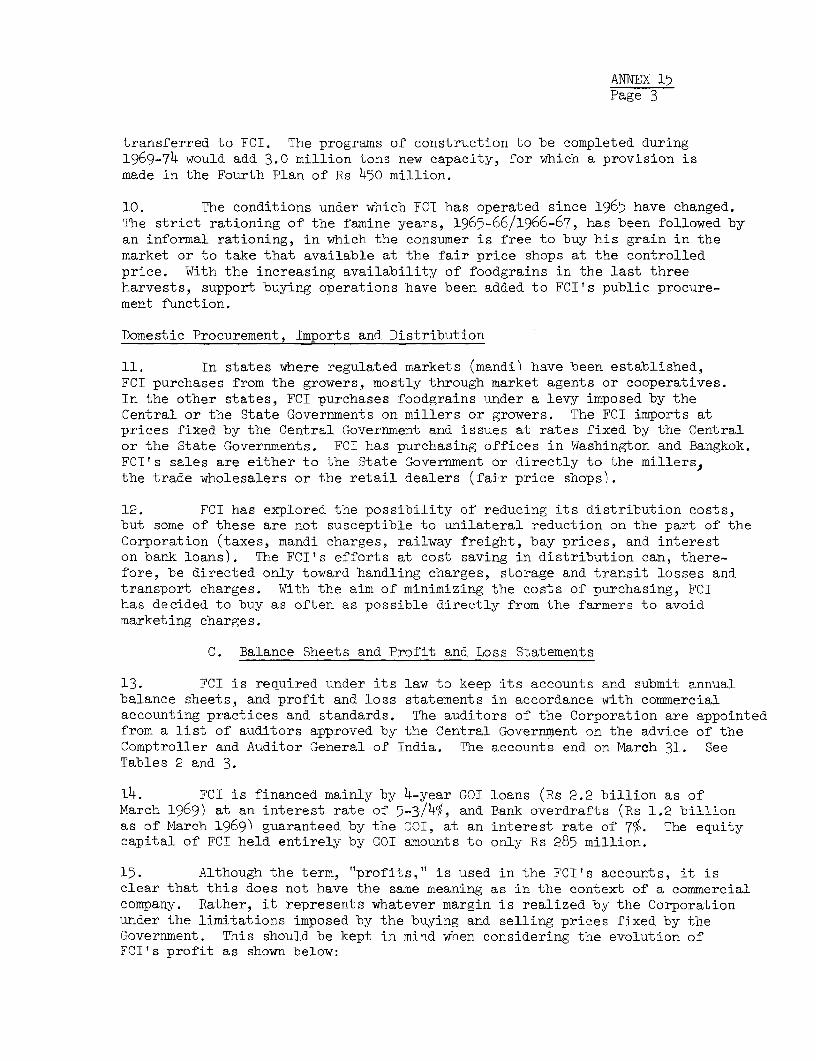
ANNEX 15Page 3
transferred to FCI. The programs of construction to be completed during1969-74 would add 3.0 million tons new capacity, for which a provision ismade in the Fourth Plan of Rs 450 million.
10. The conditions under which FCI has operated since 1965 have changed.The strict rationing of the famine years, 1965-66/1966-67, has been followed byan informal rationing, in which the consumer is free to buy his grain in themarket or to take that available at the fair price shops at the controlledprice. With the increasing availability of foodgrains in the last threeharvests, support buying operations have been added to FCI's public procure-ment function.
Domestic Procurement, Imports and Distribution
11. In states where regulated markets (mandi) have been established,FCI purchases from the growers, mostly through market agents or cooperatives.In the other states, FCI purchases foodgrains under a levy imposed by theCentral or the State Governments on millers or growers. The FCI imports atprices fixed by the Central Government and issues at rates fixed by the Centralor the State Governments. FCI has purchasing offices in Washington and Bangkok.FCI's sales are either to the State Government or directly to the millers,the trade wholesalers or the retail dealers (fair price shops).
12. FCI has explored the possibility of reducing its distribution costs,but some of these are not susceptible to unilateral reduction on the part of theCorporation (taxes, mandi charges, railway freight, bay prices, and intereston bank loans). The FCI's efforts at cost saving in distribution can, there-fore, be directed only toward handling charges, storage and transit losses andtransport charges. With the aim of minimizing the costs of purchasing, FCIhas decided to buy as often as possible directly from the farmers to avoidmarketing charges.
C. Balance Sheets and Profit and Loss Statements
13. FCI is required under its law to keep its accounts and submit annualbalance sheets, and profit and loss statements in accordance with commercialaccounting practices and standards. The auditors of the Corporation are appointedfrom a list of auditors approved by the Central Government on the advice of theComptroller and Auditor General of India. The accounts end on March 31. SeeTables 2 and 3.
14. FCI is financed mainly by 4-year GOI loans (Rs 2.2 billion as ofMarch 1969) at an interest rate of 5-3/4%, and Bank overdrafts (Rs 1.2 billionas of March 1969) guaranteed by the GOI, at an interest rate of 7%. The equitycapital of FCI held entirely by GOI amounts to only Rs 285 million.
15. Although the term, "profits," is used in the FCI's accounts, it isclear that this does not have the same meaning as in the context of a commercialcompany. Rather, it represents whatever margin is realized by the Corporationunder the limitations imposed by the buying and selling prices fixed by theGovernment. This should be kept in mind when considering the evolution ofFCI's profit as shown below:
ANNEX 15Page 4
Profit Earned - Es '000 % of Sales
1965/66 2,260 0.171966/67 30,470 1.211967/68 39,110 1.011968/69 16,220 0.29
D. Organization
16. The Corporation has a head office in New Delhi, 4 zonal offices,14 regional offices, 124 district offices, and more than 1,000 operatingpoints throughout the country for its purchase and distributing operations.The main functions carried out by the head office are as follows: (a)arranging the import of foodgrains as per the instructions of the Governmentof India; (b) purchasing foodgrains within the country; (c) constructing andhiring suitable storage; (d) operating contingency stock; and (e) clearing,storing and distributing foodgrains imported or procured domestically.
17. The head office, which employs 670 persons, consists of nine divisionsoperating under the overall control of the Managing Director. The zonal, region-al and district offices; the storage depots; and the port clearance officesaltogether employ about 25,500 people. The zonal and regional offices areresponsible for the control and supervision of all district offices and thedepots within the area of their jurisdiction. The district offices are incharge of purchase operations and the movement of foodgrains to the storagedepots. Storage depots are defined as places where foodgrains of the FCI arestored in properly built godowns. The staff of the depot has to maintainquality control over the stocks, issue the stocks wherever they are required,and maintain proper accounts of the receipt and issue of the foodgrains. Theport clearance offices make the arrangements at the port of discharge forefficient clearance of the cargo. An organization chart appears in Figure 1.
Manpower
18. FCT's manpower grew from 2,150 to the 25,500 workers presently em-ployed between 1965 and 1969. The takeover of all the field functions of theUnion Food Department has resulted in the absorption of about 15,400 persons,of which 5,700 persons are on secondment.
19. The top management of FCI is of high calibre, but here, too, manyofficers are at present on secondment from Government Departments. GOI intendsto require such staff to opt either to transfer to FCI or to return to parentorganizations.
Engineering Department
20. Hitherto, the Engineering Department of FCI has relied extensively onthe Central Public Works Department of GOI for technical assistance. Thisarrangement had undoubted advantages during FCI's early years when its building
ANNEX 15Page 5
program was largely made up of flat storage. Now, however, because FCI'sstorage expansion will include an increasing proportion of silos, for whichonly a limited amount of expertise is available, the Engineering Departmentneeds to be strengthened. It is essential that FCI should eventually haveits own staff capable of drawing up detailed plans and specifications forsilos and related equipment to acceptable international standards. Pendingthis reinforcement of the Engineering Department, FCI needs the services ofconsultants.
Planning and Research
21. With the changing pattern of FCI's activities, there is a growingneed for more planning and research, as well as economic evaluation of proceduresand projects. This need is recognized by FCI and it has recently awarded a con-tract for an economic study on movement and storage policies to a consultant.The study is being undertaken by the National Council of Applied EconomicResearch (NCAER) - a Government-sponsored research organization.
22. Other fields that call for detailed study and appraisal are:
(a) alternative purchasing channels under support buyingoperations;
(b) storage location studies in the light of new patternsof public procurement and distribution, as well ascontingency stock requirements;
(cW the adaptability to Indian conditions of cold airaeraJion storage techniques presently being developedin other countries, together with technical andeconomic appraisal of such systems;
(d) the effectiveness of wheat marketing operations tocounteract undue rises in market prices; and
(e) possible ways and means of encouraging roller flourmillers to install bulk handling and storage facilitiesin areas where their offtake could be from FCI silos.
So that the present Planning and Research Unit of FCI can cope with its in-creasing work load, its technical staff should be increased. An experiencedeconomist is to be appointed as its head. Furthermore, the Corporation'soperating costs should be kept under continuous scrutiny.
1/ FCI recently conducted a study of marketing operations in Bihar.
June 8, 1971

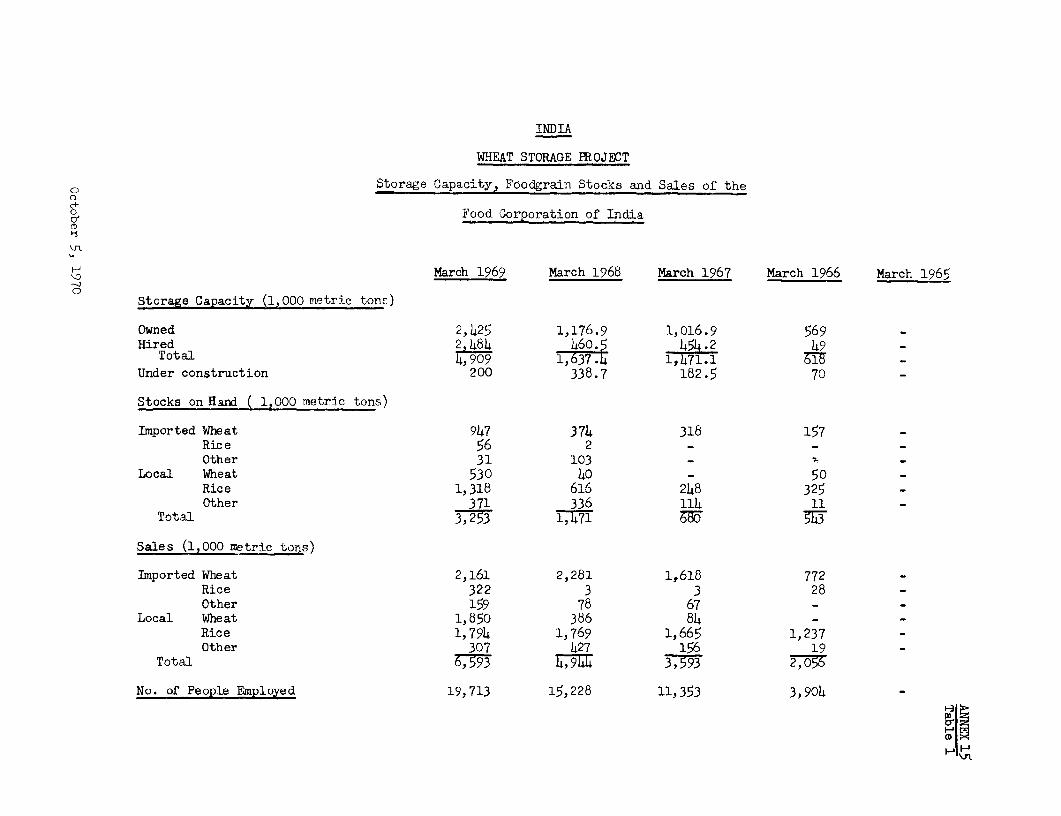
INDIA
WHEAT STORAGE PROJECT
Storage Capacity, Foodgrain Stocks and Sales of the
o Food Corporation of India
March 1969 March 1968 March 1967 March 1966 March 1965
0Storage Capacity (1,000 metric tony)
Owned 2,425 1,176.9 1,016.9 569Hired 2 484 460.5 454.2 49
Total 1,637 1,471.1 M7Under construction 200 338.7 182.5 70
Stocks on Hand ( 1,000 metric tons)
Imported Wheat 947 374 318 157Rice 56 2 - _Other 31 103 - _
Local Wheat 530 40 - 50Rice 1,318 616 248 325 _Other 371 336 114 11 -
Total 3,253
Sales (1,000 metric tons)
Imported Wheat 2,161 2,281 1,618 772 _Rice 322 3 3 28 -Other 159 78 67 _ _
Local Wheat 1,850 386 84 _ _Rice 1,794 1,769 1,665 1,237 -Other 307 427 156 _ 19
Total 6,593 4,797 3,593 2,056
No. of People Employed 19,713 15,228 11,353 3,904 -
1H
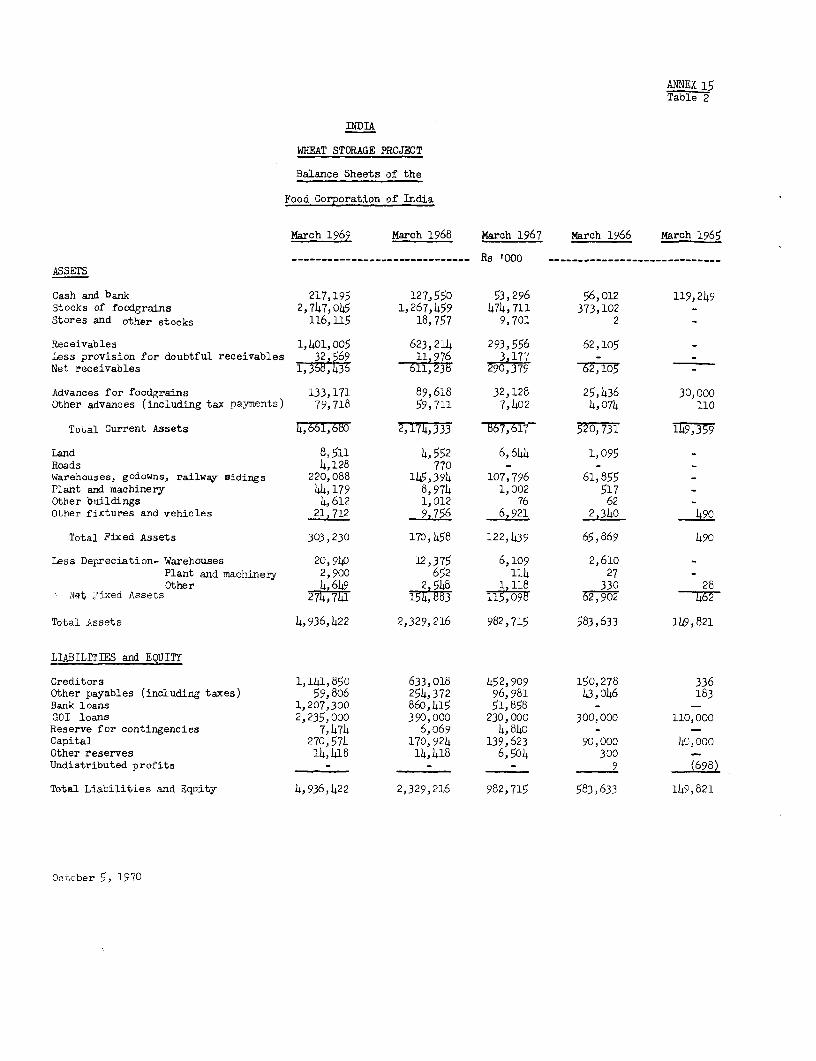
ANNEX 15Table 2
INDIA
WHEAT STORAGE PROJECT
Balance Sheets of the
Food Corporation of India
March 1969 March 1968 March 1967 March 1966 March 1965
-_____________________________ Rs tooo _______ -- -- ____ASSETS
Cash and bank 217,195 127,550 53,296 56,012 119,249Stocks of foodgrains 2,747,045 1,267,459 474,711 373,102 -Stores and other stocks 116,115 18,757 9,701 2
Receivables 1,401,005 623,214 293,556 62,105Less provision for doubtful receivables 32 569 11,976 3,17 -'Net receivables 1,36c,436 611,238 290,379 62,105 -
Advances for foodgrains 133,171 89,618 32,128 25,436 30,000Other advances (including tax payments) 79,718 59,711 7,402 4,074 110
Total Current Assets 41,8 2,1714,333 867,61 520,731 149,359
Land 8,511 4,552 6,6644 1,095 -Roads 4,128 770 - - -Warehouses, godowns, railway sidings 220,088 145,394 107,796 61,855 -Plant and machinery 44,179 8,974 1,002 517 -Other buildings 4,612 1,012 76 62 -
Other fixtures and vehicles 21,712 9,756 6,921 2,340 490
Total Fixed Assets 303,230 170,458 122,439 65,869 490
Less Depreciation- Warehouses 20,940 12,375 6,109 2,610Plant and machinery 2,900 652 114 27Other 4 649 2 548 1,118 330 28
Nst 7ixed Assets 274,741 154,883 115,098 62,902 462
Total Assets 4,936,422 2,329,216 982,715 583,633 149,821
LIABILITES and EQUITY
Creditors 1,141,850 633,018 452,909 150,278 336Other payables (including taxes) 59,806 254,372 96,981 43,046 183Bank loans 1,207,300 860,415 51,858 - -GOI loans 2,235,000 390,000 230,000 300,000 110,000Reserve for contingencies 7,474 6,069 4,840 - -Capital 270,574 170,924 139,623 90,000 40,000Other reserves 14,418 14,418 6,504 300 -Undistributed profits - - - 9 (698)
Total Liabilities and Equity 4,936,422 2,329,216 982,715 583,633 149,821
October 5, 1970
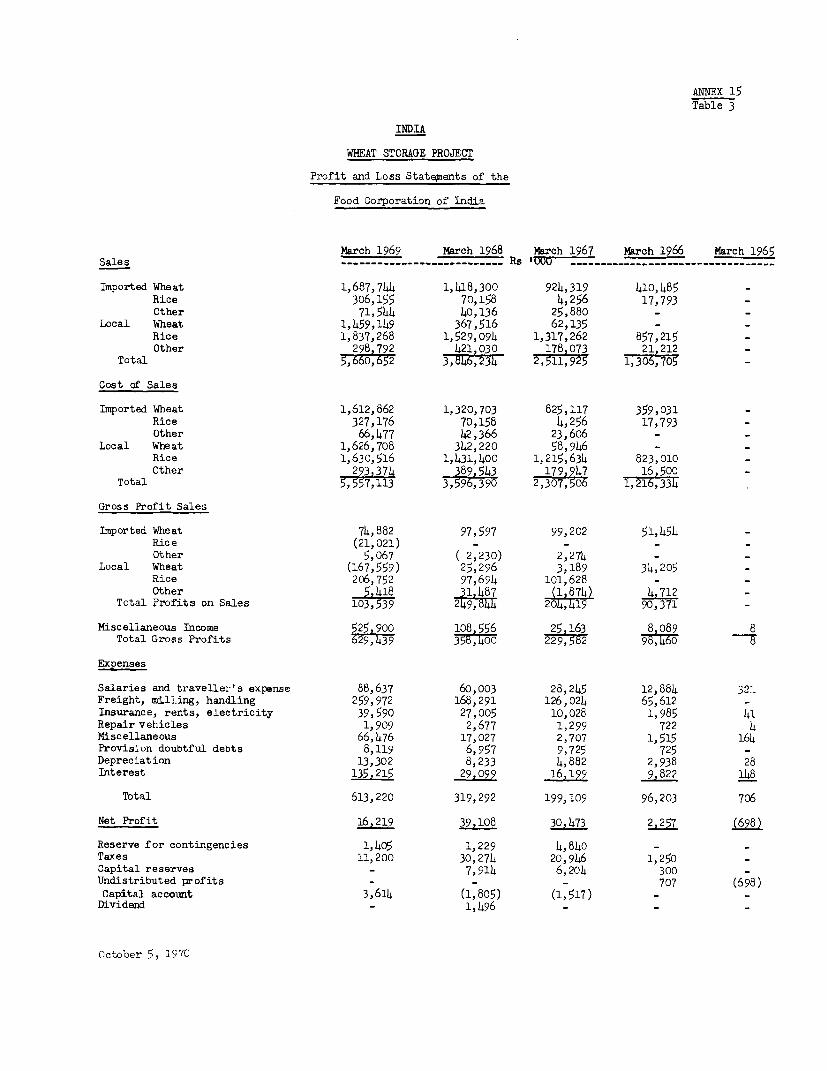
AimEX 15Table 3
INDIA
WHEAT STORAGE PROJECT
Profit and Loss Stateaents of the
Food Corporation of India
March 1969 March 1968 March 1967 March 1966 March 1965Sales ------------------------ Rs 's W = ---------------------------
Imported Wheat 1,687,744 1,418,300 924,319 410,485 -
Rice 306,155 70,158 4,256 17,793 -
Other 71,544 40,136 25,880 - _Local Wheat 1,459,149 367,516 62,135 - -
Rice 1,837,268 1,529,094 1,317,262 857,215 -Other 298 792 421 030 178,073 21,212 -
Total 5,660,652 3,846,234 2,511,925 1,306,705 -
Cost of Sales
Imported Wheat 1,612,862 1,320,703 825,117 359,031 -Rice 327,176 70,158 4,256 17,793 -Other 66,477 42,366 23,606 - -
Local Wheat 1,626,708 342,220 58,946 - -
Rice 1,630,516 1,431,400 1,215,634 823,010 _Other 293 374 389 543 179,947 16 500 _
Total 5,557,113 3,596,390 2,307,506 1,1633
Gross Profit Sales
Imported Wheat 74,882 97,597 99,202 51,454 _Rice (21,021) - - - -
Other 5,067 ( 2,230) 2,274 - -
Local Wheat (167,559) 25,296 3,189 34,205 _Rice 206,752 97,694 101,628 - -
Other 5,418 31,487 1874) 4,712 _Total Profits on Sales 1 3,539 249,844 204,419 90,371 -
Miscellaneous Income 525,900 108 556 25,163 8 089 8Total Gross Profits 629,439 358,400 229,5582 9 8
Expenses
Salaries and traveller's expense 88,637 60,003 28,245 12,884 32L-Freight, milling, handling 259,972 168,291 126,024 65,612 -Insurance, rents, electricity 39,590 27,005 10,028 1,985 41Repair vehicles 1,909 2,677 1,299 722 4Miscellaneous 66,476 17,027 2,707 1,515 164Provision doubtful debts 8,119 6,957 9,725 725 -
Depreciation 13,302 8,233 4,882 2,938 28Interest 135,215 29,099 16,199 9,822 148
Tbtal 613,220 319,292 199,109 96,203 706
Net Profit 16,29 39,108 30,473 2,257 (698)
Reserve for contingencies 1,1405 1,229 4,840 - -Taxes 11,200 30,274 20,946 1,250 -
Capital reserves - 7,914 6,204 300 -
Undistributed profits - - - 707 (698)Capital account 3,6114 (1,805) (1,517) - -
Dividend - 1,496 - - -
October 5, 1970


INDIAWHEAT STORAGE PROJECT
ORGANIZATION CHART OF THE FOOD CORPORATION OF INDIA
CHAIRMAN
MANAGING DIRECTOR
/ E W DEL HI/ OFF/CE
FINANCIAL SECRETARY COMMERCIAL MANAGER MANAGER TECHNICAL MANAGER QUALITY MANAGER PORT
ADVISORPERSONNEL PLANNINGEN MANAGER ST E CONTROL COORDINATIONADVISOR ANAGER OVEMENT AND RESEARCFI ANGRSOGEMANAGER CODNTO
~~~~~(116) = 98) (61) (18) (45 (5 )(6 (54
PERSONNEL:
NEW DELHI 670
ZONAL OFFICES 24,900
25,570
ZONAL MANAGER ZONAL MANAGER ZONAL MANAGER ZONAL MANAGER
EAST SOUTH WEST NORTH
(9,912) (4,.730) (5,,947) (4,313)
NOTE: FIGURES IN ERAChEl S INDICATE NIAMFR OF PEOPLE EMPI-OYEI). I, BX
I BR D-4936 (R) - _~


ANNEX 16
INDLA
WHEAT STORAGE PROJECT
Storage and Distribution Cost
Godown (10,000 ton) Silo (20,000 ton)____ _____ __,Rs. l0 o------_--_---------- ----
Investment Costs
Land 202 BoRailway siding 575 575Building 2,415 5,358Equipment 86 ?,162
Total (inL. 25% contingencies) 3,278 8,175Total oer ton (Rs) 327.80 408.75
Fixed Costs (RsBooo)1. Capital Recovery Cost (7%) 12 Months 24 Months 36 Months 12 Months 24 Months 36 Months
Railway sidings (15 years) 63.1 126.2 189.3 63.1 126.2 189.3B.ildings (godown, 35 years; silo, 50 years) 186.5 373.0 559.5 388.2 776.4 1,164.6Equipment (15 years) 9.4 18.fl 28.2 237.1 471.8 712.2
Total capital recovery cost 259.0 518.0 777.o 688.7 1,377.4 2,066.1
?. Other Fixed Costs
Supervision 91.0 188.0 282.0 17n.0 340.0 51o.oMaintenance buildings (1%) 24.0 48.0 72.0 54.0 108.0 162.0Maintenance equipment (2.5%) 2.0 4.0 6.o 54.0 108.0 162.0Taxes (0.25% on railway sidings and buildings) 7.0 14.0 21.0 15.0 30.0 45.0Insurance (0.20% on railway sidings and buildings) 5.0 10.0 15.0 12.0 2U1.0 36.0
Overheads 8.0 16.0 24.0 14.0 28.0 42.0
Total 140.0 280.0 420.0 319.0 63B.0 957.0Total fixed costs 399.0 798.0 1,197.0 1,007.7 2,015.1, 3,023.1
Fixed and Variable Costs Per Ton-- tn--------------------------- ------ -
1. Capital Recovery Cost 25.90 51.80 77.70 34.4L 63.88 103.3?
2. Other Fixed Cost 14.00 28.00 42.00 15.95 31.90 b7.85
3. Storage Operating Coat
Restacking in gocbwns/loading into silos 1.60 1.60 1.60 0.50 O.50 0.50Fumigating godowns (Rs 2.4 every 3 mcnths) 9.60 19.20 28.80 - - -Fwnigating silos (Rs 1.2 every 12 months) - - - 1.20 2.40 3.60
11.20 76 30676O b 7e 7
4. TOTAL Storage Cost Per Ton Per Annum 51.10 100.60 150.10 52.09 103.68 155.27
5. Mandi Cost and Transport to Storage
Mandi covmissioning 23.70 23.70 23.70 23.70 23.70 23.70Mandi handling 4.20 4.20 4.20 1.20 1.20 1.20State Govenment charge 9.40 9.40 9.40 9.40 9.40 9.40Octroi 0.20 0.20 0.20 0.20 0.20 0.20Purchase tax 23.20 23.20 23.20 23.20 23.20 23.20Administrative charges 2.00 2.00 2.00 2.00 2.00 2.00Transport to mandi, godown or silo 1.60 1.60 1.60 1.20 1.20 1.20
M 61.30 6.30 6 .0 '64.--9 69-0.906. Bagging on Mandi or Out of Silo (bags and labor) 29.70 29.70 29.70 29.70 29.70 29.70
7. Handling and Freight Up to Fppdgrain Sales Centers
Loading railway 6.40 6.40 6.40 6.40 6.40 6.10Average freight charges 40.30 40.30 40.30 10.30 40.30 40.30Restacking issue depots 6.40 6.40 6.40 6.40 6.40 6.40
53.10 53.10 53.10 53.10 53.10 53.108. TOTAl Storage and Distribution Costs Per Ton . 198.20 217.70 297.20 195.79 217.38 298.97
9. TOTAL Storage and Diatribution Costs Per Ton Per Month 16.51 10.32 B.26 16.31 10.31 8.30
October 5, 157C


C It D 1 A 1151 17
WET SMOms PEROWr
Analysie of eodtsD Storer VSenr Silo Storae
Godosa Silo(1,00 tosS'000 o
- - -~~~-------------------- ------ Rs per ton-
iOveotment Cost: Rs327.8C _568.17
1 Yesr 2 Year; Years 1 lear 2 Years 3 Yeare
--------------------------------- R. per ten per -a _-__-_________-__-_
1. Capital ge-overy Cost at 75(godown,35 years; silos,50 years) 25.90 51.80 77.70 49.83 99.66 149.49
2. Otho- Foixd Cost 14.00 28.00 42.oo 26.40 52.cO 79.20
3. Storoge Operating Cost 11.20 92.40 33.80 1.70 2.90 4.1C
4. Total Soorage Cost 51.10 102.20 1513.30 -77.9 155.36 232.79
5. Moodi rnd TrAnsport Coot 64.30 64.30 64.30 60.90 60.90 60.91
6. Rgging 29.70 29.70 29.70 29.70 29.70 29.70
7. Hoodling rod Preigot Up to Foodgrain SaJee Canters 53.10 53.10 53.10 53.10 53.10 53.10
8. Total Storage and DCttrabutiag Cost 198.20 049730 3°0.40 221.63 299.06 376.49
9. besos (grdoona,Sf. clOse,48 on stored 60.3, 121.60 132.4C 3o.Lc 60.60 91.20shoot at Ito 760 to-)
10. Total Laorgos Coot or Storage and Strab-otint Par Too 259.00 3T70.9 at2S 252 .C3 . 59S, 467.69
Ibtal O -oorr c Coot or Storage rad Dlotrib-uatn- Per
Too Per soth 21.56 1A5.1 13.4} 21.00 1y9 12 99
SeAson S.l(25,000 to (23, 0,00 too
_____--- --------.----------- lrpPer ton -------------- --------- --
tsoeotoeo OrCsto 285.105 608.75
1 Year 2 Years 3 Trars 1 Ysar 2 YTors 3 Ye:-
-------------------------------- -----.s e o --------__ -_ --_-----------------------1. Crpitl R' oorery Cost at 7%
(godon,35 years; a' ir, 50 years) 00.06 44.12 66.18 31-44 66.80 103.32
2. Other 6tood Coots 13.50 00.80 41.70 15.95 31.90 47.85
3. Storag. cp-rotig Coot
11.20 20.80 30.40 1.70 -,.C 4.10
4. 3otol Storage CooL 47.16 92.72 106.20 52.09 03.68 155.2,
5. Xaedi ant Troasnoro Coat 64,30 64.30 64.30 60.70 60.50 60.YO
6. 8aggdig 29.70 20.70 09.70 25.70 0°.00 29.70
7. ila-dl g sad FreightUp to Foodgrain Sa es Centers 53.10 53.10 53.11 53.10 53.10
S. Total Stn agE .ad . ietribrtiro Coot 194.26 239.82 285.38 195.79 247.38 298.97
9. Lossese (godso'oo 8% * sila, 43i son stored9 te-t at RD lM 6o.8o 121.60 182.40 30.40 60.60 91.20
10. TYtel Sarorir Cost of Store and DlstribUtio Per rIo 25S.06 361.42 467.78 226.19 308.18 390.17
Total SooEad- Cost of Storage rod Dtetrihstioe9er 7t5 Per Monte 21.26 15.06 12.99 18.85 12.87. 10.64
0027)00' 5. 1S7' ___

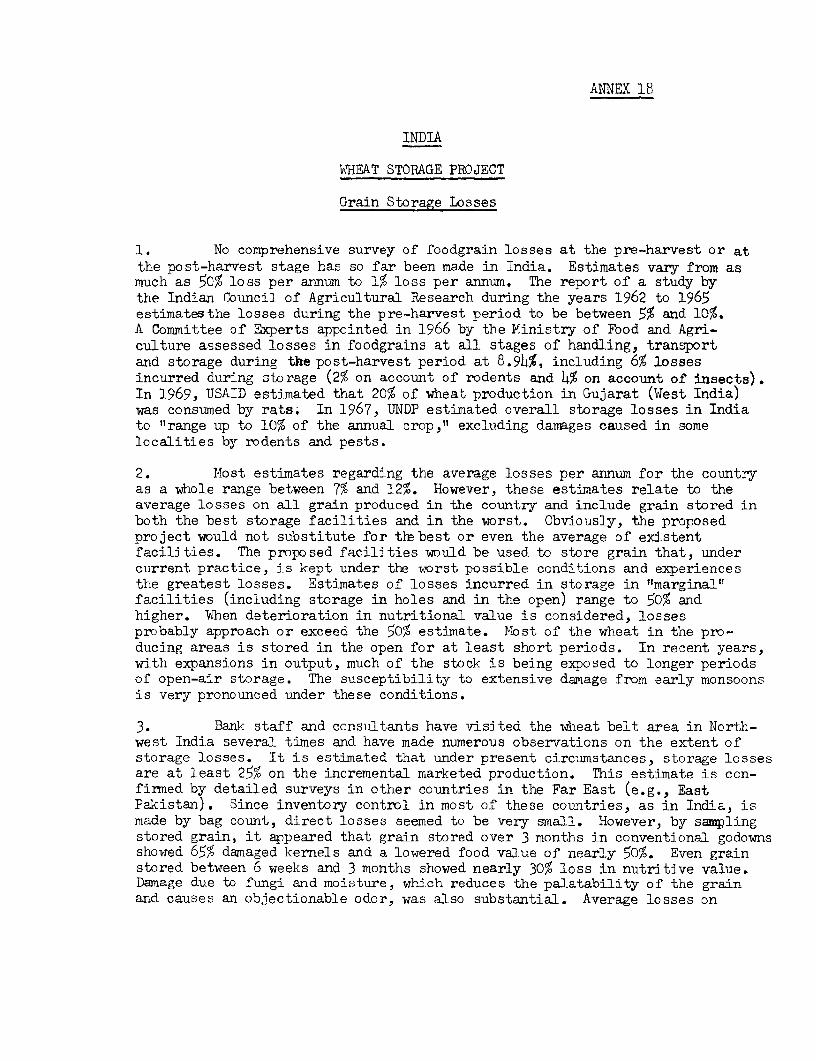
ANNEX 18
INDIA
WHEAT STORAGE PROJECT
Grain Storage Losses
1. No comprehensive survey of foodgrain losses at the pre-harvest or atthe post-harvest stage has so far been made in India. Estimates vary from asmuch as 50% loss per annum to 1% loss per annum. The report of a study bythe Indian Council of Agricultural Research during the years 1962 to 1965estimatesthe losses during the pre-harvest period to be between 5% and 10%.A Committee of Experts appointed in 1966 by the Ministry of Food and Agri-culture assessed losses in foodgrains at all stages of handling, transportand storage during the post-harvest period at 8.94%, including 6% lossesincurred during storage (2% on account of rodents and 4% on account of insects).In 1969, USAID estimated that 20% of wheat production in Gujarat (West India)was consumed by rats. In 1967, UNDP estimated overall storage losses in Indiato "range up to 10% of the annual crop," excluding damages caused in somelocalities by rodents and pests.
2. Most estimates regarding the average losses per annum for the countryas a whole range between 7% and 12%. However, these estimates relate to theaverage losses on all grain produced in the country and include grain stored inboth the best storage facilities and in the worst. Obviously, the proposedproject would not substitute for t~ebest or even the average of existentfacilities. The proposed facilities would be used to store grain that, undercurrent practice, is kept under the worst possible conditions and experiencesthe greatest losses. Estimates of losses incurred in storage in "marginal'facilities (including storage in holes and in the open) range to 50% andhigher. When deterioration in nutritional value is considered, lossesprobably approach or exceed the 50% estimate. Most of the wheat in the pro-ducing areas is stored in the open for at least short periods. In recent years,with expansions in output, much of the stock is being exposed to longer periodsof open-air storage. The susceptibility to extensive damage from early monsoonsis very pronounced under these conditions.
3. Bank staff and consultants have visited the wheat belt area in Norti-west India several times and have made numerous observations on the extent ofstorage losses. It is estimated that under present circumstances, storage lossesare at least 25% on the incremental marketed production. This estimate is con-firmed by detailed surveys in other countries in the Far East (e.g., EastPakistan). Since inventory control in most of these countries, as in India, ismade by bag count, direct losses seemed to be very small. However, by samplingstored grain, it appeared that grain stored over 3 months in conventional godownsshowzed 65% damaged kernels and a lowered food value of nearly 50%. Even grainstored between 6 weeks and 3 months showed nearly 30% loss in nutritive value.Damage due to fungi and moisture, which reduces the palatability of the grainand causes an objectionable odor, was also substantial. Average losses on

ANNEX 18Page 2
operational stocks stored for 3 months were ascertained to be as follows:
Insects 20.0%
Moisture 2.5%
Rodents 2.7%
Total 25.2%
4. It has, therefore, been assumed in this report, conservatively, thatgrain storagelosses in India's wheat belt on the incremental marketed productionamount to at least 25%. Detailed surveys in East Pakistan showed thatgrain losses in modern silos were about 6%. It is estimated that, under climaticconditions prevailing in North-west India, average grain losses in modern silosin a 1-year period would be about 3.5% to 4.0% (assuming one turnover per annum).Grain losses in godowns depend to a large extent, on pest and insect control.With good control of pests and insects, such losses were reduced in EastPakistan to about 10% to 12%. Again, under the more favorable climatic conditionin North-west India, losses should be less. It is estimated that with theadequate pest and insect control FCI is providing, grain storage losses inmodern project godowns should not be more than S% (assuming one turnover perannum).
October 6, 1970
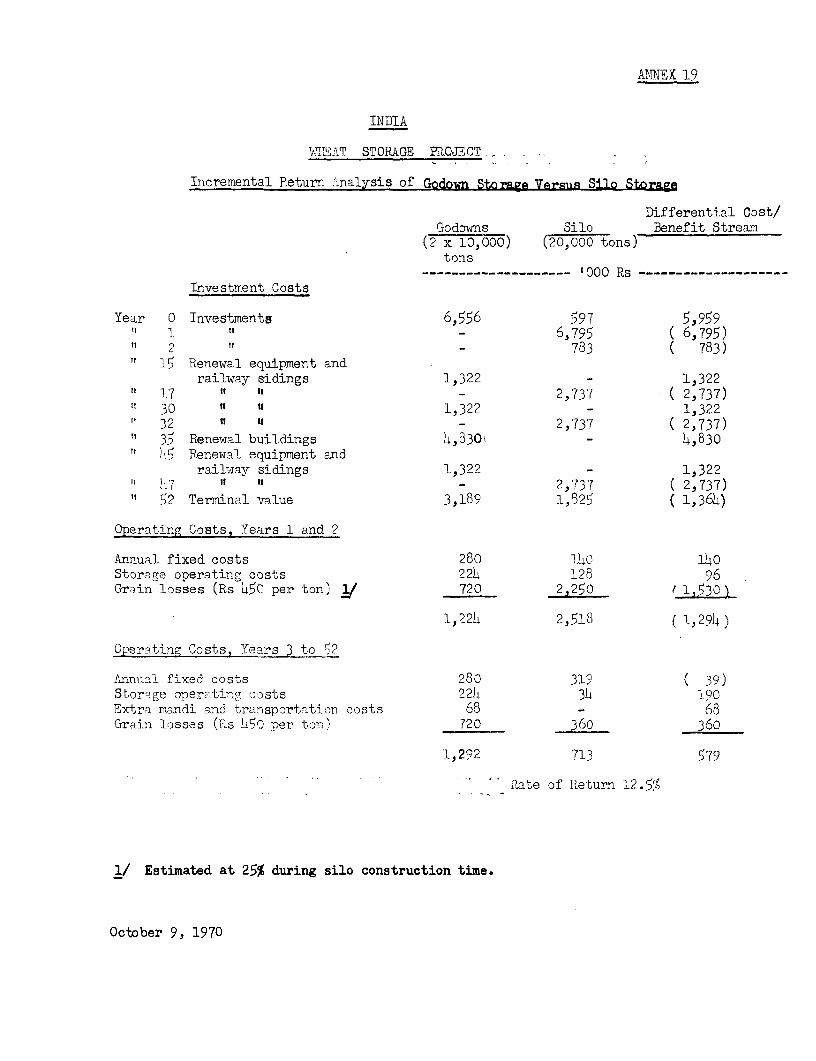
AMNEX 19
INDIA
VT.[TWHET STORAGE PRQ0JECT .
Incremental Return 'Analysis of Godown StoragA VArm11R Silo StoragA
Differential Cost/Godowns Silo Benefit Stream
(2 x 10,000) (20,000 tons)tons
-__ -_ Rs 000Rs----Investment Costs
Year 0 Investments 6,556 597 5)959"1 "I - 6,795 ( 6,795)" 2 " - 783 ( 783)T 15 Renewal equipment and
railway sidings 1,322 - 1,322" 17 . " " - 2,737 ( 2,737)It 30 1" 1,322 - 1,322" 32 n 4 - 2,737 ( 2,737)
35 Renewal buildings 4,330' - 4,8305 Renewal equipment and
railway sidings 1,322 - 1,322" 47 " - 2,737 ( 2,737)52 Terminal value 3,189 1,825 ( 1,364)
Operatirg Costs, Years 1 and 2
Aniual fixed costs 280 1]-)I) 140Storage operating costs 224 128 96Gr.in losses (Rs 450 per ton) / 720 2,250 ( ],53°t
1,224 2,518 ( 1,294)
Operating Costs, Years 3 to _2
inmual fixed costs 280 31 ( 39)Storige operFtinn cssts 224 3) 190Extra mandi and transportaat'on costs 68 - 68Grain losses (Rs li50 per ton) 720 360 360
1,292 713 579
* 'ate of Return 12.5%
1/ Estimated at 25% during silo construction time.
October 9, 1970


ANNEX 20
INDIA
WXEAT STORAGE PROJECT
Economic Rate of Return of Proposed Facilities
1. Without the proposed project, foodgrain losses would be at least25!, compared to 14% for silos and 8% for godowns under the project (Annex 18).The wheat is evaluated at a projected price of Rs 450 (US$60) per ton, whichis in line with projected world market prices. It has been assumed that therewould be one turnover in a year for the wheat stored in the proposedfacilities.
2. Also, in the without-the-project case, the wheat must be transportedquickly to the consuming areas because otherwise the grain would become un-saleable. The railroad bottleneck during the 3-month post-harvest period leadsto an increase in handling, transhipment and transport costs, calculated bythe railroads at about Rs 7 million. It was not possible to verify thiscalculation in detail, but the transport cost increases are at least half thisamount.
3. A differential analysis of the cost streams in the with- and-without-the project case is attached. The rate of return is 25%. The sensitivity ofthe rate of return with respect to losses has also been tested. If losseswithout the project are 15%, the rate of return would be about 16%, and if lossesare 35%, the rate of return would be about 40%.
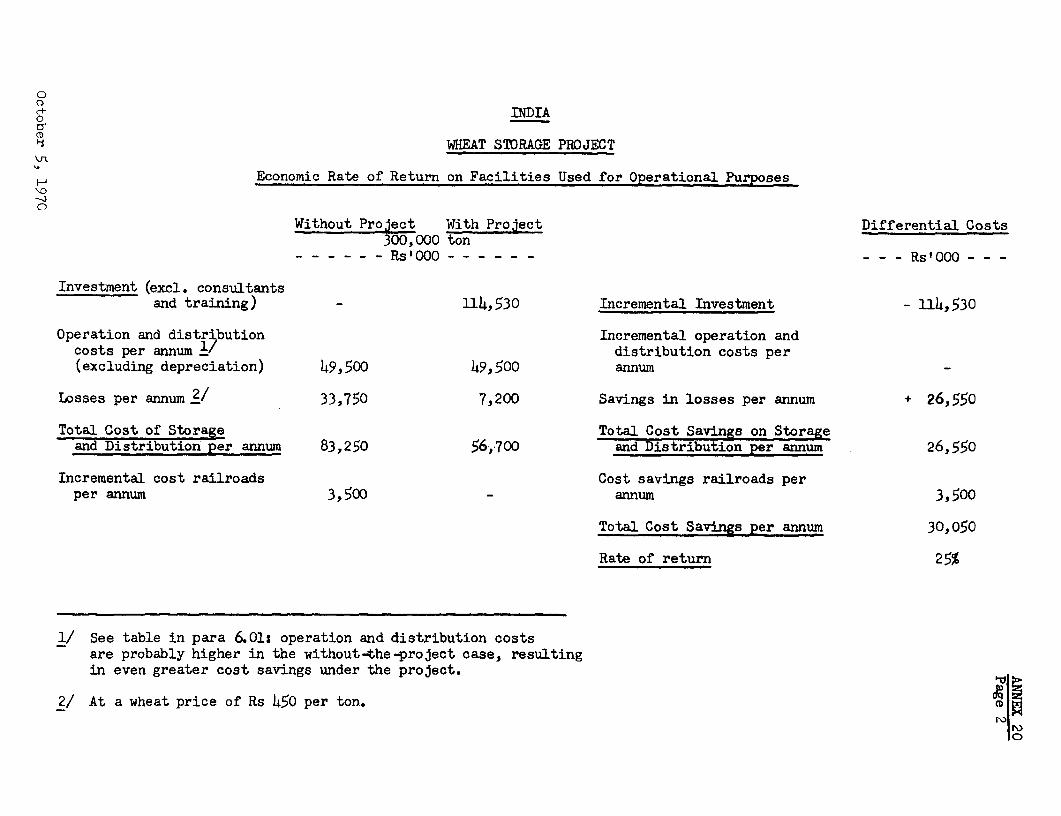
0
Ct INDTA0
ei WHEAT STORAGE PROJECT
H Economic Rate of Return on Facilities Used for Operational Purposes
Without Project With Project Differential Costs300,000 ton
- - - - - - Rs'OOO - - - Rs'OO0 - - -
Investment (excl. consultantsand training) -114,530 Incremental Investment - 114,530
Operation and distr'bution Incremental operation andcosts per annum - distribution costs per(excluding depreciation) 49,500 49,500 annum
Losses per annum 2/ 33,750 7,200 Savings in losses per annum + 26,550
Total Cost of Storage Total Cost Savings on Storageand Distribution per annum 83,250 56,700 and Distribution per annum 26,550
Incremental cost railroads Cost savings railroads perper annum 3,500 annum 3,500
Total Cost Savings per annum 30,050
Rate of return 25%
1/ See table in para &6Ols operation and distribution costsare probably higher in the without-the-project case, resultingin even greater cost savings under the project.
2/ At a wheat price of Rs 450 per ton. X
r'o0

ANNEX 21
INDIA
WHEAT STORAGE PROJECT
Economic Rate of Return of FacilitiesUsed for Contingency Stock Operations
Direct Benefits - Benefits of Domestic Sales
1. A model has been set up to simulate contingency stock operationsunder Indian conditions. A statistical analysis of India's foodgrain pro-duction over the past 20 years has shown that the time series contains a 6-yearcycle from the trend and random deviations from the cycle. The cyclicaldeviations from the trend are as follows:
Year 1 +0.25%2 +4.35%3 +1.35%4 -2.15%5 -2.25%6 -1.551
The random fluctuations were a maximum of about 20% from top to bottom if thevery exceptional drought years 1965 and 1966 are not taken into account. A 30-year series of projected production levels, assuming a 3.2% annual increase inthe production trend, cyclical fluctuations of the above indicated magnitudeand randomly selected deviations in the range of -10% to +10%, derived by usinga table of random numbers, is shown in column 2 of Table 1. Comsumption isexpected to increase at the same rate as normal production with the pricebeing US$60 per ton.
2. The price projected for imported wheat for 1975 and thereafter isUs$65 per ton CIF India, or about US$70 per ton wholesale, and the exportprice would be about US$50 per ton. The price of uS$60 per ton for domesticallyproduced wheat is therefore a reasonable assumption.
3. The price elasticity of foodgrains in the open market is at presentabout -0.5. Since this does not take into account the fairly inelastic demandof the fair price shop consumer, overall elasticity is probably about -0.4.Thus, the price series in column 5 of table 1 is derived by assuming that thedemand elasticity for deviations of production for desired consumption is -0.4,i.e., that a 1% increase in supply will result in a 2.5% or $1.50 decrease inprice.
4. The storage activities shown in columns 6, 7 and 8 of Table 1 assumethat a storage capacity of 5 million tons is available and that the storagepolicy intends to eliminate all year-to-year price fluctuation * The purchasecosts and sales revenues of grain put into and taken out of storage are evaluatedby the average of the without-and-with-storage prices (columns 5 and 6). Thetotal purchase and storage costs of the operation are shown in column 12 and thesales revenue in column 13. The differences between these two columns is thefinancial return that the FCI would make on a contingency stock operation ofthis size. The financial rate of return would be about 2%. However, grain lossesshould also be taken into account. The contingency stock operator makes good on theselosses because the grain contains a moisture uptake that he also sells. From aneconomic point of view, however, the difference in losses between those incurred

ANNEX 21Page 2
under the contingency stock operation and those incurred without the contingencystock operation, should be considered. The losses under the contingency stockoperation have been estimated at 4% per annum of stocks stored for periods longerthan one year from the end of the first year onwards. The net domestic benefitsof the operation are shown in column 16.
Direct Benefits - Import Price Savings
5. The contingency stock operation has also a second major benefit. IfTndia wants to provide consumers with a level of foodgrain consumption as in-dicated in column 1 of Table 1, wheat would have to be procured on world marketsin the without-the-contingency-operation case. World market prices would bemuch higher than the prices that would prevail with the contingency stockoperation.
6. The normal quantity marketed annually on world markets is about 50million tons and the price elasticity has been estimated at about -0.67. Thenormal world market price is projected at about US$65 per ton (wholesale priceIndia US$70 per ton). If India had to import an additional 5 million tons, theworld market price would increase to US$74.75 (wholesale price India US$79.75).The incremental costs to India of purchasing this wheat on world markets in thewithout-the-contingency-stock-operation case, is shown in column 20. Thesebenefits, added to the domestic benefits (column 16) are shown in column 21.
7. Assuming the investment cost is US$45 per ton or US$225 million f'or 5million tons capacity and a salvage value of US$112 million, the internal rate ofreturn (based on the cost and benefit series shown in column 21) is about 5%.
8. The previous analysis assumea. tnat crle wheat could be bought on worldmarkets. It is, however, possible that prices would be much higher than indicatedabove. Also, shipping could be a bottleneck, resulting in a substantial increasein CIF India prices. If, for instance, such bottlenecks would result in anadditional increase of US$10 per ton on India's imports, which is not inconceiv-able, the rate of return would be about 10%.
Indirect Benefits
9. There are, in addition to the direct benefits, also indirect benefits thataccrue to a contingency stock operation. The increased incentives to farmerscreated by stable prices could not be analyzed in quantitative terms, but theireffects upon India's prospects for achieving self-sufficiency are neverthelesssubstantial.
Conclusions Covering Above Model
10. The above analysis indicates that the rate of return on a contingencystock operation of 5 million tons would be at least 5% and possibly 10% whenadditional factors such as shipping bottlenecks and conceivably higher importprices are considered. In addition, there are substantial indirect benefits,which were not taken into account.

ANNEX 21Page 3
Computer Model
11. The above calculations are, of course, very specific to theparticular selected sequence of deviations from normal production and are inthis sense only illustrative. A slightly different model was used tosimulate, with the aid of a computer, the expected rate of return from contingencystocks on a sample of 300 randomly selected 30-year series. The major adjust-ment in the model is that production remains constant over time and is subjectto a uniform probability distribution, ranging from 85 to 115 million tons.The rates of return under this model are substantially the same as thosecalculated above.
June 8, 1971


INDIA0
WHeAT SToRAGE T0RWECT
Analysis of Contingeney Stock Operation - Bedefits of' Domestic Sales
H
Price per Price perProjected Projected Surplus or Surplus or Ton US$ Ton US$
Normal Actual Deficit in Deficit in Without With Govt. Govt. Govt. Total Net GrainConsumption Production Quantity % Storage Storage Purchases Sales Stocks Purchase Storage Financial Sales Financial Storage Domestic---------- ton 000 -- ------- ton 000 --------- Cost Cost Cost Revenues Profits Losses Benefits (cont.)
(1) (2) (3) (4) (5) (6) (7) (9) (9) (10) (11) (12) (13) (14) (15) (16)1970 87,232 84,776 -2,456 -2.80 64.20 -64.20 - - - - - -1971 88,864 90,452 +1,588 +1.78 57.33 57 .33 - - _1972 90,496 91,234 +738 4o.80 58.80 58.80 - - -1973 92,098 101,598 +9,500 +10.30 44.55 44.55 - - - - - _1976 95,000 103,985 +8,985 +9.45 45.83 53.72 5,000 5,000 248,850 7,500 256,350 - (256,350) (256,350)1975 98,087 88,208 -9,879 -10.07 75.10 -67.65 - 5,)00 - - 7,500 7,500 351,400 363,900 - 343,9001976 101,270 104,930 +3,660 +3.61 54.59 60.00 3,660 - 3,660 209,718 6,830 216,548 - (216,548) - (216,548)1977 104,566 92,651 -11,915 -11.39 77.08 -71.83 - 3,660 - - 6,830 6,830 267,864 2f1,036 - 261,0341978 107,967 114,730 .6,763 +6.26 50.61 57.56 5,000 5,000 270,400 7,500 277,900 - (277,900) - (277,900)1979 111,473 117,485 +6,012 +5.39 51.91 51.91 - . 5,000 - 10,000 10,000 - (10,000) 12,000 (22,000)1980 115,092 121,311 +6,219 +5.40 51.90 51.90 - - 5,nO0 - 10,000 10,000 - (10,000) 12,000 (22,000)1981 118,835 127,908 +9,073 +7.63 48.56 48.56 - - 5,000 - 10,000 10,000 - (10,000) 12,000 (22,000)1982 122,702 213,944 -8,758 -6.73 70.09 -63.99 - 5,000 - - 7,500 7,500 330,200 322,700 - 322,7001983 126,825 121,113 -5,712 -4.50 66.75 66.75 - - - - 5,000 5,000 - (5,000) - (5,000)1984 130,805 136,377 +5,572 +4.25 53.63 59.35 5,ooo 5,000 282,450 7,500 289,950 - (289,950) - (289,950)1985 135,052 150,792 +15,740 +11.63 42.56 42.56 5,000 - 10,000 10,000 - (10,000) 12,000 (22,000)1986 139,441 139,910 +469 +0.33 59.51 59.51 - - 5,ooo - 10,000 10,000 - (10,000) 12,000 (22,000)1987 143,973 128,199 -15,774 -10.95 76.62 71.22 - 5,000 - - 7,500 7,500 364,100 356,600 - 356,6001988 148,656 156,936 +8,280 +5.56 51.66 56.69 5,000 - 5,000 270,900 7,500 278,400 - (278,400) - (278,400)1989 153,425 148,026 -5,399 -3.51 65.26 60.39 - 5,000 - - 7,500 7,500 309,100 301,600 - 301,6001990 158,479 168,047 +9,568 +6.26 50.61 55.35 5,000 - 5,o00 264,900 7,500 272,400 - (272,400) - (272,400)1991 163,627 162,202 -1,425 -0.87 61.30 60.00 - 1,625 3,575 - 9,287 9,287 86,001 76,716 3,<2o 66,1361992 168,938 186,629 +17,691 -10.47 44.29 45.56 1,425 - 5,000 64,o0l 9,287 73,298 - (73,298) 12,000 (85,298)1993 174,420 187,737 +13,317 +7.66 48.51 48.51 - - 5,000 - 10,000 10,000 - (10,000) 12,000 (22,000)1994 180,025 188,292 +8,267 +4.59 53.12 53.12 - - 5,000 - 10,000 10,000 - (10,000) 12,000 (22,000)1995 185,953 186,732 +779 +0.41 59.38 59.38 - . 5,000 - 10,000 10,000 - (10,000) 12,000 (22,000)1996 191,995 186,701 -5,296 -2.75 64.12 60.23 - 5,000 - - 7,500 7,500 305,850 298,350 - 298,3501997 198,236 221,339 +23,103 +11.65 42-53 46.30 5,000 5,000 222,050 7,500 229,550 - (229,550) - (229,550)1998 204,687 224,o46 +19,359 +9.45 45.82 45.82 - 5,000 - 10,000 10,000 - (10,000) 12,000 (22,000) , 1999 211,377 217,174 +5,797 +2.74 55.19 55.19 - 5,000 - 10,000 10,000 - (10,000) 12,000 (22,000) ,2000 218,206 213,297 -4,909 -2.24 63.36 60.00 - 4,9O9 91 - 7,545 7,545 297,878 290,333 - 290,333 HIN
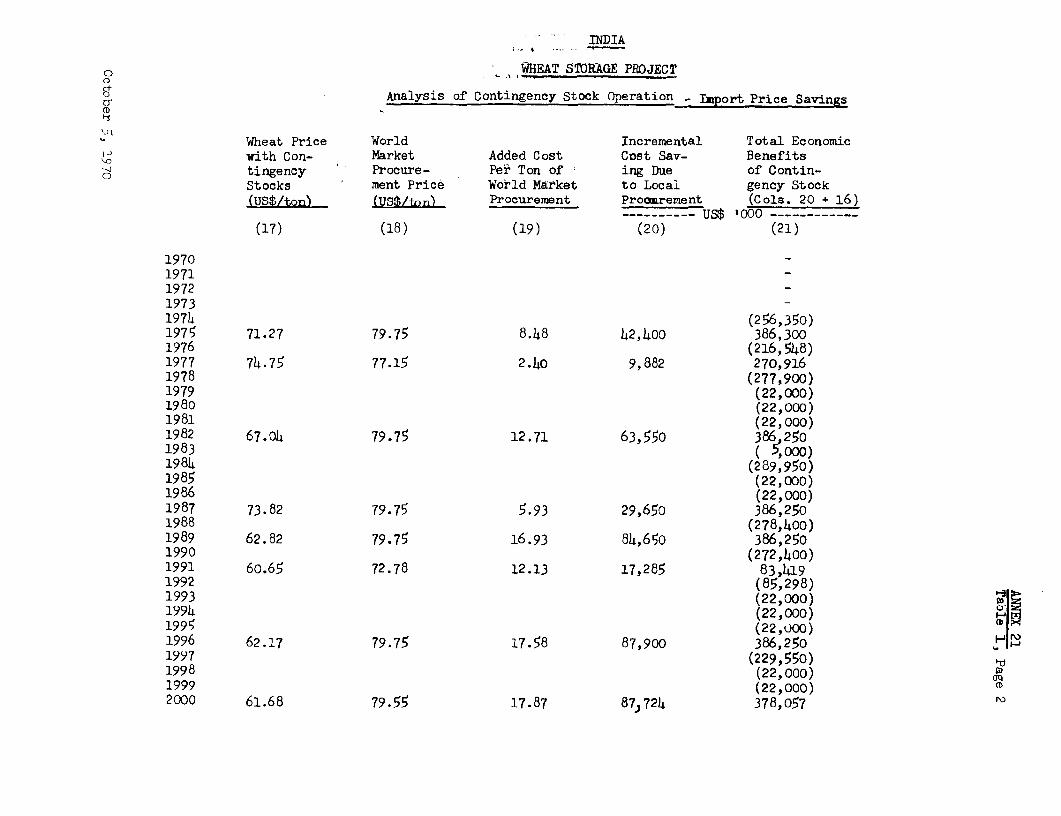
INDIA
o ~t~HEAT STORAGE PROJECT
Analysis of Contingency Stock Operation - Import Price Savings(D
Wheat Price World Incremental Total Economicwith Con- Market Added Cost Cost Sav- Benefitstingency Procure- Per Ton of ing Due of Contin-Stocks ment Price World Market to Local gency Stock(US$/ton) Procurement Proo-rement (Cols. 20 + 16)
(17) (18) (19) (20) (21)
19701971197219731974 (256,350)1975 71.27 79.75 8.48 42,400 386,3001976 (216, 548)1977 74.75 77.15 2.40 9,882 270,9161978 (277,900)1979 (22,000)1980 (22,000)1981 (22,000)1982 67.04 79.75 12.71 63,550 386 2501983 ( Y 000)1984 (289,'950)1985 (22,000)1986 (22,000)1987 73.82 79.75 5.93 29,650 386,2501988 (278,400)1989 62.82 79.75 16.93 84,650 386,2501990 (272,400)1991 60.65 72.78 12.13 17,285 83,4191992 (85,298)1993 (22,000)1994 (22,000)1995 (22,000)1996 62.17 79-75 17.58 87,900 386,2501997 (229,550)1998 (22,000)1999 (22,000)2000 61.68 79.55 17.87 87,724 378,057

~~~~~~(. L A jbgJAMMU &KASHMIR
t 4 >ACH"AGHALN ~~~PRADESHs <9 e ~~~~~~T I B E T
Iq s'N4/BH4UTAN A S |
"r' C tt'LS--'-' <, .
E /~~~~~
~PAKISTAN ( '
INDIA
ARA/ /kw9--< ., , ) ... 0WHEAT STORAGE PROJECTTD o"A-T^tv\ r t ~~~~U XATION OF PROPOSED STORAGE FACILITIES
*WMbIIS *S9uI SnEakNW ;OCATION OF IKOPOSID STORAGE FACILIES
OSTATI A.O TENlOSTOT SERA FOUNDARLIES
DISTRICT TOUNPAiI!S
KE^
. ' ' W .- *s~~~~~~UIC' ( /'
-AY 1971 iBRC tiAii