international society for environmental epidemiology ... · that are functions of a mis-measured...
TRANSCRIPT
Donna Spiegelman, Sc.D. Professor of Epidemiologic Methods Departments of Epidemiology, Biostatistics, Nutrition and Global Health [email protected] www.hsph.harvard.edu/donna-spiegelman/
International Society for Environmental Epidemiology August 2014 Supported by NIH R01 ES009411
hsph.harvard.edu/donna-spiegelman/ 2
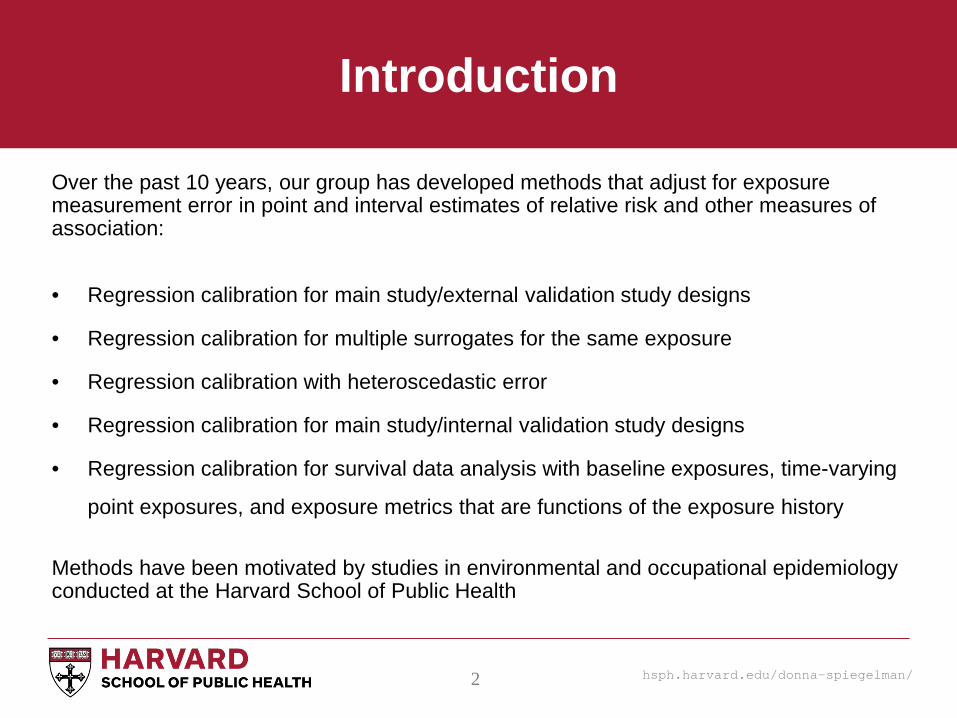
Over the past 10 years, our group has developed methods that adjust for exposure measurement error in point and interval estimates of relative risk and other measures of association:
• Regression calibration for main study/external validation study designs
• Regression calibration for multiple surrogates for the same exposure
• Regression calibration with heteroscedastic error
• Regression calibration for main study/internal validation study designs
• Regression calibration for survival data analysis with baseline exposures, time-varying
point exposures, and exposure metrics that are functions of the exposure history Methods have been motivated by studies in environmental and occupational epidemiology conducted at the Harvard School of Public Health
Introduction
hsph.harvard.edu/donna-spiegelman/ 3
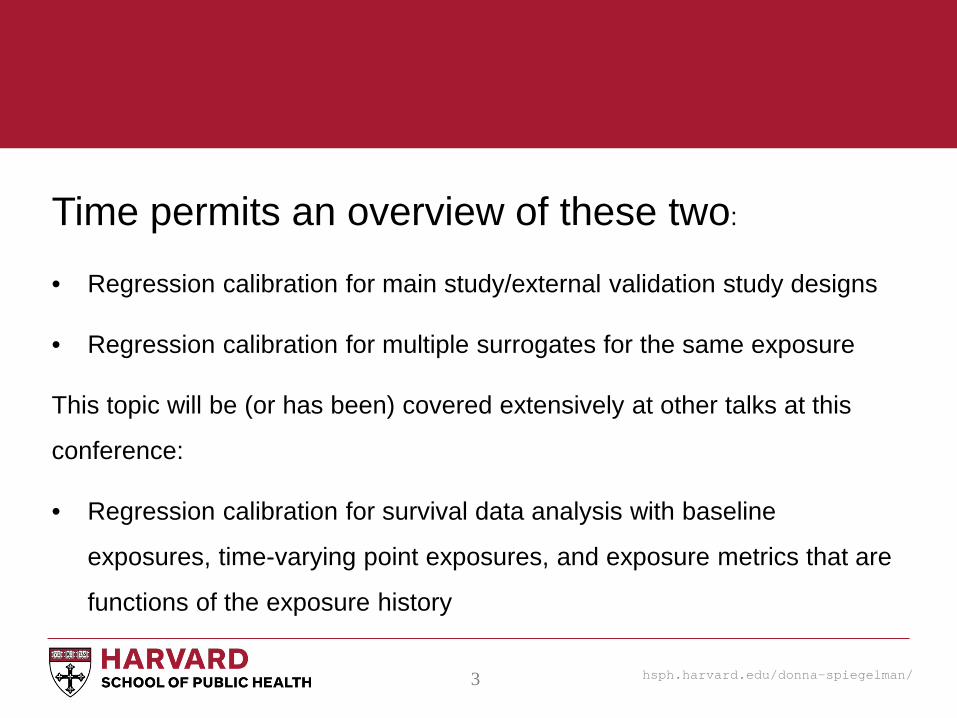
Time permits an overview of these two:
• Regression calibration for main study/external validation study designs
• Regression calibration for multiple surrogates for the same exposure
This topic will be (or has been) covered extensively at other talks at this
conference:
• Regression calibration for survival data analysis with baseline
exposures, time-varying point exposures, and exposure metrics that are
functions of the exposure history
hsph.harvard.edu/donna-spiegelman/ 4
Related talks & posters
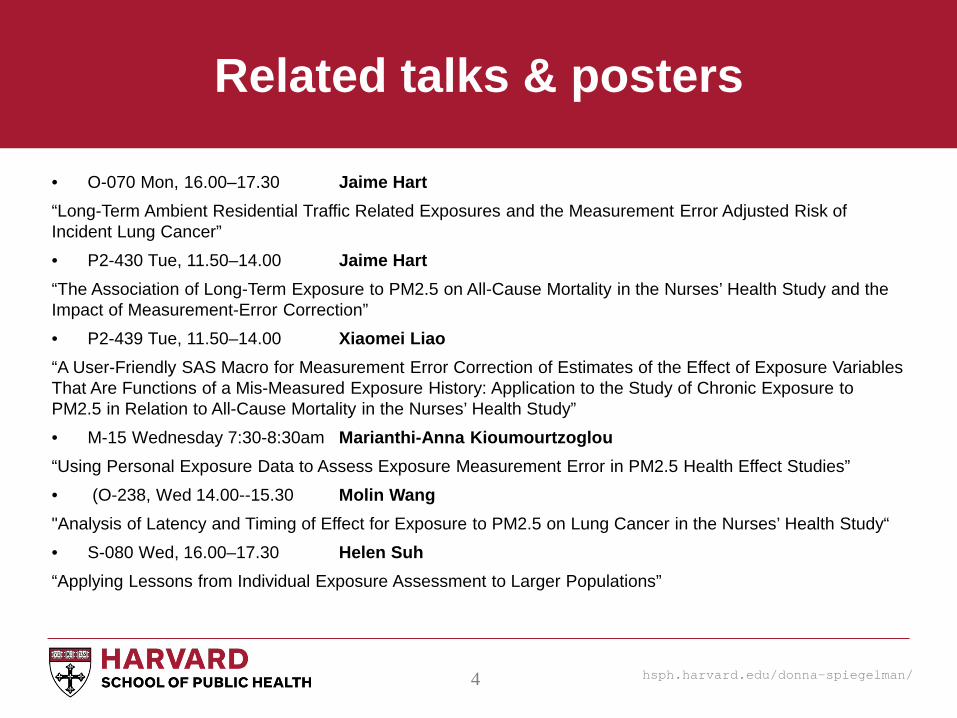
• O-070 Mon, 16.00–17.30 Jaime Hart “Long-Term Ambient Residential Traffic Related Exposures and the Measurement Error Adjusted Risk of Incident Lung Cancer”
• P2-430 Tue, 11.50–14.00 Jaime Hart “The Association of Long-Term Exposure to PM2.5 on All-Cause Mortality in the Nurses’ Health Study and the Impact of Measurement-Error Correction”
• P2-439 Tue, 11.50–14.00 Xiaomei Liao “A User-Friendly SAS Macro for Measurement Error Correction of Estimates of the Effect of Exposure Variables That Are Functions of a Mis-Measured Exposure History: Application to the Study of Chronic Exposure to PM2.5 in Relation to All-Cause Mortality in the Nurses’ Health Study”
• M-15 Wednesday 7:30-8:30am Marianthi-Anna Kioumourtzoglou “Using Personal Exposure Data to Assess Exposure Measurement Error in PM2.5 Health Effect Studies”
• (O-238, Wed 14.00--15.30 Molin Wang "Analysis of Latency and Timing of Effect for Exposure to PM2.5 on Lung Cancer in the Nurses’ Health Study“
• S-080 Wed, 16.00–17.30 Helen Suh “Applying Lessons from Individual Exposure Assessment to Larger Populations”
hsph.harvard.edu/donna-spiegelman/ 5
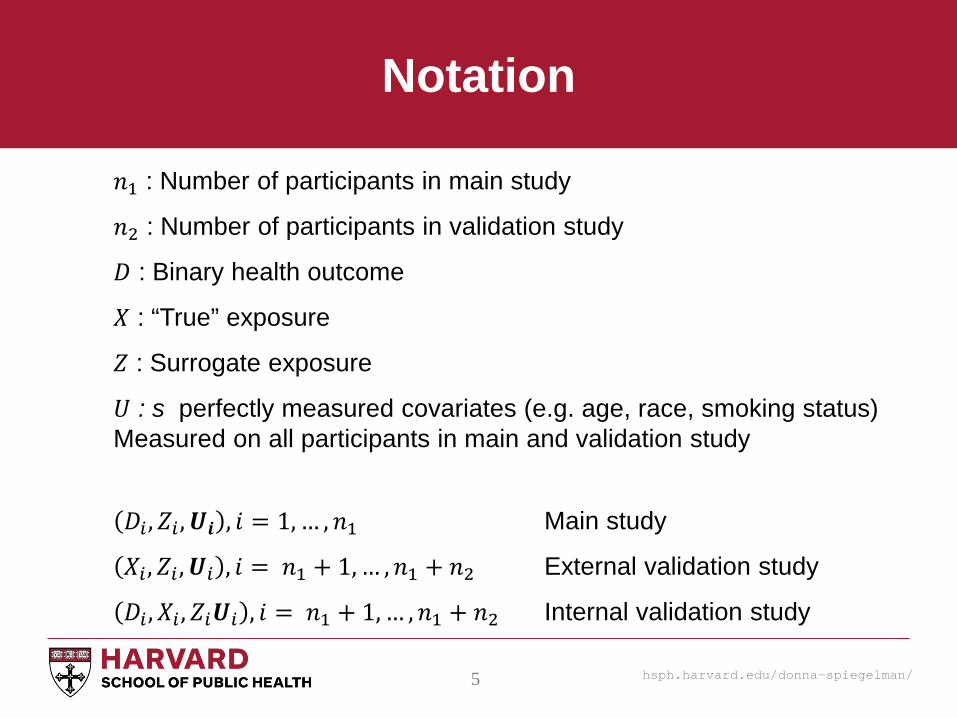
𝑛𝑛1 : Number of participants in main study
𝑛𝑛2 : Number of participants in validation study
𝐷𝐷 : Binary health outcome
𝑋𝑋 : “True” exposure
𝑍𝑍 : Surrogate exposure
𝑈𝑈 : s perfectly measured covariates (e.g. age, race, smoking status) Measured on all participants in main and validation study
𝐷𝐷𝑖𝑖 ,𝑍𝑍𝑖𝑖 ,𝑼𝑼𝒊𝒊 , 𝑖𝑖 = 1, … ,𝑛𝑛1 Main study
𝑋𝑋𝑖𝑖 ,𝑍𝑍𝑖𝑖 ,𝑼𝑼𝑖𝑖 , 𝑖𝑖 = 𝑛𝑛1 + 1, … ,𝑛𝑛1 + 𝑛𝑛2 External validation study
𝐷𝐷𝑖𝑖 ,𝑋𝑋𝑖𝑖 ,𝑍𝑍𝑖𝑖𝑼𝑼𝑖𝑖 , 𝑖𝑖 = 𝑛𝑛1 + 1, … ,𝑛𝑛1 + 𝑛𝑛2 Internal validation study
Notation
hsph.harvard.edu/donna-spiegelman/ 6
Assumptions
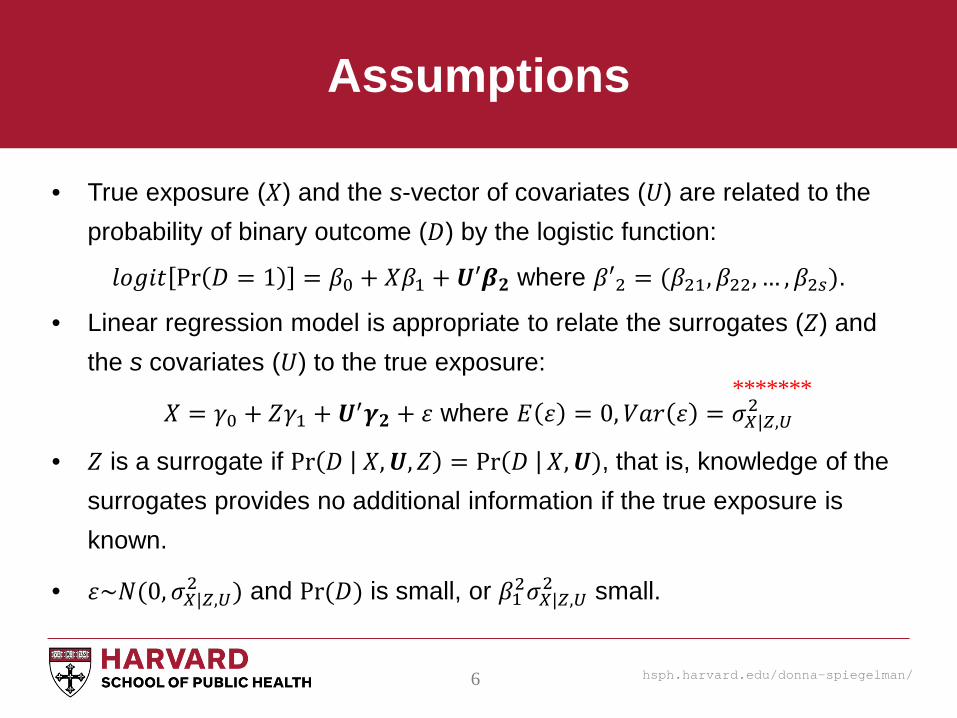
• True exposure (𝑋𝑋) and the s-vector of covariates (𝑈𝑈) are related to the probability of binary outcome (𝐷𝐷) by the logistic function:
𝑙𝑙𝑙𝑙𝑙𝑙𝑖𝑖𝑙𝑙 Pr 𝐷𝐷 = 1 = 𝛽𝛽0 + 𝑋𝑋𝛽𝛽1 + 𝑼𝑼𝑼𝜷𝜷𝟐𝟐 where 𝛽𝛽𝑼2 = (𝛽𝛽21,𝛽𝛽22, … ,𝛽𝛽2𝑠𝑠).
• Linear regression model is appropriate to relate the surrogates (𝑍𝑍) and the s covariates (𝑈𝑈) to the true exposure:
𝑋𝑋 = 𝛾𝛾0 + 𝑍𝑍𝛾𝛾1 + 𝑼𝑼′𝜸𝜸𝟐𝟐 + 𝜀𝜀 where 𝐸𝐸 𝜀𝜀 = 0,𝑉𝑉𝑉𝑉𝑉𝑉 𝜀𝜀 = 𝜎𝜎𝑋𝑋|𝑍𝑍,𝑈𝑈2
• 𝑍𝑍 is a surrogate if Pr 𝐷𝐷 𝑋𝑋,𝑼𝑼,𝑍𝑍 = Pr 𝐷𝐷 𝑋𝑋,𝑼𝑼), that is, knowledge of the surrogates provides no additional information if the true exposure is known.
• 𝜀𝜀~𝑁𝑁(0,𝜎𝜎𝑋𝑋|𝑍𝑍,𝑈𝑈2 ) and Pr (𝐷𝐷) is small, or 𝛽𝛽12𝜎𝜎𝑋𝑋|𝑍𝑍,𝑈𝑈
2 small.
*******
hsph.harvard.edu/donna-spiegelman/ 7
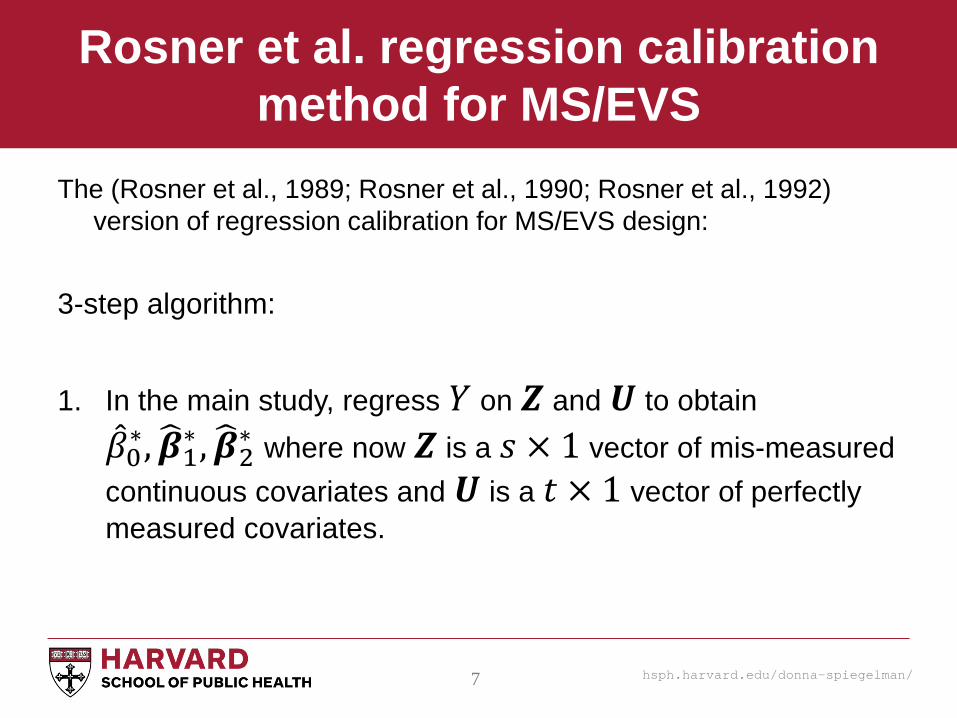
Rosner et al. regression calibration method for MS/EVS
The (Rosner et al., 1989; Rosner et al., 1990; Rosner et al., 1992) version of regression calibration for MS/EVS design:
3-step algorithm: 1. In the main study, regress 𝑌𝑌 on 𝒁𝒁 and 𝑼𝑼 to obtain
�̂�𝛽0∗,𝜷𝜷�1∗ ,𝜷𝜷�2∗ where now 𝒁𝒁 is a 𝑠𝑠 × 1 vector of mis-measured continuous covariates and 𝑼𝑼 is a 𝑙𝑙 × 1 vector of perfectly measured covariates.
hsph.harvard.edu/donna-spiegelman/ 8
Rosner et al. regression calibration method for MS/EVS
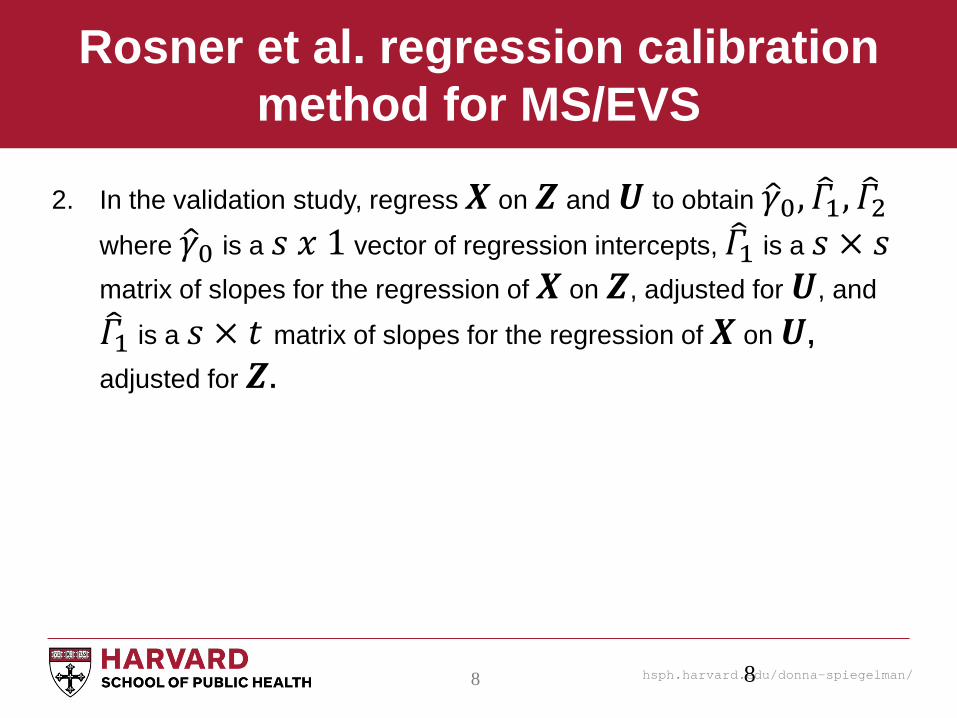
2. In the validation study, regress 𝑿𝑿 on 𝒁𝒁 and 𝑼𝑼 to obtain 𝛾𝛾�0,𝛤𝛤�1,𝛤𝛤�2
where 𝛾𝛾�0 is a 𝑠𝑠 𝑥𝑥 1 vector of regression intercepts, 𝛤𝛤�1 is a 𝑠𝑠 × 𝑠𝑠 matrix of slopes for the regression of 𝑿𝑿 on 𝒁𝒁, adjusted for 𝑼𝑼, and
𝛤𝛤�1 is a 𝑠𝑠 × 𝑙𝑙 matrix of slopes for the regression of 𝑿𝑿 on 𝑼𝑼, adjusted for 𝒁𝒁.
8
hsph.harvard.edu/donna-spiegelman/ 9
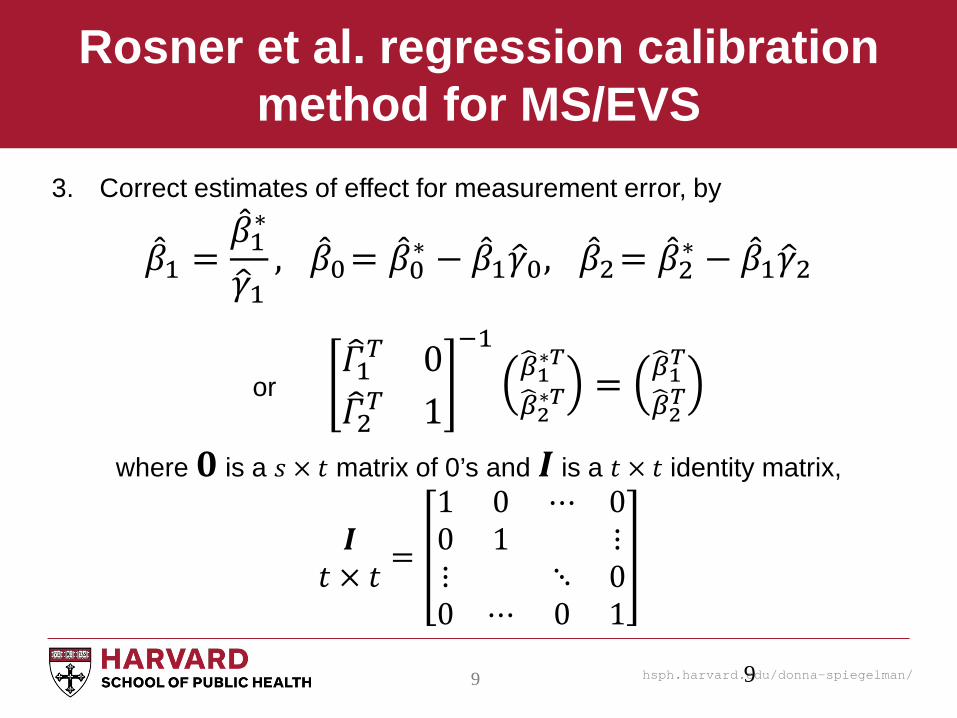
Rosner et al. regression calibration method for MS/EVS
3. Correct estimates of effect for measurement error, by
�̂�𝛽1 =�̂�𝛽1∗
𝛾𝛾�1, �̂�𝛽0= �̂�𝛽0∗ − �̂�𝛽1𝛾𝛾�0, �̂�𝛽2= �̂�𝛽2∗ − �̂�𝛽1𝛾𝛾�2
or 𝛤𝛤�1𝑇𝑇 0𝛤𝛤�2𝑇𝑇 1
−1𝛽𝛽�1∗𝑇𝑇
𝛽𝛽�2∗𝑇𝑇= 𝛽𝛽�1𝑇𝑇
𝛽𝛽�2𝑇𝑇
where 𝟎𝟎 is a 𝑠𝑠 × 𝑙𝑙 matrix of 0’s and 𝑰𝑰 is a 𝑙𝑙 × 𝑙𝑙 identity matrix,
𝑰𝑰𝑙𝑙 × 𝑙𝑙 =
1 0 ⋯ 00 1 ⋮⋮ ⋱ 00 ⋯ 0 1
9
hsph.harvard.edu/donna-spiegelman/ 10
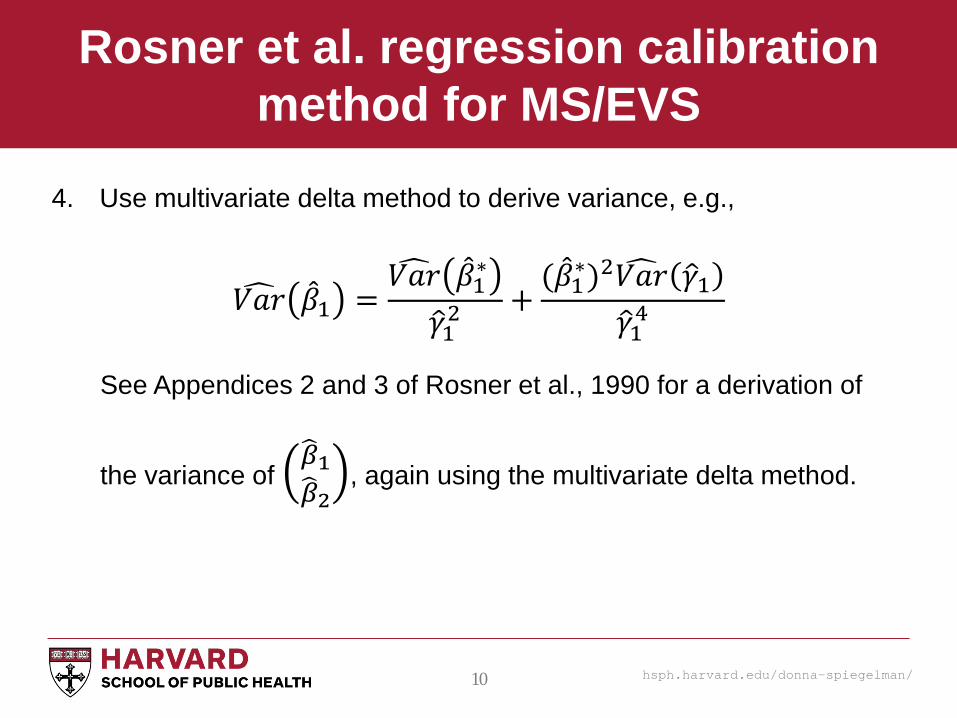
Rosner et al. regression calibration method for MS/EVS
4. Use multivariate delta method to derive variance, e.g.,
𝑉𝑉𝑉𝑉𝑉𝑉� �̂�𝛽1 =𝑉𝑉𝑉𝑉𝑉𝑉� �̂�𝛽1∗
𝛾𝛾�12+
(�̂�𝛽1∗)2𝑉𝑉𝑉𝑉𝑉𝑉� 𝛾𝛾�1𝛾𝛾�14
See Appendices 2 and 3 of Rosner et al., 1990 for a derivation of
the variance of 𝛽𝛽�1𝛽𝛽�2
, again using the multivariate delta method.
hsph.harvard.edu/donna-spiegelman/ 11
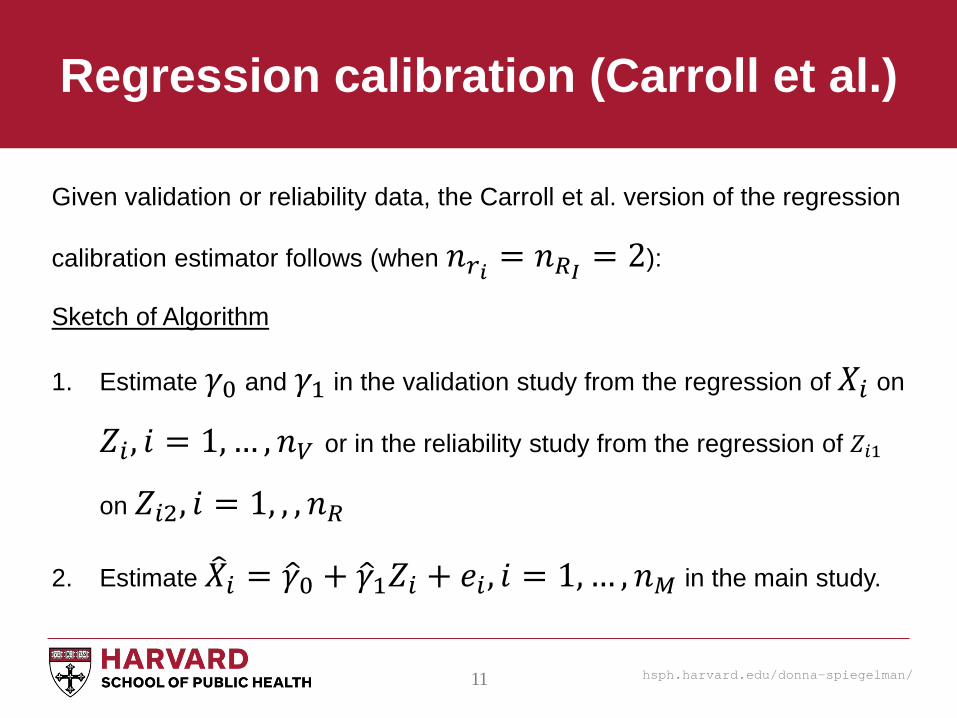
Regression calibration (Carroll et al.)
Given validation or reliability data, the Carroll et al. version of the regression
calibration estimator follows (when 𝑛𝑛𝑟𝑟𝑖𝑖 = 𝑛𝑛𝑅𝑅𝐼𝐼 = 2):
Sketch of Algorithm
1. Estimate 𝛾𝛾0 and 𝛾𝛾1 in the validation study from the regression of 𝑋𝑋𝑖𝑖 on
𝑍𝑍𝑖𝑖 , 𝑖𝑖 = 1, … ,𝑛𝑛𝑉𝑉 or in the reliability study from the regression of 𝑍𝑍𝑖𝑖1
on 𝑍𝑍𝑖𝑖2, 𝑖𝑖 = 1, , ,𝑛𝑛𝑅𝑅
2. Estimate 𝑋𝑋�𝑖𝑖 = 𝛾𝛾�0 + 𝛾𝛾�1𝑍𝑍𝑖𝑖 + 𝑒𝑒𝑖𝑖 , 𝑖𝑖 = 1, … ,𝑛𝑛𝑀𝑀 in the main study.
hsph.harvard.edu/donna-spiegelman/ 12
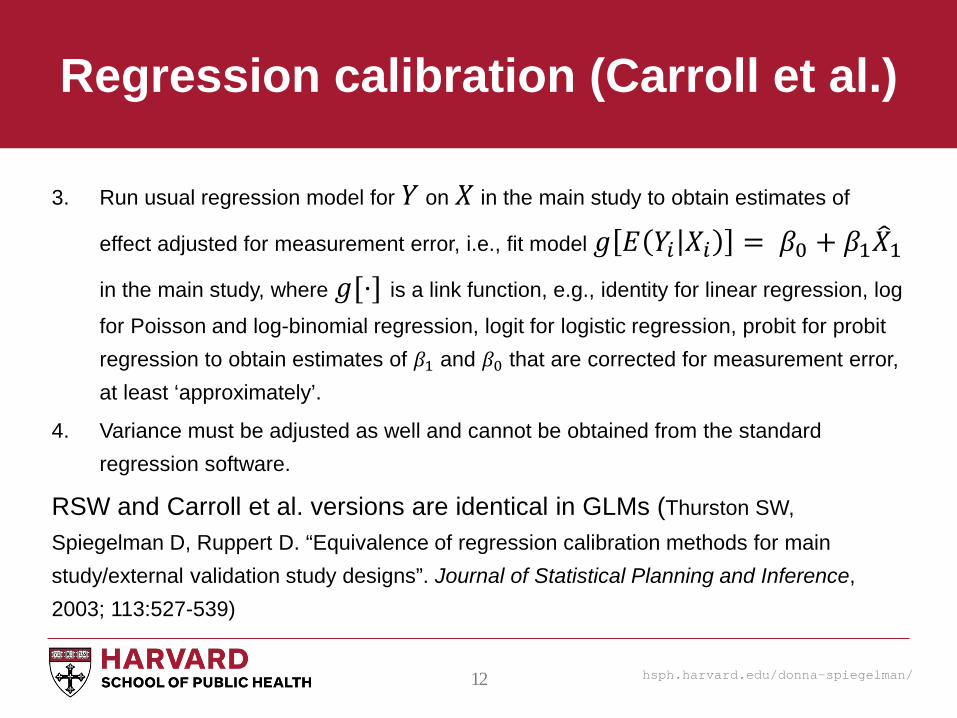
Regression calibration (Carroll et al.)
3. Run usual regression model for 𝑌𝑌 on 𝑋𝑋 in the main study to obtain estimates of
effect adjusted for measurement error, i.e., fit model 𝑙𝑙 𝐸𝐸 𝑌𝑌𝑖𝑖 𝑋𝑋𝑖𝑖 = 𝛽𝛽0 + 𝛽𝛽1𝑋𝑋�1
in the main study, where 𝑙𝑙[⋅] is a link function, e.g., identity for linear regression, log
for Poisson and log-binomial regression, logit for logistic regression, probit for probit regression to obtain estimates of 𝛽𝛽1 and 𝛽𝛽0 that are corrected for measurement error, at least ‘approximately’.
4. Variance must be adjusted as well and cannot be obtained from the standard regression software.
RSW and Carroll et al. versions are identical in GLMs (Thurston SW, Spiegelman D, Ruppert D. “Equivalence of regression calibration methods for main study/external validation study designs”. Journal of Statistical Planning and Inference, 2003; 113:527-539)
hsph.harvard.edu/donna-spiegelman/ 13
An example
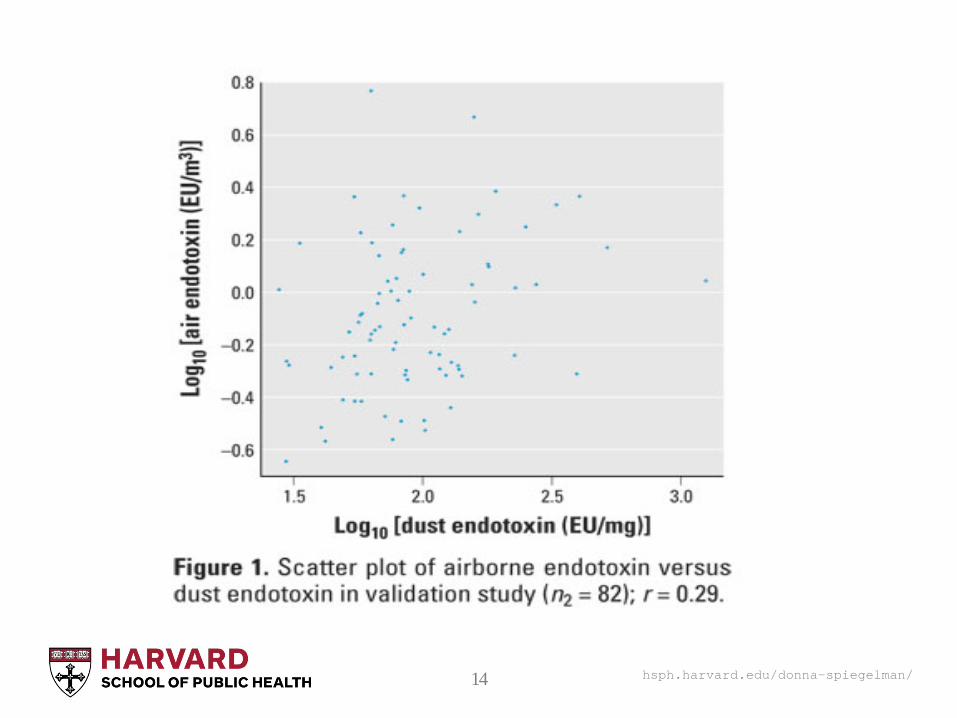
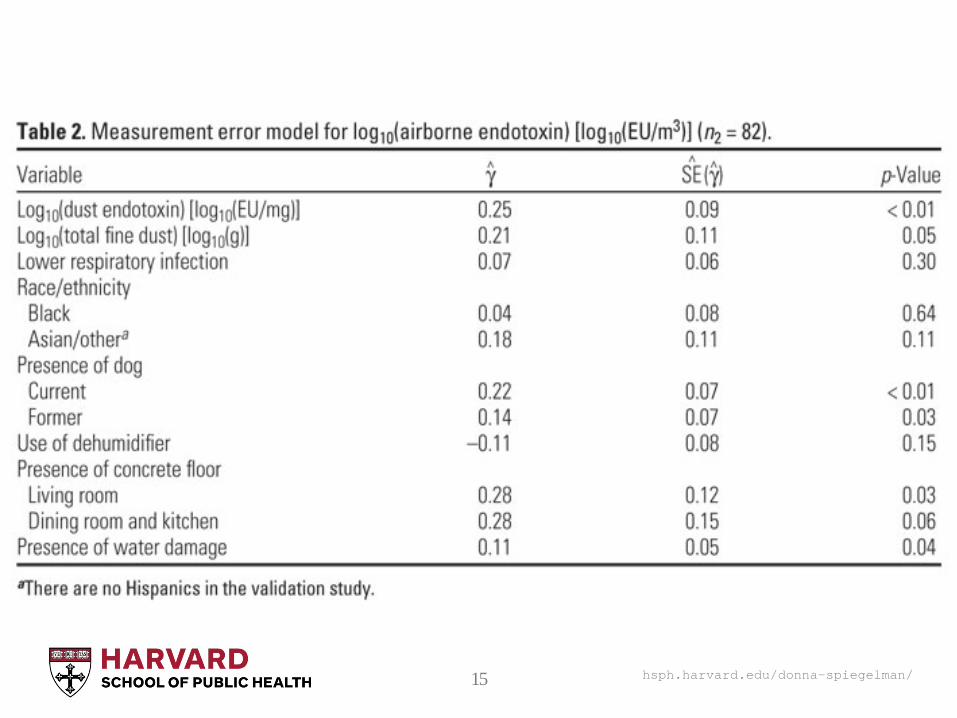
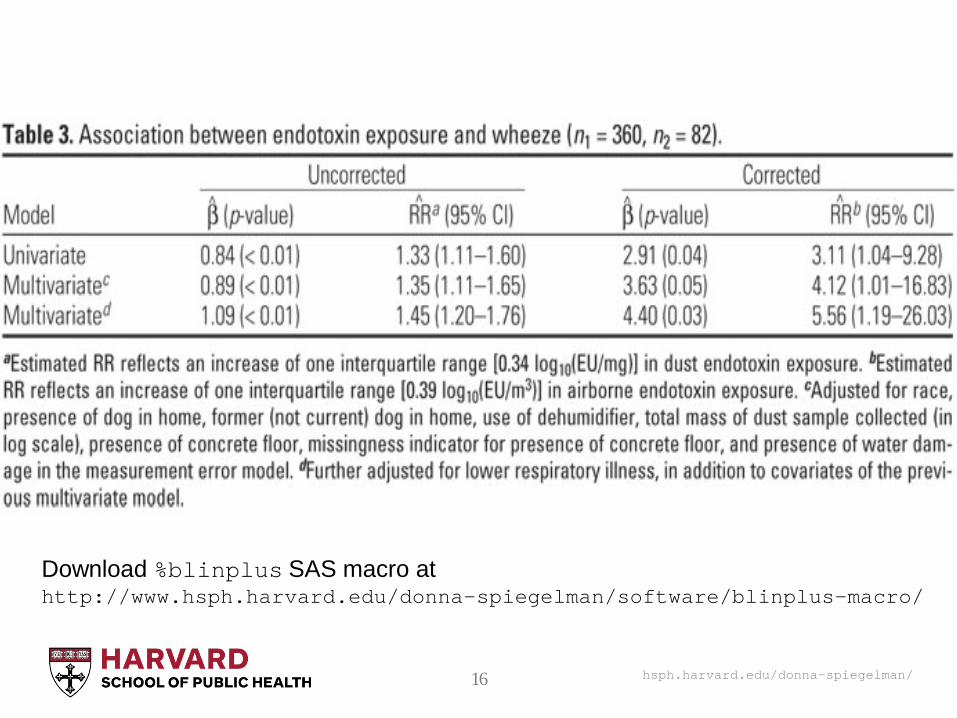
Home Endotoxin Exposure and Wheeze in Infants: Correction for Bias Due to Exposure Measurement Error Nora Horick, Edie Weller, Donald K. Milton, Diane R. Gold, Ruifeng Li, and Donna Spiegelman Department of Biostatistics and Department of Environmental Health, Harvard School of Public Health, Boston, Massachusetts, USA; Channing Laboratory, Harvard Medical School, Boston, Massachusetts, USA; Department of Epidemiology, Harvard School of Public Health, Boston, Massachusetts, USA Environmental Health Perspectives Volume 114, Number 1, January 2006
hsph.harvard.edu/donna-spiegelman/ 14
hsph.harvard.edu/donna-spiegelman/ 15
hsph.harvard.edu/donna-spiegelman/ 16
Download %blinplus SAS macro at http://www.hsph.harvard.edu/donna-spiegelman/software/blinplus-macro/
hsph.harvard.edu/donna-spiegelman/ 17
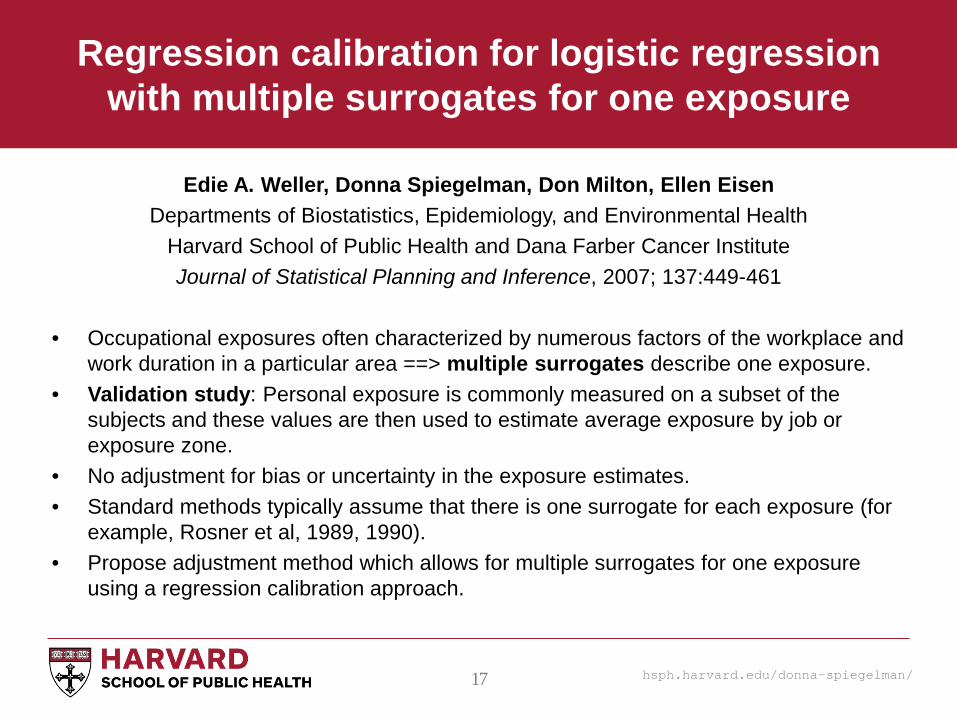
Regression calibration for logistic regression with multiple surrogates for one exposure
Edie A. Weller, Donna Spiegelman, Don Milton, Ellen Eisen Departments of Biostatistics, Epidemiology, and Environmental Health
Harvard School of Public Health and Dana Farber Cancer Institute Journal of Statistical Planning and Inference, 2007; 137:449-461
• Occupational exposures often characterized by numerous factors of the workplace and
work duration in a particular area ==> multiple surrogates describe one exposure. • Validation study: Personal exposure is commonly measured on a subset of the
subjects and these values are then used to estimate average exposure by job or exposure zone.
• No adjustment for bias or uncertainty in the exposure estimates. • Standard methods typically assume that there is one surrogate for each exposure (for
example, Rosner et al, 1989, 1990). • Propose adjustment method which allows for multiple surrogates for one exposure
using a regression calibration approach.
hsph.harvard.edu/donna-spiegelman/ 18
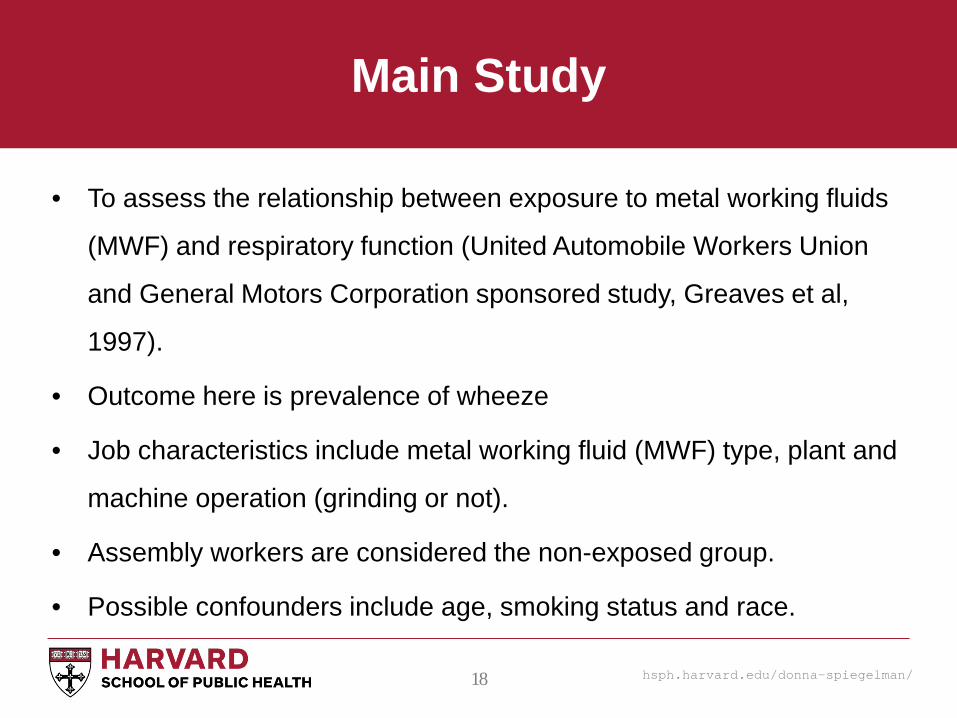
Main Study
• To assess the relationship between exposure to metal working fluids
(MWF) and respiratory function (United Automobile Workers Union
and General Motors Corporation sponsored study, Greaves et al,
1997).
• Outcome here is prevalence of wheeze
• Job characteristics include metal working fluid (MWF) type, plant and
machine operation (grinding or not).
• Assembly workers are considered the non-exposed group.
• Possible confounders include age, smoking status and race.

hsph.harvard.edu/donna-spiegelman/ 19
Exposure Assessment Study (generically, the validation study)
• Exposure was measured in various job zones (Woskie et al., 1994).
• Intensity of exposure to MWF aerosol measured by the thoracic
aerosol fraction (i.e. the sum of the two smallest size fractions
measured with the personal monitors).
• Full shift (8 hour) personal samples of aerosol exposure in breathing
zone of automobile workers were collected in various job zones.
hsph.harvard.edu/donna-spiegelman/ 20
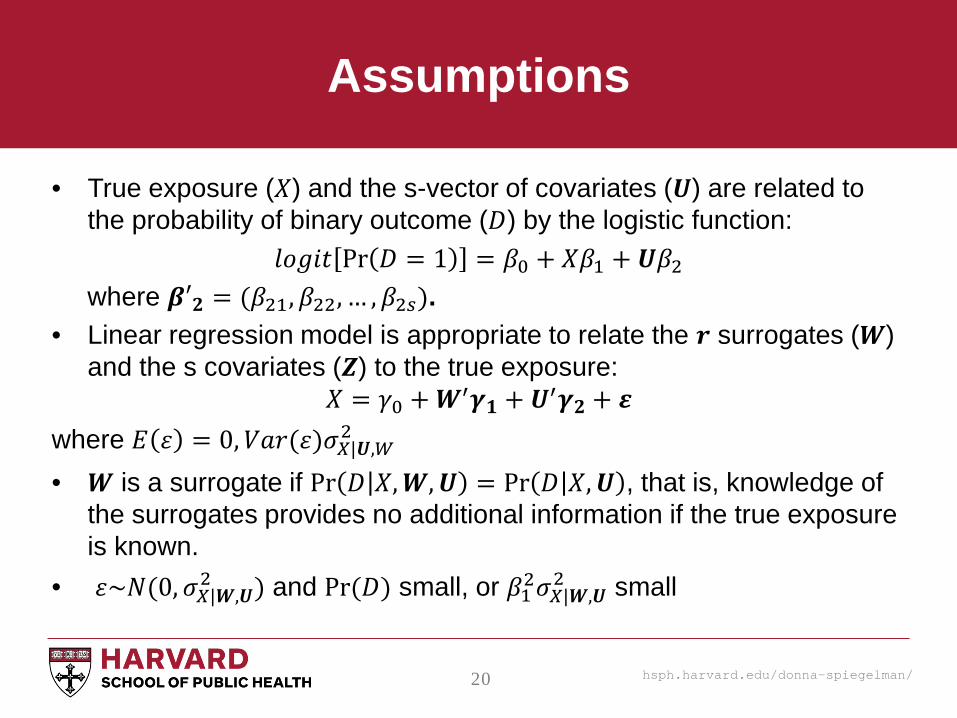
Assumptions
• True exposure (𝑋𝑋) and the s-vector of covariates (𝑼𝑼) are related to the probability of binary outcome (𝐷𝐷) by the logistic function:
𝑙𝑙𝑙𝑙𝑙𝑙𝑖𝑖𝑙𝑙 Pr 𝐷𝐷 = 1 = 𝛽𝛽0 + 𝑋𝑋𝛽𝛽1 + 𝑼𝑼𝛽𝛽2 where 𝜷𝜷𝑼𝟐𝟐 = (𝛽𝛽21,𝛽𝛽22, … ,𝛽𝛽2𝑠𝑠).
• Linear regression model is appropriate to relate the 𝒓𝒓 surrogates (𝑾𝑾) and the s covariates (𝒁𝒁) to the true exposure:
𝑋𝑋 = 𝛾𝛾0 + 𝑾𝑾′𝜸𝜸𝟏𝟏 + 𝑼𝑼′𝜸𝜸𝟐𝟐 + 𝜺𝜺 where 𝐸𝐸 𝜀𝜀 = 0,𝑉𝑉𝑉𝑉𝑉𝑉(𝜀𝜀)𝜎𝜎𝑋𝑋|𝑼𝑼,𝑊𝑊
2 • 𝑾𝑾 is a surrogate if Pr 𝐷𝐷 𝑋𝑋,𝑾𝑾,𝑼𝑼 = Pr 𝐷𝐷 𝑋𝑋,𝑼𝑼 , that is, knowledge of
the surrogates provides no additional information if the true exposure is known.
• 𝜀𝜀~𝑁𝑁(0,𝜎𝜎𝑋𝑋|𝑾𝑾,𝑼𝑼2 ) and Pr (𝐷𝐷) small, or 𝛽𝛽12𝜎𝜎𝑋𝑋|𝑾𝑾,𝑼𝑼
2 small
hsph.harvard.edu/donna-spiegelman/ 21
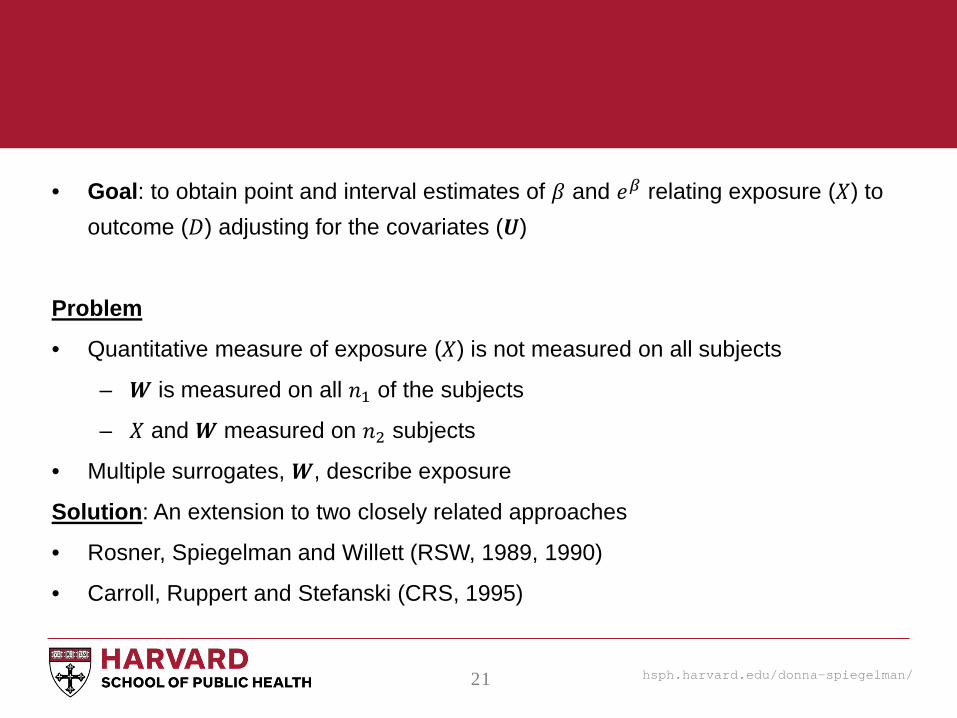
• Goal: to obtain point and interval estimates of 𝛽𝛽 and 𝑒𝑒𝛽𝛽 relating exposure (𝑋𝑋) to outcome (𝐷𝐷) adjusting for the covariates (𝑼𝑼)
Problem
• Quantitative measure of exposure (𝑋𝑋) is not measured on all subjects
– 𝑾𝑾 is measured on all 𝑛𝑛1 of the subjects
– 𝑋𝑋 and 𝑾𝑾 measured on 𝑛𝑛2 subjects
• Multiple surrogates, 𝑾𝑾, describe exposure
Solution: An extension to two closely related approaches
• Rosner, Spiegelman and Willett (RSW, 1989, 1990)
• Carroll, Ruppert and Stefanski (CRS, 1995)
hsph.harvard.edu/donna-spiegelman/ 22
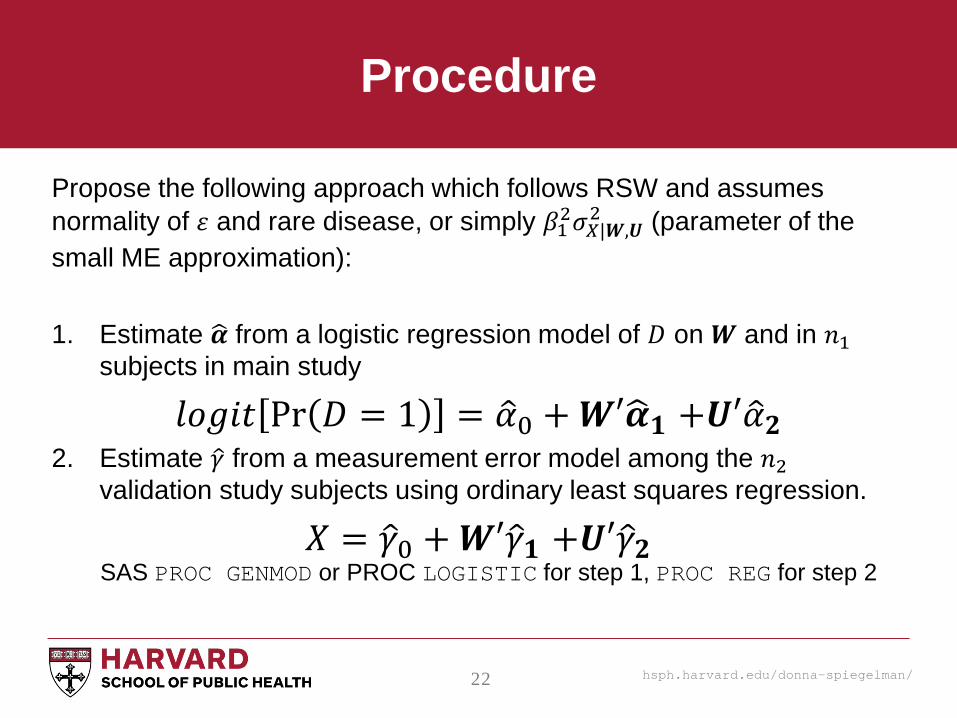
Procedure
Propose the following approach which follows RSW and assumes normality of 𝜀𝜀 and rare disease, or simply 𝛽𝛽12𝜎𝜎𝑋𝑋|𝑾𝑾,𝑼𝑼
2 (parameter of the small ME approximation): 1. Estimate 𝜶𝜶� from a logistic regression model of 𝐷𝐷 on 𝑾𝑾 and in 𝑛𝑛1
subjects in main study
𝑙𝑙𝑙𝑙𝑙𝑙𝑖𝑖𝑙𝑙 Pr 𝐷𝐷 = 1 = 𝛼𝛼�0 + 𝑾𝑾𝑼𝜶𝜶�𝟏𝟏 +𝑼𝑼𝑼𝛼𝛼�𝟐𝟐 2. Estimate 𝛾𝛾� from a measurement error model among the 𝑛𝑛2
validation study subjects using ordinary least squares regression.
𝑋𝑋 = 𝛾𝛾�0 + 𝑾𝑾𝑼𝛾𝛾�𝟏𝟏 +𝑼𝑼𝑼𝛾𝛾�𝟐𝟐 SAS PROC GENMOD or PROC LOGISTIC for step 1, PROC REG for step 2
hsph.harvard.edu/donna-spiegelman/ 23
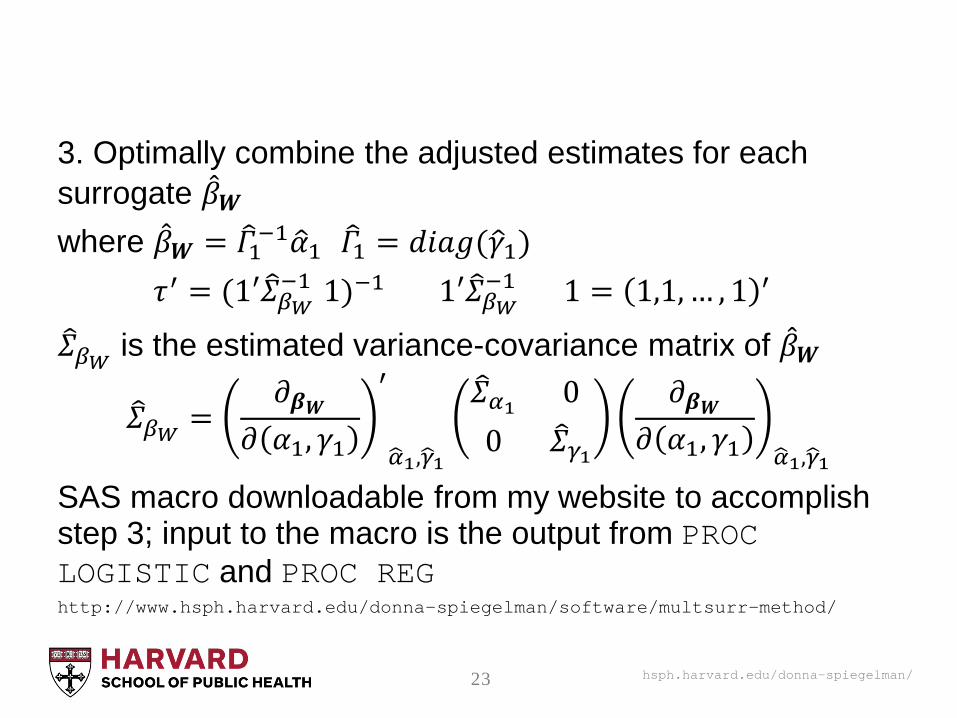
3. Optimally combine the adjusted estimates for each surrogate �̂�𝛽𝑾𝑾 where �̂�𝛽𝑾𝑾 = 𝛤𝛤�1−1𝛼𝛼�1 𝛤𝛤�1 = 𝑑𝑑𝑖𝑖𝑉𝑉𝑙𝑙(𝛾𝛾�1) 𝜏𝜏′ = (1𝑼𝛴𝛴�𝛽𝛽𝑊𝑊
−1 1)−1 1𝑼𝛴𝛴�𝛽𝛽𝑊𝑊−1 1 = 1,1, … , 1 ′
𝛴𝛴�𝛽𝛽𝑊𝑊 is the estimated variance-covariance matrix of �̂�𝛽𝑾𝑾
𝛴𝛴�𝛽𝛽𝑊𝑊 =𝜕𝜕𝜷𝜷𝑾𝑾
𝜕𝜕 𝛼𝛼1, 𝛾𝛾1
′
𝛼𝛼�1,𝛾𝛾�1
𝛴𝛴�𝛼𝛼1 00 𝛴𝛴�𝛾𝛾1
𝜕𝜕𝜷𝜷𝑾𝑾𝜕𝜕 𝛼𝛼1, 𝛾𝛾1 𝛼𝛼�1,𝛾𝛾�1
SAS macro downloadable from my website to accomplish step 3; input to the macro is the output from PROC LOGISTIC and PROC REG http://www.hsph.harvard.edu/donna-spiegelman/software/multsurr-method/
hsph.harvard.edu/donna-spiegelman/ 24
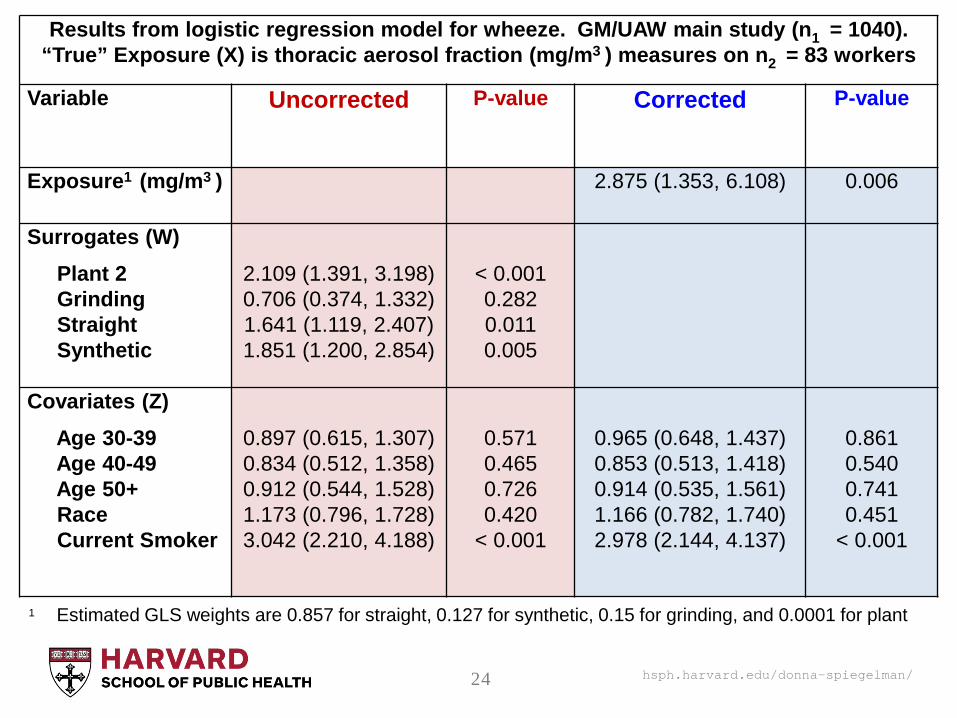
Results from logistic regression model for wheeze. GM/UAW main study (n1 = 1040). “True” Exposure (X) is thoracic aerosol fraction (mg/m3 ) measures on n2 = 83 workers
Variable Uncorrected
P-value
Corrected
P-value
Exposure1 (mg/m3 ) 2.875 (1.353, 6.108)
0.006
Surrogates (W)
Plant 2 Grinding Straight Synthetic
2.109 (1.391, 3.198) 0.706 (0.374, 1.332) 1.641 (1.119, 2.407) 1.851 (1.200, 2.854)
< 0.001 0.282 0.011 0.005
Covariates (Z)
Age 30-39 Age 40-49 Age 50+ Race Current Smoker
0.897 (0.615, 1.307) 0.834 (0.512, 1.358) 0.912 (0.544, 1.528) 1.173 (0.796, 1.728) 3.042 (2.210, 4.188)
0.571 0.465 0.726 0.420
< 0.001
0.965 (0.648, 1.437) 0.853 (0.513, 1.418) 0.914 (0.535, 1.561) 1.166 (0.782, 1.740) 2.978 (2.144, 4.137)
0.861 0.540 0.741 0.451
< 0.001
1 Estimated GLS weights are 0.857 for straight, 0.127 for synthetic, 0.15 for grinding, and 0.0001 for plant
hsph.harvard.edu/donna-spiegelman/ 25
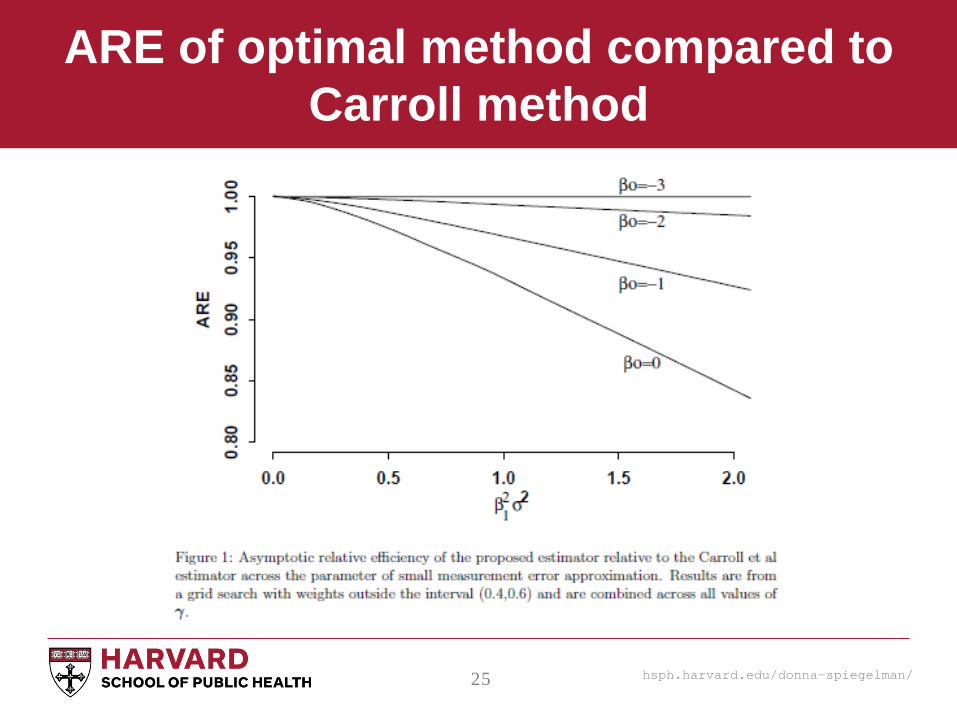
ARE of optimal method compared to Carroll method
hsph.harvard.edu/donna-spiegelman/ 26
Regression Calibration With Heteroscedastic Variance
Donna Spiegelman, Roger Logan, Douglas Grove
International Journal of Biostatistics: 2011 Vol. 7, Issue 1, Article
4. PMCID: PMC3404553
Conclusion: For all practical purposes, no need
to worry about heteroscedasticity
hsph.harvard.edu/donna-spiegelman/ 27
A comparison of regression calibration approaches for designs with internal validation data Sally W. Thurston , Paige L. Williams, Russ Hauser, Howard Hu, Mauricio Hernandez-Avila, and Donna Spiegelman
Department of Biostatistics and Computational Biology, University of Rochester Medical Center, 601 Elmwood Avenue, P.O. Box 630, Rochester, NY 14642, USA
Department of Biostatistics, Harvard School of Public Health, USA
Department of Environmental Health, Harvard School of Public Health, USA
Centro de Investigaciones en Salud Poblacional, Instituto Nacional de Salud Publica, Cuernavaca, Morelos, Mexico
Department of Epidemiology, Harvard School of Public Health, USA
Channing Laboratory, Department of Medicine, Brigham and Women's Hospital, Harvard Medical School, US
Journal of Statistical Planning and Inference, 2005; 131:175-190.
hsph.harvard.edu/donna-spiegelman/ 28
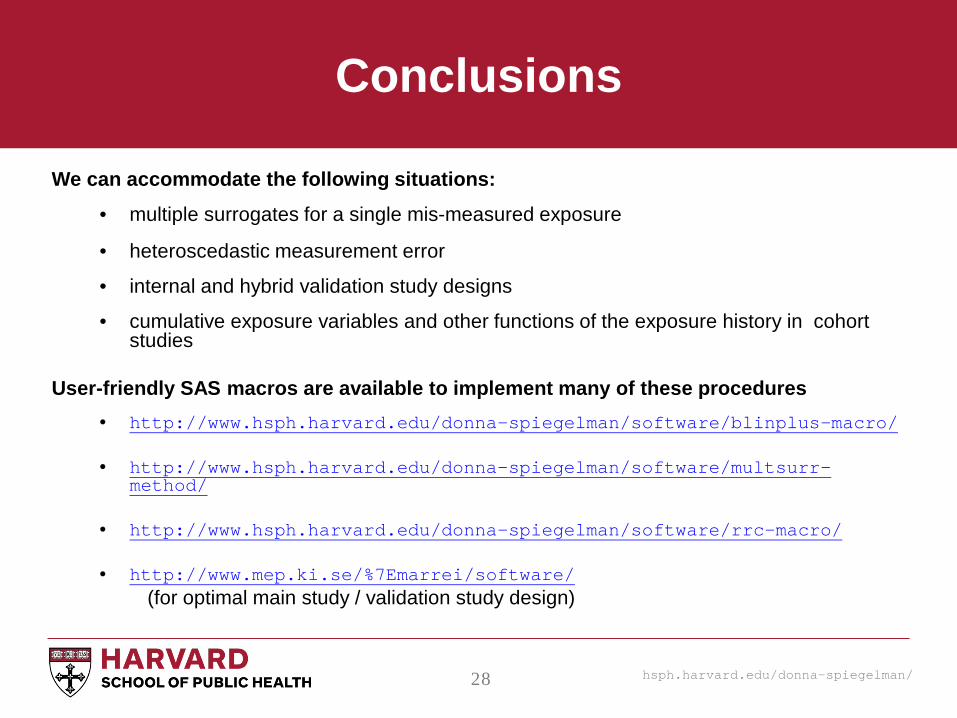
Conclusions
We can accommodate the following situations:
• multiple surrogates for a single mis-measured exposure
• heteroscedastic measurement error
• internal and hybrid validation study designs
• cumulative exposure variables and other functions of the exposure history in cohort studies
User-friendly SAS macros are available to implement many of these procedures
• http://www.hsph.harvard.edu/donna-spiegelman/software/blinplus-macro/
• http://www.hsph.harvard.edu/donna-spiegelman/software/multsurr-method/
• http://www.hsph.harvard.edu/donna-spiegelman/software/rrc-macro/
• http://www.mep.ki.se/%7Emarrei/software/ (for optimal main study / validation study design)
hsph.harvard.edu/donna-spiegelman/ 29
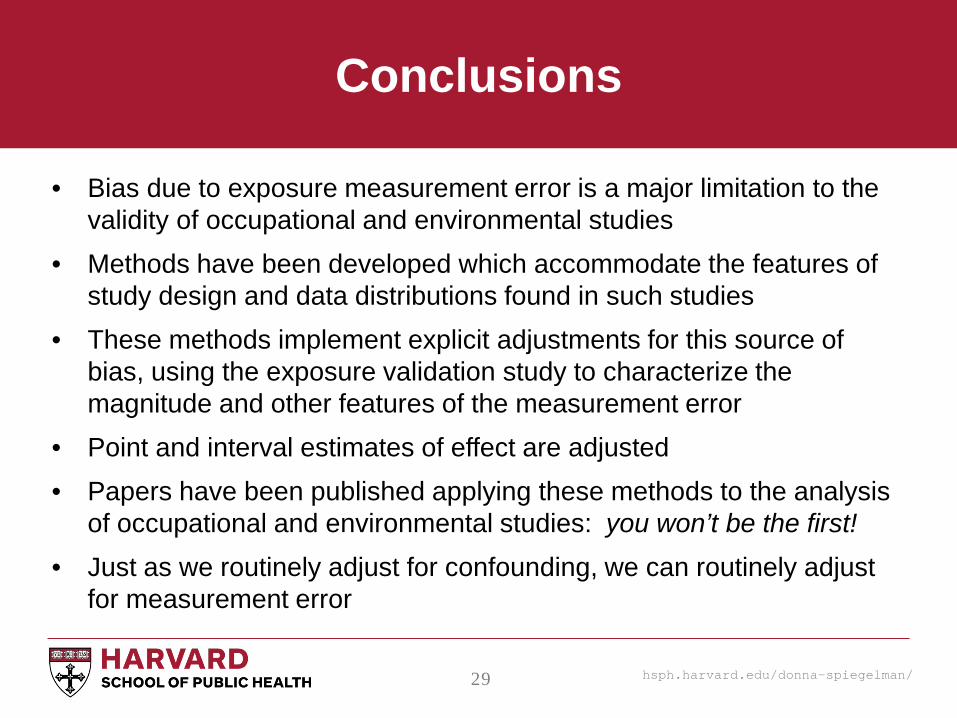
Conclusions
• Bias due to exposure measurement error is a major limitation to the validity of occupational and environmental studies
• Methods have been developed which accommodate the features of study design and data distributions found in such studies
• These methods implement explicit adjustments for this source of bias, using the exposure validation study to characterize the magnitude and other features of the measurement error
• Point and interval estimates of effect are adjusted • Papers have been published applying these methods to the analysis
of occupational and environmental studies: you won’t be the first! • Just as we routinely adjust for confounding, we can routinely adjust
for measurement error

hsph.harvard.edu/donna-spiegelman/ 30
Acknowledgements
• NIEHS
• Edie Weller, Ruifeng Li, Don Milton, Ellen Eisen, Barbara Valanis, Sally Thurston, Jon Samet, Paige Williams, Russ Hauser, Roger Logan, Jon Samet, Doug Grove, Doug Dockery, Lucas Neas, Nora Horrick, Diane Gold, Mauricio Hernandez, Howard Hu, Aparna Keshaviah
• Xiaomei Liao, Molin Wang, Biling Hong
• Francine Laden, Helen Suh, Jaime E. Hart, Joel Kaufman, Adam Szpiro, Lianne Sheppard, Ronald Williams, Robin C. Puett, Marianthi-Anna Kioumourtzoglou
• Alan Berkeley, Emily Long
Thank you!