intervest offices & warehouses - key figures 2014
DESCRIPTION
ÂTRANSCRIPT

key fIGures 2014


Intervest offIces & warehouses
a public regulated real estate company (rrec) under Belgian law
shares are listed on euronext Brussels (Into)
specialises in investments in high-quality office buildings and logistics properties, strategically situated on good locations outside municipal centres
focuses its investment policy on high-quality professional real estate respecting the principles of risk diversification in the real estate portfolio based on building type as well as geographic spread
enjoys a high dividend yield
has a sound financial structure

83%82%
87%86%
91%91%31.12.2013
31.12.2014
LogisticsO�cesTotal
rIsk spread of the real estate portfolIo
55%58%O�ces
45%42%Logistics31.12.2013
31.12.2014
+ 3%Logistics
nature of the re al estate portfolio
Strategic shift in the portfolio towards logistics real estate: at year-end 2014, 55% of the portfolio consists of offices and 45% of logistics real estate. After the acquisition of the logistics site in Liège, at the beginning of 2015, logistics represents 48% of the entire real estate portfolio.
occupancy rate
Improved occupancy rate in 2014: 87% as at 31 December 2014 (86% as at 31 December 2013); the occupancy rate of the office portfolio increases by 1% in 2014 to 83%, while the occupancy rate of the logistics portfolio remains stable at 91%.
+ 1%Occupancy rate
4

2013: 604.428 m2
674.156 m2
= 25.000 m2
total le a sable space
The total leasable space has increased by 11% to 674.156 m² on 31 December 2014.
+ 11%Leasable space
fair value
As at 31 December 2014, the fair value of the total real estate portfolio amounts to € 609 million. The logistics portfolio expands by 14% in 2014 through the acquisition of a logistics site of approximately 77.000 m² in Limburg for € 33 million. Excluding the investments and divestments realised in the course of 2014, the fair value of the standing real estate portfolio decreases by 1% in 2014, whereby the logistics segment records a 1% appreciation and the office segment depreciates by 2%.
+ 14%Logistics
31.12.2013
€ 243€ 338
31.12.2014
€ 333 € 276
O�ces
Logistics
Total
€ 581 million
€ 609 million
5

31.12.2013
4,1years
3,8years
3,9years
4,0years
31.12.2014
3,7years
4,3years
O�ces
Logistics
Total
average remain ing duration of the le a se agreements
Renewal of lease agreements representing 20% of the total annual rental income of the company, including those with three important tenants (Hewlett-Packard Belgium, Nike Europe and CEVA Logistics Belgium). In addition, lease agreements are concluded in 2014 with new tenants representing 2% of the total annual rental income.
turn - ke y solutions
In the “turn-key solutions” concept, 2.745 m² of office space is fitted out in 5 projects. The further finishing of 2.700 m² for Cochlear at Mechelen Campus is in progress.
cochlear, Mechelen campus
14Projects
11.000 m2
6

31.12.2014
314.167
304.423
286.521
302.341
31.12.2013
Equity (€ 000)
Liabilities (€ 000)
Debt ratio (%)
46,6% 48,7%
Key figures per share 31.12.2014 31.12.2013
Number of shares at year-end 16.143.906 14.424.982
Number of shares entitled to dividend1 14.777.342 14.424.982
Net value (fair value) (€) 19,46 19,86
Net value (investment value) (€) 20,36 20,87
Share price on closing date (€) 22,50 19,48
Premium (+)/discount (-) to net value (fair value) (%) 16% -2%
Balance sheet data
Strengthening of the equity by a € 26 million capital increase in December 2014 and an optional dividend for financial year 2013 in May 2014 of € 7 million, with 42,7% of the shareholders opting for shares.
Reduction in the debt ratio to 46,6% as at 31 December 2014 through strengthening of the shareholders’ equity.
-2,1%Debt ratio
+ € 33 millionEquity
1 the 1.366.564 new shares issued at the capital increase in december 2014 are entitled to dividend as from 1 January 2015.
7

47 75 40
2015
52
2016
30
2018
44
2019
20
2020
21
2017
4
2022
35
2021
7
2024
mill
ion
€
Short-term
credit f
acilit
iesBond lo
an
2015
Successful private placement of bonds in March 2014 of € 60 million with a term of 5 years and 7 years.
e xpiry c alendar financing
In 2014, Intervest Offices & Warehouses has continued the process of diversifying its sources of funding and spreading the due dates of its credit lines. Refinancing for financial year 2015 has already been completely finalised.
€ 60 millionPrivate placement
8

Results (€ 000) 2014 2013
Operating distributable result 23.038 24.574
Result on portfolio -6.404 7.841
Changes in fair value of financial assets and liabilities (ineffective hedges - IAS 39) -344 2.166
Net result 16.290 34.581
Results per share 2014 2013
Number of shares entitled to dividend 14.777.342 14.424.982
Operating distributable result (€) 1,56 1,70
Gross dividend (€) 1,40 1,53
Net dividend (€) 1,0500 1,1475
2 since 2013 Intervest offices & warehouses has decreased the pay-out ratio of the dividend from 100 % of the operat-ing distributable result to 90 %.
The gross dividend of Intervest Offices & Warehouses amounts in 2014 to € 1,40 per share for financial year 2014, offering a gross dividend yield of 6,2% based on the share price on closing date of 31 December 2014. Pay-out ratio for the dividend is 90 % in 2014.
The operating distributable result amounts in 2014 to € 1,56 per share (€ 1,70 in 2013).
results 2014
€ 1,402 Gross dividend distribution
2013
Operating distributable result
€ 1,70 € 1,56
2014
Gross dividend distribution
€ 1,53€ 1,40
9

EPRA - key figures per share 31.12.2014 31.12.2013
EPRA Earnings (€) 1,57 1,71
EPRA NAV (€) 19,77 20,20
EPRA NNNAV (€) 19,02 19,64
EPRA Net Initial Yield (NIY) (%) 6,4% 6,3%
EPRA Topped-up NIY (%) 6,9% 6,7%
EPRA Vacancy rate (%) 14,8% 16,1%
EPRA Cost Ratio (including direct vacancy costs) (%) 15,2% 13,8%
EPRA Cost Ratio (excluding direct vacancy costs) (%) 13,3% 11,9%
epra3
woluwe Garden 3 financial performance indicator calculated according to Best practices recommandations of epra (european public real estate assocation). see also www.epra.com
10
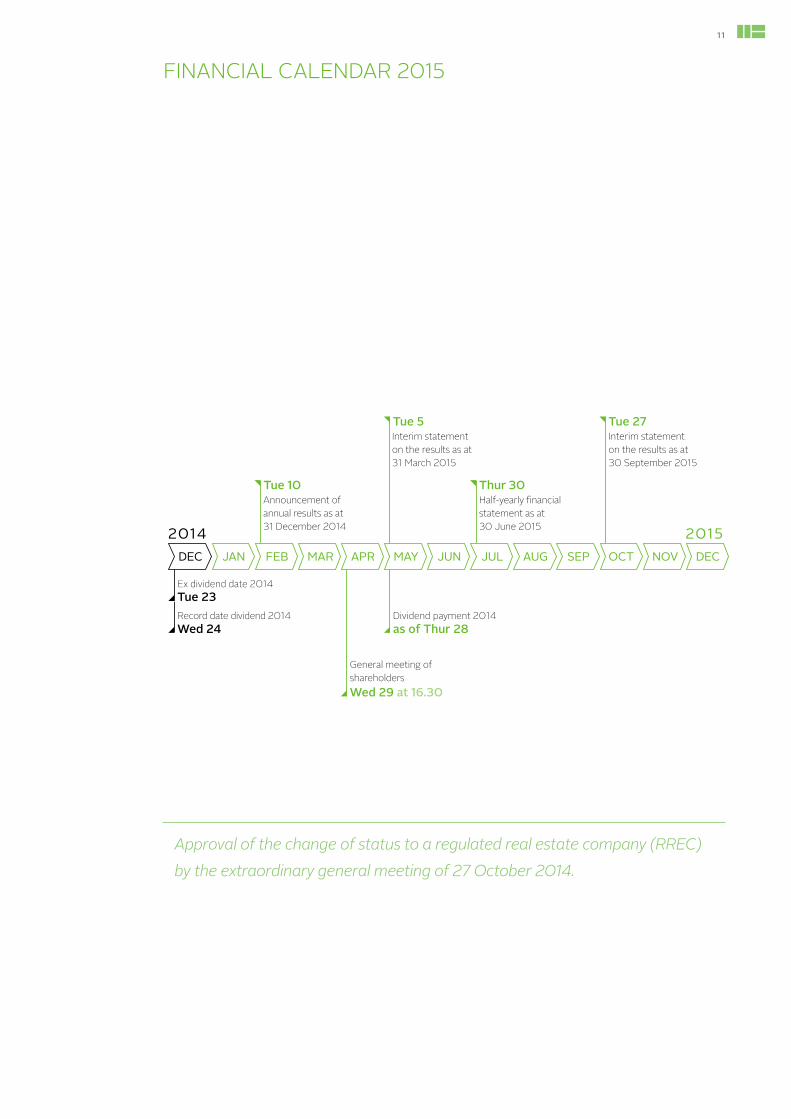
fInancIal calendar 2015
DEC JAN FEB
Announcement of annual results as at 31 December 2014
Tue 10
MAR APR
General meeting of shareholders
MAY
Interim statement on the results as at 31 March 2015
Tue 5
JUN JUL
Half-yearly �nancial statement as at 30 June 2015
Thur 30
AUG SEP OCT
Interim statement on the results as at 30 September 2015
Tue 27
NOV DEC
Wed 29 at 16.30
Record date dividend 2014 Wed 24
2014 2015
Ex dividend date 2014Tue 23
Dividend payment 2014 as of Thur 28
Approval of the change of status to a regulated real estate company (RREC) by the extraordinary general meeting of 27 October 2014.
11

INTERVEST OFFICES & WAREHOUSESUitbreidingstraat 182600 Berchem
T +32 3 287 67 87F +32 3 287 67 29