intralot group announcement of financial results · 7 on a quarterly basis, revenues increased...
TRANSCRIPT

INTRALOT Group
ANNOUNCEMENT
OF FINANCIAL RESULTS
for the six month period
ended June 30th, 2018
2
“INTRALOT announces an almost on par Revenue
(+2.4%) and EBITDA (-2.4%) y-o-y performance for 1H18
despite FX turmoil in key markets”
August 30th, 2018
INTRALOT SA (RIC: INLr.AT, Bloomberg: INLOT GA), an international gaming solutions and
operations leader, announces its financial results for the six month period ended June 30th, 2018,
prepared in accordance with IFRS.
OVERVIEW
Revenue and EBITDA growth of +11.4% and +12.1% year over year respectively
on a constant currency basis.
Group Revenues increased by 2.4% in 1H18, compared to 1H17.
EBITDA in the six-month period lower by 2.4% year over year.
EBITDA margins on sales and on GGR contracted by 0.8pps (at 14.6%) and 0.9pps
(at 29.1%), respectively.
EBT concluded to €32.5m higher by 85.7% vs. 1H17. EBT margin developed to
5.9% (+2.6pps vs. 1H17).
NIATMI (Net Income After Tax and Minority Interest) from continuing operations
improved by €12.5m vs. last year, developing to €-3.1m.
Operating Cash Flow in 1H18 below last year by €-40.5m.
Net Debt stood at €572.5m, up €61.8m compared to December 31st 2017.
On July 2nd, 2018, INTRALOT announced a five-year extension to its current
gaming systems contract with the New Hampshire Lottery Commission.
On July 24th, 2018, GAMENET Group—in which INTRALOT holds a 20% equity
investment—signed an agreement for the acquisition of 100% of Goldbet,
becoming the leading betting operator in Italy.
In August 2018, our subsidiary in Turkey (Inteltek), signed a new contract with
the Turkish State Organization SporToto, for up to one additional year, with the
same commercial terms.
PRESS RELEASE

3
1H18 INFOGRAPHIC
4
Group Headline Figures
(in € million) 1H18 1H17 %
Change 2Q18 2Q17
%
Change LTM
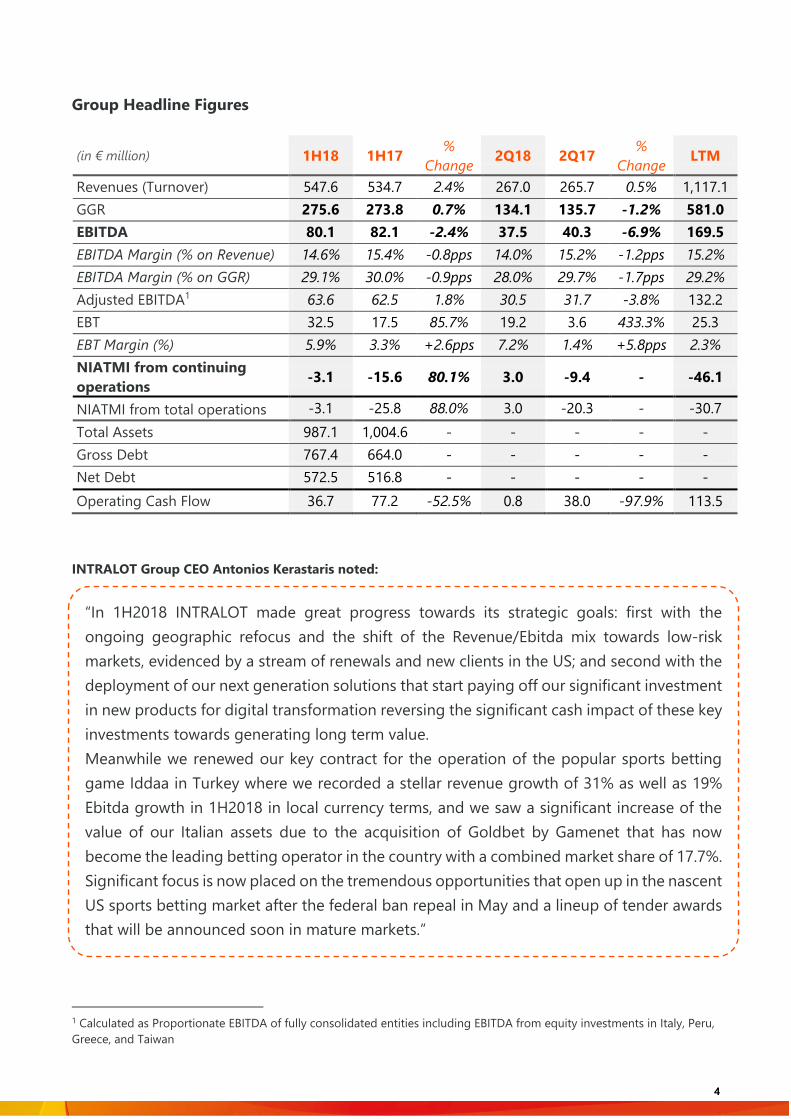
Revenues (Turnover) 547.6 534.7 2.4% 267.0 265.7 0.5% 1,117.1
GGR 275.6 273.8 0.7% 134.1 135.7 -1.2% 581.0
EBITDA 80.1 82.1 -2.4% 37.5 40.3 -6.9% 169.5
EBITDA Margin (% on Revenue) 14.6% 15.4% -0.8pps 14.0% 15.2% -1.2pps 15.2%
EBITDA Margin (% on GGR) 29.1% 30.0% -0.9pps 28.0% 29.7% -1.7pps 29.2%
Adjusted EBITDA1 63.6 62.5 1.8% 30.5 31.7 -3.8% 132.2
EBT 32.5 17.5 85.7% 19.2 3.6 433.3% 25.3
EBT Margin (%) 5.9% 3.3% +2.6pps 7.2% 1.4% +5.8pps 2.3%
NIATMI from continuing
operations -3.1 -15.6 80.1% 3.0 -9.4 - -46.1
NIATMI from total operations -3.1 -25.8 88.0% 3.0 -20.3 - -30.7
Total Assets 987.1 1,004.6 - - - - -
Gross Debt 767.4 664.0 - - - - -
Net Debt 572.5 516.8 - - - - -
Operating Cash Flow 36.7 77.2 -52.5% 0.8 38.0 -97.9% 113.5
INTRALOT Group CEO Antonios Kerastaris noted:
1 Calculated as Proportionate EBITDA of fully consolidated entities including EBITDA from equity investments in Italy, Peru,
Greece, and Taiwan
“In 1H2018 INTRALOT made great progress towards its strategic goals: first with the
ongoing geographic refocus and the shift of the Revenue/Ebitda mix towards low-risk
markets, evidenced by a stream of renewals and new clients in the US; and second with the
deployment of our next generation solutions that start paying off our significant investment
in new products for digital transformation reversing the significant cash impact of these key
investments towards generating long term value.
Meanwhile we renewed our key contract for the operation of the popular sports betting
game Iddaa in Turkey where we recorded a stellar revenue growth of 31% as well as 19%
Ebitda growth in 1H2018 in local currency terms, and we saw a significant increase of the
value of our Italian assets due to the acquisition of Goldbet by Gamenet that has now
become the leading betting operator in the country with a combined market share of 17.7%.
Significant focus is now placed on the tremendous opportunities that open up in the nascent
US sports betting market after the federal ban repeal in May and a lineup of tender awards
that will be announced soon in mature markets.”

5
OVERVIEW OF RESULTS
WAGERS HANDLED
During the six-month period ended June 30th,
2018, INTRALOT systems handled €11.0b of
worldwide wagers (from continuing operations),
a 2.7% y-o-y decrease. Africa’s wagers increased
by 22.9%, South America’s by 6.8%, and East
Europe’s by 1.4%; while North America’s
decreased by 8.0% (mainly FX driven), West
Europe’s by 2.9%, and Asia’s by 1.9%.
REVENUE
Reported consolidated revenues increased
by 2.4% compared to 1H17, leading to
total revenues for the six-month period
ended June 30th, 2018, of €547.6m.
Sports Betting was the largest contributor
to our top line, comprising 58.3% of our
revenues (posting a 9.5% revenue growth,
year over year), followed by Lottery Games
contributing 29.6% to Group turnover.
Technology contracts accounted for 6.7%
and VLTs represented 2.8% of Group
turnover while Racing constituted the
2.6% of total revenues of 1H18.
Reported consolidated revenues for the six-month period are up by €12.9m year over year. The
main factors that drove top line performance per Business Activity are:
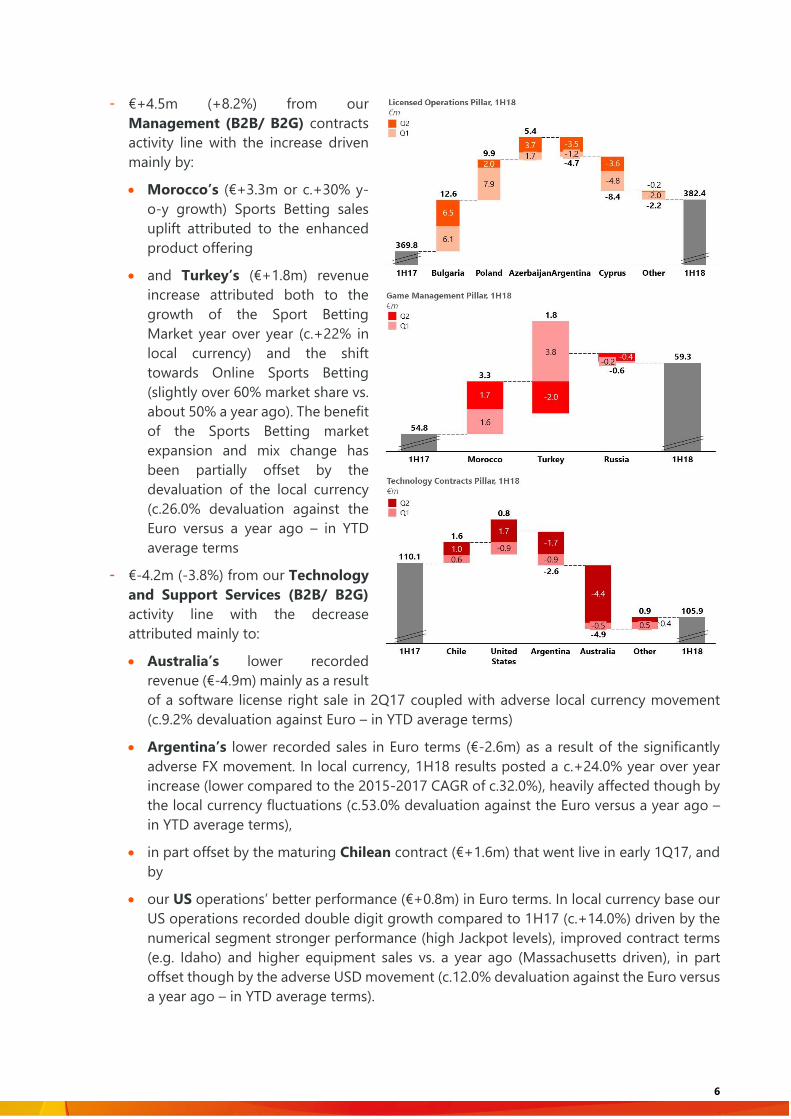
- €+12.6m (+3.4%) from our Licensed Operations (B2C) activity line with the increase
attributed mainly to higher revenues in:
Bulgaria (€+12.6m), mainly following the growth in Virtual Sports which is in part
correlated with the increased payout.
Poland with additional revenues of €9.9m due to the growth of the interactive Sport
Betting channel (following market regulation) and the introduction of Virtual Games in
2Q17.
Azerbaijan (€+5.4m), driven by the enhanced Sports Betting portfolio (both retail and
online)
in part offset by the impact of the suspended license in Cyprus in 4Q 2017 (€-8.4m)
and the lower recorded revenues, in Euro terms, from our Argentinean licensed
operations (€-4.7m). In local currency, 1H18 results posted a c.+30% year over year
increase (higher compared to the 2015-2017 CAGR of c.27.0%), heavily affected though
by the local currency fluctuations (c.53.0% devaluation against the Euro versus a year ago
– in YTD average terms), with that being the key driver for the worsening performance in
Euro terms in the six-month period
6
- €+4.5m (+8.2%) from our
Management (B2B/ B2G) contracts
activity line with the increase driven
mainly by:
Morocco’s (€+3.3m or c.+30% y-
o-y growth) Sports Betting sales
uplift attributed to the enhanced
product offering
and Turkey’s (€+1.8m) revenue
increase attributed both to the
growth of the Sport Betting
Market year over year (c.+22% in
local currency) and the shift
towards Online Sports Betting
(slightly over 60% market share vs.
about 50% a year ago). The benefit
of the Sports Betting market
expansion and mix change has
been partially offset by the
devaluation of the local currency
(c.26.0% devaluation against the
Euro versus a year ago – in YTD
average terms
- €-4.2m (-3.8%) from our Technology
and Support Services (B2B/ B2G)
activity line with the decrease
attributed mainly to:
Australia’s lower recorded
revenue (€-4.9m) mainly as a result
of a software license right sale in 2Q17 coupled with adverse local currency movement
(c.9.2% devaluation against Euro – in YTD average terms)
Argentina’s lower recorded sales in Euro terms (€-2.6m) as a result of the significantly
adverse FX movement. In local currency, 1H18 results posted a c.+24.0% year over year
increase (lower compared to the 2015-2017 CAGR of c.32.0%), heavily affected though by
the local currency fluctuations (c.53.0% devaluation against the Euro versus a year ago –
in YTD average terms),
in part offset by the maturing Chilean contract (€+1.6m) that went live in early 1Q17, and
by
our US operations’ better performance (€+0.8m) in Euro terms. In local currency base our
US operations recorded double digit growth compared to 1H17 (c.+14.0%) driven by the
numerical segment stronger performance (high Jackpot levels), improved contract terms
(e.g. Idaho) and higher equipment sales vs. a year ago (Massachusetts driven), in part
offset though by the adverse USD movement (c.12.0% devaluation against the Euro versus
a year ago – in YTD average terms).
7
On a quarterly basis, revenues increased slightly at 0.5% compared to 2Q17, leading to total
revenues for the three-month period started in April 1st, 2018, and ended in June 30th, 2018, of
€267.0m. Increased revenues for the quarter (€+1.3m) are primarily attributed to increased sales
in Bulgaria, Azerbaijan, Poland, the US, Morocco and Chile, in part offset by Argentina’s and
Turkey’s FX impacted revenues, Australia revenue shortfall (software license right sale in 2Q17),
and Cyprus suspended SB license
Constant currency basis: In 1H18, revenues—net of the negative FX impact of €48.1m—
reached €595.7m (+11.4% y-o-y), while 2Q18 revenues—net of the negative FX impact of
€25.8m reached €292.7m (+10.1% y-o-y).
GROSS GAMING REVENUE & Payout
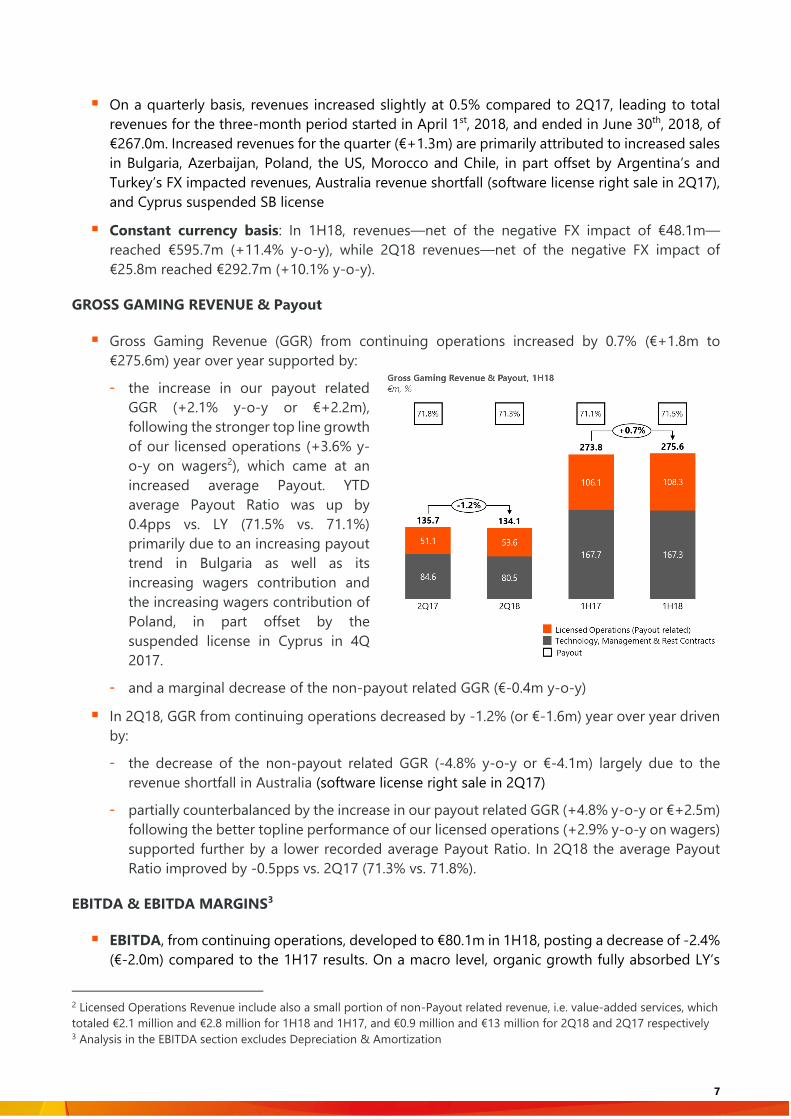
Gross Gaming Revenue (GGR) from continuing operations increased by 0.7% (€+1.8m to
€275.6m) year over year supported by:
- the increase in our payout related
GGR (+2.1% y-o-y or €+2.2m),
following the stronger top line growth
of our licensed operations (+3.6% y-
o-y on wagers2), which came at an
increased average Payout. YTD
average Payout Ratio was up by
0.4pps vs. LY (71.5% vs. 71.1%)
primarily due to an increasing payout
trend in Bulgaria as well as its
increasing wagers contribution and
the increasing wagers contribution of
Poland, in part offset by the
suspended license in Cyprus in 4Q
2017.
- and a marginal decrease of the non-payout related GGR (€-0.4m y-o-y)
In 2Q18, GGR from continuing operations decreased by -1.2% (or €-1.6m) year over year driven
by:
- the decrease of the non-payout related GGR (-4.8% y-o-y or €-4.1m) largely due to the
revenue shortfall in Australia (software license right sale in 2Q17)
- partially counterbalanced by the increase in our payout related GGR (+4.8% y-o-y or €+2.5m)
following the better topline performance of our licensed operations (+2.9% y-o-y on wagers)
supported further by a lower recorded average Payout Ratio. In 2Q18 the average Payout
Ratio improved by -0.5pps vs. 2Q17 (71.3% vs. 71.8%).
EBITDA & EBITDA MARGINS3
EBITDA, from continuing operations, developed to €80.1m in 1H18, posting a decrease of -2.4%
(€-2.0m) compared to the 1H17 results. On a macro level, organic growth fully absorbed LY’s
2 Licensed Operations Revenue include also a small portion of non-Payout related revenue, i.e. value-added services, which
totaled €2.1 million and €2.8 million for 1H18 and 1H17, and €0.9 million and €13 million for 2Q18 and 2Q17 respectively 3 Analysis in the EBITDA section excludes Depreciation & Amortization

8
software license right sale in Australia but could not fully absorb the extremely adverse FX
movement across markets (e.g. Turkey, Argentina, the US and Australia).
The main drivers for the decrease in 1H18 EBITDA, overturning the marginal 1H18 GGR increase,
are:
- the deterioration in the OPEX margin (-2.3% over GGR) is mainly driven by the deterioration
of the respective B2B/ B2G OPEX margin as a result of the increased administrative expenses
(US mainly) and advertising expenses (largely driven by the increased marketing expenses in
Turkey related to our Online Sport Betting activity), coupled with penalty provisions in
Morocco (based on a performance reconciliation mechanism) and the first time consolidation
of Bit8.
- the decrease in the Other operating income in 1H18, which totaled €7.3m compared to
€8.8m in 1H17, mainly driven by less equipment lease income (following the recent contract
renewals in OH and ID) coupled with the adverse USD movement against the Euro. The US
other operating income shortfall, in local currency, has been more than recouped from the
increased revenue in both contracts.
- partially offset by the improvement in the Taxes & Agent Fees margin (+1.0% over GGR)
mainly due to the improvement of the Taxes & Agent Fees margin in each of the two
categories. The B2C contracts Taxes & Agent Fees margin improvement is mainly driven by
LATAM and the suspension of the Sport Betting license in Cyprus only partially diluted by the
worsening contribution of Bulgaria and Poland, while that of the B2B/ B2G segment is driven
by a more favorable sales mix in the retail Sports Betting segment in Turkey.
- and the improvement in the Rest of Cost of Sales margin (+0.9% over GGR) driven mainly
by the improvement in the margin of the B2B/ B2G contracts following direct cost
optimization across operations.

9
On a yearly basis, EBITDA margin on sales, has been impacted by the worsening margins of the
B2B/ B2G segment (mainly due to the software license right sale in Australia in 2Q17), decreasing
to 14.6% compared to 15.4% in 1H17.
On a quarterly basis, EBITDA deteriorated by -6.9% to €37.5m, mainly due to the absence of
non-recurring revenue in Australia in 2Q17 and the adverse FX vs. a year ago
On a quarterly basis, EBITDA margin on GGR, decreased to 28.0% compared to 29.7% in 2Q17,
as a result of the B2B/ B2G segment margin contraction primarily due to the Australian license
right sale a year ago.
LTM EBITDA developed to €169.5m posting a slight decrease of -1.6% vs. 1Q18.
Constant currency basis: In 1H18, EBITDA, net of the negative FX impact of €11.9m, reached
€92.0m (+12.1% y-o-y) while 2Q18 EBITDA, net of the negative FX impact of €6.2m reached
€43.7m (+8.4% y-o-y)
EBT / NIATMI
EBT in 1H18 totaled €32.5m, significantly higher compared to €17.5m in 1H17. The impact of
the decreased EBITDA described above (y-o-y: €-2.0m) was completely counterbalanced by the
significantly better FX results (€+8.0m vs. 1H17) driven mainly by the better USD performance
against the local currencies (e.g. high portion of Cash and Cash equivalents in Turkish Entities
are held in USD) — being in part offset though by the deterioration of local currencies against
EUR, the lower D&A for the period (favorable impact: €+3.0m vs. 1H17), the better results
derived from the equity method consolidation of associates (€+2.0m vs. 1H17; benefited by the
better performance of our equity investments in Peru and Italy and the full consolidation of Bit8
in 4Q17), the higher income from participations/investments (€+1.7m; assisted mainly by the
higher dividend received from our investment in Hellenic Lotteries in 2Q18), the better Net
Interest results (€+1.6m), and the lower impairments of assets for the period (€+0.7m).
In 2Q18, the significantly better FX results (€+11.3m driven by the USD performance against the
local currencies), coupled with the lower D&A (favorable impact: €+2.0m), the better results
from equity method consolidation (€+1.6m), the better Net Interest results (€+1.5m), the higher
income from participations/investments (€+1.2m), and the lower impairment of assets (€+0.7m)
more than absorbed the recorded y-o-y EBITDA deficit (€-2.8m vs. 2Q17), thus, concluding to
an EBT of €19.2m (+15.6m vs. 2Q17).
Constant currency basis: In 1H18 EBΤ, adjusted for the FX impact, reached €39.4m from €21.8m
in 1H17 while in 2Q18 adjusted for the FX impact, concluded to €18.6m from €8.6m in 2Q17.
NIATMI from continuing operations in 1H18 concluded at €-3.1m compared to €-15.6m in
1H17. NIATMI from total operations in 1H17 was further deteriorated from the PAT
contribution of the prior period’s discontinued operations (€-10.2m) and concluded at €-25.8m
(in 1H18 there were no discontinued entities). In 2Q18, NIATMI from continuing operations
was positive and reached €+3.0m (vs. €-9.4m y-o-y). NIATMI from total operations in 2Q17
was €-20.3m impacted by the PAT contribution of the prior period’s discontinued operations (€-
10.9m)
Constant currency basis: NIATMI (total operations) in 1H18, on a constant currency basis,
reached €+0.3m from €-7.4m in 1H17 while in 2Q18 reached €1.1m from €-1.4m

10
CASH-FLOW
Operating Cash-flow posted a considerable decrease in 1H18 at €36.7m vs. €77.2m in 1H17.
Excluding the operating cash-flow contribution of our discontinued operations (Jamaica, Santa
Lucia, Russia, and Slovakia) in 1H17 (€+9.1m), the cash-flow from operating activities is lower by
€31.4m (€36.7m vs. €68.1m) mainly driven by the adverse working capital movement of 1H18
(€-30.5m vs. €-0.2m in 1H17). Current period WC impact is driven by the repayment of a long
due interest-bearing liability (€-13.0m) and the inventory buildup for new projects (€-12.8m)
largely as a result of the Illinois and Ohio projects.
Adjusted Free Cash Flow4 in 1H18 increased by €2.2m, to €12.6m compared to €10.4m a year
ago despite the lower recorded EBITDA (y-o-y). Key contributors to this variance were the
dividend received from our equity investment in Italy & Greece (Gamenet first-time dividend
distribution and the higher dividend vs. 1H17 from “Hellenic Lotteries S.A.”), the increased
interest received for the cash held in the Turkish entities, in part only offset by the higher than
prior period dividends paid to our partners in Azerbaijan, Turkey, and Argentina. In 2Q18, the
Adjusted Free Cash Flow reached €18.5m, up by €18.3m vs. 1H17, significantly benefited by the
timing variance of the bond coupons payment schedule (following the refinancing that took
place in 3Q17 resulting in coupon payments across Q1 and Q3 vs. a coupon payment every
Quarter previously), and the higher dividends received from our equity investments in Italy and
Greece.
Net Capex in 1H18 was €42.4m compared to €41.2m in 1H17 with the increased Capex in the
US and the last installment towards the strategic partnership with AMELCO (both in 2Q18) being
the key contributors to bring Net Capex to similar levels on a year-over-year basis (closing the
positive gap of €10.4m in 1Q18 vs. 1Q17). Headline Capex items in 1H18 include €9.8m towards
R&D, €16.3m in the US mainly towards the Illinois new contract, Ohio contract renewal, and New
Hampshire’s “Keno” service launch, and €5.7m towards AMELCO. All other net additions amount
to €10.6m for 1H18. Maintenance CAPEX for 1H18 stood at €11.7m, or 27.4% of the overall
capital expenditure in 1H18 (€42.7m), at the same levels as a year ago (1H17; €11.9m – excluding
discontinued operations in Jamaica, Santa Lucia, Slovakia & Russia).
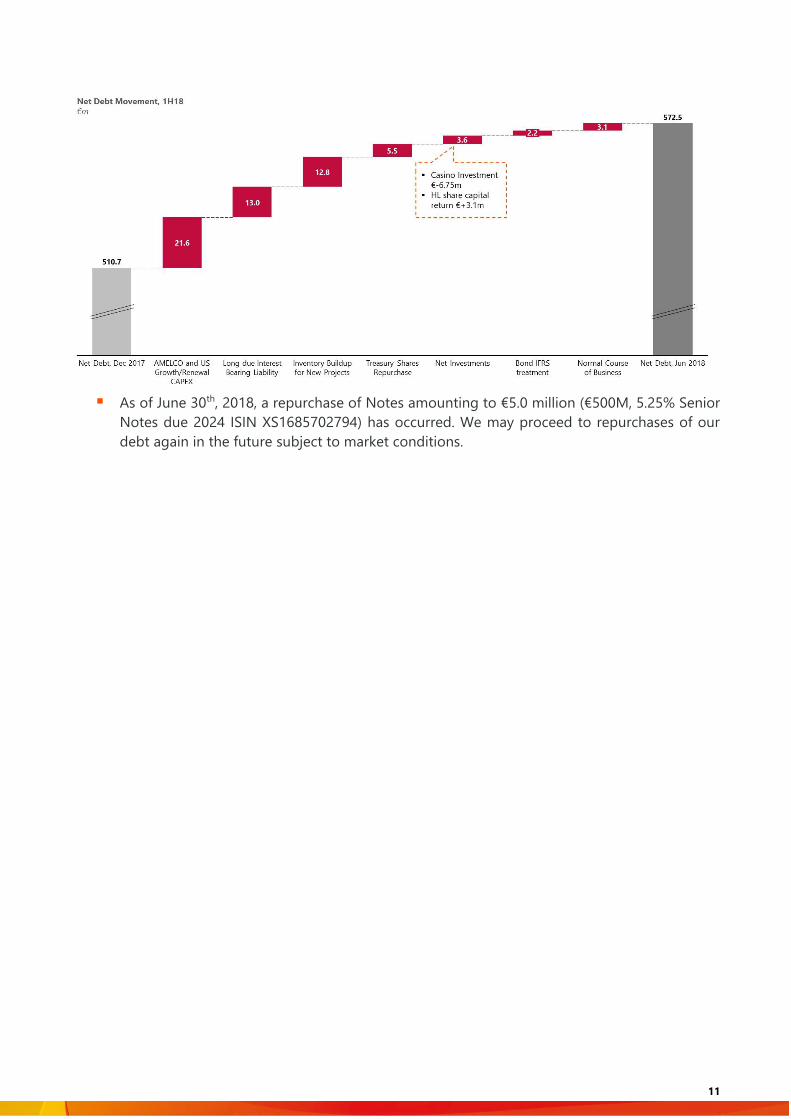
Net Debt, as of June 30th, 2018, stood at €572.5m, up €61.8m compared to December 31st 2017
as a result of our decision to invest in software (€-5.7m AMELCO), the investments in our US
business (€-15.9m towards growth & renewal CAPEX in the US), the repayment of a long due
interest bearing liability (€-13.0m), the inventory buildup for new projects (€-12.8m; as described
above), own shares repurchase (€-5.5m), the net results from investments (€-3.6m; the outflow
for an indirect stake in “Hellenic Casino Parnitha S.A.” of €6.8m being in part offset by the share
capital return of €3.1m from the Hellenic Lotteries equity investment) and the bond IFRS
treatment (€-2.2m). On a quarterly basis, Net Debt increased by €44.2m significantly affected by
the liability payment and the inventory buildup, the AMELCO investment and the increased
CAPEX outflow in the US.
4 Calculated as EBITDA – Maintenance CAPEX – Cash Taxes – Net Cash Finance Charges (excluding refinancing charges) –
Net Dividends Paid; all finance metrics exclude the impact of discontinued operations
11
As of June 30th, 2018, a repurchase of Notes amounting to €5.0 million (€500M, 5.25% Senior
Notes due 2024 ISIN XS1685702794) has occurred. We may proceed to repurchases of our
debt again in the future subject to market conditions.

12
RECENT/ SIGNIFICANT COMPANY DEVELOPMENTS
On July 2nd, 2018, INTRALOT announced a five-year extension to its current gaming systems
contract with the New Hampshire Lottery Commission. The extension will commence at the
end of the current contract term of June 30, 2020, furthering the contract through June 30,
2025. The New Hampshire Lottery Commission is the first and oldest U.S. state lottery and
continues to be an industry leader. INTRALOT began its partnership with the New Hampshire
lottery in 2010.
On July 5th, 2018, INTRALOT announced the renewal of its “WLA Certification of Alignment”
with the Responsible Gaming Framework through July 2021. Granted accreditation is in
accordance with the criteria set in WLA Responsible Gaming Certification Standards for
Associate Members and covers all corporate functions certifying the integrity of the games
and corporate conduct.
On July 24th, 2018, GAMENET Group – in which INTRALOT holds a 20% equity investment –
signed an agreement for the acquisition of 100% of Goldbet. Following the transaction,
GAMENET Group became the leading betting operator in Italy with the country's largest
network of sports betting (over 1,700 points of sale). The acquisition will significantly increase
the degree of diversification of the Group’s product portfolio and its profitability.
During the period between 01.01.2018 and 30.06.18, Intralot SA has proceeded with the
repurchase of 5,444,410 own shares amounting to €5.5 million with an average price of €1.01,
while for the period between 01.07.2018 and 29.08.18, Intralot SA has proceeded with the
repurchase of 2,669,882 own shares amounting to €2.3 million with an average price of €0.86.
On August 28th, 2018, INTRALOT announced the signing of a new contract between the
Turkish State Organization SporToto and INTELTEK, its subsidiary in Turkey, in partnership with
Turkcell, to continue the operation and technical support of the successful and extremely
popular fixed odds sports betting game Iddaa for up to one additional year, starting August
29, 2018. The new contract is under the same main terms with the 10-year contract that expires
on August 28, 2018.

13
APPENDIX
Performance per Business Segment
YTD Performance
Quarterly Performance
Performance per Geography
Revenue Breakdown
(in € million) 1H18 1H17 %
Change
Europe 320.6 305.3 5.0%
Americas 100.6 108.9 -7.6%
Other 151.1 145.7 3.7%
Eliminations -24.7 -25.2 -
Total Consolidated Sales 547.6 534.7 2.4%

14
Gross Profit Breakdown
(in € million) 1H18 1H17 %
Change
Europe 38.6 31.2 23.7%
Americas 14.2 13.1 8.4%
Other 66.4 63.7 4.2%
Eliminations -2.7 0.4 -
Total Consolidated Gross Profit 116.5 108.4 7.5%
Gross Margin Breakdown
1H18 1H17 %
Change
Europe 12.0% 10.2% +1.8pps
Americas 14.1% 12.0% +2.1pps
Other 43.9% 43.7% +0.2pps
Total Consolidated Gross Margin 21.3% 20.3% +1.0pps
INTRALOT Parent Company results
Revenues for the period increased by 8.9% to €29.4m. The sales boost is primarily driven by the
increased royalties/ software license fees from subsidiaries and by the higher hardware sales to
subsidiaries and associates (e.g. Peru).
EBITDA increased to €3.0m from €1.4m in 1H17. The EBITDA variance is mainly the result of the
positive Gross Profit variance y-o-y driven by the higher Revenues described above supported
also by improved OPEX savings.
Earnings after Taxes (EAT) at €-1.4m from €0.0m in 1H17.
LTM EBITDA figure is higher by €2.4m vs. LTM 1Q18 reflecting the significantly better top line
performance of the Company in 2Q18 (vs. 2Q17).
(in € million) 1H18 1H17 %
Change LTM
Revenues 29.4 27.0 8.9% 69.2
Gross Profit 11.0 9.9 11.1% 29.2
Other Operating Income 0.1 0.1 0.0% 2.0
OPEX -15.0 -16.4 -8.5% -33.3
EBITDA 3.0 1.4 114.3% 10.4
EAT -1.4 0.0 - -12.9
CAPEX (paid) -8.8 -8.5 3.5% -15.8

15
CONFERENCE CALL INVITATION – 1H18 FINANCIAL RESULTS
Antonios Kerastaris, Group CEO, Georgios Koliastasis, Group CFO, Nikolaos Pavlakis, Group Tax &
Accounting Director, Andreas Chrysos, Group Budgeting, Controlling & Finance Director and Michail
Tsagalakis, Capital Markets Director, will address INTRALOT’s analysts and institutional investors to
present the Company’s First Half 2018 results, as well as to discuss the latest developments at the
Company.
The financial results will be released on the ATHEX website (www.helex.gr), and will be posted on the
company’s website (www.intralot.com) on Thursday 30th August, 2018 (after the closing of the trading
session of the ATHEX).
AGENDA: Brief Presentation - Question and Answer Session
CONFERENCE CALL DETAILS
Date: 31st August 2018
Time: Greek time 17:00 - UK time 15:00 - CET 16:00 - USA time 10:00 (East Coast Line)
Conference Phone GR + 30 211 180 2000
Conference Phone GR + 30 210 94 60 800
Conference Phone GB + 44 (0) 203 059 5872
Conference Phone GB + 44 (0) 800 368 1063
Conference Phone US + 1 516 447 5632
We recommend that you call any of the above numbers 5 to 10 minutes before
the conference call is scheduled to start.
LIVE WEBCAST DETAILS
The conference call will be available via webcast in real time over the Internet and you may join by
linking at the internet site:
https://services.choruscall.eu/links/intralot18H1.html
DIGITAL PLAYBACK
There will be a digital playback on the 31st August 2018 at 19:00 (GR Time).
This Service will be available until the end of the business day 11th September 2018.
Please dial the following numbers and the PIN CODE: 059 # from a touch-tone telephone
Digital Playback UK: + 44 (0) 203 059 5874
Digital Playback US: + 1 631 257 0626
Digital Playback GR: + 30 210 94 60 929
In case you need further information, please contact Intralot, Mr. Michail Tsagalakis, at the telephone
number: +30 213 0397000 or Chorus Call Hellas S.A., our Teleconferencing Services Provider, Tel. +30
210 9427300.

16
SUMMARY OF FINANCIAL STATEMENTS
Group Statement of Comprehensive Income
(in € million) 1H18 1H17 % Change 2Q18 2Q17 %
Change LTM
Revenues 547.6 534.7 2.4% 267.0 265.7 0.5% 1,117.1
Gross Profit 116.5 108.4 7.5% 55.7 53.7 3.7% 250.0
Other Operating Income 7.3 8.8 -17.0% 3.8 4.6 -17.4% 15.7
OPEX -75.5 -69.9 8.0% -38.1 -36.1 5.5% -156.1
EBITDA 80.1 82.1 -2.4% 37.5 40.3 -6.9% 169.5
Margin 14.6% 15.4% -0.8pps 14.0% 15.2% -1.2pps 15.2%
EBIT 48.3 47.3 2.1% 21.4 22.2 -3.6% 109.6
Interest expense (net) -22.0 -23.6 -6.8% -10.9 -12.3 -11.4% -61.3
Exchange differences 3.7 -4.3 - 6.3 -5.0 - 2.0
Other 2.5 -1.9 - 2.4 -1.3 - -25.0
EBT 32.5 17.5 85.7% 19.2 3.6 433.3% 25.3
NIATMI -3.1 -25.8 88.0% 3.0 -20.3 - -30.7
NIATMI continuing -3.1 -15.6 80.1% 3.0 -9.4 - -46.2
NIATMI discontinued 0.0 -10.2 - 0.0 -10.9 - 15.5
Group Statement of Financial Position
(in € million) 1H18 FY17
Tangible Assets 105.8 102.8
Intangible Assets 328.2 324.5
Other Non-Current Assets 179.1 178.6
Inventories 45.1 31.5
Trade receivables 74.2 84.2
Other Current Assets 254.7 300.3
Total Assets 987.1 1,021.9
Share Capital 47.1 47.7
Other Equity Elements -7.4 10.1
Non-Controlling Interests 21.8 32.0
Total Shareholders’ Equity 61.5 89.8
Long-term Debt 742.7 729.4
Provisions/ Other Long term Liabilities 32.3 29.6
Short-term Debt 24.7 19.3
Other Short-term Liabilities 125.9 153.8
Total Liabilities 925.6 932.1
Total Equity and Liabilities 987.1 1,021.9

17
Group Statement of Cash Flows
(in € million) 1H18 1H17
EBT from continuing operations 32.5 17.5
EBT from discontinued operations 0.0 -3.0
Plus/less Adjustments 48.6 78.6
Decrease/(increase) of Inventories -11.5 -4.1
Decrease/(increase) of Receivable Accounts -0.9 0.2
(Decrease)/increase of Payable Accounts -18.1 3.7
Income Tax Paid -13.9 -15.7
Net Cash from Operating Activities 36.7 77.2
Net CAPEX -42.4 -41.2
(Purchases) / Sales of subsidiaries & other investments -3.6 4.5
Interest received 4.1 2.6
Dividends received 6.8 1.8
Net Cash from Investing Activities -35.1 -32.3
Repurchase of own shares -5.5 0.0
Cash inflows from loans 52.7 52.5
Repayment of loans -28.8 -53.2
Bond buybacks -5.0 0.0
Repayment of Leasing Obligations -2.9 -0.9
Interest and similar charges paid -25.1 -25.4
Dividends paid -27.8 -27.5
Net Cash from Financing Activities -42.4 -54.5
Net increase / (decrease) in cash for the period -40.8 -9.6
Exchange differences -2.3 -7.6
Cash at the beginning of the period 238.0 164.4
Cash at the end of the period from total operations 194.9 147.2
About INTRALOT
INTRALOT, a public listed company established in 1992, is a leading gaming solutions supplier and operator active in 50
regulated jurisdictions around the globe. With €1.1 billion turnover and a global workforce of approximately 5,100
employees (3,100 of which in subsidiaries and 2,000 in associates) in 2017, INTRALOT is an innovation – driven corporation
focusing its product development on the customer experience. The company is uniquely positioned to offer to lottery and
gaming organizations across geographies market-tested solutions and retail operational expertise. Through the use of a
dynamic and omni-channel approach, INTRALOT offers an integrated portfolio of best-in-class gaming systems and product
solutions & services addressing all gaming verticals (Lottery, Betting, Interactive, VLT). Players can enjoy a seamless and
personalized experience through exciting games and premium content across multiple delivery channels, both retail and
interactive. INTRALOT has been awarded with the prestigious WLA Responsible Gaming Framework Certification by the
World Lottery Association (WLA) for its global lottery operations.
For more info:
-Mr. Chris Sfatos, Group Director Corporate Affairs, email: [email protected] or
-Investor Relations Dept. email: [email protected]
Phone: +30-210 6156000, Fax: +30-210 6106800, www.intralot.com