introducngi and valdati ngi snia sss performance test suite...apples to apples, pears to pears in...
TRANSCRIPT

Introducing and Validating SNIA SSS Performance Test Suite
Esther Spanjer, SMART Modular

Apples to Apples, Pears to Pears in SSS Performance Benchmarking © 2011 Storage Networking Industry Association. All Rights Reserved. 22
SNIA Legal Notice
The material contained in this tutorial is copyrighted by the SNIA. Member companies and individual members may use this material in presentations and literature under the following conditions:
Any slide or slides used must be reproduced in their entirety without modificationThe SNIA must be acknowledged as the source of any material used in the body of any document containing material from these presentations.
This presentation is a project of the SNIA Education Committee.Neither the author nor the presenter is an attorney and nothing in this presentation is intended to be, or should be construed as legal advice or an opinion of counsel. If you need legal advice or a legal opinion please contact your attorney.The information presented herein represents the author's personal opinion and current understanding of the relevant issues involved. The author, the presenter, and the SNIA do not assume any responsibility or liability for damages arising out of any reliance on or use of this information.NO WARRANTIES, EXPRESS OR IMPLIED. USE AT YOUR OWN RISK.

Apples to Apples, Pears to Pears in SSS Performance Benchmarking © 2011 Storage Networking Industry Association. All Rights Reserved. 33
Abstract
SSS Performance Benchmarking Learning ObjectivesGet a good understanding of the various parameters that influence the performance characteristics of SSDs Get a full understanding of the proposed SNIA Performance Measurement SpecificationProvide step-by-step guidance on how to set up a test benchmark that enables comparison among the various SSS devices
Apples to Apples, Pears to Pears in SSS Performance Benchmarking © 2011 Storage Networking Industry Association. All Rights Reserved.
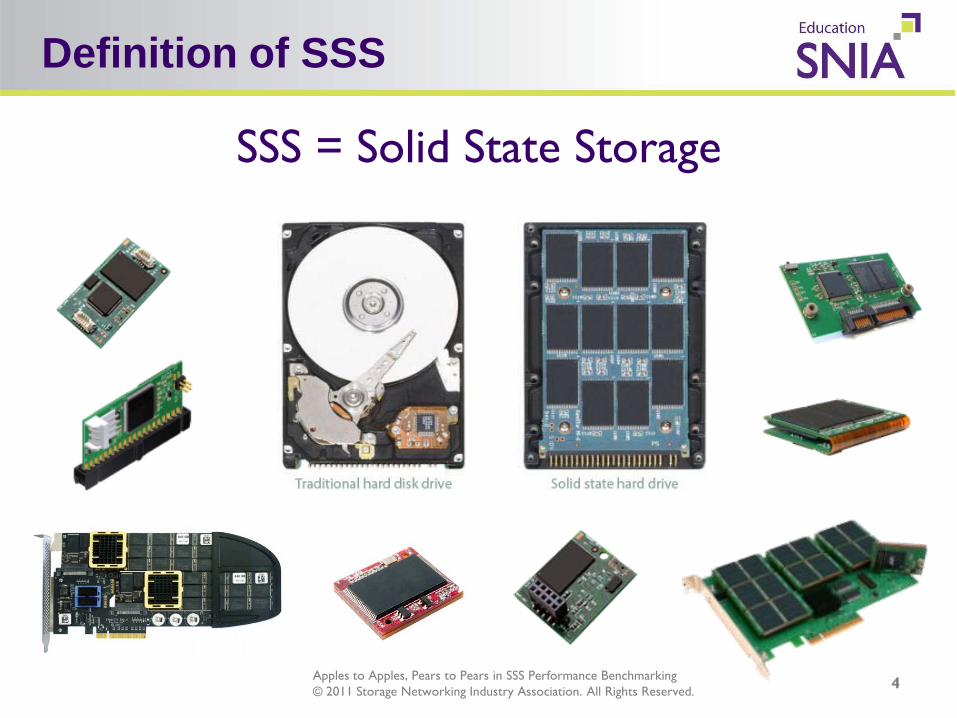
Definition of SSS
4
SSS = Solid State Storage

Apples to Apples, Pears to Pears in SSS Performance Benchmarking © 2011 Storage Networking Industry Association. All Rights Reserved.
Flashy fists fly as OCZ and DDRdrive row over SSD performance
5
http://www.theregister.co.uk/2011/01/14/ocz_and_ddrdrive_performance_row/
"dirty tricks used to drastically inflate IOPS results“…
" the egregious disparity between promised performance and reality”…
"This really isn’t an 'apples to apples' comparison”…
“you can't use an X1 dragster on the open road but you can use a Ferrari Vertex 2 EX”…

Apples to Apples, Pears to Pears in SSS Performance Benchmarking © 2011 Storage Networking Industry Association. All Rights Reserved.
The Performance LandscapeOne Year Later
Random or Sustained? Up to?
Random Precondition Sustained Speed?
IOPS?MB/s or Mb/s?
Block Size?

Apples to Apples, Pears to Pears in SSS Performance Benchmarking © 2011 Storage Networking Industry Association. All Rights Reserved.
Market Segmentation
Client SSD
• Low cost• C-MLC• 0-7% over provisioning• No backup power circuit• No Enterprise features• No customization• Warranty 1-3 yrs
Enterprise SSD
• Higher cost• E-MLC/SLC• 28-50% over provisioning• Backup power circuit• Enterprise features• Customization• Warranty 5 yrs

Apples to Apples, Pears to Pears in SSS Performance Benchmarking © 2011 Storage Networking Industry Association. All Rights Reserved.
Performance ComparisonEnterprise vs. Client SSD
0
50
100
150
200
250
300
350
400
MB/
s
Sequential Read
Enterprise SSD (SATA)
Enterprise SSD (SAS)
Client SSD 1 (SATA)
Client SSD 2 (SATA)
0
50
100
150
200
250
300
350
400
MB/
s
Sequential Write
Enterprise SSD (SATA)
Enterprise SSD (SAS)
Client SSD 1 (SATA)
Client SSD 2 (SATA)
0
10,000
20,000
30,000
40,000IO
PS
Random Write
Enterprise SSD (SATA)
Enterprise SSD (SAS)
Client SSD 1 (SATA)
Client SSD 2 (SATA)
0
20,000
40,000
60,000
80,000
100,000
IOPS
Random Read
Enterprise SSD (SATA)
Enterprise SSD (SAS)
Client SSD 1 (SATA)
Client SSD 2 (SATA)
Apples to Apples, Pears to Pears in SSS Performance Benchmarking © 2011 Storage Networking Industry Association. All Rights Reserved.
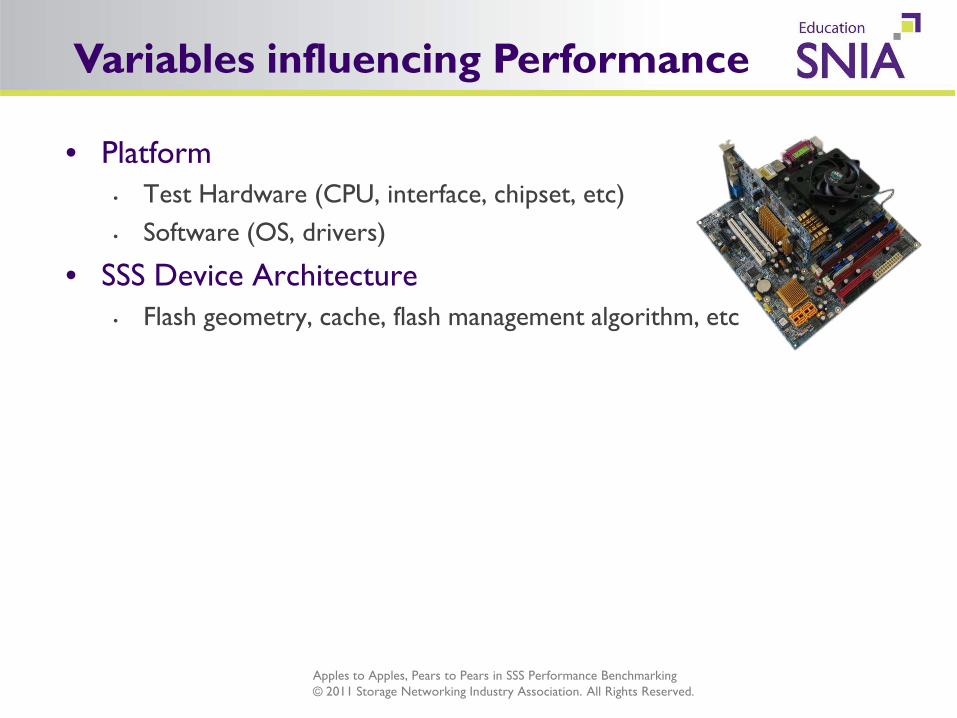
Variables influencing Performance
• Platform• Test Hardware (CPU, interface, chipset, etc)• Software (OS, drivers)
• SSS Device Architecture• Flash geometry, cache, flash management algorithm, etc

Apples to Apples, Pears to Pears in SSS Performance Benchmarking © 2011 Storage Networking Industry Association. All Rights Reserved.
Variables influencing Performance
• Platform• Test Hardware (CPU, interface, chipset, etc)• Software (OS, drivers)
• SSS Device Architecture• Flash geometry, cache, flash management algorithm, etc
• Workload1. Write history & preconditioning: State of device before testing

Apples to Apples, Pears to Pears in SSS Performance Benchmarking © 2011 Storage Networking Industry Association. All Rights Reserved.
The need for Preconditioning
Santa Clara, CA USAAugust 2009
0
0.2
0.4
0.6
0.8
1
1.2
0 50 100 150 200 250 300
Nor
mal
ized
IOP
S (I
OP
S/M
ax(I
OP
S))
Time (Minutes)
Performance States for Various SSDsNM (MLC) NS (SLC) JS (SLC) PSM (MLC) JM (MLC)
FOBTransition
Steady State (desirable test range)

Apples to Apples, Pears to Pears in SSS Performance Benchmarking © 2011 Storage Networking Industry Association. All Rights Reserved.
0
5000
10000
15000
20000
25000
30000
35000
40000
45000
20 60 100
140
180
220
260
300
340
380
420
460
500
540
580
620
660
700
740
780
820
860
900
940
980
1020
1060
1100
1140
1180
1220
1280
1320
1360
1400
1440
1480
1520
1560
1600
1640
1680
IOPS
Time (Minutes)
4K Random to 128K Sequential Transition
Write History - 1
4K Steady State
F.O.B. (~1hr)
Random to Sequential Transition (~1.5hr)
128K Steady State
Apples to Apples, Pears to Pears in SSS Performance Benchmarking © 2011 Storage Networking Industry Association. All Rights Reserved.
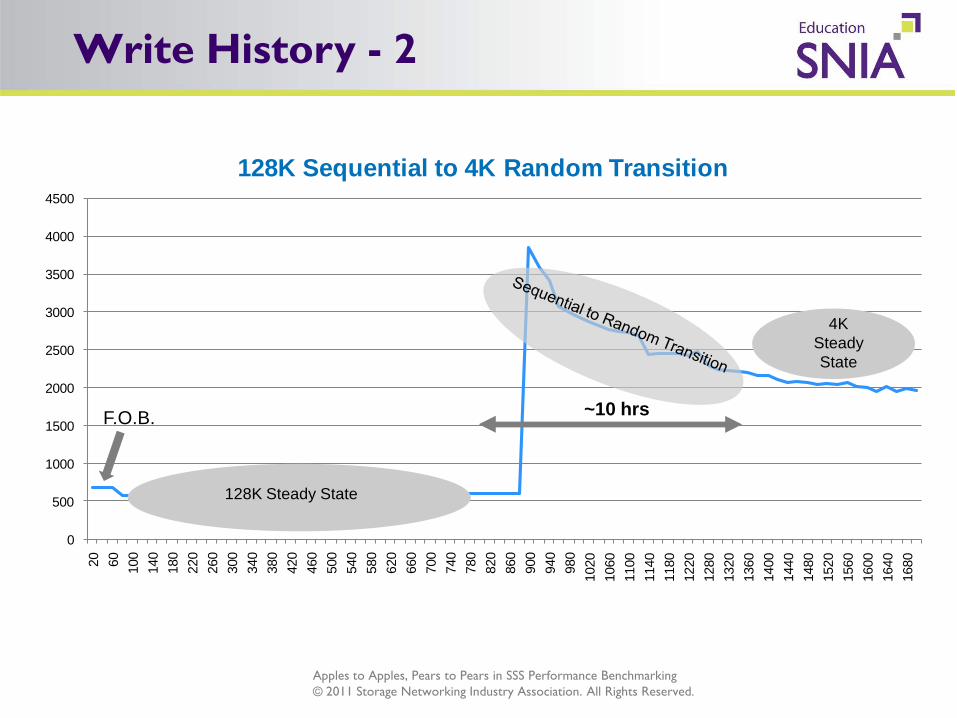
Write History - 2
0
500
1000
1500
2000
2500
3000
3500
4000
4500
20 60 100
140
180
220
260
300
340
380
420
460
500
540
580
620
660
700
740
780
820
860
900
940
980
1020
1060
1100
1140
1180
1220
1280
1320
1360
1400
1440
1480
1520
1560
1600
1640
1680
128K Sequential to 4K Random Transition
4K Steady State
128K Steady State
F.O.B. ~10 hrs

Apples to Apples, Pears to Pears in SSS Performance Benchmarking © 2011 Storage Networking Industry Association. All Rights Reserved.
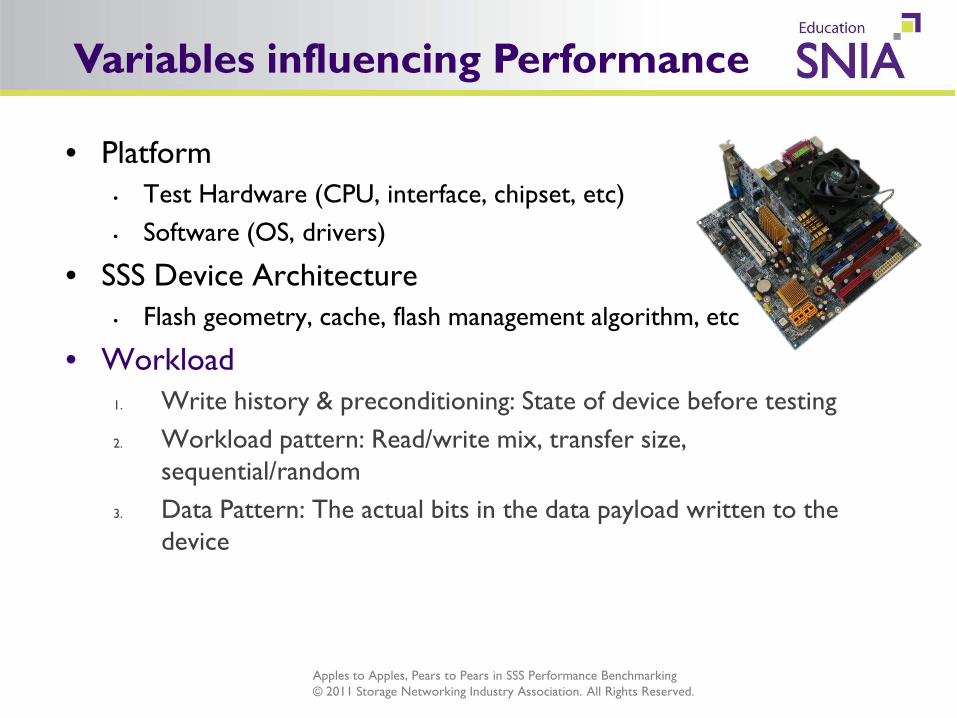
Variables influencing Performance
• Platform• Test Hardware (CPU, interface, chipset, etc)• Software (OS, drivers)
• SSS Device Architecture• Flash geometry, cache, flash management algorithm, etc
• Workload1. Write history & preconditioning: State of device before testing2. Workload pattern: Read/write mix, transfer size,
sequential/random

Apples to Apples, Pears to Pears in SSS Performance Benchmarking © 2011 Storage Networking Industry Association. All Rights Reserved.
Workload Pattern
0.5
2
8
1024
0.0
500.0
1000.0
1500.0
2000.0
2500.0
3000.0
3500.0
4000.0
0/100 10/90 20/80 35/65 65/35 80/20 90/10 100/0Bl
ock
Size
(KB)
IOPS
R/W Mix (%)
3D IOPS Surface Profile 0.0-500.0 500.0-1000.0 1000.0-1500.0 1500.0-2000.0
2000.0-2500.0 2500.0-3000.0 3000.0-3500.0 3500.0-4000.0
Performance depends on
Read/Write MixBlock SizeQueue Depth (not shown)
Note: Shown 3D IOPS image courtesy of Calypso Systems
Apples to Apples, Pears to Pears in SSS Performance Benchmarking © 2011 Storage Networking Industry Association. All Rights Reserved.
Variables influencing Performance
• Platform• Test Hardware (CPU, interface, chipset, etc)• Software (OS, drivers)
• SSS Device Architecture• Flash geometry, cache, flash management algorithm, etc
• Workload1. Write history & preconditioning: State of device before testing2. Workload pattern: Read/write mix, transfer size,
sequential/random3. Data Pattern: The actual bits in the data payload written to the
device

Apples to Apples, Pears to Pears in SSS Performance Benchmarking © 2011 Storage Networking Industry Association. All Rights Reserved.
Dependency on data content - 1
0.52
8
32
128
512
0
5,000
10,000
15,000
20,000
25,000
30,000
35,000
0/10010/90
20/8035/65
65/3580/20
90/10100/0
Transfer Size (KB)
IOPS
R/W Mix %
3D IOPS Surface Profile (IOMETER 2008)
30,000 - 35,000
25,000 - 30,000
20,000 - 25,000
15,000 - 20,000
10,000 - 15,000
5,000 - 10,000
0 - 5,000

Apples to Apples, Pears to Pears in SSS Performance Benchmarking © 2011 Storage Networking Industry Association. All Rights Reserved.
0.52
8
32
128
512
0
5,000
10,000
15,000
20,000
25,000
30,000
35,000
0/10010/90
20/8035/65
65/3580/20
90/10100/0
Transfer Size (KB)
IOPS
R/W Mix %
3D IOPS Surface Profile (IOMETER 2008)
30,000 - 35,000
25,000 - 30,000
20,000 - 25,000
15,000 - 20,000
10,000 - 15,000
5,000 - 10,000
0 - 5,000
Dependency on data content - 2
18
0.51
24
816
3264
128256
512
1024
0
5,000
10,000
15,000
20,000
25,000
30,000
35,000
0/10010/90
20/8035/65
65/3580/20
90/10100/0
Transfer Size (KB)
IOPS
R/W Mix %
3D IOPS Surface Profile (IOMETER 2006)
30,000 - 35,000
25,000 - 30,000
20,000 - 25,000
15,000 - 20,000
10,000 - 15,000
5,000 - 10,000
0 - 5,000
IOMeter 2006 High Entropy Data Content
IOMeter 2008 Low Entropy Data Content

Apples to Apples, Pears to Pears in SSS Performance Benchmarking © 2011 Storage Networking Industry Association. All Rights Reserved.
Test Suite Client SSD Enterprise SSD
PCMark HDD Score, OS and application loading timing, user simulation (surfing web, windows media player, etc) √
SysMark System-level test. Measures performance based on average response time, gives score (0-250) √
IOMeter Sequential/Random performance, workload simulation (file server, web server workload, etc) √ √
HDTach/H2benchw
Performance stability, Sequential/Burst performance, Access Time √ √
HD Tune Performance stability, Sequential/Burst performance, Access Time
Everest Random Access Time (Read/Write) √ √VDBench Workload generator, performance on DAS and NAS √Calypso CTS Device (RAW) level, direct IO synthetic stimulus
generator for both client and enterprise √ √
Benchmark Suites

Apples to Apples, Pears to Pears in SSS Performance Benchmarking © 2011 Storage Networking Industry Association. All Rights Reserved.
The Need for Industry Standardization!
• SNIA Technical Working Group (TWG)• Created in early 2009
• Specification for tests procedures to enable comparative testing of SSS performance
• Agnostic – Does not favor any one technology• Relevant & Repeatable – Meaningful to end users• Practical – Complete with reasonable time and effort
• Spec 1.0 to be released soon• Future: Split of test specification into separate
Enterprise and Client categories

Apples to Apples, Pears to Pears in SSS Performance Benchmarking © 2011 Storage Networking Industry Association. All Rights Reserved.
SNIA Performance Specification
1. Prepare the DevicePurge/Erase put SSD back into “original” state
2. Workload independent preconditioningWrite data 2x capacity bring device to known state
3. Steady State Testing (includes workload based preconditioning)
Run Test Loop up until steady state is achievedPerformance stays within ± 10% margin
4. Test Report Steady state convergenceSteady State VerificationPerformance measurement (2D/3D)

Apples to Apples, Pears to Pears in SSS Performance Benchmarking © 2011 Storage Networking Industry Association. All Rights Reserved.
Preconditioning
• Preconditioning is key to get repeatable results• Preconditioning needed to get drive in Steady State,
after which performance can be measured
22
Apples to Apples, Pears to Pears in SSS Performance Benchmarking © 2011 Storage Networking Industry Association. All Rights Reserved.
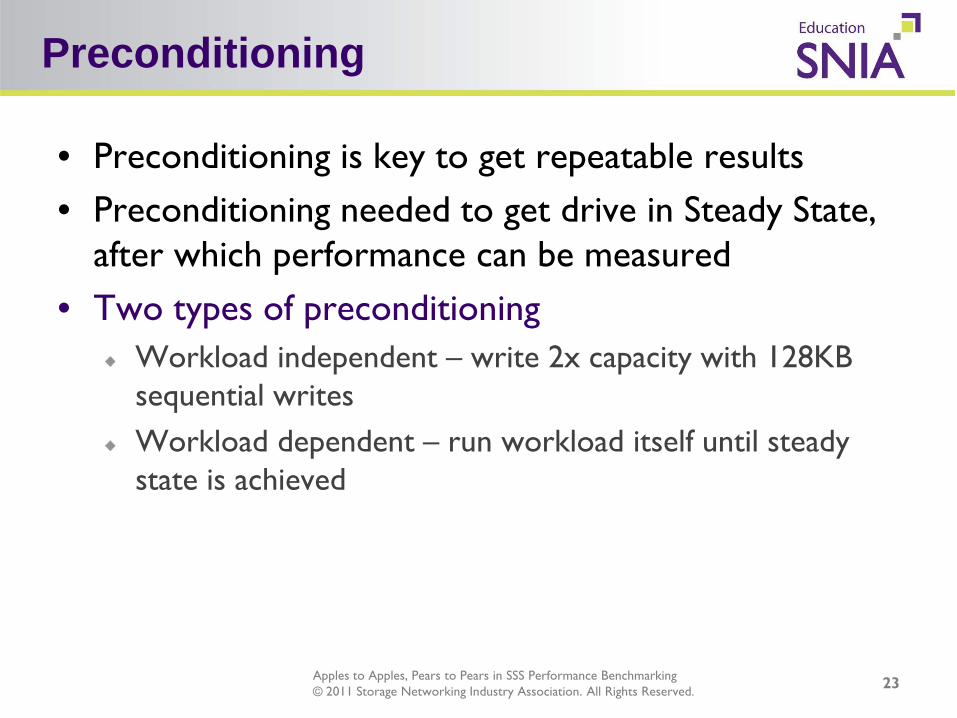
Preconditioning
• Preconditioning is key to get repeatable results• Preconditioning needed to get drive in Steady State,
after which performance can be measured• Two types of preconditioning
Workload independent – write 2x capacity with 128KB sequential writesWorkload dependent – run workload itself until steady state is achieved
23

Apples to Apples, Pears to Pears in SSS Performance Benchmarking © 2011 Storage Networking Industry Association. All Rights Reserved.
Dat
a ex
curs
ion
20%
ave
rage
Slope excursion10%
averageSteady State
• Measurement window is interval for last 5 measured rounds (i.e. test loops) that show steady sate results
• Steady State is achieved if BOTH conditions are metVariation of y in measurement window is within 20% of averageTrending of y within measurementwindow is within 10% of average
24

Apples to Apples, Pears to Pears in SSS Performance Benchmarking © 2011 Storage Networking Industry Association. All Rights Reserved.
Performance Workloads & Tests
25
Client Test
• Random IOPS• 100/0, 95/5, 65/35,
50/50, 35/65, 5/95, 0/100• 1024K, 128K, 64K, 32K,
16K, 8K, 4K, 0.5K
• Sequential MB/s• 100/0, 0/100• 1024K
• Latency (random access)
• 100/0, 65/35, 0/100• 8K, 4K, 0.5K
Enterprise Test
• Random IOPS• 100/0, 95/5, 65/35, 50/50,
35/65, 5/95, 0/100• 1024K, 128K, 64K, 32K,
16K, 8K, 4K, 0.5K
• Sequential MB/s• 100/0, 0/100• 1024K, 64K, 8K, 4K, 0.5K
• Latency (random access)
• 100/0, 65/35, 0/100• 8K, 4K, 0.5K
Version 1.0 will focus further on differentiating Client vs. Enterprise Testing

Apples to Apples, Pears to Pears in SSS Performance Benchmarking © 2011 Storage Networking Industry Association. All Rights Reserved.
Standard Reporting - 1
26
Steady State Convergence Plot
Steady State Verification

Apples to Apples, Pears to Pears in SSS Performance Benchmarking © 2011 Storage Networking Industry Association. All Rights Reserved.
Standard Reporting - 2
27
Performance Measurements 3D
Performance Measurements 2D

Apples to Apples, Pears to Pears in SSS Performance Benchmarking © 2011 Storage Networking Industry Association. All Rights Reserved.
Sample Test Report included
28

Apples to Apples, Pears to Pears in SSS Performance Benchmarking © 2011 Storage Networking Industry Association. All Rights Reserved.
• SSSI Group of SNIA• Technical Work Group (TWG) Performance
Benchmark Spec• Tech Dev Group Performance Test Platform
• JEDEC 64.8• Specification for SSD endurance measurement
• SSDA• Testing of reliability (power cycling, data retention,
endurance, etc) and OS compatibility (Windows 7)
Other Standardization Initiatives

Apples to Apples, Pears to Pears in SSS Performance Benchmarking © 2011 Storage Networking Industry Association. All Rights Reserved.
Summary
• SSS Performance is dependent on many variables• Comparing vendors is not trivial industry
standard required• SNIA Performance Specs allows
apples to apples comparison• Spec for review at
http://www.snia.org/tech_activities/publicreview• Send your feedback to [email protected]

Apples to Apples, Pears to Pears in SSS Performance Benchmarking © 2011 Storage Networking Industry Association. All Rights Reserved. 3131
Q&A / Feedback
Please send any questions or comments on this presentation to SNIA: [email protected]
Many thanks to the following individuals for their contributions to this tutorial.
- SNIA Education Committee
David Landsman,Easen HoEden KimNeal Ekker,Dan Le