introduction - barc india think- cricket in india.pdf · no dearth of live cricket content live...
TRANSCRIPT

N E W S L E T T E R 2 0 1 9

India is now being referred to a Sport ing nat ion in the making and the televis ion v iewership stats prove just that. I t reveals that sports in India is a potent genre. The sports fervor has seen fans going al l out to display their love and loyalty for their favorite team or star player. Marketers understand the immense power of this cult of sports enthusiasts to increase brand v is ibi l i ty , populari ty and perceived value in the minds of hundreds and thousands of v iewers of Sports.
The popularity of sports in the country is largely driven by Cricket. The game is truly a rel igion here, seeping into the warp and weft of the social fabric of our l ives. The growing supply of cr icket content both on sports channels and others as well as the growing audiences are test imony to the fact that cr icket wil l cont inue to reign i ts numero uno spot in India.
In this edit ion of THiNK we analyze the impact of Cricket on televis ion v iewership. We have explored v iewership at various angles l ike format of the game, India matches, popular leagues and so on.
Let’s Play!
Introduction

766 Mn viewers sampled sports content in 2018.
766 MN VIEWERS
Youth continues to be the highest consumer of Live cr icket with 35% viewership of Live cr icket contr ibuted by 15-30 year olds in 2019.
35%OF LIVE CRICKET VIEWERSHIPBY YOUTH
Women form 48% of cr icket v iewers for 2018 with 342 Mn viewers.
342 MNWOMEN VIEWERS
IPL scores year over year, growing both in terms of v iewers as well as average watch t ime per v iewer – 28 minutes to 34 minutes from 2016 to 2018.
IPLSCORES
Share of NCCS AB cricket v iewers is on the r ise and stands at 56% for the f irst 21 weeks of 2019.
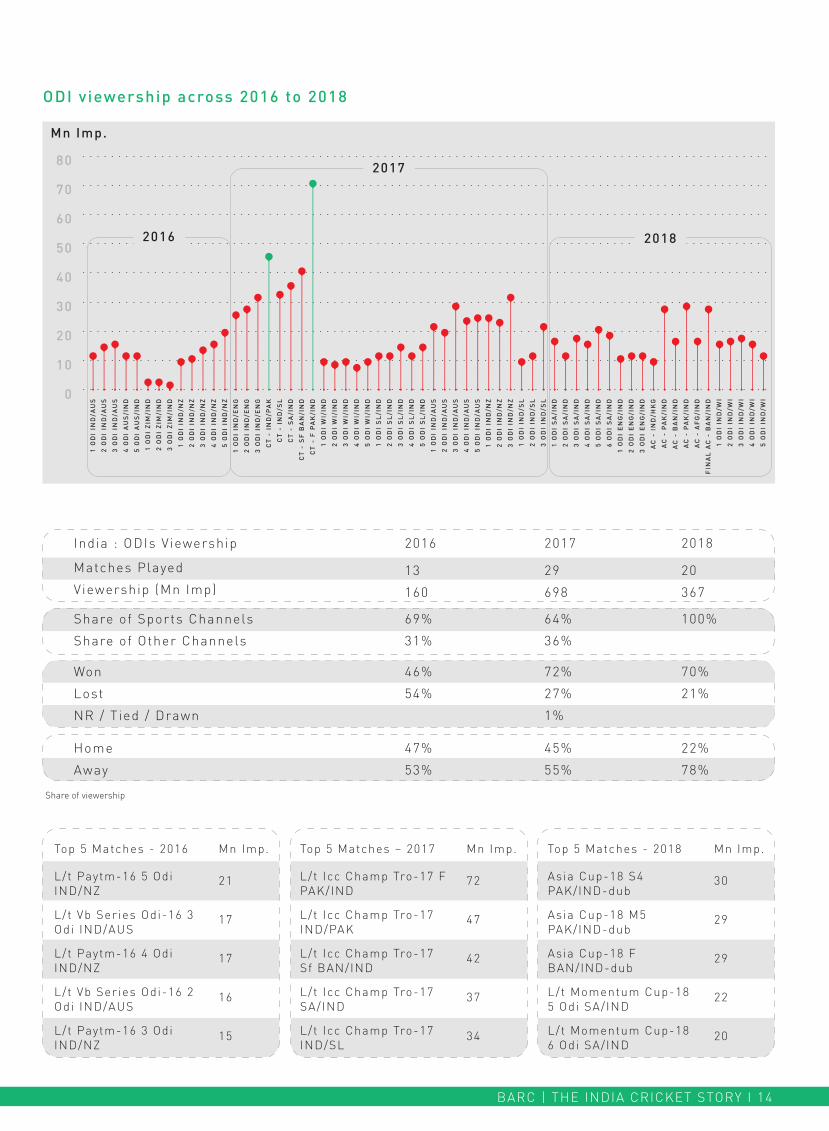
India Pakistan ODIs l ive up to the hype and garner enormous v iewership. The top 2 ODI matches in the 2016 to 2018 period are matches played between these neighbouring nat ions.
INDO-PAK CRICKETINGLEGACY
Women’s cr icket scores on ROI as compared to Internat ional T20 leagues and Domestic cr icket. The Women’s World Cup Final between India & England had a v iewership of 39 Mn impressions.
WOMEN'S CRICKET
93% of al l sports v iewers in 2018 watched cricket content.
93% VIEWERS
51%NCCS AB CRICKETVIEWERS

Sports In India – An Overview 01
03
06
09
17
25
32
36
Cricket viewership is on the rise
Live Cricket Overview
The IndiaCricket Story
The IPL Phenomenon
Rise In Quantum Of Advertising
Other Emerging Cohorts
Summary
INDEX
#1
SPORTS IN INDIA – AN OVERVIEW
0
10
20
30
40
50
60
70
80
90
100
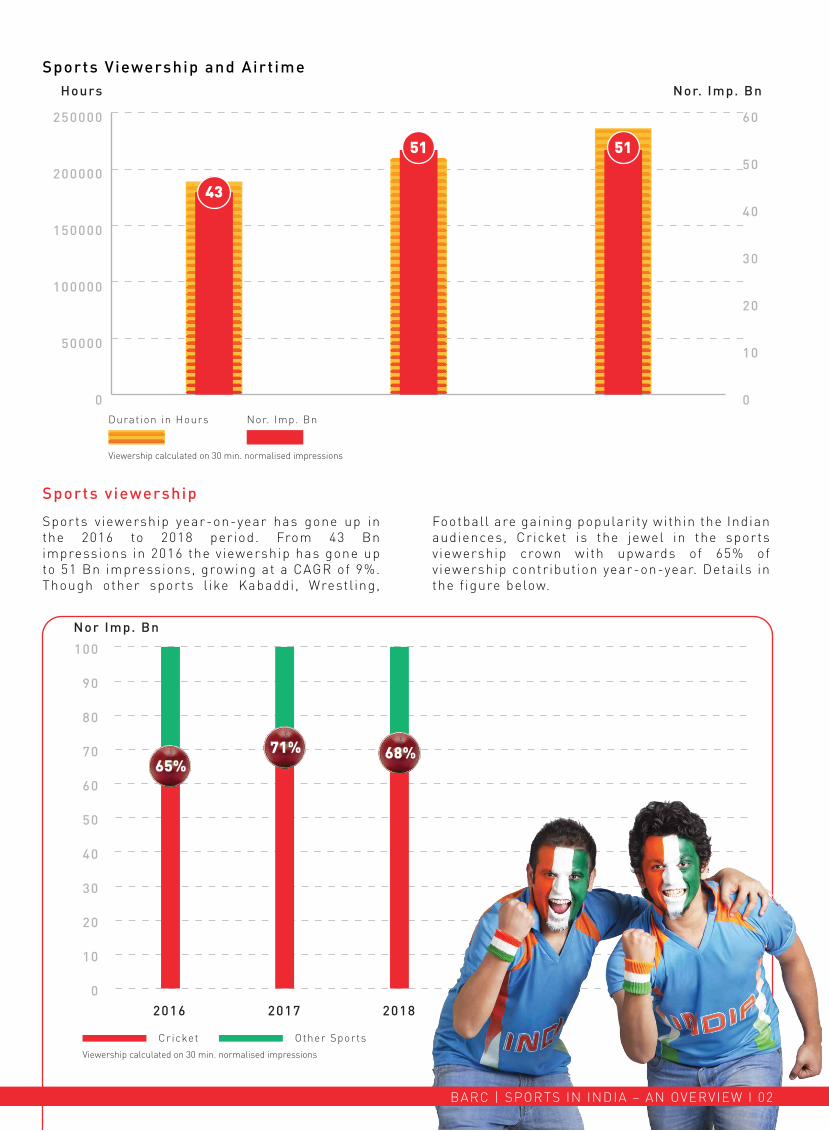
Sports v iewership year-on-year has gone up in the 2016 to 2018 period. From 43 Bn impressions in 2016 the v iewership has gone up to 51 Bn impressions, growing at a CAGR of 9%. Though other sports l ike Kabaddi , Wrestl ing,
Football are gaining popularity within the Indian audiences, Cricket is the jewel in the sports v iewership crown with upwards of 65% of v iewership contr ibut ion year-on-year. Detai ls in the f igure below.
Sports viewership
0
10
20
30
40
50
60
0
50000
100000
150000
200000
250000
Hours Nor. Imp. Bn
51 51
43
Sports Viewership and Airt ime
Duration in Hours Nor. Imp. Bn
2016 2017 2018
68%71%65%
Cricket Other Sports
Viewership calculated on 30 min. normalised impressions
Viewership calculated on 30 min. normalised impressions
Nor Imp. Bn
BARC | SPORTS IN INDIA – AN OVERVIEW I 02

#2
CRICKET VIEWERSHIP
IS ON THE RISE

The last 3 years have seen a steady increase in cr icket content on sports channels. Apart from internat ional cr icket matches to the nat ional favourite IPL, v iewers today have a wide array of choice. From domestic competit ions l ike the
Ranj i Trophy, the Duleep Trophy, the Vi jaya Hazare Trophy etc to Internat ional T20 Leagues l ike Big Bash League, Mzansi Super League, Pakistan Super League etc to popular celebrity leagues we can see i t al l on the small screen.
Surge In Programming as well as Sports Channels
Hours of Content
2016Sports Channels
2017 2018
Number of Channels
Interest ingly, the footprint of cr icket is not just restr icted to sports channels and goes well beyond them. Overall , there is 25% growth of cr icket v iewership in 2018 over 2016, for the same period, cr icket v iewership on sports channels grew by 79%.
The dynamics of l ive cr icket on Non–sports channels has seen a change from 2018. The drop in non- sports channels v iewership for cr icket content in 2018 can be attr ibuted to majori ty of IPL-12 telecast moving to channels in the Sports genre.
Cricket Viewership on Sports Channels
Cricket Viewership on Non-sports Channels
Cricket content on televis ion is approaching the 1 Mil l ion hour mark annually , with 89000 hours being clocked in 2018. Non–sports channels carried 4700 hours of cr icket content in 2016 and upwards of 5400 hours in 2018. Some news channels have the same cricket program t i t les running over last 3 years.
Number of sports channels have witnessed a steady r ise on the back of both HD channels and regional channel launches. Popular matches are also simulcasted on Non-sports channels and this number has gone north as well . Non-l ive cr icket content also makes up for respectable airt ime.
Non-sports Channels
478145056
492264913
540784013
2016
2017
2018
19
32
29
111
153
159
SportsChannels
Non-sports Channels
Year
BARC | CRICKET VIEWERSHIP IS ON THE RISE I 04
2018
2017
2016
2018
2017
2016
Viewership calculated on 30 min. normalised impressions
Sports Channels Non-sports Channels
0 5 10 15 20 25 30 35
35%growth
33%growth 79%
growth
Nor. Imp. Bn
Nor. Imp. Bn

Cricket Content Spl i t
BARC | CRICKET VIEWERSHIP IS ON THE RISE I 05
With Over 89000 Hours, Cricket Programming Up By 79% In 2018 Over 2016
Live Cricket Viewership Stands at >70% of Total Cricket Viewership in 2018
Share of 30 min. normalised impressions
Live Cricket - Sports Channels
Live Cricket - Other Channels
Non-Live Cricket : Sports Channels
Non-Live Cricket : Other Channels
Cricket Content (Hours)
2016
20%
2%
70%
8%
49837
2017
14%
1%
78%
6%
69835
2018
14%
2%
80%
4%
89420
2016
Live on Sports 50Live on Non-sports 31Non-l ive on Sports 13Non-l ive on Non-sports 6
2017
Live on Sports 47Live on Non-sports 31Non-l ive on Sports 17Non-l ive on Non-sports 5
2018
Live on Sports 64Live on Non-sports 7Non-l ive on Sports 26Non-l ive on Non-sports 3
#3
LIVE CRICKET
OVERVIEW

What was watched?
T20 World Cup in 2016 and Champions Trophy in 2017 contr ibuted 21% & 14% to the total cr icket v iewership of the year respect ively.
No dearth of l ive cricket content
Live cr icket content contr ibuted to a minority share to (22% in 2016, 15% in 2017 and 16% in 2018) cr icket content telecast. But in absolute terms, l ive cr icket has grown by 30% from 10882 hours in 2016 to 14180 hours in 2018.
0 3000 6000 9000 12000 15000
2016
2017
2018
Hours
The absence of any major ICC event results in 28% drop in the internat ional cr icket v iewing for 2018. IPL in 2018 grows by 19% over the previous year
0 5 10 15 20 25 30
2016
2017
2018
Nor. Imp. Bn
Internat ional Matches / Tournaments IPL Other Cricket Analysis / Specials etc
Cricket Viewership
Cricket Content
Internat ional Matches / Tournaments IPL Other Cricket Analysis / Specials etc
BARC | LIVE CRICKET OVERVIEW I 07
Viewership calculated on 30 min. normalised impressions
ACROSS ALL MATCHES INTERNATIONAL MATCHES
ACROSS ALL MATCHES INTERNATIONAL MATCHES
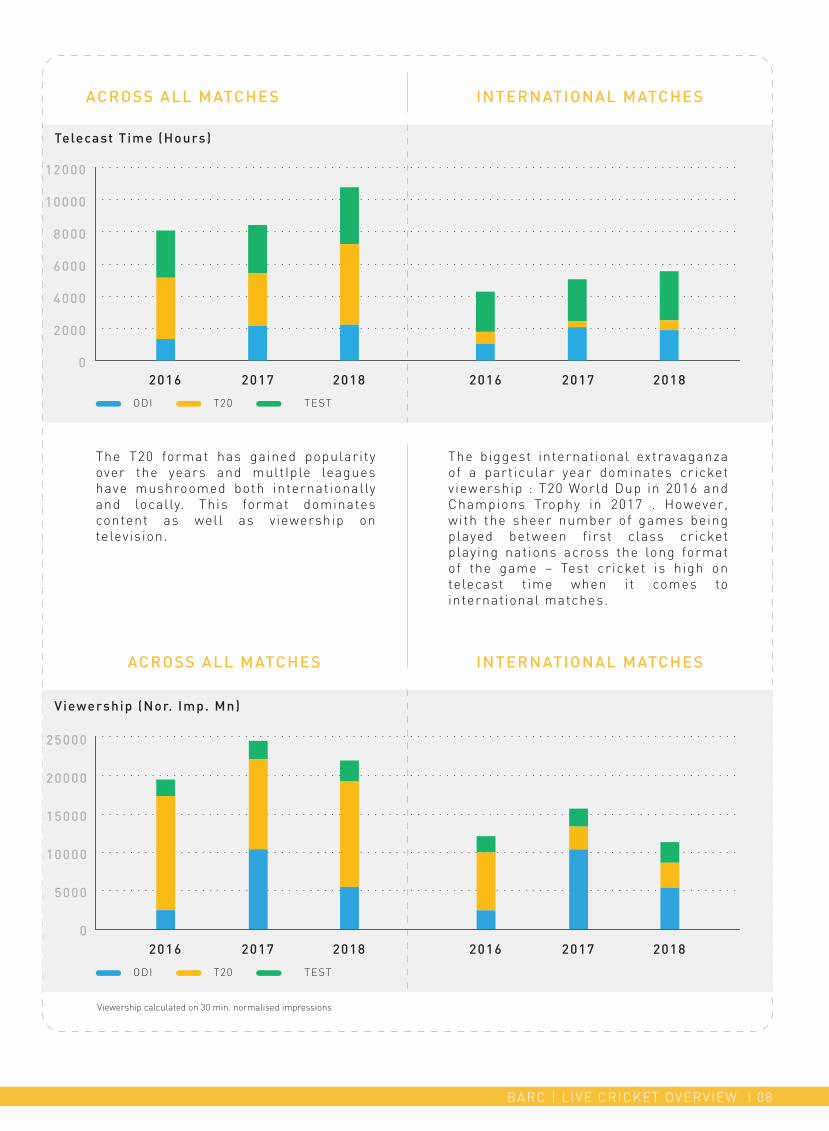
The T20 format has gained popularity over the years and mult Iple leagues have mushroomed both internat ionally and locally. This format dominates content as well as v iewership on televis ion.
The biggest internat ional extravaganza of a part icular year dominates cr icket v iewership : T20 World Dup in 2016 and Champions Trophy in 2017 . However, with the sheer number of games being played between f irst class cr icket playing nat ions across the long format of the game – Test cr icket is high on telecast t ime when i t comes to internat ional matches.
0
2000
4000
6000
8000
10000
12000
2016 2017 2018 2016 2017 2018
ODI T20 TEST
2016 2017 2018 2016 2017 2018
ODI T20 TEST
0
5000
10000
15000
20000
25000
Telecast Time (Hours)
Viewership (Nor. Imp. Mn)
BARC | LIVE CRICKET OVERVIEW I 08
Viewership calculated on 30 min. normalised impressions
#4
THE INDIA CRICKET
STORY
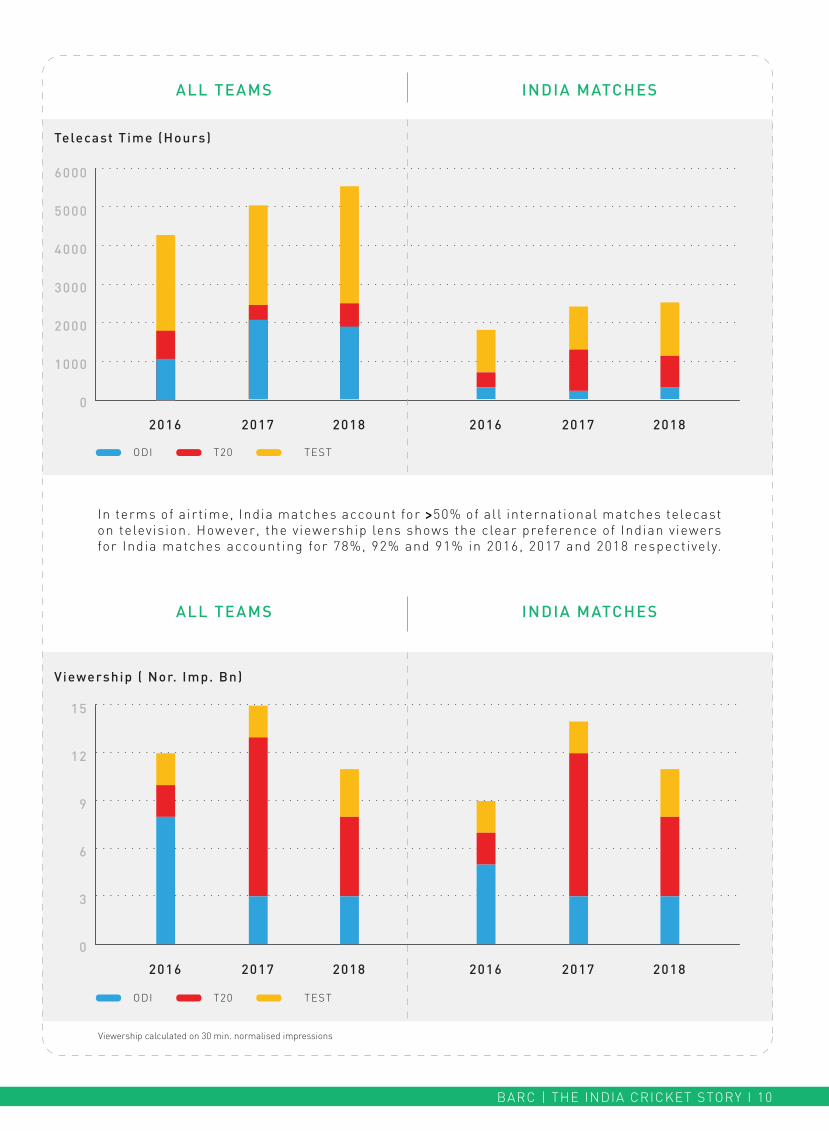
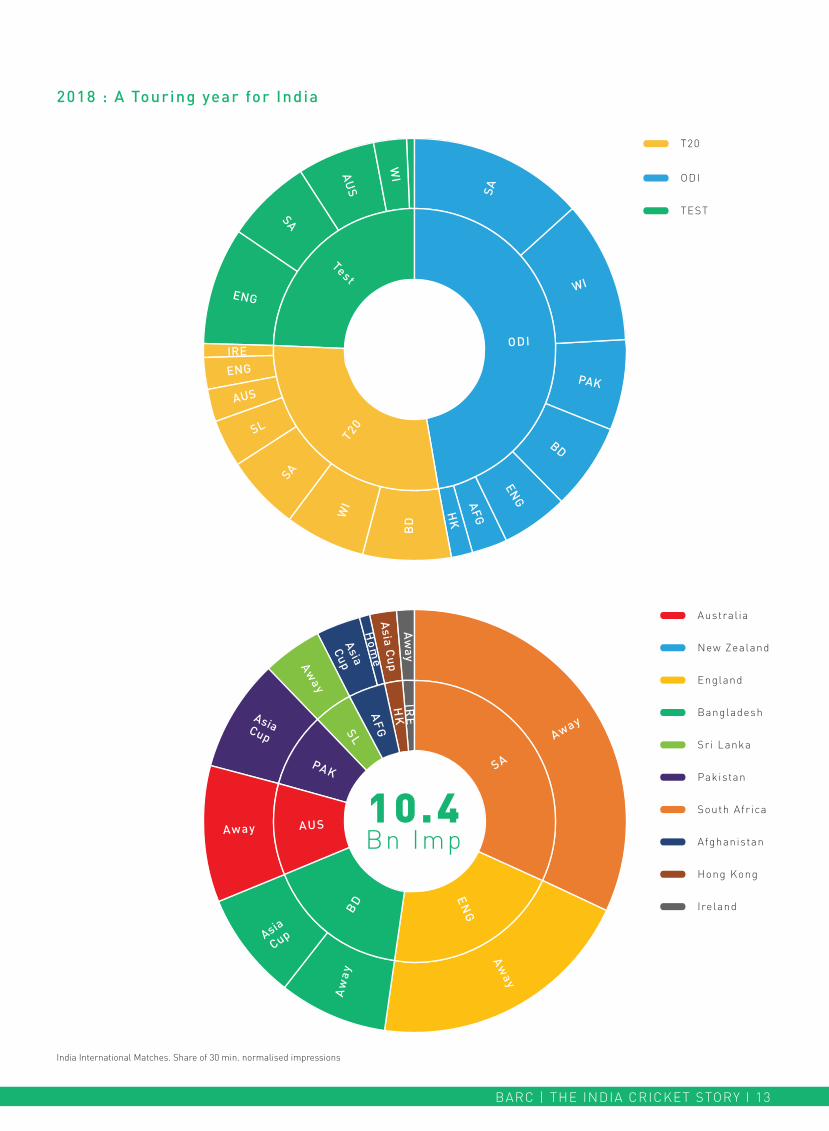
In terms of airt ime, India matches account for >50% of al l internat ional matches telecast on televis ion. However, the v iewership lens shows the clear preference of Indian v iewers for India matches accounting for 78%, 92% and 91% in 2016, 2017 and 2018 respect ively.
ALL TEAMS INDIA MATCHES
2016 2017 2018 2016 2017 2018
ODI T20 TEST
0
1000
2000
3000
4000
5000
6000
ALL TEAMS INDIA MATCHES
2016 2017 2018 2016 2017 2018
ODI T20 TEST
Viewership ( Nor. Imp. Bn)
Telecast Time (Hours)
BARC | THE INDIA CRICKET STORY I 10
0
3
6
9
12
15
Viewership calculated on 30 min. normalised impressions
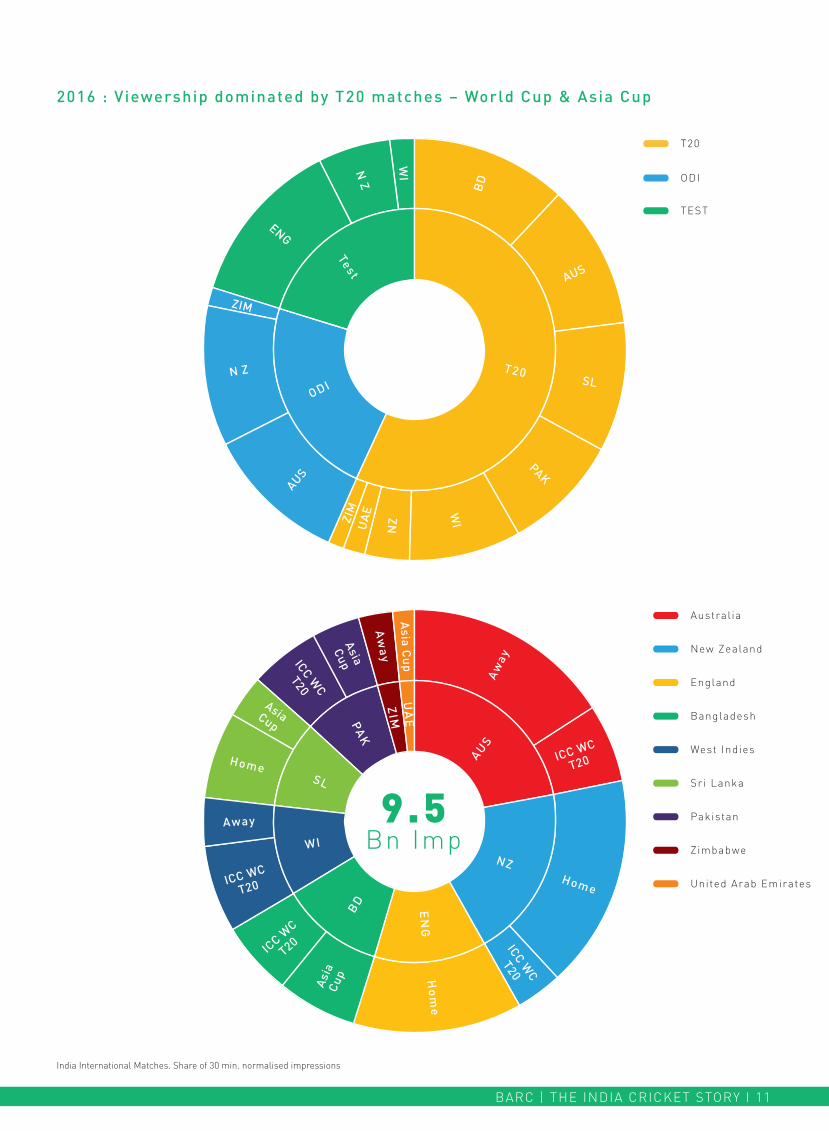
2016 : Viewership dominated by T20 matches – World Cup & Asia Cup
India International Matches. Share of 30 min. normalised impressions
BARC | THE INDIA CRICKET STORY I 11
9.5Bn Imp
T20
ODI
TEST
Austral ia
New Zealand
England
Bangladesh
West Indies
Sri Lanka
Pakistan
Zimbabwe
United Arab Emirates
ODI
AUSZIM
N Z
N Z
WI
BD
AUS
SL
PAK
WI
NZUA
E
ZIM
ENG
Test
T20
Aw
ay
Aw
ay
Away
ICC WC
T20
ICC WC
T20
ICC W
C
T20
ICC WC
T20
ICC WC
T20
Asia
Cup
AsiaCup
Asia C
up
Asia
Cup
Home
Home
Ho
me
NZ
EN
G
BD
WI
SL
PAK
ZIM
UA
E
AUS

Hom
e
Ho
me
Home
Away
ChampionsTrophy
Home
Hom
e
ChampionsTrophy
AUS
ENG
NZ
PAK
BD
SA
SLCham
pions
Trophy
Cham
pions
Trophy
India International Matches. Share of 30 min. normalised impressions
2017 : The Return of the ODI Format
BARC | THE INDIA CRICKET STORY I 12
14.4Bn Imp
Austral ia
New Zealand
England
Bangladesh
Sri Lanka
Pakistan
South Afr ica
T20
ODI
TEST
T20
SA
WI
NZ
AUS
WI
ENG
SL
SL
BD
SL
AUS
PAK
ENG
NZB
D
AUS
Test
ODI
Away
Aw
ay
Aw
ay
Ho
me
Away
Aw
ay
Asia
Cup
AsiaCup
Aw
ay
Asia C
up
Asia
Cup
EN
GBD
AUS
PAK
SL
AF
G
IRE
HK
SA
2018 : A Touring year for India
BARC | THE INDIA CRICKET STORY I 13
10.4Bn Imp
India International Matches. Share of 30 min. normalised impressions
Austral ia
New Zealand
England
Bangladesh
Sri Lanka
Pakistan
South Afr ica
Afghanistan
Hong Kong
Ireland
T20
SAENG
IRE
ENG
AUS
SL
AU
S
WI
SA
WI
PAK
BD
ENG
HK
AFG
BDW
I
SA
Test
ODI
T20
ODI
TEST
Share of viewership
ODI viewership across 2016 to 2018 1
OD
I IN
D/A
US
2 O
DI
IND
/AU
S
3 O
DI
IND
/AU
S
4 O
DI
AU
S/I
ND
5 O
DI
AU
S/I
ND
1 O
DI
ZIM
/IN
D
2 O
DI
ZIM
/IN
D
3 O
DI
ZIM
/IN
D
1 O
DI
IND
/NZ
2 O
DI
IND
/NZ
3 O
DI
IND
/NZ
4 O
DI
IND
/NZ
5 O
DI
IND
/NZ
1 O
DI
IND
/EN
G
2 O
DI
IND
/EN
G
3 O
DI
IND
/EN
G
CT
- I
ND
/PA
K
CT
- I
ND
/SL
CT
- S
A/I
ND
CT
- S
F B
AN
/IN
D
CT
- F
PA
K/I
ND
1 O
DI
WI/
IND
2 O
DI
WI/
IND
3 O
DI
WI/
IND
4 O
DI
WI/
IND
5 O
DI
WI/
IND
1 O
DI
SL
/IN
D
2 O
DI
SL
/IN
D
3 O
DI
SL
/IN
D
4 O
DI
SL
/IN
D
5 O
DI
SL
/IN
D
1 O
DI
IND
/AU
S
2 O
DI
IND
/AU
S
3 O
DI
IND
/AU
S
4 O
DI
IND
/AU
S
5 O
DI
IND
/AU
S
1 O
DI
IND
/NZ
2 O
DI
IND
/NZ
3 O
DI
IND
/NZ
1 O
DI
IND
/SL
2 O
DI
IND
/SL
3 O
DI
IND
/SL
1 O
DI
SA
/IN
D
2 O
DI
SA
/IN
D
3 O
DI
SA
/IN
D
4 O
DI
SA
/IN
D
5 O
DI
SA
/IN
D
6 O
DI
SA
/IN
D
1 O
DI
EN
G/I
ND
2 O
DI
EN
G/I
ND
3 O
DI
EN
G/I
ND
AC
- I
ND
/HK
G
AC
- P
AK
/IN
D
AC
- B
AN
/IN
D
AC
- P
AK
/IN
D
AC
- A
FG
/IN
D
FIN
AL
AC
- B
AN
/IN
D
1 O
DI
IND
/WI
2 O
DI
IND
/WI
3 O
DI
IND
/WI
4 O
DI
IND
/WI
5 O
DI
IND
/WI
Mn Imp.
Top 5 Matches - 2016
L/t Paytm-16 5 Odi IND/NZ
L/t Vb Series Odi-16 3 Odi IND/AUS
L/t Paytm-16 4 Odi IND/NZ
L/t Vb Series Odi-16 2 Odi IND/AUS
L/t Paytm-16 3 Odi IND/NZ
Mn Imp.
21
17
17
16
15
Top 5 Matches – 2017
L/t Icc Champ Tro-17 F PAK/IND
L/t Icc Champ Tro-17 IND/PAK
L/t Icc Champ Tro-17 Sf BAN/IND
L/t Icc Champ Tro-17 SA/IND
L/t Icc Champ Tro-17 IND/SL
Mn Imp.
72
47
42
37
34
Top 5 Matches - 2018
Asia Cup-18 S4 PAK/IND-dub
Asia Cup-18 M5 PAK/IND-dub
Asia Cup-18 F BAN/IND-dub
L/t Momentum Cup-18 5 Odi SA/IND
L/t Momentum Cup-18 6 Odi SA/IND
Mn Imp.
30
29
29
22
20
2018
2017
2016
India : ODIs Viewership
Matches Played
Viewership (Mn Imp)
Share of Sports Channels
Share of Other Channels
Won
Lost
NR / Tied / Drawn
Home
Away
2016
13
160
69%
31%
46%
54%
47%
53%
29
698
64%
36%
72%
27%
1%
45%
55%
2017
20
367
100%
70%
21%
22%
78%
2018
0
10
20
30
40
50
60
70
80
BARC | THE INDIA CRICKET STORY I 14

T20 viewership across 2016 to 2018
Top 5 Matches - 2016
L/t Icc Wc T20-16 Sf IND/WI
L/t Icc Wc T20-16 S10 AUS/IND
L/t Icc Wc T20-16 S10 PAK/IND
L/t Icc Wc T20-16 S10 IND/BAN
Asia Cup T20-16 F BAN/IND
Mn Imp.
88
83
82
70
62
Top 5 Matches – 2017
L/t Paytm-17 3 T20 IND/ENG
L/t Paytm-17 2 T20 IND/ENG
L/t Paytm-17 1 T20 IND/NZ
L/t Paytm-17 2 T20 IND/NZ
L/t Paytm-17 3 T20 IND/SL
Mn Imp.
49
46
46
45
42
Top 5 Matches - 2018
Nidahas Trophy-18 F BAN/IND
L/t Paytm-18 3 T20 IND/WI
L/t Paytm-18 2 T20 IND/WI
Nidahas Trophy-18 IND/BAN
L/t Paytm-18 1 T20 IND/WI
Mn Imp.
45
34
33
32
31
India : T20s Viewership
Matches Played
Viewership (Mn Imp)
Share of Sports Channels
Share of Other Channels
Won
Lost
NR / Tied / Drawn
Home
Away
2016
21
849
67%
39%
74%
25%
2%
58%
42%
13
476
72%
28%
74%
26%
90%
10%
2017
19
446
84%
16%
49%
48%
3%
22%
78%
2018
1 I
ND
/AU
S
2 I
ND
/AU
S
3 A
US
/IN
D
1 I
ND
/SL
2 I
ND
/SL
3 S
L/I
ND
IN
D/B
AN
PA
K/I
ND
SL
/IN
D
UA
E/I
ND
F B
AN
/IN
D
WC
- N
Z/I
ND
WC
- P
AK
/IN
D
WC
- I
ND
/BA
N
WC
- A
US
/IN
D
WC
- S
F I
ND
/WI
1 Z
IM/I
ND
2 Z
IM/I
ND
3 I
ND
/ZIM
M1
WI/
IND
-FL
D
M2
WI/
IND
-FL
D
1 I
ND
/EN
G
2 I
ND
/EN
G
3 I
ND
/EN
G
WI/
IND
SL
/IN
D
1 I
ND
/AU
S
2 I
ND
/AU
S
1 I
ND
/NZ
2 I
ND
/NZ
3 I
ND
/NZ
1 I
ND
/SL
2 I
ND
/SL
3 I
ND
/SL
1 S
A/I
ND
2 S
A/I
ND
3 S
A/I
ND
NT
- I
ND
/SL
NT
- B
AN
/IN
D
NT
- S
L/I
ND
NT
- I
ND
/BA
N
NT
- F
BA
N/I
ND
1 I
RE
/IN
D
2 I
RE
/IN
D
1 E
NG
/IN
D
2 E
NG
/IN
D
3 E
NG
/IN
D
1 I
ND
/WI
2 I
ND
/WI
3 I
ND
/WI
1 A
US
/IN
D
2 A
US
/IN
D
3 A
US
/IN
D
Mn Imp.
2017
2016
0
20
40
60
80
100
2018
BARC | THE INDIA CRICKET STORY I 15
Share of viewership

BARC | THE INDIA CRICKET STORY I 16
Test Match viewership across 2016 to 2018
Top 5 Matches - 2016
L/t Paytm-16 4 Test IND/ENG
L/t Paytm-16 2 Test IND/ENG
L/t Paytm-16 5 Test IND/ENG
L/t Paytm-16 1 Test IND/ENG
L/t Paytm-16 3 Test IND/ENG
Mn Imp.
26
22
21
19
18
Top 5 Matches – 2017
L/t Paytm-17 4 Test IND/AUS
L/t Paytm-17 3 Test IND/AUS
L/t Paytm-17 2 Test IND/AUS
L/t Paytm-17 1 Test IND/BAN
L/t Paytm-17 3 Test IND/SL
Mn Imp.
31
31
24
21
20
Top 5 Matches - 2018
Freedom Cup-18 2 Test SA/IND
Specsavers-18 3 Test ENG/IND
Domain-18-19 2 Test AUS/IND
Specsavers-18 4 Test ENG/IND
Specsavers-18 1 Test ENG/IND
Mn Imp.
23
20
19
18
18
India : Test Viewership
Matches Played
Viewership (Mn Imp)
Share of Sports Channels
Share of Other Channels
Won
Lost
NR / Tied / Drawn
Home
Away
2016
12
168
100%
84%
16%
89%
11%
11
197
100%
57%
8%
36%
90%
10%
2017
14
211
100%
46%
54%
14%
86%
2018
1 I
ND
/WI
2 W
I/IN
D
3 W
I/IN
D
4 W
I/IN
D
1 I
ND
/NZ
2 I
ND
/NZ
3 I
ND
/NZ
1 I
ND
/EN
G
2 I
ND
/EN
G
3 I
ND
/EN
G
4 I
ND
/EN
G
5 I
ND
/EN
G
1 I
ND
/BA
N
1 I
ND
/AU
S
2 I
ND
/AU
S
3 I
ND
/AU
S
4 I
ND
/AU
S
1 S
L/I
ND
2 S
L/I
ND
3 S
L/I
ND
1 I
ND
/SL
2 I
ND
/SL
3 I
ND
/SL
1 S
A/I
ND
2 S
A/I
ND
3 S
A/I
ND
1 I
ND
/AF
G
1 E
NG
/IN
D
2 E
NG
/IN
D
3 E
NG
/IN
D
4 E
NG
/IN
D
5 E
NG
/IN
D
1 I
ND
/WI
2 I
ND
/WI
1 A
US
/IN
D
2 A
US
/IN
D
3 A
US
/IN
D
Mn Imp.
2018
2017
2016
Share of Impressions
0
5
10
15
20
25
30
35
#5
THE IPL PHENOMENON

Growing over the years in all parameters
1027
2016 2017
1250
2018
1425
Durationin Hours 996 978 2094
IPL is a mainstay in the regular Indian home and dominates sports v iewership in the weeks i ts on air. The homegrown league in i ts 11th edit ion dominated the annual cr icket v iewership at 40% viewership share.
Viewership(Imp. in Mn)
2016 2017 2018
ATS (Viewer)
Cov. Mn. 362 411 414
00:28:48 00:31:49 00:34:06
BARC | THE IPL PHENOMENON I 18
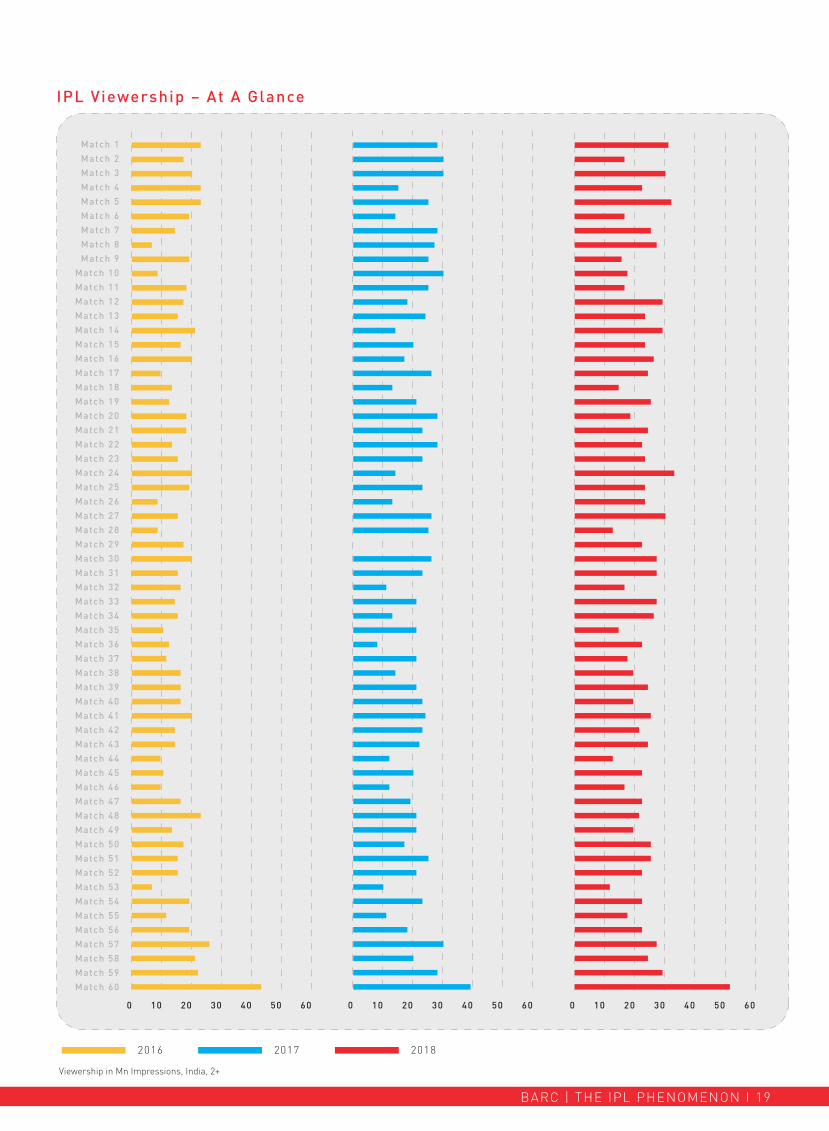
IPL Viewership – At A Glance
Match 1
Match 2
Match 3
Match 4
Match 5
Match 6
Match 7
Match 8
Match 9
Match 10
Match 11
Match 12
Match 13
Match 14
Match 15
Match 16
Match 17
Match 18
Match 19
Match 20
Match 21
Match 22
Match 23
Match 24
Match 25
Match 26
Match 27
Match 28
Match 29
Match 30
Match 31
Match 32
Match 33
Match 34
Match 35
Match 36
Match 37
Match 38
Match 39
Match 40
Match 41
Match 42
Match 43
Match 44
Match 45
Match 46
Match 47
Match 48
Match 49
Match 50
Match 51
Match 52
Match 53
Match 54
Match 55
Match 56
Match 57
Match 58
Match 59
Match 60
2016 2017 2018
Viewership in Mn Impressions, India, 2+
0 10 20 30 40 50 60 0 10 20 30 40 50 60 0 10 20 30 40 50 60
BARC | THE IPL PHENOMENON I 19

Viewership in Mn Impressions, India, 2+
2016 2017
2018
60
57
4
5
1
48
59
58
14
24
F SRH Vs RCB
QL GL Vs RCB
MI Vs RPS
RCB Vs SRH
KKR Vs MI
KKR Vs RCB
QL GL Vs SRH
EL SRH Vs KKR
RCB Vs MI
KKR Vs MI
Bengaluru
Bengaluru
Mumbai
Bengaluru
Kolkata
Kolkata
Delhi
Delhi
Mumbai
Mumbai
45
27
24
24
24
24
23
22
22
21
2016VenueDescript ionMatch #
60
24
5
1
27
3
59
12
14
57
F SRH/CSK
RCB/CSK
KKR/CSK
MI Vs CSK
CSK Vs MI
RCB Vs KKR
QL SRH Vs KKR
KP Vs CSK
MI Vs RCB
QL SRH Vs CSK
Mumbai
Bengaluru
Chennai
Mumbai
Pune
Kolkata
Kolkata
Mohal i
Mumbai
Mumbai
53
34
33
32
31
31
30
30
30
28
2018VenueDescript ionMatch #
60
2
3
57
10
20
1
22
7
59
F MI Vs RPS
MI Vs RPS
GL Vs KKR
QL RPS Vs MI
SRH Vs MI
RCB Vs GL
SRH Vs RCB
KP Vs MI
KKR Vs MI
QL KKR Vs MI
Hyderabad
Pune
Rajkot
Mumbai
Mumbai
Rajkot
Hyderabad
Indore
Mumbai
Bengaluru
39
30
30
30
30
28
28
28
28
28
2017VenueDescript ionMatch #
BARC | THE IPL PHENOMENON I 20

Deconstructing The IPL Viewer
2016 2017 2018
15-30 YRS 31-40 YRS 41+ 50 YRS 51+ 60 YRS 61+ YRS2-14 YRS
NCCS - A NCCS - B NCCS - CDE
MALE FEMALE
58% 42%59% 41% 59% 41%
14%
38%
15% 16%
10%7%
13%
38%
18% 17%
9%
5%
14%
36%
16% 16%
10%7%
Appeal ing to younger audiences : 50% of IPL v iewers are less than 30 years of age.
Catering to af f luent audiences : NCCS A & B – combined now stands at 55% of total IPL v iewership.
25% 26%
49%
29%
23%
49%
27% 28%
45%
BARC | THE IPL PHENOMENON I 21
Share of Viewership, India 2+

Share of Viewership
The return of CSK in 2018 saw viewership shif ts in South markets l ike TN, AP/Telangana & Karnataka. The top 5 markets have grown from 55% audience share in 2016 to 58% in 2018
AP / Telangana
Assam / North East / Sikkim
Bihar/Jharkhand
Delhi
Guj / D&D / DNH
Karnataka
Kerala
Mah / Goa
MP/Chhatt isgarh
Odisha
Pun / Har / Cha / HP / J&K
Rajasthan
TN/Pondicherry
UP/Uttarakhand
West Bengal
Regions
10%
2%
4%
4%
9%
10%
4%
19%
5%
3%
8%
4%
5%
7%
6%
2016
10%
2%
3%
4%
9%
9%
3%
21%
7%
2%
5%
4%
6%
6%
8%
2017
11%
3%
3%
4%
9%
9%
3%
19%
5%
3%
5%
3%
8%
5%
9%
2018
BARC | THE IPL PHENOMENON I 22
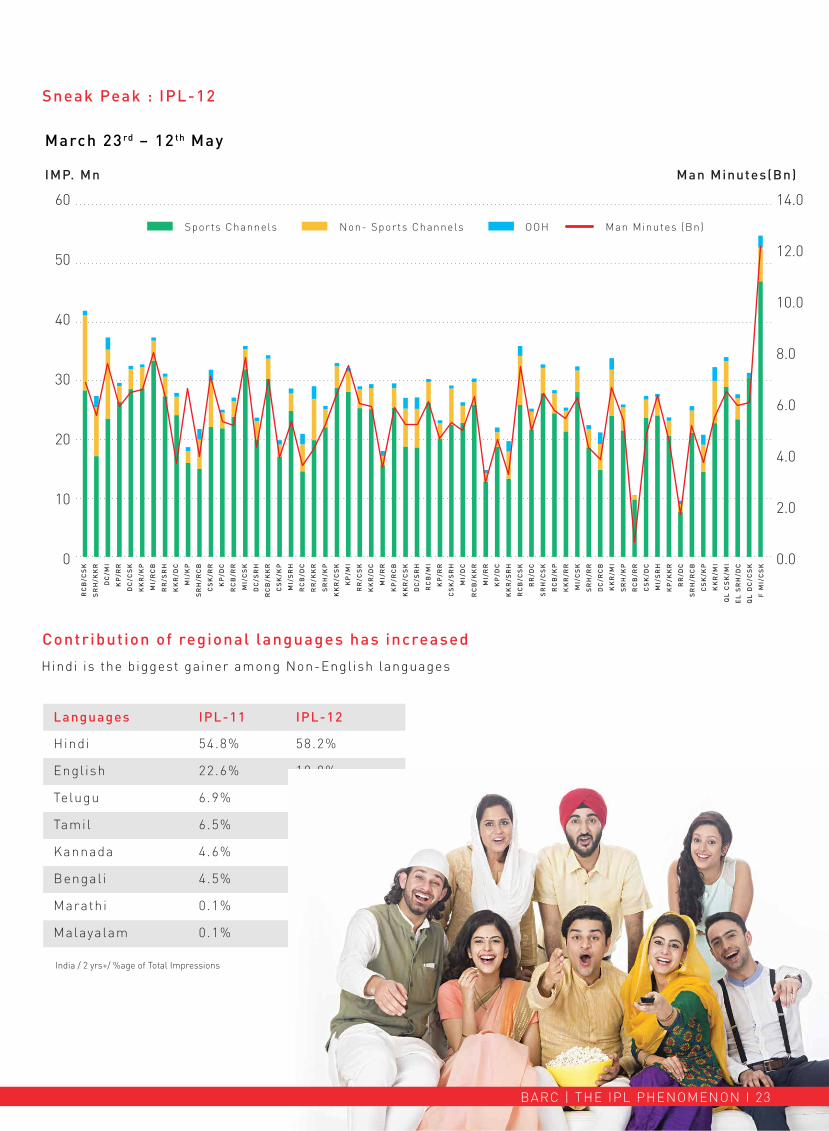
Sneak Peak : IPL-12
Contribution of regional languages has increased
March 23 rd – 12 th May
Hindi is the biggest gainer among Non-Engl ish languages
IMP. Mn Man Minutes(Bn)
Sports Channels Non- Sports Channels OOH Man Minutes (Bn)
RC
B/C
SK
SR
H/K
KR
DC
/MI
KP
/RR
DC
/CS
K
KK
R/K
P
MI/
RC
B
RR
/SR
H
KK
R/D
C
MI/
KP
SR
H/R
CB
CS
K/R
R
KP
/DC
RC
B/R
R
MI/
CS
K
DC
/SR
H
RC
B/K
KR
CS
K/K
P
MI/
SR
H
RC
B/D
C
RR
/KK
R
SR
H/K
P
KK
R/C
SK
KP
/MI
RR
/CS
K
KK
R/D
C
MI/
RR
KP
/RC
B
KK
R/C
SK
DC
/SR
H
RC
B/M
I
KP
/RR
CS
K/S
RH
MI/
DC
RC
B/K
KR
MI/
RR
KP
/DC
KK
R/S
RH
RC
B/C
SK
RR
/DC
SR
H/C
SK
RC
B/K
P
KK
R/R
R
MI/
CS
K
SR
H/R
R
DC
/RC
B
KK
R/M
I
SR
H/K
P
RC
B/R
R
CS
K/D
C
MI/
SR
H
KP
/KK
R
RR
/DC
SR
H/R
CB
CS
K/K
P
KK
R/M
I
QL
CS
K/M
I
EL
SR
H/D
C
QL
DC
/CS
K
F M
I/C
SK
0.0
2.0
4.0
6.0
8.0
10.0
12.0
14.0
0
10
20
30
40
50
60
India / 2 yrs+/ %age of Total Impressions
Hindi
Engl ish
Telugu
Tamil
Kannada
Bengal i
Marathi
Malayalam
54.8%
22.6%
6.9%
6.5%
4.6%
4.5%
0.1%
0.1%
58.2%
19.0%
8.4%
7.4%
2.7%
3.8%
0.3%
0.2%
IPL-12IPL-11Languages
BARC | THE IPL PHENOMENON I 23

BARC | THE IPL PHENOMENON I 24
11%
18%
India / 2 yrs+/ %age of Total Wt Impressions on TV
Asianet Plus, Hungama(v) , Star Suvarna, STAR Suvarna HD, Jalsha Movies, Jalsha Movies HD, Star Maa Movies, STAR Maa Movies HD, STAR Gold HD,STAR Gold, STAR Pravah, STAR Sports 1,STAR Sports 1 Tamil , STAR Sports 1 Kannada, STAR Sports 1 Telugu, STAR Sports 1 Bangla, STAR Sports 2(v) , STAR Sports 1 Hindi , STAR Sports 1 HD,STAR Sports 2 HD(v) , STAR Sports 1 HD Hindi , STAR Sports Select 1 HD, STAR Sports Select 1 SD, STAR Vi jay Super
8 regions constitute 75% of IPL viewership this year
0 5 10 15 20 25 30 35 40
5%
8%
9%
9%
8%
8%
Mah/Goa
AP /Telangana
TN/Pondicherry
Guj/D&D/Dnh
West Bengal
Karnataka
UP/Utk
MP/CG
1.58 Bn Imp
326 Bn ManMinutes
2019
Year Delhi
4%
Rajasthan
4%
Har/HP/J&K
3%
Pun/Cha
3%
Bihar/Jharkhand
3%
Assam/North East/Sikkim
3%
Kerala
3%
Odisha
2%
Channels in IPL-12:
#6
RISE IN QUANTUM OF ADVERTISING

14% growth in ads across all cricket content from 2016 to 2018
Ads in India Matches grew at 38% from 2016 to 2018
Faster Rate of growth on Live cricket
0
100
200
300
400
500
600
700
800
547K
234K 229K
309K
560K
625K
2016 2017 2018 2016 2017 2018
2016 2017 2018
111.5Kads
73Kads
87Kads
112.4Kads
101Kads
128Kads
Ads in Internat ional Matches Ads in India Playing Internat ional Matches
# Ad In 000s
BARC | RISE IN QUANTUM OF ADVERTISING I 26
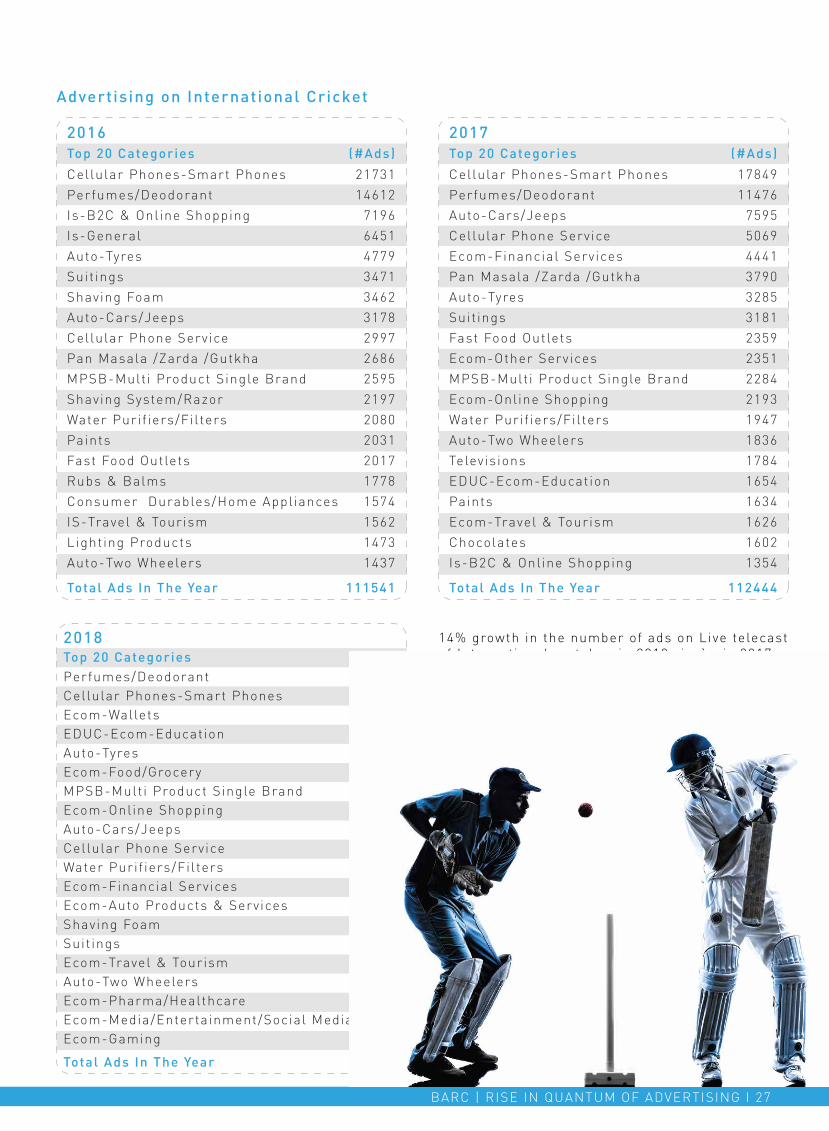
Advertising on International Cricket
2016
Cellular Phones-Smart Phones
Perfumes/Deodorant
Is-B2C & Onl ine Shopping
Is-General
Auto-Tyres
Suit ings
Shaving Foam
Auto-Cars/Jeeps
Cellular Phone Service
Pan Masala /Zarda /Gutkha
MPSB-Mult i Product Single Brand
Shaving System/Razor
Water Puri f iers/Fi l ters
Paints
Fast Food Outlets
Rubs & Balms
Consumer Durables/Home Appl iances
IS-Travel & Tourism
Lighting Products
Auto-Two Wheelers
21731
14612
7196
6451
4779
3471
3462
3178
2997
2686
2595
2197
2080
2031
2017
1778
1574
1562
1473
1437
(#Ads)Top 20 Categories
Total Ads In The Year 111541
2017
Cellular Phones-Smart Phones
Perfumes/Deodorant
Auto-Cars/Jeeps
Cellular Phone Service
Ecom-Financial Services
Pan Masala /Zarda /Gutkha
Auto-Tyres
Suit ings
Fast Food Outlets
Ecom-Other Services
MPSB-Mult i Product Single Brand
Ecom-Online Shopping
Water Puri f iers/Fi l ters
Auto-Two Wheelers
Televis ions
EDUC-Ecom-Education
Paints
Ecom-Travel & Tourism
Chocolates
Is-B2C & Onl ine Shopping
17849
11476
7595
5069
4441
3790
3285
3181
2359
2351
2284
2193
1947
1836
1784
1654
1634
1626
1602
1354
(#Ads)Top 20 Categories
Total Ads In The Year 112444
2018
Perfumes/DeodorantCellular Phones-Smart PhonesEcom-WalletsEDUC-Ecom-EducationAuto-TyresEcom-Food/GroceryMPSB-Mult i Product Single BrandEcom-Online ShoppingAuto-Cars/JeepsCellular Phone ServiceWater Puri f iers/Fi l tersEcom-Financial ServicesEcom-Auto Products & ServicesShaving FoamSuit ingsEcom-Travel & TourismAuto-Two WheelersEcom-Pharma/HealthcareEcom-Media/Entertainment/Social MediaEcom-Gaming
183918051697161575740546052695227518948503763307328212723216921371937190117611487
(#Ads)Top 20 Categories
Total Ads In The Year 128336
14% growth in the number of ads on Live telecast of Internat ional matches in 2018 v is-à-vis 2017.
BARC | RISE IN QUANTUM OF ADVERTISING I 27
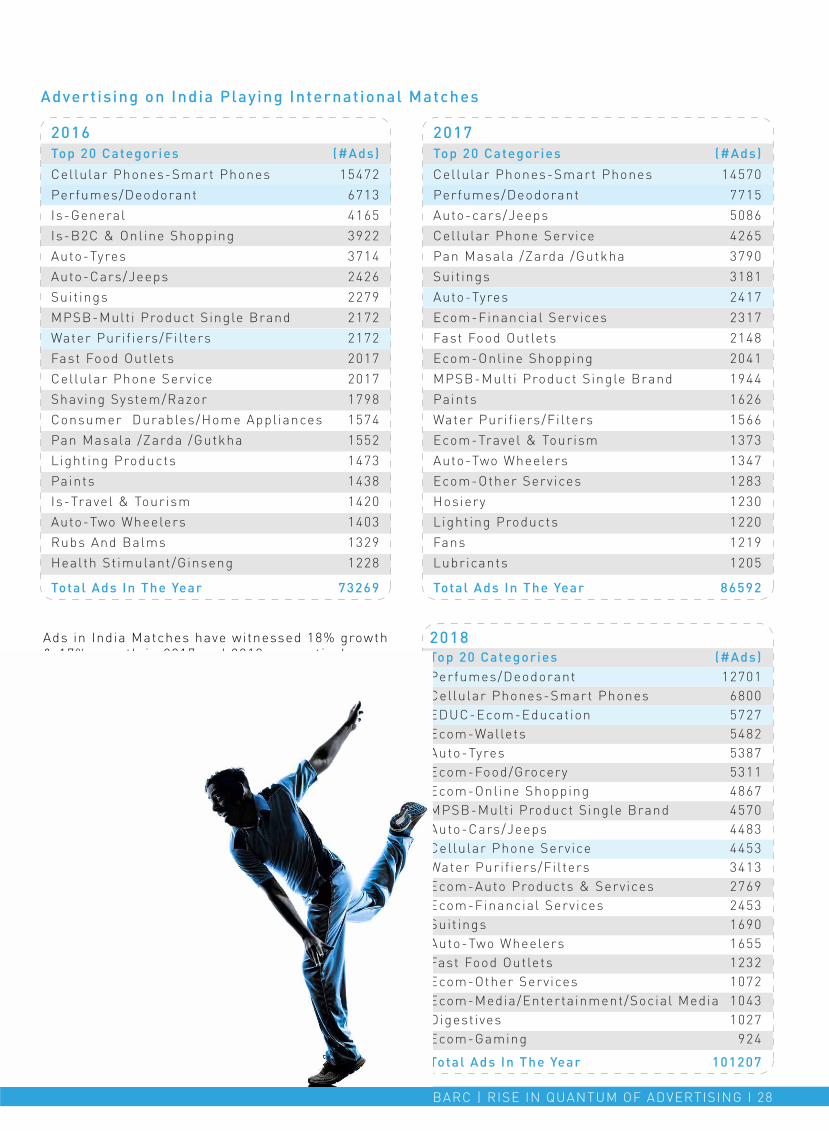
Advertising on India Playing International Matches
2016
Cellular Phones-Smart Phones
Perfumes/Deodorant
Is-General
Is-B2C & Onl ine Shopping
Auto-Tyres
Auto-Cars/Jeeps
Suit ings
MPSB-Mult i Product Single Brand
Water Puri f iers/Fi l ters
Fast Food Outlets
Cellular Phone Service
Shaving System/Razor
Consumer Durables/Home Appl iances
Pan Masala /Zarda /Gutkha
Light ing Products
Paints
Is-Travel & Tourism
Auto-Two Wheelers
Rubs And Balms
Health St imulant/Ginseng
15472
6713
4165
3922
3714
2426
2279
2172
2172
2017
2017
1798
1574
1552
1473
1438
1420
1403
1329
1228
(#Ads)Top 20 Categories
Total Ads In The Year 73269
2017
Cellular Phones-Smart Phones
Perfumes/Deodorant
Auto-cars/Jeeps
Cellular Phone Service
Pan Masala /Zarda /Gutkha
Suit ings
Auto-Tyres
Ecom-Financial Services
Fast Food Outlets
Ecom-Online Shopping
MPSB-Mult i Product Single Brand
Paints
Water Puri f iers/Fi l ters
Ecom-Travel & Tourism
Auto-Two Wheelers
Ecom-Other Services
Hosiery
Light ing Products
Fans
Lubricants
14570
7715
5086
4265
3790
3181
2417
2317
2148
2041
1944
1626
1566
1373
1347
1283
1230
1220
1219
1205
(#Ads)Top 20 Categories
Total Ads In The Year 86592
2018
Perfumes/DeodorantCellular Phones-Smart PhonesEDUC-Ecom-EducationEcom-WalletsAuto-TyresEcom-Food/GroceryEcom-Online ShoppingMPSB-Mult i Product Single BrandAuto-Cars/JeepsCellular Phone ServiceWater Puri f iers/Fi l tersEcom-Auto Products & ServicesEcom-Financial ServicesSuit ingsAuto-Two WheelersFast Food OutletsEcom-Other ServicesEcom-Media/Entertainment/Social MediaDigest ivesEcom-Gaming
12701680057275482538753114867457044834453341327692453169016551232107210431027
924
(#Ads)Top 20 Categories
Total Ads In The Year 101207
Ads in India Matches have witnessed 18% growth & 17% growth in 2017 and 2018 respect ively.
e-commerce has emerged as the dominant sector with share of ads going up from 14% in 2016 to 42% in 2018.
Smartphones & telecom ads have decreased; 24% in 2016 to 11% in 2018.
BARC | RISE IN QUANTUM OF ADVERTISING I 28

Advertising on IPL
Growth Witnessed Across Categories & Brands
IPL : Advertiser Interest Accelerated In 2018
0
20000
40000
60000
80000
100000
120000
0.00
0.20
0.40
0.60
0.80
1.00
1.20
1.40
1.60
1.80
2016 2017 2018
1.60
0.760.81
# Ads
Ad. Secondages Mn.
201820172016
CATEGORIES 57
82
138
119
TOTAL
ADVERTISERS
58
74
135
177
BRANDS
79
106
214 412
Ad.Sec Mn. # Ads
BARC | RISE IN QUANTUM OF ADVERTISING I 29

Advertising on IPL
2016
Cellular Phones-Smart Phones
Is-B2C & Onl ine Shopping
Auto-Cars/Jeeps
Pan Masala /Zarda /Gutkha
Auto-Tyres
Cellular Phone Service
Liquor-Beer
Air Condit ioners
Paints
Soft Drink Aerated
Light ing Products
Perfumes/Deodorant
Soft Drink Non Aerated
Is-Travel & Tourism
Dth Service Providers
Water Puri f iers/Fi l ters
Fans
Biscuits
Auto-Two Wheelers
Readymade Garments
6843
5715
2767
2598
2552
1798
1653
1582
1478
1421
1180
1087
900
797
777
752
604
556
531
523
(#Ads)Top 20 Categories
Total Ads In The Year 42081
2017
Cellular Phones-Smart Phones
Cellular Phone Service
Air Condit ioners
Auto-Two Wheelers
Auto-Cars/Jeeps
Auto-Tyres
Wires & Cables
Fans
Biscuits
Ecom-Online Shopping
Pan Masala /Zarda /Gutkha
Soft Drink Non Aerated
Hosiery
Paints
Ecom-Travel & Tourism
Banking-Retai l Banking
Retai l Outlets-Departmental Stores
Corporate-Sports
Ti les & Floorings
Water Puri f iers/Fi l ters
10728
4068
3085
2618
2152
1899
1746
1651
1587
1538
1460
1444
1225
1192
1156
887
682
546
530
523
(#Ads)Top 20 Categories
Total Ads In The Year 47541
2018
Cellular Phones-Smart PhonesCellular Phone ServicePan Masala/Zarda/GutkhaPaintsSoft Drink Non AeratedAir Condit ionersAuto-Sars/JeepsMPSB-Mult i Product Single BrandAuto-TyresBiscuitsSoft Drink AeratedWater Puri f iers/Fi l tersFansEcom-Travel & TourismCellular PhonesEcom-Food/GroceryAuto-Two WheelersEDUC-Ecom-EducationEcom-Financial ServicesRetai l Outlets-Departmental Stores
138268424599752103724366533083307323032173120263724012395218721471750158815291516
(#Ads)Top 20 Categories
Total Ads In The Year 101242
Smartphones & telecom dominate with 24% of ads in 2018.
Share of e-commerce ads increase; 7% in 2016 to 17% in 2018. 2017 however, saw a peak with 29% of ads from e-commerce.
Auto sector ads move southwards : from 14% in 2016 to 8% in 2018.
BARC | RISE IN QUANTUM OF ADVERTISING I 30

Advertising on IPL -12
2019
Cellular Phones-Smart Phones
Auto-Cars
Pan Masala /Zarda /Gutkha
Ecom-Gaming
Paints
Ecom-Wallets
Soft Drink Non Aerated
EDUC-Ecom-Education
Perfumes/Deodorant
Ecom-Food/Grocery
Ecom-Media/Entertainment/Social Media
Air Condit ioners
Soft Drink Aerated
Auto-Tyres
Ecom-Travel & Tourism
Refrigerators
Cellular Phone Service
Fans
Fast Food Outlets
Chocolates
30253
12026
10452
10202
9469
8896
8296
7456
7392
6862
6789
6316
5374
4790
4533
4303
3909
3706
3672
3153
(#Ads)Top 20 Categories
Total Ads on IPL-12 212493
Ad volumes grew over 100% in IPL-12 vis-à-vis IPL -11# Ads
Ad. Secondages Mn.
2018 2019
246 brands from 95 categories were advert ised in this period. 158 brands were advert ised on l ive as well as match highl ights.
Top 10 categories contr ibuted to 52% of the ads telecast.
Services led by ecommerce brands has made a comeback as the top sector this season with 24% ads.
Smartphones ads by 5 advert isers clocked 14.2% of al l ads and emerges as the top category this IPL season fol lowed by Auto-Cars with 5.7% of ads.
# Ads
3.23
1.60
Ad.Sec Mn.
BARC | RISE IN QUANTUM OF ADVERTISING I 31
0.0
0.5
1.0
1.5
2.0
2.5
3.0
3.5
0
50000
100000
150000
200000
250000
BARC CRICKET VIEWERSHIP IS ON THE RISE I 05
#7
OTHER EMERGING COHORTS

Prest igious legacy tournaments l ike Ranj i Trophy, Duleep Trophy etc hold their ground in the midst of the more popular T20 format.
Domestic Cricket growing on the back of T20 matches
Domestic Cricket
203
2016 2017
296
2018
399
Durationin Hours 1188 1410 1878
2016 2017 2018
Domestic cricketcontent on the rise as well
ODI T20 TEST
0
500
1000
1500
2000
2016 2017 2018
T20 formatdominates viewership
0
50
100
150
200
250
300
350
400
ODI T20 TEST
Nor. Imp. Mn Hours
ViewershipNor. Imp. Mn
BARC | OTHER EMERGING COHORTS I 33

Consistent on-air presence by leagues begets v iewership. The Big Bash League and Caribbean Premier League are examples of this phenomenon
Other T20 Leagues
Nor. Imp. Mn.
0 100 200 300
2016
2017
2018
Viewership
BPL - BangladeshNatwest T20 Blast
PSL - PakistanGT20 - Canada
BBL - Austral iaAPL - AfghanistanCSA - SA
CPL - WIMzansi - SASuper Smash - NZ
0 300 600 900 1200
2016
2017
2018
Airt ime of International Leagues
BPL - BangladeshNatwest T20 Blast
PSL - PakistanGT20 - Canada
BBL - Austral iaAPL - AfghanistanCSA - SA
CPL - WIMzansi - SASuper Smash - NZ
Hours
BARC | OTHER EMERGING COHORTS I 34

Women’s Cricket – scoring on yield
Women’s Cricket driven by Indian matches
0
100
200
300
400
500
448
2016 2017 2018
128
65
All Matches India Matches
World Cups in 2016 and 2017 witnessed high viewership for Women’s Cricket
0 100 200 300 400 500
2016
2017
2018
Nor. Imp. Mn
Nor. Imp. Mn
Ashes Asia Cup Challenger TrophyICC WC T20 India SA - T20 India tour of Austral iaDomestic T20 Rebel WBBL South Afr ica tour of EnglandODI T20 WC T20WC-17
BARC | OTHER EMERGING COHORTS I 35
199 Hours
285 Hours
400 Hours
2016
2017
2018

BARC CRICKET VIEWERSHIP IS ON THE RISE I 05
#8
SUMMARY
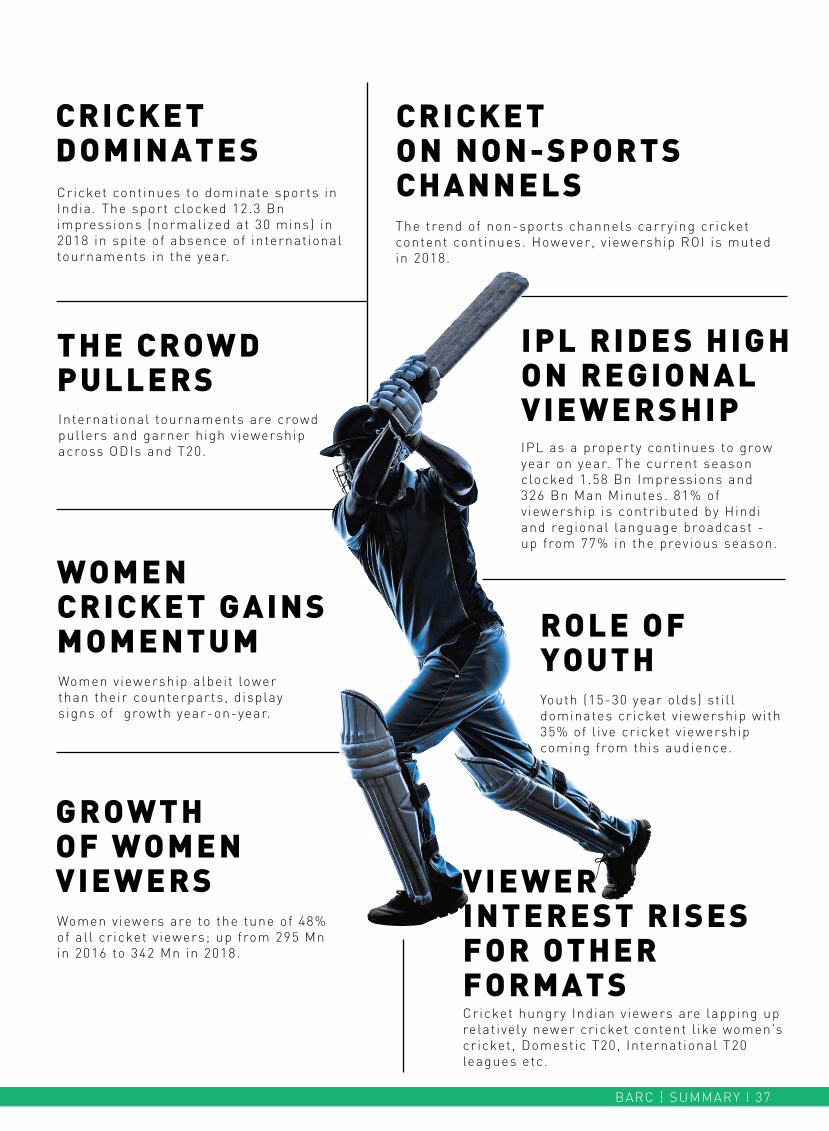
Internat ional tournaments are crowd pullers and garner high v iewership across ODIs and T20. IPL as a property cont inues to grow
year on year. The current season clocked 1.58 Bn Impressions and 326 Bn Man Minutes. 81% of v iewership is contr ibuted by Hindi and regional language broadcast - up from 77% in the previous season.
Women viewership albeit lower than their counterparts, d isplay s igns of growth year-on-year.
Youth (15-30 year olds) st i l l dominates cr icket v iewership with 35% of l ive cr icket v iewership coming from this audience.
Cricket hungry Indian v iewers are lapping up relat ively newer cr icket content l ike women’s cr icket, Domestic T20, Internat ional T20 leagues etc.
The trend of non-sports channels carrying cr icket content cont inues. However, v iewership ROI is muted in 2018.
Women viewers are to the tune of 48% of al l cr icket v iewers; up from 295 Mn in 2016 to 342 Mn in 2018.
GROWTHOF WOMENVIEWERS
IPL RIDES HIGH ON REGIONAL VIEWERSHIP
THE CROWD PULLERS
WOMEN CRICKET GAINS MOMENTUM
VIEWER INTEREST RISES FOR OTHER FORMATS
CRICKET ON NON-SPORTS CHANNELS
ROLE OF YOUTH
BARC | SUMMARY I 37
Cricket cont inues to dominate sports in India. The sport clocked 12.3 Bn impressions (normalized at 30 mins) in 2018 in spite of absence of internat ional tournaments in the year.
CRICKETDOMINATES


[email protected] us on Twi�er: @BARCIndia
CONTACT US
Images Courtesy - www.imagesbazaar.com / www.shutterstock.com