introduction to x ray crystallography - gerstein lab
TRANSCRIPT

Jesse Rinehart
Department of Cellular & Molecular PhysiologySystems Biology Institute
Introduction to X‐ray Crystallography

Contributions to this lecture:
Yong Xiong, PhDYale, Department of Molecular Biophysics & Biochemistry
Yufeng Zhou, PhDYale, Department of Cellular & Molecular Physiology
Recommended Course @ Yale: MB&B 720a Macromolecular Structure and Biophysical Analysis
Additional Resources:
Crystallography Made Crystal Clear: A Guide for Users of Macromolecular Modelsby Gale Rhodes (Third Edition, 2006 Elsevier/Academic Press)
CMCC Home Page: http://spdbv.vital‐it.ch/TheMolecularLevel/CMCC/index.html
“Crystallography 101” http://www.ruppweb.org/Xray/101index.html
“Introduction to X‐ray crystallography” http://vimeo.com/7643687
http://ucxray.berkeley.edu/~jamesh/movies/movies demonstrating diffraction, resolution, data quality, and refinement.
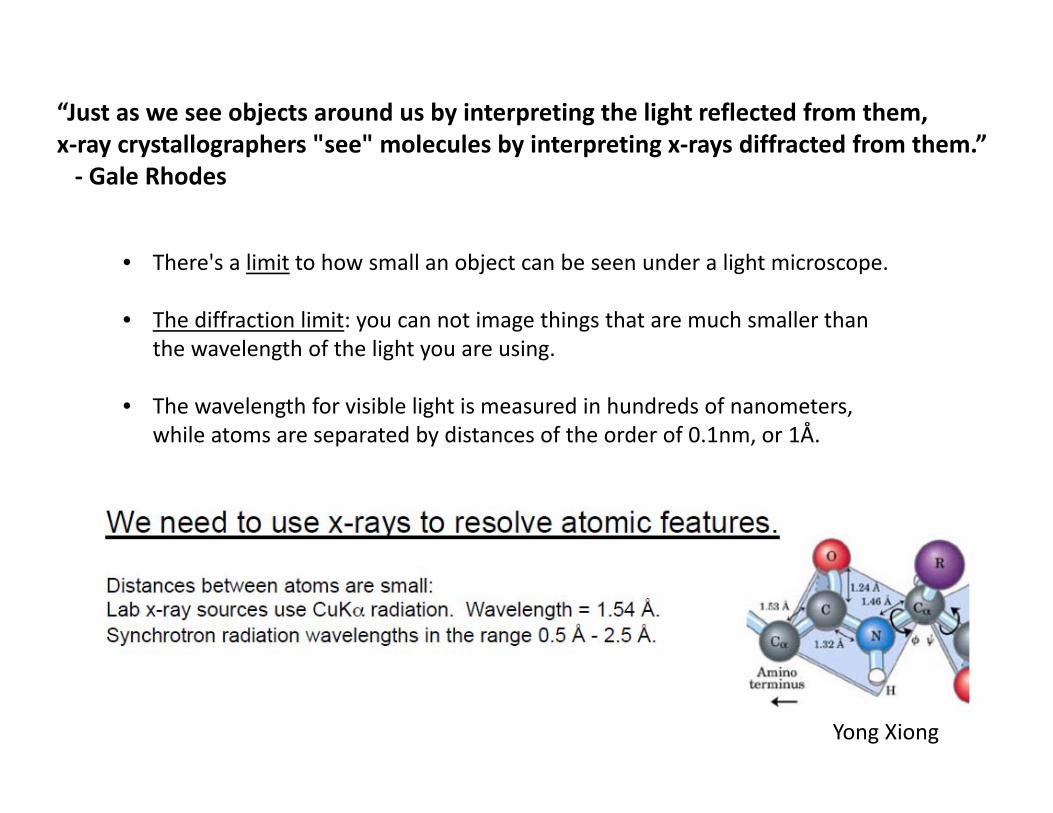
• There's a limit to how small an object can be seen under a light microscope.
• The diffraction limit: you can not image things that are much smaller than the wavelength of the light you are using.
• The wavelength for visible light is measured in hundreds of nanometers, while atoms are separated by distances of the order of 0.1nm, or 1Å.
Yong Xiong
“Just as we see objects around us by interpreting the light reflected from them, x‐ray crystallographers "see" molecules by interpreting x‐rays diffracted from them.”‐ Gale Rhodes

Experimental Determination of Atomic Resolution Structures
X‐ray
X‐raysDiffractionPattern
Direct detection ofatom positions
Crystals
NMR
RFRFResonance
H0
Indirect detection ofH-H distances In solution
Other methods for determining protein structures:‐EM, Cryo‐EM, ESR/Fluorescence

http://www.noble.org/PlantBio/Wang/crystallography.htmlYufeng Zhou

Why Crystals?
Yong Xiong

Yong Xiong
Some Crystallization Methods:

Data Collection
Crystallography 101

NSLS BNL ALS Berkeley
APS Chicago CHESS Ithaca
Synchrotron X‐ray SourcesLab x‐ray sources @ 1.54 Å VS. Synchrotron @ 0.5 Å ‐ 2.5 Å.

Image of diffraction

Most famous X‐ray diffraction pattern

Most famous X‐ray diffraction pattern

• © 2006• Academic Press

The information we get from a single diffraction experiment
a
b
c
(b) unit cell dimensions
Analyze the pattern of the reflections
(a) space group of the crystal

Yong Xiong

• © 2006• Academic
Press
Electron density map
Building a structure model

The importance of resolution
Experimental electron density map created from multi‐wavelength data collected at SSRL beam line 1‐5 on a Gold derivative of tetanus C fragment.
Example of high quality Experimental datawhere very little refinement has been appliedto fit a tyrosine into the density map.
http://www.ruppweb.org/Xray/101index.html

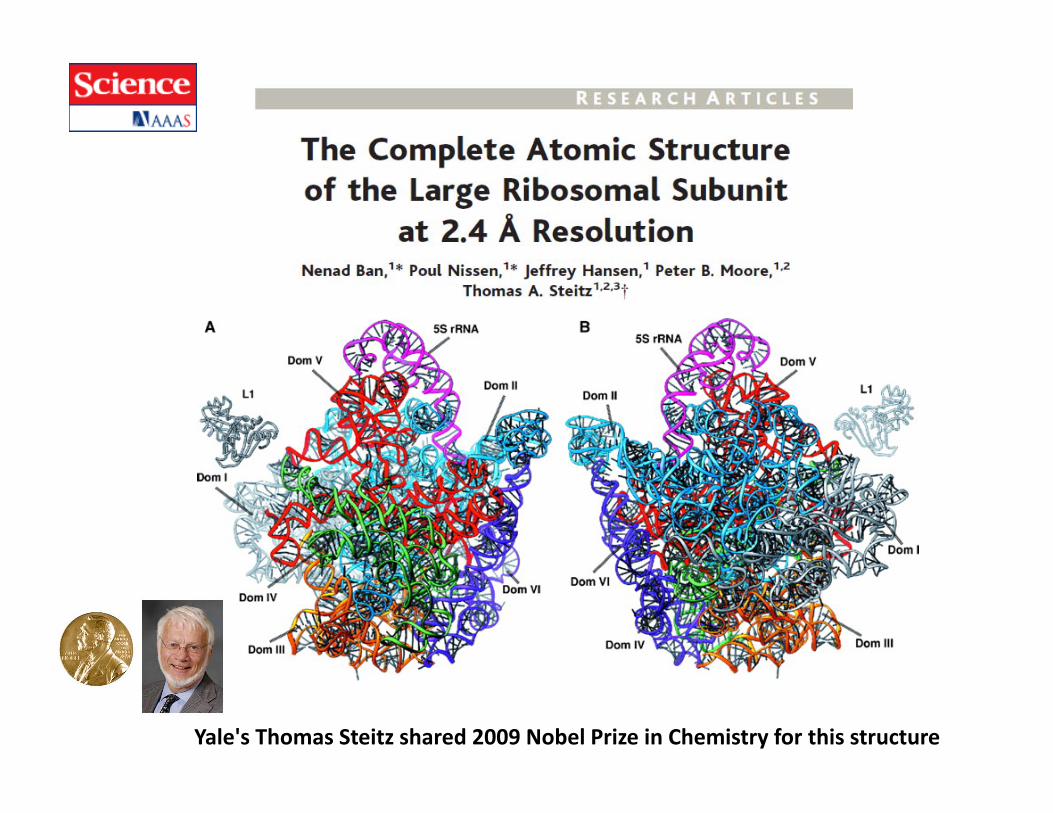
Yale's Thomas Steitz shared 2009 Nobel Prize in Chemistry for this structure


PDB Growth
What species are the structures from?
PDB has~ 70,000 structuresexample:~ 1,000 membrane proteins
CummulativeYearly total

Tools for Viewing Structures• Jmol
– http://jmol.sourceforge.net• PyMOL
– http://pymol.sourceforge.net• Swiss PDB viewer
– http://www.expasy.ch/spdbv• Mage/KiNG
– http://kinemage.biochem.duke.edu/software/mage.php– http://kinemage.biochem.duke.edu/software/king.php
• Rasmol– http://www.umass.edu/microbio/rasmol/