investigating the campus cycling...
TRANSCRIPT

INVESTIGATING THE CAMPUS CYCLING ENVIRONMENT
OF A LARGE SOUTHEASTERN UNIVERSITY FROM
AN ECOLOGICAL PERSPECTIVE
by
MARGARET M. SHIELDS
ANGELIA PASCHAL, COMMITTEE CHAIR STUART USDAN
MELANIE TUCKER BRIAN GORDON JAMES LEEPER
A DISSERTATION
Submitted in partial fulfillment of the requirements for the degree of Doctor of Philosophy in the Department of Health Sciences
in the Graduate School of The University of Alabama
TUSCALOOSA, ALABAMA
2015

Copyright Margaret M. Shields 2015 ALL RIGHTS RESERVED

ii
ABSTRACT
Cycling is an effective method to address physical, psychological, and environmental
health. As an alternative mode of transport, it can also be more economical compared to motor
vehicles. Despite these benefits, cyclists run a moderately high risk of being injured on the road
or in a vehicular accident. According to a survey completed by the National Highway Traffic
Safety Administration, 88% of cyclists felt most threatened by motorists on the road and 37%
perceived uneven walkways and roadways were a threat to personal safety.
The purpose of this study was to examine college student perceptions of safety and
factors contributing to campus cycling from an ecological perspective. Intrapersonal,
interpersonal, and institutional factors associated with safety and campus cycling were assessed
as well as how they interacted with each other. A survey was developed and administered to
students on a large southeastern public university.
The sample of 356 participants indicated that certain intrapersonal level factors were
predictors of cycling, including bike specific issues (e.g., concerns about general bike
maintenance) and personal appearance (e.g., looking “silly while wearing a helmet).
Interpersonal cycling factors (e.g., concerns about interacting with motor vehicle drivers) were
not statistically significant. However, institutional cycling factors, including institutional
barriers (e.g., busy roads) and institutional facilitators (e.g., establishing more bike lanes and
covered parking), were predictors of cycling.

iii
The study findings provide guidance to university stakeholders about what specific
factors are prioritized and deemed more likely to facilitate cycling among students. Cycling has
been found to be very beneficial, as it has been associated with reduced traffic, improved
parking, and better ease of transport on campus. Therefore, these suggestions have implications
for environmental and structural changes, policy development, and program planning.
iv
DEDICATION
This dissertation is dedicated to my nieces and nephews. I hope this hard work inspires
them to believe nothing is impossible.
“Congratulations! Today is your day. You’re off to great places! You’re off and away!
And will you succeed? Yes! You will indeed (98¾% guaranteed).
Kid, you’ll move mountains!”
-Dr. Seuss

v
LIST OF ABBREVIATIONS AND SYMBOLS
a Cronbach’s index of internal consistency
ACHA American College Health Association
ACSM American College of Sports Medicine
BAG Bike Advisory Group
BFU Bicycle Friendly University
CDC Centers for Disease Control and Prevention
CI Confidence Interval
f Frequency
HBM Health Belief Model
LAB League of American Bicyclists
NHTSA National Highway Transportation Administration
OR Odds ratio: an association between an exposure and an outcome p Probability associated with the occurrence under the null hypothesis of a value as
extreme as or more extreme than the observed value SEM Social Ecological Model UA University of Alabama

vi
ACKNOWLEDGMENTS
“The journey of a thousand miles begins with a single step,” (Japanese Proverb) and the
journey of a dissertation begins with a single word. I am first and foremost thankful for my
husband, Kevin, who kept reminding that I would make it through and continually supported me.
Second, to my family (both blood and adopted) that cheered me on, called me, and took me out
for meals. Every bit is remembered and dear to my heart. I am grateful for all of the little voices
in my life that cheered me on during this chapter. From my nieces, Nana and Grandpa, athletes,
students, and friends who spoke words of comfort and love. It takes a village to raise a child as
well as complete a degree and they are the best! Finally, I am so thankful for every 9:30 phone
call from dad after I got off work. Whether it was words of encouragement or about the weather,
it was always nice knowing that he is always there for me.
To my committee chair, Dr. Paschal has been my mentor and friend in this journey. “It’s
not where you go, its who you meet along the way!” I am grateful for all of the help along the
way and words of encouragement. Every meeting we had, I came out feeling a little better about
the process. To Dr. Tucker, thank you for helping me from day one and reminding me that I am
good enough to be in the program. To Dr. Leeper, thank you for helping me sort out my
promiscuous stats. To Drs. Usdan and Bolland, you were encouragement, direction and support
along the way. Dr. Gordon, thank you for stepping in and helping when I needed it! I am
grateful to all of you!

vii
CONTENTS
ABSTRACT ............................................................................................................ ii
DEDICATION ....................................................................................................... iv
LIST OF ABBREVIATIONS AND SYMBOLS ................................................... v
ACKNOWLEDGMENTS ..................................................................................... vi
LIST OF TABLES .................................................................................................. x
1. INTRODUCTION .............................................................................................. 1
a. Purpose & Significance ...................................................................................... 2
b. Implications ......................................................................................................... 3
c. Research Questions ............................................................................................. 5
d. Assumptions ........................................................................................................ 5
e. Delimitations ....................................................................................................... 6
f. Limitations ........................................................................................................... 7
g. Terminology ........................................................................................................ 8
2. REVIEW OF LITERATURE .......................................................................... 11
a. Introduction ...................................................................................................... 11
b. Bikeability ........................................................................................................ 12
c. History of the Bicycle ...................................................................................... 13
d. The Bikeable Environment .............................................................................. 14
e. Population that Currently Cycles ...................................................................... 20
f. Health ................................................................................................................. 21
viii
g. Physical Activity ............................................................................................... 22
h. Healthy Campus 2020 ....................................................................................... 25
i. Health Statistics ................................................................................................. 26
j. How Cycling Improves University Campuses ................................................... 30
k. Challenges to Cycling on Campus .................................................................... 34
l. Current Research on Cycling ............................................................................. 42
m. Social Ecological Model .................................................................................. 46
n. Health Belief Model .......................................................................................... 50
o. Purpose .............................................................................................................. 52
3. METHODOLOGY ........................................................................................... 53
a. Institutional Review Board Approval ............................................................... 53
b. Participant Recruitment .................................................................................... 53
c. Data Collection .................................................................................................. 55
d. Survey Instrument ............................................................................................. 55
e. Piloting the Survey ............................................................................................ 62
f. Survey Completion ............................................................................................ 62
g. Data Analysis .................................................................................................... 63
h. Research Questions ........................................................................................... 63
i. Summary ............................................................................................................ 65
4. RESULTS ......................................................................................................... 67
a. Data Source ...................................................................................................... 68
b. Sample Characteristics ..................................................................................... 68
c. Missing Data .................................................................................................... 72
ix
d. Analysis of Research Questions ....................................................................... 73
e. Summary .......................................................................................................... 91
5. DISCUSSION & CONCLUSIONS .................................................................. 93
REFERENCES ................................................................................................... 108
APPENDICES .................................................................................................... 130
x
LIST OF TABLES
2.1 Bikeability Standards for Diamond and Platinum Statuses ............................ 16
2.2 2014 Bikeability Rates for Alabama ............................................................... 18
3.1 Questions Specific to the Health Belief Model ............................................... 58
3.2 Survey Questions: Health Belief Model Constructs ....................................... 60
3.3 Survey Questions: Social Ecological Model Constructs ................................ 61
4.1 Student Demographics ................................................................................... 69
4.2 Student Health Status & Physical Activity ..................................................... 70
4.3 Safety Perceptions of Students ........................................................................ 71
4.4 Cycling Prevalence in Student Sample ........................................................... 74
4.5 Cyclist Demographics ..................................................................................... 76
4.6 Logistic Regression Analysis of the Population in Comparison of Cyclists vs. Non-Cyclists ............................................................................... 77
4.7 Multivariate Logistic Regression Analysis of the Population in Comparison of Cyclists vs. Non-Cyclists ...................................................... 78
4.8 Intrapersonal Cycling Factors ......................................................................... 79
4.9 Intrapersonal Cycling Factor Results .............................................................. 81
4.10 Interpersonal Cycling Factors ....................................................................... 82
4.11 Interpersonal Cycling Factor Results ............................................................ 83
4.12 Institutional Cycling Factors ......................................................................... 84
4.13 Institutional Cycling Factor Results .............................................................. 86

xi
4.14 Descriptives of Each of the Scored Questions .............................................. 88
4.15 Descriptives of Each of the Social Ecological Model Levels ....................... 89
4.16 Suggestions from the 2014 Cycling Survey for the University of Alabama ............................................................................... 90
4.17 Additional Comments from the 2014 Cycling Survey for the University of Alabama .............................................................................. 91

1
CHAPTER ONE
INTRODUCTION
In 2012, cycling accounted for 726 traffic deaths in the U.S., which was a six percent
increase from the previous year (NHTSA, 2014). Of the cycling deaths, 69% occurred in urban
areas, 60% occurred at non-intersection areas of the road, and 48% occurred between 4:00 p.m.
and 11:59 p.m. Ninety-five of the people killed in cycling accidents were between 16 and 24
years old; cycling rates among male cyclers were four times higher than female cyclers
(NHTSA, 2014). Another 49,000 cyclists were injured during the same year.
Between 2002 and 2011, there were a total of 2,041 reported injuries and 72 fatalities in
the state of Alabama (CAPS, 2012). Alabama ranked 50th in the nation for bikeability in 2013,
which was a decrease from the previous year (League of American Bicyclists, 2014a).
Alabama’s highest performing categories were “Policies & Programs” and “Education &
Encouragement” which scored between 20-40% out of 100%. For the purpose of this paper,
bikeability is defined as an assessment of an area or community for numerous aspects of bicycle
use including the laws and policies, safety, education, and promotion as well as the general
acceptance or use of bicycles in the area (Lowry, Callister, Gresham & Moore, 2012).
National efforts to improve bikeability have been made by a number of federal agencies
including the US Department of Transportation, Environmental Protection Agency and Centers
for Disease Control and Prevention (CDC) (Lynott et al. 2009; EPA, 2009; American Academy
of Pediatrics, 2009). Each of these agencies promotes cycling as a way to improve health,

2
reduce air pollution and the consumption of non-renewable energy, and an economic mode of
transportation. However, despite efforts, there has only been a 0.09% increase in the total of
cyclists in the United States since 1994 (Flusche, 2010). The total cycling population increased
from 9,463 to 24,428 (US Census, 2010b, c).
Researchers in a number of cities and universities worldwide have conducted studies
about cycling as a method of active transport. However, the majority of these studies are
international (Scheeper et al., 2013; Molina-Garcia, Sallis & Castillo, 2014; Agarwal & North,
2012); only a handful were conducted in the United States (Shepherd, 2008; Sallis, Frank,
Saelens, & Kraft, 2004; Troped, Saunders, Pate, Reininger, & Addy, 2003). Minimal studies
have documented active transport on a college campus in the U.S. (Bopp, Kaczynski, &
Wittman, 2011; Bonham & Koth, 2010; Sisson & Tudor-Locke, 2008), which presents a
significant knowledge gap about active transport among this population. The proposed study
addressed this gap, utilizing the Health Belief Model and the Social Ecological Model.
Purpose and Significance
The University of Alabama student population has grown substantially over the past
years. For instance, the campus population increased from 20,969 in 2004 to 34,852 in 2013
(University of Alabama, 2013; University of Alabama, 2014; UA News, 2013). In turn, this
growth has increased the motor vehicle traffic on campus. These trafficking concerns and
consequent safety issues have prompted the University to address these problems. There is
currently an initiative on campus in coordination with the Bike Advisory Group (BAG), which
is employees of the facilities, recreation and police departments, to increase the public safety
of pedestrians and cyclists and to decrease the amount of motor vehicles (Crimson White Staff,
2014). This effort will help reduce the incidence of pedestrian and cyclist injuries, and it

3
coincides with the Healthy People 2020 initiatives to increase physical activity and
environmental health for the campus (USDHHS, 2014c).
Before campus stakeholders can curb the rate and population of motor vehicle traffic, it
is important to address active commuting issues and safety on university campuses (Mapes,
2007). Data collected from the campus population will help identify the necessary perceived
changes and barriers of cycling. The current study will provide information from the
perspectives of students about factors that are helpful, serve as barriers, and that are needed to
promote cycling. The results will provide the UA Bike Advisory Group and other campus
stakeholders with information needed to improve campus cycling.
The purpose of this study was to examine college student perceptions of safety and
factors contributing to campus cycling from an ecological perspective. Intrapersonal,
interpersonal, and institutional factors associated with safety and campus cycling were assessed,
as well as how these influences interacted with each other. Recommendations for improving
safety in university cycling were also obtained.
Implications
This study consisted of a sample of students from the University of Alabama to
investigate the factors associated with campus cycling and to provide potential strategies for
change. Currently, there is no research that provides this information from a southeastern
university. By analyzing ecological levels, researchers are able to look beyond the use of other
models which focus on individual factors that contribute to behavior, and they are able to
consider other levels of influence, including environmental and behavioral factors (Stokals,
1996). This approach brings multiple facets of research together and analyzes the relationship
between individual levels. The resulting information will help stakeholders of the university and
4
health educators to successfully disseminate health campaigns throughout the population to
create or change beliefs and attitudes to reduce the barriers surrounding cycling for health and
wellness.
Furthermore, stakeholders from the University of Alabama are advocating for the
importance and benefits of cycling on campus. The current research provides UA stakeholders
information from the students’ perception to help make informed decisions that would affect the
environmental and physical wellness of the university. To accomplish this feat, the population
and stakeholders need to move toward an environment of sustainable and active transport. This
study will help campus planners better understand the needs and desires of the population. The
information will also help make informed changes to community and policy levels as a method
of intervention.
Increased prevention efforts are needed to address chronic disease (Wu & Green, 2000).
Physical activity, including cycling, can be used as a means for reducing and preventing the rates
of chronic disease (Nelson et al., 2007; King et al., 1995). The results of this study will
potentially benefit the field of health promotion by making a connection between cycling and
student perceptions of safety. This data can then be used to address community and policy levels
of the Social Ecological Model to advocate for physical activity (King et al., 1995). Additionally,
campus programs which incorporate a theoretical framework such as the Health Belief Model
and that target student perceptions could help the UA campus and others like it to better
understand how cycling could be incorporated throughout campus life as a means of chronic
disease prevention.

5
Research Questions
The following research questions were investigated.
Research Question 1: Of the population sampled, what is the prevalence of on-campus
cycling at the University of Alabama?
Research Question 2: How does campus cycling differ between demographic subgroups
at the University of Alabama?
Research Question 3: Which factors facilitate or hinder cycling behaviors at the
University of Alabama?
Subquestion A: Which intrapersonal factors facilitate or hinder cycling behaviors?
Subquestion B: Which interpersonal factors facilitate or hinder cycling behaviors?
Subquestion C: Which institutional factors facilitate or hinder cycling behaviors?
Research Question 4: What strategies or suggestions for improving campus cycling are
recommended by students at the University of Alabama?
Assumptions
Assumptions are the elements of the study that are identified and accepted by the
researchers without control or burden of proof (Simon, 2011). In this study, there are four
assumptions:
1. Theory and model assumption: It is assumed that the Health Belief Model and the
Social Ecological Model will adequately describe the cycling perception of the
University of Alabama student population and explain the adoption of cycling on
campus.

6
2. Instrument assumption: It is assumed that the “Cycling Survey for the University of
Alabama” will capture the perceptions of the campus student population that are
needed for data collection.
3. Respondent assumption: It is assumed that the students will be able to complete the
instrument to the satisfaction of the researchers.
4. Distribution assumption: It is assumed that the professors at the University of
Alabama will adequately promote and distribute the survey to the student population.
Delimitations
Delimitations are the elements that limit the scope and define boundaries the study which
is controlled by the research (Simon, 2011). These factors include the objectives, research
questions, theoretical framework, and population of interest. One of the delimitations of this
study is the subject of the research. Research on cycling a southeastern university has not
previously been conducted. Since stakeholders of the university are working to make the
campus ‘cycling friendly’, this is an appropriate time for this to take place.
In addition, another delimitation is the research questions, which informed the survey
instrument questions. The survey questions are simple and anticipate participant perceptions
while addressing both the social ecology and perceptions of safety.
Another delimitation is the combination of model and theory used for the study. The
Social Ecological Model (SEM) provides a framework for understanding human behavior and its
interaction with the social and physical environments (Bronfenbrenner, 1979). The SEM helps
stakeholders to better understand how the population views themselves within various levels of
ecology. The Health Belief Model (HBM) provides knowledge to researchers regarding how
7
perceptions of safety influence a person’s decision to cycle (Quine, Rutter & Arnold, 1998). This
model weighs perceived threat of safety against the perceived benefits of cycling to determine
attitudes and beliefs of health and cycling. Both the SEM and HBM are compatible in
researching cycling in this study.
The final delimitation is the population of interest. This study consists of a population of
students, ages 17-24 years, at a large southeastern United States university. All participants must
be currently enrolled in the university to take part in the study.
Limitations
There are a number of limitations regarding this research. This data was collected from a
convenience sample, which is one of the most common forms of data collection (Farrokhi,
2012). Although convenience sampling in this study can lead to adequate data collection the
findings may not be fully representative of the campus population. Convenience sampling is less
expensive, easy to implement, and can result in a random sample (Freedman, 2009). However,
this can also result in a biased sample and its findings may not be applicable to the population as
a whole. Given the nature of this investigation, which also presents minimal risk to student
participants, convenience sampling is acceptable.
Data are self-reported, which could be problematic in recall or reluctance in answering
questions (Northrup, 1996). The survey instrument is designed to provoke honesty from the
individual for the best study results. In addition, misreporting is associated with sensitivity and
threat. Since the questions are non-sensitive, it is reasonable to conclude that misreporting will
be minimal (Northrup, 1996).

8
Terminology
General Study Terms
Active Transport. The act of walking or cycling to work.
Bikeability. An assessment of an area or community for numerous aspects of bicycle use
including the laws and policies, safety, education, and promotion and the general acceptance or
use of bicycles in the area.
Cycling. The act of utilized a human propelled one, two, or three-wheeled cycle for the
act of exercise, leisure, utility or commute.
Cyclist. A person, male or female, that engages in cycling.
Distracted Driving. Operating a motor vehicle while texting, talking on the phone,
listening to music, eating and drinking, grooming or putting on makeup, using a navigation
system, or watching a video.
Motor Vehicle. Any mode of transportation that requires any form of motor, electric, or
fuel. This includes passenger vehicles, utility vehicles, and motorcycles.
Velodrome. A track designed for cycling (Merriam-Webster, n.d.)
Social Ecological Model Definitions
Social Ecological Model. A health model that considers that interplay of five complex
factors: intrapersonal, interpersonal, institutional, community, and policy (Bronfenbrenner,
1979).
Intrapersonal. A level of the Social Ecological Model that refers to biological and
personal factors that contributes to health behaviors.

9
Interpersonal. A level of the Social Ecological Model that refers to closer relationships
that influence behaviors, including close social peers, partners, and family members
(Bronfenbrenner, 1979).
Institutional. A level of the Social Ecological Model that refers to the organizational
characteristics, formal rules, and operative regulations of a social institution. This includes
campus climate, schedules, built environment, and common spaces (Bronfenbrenner, 1979).
Community. A level of the Social Ecological Model that refers to settings in which a
person dwells, such as schools, workplaces, church, and neighborhoods (Bronfenbrenner, 1979).
Policy. A level of the Social Ecological Model that refers to local, state, and national
laws or policies (Bronfenbrenner, 1979).
Health Belief Model Definitions
Health Belief Model: A model for the prediction of health behavior (Rosenstock, 1974).
Cues to Action: A construct of the Health Belief Model that refers to the reminders and
other elements that remind an individual of a new health behavior (Glanz, 2008).
Perceived Barriers: A construct of the Health Belief Model that refers to the belief that
an action or factor will have negative consequences on the individual (Glanz, 2008).
Perceived Benefits: A construct of the Health Belief Model that refers to the belief or
attitude that an action or factors will result in positive benefits (Glanz, 2008).
Perceived Severity: A construct of the Health Belief Model that refers to the degree to
which a behavior or factor will disrupt daily routine (Glanz, 2008).
Perceived Susceptibility: A construct of the Health Belief Model that refers to the belief
that an individual might be affected by a behavior or factor (Glanz, 2008).

10
Perceived Threat: A combination of the Perceived Susceptibility and Perceived Severity
constructs (Glanz, 2008).
Self-Efficacy: A construct of the Health Belief Model that refers to the personal
confidence that a person has toward a new behavior or factor (Glanz, 2008).

11
CHAPTER TWO
REVIEW OF LITERATURE
Introduction
Cycling is an effective method to address physical activity, psychological and
environmental health, and economic considerations (Cavill & Davis, 2003). However, cyclists
are at a moderately high risk of being injured on the road or involved in a vehicular accident
(Albert, 1999). Motor vehicles are the predominant mode of transportation, often with short
commute times in many areas, and contribute to congestion, stress, and other complications
(Bhalla, Ezzati, Mahal, Salomon & Reich, 2007). The modern traffic system is designed to be
compatible with automobiles, but not with cyclists in many areas of the country (Wegman et al.,
2010). As a result, people in the United States cycle less than any other country. Other factors
that impact low cycling rates include the lack of bike lanes and the need of cyclists to share the
road with motor vehicles (Wegman et al., 2010). Even when bicycle paths and lanes are
available, many cyclists do not utilize them due to poor construction or deterioration of the lanes,
or a lack of convenience to them.
Personal safety is an important component to using a bicycle as a main method of
transportation. According to a survey completed by the National Highway Traffic Safety
Administration (2008), 88% of cyclists felt most threatened by motorists on the road, and 37%
felt that uneven walkways and roadways were a threat to personal safety. Possible
improvements to infrastructure would likely encourage more cycling in the area. Many states,

12
cities, and college campuses across the United States encourage a bicycle friendly atmosphere
(Shinkle & Teigan, 2008). According to the American Community Survey (US Census Bureau,
2010), from 2000 to 2008 bicycle-commuting increased 43%; however, less than 1%
(approximately 0.55%) use cycling as their predominant form of transportation. Many cities
rarely exceed 5%, even though cities like Minneapolis once had a bicycle population that made
up over 20% of its normal downtown traffic (Mapes, 2009).
In 2010, six fatalities and 167 injuries to cyclists were reported in the state of Alabama.
Of these reported events, the majority of injuries and deaths occurred to riders 16 years and
older. Among others, this age group includes college students and the working class, who would
be more likely to use cycling as a form of exercise and/or alternative transportation (NHTSA,
2010).
Alabama currently ranks 50th among all other states for being cyclist friendly. Alabama
also has no strategic highway safety plan or aggressive fund for bicycle safety projects (LAB,
2012). The state has made progress by passing a “texting while driving” ban as a step towards
creating safer streets by reducing distracted driving (Alabama Department of Public Safety,
2012). However, many of the organizations that form the laws and policies of the state have yet
to assess the bikeability of the natural and built environment.
Bikeability
The term “bikeability” came from a program that was used in the United Kingdom to
improve participation in cycling and active commuting (Wahlgren & Schantz, 2011). However,
in recent years, it has become a scale as to how safe an area is for the individual cyclist. It
considers the amount and kind of bike lanes that are present, the speed limit and proximity of
motor vehicles to those on bicycles, how structurally safe the lanes are, and how accessible they

13
are from various parts of an area. To simplify, bikeability assesses an area or community’s laws
and policies, infrastructure, safety, education and promotion, as well as the general acceptance or
use of bicycles in an area (Wahlgren & Schantz, 2011).
A university’s bikeability study could help by analyzing the population that presently
cycles, the availability of parking or storage for bicycles on campus, and law enforcement.
Regulations have been in place for a number of years regarding active transport, but not the
safety of cyclists while sharing the road with motor vehicles. For example, a motor vehicle is
required to drive at least three feet from a cyclist on any given street, which is the responsibility
of the person in the car or truck (Alabama Department of Public Safety, 2014); however, there is
no control over the physical space that is given to a cyclist on the street or the behavior of the
cyclist. This has been a challenge since most infrastructures were originally built around the use
of bicycles in the early 1900s.
History of the Bicycle
Early bicycle versions had a tall stature that made riding awkward and unsafe, especially
for females (Herlihy, 2004). The “safety bicycle” was introduced in the late 1880s and became
what is known today as the modern bicycle. This design was primarily marketed to women as a
means of empowerment and freedom from their daily mundane lives. The main benefit was
people could put their feet on the ground at stop signs or for added stability. This created an
affordable and practical way to commute throughout cities. For women, driving cars was not
acceptable but cycling was encouraged. This opened doors for freedom and control in everyday
life (McClean, 2012).
By the late 1800s, bicycles had become common, with an estimated four million people
cycling. For example, by 1906, 20% of the commuters in Minneapolis were cyclists (Pfaum,

14
2011). This gave cyclists a right to the road with power in numbers. Nearly every state claimed
that bicycles had the same right to the road as motor vehicles (Mapes, 2007).
With the boom of the motor vehicle, the bicycle became less popular and recreation for
children with periodic revivals throughout the following decades. During the Great Depression
and World War II, bicycles were popular again with economic strife and gasoline rations
(McClean, 2012). The final jump was in the 1970s when the number of bikes increased by 8.3
million in two years due to the cultural shift exemplified by the first Earth Day and to the rise of
gas prices in this decade.
Currently, in the United States, cycling is more often than not for recreation and thrill
(Mapes, 2007). As a mode of transportation, it has fallen below 5% in all cities. Because of this,
the United States government has developed multi-faceted bike policies to encourage more bike-
friendly communities (US Department of Transportation, 2014).
The Bikeable Environment
Each year, the League of American Bicyclists (LAB) reviews and ranks the 50 United
States to determine which are making contributions to bike friendliness in the nation. As
previously stated, Alabama is rated 50th while other states nearby are rated much higher,
including Arkansas (38th), Mississippi (31st), Louisiana (32nd), Georgia (26th) and Tennessee
(22nd) (League of American Bicyclists, 2014a). Rankings are updated each year for states,
communities, universities, and businesses, and are conducted through the use of LAB’s version
of the Social Ecological Model called the “5 E’s.”
The LAB’s 5 E’s are enforcement, education, engineering, evaluation, and education
dependent on the percentage of increase or decrease of three key outcomes: ridership (people
commuting by bicycle), crashes (per 10,000 daily commuters), and fatalities (per 10,000 daily

15
commuters). These are then ranked into five categories (bronze, silver, gold, platinum, and
diamond) (League of American Bicyclists, 2014b). For the diamond status, ridership must have
20% of the people commuting by bicycle, 50 or less crashes per 10,000 daily commuters, and 0.2
fatalities per 10,000 daily commuters. Each of the 5 E’s is broken down into subcategories to
determine appropriate ranking. Table 2.1 provides the 2014 qualifiers for platinum and diamond
statuses (League of American Bicyclists, 2014a). The following explains this with the criteria
needed for platinum or diamond statuses.
Enforcement is determined by whether or not the community or state has a law
enforcement or cycling liaison and if there are bicycle friendly laws and ordinances in place.
Education is the ratings of public education outreach and the annual offering of adult bicycling
skills classes as well as the percentage of primary and secondary schools offering bicycling
education. The engineering category is decided by a rating of bike access to public
transportation, percentages of total bicycle network mileage to total road network mileage, and
arterial streets with bike lanes. Evaluation is deduced by the number of bike program staff and a
bike plan that is current and being implemented. Finally, encouragement is assessed by active
bike clubs and signature events, bike month and bike to work events, active bicycle advisory
committee, active advocacy group, and recreational facilities like bike parks and velodromes
(League of American Bicyclists, 2014b). Each of these categories parallels levels associated
with the Social Ecological Model.

16
Table 2.1 Bikeability Standards for Diamond and Platinum Statuses Platinum Diamond Enforcement Law Enforcement/Cycling Liaison Yes Yes Bicycle-Friendly Lanes/Ordinances in Place Very Good Excellent Education Public Education Outreach Excellent Excellent Annual Offering of Adult Bicycling Skills Classes
Quarterly Monthly
Percent of Primary & Secondary Schools Offering Bicycling Education
60% 80%
Engineering Bike Access to Public Transportation Very Good Excellent Total Bicycle Network Mileage to Total Road Network Mileage
45% 70%
Arterial Streets with Bike Lanes 78% 90% Evaluation One (1) Bike Program Staff Person Per 20K Citizens Per 10K Citizens Bike Plan is Current & Being Implemented Yes Yes Encouragement Active Bike Clubs & Signature Events Yes Yes Bike Month & Bike to Work Events Excellent Excellent Active Bicycle Advisory Committee Yes Yes Active Advocacy Group Yes Yes Recreational Facilities Like Bike Parks & Velodromes
Very Likely Yes
Source: League of American Bicyclists, 2014a
Currently, neither the state of Alabama nor the University of Alabama has reached any of
the above rankings. However, the community of Auburn currently holds the bronze ranking and
the University of Alabama has received an honorable mention for the strides made in the past
years to establish a more friendly cycling environment (League of American Bicyclists, 2014c).
These are steps towards improvement, but are insufficient to remove Alabama from its bottom
position.

17
Each year, bike friendliness is reevaluated among the divisions of LAB in order to keep
stakeholders, cyclists, and the recognized entities current with the given standard. In addition,
states are given report cards for any change that has taken place over the last year. Currently,
Washington State holds the top position of all 50 states with an overall value of 66.8 out of 100
points (League of American Bicyclists, 2014d). Among the signs of success and scores given to
the state, Washington indicated evidence of nine out of the ten signs, only missing the “People
Commuting by Bike (More than 1%)” and qualitative feedback for the state included
accountability and expansion of funding, laws and investments for the non-motorized population.
Overall, Washington State was given a silver status.
Conversely, Alabama is currently ranked last with an overall score of 17.4 out of 100,
which is a five-point increase from the previous year. Of the top ten signs of success, Alabama
has sustained both an active state advocacy group and a state bicycle plan that was adopted in
2004 (League of American Bicyclists, 2014e). In addition, Alabama introduced bicycle
education for police, bicycle safety emphasis in strategic highway safety planning and top ten
state for congestion mitigation, and air quality spending in 2014. LAB (2014e) suggested
Alabama adopt a safe passing law, add specific training and policies for engineering, aid in
funding a cycling friendly environment, and include language, state websites and campaigns to
address and advocate cycling in the state (Table 2.2).

18
Table 2.2 2014 Bikeability Rates for Alabama United States Ranking 50 Regional Ranking (South) 13 Category Scores 5 = High 1 = Low Bicycle-Friendly Lanes/Ordinances in Place Very Good Excellent Education Public Education Outreach Excellent Excellent Annual Offering of Adult Bicycling Skills Classes
Quarterly Monthly
Percent of Primary & Secondary Schools Offering Bicycling Education
60% 80%
Engineering Bike Access to Public Transportation Very Good Excellent Total Bicycle Network Mileage to Total Road Network Mileage
45% 70%
Arterial Streets with Bike Lanes 78% 90% Evaluation One (1) Bike Program Staff Person Per 20K Citizens Per 10K Citizens Bike Plan is Current & Being Implemented Yes Yes Encouragement Active Bike Clubs & Signature Events Yes Yes Bike Month & Bike to Work Events Excellent Excellent Active Bicycle Advisory Committee Yes Yes Active Advocacy Group Yes Yes Recreational Facilities Like Bike Parks & Velodromes
Very Likely Yes
Currently, nine out of ten of the top national universities are ranked among the Bicycle
Friendly University (BFU) Program (League of American Bicyclists, 2014f). Of the universities
recognized, only two are ranked at the platinum level: Stanford University and the University of
California at Davis (UC Davis) (League of American Bicyclists, 2014g). Platinum colleges and
universities indicate excellence in all categories. These campuses have a comfortable and safe
bike network, excellent bike parking, education and support programs for bikes, and a large
proportion of the campus population utilizing bikes as a regular method of transportation.
19
Upon further investigation of the sustainable transportation on college campuses,
researchers have determined that the higher education setting is a viable target to impact the
population and areas surrounding the campus (Balsas, 2003). Cycling is currently improving
quality of life on campuses (Clarke, 2000) as seen in many areas of the United States. Students
often walk and cycle in conjunction with motorized transportation. In addition, college students
tend to be physically more fit, have restricted budgets, live close to campus, and already own a
bicycle or are willing to purchase one (Tolley, 1996).
UC Davis is among those universities that strongly advocate for campus cycling. The
university has wide offerings of cycling resources to encourage non-motorized transport. UC
Davis was awarded BFU status by the League of American Bicyclists in 2005. To build
enthusiasm for the cause, the university maintains wider streets, well-marked bike lanes, inviting
pathways, abundant bike parking, and mutual respect between cyclists and motorists, which has
encouraged the numbers of bikes per capita for the area. This is accomplished through various
programs to build and advocate for cycling (UC Davis, 2012).
To further this movement, UC Davis educates students on a wide variety of notions
including how to choose the appropriate bike, theft prevention, appropriate bicycle parking,
general rules of the road, and advice for the new cyclist (UC Davis, 2012). Because of this and
general heightened awareness for the cycling population, the university boasts of 15,000 to
20,000 cyclists during peak use and has additional services specific for the cyclist. These
include daily use and summer bicycle storage, cycling classes, commuter showers, and bike
repair stations located around campus (UC Davis, 2012). Overall, these components encourage
an environment and population of cycling for a holistically more healthy campus.

20
Population that Currently Cycles
Most U.S. cyclists are male; research indicates that more than 50% of men participate in
cycling annually (Harris, 2011) with higher use rate in males ages 25-64 years (Pucher, Buehler
& Seinen, 2011). Nationwide, 0.8% of men and 0.3% of women utilize cycling as a mode of
active transport (McKenzie, 2014). Increased numbers of female cyclists are found in areas
where there is a wider separation between the cyclist and traffic or with separated cycling
facilities (Baker, 2009; Garrard, Rose & Lo, 2008).
According to the annual American Community Survey, there is a reported increase of
commuters that cycle nationwide. In 1990, there were only 9,643 reported cyclists commuting,
but between 2006 and 2008 there was about 24,428 (US Census, 2010a, b, c). This is a 153%
increase from 1990 to 2008. In Alabama, there are approximately 2,300 cycle commuters (0.2%)
out of the 4.8 million residents in the state, which is the third lowest proportion of United States
commuters traveling by bike (McKenzie, 2014). Of those commuters, 1,454 are male and 868 are
female.
Nationally, the younger population (16-24 years) is more likely to use cycling as a mode
of commute at a rate of 1.0%. However, as the age groups increase, this rate quickly declines to
a rate of 0.3% in those 55 and older (McKenzie, 2014). Age and gender are not the only
predictors of cycling for active transport. Race also plays a role; African Americans have the
lowest percentage of cyclers (0.3%), and those who identified with two or more races have the
highest (0.8%) (McKenzie, 2014). Finally, there is a convex trend in cycling and education.
Those with less than a high school degree and those with a graduate or professional degree have
the highest proportion of cyclers (0.7% and 0.9%, respectively) (McKenzie, 2014).

21
Health
While the United States is one of the wealthiest countries in the world, the health of the
population does not parallel this trend (Institute of Medicine of the National Academies, 2013).
In comparison to other high-income countries, the United States ranks poorly in heart disease,
obesity, and diabetes. Of the top seventeen high-income countries, it ranks 17th in life
expectancy for males and 16th for females (Ho & Preston, 2010). Each of these health risks is
directly correlated with physical activity and can be prevented.
Healthy People 2020
The Healthy People Initiatives began with the 1979 Surgeon General’s Report. In the
early 1980s, the US Department of Health and Human Services along with the Centers for
Disease Control and Prevention, the Food and Drug Administration, the National Institutes of
Health, and other leading U.S. agencies unveiled Healthy People 1990 as a means of eliminating
or reducing health disparities, addressing quality health care, and improving availability of
health-related information (USDHHS, 2014b).
One of the objectives of Healthy People 2020, the fourth generation of initiatives since
the 1979 Surgeon General’s Report, encourages an “increase [in] trips to work made by cycling”
by 10% from 2010 (USDHHS, 2014d, EH 2.1). University campuses can help meet this Healthy
People objective (CDC, 2010). The college environment plays an important role in impacting the
current and future health behaviors of university students (Bopp, Kaczynski & Wittman, 2011).
Active transport impacts the physical, psychological, and environmental health of university
students (Kaczynski, Bopp & Wittman, 2010).
This national set of guidelines also includes objectives for physical activity, which are to
reduce the proportion of adults who do not participate in physical activity in their free time

22
(USDHHS, 2014c, PA-1), as well as increase the amount of adults that meet the national
guidelines for both aerobic and muscle-strengthening activities (USDHHS, 2014d, PA-2).
Meeting these objectives would help lower the risk of many of the above-mentioned diseases
including obesity, CVD, high blood pressure, and type 2 diabetes (USDHHS, 2008).
Physical Activity
In 2008, 32% of adults reported being inactive, and 19% were active but did not meet the
recommended guidelines for physical activity. By 2011, less than half (48%) met the
recommendations for physical activity for aerobic or strength training (CDC, 2011). Of these,
men were more likely to complete all of the guidelines than women.
Physical activity is important for any age group. Not only can it control weight and
increase the ability to perform daily activities, but it can also reduce risk of chronic diseases such
as cardiovascular disease (CVD), type 2 diabetes, and some cancers (CDC, 2011). Physical
activity also helps strengthen muscles and bones and improves overall mental health and mood
(CDC, 2011).
Recommendations
The World Health Organization (WHO) provides physical activity recommendations for
all nations. It is recommended that individuals strive to participate in 30 minutes of physical
activity each day. This can be achieved at one time or at various times throughout the day with
two 15-minute or three 10-minute periods of activity (World Health Organization, 2002). This
includes purposeful times of exercise or utilizing a 15-minute bike ride to commute each way to
work.
The American College of Sports Medicine (ACSM) recommends physical activity based
on four major categories: cardiorespiratory, resistance, flexibility, and neuromotor exercises

23
(ACSM, 2011). All of these reduce the risk of cardiovascular and other chronic diseases. While
these contribute to benefits of the body, the overall ACSM recommendation is to participate in
150 minutes or more of moderate exercise every week. Each category of activity has individual
recommendations for it, but the bottom line is that individuals stay active or “keep moving”.
ACSM states, “People unable to meet these minimums can benefit from some
activity…Sedentary behaviors—sitting for long periods of time—are distinct from physical
activity and has been shown to be a health risk in itself (ACSM, 2011).” Exercise can be
accomplished in big sections of time (i.e. one hour of Zumba class) or in smaller sections (i.e. 10
minutes of walking at lunch and after work). Either way is acceptable (USDHHS, 2012).
Importance of Physical Activity
Since the 1950s researchers have focused on physical activity and found a strong
correlation to good health (Morris, Heady, Raffle, Roberts & Parks, 1953). In 1996, the United
States Surgeon General released a report that highlighted the importance of physical activity
(USDHHS, 1996). According to the US Surgeon General, benefits of physical activity included
reductions in heart disease, hypertension, colon cancer, and diabetes. Additional benefits
included increased maintenance of bones, muscles, and joints, and reduced rates of anxiety and
depression. The report also stated physical activity promotes mental and emotional well-being,
aids in maintenance of body weight, contributes to lean muscle, and lowers body fat (US DHHS,
1996).
There have been numerous studies throughout the history of health research that pointed
to improved health with physical activity. Participating in such daily physical activity routines
such as walking were correlated with reduced mortality in the Honolulu Heart Program
(Anderson, Schnohr, Schroll & Hein, 2000). The study found that men who walked less than one

24
mile per day had twice the mortality than those who walked more than two miles (Hakim et al.,
1998). Anderson, Schnohr, Schroll and Hein (2000) found that both men and women who stayed
active during their leisure time, cycling included, had lower associations with all-cause mortality.
It is not only circulatory diseases and overall mortality that are positively affected by
physical activity, but cancer and diabetes are also affected. The risk of colon cancer on average
is reduced by 40-50% (Lee & Blair, 2002). There is a reduction of the risk of breast cancer
(Luoto, Latikka, Pukkala, Hakulinin & Vihko, 2000). In addition, physical activity has shown to
have a protective health effect on those with lung cancer (Lee & Blair, 2002).
Walking and cycling, whether for active transportation or leisure, have been found to
reduce the risk factors of type 2 diabetes (Wannamethee, Shaper & Alberti, 2000). This disease
was once found primarily in adults but is now found in many children and adolescents with the
rise of obesity (Kaufman, 2002; USDHHS, 1996).
Physical activity benefits do not solely act on body structure but also aid in psychological
health and well-being. Regardless of socioeconomic status, the effects can be pinpointed in all
ages and populations for improvements of mood and emotion (Biddle, 2000). Physical activity
has been associated with improvements in self-esteem, self-perception, and depression (Fox,
2000). While the exact mechanisms or rates are still unknown for these diseases, researchers are
confident in the beneficial effects of physical activity on disease (Fox, 1999).
As physical activity improves the health of an individual, physical inactivity creates a
myriad of complex problems. One of the major risk factors for type 2 diabetes is physical
inactivity which can increase the risk of the disease by as much as 50% (Wannamethee, Shaper
& Alberti, 2000). In addition, physical inactivity has deleterious impact on mental and
psychological well-being. Those who spend less time engaged in physical activity are more

25
likely to become depressed over time (Camacho, Roberts, Lazarus, Kaplan & Cohen, 1991;
Penedo & Dahn, 2005). Keeping the population in motion is important for the prevention of
many diseases and for lowering the risk of early mortality. This can be accomplished on
university campuses through the Health Campus initiatives (ACHA, 2014).
Healthy Campus 2020
To promote and accompany Healthy People 2020, the American College Health
Association (ACHA) formed a coalition to propose objectives that would mirror the efforts of the
US Department of Health and Human Services but target the college population. In 2010, upon
the announcement of the Healthy People 2020 objectives, the Healthy Campus Coalition was
created. It was comprised of health professionals from over 25 higher education professional
organizations who wrote student and employee objectives for better campus health (ACHA,
2013).
The college health initiative utilized portions of the Healthy People 2020 guidelines that
pertained to the college age population and demographics. It consists of 54 objectives and 11
topic areas. While these do not directly address cycling, the initiative addressed many of the
major concerns of this population and considers topics helpful to the public health of students in
relationship to academic progress. These objectives include stress, sleep, anxiety, work, and
common communicable diseases such as influenza or strep throat (ACHA, 2013).
As another important component of health on campuses, the initiatives of Healthy
Campus 2020 also address the health of faculty and staff (ACHA, 2013). These do not directly
affect the health of students beyond communicable diseases, but indirectly affect those that work
within the university system within the classroom environment to create herd immunity.

26
Health Statistics
Alabama Health Statistics
The state of Alabama is faced with many chronic health challenges. Heart disease,
cerebrovascular diseases, diabetes mellitus, and hypertension were included in the top 15 causes
of death (Alabama Center for Health Statistics, 2013). Alabama was ranked 47th in the United
States for all health outcomes in 2012 (United Health Foundation, 2012).
According to the Alabama Department of Public Health, nearly one-third of the adult
population in Alabama has high blood pressure and even more (39.3%) has high blood
cholesterol. Above the two-thirds national average, 68.1% of the population categorized as
overweight and obese and 12.2% diagnosed with diabetes (ADPH, 2010). Each of these is a risk
factor of cardiovascular disease (CVD), which is a component of heart disease, and is the highest
cause of death not only in Alabama but the United States.
Heart disease and stroke led to 33% of Alabama deaths in 2005. High blood pressure and
cholesterol were reported in over one-third of the population in 2007 (ADPH, 2010). Together
these problems kill over 15,000 people in the state per year and cost the U.S. $503.20 billion
annually (ADPH, 2010). Heart disease and stroke are the first and third causes of death in the
United States, respectively, mainly due to poor lifestyle choices including diet and physical
activity (CDC, 2008).
While not mentioned as a leading cause of death, obesity is a large contributor; it is
associated with an unhealthy lifestyle. In 2007, 66.6% of adults in Alabama were described as
overweight or obese. This is more than three percent above the national average (CDC, 2008).
Additionally, 17% of high school students are reported obese, which is four percent above the
national average (American Heart Association, 2011), and many of these students are entering

27
the university population. In Tuscaloosa, the rate is even higher with 71% of the population
being obese or overweight (ADPH, 2010).
Obesity is an epidemic across the nation and in Alabama, and can be treated with an
active lifestyle. Physical activity is important for many reasons. It not only reduces the amount
of obesity in a population but also improves the health of individuals. Alarmingly, in the state of
Alabama, 58% of adults report insufficient physical activity (CDC, 2008). Thirty-one percent of
the state population and 32% of the population in the Tuscaloosa area claimed they were
inactive, defined as no physical activity in the last 30 days (CDC, 2008).
National University Health Statistics
The American College Health Association (ACHA) collects and reports on student data
collected from 153 national universities to provide a valid snapshot each year of campus health
(ACHA, 2013). Overall, the university student self-reports indicate a higher perception of health
than those in the state or national population. When asked about overall health, 58.7% of all
students reported having very good or excellent health in the spring of 2013 (ACHA, 2013).
When asked what factors affect their individual academic performance, students replied they
were affected by anxiety (19.6%), a chronic health problem or serious illness (3.5%), depression
(12.6%), difficulty sleeping (19.4%), and stress (28.6%) (ACHA, 2013).
The percentage of overweight and obesity in this population is also on the rise.
Overweight and obesity in children 12-19 years old saw a growth rate of 5% to 21% from 1980
to 2012 (Ogden, Carroll, Kit & Flegal, 2014). Those with overweight or obese parents are at
even greater risk (Agras, Hammer, McNicholas & Kraemer, 2004). The dilemma becomes
multifactorial in the wellness spectrum of these individuals. Extra weight on the body affects the
skeletal and organ systems and increases the rate of comorbidities (Daniels et al., 2005;

28
Freedman, Zuguo, Srinivasan, Berenson & Dietz, 2009; Li, Ford, Zhao & Mokdad, 2009). Many
diseases once only seen in older adults, such as type 2 diabetes, cardiovascular disease,
hypertension, hypercholesterolemia, and sleep apnea, are now being identified in the younger
population (Kennedy, Sloman, Douglass & Sawyer, 2007). Beyond the physical issues, there are
many emotional and psychological diseases an obese person will encounter including bullying,
low self-esteem, and depression (Stoler, 2013).
University of Alabama Health Statistics
The University of Alabama (UA) participated in the university specific National College
Health Assessment. Compared to the national physical activity rate, UA is above the standard.
When asked how many times in the past seven days a student participated in moderate activity
for 30 minutes, 61.9% (4.4% above the national average), 23.4% reported five to seven days
(3.9% above the national average), and only 14.6% reported that they participated in no
moderate activity per week, which is 8.4% below the national average (ACHA, 2011). The same
questions were asked regarding vigorous activity for 20 minutes. UA students answered 31.9%
did vigorous activity one to two days per week (0.8% above the national average), 40.2%
claimed three to seven days per week (9.5% above the national average), and 28% claimed to not
participate in vigorous activity weekly (9.5% below the national average) (ACHA, 2011).
The data above indicates a change in the university chronic health problems. Like
physical activity levels, the University of Alabama rates better for levels of chronic diseases.
The rate of students diagnosed or treated for diabetes in the last 12 months was 0.9% (0.1%
below the national average), and 1.9% for high cholesterol (1.1% below the national average).
In the past 12 months, 91.9% of students claimed health did not affect their academic status
compared to the 90% national average, and 6.7% experienced a health issue, which did not affect

29
them negatively. This was slightly above the 6.3% national average (ACHA, 2011). The health
problems of the student population are unique due to the pressures of the academia and college
life. However, like those of the general population, these too can be treated with physical
activity (ACHA, 2012), which not only has a physical impact on people but also an economic
impact.
Economic Impact of Physical Activity
Quantified benefits of physical activity vary widely based on physical outcomes and
methods used to value them. There are a number of less obvious costs directly and indirectly
correlated with physical inactivity (Bidwell, 2012). In the United States, the direct health care
costs of inactivity are estimated to range between $24.3 billion and $37.2 billion. This accounts
for 2.4% to 3.7% of health care costs and jumps to 9.4% when obesity is included (Colditz,
1999). The cost of diseases related to lack of physical activity and poor nutrition habits is a
concern with $174 billion spent in relation to diabetes in 2007 (American Diabetes Association,
2008) and $14.1 billion in direct costs related to childhood obesity in 2009 (Cawley, 2010). This
will later impact the university population. The physically inactive will spend an average of
$330 more per year on health costs compared to a physically active counterpart.
Cycling is an inexpensive and sustainable form of transport (Gatersleben & Appleton,
2007). It not only requires a low consumption of energy but aids in the health of the cyclist and
environment. Cycling is also a relatively fast method of transportation for short commute
distances and is both reliable and affordable for the population (Lumsdon & Tolley, 2001).
Bicycle commuting saves money in various other methods as well. According to the
Office of the Federal Environmental Executive, cycling for commute decreases work
absenteeism, increases employee productivity, and reduces maintenance costs. Utilizing a bike

30
does not require a person to fill up on gas, requires less space than the motorized counterpart,
and causes little wear on the roads. Saving money combined with other health dimensions could
be used to advocate for cycling or physical activity, in general (Davis, 2010).
How Cycling Helps Health
Cycling helps environmental, mental, and physical dimensions of health (Woodcock et
al., 2007). The relationship between cycling as a mode of active transportation and health
benefits is complex. Various studies have concluded that the duration to and from work
combined with the intensity of physical output are sufficient to improve health in an individual
more than walking (Oja et al., 1991; Vuori, Oja & Paronen, 1994). Cycling maintains health
benefits even when combined with local transportation systems (Oja, Vuori & Paronen, 1998).
A number of health benefits are specific to cycling. It is a low impact exercise, which
creates less strain on and injury to joints and prevents further injury to damaged joints (Klein et
al., 2007). Klein et al. (2007) rated cycling as allowable after serious hip and knee surgeries.
This qualifies the activity for many other stages and kinds of injury. Additionally, a 150-pound
cyclist burns approximately 410 calories when pedaling 12 miles an hour (Conway, 2012). If
bicycling were incorporated into daily routines and commute, the campus community would be
healthier, save money, and decrease healthcare costs (Davis, 2010).
How Cycling Improves University Campuses
Cycling as a method of transportation improves the health of the individual cyclist,
mitigates climate change, improves environmental health, and benefits the entire population in a
manner that is socially equitable (Macmillan et al., 2014). Bicycle commuting offers a “non-
polluting, non-congesting, physically active form of transportation in a country (Mapes, 2013).”
31
Since 40 percent of trips in the U.S. are within two miles of a person’s home, cycling is adequate
for those trips and can easily replace motor vehicle transportation (Mapes, 2013).
Reduces Parking Issues
According to the University of Alabama, the campus population has grown by nearly
15,000 students from 2004 (enrollment - 20,969) to 2013 (enrollment - 34,852). This growth has
caused challenges for parking on campus (University of Alabama, 2013; University of Alabama,
2014). Those that commute to campus are challenged to find adequate parking in the perimeter
parking zones and take another form of transportation to specific buildings or classes while
students that live on campus have specific parking hubs.
Lack of parking creates acute problems in densely populated areas that are not able to
provide adequate parking for the population (Arnott & Inci, 2006). When university officials are
not prepared for population surges, small parking areas and transportation become troublesome
to those that work, study, or live in the area (Balsas, 2003; Shang, Lin & Huang, 2007). This is
due to population size and the outdated design of the university. This is the case of the University
of Alabama, which was founded in the early 1800s.
The first Campus Master Plan was released in 2007 and outlined the physical and
historical foundations of the university campus (University Planning, 2007). There is a growth in
campus toward a more pedestrian and cyclist friendly layout as well as sustainable expansions.
According to the original plan, the president and campus planners wanted to increase pedestrian
activity and support bicycle use. “By encouraging walking and cycling for general accessibility,
the University supports more active lifestyles for students, which is essential for their full
intellectual and social growth” (University Planning, 2007).

32
With the 2010 purchase of land to expand the University of Alabama, planners saw the
need to continue to move parking to the perimeter of the physical campus and make it “a
walkable campus” that will “support bicycle use” (University Planning, 2012). The plan
dedicates land on the campus outskirts for short-term parking and reduced the congestion of
central campus by eliminating smaller parking lots. There is more availability for bike racks in
centralized areas and nearer to frequented buildings by making actions toward a more cycle
friendly campus.
Reduces Motor Vehicle Traffic
Increased cycling and reduced motor vehicle traffic on campus reduce noise and physical
danger for the student population (Woodcock et al., 2009). Motor vehicle traffic contributes to
high levels of campus noise, which can also be a contributor of stress. Not only has noise been
found to be a contributor of elevated blood pressure and other psychiatric illness, traffic noise is
specifically correlated with decrease in work quality, increase in physical tension, increase in
blood pressure, and notable change in hormones (Ising, Dienel, Gunther & Markert, 1980). By
reducing motor vehicle traffic, stress can be reduced.
Motor vehicle traffic is negatively correlated with non-motor vehicle traffic (Dill &
Voros, 2007). Heavy motor vehicle traffic leads to greater perceived risk of accidents,
frustration with cyclist and vehicle interaction, and insecurity while travelling. Streets with
lower speed limits are perceived to be safer by cyclists and reduce the amount of crashes
involving cyclists. Lowered speeds and reduced volume of traffic allow for more reaction time
to prevent accidents between vehicles and cyclists (Retting, Ferguson & McCartt, 2003). Traffic
calming including such methods as narrowing lanes, speed tables, and protected pedestrian

33
islands are further methods that can make traffic seem safer and increase the amount of cycling
traffic (Smith & Appleyard, 1981).
Cycling itself helps in multiple ways to reduce the amount of motor vehicles on the road.
Basically, the more people who ride bikes, the less people would drive cars (Jacobsen, 2003).
However, there are more contributing factors. Jacobsen (2003) reports increased walking and
cycling does not change the number of accidents but helps to alter the behavior of the motorist.
Increasing the number of cyclists creates power in numbers and improves perceived safety in the
population (Jacobsen, 2003).
Improved Air Quality
Air pollution negatively affects the health of human population each year, especially in
areas that are densely populated (WHO, 2006; COMEAP, 2010). While industry and
commercial activity contribute to the problem, road traffic also affects the amount of air
pollution present (Caiazzo, Ashok, Waitz, Yim, & Barrett, 2013). Exposure to unhealthy air
particles contributed to approximately 130,000 premature deaths in 2005 (Fann et al., 2012) and
160,000 in 2012 (US EPA, 2011).
Cycling is an environmentally sustainable and pollution-free mode of transport (Cavill &
Davis, 2003). According to Rowell and Fergusson (1991), if the rate of cycling increased by ten
times the current rate, it would prevent as much as 750,000 tons of carbon monoxide, 100,000
tons of nitrogen dioxide, and 16,000,000 tons of carbon dioxide from being emitted. While it is
commonly thought that those walking and cycling are exposed to higher amounts of pollutants, it
is also true that those caught in slow moving traffic are at the same risk or higher (van Wijnen,
Verhoeff, Jans & van Bruggen, 1995). In fact, driving can be a risk three times greater than a

34
person cycling due to the proximity of the driver to the polluted air and quantity of emissions
(Department of the Environment Transport and the Regions, 1998).
A common approach recommended by many health professionals is to reduce exposure to
air pollution through increased means of physical activity in areas of high pollutant
concentrations (Sharma, 2005). Individuals often refrain from exposure to air pollution when
amounts are increased, which can deter from using bicycles as a means of commute.
Challenges to Cycling on Campus
Cycling is a great option for physical activity, as it improves psychological and
environmental health, and softens economic hardships (for instance, the need to purchase gas is
decreased). However, there are problems that often affect the cycling community (Mapes,
2009). Since the popularity of the car in the last half of the 1900s, the transportation system has
continued to invest money into the motor vehicle infrastructure system. This is far different than
the laws of 1900 in which states claimed that bicycles and vehicles had the same rights of the
road (Mapes, 2009).
Cyclists run a moderately high risk of being injured on the road or in a motor vehicle
accident, which is a big concern to many cyclists (Bracher, 1989; CTC, 1997). The modern
traffic system is designed to be friendly to the automobile but not to the cyclist in many areas of
the state and city (Wegman et al., 2010). As a result of this and other factors, people in the U.S.
cycle less than any other country as of 2003. This can be attributed to lack of bike lanes, bike
lanes in poor repair, or the need to share the road with motor vehicles.
The University of Alabama is not free from the injury list. From April to December of
2013, there were a total of nine reported accidents on the campus (UAPD, 2013). All of these
listed the bicyclist at fault, typically due to refusal to stop before the pedestrian crosswalk.
35
Seven of the cases resulted in minor injuries while two had no injuries at all. As of late August
2014, there have only been two cases reported with no injury (UAPD, 2014). It was not listed
whether the injury was the cyclist or another person involved.
Another challenge in the United States is urban sprawl (Moudon et al., 2005). Unlike
some areas of Europe or heavily populated cities in which much of the city is close in proximity,
cities like Tuscaloosa are spread out and increase the commute time for bicycles and motorists
alike. This makes a challenge for city government officials and developers to encourage an
environment that is safe for cyclists. It is also important to have end-of-trip facilities like bicycle
racks or lockers to encourage commuting (Mapes, 2009).
Perceptions of risk and safety tend to further the barriers of cycling. This affects how
often and who is willing to participate. In the populations that utilize cycling as a means of
commute as well as those that use it for recreation, the perceived risk of cycling is as significant
as the experience of an accident (Xing, Handy & Buehler, 2008; Dill & Voros, 2007). Cyclists
determine this through safety in numbers (Jacobsen, 2003). For example, the more cyclists take
to the road, the more people feel safe and visible on the road, and the less accidents are reported.
Infrastructure also changes the perception among cycling participants.
Taylor, Kingham, and Koorey (2009) argued that off-road or separated paths increase the
perception that cycling is more safe and enjoyable. In addition, the perceived fear for safety also
needs to be addressed when developing, planning, and implementing policies. In the 2002
National Survey of Pedestrian and Bicyclist Attitudes and Behaviors, more than 10% of the
participants felt their personal safety was threatened as they cycled (Royal & Miller-Steiger,
2008), 88% of them reported that they felt threatened by motor vehicles and 37% had concerns
about the road or sidewalk conditions.

36
Traffic System
Infrastructure has a lot of influence on the atmosphere of cycling in various cities, both in
and around university campuses. Infrastructure can either encourage or discourage the
likelihood of cycling. A study from the Harvard School of Public Health analyzed the use and
risk of injury on bicycle specific trails versus a bicycle lane on the side of the street. Researchers
noted that physically separated cycle tracks are as safe or safer than in-road bike lanes (Lusk et
al., 2011). Separate cycling paths were used 2.5 times more than nearby on-street bicycle lanes
and the relative risk of injury was 28% lower. Of these, the safest cycle tracks were on streets
with the least amount of motor vehicle traffic. This research discussed a major limitation of
increased quantities of shared roads. One of these is the amount of parking that is taken from the
space with bike lanes, causing more motor vehicles to use the bike lane as a parking space (Lusk
et al., 2011).
Researchers have found that there is no single way to better the traffic system and
increase bicycle commuting by the population (Moritz, 1997; Nelson & Allen, 1997; Ogilvie,
Egan, Hamilton & Petticrew, 2004). Mouden et al. (2005) stated, “Frequently mentioned
environmental changes that can encourage cycling included: more bike lanes and trails
(mentioned by almost 49% of the respondents), good lighting at night (33%), and bicycle racks
at destinations (31%).” This is discussed further in other literature. Pucher, Dill, and Handy
(2010) reported that appropriate and aggregated infrastructure would facilitate an increase in
cycling. Even more, the increase of bicycle infrastructure is “positively and significantly
correlated with higher rates of bicycle commuting” (Dill & Carr, 2003). However, bike lanes
and paths alone did not increase the number of cyclists without connectivity to off-campus
destinations (Dill & Carr, 2003; Nelson & Allen, 1997).

37
Laws Around Cycling
Law enforcement is an influential component when increasing bikeability in a
community. This includes helmet laws, speed limits, and general driving by both cyclists and
motor vehicles. These laws are found to increase the population’s comfort and perception of
safety (McClean, 2012). However, not all laws are advantageous in increasing the cycling
population.
While helmet laws are important, the enforcement of these laws can cause the number of
cyclists to decrease (McClean, 2012). This is reportedly due to how clumsy and awkward the
helmet feels while riding, reducing the comfort level of the individual. In addition, there have
been added complaints of storage issues with a helmet for fear that the helmet could be stolen or
where to store it when in a building.
Enforcement of reduced speed, speed tables, and areas with traffic calming has been
attributed to increased rates of cycling. Lowered speed limits improve both the perceived and
actual safety for the cyclists (McClean, 2012). Simultaneously, this reduces air and noise
pollution, making the area more environmentally friendly, and increases the relative speed of
cycling to driving. When each of these is mandated, the efficiency of cycling rivals the
efficiency of driving.
Personal Safety
Personal safety is an important component to using a bicycle as a main method of
transportation. Concern for safety is a prevalent barrier and safe conditions are not always
present (Chan, 2009; Pucher & Buehler, 2009). According to a survey completed by the
National Highway Traffic Safety Administration (2008), 88% of cyclists felt more threatened by
motorists while on the road and 37% felt that uneven walkways and roadways were a threat to

38
personal safety. Concern for safety is often stated as a significant barrier that affects commuting
habits (Pucher, Dill & Handy, 2010; Boelte, 2010).
There are other reasons that cyclists do not utilize bicycle paths and lanes. For many,
these reasons include poor construction, deterioration of lanes, or lack of convenience, meaning
that those planning the infrastructure did not effectively plan bicycle routes (Pucher,
Thorwaldson, Buehler & Klein, 2010). Taylor, Kingham, and Koorey argue that off-road or
separated lanes increase the perception that cycling is safe and more enjoyable (2009). However,
perceived fears need to be considered when developing, planning, and implementing
interventions and policies for better cycling environments.
Further challenges to cycling include the underreporting of accidents whether they occur
with motor vehicles or not (de Hartog, Boogaard, Nijland & Hoek, 2010). This is often due to
embarrassment from one or both parties or the desire to keep law enforcement and insurance
companies from being involved. This is common in those accidents that do not include fatalities
and leads to inaccurate statistics and problems of cycling safety.
Perceptions of Cycling
Overall, cycling can be a way for individuals to get healthy as well as contribute to the
environment (Pooley & Turnbull, 2000). However, one of the major deterrents of cycling in the
United States is the perceived amount of danger (Zeeger, 1994). When riding next to heavily
trafficked or in high-speed areas, a person can feel that the chance of injury is greater. This is
not always the case. Forrester (2001) argues that when a population becomes adjusted to a
higher rate of cycling, the roadways also become safer as seen in many European cities. There is
also often an increase in facilities to aid in cycling such as bike lanes, bike paths, or parking
facilities (Pucher, 2001).

39
In further research, the perceived improvement in cycling safety has helped to increase
the cycling population. This is identified as safety in numbers (Elvik, 2009; Robinson, 2005).
As rates of cyclists rise and as they see more of each other on the road, the number of injury
levels fall (Pucher, Thorwaldson, Buehler & Klein, 2010). Additionally, the more people in a
community who cycle, the more probable that drivers are also cyclists and will heed safety
concerns.
People feel cycling with traffic can put oneself in the way of air pollution and emissions
from motor vehicles (Pucher & Dijkstra, 2003). However, research has shown cycling can
remove a person from the emissions of heavy traffic, and the increased number of trips by
bicycle reduces the number of motor vehicles on the roadway thereby reducing the amount of
emissions and air pollution from traffic (Rojas-Rueda, de Nazelle, Tainio & Nieuwenhuijsen,
2011). Additionally, many people feel that cycling is neither convenient nor an attractive way to
commute from place to place (Pucher & Dijkstra, 2003), as one may perspire or be exposed to
natural debris, like dirt, puddles, or rain.
Visual assumptions guide cyclists. When measured, the perception of the road, alertness,
and responsiveness changed given the quality of the physical path (Vansteenkiste, Zeuwts,
Cardon, Philippaerts & Lenoir, 2014). Cyclists often spend more time during a regular commute
looking at the surrounding environment instead of paying attention to the roadway (Foulsham,
Walker & Kingstone, 2011). When the texture of the path changes, the gaze and perception of
the person follows suit (Pelz & Rothkopf, 2007). This changes the acuity of the individual and
reaction time in relation to a person’s surroundings. When the only available and functional
space for cycling is not designed or maintained for the purpose of cycling, the changed
perception and acuity of the person will lead to more accidents.

40
Bicyclist fatalities have fallen in the United States by 24% between 1980 and 2000 given
the awareness of non-motorists on the roadway (Pucher & Dijkstra, 2000). It is also safe to say
that with positive advocacy for the mode of transportation, a cycling culture will flourish.
Policies & Laws
Since the last half of the 1900s, the transportation system has continued to pour money
into the motor vehicle infrastructure system, with little investment towards cycling (Mapes,
2009). The Intermodal Surface Transportation Efficiency Act of 1991 was passed to increase
highway safety and mass transit in an energy efficient manner (US Department of Congress,
1991). Yet, no funding was made available for cycling. This funding disparity does not appear
to support the laws in most states, which claimed bicycles and vehicles had the same rights of the
road (Mapes, 2009).
Internationally, Germany, Denmark, and the Netherlands have taken innovative measures
and put key policies in place (Pucher & Buehler, 2009). These countries have bicycling
networks that include separated cycling facilities, modified intersections with priority traffic
systems, traffic calming, specific bike parking, traffic education, and protective laws intended for
the non-motor vehicle transportation. The bicycle networks of Northern Europe are
multifaceted, available to and utilized by all income classes, genders, and ages, and focus on
education and safety for active commuters (Pucher & Buehler, 2009).
Many federal, state, and city level agencies have tried in the past two decades to
implement policies and initiatives to improve the cycling atmosphere in the prospective areas.
The first was the federal Intermodal Surface Transportation Efficiency Act (ISTEA) of 1991.
This act was introduced to provide highway and transit funding in collaboration with various
planning requirements to provide more non-motorized commuter trails through high priority

41
corridors in the National Highway System (US Congress, 1991). During the course of its era
until it expired in 1997, 80 corridors across the United States were improved.
Following the ISTEA, the Transportation Equity Act for the 21st Century (TEA-21) of
1998 began. TEA-21 was authorized to fund specific regional transportation plans provided it
met seven planning factors. These included an increase in the safety and security for both
motorized and non-motorized users, promotion of energy conservation and improvement of
quality of life for the population, and integration of connectivity across and between various
modes of transportation (US Congress, 1998). This guaranteed federal funds for surface
transportation through the 2003 fiscal year.
The Emergency Economic Stabilization Act of 2008 became Public Law 110-343. A
section commonly known as the “Bicycle Commuter Act (Section 211)” was added by Oregon
representative Earl Blumenaurer which included “transportation fringe benefit to bicycle
consumers.” While it was unsuccessfully attached to other bills, the Bicycle Commuter Act helps
to benefit the companies and organizations that add in bicycle improvements, repair, and storage
by offering a tax break for the various improvements (Public Law 110-343, 2008)
In March of 2010, the Policy Statement on Bicycle and Pedestrian Accommodation
Regulations and Recommendations was released to establish the integration of active
transportation networks and support these as equally important to the motorized counterparts (US
Department of Transportation, 2014). Legislation and regulations require the inclusion of
bicycle and pedestrian projects in order to foster safer cycling, more livable and people friendly
communities, promote health and physical activity, and help environmental health by reducing
emissions and the use of fuel. Furthermore, this policy encourages transportation agencies to

42
take a proactive role in providing safe and convenient facilities that foster increased pedestrian
and cyclist use of all ages.
Policies change the amount of motor vehicle use in and around university campuses.
They hold a lot of potential to solve the need for parking (Shannon, Giles-Corti, Pikora, Bulsara,
Shilton & Bull, 2006), increase quality of life and financial benefits (Toor & Havlick, 2004), and
reduce the amount of traffic congestion related to the campus (Delmelle & Delmelle, 2012).
This has already been observed in small and large universities by increased parking fees
(Delmelle & Delmelle, 2012) and increased financial perception of driving (Shannon et al, 2006)
as effective policies to shifting the mode from motor vehicle use to forms of active transport.
Currently, UA has does not have a specific list of laws for cyclists but promotes those in
the state of Alabama. Bike registration is free and optional to students and faculty (University
Recreation, 2014). While this policy is optional, it helps the University of Alabama Police
Department to find and return stolen bicycles. According to the Alabama Code, bicyclists “shall
be granted all of the rights and shall be subject to all of the duties applicable to the driver of a
vehicle…except as to those provisions…which by their nature have no application” (Alabama
Code, 1975).
Current Research on Cycling
Many states and colleges campuses across the United States are working to encourage a
bicycle friendly atmosphere (Handy, Heinen and Xing, 2011; Heinen and Handy, 2012;
Nankervis, 2012; Paez & Whalen, 2010; Rybarczyk & Gallagher, 2014). According to the
American Community Survey, bicycle-commuting trends from 2000 to 2008 have increased 43%
(League of American Bicyclists, 2009).

43
Non-University Studies
In a study of six U.S. cities, Handy, Heinen and Xing (2011) analyzed the decision to
commute by bicycle and barriers that current and potential commuters face on a regular basis.
They found that several factors affected the choice to choose or refrain from cycling, including
socioeconomic factors, attitude, self-selection, social-environmental factors, and physical
environment factors. Their research led to the conclusion that the social environment of the
workplace, attitudes, and self-selection are important considerations affecting the likelihood to
commute by cycle. Even more so, the more the employer supports cycling and the individual
feels comfortable with it, the more likely that active commute by cycling will increase.
In a comparison study of Davis, California and Delft, Netherlands, the similarities and
differences between attitudes and beliefs about the decision to commute were examined (Heinen
& Handy, 2012). By comparing a person’s attitude toward a behavior, the norms of the social
environment, and the perception to the extent a person is able to perform the behavior, a greater
understanding of whether a person will or will not commute by bicycle can be achieved. The
researchers interpreted that when a person believes and adds importance to it, there is a reason or
motivation to cycle. For example, if a person believes that commuting by bicycle will help him
get in shape and that is an important factor, then a person is more inclined to commute by
bicycle. However, when a person has a negative perception or does not find cycling to be
socially acceptable, then the likelihood of using this as a regular form of transportation quickly
declines.
Weather has often been assumed as a barrier to active commute by bicycle but reports
offer little data to support this (Replogle, 1992; Goldsmith, 1992). However, research conducted
in Melbourne, Australia, researchers presented data on the effect of weather conditions on

44
cycling (Nankervis, 2012). The assumption of weather, especially rain, made the conditions of
cycling unfeasible. While weather did affect the number of cyclists, Nankervis found the
difference to be small. Weather and climate were not found to be a strong barrier and cyclists
generally resumed daily routine. Dill and Carr (2003) concluded that research was inconclusive
of the impact of rain and other weather on commuter cyclists.
Interventions to increase cycling safety and the number of cyclists were conducted in the
already high cycling population cities of Munster (Germany), Freiberg (Germany) and
Amsterdam (Netherlands) (Beatley, 2000). These cities have taken action to calm motor vehicle
traffic, build and integrate bike networks, construct bike paths, improve signage, and discourage
the use of motor vehicles. This was not only found to increase the number of cyclists but also
works to make a more sustainable environment.
University Studies
Around the world, universities are working to promote a sustainable campus environment
by reducing the amount of automobile use (Paez & Whalen, 2010). Rising school enrollments,
like that of the University of Alabama, have led to issues with air and noise pollutions, motor
vehicle accidents, and congestion (Barata, Cruz & Ferreira, 2011). This has led a number of
universities to conduct studies to better understand the use of sustainable transport as a means of
active living and friendlier university environment.
At the University of Michigan in Flint, research was conducted to understand the
untapped potential for active transportation in and around the campus (Rybarczyk & Gallagher,
2014). Researchers used an attitudinal survey to gather the perception of cycling from the
students, staff, and faculty of the university. As one of the fastest growing universities in
Michigan, university leaders were encouraged to change the transportation schematic in order to

45
manage parking, reduce the amount of congestion on the campus, and increase sustainability. By
exploring the attitudes toward cycling and barriers, officials were able to gauge activity on the
campus. In the end, students agreed that safer routes, better lighting, and more attractive
destinations would improve the amount of cycling. Faculty and staff did not agree with this but
all parties agreed that living more than five miles from the university would be a barrier
(Rybarczyk & Gallagher, 2014). Members of the faculty, staff, and students that lived within
five miles agreed that safer routes, repair/air stations, bicycle classes, and increased parking costs
and fees would help increase the amount of cycling on the campus.
In a large, Midwestern university, researchers disseminated a survey to better understand
the mode of travel and influences on commuting. Overall, students responded with higher
amounts of active commuting behavior than did faculty or staff (Bopp, Kaczynski & Wittman,
2011). The most prominent explanation in the variance of travel decisions was based on
psychological set. When the current economic and ecological perceptions pointed to cycling or
walking to be a beneficial action, the individual was more likely to participate.
In 2009, research was conducted at the University of Maryland in College Park, MA.
Through a web-based survey, researchers analyzed travel patterns and specific issues
surrounding bicyclists (Akar & Clifton, 2009). The survey included a wide variety of subjects
including program innovations, improvement in infrastructure, and policies on the campus. The
findings of the study identified issues and concerns campus wide. The whole population, cyclists
and non-cyclists alike, agreed infrastructure is important to encourage cycling. Furthermore, the
results also indicated that nonmotorized vehicle adoptions may be more time sensitive given the
perception of cycling for exercise, time saving and economic purposes. This helped university

46
stakeholders to make policy and transportation improvements to create a more bike friendly
environment.
In a study to assess the knowledge, beliefs, and attitudes of the Georgia State University
students, participants completed surveys (Pope, 2010). The purpose was to assess the bicycling
trends and examine the beliefs and attitudes between those who cycle and those who do not. Of
the sample, 11% identified themselves as cyclists and half of those reported using bicycles as a
regular mode of transport to and from campus. Overall, cyclists believed that riding a bike was a
pleasant experience, had social support among cyclists, and had a higher rate of self-efficacy
than those who did not cycle. The largest barrier was the distance from home to campus and
many felt that bringing a bike to campus was not convenient. This is better understood through
the ecology of the population.
Social Ecological Model
The Social Ecological Model (SEM) provides a framework for understanding human
behavior and its interaction with the social and physical environments (Bronfenbrenner, 1979).
The model postulates that human behavior is influenced by multiple factors, which occur at
various levels of influence. The factors interact both within and between these levels to
influence or shape the health behavior or pattern of disease or injury. Although different
versions have been used to demonstrate the SEM levels, typically the factors are categorized into
the following levels: intrapersonal, interpersonal, institutional, community and policy levels
(Sallis, Cervero, Ascher, Henderson, Kraft & Kerr, 2006; Stokols, 2000).
The individual level includes biological and personal factors that might affect a given
health behavior such as campus cycling (e.g., a cyclist’s sex, age, history of illness, physical
fitness, attitudes, beliefs, knowledge, and skills) (Stokols, 2000). The interpersonal level

47
includes social groups, networks, and relationships that might influence whether campus cycling
occurs (e.g., the cyclist’s family, friends, athletic team, or faculty-student relationship). The
institutional level addresses specific institution/settings, which might influence the behavior. For
example, the university is an institution/setting. Specific characteristics of this institution that
might influence “campus cycling” could include the university’s free parking areas and hours,
availability of biking stations on campus, university specific traffic laws, the efforts of a
particular university committee, or the university’s busing/transportation system.
The community level in the SEM includes factors that go beyond the individual, primary
relationship, and a particular institution/setting (Stokols, 1996). In the case of campus cycling,
community level factors might include settings/organizations outside of the university and their
characteristics, as well as the relationship of the university with these settings/organizations (e.g.,
an adjacent neighborhood’s infrastructure including bike paths; a community’s traffic volume
and commute time; availability of buses in the community). The community level may also
include broader social, economic, cultural, health, and environmental factors or conditions that
impact campus cycling (e.g., the “cycling culture” of a city, gas prices, rate of physical inactivity
in a community, or socioeconomic status of a particular population).
Finally, the policy level includes laws, policies, regulations, and processes at the local,
state, or national levels that affect a given health behavior, such as campus cycling (Stokols,
1996). Examples of factors at this level might include the city’s biking zones, the state’s
transportation laws, the level of state funding for cycling lanes/safety, and support from the
national health agenda on cycling such as Healthy People 2020.
The Social Ecological Model blends well with the proposed study for a number of
reasons. First, SEM draws on the environment for having an influence on the physical, social,

48
and cultural dimensions that play a role in health and wellness (Stokols, 1996). Thousands of
students walk on the University of Alabama every day. Improvement in the environmental
health of the campus will also influence the overall health of the student population.
Health and wellness are interdisciplinary (Pongsiri & Roman, 2007) and the movement
to promote health considers the interdependencies in each of the levels of social ecology
(Stokols, 1996). This helps to integrate community-wide change, strategies for prevention, and
encompass epidemiology in coordination with making an active presence on the campus.
A greater understanding of the effects of policies, the physical environment, and the
social influences on physical activity (in this case, campus cycling) can be gained from social
ecological models (Giles-Corti & Donovan, 2002). Because campus cycling is understudied, the
SEM is a suitable framework to assess factors that influence this behavior and to identify
recommended strategies for improving bikeability on campuses. The information obtained can
help build effective programs and initiatives.
A number of studies have reported the importance of addressing cycling from an
ecological perspective. When considering active transport only on an individual level,
researchers found that the amount of staff and students of an Australian university that utilized
active transport, namely walking and cycling, was comparable. However, when comparing rates
of physical activity between those who walk or cycle and those who do not. Rissel, Mulley and
Ding (2013) found that those who use active transport were more likely to be active in general.
This gave program planners direction for the future programs and initiatives for the university
(Rissel, Mulley & Ding, 2013).
The RESIDential Environmental Study (RESIDE) was a five-year research program that
took place in Australia to understand why people started to cycle for both recreation and
49
transport by evaluating the impact of the Department of Planning’s Livable Neighborhood guide
(Badland, Knuiman, Hooper & Giles-Corti, 2013). Researchers found that enhancing self-
efficacy in the intrapersonal level, social support in the interpersonal level, and available
infrastructure in the community level helps to increase cycling levels (Badland, Knuiman,
Hooper & Giles-Corti, 2013).
TravelSmart, another Australian cycling program, was funded to target the staff and
students of a campus community (Hancock & Nuttman, 2014). Researchers were interested in
promoting cycling and gaining feedback from the population simultaneously and encompassed
the individual and organizational facets. By utilizing the interpersonal, institutional, and
community levels, the university was able to build a coordinated sustainability management team
to influence the individuals and policies, as these were found to be two of the largest barriers.
Furthermore, this pushed the university to address the carbon footprint and improve the overall
health of the university population and environment (Hancock & Nuttman, 2014).
When trying to understand choice of modality, Lavery, Paez and Kanaroglou (2013)
found that three main factors were influential: the demographic descriptors of the person, attitude
and the space or land use of the university. Those who were identified as active travelers were
more enthusiastic for their method of transportation and likely to use it on a regular basis. The
density of the built environment swayed those who used cars and public transit, with a positive
relationship between the rate of density and use of car. Finally, demographics contributed to the
mode of transport, whether a person could afford a personal vehicle, understood the important of
feasible alternatives or was willing to utilize public transport (Lavery, Paez & Kanaroglou,
2013).

50
Health Belief Model
Rosenstock and Hochbaum (1958) developed the Health Belief Model, which was based
on Lewin’s Field Theory of 1935 that founded the idea of barriers in behavior change. This
theory also utilizes the Value-Expectancy Theory, which discusses the value of the outcome or
an action and the expectation that the action may bring assuming that the population is interested
in health and preventing disease.
The Health Belief Model (HBM) is the most commonly used health promotion theory
with all influences on an intrapersonal level (Yarbrough & Braden, 2001). With beginnings in
subjective expected utility models, the theory combines knowledge, attitudes beliefs, history,
culture, and skills through four perceptions that serve as constructs for the theory.
While there are seven total constructs for the Health Belief Model, the four distinct ones
are perceived severity, perceived susceptibility, perceived barriers, and perceived benefits. As
the theory was expanded, cues to action, motivating factors, and self-efficacy were added to the
constructs. The three later added constructs are cues to action, self-efficacy, and modifying
factors level (Champion & Skinner, 2008).
Perceived severity is a person’s notion of how serious danger or condition may be on
one’s life. Three factors were found to influence this perception in relation to personal safety
and bicycles: commute distance, number of traffic signals passed, and familiarity with the law
(John & Najafi, 2011). The greater the distance and higher the number of traffic signals, the
greater the perception of severity.
Perceived susceptibility is a person’s belief about the chances of getting a disease or
health condition. If a person does not believe that there is a risk, there is little chance for change.
In a 2011 study, 37 of 100 individuals surveyed reported always wearing a helmet. Of these,
51
62% reported a personal experience, 81% knew someone who had been involved, and 65% had
witnessed a bicycle accident (John & Najafi, 2011). These three factors influence the perceived
susceptibility of the individual.
Perceived threat is a combination of perceived susceptibility and perceived severity.
While cues to action were found to affect the perception of threat, perceptions of threat were
found to be a strong influence on the attitude, intentions, and behaviors toward bicycle helmets
(Witte, Stokols, Ituarte & Schneider, 1993).
Perceived benefits are the believed values in a behavior. One of the main perceived
benefits is the ecological-economic awareness (de Geus, De Bourdeaudhuij, Jannes & Meeusen,
2007). Many cyclists reported cycling is cheaper than driving a motor vehicle and better for the
environment which was found to be a major benefit of the activity. In addition, bike lane
connectivity and rapidity of cycling were also found to be reported by those who regularly
cycled (Titze, Stronegger, Janschitz & Oja, 2008).
Perceived barriers are the believe obstacles that stand in the way of a person changing his
behavior. This is one of the most important constructs to determine change because barriers that
are too strong will not allow for change in a person no matter the level of the other constructs
(Janz & Becker, 1984). In order for healthy behaviors to start or flourish, the perceived benefits
must outweigh the perceived barriers. Researchers found that cyclists would be more likely to
wear helmets if manufacturers are able to make a helmet that is aesthetically pleasing with
convenient storage for little to no extra cost (John & Najafi, 2011). Both the look and
cumbersome qualities are barriers to a person wearing a helmet on a regular basis if at all.
Cues to action are the people, events, or things that prompt a person to change. This can
be as simple as a commercial on TV or being winded at the top of the stairs or as complex as a
52
diagnosis of disease or death of a loved one (Hayden, 2009). Helmet manufacturers and
educational campaigns were found to be effective cues to action for cyclists through the
promotion and aesthetics of the items (John & Najafi, 2011).
Self-efficacy is the belief and confidence in oneself to be able to complete conquer a
challenge. In this theory, it is also addressed for improvement through goal setting,
reinforcement, or monitoring. Campaigns aimed at increasing self-efficacy were found to be
effective at also increasing cycling for transportation (de Geus, De Bourdeaudhuij, Jannes &
Meeusen, 2007).
Modifying factors are those intrapersonal variables that can be swayed through education,
enlightenment, or change of environment. These factors come from a wide variety of sources.
Modifying factors of cycling are directly correlated with safety regulations. Fraser and Lock
(2010) reported positive associations with policies promoting safe cycling lane construction.
This theory has been well validated and studied in numerous interventions. Janz and
Becker found that the greatest results were those that came when barriers and susceptibility are
targeted (1984). This is also useful in a large population intervention. In a recent study, the
Health Belief Model and associated scale defined 52% of the variance associated with helmet use
(Ross, Thomson Ross, Rahman & Cataldo, 2010).
Purpose
The purpose of this study was to examine college student perceptions of safety and
factors contributing to campus cycling from an ecological perspective. Intrapersonal,
interpersonal, and institutional factors associated with campus cycling were assessed as well as
how these influences interact with each other. Recommendations for improving cycling were
obtained to address future needed campus changes.

53
CHAPTER THREE
METHODOLOGY
The purpose of this study was to examine college student perceptions of safety and
factors contributing to campus cycling from an ecological perspective. This was a non-
experimental, descriptive, correlational study. The main purpose was to describe the cycling
population of the University of Alabama, including subdemographic descriptives. Additionally,
factors at the intrapersonal, interpersonal, and institutional ecological levels were evaluated
while exploring possible relationships among them in the university population. This chapter
details the study design, population recruitment, instrument development, data collection, and
statistical analysis with the use of the Social Ecological Model and the Health Belief Model.
Institutional Review Board Approval
The Institutional Review Board (IRB) at the University of Alabama (UA) approved a
proposal with expedited review on September 19, 2014 (see Appendix B). Modifications were
made to the protocol based on the feedback of the dissertation committee. The application was
submitted for additional modifications and approved November 7, 2014.
Participant Recruitment
The study consisted of a sample of students from a large southeastern public university,
the University of Alabama. The inclusion criteria for study participation were: currently a
graduate or undergraduate student of the University of Alabama (UA), 17-24 years old, and able

54
to read and write English. These criteria were selected because they were characteristic of most
students at the university and would be helpful for recruitment purposes.
Alabama law states that those under the age of 19 years are considered minors. Due to
this, minors were involved in the study since the inclusion criteria for age range begins at 17
years. Due to the amount of students who live away from home and the inclusion of minors in
the study, a waiver of parental consent was approved for this study. Additionally, written
consent was waived for all participants to ensure anonymity. Those who did not fall within the
inclusion criteria or did not agree to the conditions of the survey were not included in the
statistical analysis.
A power analysis was conducted with G*Power Version 3.1.9.2 (Faul, Erdfelder,
Buchner & Lang, 2009) to calculate the needed sample size for a multiple binary logistic
regression with parameters (OR = 1.4; effect size = 0.2; α = 0.05; power = 0.8). This yielded a
sample size of n=450, which is comparable to a recent United States university study which
yielded a population of 457 students (Bopp, Kaczynski & Wittman, 2011).
The researcher sent recruitment emails to UA instructors to inform them of the study and
to gain permission to enter classes for participant recruitment. For classes where the instructor
allowed the researcher admittance, the researcher scheduled appointments to attend the class,
describe the study, and encourage participation. The researcher informed potential participants
that there were no repercussions for not participating in the study. The link to the Qualtrics
survey was sent to the instructors and posted to Blackboard for the use of participants in the
classroom.

55
Data Collection
Data collection took place over the course of four weeks between November and
December 2014. Surveys were completed in the privacy of the student’s choosing and time. The
study’s purpose and requirements were explained at the beginning of the electronic survey. The
participants accepted these to continue the study. All data were compiled through Qualtrics
survey software.
Qualtrics is a web-based survey and data collection software tool that is used worldwide
for marketing, research, and education (Qualtrics, 2014). This program was available through
the University of Alabama and allowed the researcher to easily add and edit instruments
developed through the website. This service then made a weblink available to students to easily
access the survey from any computer or smartphone.
Survey Instrument
The Cycling Survey for the University of Alabama included questions that addressed
demographic information including gender, age, rank in school, and distance from home to
campus (see appendix C). This instrument assessed the general public safety of campus,
perceptions of cycling, facilitations, and barriers of cycling based on the levels and constructs of
the Social Ecological Model and Health Belief Model. Questions were based on the US
Department of Transportation: National Highway Traffic Safety Administration’s Bikeability
Checklist, UC Davis’ Travel Survey, and California State University at Channel Islands’ Bike
and Transportation Survey. These were used to assess bikeability and active transport in
communities and campuses. Questions were based on either a 5-point Likert scale or “Check all
that apply” format to collect accurate information.

56
The questions from these surveys included 15 items addressing bicycle ownership. The
initial question was, “Do you own a bicycle?” If answered, “No,” then participants skipped
forward to other factors that influence cycling. If answered, “Yes,” the participants are asked to
describe cycling habits through a number of categorical questions. Examples included, “Is your
bicycle registered? (yes/no).” “When did you last ride your bike? (this week, within the last
month, within the last year, more than a year ago, never).” “Have you used the bike repair
stations on campus? (yes, no, didn’t know that there were any).”
In addition, questions were also paired with the intrapersonal, interpersonal, and
institutional levels of the Social Ecological Model. Those that were intrapersonal and
interpersonal included three “check all that apply” questions with the “other” type-in option to
cover the intrapersonal factors associated with cycling. These included the perception of factors
of the physical bicycle that may deter a person from cycling. Example statements included, “I
don’t know how to work the gears,” “I can never get my brakes working right,” or “I’m not
confident in using a bike lock.” Factors that influence cycling decisions included statements
such as “I don’t know how to ride a bike,” “I don't know cycling rules,” “my cycling skills are
poor,” or “I had an accident or scare/near-miss on a bike in the past.” Finally, statements of
appearance were addressed with such statements as, “looking/feeling silly on a bike,” “helmets
mess up my hair,” or “others look fit and I don’t.”
Those survey questions that were categorized as “institutional” included three “check all
that apply” questions with the “other” type-in option to cover the institutional factors associated
with cycling. These included statements about the perception of institutional factors such as,
“there are inadequate bike lanes or bike paths in my area,” “I dislike car fumes,” and “there is no
place to change my clothes after cycling to campus.” Statements that targeted traffic perceptions

57
included, “speed of automobiles,” “vehicles turning right in front of me when I’m going
straight,” “insufficient enforcement of both cycling and traffic laws,” and “vehicles hitting me
from behind when I’m cycling.” Factors relating to services and facilities that would encourage
cycling included “covered parking,” “locker/shower facilities,” “better markings/signage,” and
“more connectivity to downtown/shopping.”
Personal safety perceptions of the population were addressed through questions from the
Bicycle Helmet Attitudes Scale (Ross et al., 2010). These had all been used to assess
perceptions of severity, susceptibility, barriers, and benefits as well as cues to action based on the
constructs of the Health Belief Model. The survey included eighteen 5-point Likert scale
statement to address the perception of cycling safety among the campus population (Table 3.1).
These included perceived threat statements such as, “I do not go fast enough to need head
protection in a crash,” “bicycling is dangerous on slippery/wet roads,” and “if I injured my head
while riding my bike, it could seriously affect my ability to function at school.” Perceived
benefits were addressed through statements such as, “wearing a helmet would make me feel less
anxious when I ride a bike” and “I believe that wearing a helmet can prevent a serious head
injury if I have a bicycle accident.” Perceived barriers were addressed by statements such as, “I
would feel embarrassed wearing a bicycle helmet,” “quite frankly, wearing a helmet looks
stupid,” or the cost of helmets is generally more than they are worth.” Lastly, cues to action
were measured by statements such as, “I recall seeing commercials, ads or posters about wearing
a helmet while bicycling.”
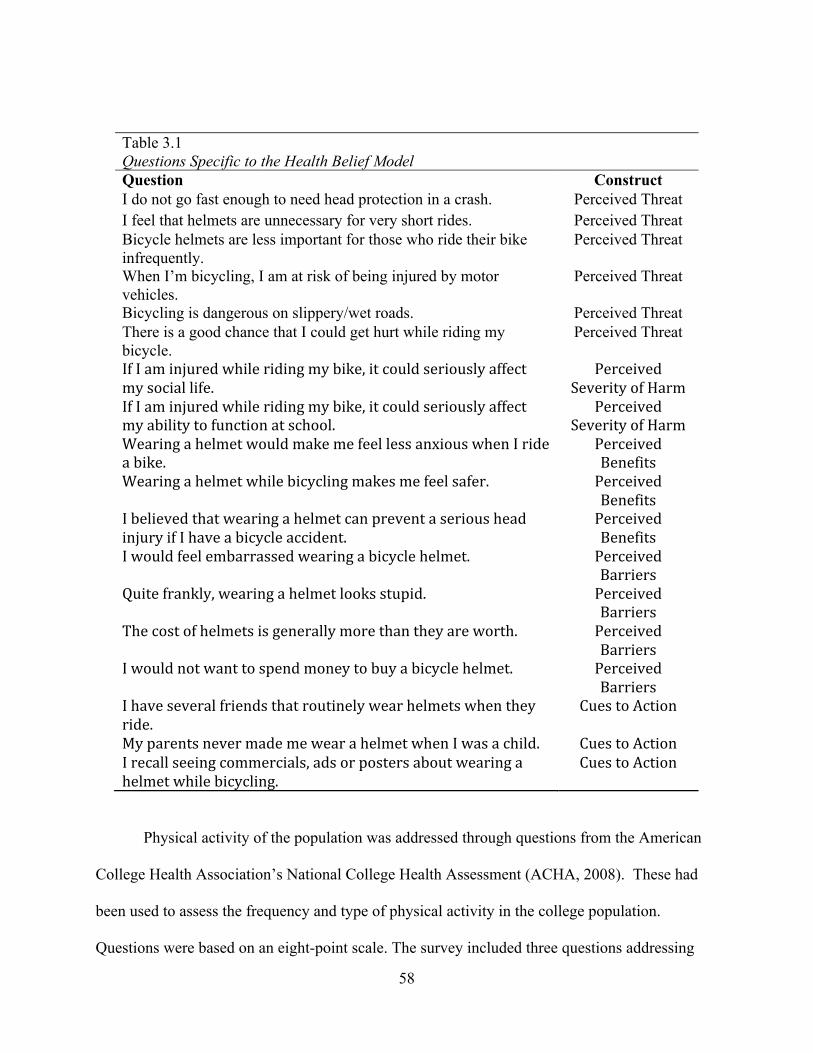
58
Table 3.1 Questions Specific to the Health Belief Model Question Construct I do not go fast enough to need head protection in a crash. Perceived Threat I feel that helmets are unnecessary for very short rides. Perceived Threat Bicycle helmets are less important for those who ride their bike infrequently.
Perceived Threat
When I’m bicycling, I am at risk of being injured by motor vehicles.
Perceived Threat
Bicycling is dangerous on slippery/wet roads. Perceived Threat There is a good chance that I could get hurt while riding my bicycle.
Perceived Threat
If I am injured while riding my bike, it could seriously affect my social life.
Perceived Severity of Harm
If I am injured while riding my bike, it could seriously affect my ability to function at school.
Perceived Severity of Harm
Wearing a helmet would make me feel less anxious when I ride a bike.
Perceived Benefits
Wearing a helmet while bicycling makes me feel safer. Perceived Benefits
I believed that wearing a helmet can prevent a serious head injury if I have a bicycle accident.
Perceived Benefits
I would feel embarrassed wearing a bicycle helmet. Perceived Barriers
Quite frankly, wearing a helmet looks stupid. Perceived Barriers
The cost of helmets is generally more than they are worth. Perceived Barriers
I would not want to spend money to buy a bicycle helmet. Perceived Barriers
I have several friends that routinely wear helmets when they ride.
Cues to Action
My parents never made me wear a helmet when I was a child. Cues to Action I recall seeing commercials, ads or posters about wearing a helmet while bicycling.
Cues to Action
Physical activity of the population was addressed through questions from the American
College Health Association’s National College Health Assessment (ACHA, 2008). These had
been used to assess the frequency and type of physical activity in the college population.
Questions were based on an eight-point scale. The survey included three questions addressing

59
physical activity. These were through a zero to seven-day scale and addressed how many times a
student had participated in moderate intensity, vigorous intensity, or resistance training in the
past week.
Finally, survey questions included primary and secondary modes of transportation, bike
ownership and uses, common bike practices on the campuses and in the area, cycling skills and
confidence, facility design and maintenance, bike and equipment, clothing and fashion, and other
influences. Finally, there were a number of questions regarding what would encourage a person
to ride a bike (“How important would these factors be in encouraging you to bicycle to campus
more often?”/”If UA offered the following, would it encourage you to bicycle to campus?”).
Participants responded on a scale of 1 (Not at all important) to 5 (Very Important) or 1 (Very
Likely) to 5 (Very Unlikely).
Commonly measured and relevant demographic variables were included in the survey,
such as gender, age, graduate/undergraduate status, year in school, area of study, race/ethnicity,
place of residence, length of commute, mode of transportation (primary and secondary), and
local zip code. These variables defined the characteristics of the sample and sub-groups in
further analyses.
The questions and statements above were directly related to the constructs of both the
Health Belief Model (Table 3.2) and the Social Ecological Model (Table 3.3). This connection
aided the researchers in better understanding the ecological perspective of the data and how this
could be utilized within the study.

60
Table 3.2 Survey Questions: Health Belief Model Constructs Question Construct
Where do you live? Perceived Benefit/Barrier If off campus, how many miles is your commute one-way to UA?
Perceived Benefit/Barrier
What state/country were you living in before you came to UA?
Perceived Benefit
Do you own or rent a bicycle? Perceived Benefit Is your bicycle registered? Perceived Threat How many miles a week do you ride your bike?
Perceived Barrier
Do you bicycle in combination with other transportation modes to campus?
Perceived Barrier
Do you lock your bike? Perceived Threat Do you wear a helmet? Perceived Threat Do you ride with the flow of traffic? Perceived Threat Do you stop at red lights/stop signs? Perceived Threat Have you ever had your bike stolen? Perceived Threat How would you rate bike parking on campus?
Modifying Factors
Have you used the bike repair stations on campus?
Modifying Factors
Are you willing to pay a facilities fee on campus for better bike paths and resources?
Perceived Benefits/ Modifying Factors
Personal Safety Factors Self-Efficacy Cycling in Traffic Self-Efficacy/ Perceived Threat Services/Facilities Perceived Benefits Bike & Equipment Modifying Factors Personal Appearance Self-Efficacy/ Perceived Barriers Factors that encourage cycling Perceived Benefits Classes that would encourage cycling Cue to Action Perceptions of Cycling Safety All Physical Activity Perceived Benefits
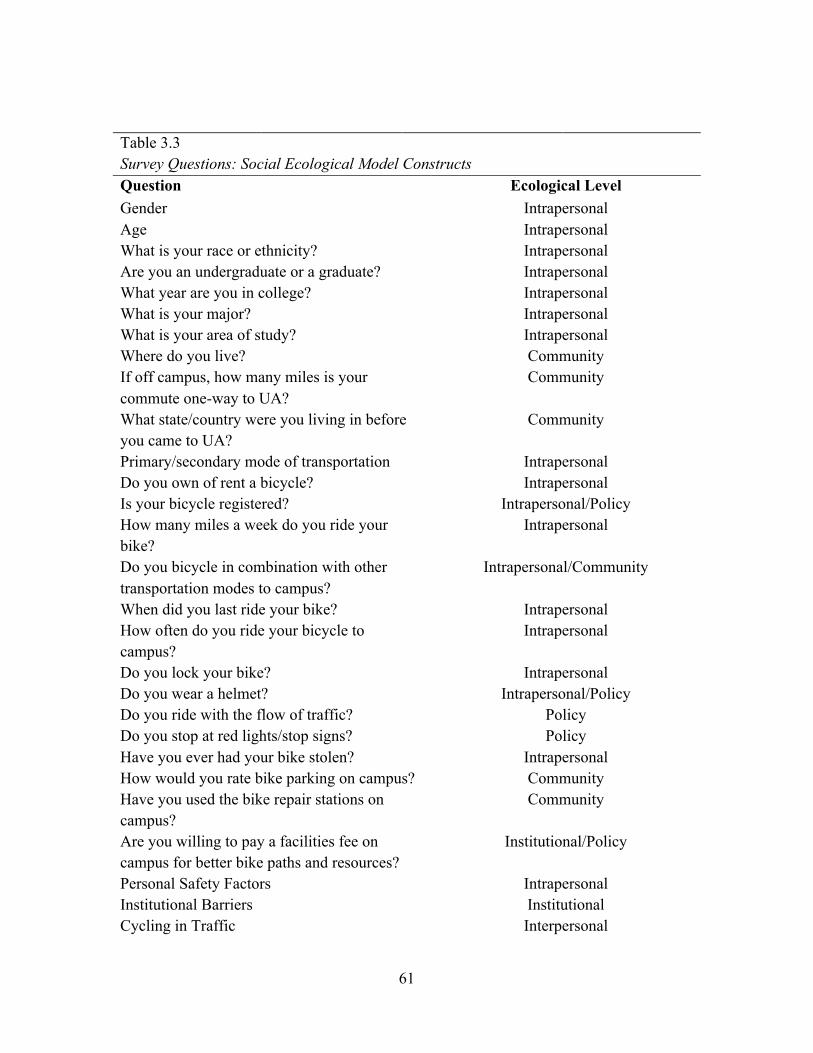
61
Table 3.3 Survey Questions: Social Ecological Model Constructs Question Ecological Level Gender Intrapersonal Age Intrapersonal What is your race or ethnicity? Intrapersonal Are you an undergraduate or a graduate? Intrapersonal What year are you in college? Intrapersonal What is your major? Intrapersonal What is your area of study? Intrapersonal Where do you live? Community If off campus, how many miles is your commute one-way to UA?
Community
What state/country were you living in before you came to UA?
Community
Primary/secondary mode of transportation Intrapersonal Do you own of rent a bicycle? Intrapersonal Is your bicycle registered? Intrapersonal/Policy How many miles a week do you ride your bike?
Intrapersonal
Do you bicycle in combination with other transportation modes to campus?
Intrapersonal/Community
When did you last ride your bike? Intrapersonal How often do you ride your bicycle to campus?
Intrapersonal
Do you lock your bike? Intrapersonal Do you wear a helmet? Intrapersonal/Policy Do you ride with the flow of traffic? Policy Do you stop at red lights/stop signs? Policy Have you ever had your bike stolen? Intrapersonal How would you rate bike parking on campus? Community Have you used the bike repair stations on campus?
Community
Are you willing to pay a facilities fee on campus for better bike paths and resources?
Institutional/Policy
Personal Safety Factors Intrapersonal Institutional Barriers Institutional Cycling in Traffic Interpersonal

62
Institutional Facilitators Institutional Bike & Equipment Intrapersonal Personal Appearance Intrapersonal/ Interpersonal Factors that encourage cycling Community Classes that would encourage cycling Institutional Where would you cycle? Community Perceptions of Cycling Safety Intrapersonal/Interpersonal/Institutional Physical Activity Intrapersonal Suggestions/Comments Intrapersonal
Piloting the Survey
A pilot study is a “small scale version or trial run in preparation for a major study” (Polit,
Beck & Hungler, 2001). It is often used as a pretest for an instrument (Baker, 1994). Although a
pilot study does not guarantee the success of the study, the process ensures that the study purpose
is understood, instructions are clear, wording is appropriate to the population, survey questions
are understood, important issues are covered, and that the question flow is logical (Simon,
2011).
A panel of 10 students and stakeholders of the university piloted the survey instrument
used for the study. All participants included in the piloting were either stakeholders of the
university from the Bike Advisory Group or part of the participating student population. Each
person independently read the survey and gave feedback. Changes to the instrument were made
accordingly.
Survey Completion
Each participant who chose to take the survey filled out the web-administered survey.
The first screen of the survey was the informed consent section (Appendix B). If a participant
chose not to consent, he/she was taken to the final page of the survey, thanked for his/her
consideration, and the survey closed. By filling out the surveys, respondents indicated they

63
understood their responsibility in the survey, they were between the ages of 17 and 24, they were
currently enrolled at the University of Alabama, and they read and understand English.
Participants were allowed to skip questions if they did not understand or feel comfortable
completing the question. Surveys lasted approximately 20 minutes and consisted of 65 items.
At the end of the survey, each participant were thanked for his/her time on the last page and
provided contact information to the researcher and the UA Institutional Review Board for
questions.
Data Analysis
All data analysis was conducted using the Statistical Package for the Social Sciences
(SPSS), version 21 for Macintosh (SPSS Inc., 2013) in coordination with Qualtrics automatic
conversion. Various levels of analysis were performed on the completed and cleaned data set.
Descriptive statistics, including frequencies and Chi Square, were generated on all study
variables. Surveys that did not meet criteria or contain inconsistencies were not included in the
final analyses.
Based on preliminary analyses, a series of univariate and multivariate logistic regressions
were used to analyze the data and determine relationships between participants who cycled and
those who did not. This was appropriate to examine the categorical outcome variable in the
study. The a priori was set at less than or equal to .05.
Research Questions
The following research questions were addressed:
Research Question 1: Of the population sampled, what was the prevalence of on-campus
cycling at the University of Alabama?

64
This research question focused on the prevalence of cycling at the University of
Alabama. To examine the prevalence of this behavior among college students sampled at UA,
simple frequencies and descriptive analysis were run in SPSS. Cycling was a categorical
variable based on bike ownership or rental (YES/NO) and frequency of cycling is a categorical
variable (never to daily).
Cycling prevalence among the UA sample was analyzed by examining frequencies,
percentiles, and a bar chart. Frequency of cycling was analyzed by examining descriptives to
determine distribution, variability, and measures of central tendency.
Research Question 2: How did campus cycling differ between demographic subgroups at the
University of Alabama?
This research question focused on the prevalence of cycling among demographic
subgroups at the University of Alabama. To examine the prevalence between subgroups among
college students sampled at UA, Chi Square was used to analyze each predictor of the outcome
in SPSS. Multivariate logistic regression was used for further in-depth analysis.
Predictors included gender (male/female), race/ethnicity (non-Hispanic white, Asian,
Hispanic/Latino, Black/African American, American Indian/Alaska Native, Native
Hawaiian/Pacific Islander, Other), campus living (On/Off), school status
(graduate/undergraduate), and age.
Research Question 3: Which factors facilitate or hinder cycling behaviors at the University of
Alabama?
Subquestion A: Which intrapersonal factors facilitate or hinder cycling behaviors?
Subquestion B: Which interpersonal factors facilitate or hinder cycling behaviors?
Subquestion C: Which institutional factors facilitate or hinder cycling behaviors?

65
This research question and its subquestions focused on factors correlated with each level
of the Social Ecological Model and the preference of those factors between participants who
cycled and those who did not. Each of the questions was analyzed with a chi square analysis.
Univariate and multivariate logistic regressions were used for further in depth analysis.
Predictors for these research questions were all categorical and included subjects such as
environmental factors, cycling skills and confidence, bike and equipment and perceptions of
cycling safety.
Research Question 4: What strategies or suggestions for improving campus cycling were
recommended by students at the University of Alabama?
This question focused on strategies or suggestions for improving cycling at the University
of Alabama which the survey participants reported. Participants were asked to write in their
suggestions. Simple frequencies and descriptive analysis were used to analyze the data.
Summary
Chapter three summarizes the research methods and questions used to analyze data
collected from the Campus Cycling Survey for the University of Alabama. Descriptive statistics
were used to organize and summarize the population and prevalence of campus cycling (Daniel,
2004). These included age, gender, race/ethnicity, participating college, and year in college.
Further, cyclists were asked about simple cycling practices such as their practices at stoplights,
use of bike locks, and use of bike helmets. Researchers used univariate and multivariate logistic
regression to analyze factors at the intrapersonal, interpersonal, and institutional levels of the
Social Ecological Model. This was done to determine which levels were most influential for the
cyclist and non-cyclist alike. The a priori for this analysis was set at .05, determining that there

66
was a 5% chance of a Type 1 error. Finally, participants were asked for suggestions for cycling
improvement and additional comments.
67
CHAPTER FOUR
RESULTS
Chapter four presents the study results of statistical data analysis. A number of studies
have attempted to explore bikeability on campuses (Bopp et al, 2011; Bonham & Koth, 2010;
Sisson & Tudor-Locke, 2008; Rybarczyk & Gallagher, 2014; Akar & Clifton, 2009). However,
these lacked theory and framework to support health behavior change needed by stakeholders.
The purpose of this study was to examine college student perceptions of safety and factors
contributing to campus cycling from an ecological perspective. Intrapersonal, interpersonal, and
institutional factors associated with safety and campus cycling were assessed as well as how
these influencers interacted with each other.
To explore the issues above, the study examined the prevalence and descriptives of
campus cycling and factors that influence or hinder cycling behavior on the intrapersonal,
interpersonal, and institutional levels. Finally, strategies and suggestions were reported for
further research. The results are organized in four sections based on the research questions.
Chapter four describes the study results. All data were analyzed using the Statistical
Package for the Social Sciences, version 21 for Macintosh (SPSS Inc., 2013). Descriptive
statistics describe the characteristics of the sample and prevalence of cycling. Chi square
analysis, univariate and multivariate logistic regressions evaluate the demographic subgroups
and factors that facilitate or hinder cycling behaviors The a priori criteria to indicate significance
of a predictor is less than or equal to .05.

68
Data Source
A total of 516 university students responded to the 2014 Cycling Survey for the
University of Alabama. The study was delimited to participants who responded to survey
questions about rent or ownership of a cycle, frequency of cycling, gender, ethnicity, age, and
university status.
Sample Characteristics
The resulting analyzed pool was a sample of 356 participants. Of the respondents, 73.9%
were female. Over half of the students were 21-22 years of age (54.4%) and 76.1% of the
population described themselves as white/non-Hispanic. Of the sample, 93.3% were
undergraduates, 82.7% were juniors or seniors, and 32.1% had academic majors in General
Health Studies, Exercise & Sport Science, or Public Relations. Table 4.1 highlights the
demographic characteristics of the student sample.

69
Table 4.1 Student Demographics (N=356)
Variable N % Gender
Male 93 26.1% Female 263 73.9%
Age 18 20 5.6% 19 36 10.1% 20 70 19.7% 21 118 33.1% 22 76 21.3% 23 23 6.5% 24 13 3.7% Race/Ethnicity American Indian/Alaska Native 9 2.5% Asian 11 3.1% Black/African American 53 14.9% Hispanic/Latino 7 2.0% Native Hawaiian/Pacific Islander 2 0.6% White/Non-Hispanic 271 76.1% Other 3 0.8% University Status
Undergraduate 332 93.3% Graduate 24 6.7%
Year in College 1 22 6.2% 2 37 10.9% 3 91 26.7% 4 191 56.0% Top 5 Undergraduate Majors General Health Studies 48 13.5% Public Relations 38 10.7% Exercise & Sport Science 28 7.9% Advertising 15 4.2% Athletic Training 12 3.4% Telecommunication & Film 12 3.4%
Table 4.2 presents additional characteristics of the sample. Of the sample, 71.3% reported
their overall health to be good or very good, 45.7% reported participating in moderately intense
exercise four or more days per week for at least 30 minutes, 27.5% participated in vigorously-
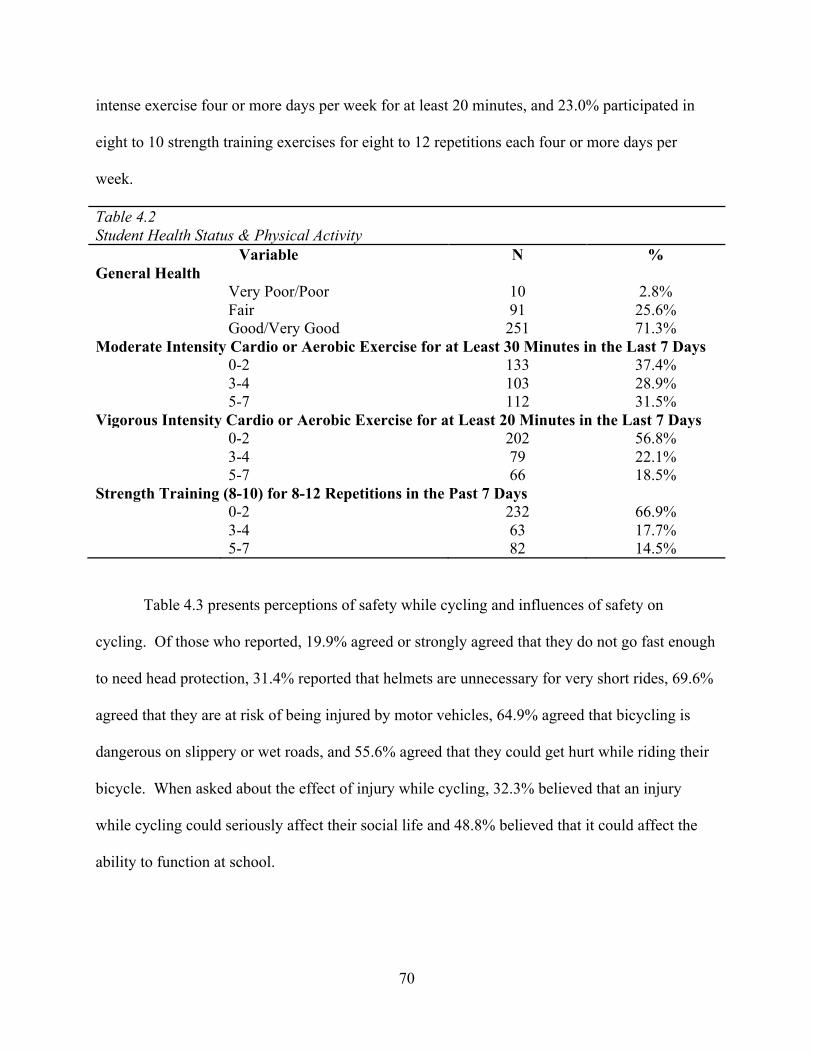
70
intense exercise four or more days per week for at least 20 minutes, and 23.0% participated in
eight to 10 strength training exercises for eight to 12 repetitions each four or more days per
week.
Table 4.2 Student Health Status & Physical Activity
Variable N % General Health
Very Poor/Poor 10 2.8% Fair 91 25.6% Good/Very Good 251 71.3%
Moderate Intensity Cardio or Aerobic Exercise for at Least 30 Minutes in the Last 7 Days 0-2 133 37.4% 3-4 103 28.9% 5-7 112 31.5% Vigorous Intensity Cardio or Aerobic Exercise for at Least 20 Minutes in the Last 7 Days 0-2 202 56.8% 3-4 79 22.1% 5-7 66 18.5% Strength Training (8-10) for 8-12 Repetitions in the Past 7 Days
0-2 232 66.9% 3-4 63 17.7%
5-7 82 14.5%
Table 4.3 presents perceptions of safety while cycling and influences of safety on
cycling. Of those who reported, 19.9% agreed or strongly agreed that they do not go fast enough
to need head protection, 31.4% reported that helmets are unnecessary for very short rides, 69.6%
agreed that they are at risk of being injured by motor vehicles, 64.9% agreed that bicycling is
dangerous on slippery or wet roads, and 55.6% agreed that they could get hurt while riding their
bicycle. When asked about the effect of injury while cycling, 32.3% believed that an injury
while cycling could seriously affect their social life and 48.8% believed that it could affect the
ability to function at school.

71
Table 4.3 Safety Perceptions of Students
Survey Statement N % I do not go fast enough to need head protection in a crash.
Strongly Disagree/Disagree 183 51.4% Neither Agree nor Disagree 94 26.4% Agree/Strongly Agree 71 19.9%
I feel that helmets are unnecessary for very short rides. Strongly Disagree/Disagree 145 40.7% Neither Agree nor Disagree 88 24.7% Agree/Strongly Agree 112 31.4% Bicycle helmets are less important for those who ride their bike infrequently. Strongly Disagree/Disagree 196 55.1% Neither Agree nor Disagree 107 30.1% Agree/Strongly Agree 45 12.7% When I’m bicycling, I am at risk of being injured by motor vehicles.
Strongly Disagree/Disagree 33 9.3% Neither Agree nor Disagree 67 18.8%
Agree/Strongly Agree 248 69.6% Bicycling is dangerous on slippery/wet roads. Strongly Disagree/Disagree 33 9.3% Neither Agree nor Disagree 81 22.8% Agree/Strongly Agree 231 64.9% There is a good chance that I could get hurt while riding my bicycle. Strongly Disagree/Disagree 54 15.1% Neither Agree nor Disagree 96 27.0% Agree/Strongly Agree 198 55.6% If I am injured while riding my bike, it could seriously affect my social life. Strongly Disagree/Disagree 102 28.6% Neither Agree nor Disagree 129 36.2% Agree/Strongly Agree 115 32.3% If I am injured while riding my bike, it could seriously affect my ability to function at school. Strongly Disagree/Disagree 64 18.0% Neither Agree nor Disagree 105 29.5% Agree/Strongly Agree 174 48.8% Wearing a helmet would make me feel less anxious when I ride my bike. Strongly Disagree/Disagree 120 33.7% Neither Agree nor Disagree 133 37.4% Agree/Strongly Agree 92 25.8% Wearing a helmet while bicycling makes me feel safer. Strongly Disagree/Disagree 83 23.3% Neither Agree nor Disagree 117 32.9% Agree/Strongly Agree 143 40.1%

72
I believe that wearing a helmet can prevent a serious head injury if I have a bicycle accident. Strongly Disagree/Disagree 23 6.4% Neither Agree nor Disagree 64 18.0% Agree/Strongly Agree 258 72.5% I would feel embarrassed wearing a bicycle helmet. Strongly Disagree/Disagree 69 19.3% Neither Agree nor Disagree 101 28.4% Agree/Strongly Agree 174 48.9% Quite frankly, wearing a helmet looks stupid. Strongly Disagree/Disagree 83 23.3% Neither Agree nor Disagree 101 28.4% Agree/Strongly Agree 161 45.3% The cost of helmets is generally more than they are worth. Strongly Disagree/Disagree 154 43.2% Neither Agree nor Disagree 137 38.5% Agree/Strongly Agree 53 14.9% I would not want to spend money to buy a bicycle helmet. Strongly Disagree/Disagree 109 30.6% Neither Agree nor Disagree 110 30.9% Agree/Strongly Agree 125 35.1% I have several friends that routinely wear helmets when they ride. Strongly Disagree/Disagree 177 49.7% Neither Agree nor Disagree 98 27.5% Agree/Strongly Agree 69 19.4% My parents never made me wear a helmet when I was a child. Strongly Disagree/Disagree 195 54.7% Neither Agree nor Disagree 76 21.3% Agree/Strongly Agree 75 21.0% I recall seeing commercials, ads or posters about wearing a helmet while bicycling. Strongly Disagree/Disagree 88 24.7% Neither Agree nor Disagree 104 29.2% Agree/Strongly Agree 152 42.7%
Missing Data
Missing data can create underrepresentation in terms of variables that can lead to
limitations in the research (Schneider, Clark, Rakowski & Lapane, 2012; Raghunathan, 2004).
Participants of the 2014 Cycling Survey for the University of Alabama provided information that
gives insight to researchers about the prevalence of cycling at UA and cycling demographics
such as gender, age, race/ethnicity, university status, and bike use. Statistically, the usefulness of
73
these variables is limited by the number of participants who refused to answer said questions
(N=163). Participants who refused to answer these questions were deleted from the sample.
Nonetheless, the resulting data were present in sufficient numbers to make analysis possible, as
the sample size was sufficient for statistical analysis.
Analysis of Research Questions
Research Question 1: Of the population sampled, what is the prevalence of on-campus cycling
at the University of Alabama?
The prevalence of on-campus cycling was analyzed through frequency and descriptive
statistics. Of the participants, 28.1% responded that they own or rent a bike on the University of
Alabama campus (N = 100) with a confidence interval of (23.4, 32.8). Table 4.4 presents the
data that was collected from those who responded, “yes” to ownership or rental of bikes on the
university campus, including registration, purpose of cycling, frequency of cycling, average
number of miles cycled per week, last time used, and directed questions of cycling safety and
security.

74
Table 4.4 Cycling Prevalence in Student Sample (N=100)
Question N % Is your bicycle registered with the university?
Yes 53 53.0% No 46 46.0%
How many miles a week do you ride your bike? 0 12 12.0% 1-25 68 68.0% 26-50 9 9.0% 51+ 4 4.0% How do you use your bike? Work 31 31.0% School 85 85.0% Shopping 8 8.0% Exercise 43 43.0% Recreation 46 4.0% Other 2 2.0% How often do you bike in combination with other transportation modes?
Never 53 53.0% Rarely/Sometimes 34 34.0% Often/All of the Time 13 13.0%
When did you last ride your bike? More than a year ago 6 6.0% Within the last year 19 19.0% Within the last month 14 14.0% This week 61 61.0% How often do you ride a bike to campus? Never, live off campus 22 22.0% Never, live on campus 13 13.0% A couple times per year 9 9.0% A couple times per month 9 9.0% A couple times per week 18 18.0% Daily 29 29.0% Do you lock your bike? Yes 94 94.0% No 6 6.0% Do you wear a helmet? Yes 13 13.0% No 87 87.0% Do you ride with the flow of traffic? Yes 81 81.0% No 18 18.0% Do you stop at red lights?

75
Yes 82 82.0% No 18 18.0% Do you stop at stop signs? Yes 63 63.0% No 36 36.0% Have you ever had your bike stolen? Yes 22 22.0% No 78 78.0% How would you rate bike parking on campus? Very Poor/Poor 28 28.0% Fair 47 47.0% Good/Very Good 26 26.0% Have you every used the bike repair stations on campus? Yes 19 19.0% No 40 40.0% Do not know there were any 41 41.0% Are you willing to pay a fee on campus for better bike paths and resources? Yes 67 67.0% No 33 33.0%
Research Question 2: How does campus cycling differ between demographic subgroups at the
University of Alabama?
Demographic subgroups were identified as gender, age, race/ethnicity, university status,
and year in college (Table 4.5). These were analyzed with univariate logistic regressions of the
cycling sample.

76
Table 4.5 Cyclist Demographics (N=100) Variable
N % of Variable
Cycling Gender Male 38 40.9% Female 62 23.6% Age 18 8 40.0% 19 12 33.3% 20 25 35.7% 21 28 23.7% 22 17 22.4% 23 6 26.1% 24 4 30.8% Race/Ethnicity White/Non-Hispanic 84 31.0% Black/African American 5 9.4% Other 11 34.4% University Status Undergraduate 93 28.0% Graduate 7 29.2% Year in College Freshmen 8 36.4% Sophomore 11 29.7% Junior 25 27.5% Senior 51 26.7% Colleges College of Arts & Sciences 19 33.3% Culverhouse College of Commerce 12 33.3% College of Communication & Information
Sciences 19 27.1%
College of Education 8 18.6% College of Engineering 14 60.9% College of Human Environmental Sciences 15 18.1% Capstone College of Nursing 0 0.0% School of Social Work 1 50.0%

77
In the overall analysis of females, 23.6% of the total female sample owned or rented a
bike on campus while 40.9% of the total male participants owned or rented a bike (Table 4.6).
This relationship is significant. Gender had an effect on the likelihood of cycling (O.R. = 2.24).
This indicated males were approximately twice as likely to cycle as their female counterparts.
Table 4.6 Logistic Regression Analysis of the Population in Comparison of Cyclists vs. Non-Cyclists Variable p-value O.R. C.I. Gender p = .002** 2.24 1.36, 3.70 Age p = 0.08 0.86 0.73, 1.02 Race/Ethnicity p = .009** African-American/Black Other p = .003** 4.31 1.66, 11.22 White/Non-Hispanic p = .007** 5.03 1.55, 16.28 Undergraduate/Graduate p = .903 0.95 0.38, 2.35 Year in College p = .806 Freshmen Sophomore p = .341 1.57 0.62, 3.96 Junior p = .705 1.16 0.54, 2.52 Senior p = .891 1.04 0.59, 1.82 * p ≤ .05 ** p ≤ .01 *** p ≤ .001 Race/ethnicity was found to be statistically significant (p = .009). The non-Hispanic
white population was five times more likely than the African American/Black population to
cycle (C.I. = 1.66, 11.22) and all other races were four times more likely than the African
American/ Black population to cycle (C.I. 1.55, 16.28).
A multivariate logistic regression was performed to ascertain the effects of gender, age,
and race/ethnicity on the likelihood that participants are cyclists. Significance was found in
gender (p ≤ .001), non-Hispanic white population and other combined races (both p = .002), and
age (p = .034). The logistic regression model explained 11.5% of the variance in cycling (Table
4.7).

78
Table 4.7 Multivariate Logistic Regression Analysis of the Population in Comparison of Cyclists vs. Non-Cyclists Variable p-value O.R. C.I. Gender p ≤ .001*** 2.63 1.55, 4.46 Age p = .034* 0.83 0.69, 0.99 Race/Ethnicity p = .002** African-American/Black Other p = .574 0.80 0.36, 1.77 White/Non-Hispanic p = .002** 0.15 0.04, 0.49
Research Question 3: Which factors facilitate or hinder cycling behaviors at the University of
Alabama?
Crosstabs and univariate logistic regression analyses calculated the strength of the
association between factors correlated with each level of the Social Ecological Model and the
preference of those factors between those who cycled and those who did not. Each of the three
ecological levels is analyzed independently below.
Subquestion A: Which intrapersonal factors facilitate or hinder cycling behaviors?
Intrapersonal factors were compared between cyclists and non-cyclists in the sample,
including personal safety factors, bike specific issues, and appearance. Of these, 56.0% of the
cycling sample indicated the weather is unsuitable while 20.7% of the non-cycling sample
reported the same. Conversely, all but one of the statements in the appearance category
indicated a lower percentage from the cycling sample than the non-cycling sample. Table 4.8
presents intrapersonal perceptions of safety while cycling and influences of other personal
factors that facilitate cycling, including number and percentage of cyclists and non-cyclists.
These questions reflect the personal perceptions of the individual.

79
Table 4.8 Intrapersonal Cycling Factors
Question Cyclist (N=100)
Non-Cyclists (N=256)
N % N % Personal Safety Factors What factors influence your cycling decisions?
I don’t know how to ride a bike. 0 0.0% 16 2.8% The distance is too far. 29 29.0% 79 30.9%
The weather is not suitable. 56 56.0% 53 20.7% I have personal safety/security concerns. 16 16.0% 42 16.4% I don’t know cycling rules. 5 5.0% 41 16.0% My cycling skills are poor. 2 2.0% 37 14.5% I can’t afford a bicycle. 1 1.0% 29 11.3% I’m not in shape to ride a bicycle. 2 2.0% 12 4.7% I’m concerned about aggressive/distracted
drivers. 43 43.0% 81 31.6%
I don’t like being assertive with drivers. 10 10.0% 32 12.5% I don’t like to ride after dark. 30 30.0% 67 26.2% I had an accident or scare/near-miss on a
bike in the past. 13 13.0% 16 6.3%
I don’t like riding close to traffic. 22 22.0% 87 34.0% Bike Specific Issues What specific issues about the bicycle influence your cycling behaviors? I don't know how to work the gears. 5 5.0% 24 9.4% I’m afraid that I’ll get stranded with a flat
tire. 7 7.0% 31 12.1%
I’m not confident in using a bike lock. 5 5.0% 39 15.2% I can never get my brakes working right. 5 5.0% 19 7.4% I don’t know how to carry books or other
items on my bike. 9 9.0% 75 29.3%
I’m afraid my bike will get stolen. 8 8.0% 61 23.8% I wish I knew more about general bike
maintenance. 15 15.0% 42 16.4%
Appearance What appearance related factors influence your cycling decisions?
My clothing while riding 24 24.0% 90 35.2% Difficulty bringing spare clothing. 15 15.0% 42 16.4% Appearance after cycling 35 35.0% 102 39.8% Helmets mess up my hair. 19 19.0% 88 34.4% I feel silly with a helmet on. 32 32.0% 97 37.9% I feel or look silly on a bike. 5 5.0% 63 24.6% No other people in the area cycle. 5 5.0% 11 4.3% Other cyclists look fit and I don’t. 6 6.0% 25 9.4% My shoes are inappropriate. 9 9.0% 30 11.7%

80
Chi-square analysis was performed on all of the intrapersonal cycling factors (Table 4.9).
Of these, 14 statements were statistically significant. Of the personal safety factors, weather and
perception of cycling were the most significant barriers (p ≤ .001 and p = .001, respectively). Of
the bike specific issues, knowing how to carry books or cargo was the most significant (p ≤
.001). Of the appearance issues, feeling silly on a bike was the most significant (p ≤ .001).

81
Table 4.9 Intrapersonal Cycling Factor Results
Question Personal Safety Factors p-value What factors influence your cycling decisions?
I don’t know how to ride a bike. p = .011** The distance is too far. p = .732
The weather is not suitable. p ≤ .001*** I have personal safety/security concerns. p = .926 I don’t know cycling rules. p = .005** My cycling skills are poor. p = .001** I can’t afford a bicycle. p = .002** I’m not in shape to ride a bicycle. p = .241 I’m concerned about aggressive/distracted
drivers. p = .043*
I don’t like being assertive with drivers. p = .511 I don’t like to ride after dark. p = .466 I had an accident or scare/near-miss on a
bike in the past. p = .036*
I don’t like riding close to traffic. p = .027* Bike Specific Issues What specific issues about the bicycle influence your cycling behaviors? I don't know how to work the gears. p = .175 I’m afraid that I’ll get stranded with a flat
tire. p = .161
I’m not confident in using a bike lock. p = .008** I can never get my brakes working right. p = .413 I don’t know how to carry books or other
items on my bike. p ≤ .001***
I’m afraid my bike will get stolen. p = .002** I wish I knew more about general bike
maintenance. p = .745
Appearance What appearance related factors influence your cycling decisions?
My clothing while riding p = .043* Difficulty bringing spare clothing. p = .249 Appearance after cycling p = .399 Helmets mess up my hair. p = .004** I feel silly with a helmet on. p = .299 I feel or look silly on a bike. p ≤ .001*** No other people in the area cycle. p = .774 Other cyclists look fit and I don’t. p = .257 My shoes are inappropriate. p = .460
* p < .05 ** p < .01 *** p < .001

82
Subquestion B: Which interpersonal factors facilitate or hinder cycling behaviors?
Interpersonal factors were compared between cyclists and non-cyclists in the sample,
including traffic interaction concerns. Greatest differences between the percentages of chose
statements were with concern about vehicles turning in from of the person while cycling, in
which cyclists’ response was 51.0% and non-cyclists’ response was 36.3%. Table 4.10 presents
interpersonal perceptions of safety while cycling and influences of other personal factors that
influence cycling, including number and percentage of cyclists and non-cyclists. These address
the perceptions of the sample regarding interaction with traffic and drivers.
Table 4.10 Interpersonal Cycling Factors
Question Cyclist (N=100)
Non-Cyclist (N=256)
N % N % Traffic Interaction Concerns What are you specific concerns about bicycling in traffic?
Volume of motor vehicles 31 31.0% 100 39.1% Speed of automobiles 47 47.0% 146 57.0%
Moving vehicles 38 38.0% 82 32.0% Distracted driving 63 63.0% 150 58.6% Possibility of bike getting stolen while it is
parked 18 18.0% 56 21.9%
Insufficient enforcement of both cycling and traffic laws
19 19.0% 29 11.3%
Motorists who run red lights and stop signs 42 42.0% 88 34.4% Vehicles turning right in front of me when
I’m going straight 51 51.0% 93 36.3%
Crossing at intersections 47 47.0% 87 34.0%
Chi-square analysis was performed on all of the interpersonal cycling factors (Table
4.11). Of these, two statements were statistically significant. Of the traffic interaction concerns,
vehicles turning in front of the cyclists and crossing intersections were statistically significant (p
= .011 and p = .023, respectively).

83
Table 4.11 Interpersonal Cycling Factor Results
Question Traffic Interaction Concerns p-value What are you specific concerns about bicycling in traffic?
Volume of motor vehicles p = .156 Speed of automobiles p = .088
Moving vehicles p = .284 Distracted driving p = .446 Possibility of bike getting stolen while it is
parked p = .418
Insufficient enforcement of both cycling and traffic laws
p = .057
Motorists who run red lights and stop signs p = .179 Vehicles turning right in front of me when
I’m going straight p = .011*
Crossing at intersections p = .023* * p < .05 ** p ≤ .01 *** p ≤ .001
Subquestion C: Which institutional factors facilitate or hinder cycling behaviors?
Institutional factors were compared between cyclists and non-cyclists in the sample,
including institutional barriers and institutional facilitators. Of the barriers, 51.0% of cyclists
indicated inadequate bike lanes while 24.2% of non-cyclists responded the some. The only
barrier chosen more by non-cyclists was difficulty riding to transit (7.0%) versus the cyclist
response (3.0%). Similarly, the percentage of institutional facilitators were higher among the
cycling sample than the non-cycling sample except for the ladies-only cycling class option which
was chosen by the non-cycling sample than the cycling sample (16.4% and 13.0%, respectively).
Table 4.12 presents institutional factors of safety while cycling and influences of other personal
factors that facilitate cycling, including number and percentage of cyclists and non-cyclists.
These are perceived factors of the built environment that encourage or inhibit students from
cycling.

84
Table 4.12 Institutional Cycling Factors
Question Cyclist (N=100)
Non-Cyclist (N=256)
N % N % Institutional Barriers What community or organizational factors influence your cycling decisions?
There are inadequate bike lanes or bike paths in my area.
51 51.0% 62 24.2%
The local roads are too busy for me to cycle on them.
39 39.0% 101 39.5%
The University of Alabama is not well connected to the city of Tuscaloosa.
23 23.0% 25 9.8%
Some of my routes are not well lit. 24 24.0% 51 19.9% The roads are in terrible shape. 19 19.0% 39 15.2% It’s difficult to ride my bike to transit. 3 3.0% 18 7.0% I dislike car fumes. 10 10.0% 11 4.3% There is nowhere to park my bike. 20 20.0% 22 8.6% There are no facilities for locking or securing
my bike. 11 11.0% 16 6.3%
There is no place to change my clothes after cycling to campus.
13 13.0% 15 5.9%
Institutional Facilitators What services/facilities would you be interested in using at UA if they were offered?
Covered parking 56 56.0% 137 53.5% Indoor bike parking 46 46.0% 55 21.9% Locker/shower facilities 18 18.0% 34 13.3% Bike lockers 30 30.0% 39 15.2% Bike repair classes 17 17.0% 24 9.4% Bike safety classes 18 18.0% 35 13.7% Ladies-only cycling classes 13 13.0% 42 16.4% Organized social cycling events 21 21.0% 16 6.3% Beginner cycling classes 15 15.0% 38 14.8% More direct routes 54 54.0% 86 33.6% More security cameras on bike racks 33 33.0% 55 21.5% More bike lanes 70 70.0% 88 34.4% Wider lanes on the road 43 43.0% 87 34.0% Better markings/signage 33 33.0% 49 19.1% More connectivity to downtown/shopping 35 35.0% 50 19.5% Better lighting along routes 35 35.0% 82 32.0% More bike racks near buildings 53 53.0% 51 19.9% More bike racks near commutes parking lots 32 32.0% 28 10.9% Ability to bring bike on Crimson Ride 21 21.0% 23 9.0%

85
Chi-square analysis was performed on all of the institutional barriers and facilitators
(Table 4.13). Of the barriers, five statements were statistically significant. Of these, inadequate
bike lanes and connectedness were the most significant barriers (p ≤ .001 and p = .001,
respectively). Of the facilitators, 11 statements were significant.

86
Table 4.13 Institutional Cycling Factor Results
Question Institutional Barriers p-value What community or organizational factors influence your cycling decisions?
There are inadequate bike lanes or bike paths in my area.
p ≤ .001***
The local roads are too busy for me to cycle on them.
p = .937
The University of Alabama is not well connected to the city of Tuscaloosa.
p = .001**
Some of my routes are not well lit. p = .396 The roads are in terrible shape. p = .387 It’s difficult to ride my bike to transit. p = .147 I dislike car fumes. p = .040* There is nowhere to park my bike. p = .003** There are no facilities for locking or securing
my bike. p = .128
There is no place to change my clothes after cycling to campus.
p = .024*
Institutional Facilitators What services/facilities would you be interested in using at UA if they were offered?
Covered parking p = .428 Indoor bike parking p ≤ .001*** Locker/shower facilities p = .257 Bike lockers p = .002** Bike repair classes p = .043* Bike safety classes p = .303 Ladies-only cycling classes p = .424 Organized social cycling events p ≤ .001*** Beginner cycling classes p = .970 More direct routes p ≤ .001*** More security cameras on bike racks p = .024* More bike lanes p ≤ .001*** Wider lanes on the road p = .112 Better markings/signage p = .005** More connectivity to downtown/shopping p = .002** Better lighting along routes p = .592 More bike racks near buildings p ≤ .001*** More bike racks near commutes parking lots p ≤ .001*** Ability to bring bike on Crimson Ride p = .002**
* p < .05 ** p ≤ .01 *** p ≤ .001

87
The six questions that were asked for the three levels for the Social Ecological Model
were scored by the total options selected by each individual and analyzed independently as well
as in combination with the three levels.
Univariate logistic regressions were performed to ascertain the effects of personal safety
factors, bike specific issues, personal appearance, traffic interaction concerns, institutional
barriers, and institutional facilitators scores on the likelihood that participants are cyclists.
Personal safety factors and traffic interaction concerns were not statistically significant. Of the
six scores, four were found to be statistically significant: institutional barriers (p ≤ .001)
explained 5.0% of the variance, institutional facilitators (p ≤ .001) explained 11.8% of the
variance, bike specific issues (p ≤ .001) explained 8.2% of the variance, and personal appearance
(p = .006) explained 3.3% of the variance. Table 4.14 presents the descriptives of each of the
scores from the coordinating scored questions and their categories. Additionally, table 4.14
presents the descriptives of the scored questions based on cycling status, including mean and
standard deviation of both samples.

88
Table 4.14 Descriptives of Each of the Scored Questions Question Category p-value O.R. C.I. Personal Safety Factors p = .997 1.00 0.87, 1.15 Bike Specific Issues p ≤ .001*** 0.58 0.44, 0.75 Appearance p = .006** 0.83 0.73, 0.95 Traffic Interaction Concerns p = .170 1.07 0.97, 1.18 Institutional Barriers p ≤ .001*** 1.28 1.12, 1.46 Institutional Facilitators p ≤ .001*** 1.22 1.13, 1.31 Descriptives of Scored Questions Based on Cycling Status
Cyclist Non-Cyclist Question Category Mean St. Dev. Mean St. Dev. Personal Safety Factors 2.04 1.64 2.04 1.74 Bike Specific Issues 0.57 0.80 1.16 1.28 Appearance 1.54 1.62 2.18 2.05 Traffic Interaction Concerns 3.64 2.14 3.25 2.49 Institutional Barriers 2.15 1.82 1.44 1.56 Institutional Facilitators 5.42 3.61 3.25 2.91 * p < .05 ** p ≤ .01 *** p ≤ .001
Table 4.15 presents the descriptives of levels from the scores of the Social Ecological
Model. Univariate logistic regressions were performed to ascertain the effects of intrapersonal,
interpersonal, and institutional scores on the likelihood that participants are cyclists. The
interpersonal level was not statistically significant. However, the intrapersonal and institutional
level scores were found to be statistically significant (p ≤ .001). The intrapersonal level
explained 3.2% of the variance of the model and the institutional level explained 11.5% of the
variance of the model. Additionally, table 4.15 presents the descriptives of the scored levels
based on cycling status, including mean and standard deviation of both samples.
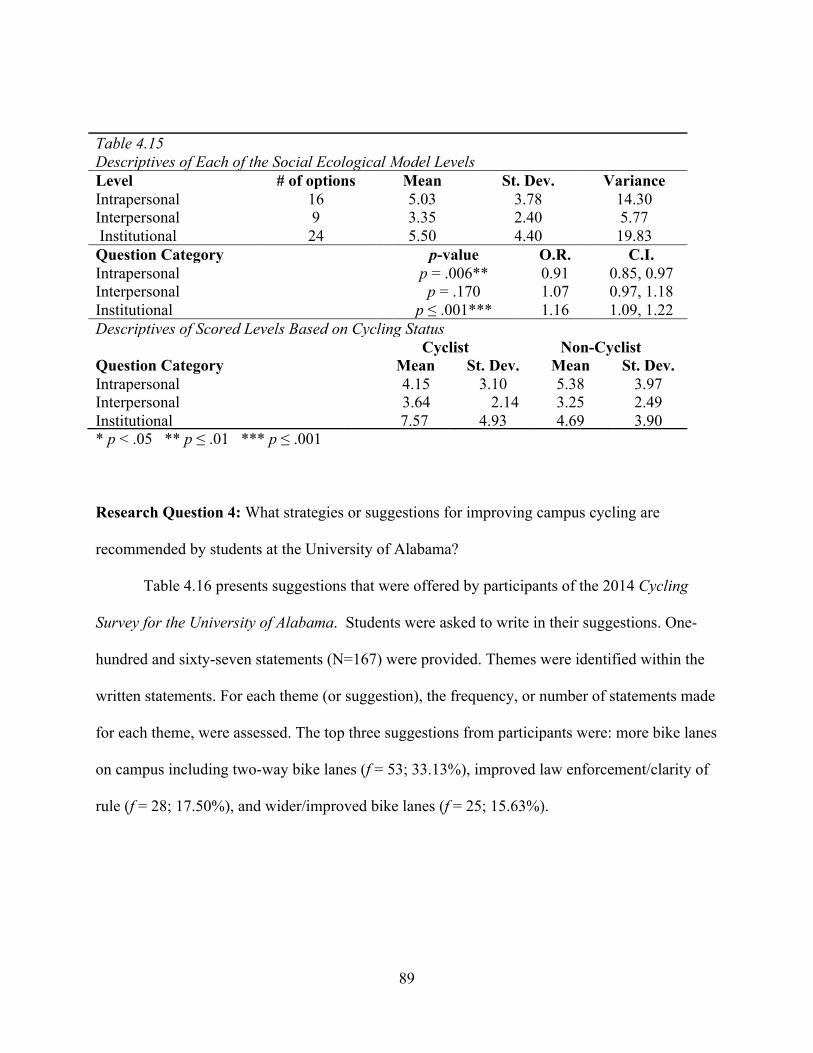
89
Table 4.15 Descriptives of Each of the Social Ecological Model Levels Level # of options Mean St. Dev. Variance Intrapersonal 16 5.03 3.78 14.30 Interpersonal 9 3.35 2.40 5.77 Institutional 24 5.50 4.40 19.83 Question Category p-value O.R. C.I. Intrapersonal p = .006** 0.91 0.85, 0.97 Interpersonal p = .170 1.07 0.97, 1.18 Institutional p ≤ .001*** 1.16 1.09, 1.22 Descriptives of Scored Levels Based on Cycling Status Cyclist Non-Cyclist Question Category Mean St. Dev. Mean St. Dev. Intrapersonal 4.15 3.10 5.38 3.97 Interpersonal 3.64 2.14 3.25 2.49 Institutional 7.57 4.93 4.69 3.90 * p < .05 ** p ≤ .01 *** p ≤ .001
Research Question 4: What strategies or suggestions for improving campus cycling are
recommended by students at the University of Alabama?
Table 4.16 presents suggestions that were offered by participants of the 2014 Cycling
Survey for the University of Alabama. Students were asked to write in their suggestions. One-
hundred and sixty-seven statements (N=167) were provided. Themes were identified within the
written statements. For each theme (or suggestion), the frequency, or number of statements made
for each theme, were assessed. The top three suggestions from participants were: more bike lanes
on campus including two-way bike lanes (f = 53; 33.13%), improved law enforcement/clarity of
rule (f = 28; 17.50%), and wider/improved bike lanes (f = 25; 15.63%).

90
Table 4.16 Suggestions from the 2014 Cycling Survey for the University of Alabama Statement Frequency (f) % More bike lanes on campus including two-way bike lanes 53 33.13% Improved law enforcement/clarity of rule 28 17.50% Wider/improved bike lanes 25 15.63% More bike racks on campus 17 10.63% Improved safety for cyclists including lighting 16 10.00% Improved bike education/cycling mindfulness 14 8.75% More bike lanes throughout Tuscaloosa 7 4.38% Better connectivity/routes 7 4.38% Covered parking/bike lockers 6 3.75% Offer more bike rental options/have bike rentals around campus
4 2.50%
Less/slower vehicular traffic 4 2.50% Bike racks closer to buildings 3 1.88% Improve road quality/infrastructure 3 1.88% Improve bike security 2 1.25% Improved motorist mindfulness 2 1.25% Add shower/changing facilities to campus 2 1.25% Be able to take bike on transit 2 1.25% Bike repair assistance/classes 1 0.63% Add a bicycle coordinator/staff to campus 1 0.63%
Table 4.17 presents additional comments that were offered by participants of the 2014
Cycling Survey for the University of Alabama. The top three suggestions from participants were
improved law enforcement for both cyclists and motor vehicle drivers (f = 7; 18.92%), build up a
cycling culture at the University of Alabama/raise awareness for cycling (f = 6; 16.22%), and
necessity for motor vehicle drivers to be more mindful of cyclists (f = 5; 13.51%).

91
Table 4.17 Additional Comments from the 2014 Cycling Survey for the University of Alabama Statement Frequency (f) % Improve law enforcement for both cyclists and motor vehicle drivers
7 18.92%
Build up a cycling culture at the University of Alabama/raise awareness for cycling
6 16.22%
Drivers need to be more mindful of cyclists 5
13.51%
I like/would like cycling. 5 13.51% Build more infrastructure for cycling at the University of Alabama
3 8.11%
Improved safety for cyclists/pedestrians at the University of Alabama
3 8.11%
Use common sense while cycling/be smart 2 5.41% Increase the amount of bikes and bike racks on the University of Alabama campus
2 5.41%
Decrease motor vehicle traffic 1 2.70% Offer daily rental bikes 1 2.70%
Summary
The statistical analysis of the data indicated that 100 of the 356 participants (28.1%)
either rent or own a bike at the University of Alabama. Of those, 53.0% reported they had
registered their bikes with the university, 61% had ridden their bike in the last week, and 68%
indicated that they ride their bikes 25 miles or less per week. The top three reasons for cycling
were school (85.0%), exercise (43.0%), and work (31.0%).
Additionally, gender, race/ethnicity, and participating college were statistically
significant, indicating that females, the non-Hispanic white sample were most likely to cycle.
While none of the interpersonal factors of the Social Ecological Model were statistically
significant, the scores of the intrapersonal and institutional levels indicated significance. Of
those, institutional factors (p ≤ .001), institutional facilitators (p ≤ .001), bike specific issues (p ≤

92
.001) and personal appearance (p = .006) were statistically significant. Finally, clear and
consistent law enforcement and improved bike lanes were the most important reported items.

93
CHAPTER FIVE
DISCUSSION & CONCLUSIONS
Cycling impacts the physical, psychological, and environmental health of university
students (Cavill & Davis, 2003; Kaczynski, Bopp, & Wittman, 2010; Rybarczyk & Gallagher,
2014; Akar & Clifton, 2009). It is also a sustainable form of transport, both physically and
monetarily (Gatersleben & Appleton, 2007). Cycling is relatively convenient for short
distances or commutes, and is both reliable and affordable for most of the population
(Lumsdon & Tolley, 2001). Yet, despite the positive benefits of cycling, limited studies have
explored bikeability on university campuses (Bopp et al., 2011; Bonham & Koth, 2010;
Sisson & Tudor-Locke, 2008). Among the university studies documented, they lacked theory
and framework to support health behavior change needed by stakeholders.
The purpose of this study was to examine college student perceptions of safety and
factors contributing to campus cycling from an ecological perspective. Intrapersonal,
interpersonal, and institutional factors associated with safety and campus cycling were
assessed as well as how these influencers interacted with each other.
This chapter provides further discussion of the study results, specifically as they pertain
to the research questions. The limitations of the study are also discussed. The chapter highlights
practical implications for campus improvement and future research. Finally, the chapter
addresses the implications of study results for health education and promotion.

94
University of Alabama Cyclists
Findings from this study indicated that the prevalence of on-campus cycling at the
University of Alabama was 28.1%. Of the University of Alabama (UA) cyclists, most cyclists
were female (73.9%), which contrasts with national statistics, which indicated the male
population cycles more (Harris, 2011). However, given the majority of UA commuting was a
short distance (less than five miles) and the speed limit was 35 miles per hour or lower, the
finding is consistent with international studies that indicated a negative relationship between
gender and speed. Stigell (2011) reported that slower velocity of motor vehicles often correlates
with more female cyclists, as they feel safer on the roadway.
In addition, there were significant differences in race/ethnicity among cyclists, and the
findings were consistent with former research (McKenzie, 2014). For instance, non-Hispanic
white students (84.0%) made up the majority of cyclists on campus. African American students
represented the lowest percentage of cyclists (5.0%). Finally, those who identified with two or
more races represented 11.0% of the cycling sample. These findings have implications for
targeted interventions.
In order to better understand who cycles, as well as the primary use of cycles, on the UA
campus, a number of questions were asked of cyclists only. The findings indicated that cycling
was utilized for school (85.0%), exercise (43.0%), and work purposes (31.0%). Nearly two-
thirds of cyclists reported they had cycled within the last week. A little over one-half (53%) said
they cycled exclusively or that they never combined cycling with other modes of transportation.
These cycling behaviors are important to stakeholders to foster a community and culture that
supports cyclists.
Intrapersonal Cycling Factors

95
Several intrapersonal factors were examined in this study. Factors at the intrapersonal
level were categorized as personal safety factors, bike-specific issues, and personal appearance.
“Personal safety factors” included concerns about riding too close to traffic, aggressive/distracted
drivers, riding after dark, unsuitable weather, distance being too far to cycle, and others. When
the individual “personal safety factors” were analyzed as a single grouped factor, personal safety
factors were not found to be statistically significant. Therefore, as a whole, “personal safety
factors” were not an important predictor of cycling. Similarly, the study did not indicate
statistically significant findings for either of the individual “personal safety factors” alone.
Nonetheless, the information obtained from this level of analysis can be used to address
barriers identified by students (cyclists and non-cyclists), which were of most concern. For
example, both cyclists and non-cyclists mentioned concerns about aggressive/distracted drivers.
Alabama state law has passed a texting while driving ban (Alabama Department of Public
Safety, 2012); therefore, this might be an issue to address by law enforcement and university
stakeholders.
Wearing helmets while cycling was an additional “personal safety factor.” Research
demonstrates that mortality rates are lower among those who wear helmets while cycling
compared to those who do not (Insurance Institute for Highway Safety Highway Loss Data
Institute, 2015). Helmet protection was a safety concern indicated among students in this study.
About 55% of the total sample agreed that bicycle helmets are important even if a person cycles
infrequently. About 52% of the cyclists indicated they go fast enough to need head protection in
the case of an accident. Moreover, approximately 70% of the cyclists indicated they were at risk
for being injured by a motor vehicle while cycling. Cues to action and perceived threat are found
to be a strong influence on attitude, intentions, and behaviors toward bicycle helmets, which is
96
consistent with the Health Belief Model (Ross et al., 2010; Witte, Stokols, Ituarte & Schneider,
1993). Yet, despite the concerns among cyclists and non-cyclists, only 13% of the cyclists
indicated they wore helmets all of the time. These findings indicate that knowledge is not always
sufficient to promote change in behavior. The findings have implications for program planning.
Perhaps offering bike training sessions or promoting awareness among motor vehicle drivers
about the importance of being attentive, especially on campus because of cyclists could be
effective strategies.
Other “personal safety factors” were examined in this study. Research indicates that
traffic violations committed by cyclists (e.g., not stopping at stop signs) and perceptions of or
experiences with stolen bicycles might negatively influence cycling (Lawson, Pakrashi, Ghosh &
Szeto, 2013). When the students in this study (cyclists and non-cyclists) were asked about the
general practices of cyclists on campus, 94.0% perceived that cyclists locked their bikes on a
regular basis, 81.0% believed cyclists rode with the flow of traffic, and 82.0% of the sample
believed that cyclists stopped at red lights or stop signs. Despite these positive perceptions,
22.0% of cyclists indicated they had bikes stolen, 81.0% said they ride with the flow of the
traffic, and 63.0% of the cyclists at UA reported that they stop at stop signs. Being aware of
these perceptions and actual cycling practices (including discrepancies between them) might help
campus stakeholder better understand what, if any, relevant and targeted interventions are
needed.
“Bike specific issues” pertained to concerns about one’s bike getting stolen, not knowing
about general bike maintenance, not feeling confident about using a lock, etc. When the
individual “bike specific issues” were analyzed as a single grouped factor, bike specific issues
were found to be statistically significant. Therefore, taken together, bike specific issues were an
97
important predictor of cycling, which is consistent with current literature (Telfer, Rissel, Bindon,
& Bosch, 2006). Although none of the individual “bike specific issues” statements were
statistically significant, they provide insight into what contributed to the significant finding when
grouping the factors (p ≤ .001), as well as what might be important for program planning. The
findings indicated that among both cyclists and non-cyclists, the desire to know something more
about general bike maintenance was among the most cited barriers (Pucher, Dill, & Handy,
2010). The findings have implications for program planning. Promoting current bike
maintenance resources already available on campus, or considering how to improve these, might
be a suitable strategy.
Finally, “personal appearance” factors pertained to concerns about looking silly while
wearing a helmet, the condition of one’s clothes while riding and afterwards, one’s hair being
disarrayed or messed up after riding, and others. When the individual “personal appearance
factors” were analyzed as a single grouped factor, appearance was found to be statistically
significant (p = .006). Therefore, taken together, personal appearance was an important predictor
of cycling. Although none of the “personal appearance factors” individually were statistically
significant, they provide insight into what contributed to the significant finding when grouping
the factors, as well as what might be important for program planning. The most frequently cited
factors for both cyclists and non- cyclists were concerns about one’s appearance after cycling,
looking “silly” while wearing a helmet, and concerns about clothes while riding (Dill & McNeil,
2013). Considering how to address this issue among college students might be a next step to
consider.
98
Interpersonal Cycling Factors
“Interpersonal cycling factors” pertained to concerns about interacting with motor vehicle
drivers or traffic interaction concerns. For example, these included speed of automobiles,
crossing at intersections, distracted drivers, and other related concerns. When these individual
“interpersonal cycling factors” were analyzed as a single grouped factor, interpersonal cycling
factors were not found to be statistically significant (p = .170). Therefore, as a whole,
“interpersonal cycling factors” were not an important predictor of cycling. Similarly, the study
did not indicate statistically significant findings for either of the individual “interpersonal cycling
factors” alone.
Nonetheless, the information obtained from this level of analysis can be used to address
the traffic interaction concerns which were identified by students (cyclists and non-cyclists) and
that were of most concern. For example, comparable concerns were reported among both
cyclists and non-cyclists. Among those concerns that were cited most frequently (and which
were also in the top three for both cyclists and non-cyclists) were distracted drivers, vehicles
turning in front of cyclists, and the speed of automobiles (Jacobsen, Racioppi & Rutter, 2009;
Tilahun, Levinson, & Krizek, 2007). The findings have implications for program planning. For
instance, media campaigns for the general student population might be needed to target drivers
about safety for all who share the roads with them, including cyclists (Pucher, Dill, & Handy,
2010).
To continue with the positive efforts of the University of Alabama in addressing cycling
safety and in promoting cycling, it is recommended that university planners rely on standards set
by the League of American Bicyclists for the 5 E’s and minimize issues that ensue with negative
interactions with motor vehicles (League of American Bicyclists, 2014b). The 5 E’s were
99
engineering, education, encouragement, enforcement, evaluation, and planning. In addition, more
education and regulation needs to be continually aimed toward campus drivers to minimize the
impacts of distracted driving and avert traffic injuries to cyclists, drivers, and pedestrians
(Jacobson & Gostin, 2010).
Institutional Cycling Factors
Institutional cycling factors included those identified as cycling barriers and facilitators.
“Institutional barriers” pertained to inadequate bike lanes or bike paths, local roads being too
busy, routes not be well lit, car fumes, lack of facilities for locking or securing bikes, etc. When
the individual “institutional barriers” were analyzed as a single grouped factor, the barriers were
found to be statistically significant (p ≤ .001). Therefore, taken together, institutional barriers
were an important predictor of cycling.
Although none of the “institutional barriers” individually were statistically significant,
they provide insight into what contributed to the significant finding when grouping the factors,
as well as what might be important for program planning. The findings indicated that among the
“institutional barriers”, the top three concerns for both cyclists and non-cyclists included busy
local roads, inadequate bike lanes or bike paths, and routes not well lit or lighted. These findings
support previous research, which explains that facilities and infrastructure make cycling easier,
more effective, and even attractive to the individual (Dill, 2004). Cyclists in the current study
indicated inadequate bike lanes (51.0%), lack of covered or indoor bike parking (56.0% and
46.0%, respectively), need for more direct routes (54.0%), and need for better markings or
signage (33.0%) as institutional barriers for cycling.
Students were also asked to respond to questions about potential factors at the
institutional level that would facilitate cycling (i.e., “institutional facilitators”). Institutional

100
facilitators included covered parking, indoor bike parking, locker/shower facilities, beginner
cycling classes, more bike racks, ability to bring bike on Crimson Ride, etc. When the individual
“institutional facilitators” were analyzed as a single grouped factor, the facilitators were found to
be statistically significant (p ≤ .001). Therefore, taken together, institutional facilitators were an
important predictor of cycling.
Although none of the “institutional facilitators” individually were statistically significant,
they provide insight into what contributed to the significant finding when grouping the factors,
as well as what might be important for program planning. Among those factors students believed
would help facilitate cycling and that were the most frequently cited among cyclists and non-
cyclists – included developing more bike lanes and covered parking. Other institutional factors
that would facilitate cycling, according to both groups, were indoor bike parking and more direct
routes. These findings have implications for structural changes at the university and/or for
promotion and awareness of available facilities and resources.
Pucher, Dill, and Handy (2010) reported that appropriate and aggregated infrastructure
would facilitate an increase in cycling. As previously stated, streets with lower speed limits are
perceived to be safer by cyclists and reduce the amount of crashes involving cyclists. Lowered
speeds and reduced volume of traffic allow for more reaction time to prevent accidents between
vehicles and cyclists (Retting, Ferguson & McCartt, 2003). Moreover, traffic calming including
such methods as narrowing lanes, speed tables, and protected pedestrian islands are further
methods that can make traffic seem safer and increase the amount of cycling traffic (Smith &
Appleyard, 1981). Also effective, separate cycling paths are typically used 2.5 times more than
nearby on-street bicycle lanes and the relative risk of injury is about 28% lower. The increase of
bicycle infrastructure is “positively and significantly correlated with higher rates of bicycle

101
commuting” (Dill & Carr, 2003). By adopting more protective infrastructure and traffic calming
methods, both perceived and actual cycling safety can improve (McClean, 2012).
Student Suggestions and Comments
Several suggestions were provided from students regarding what could be done to
improve campus cycling. The top three suggestions that were recommended included the
following items: (1) more bike lanes on campus, including two-way bike lanes (suggested by a
third of the respondents who responded to this question); (2) improved law enforcement/clarity
of rules (17.50%); and (3) wider/improved bike lanes (15.63%). Although reported with less
frequency, the following three most cited suggestions included more bike racks on campus,
improved safety for cyclists including lighting, and improved bike education/cycling
mindfulness. Many of these factors overlapped with concerns expressed at the intrapersonal,
interpersonal, and institutional levels. They provide guidance to stakeholders about what specific
factors are prioritized and deemed more likely to facilitate cycling among students. Therefore,
these suggestions have implications for environmental and structural changes, policy
development, and program planning for the university.
One of the major deterrents of cycling in the United States is the perceived amount of
danger (Zeeger, 1994). The same was indicated in this study. When riding next to heavily
trafficked or in high-speed areas, the perceived chance of injury is greater. There is a need for
facilities that aid in cycling such as bike lanes, bike paths, or parking facilities (Pucher, 2001).
Law enforcement is an influential component when increasing bikeability in a
community as seen in the suggestions and additional comments given by the respondents. This
includes helmet laws, speed limits, and general driving by both cyclists and motor vehicles.
These laws increase the population’s comfort and perception of safety (McClean, 2012).

102
Enforcement of reduced speed, speed tables, and areas with traffic calming is attributed to
increased rates of cycling. Lowered speed limits improve both the perceived and actual safety
for the cyclists (McClean, 2012). When each of these is mandated, the efficiency of cycling
rivals the efficiency of driving.
Study Limitations
A number of limitations to this study must be acknowledged, including its overall
exploratory nature. Surveys collected for this research were done through convenience sampling
by presenting the study to various classes and by word of mouth. While this is an inexpensive
method of collecting data, the data can be skewed. In this study, the greatest number of
respondents was from the College of Human Environmental Sciences even though the College of
Arts and Sciences is the largest of the colleges on campus. The students’ area of study may skew
the data collected. In addition, the majority of classes were upper division classes (junior and
senior level courses), which did not adequately capture the freshmen and sophomore
demographic.
The survey was administered during November & December. The responses to a couple
of survey items regarding cycling frequency (e.g., average # of times cycle per week) could have
been influenced by the weather during that time of the year. For example, some students might
have reported less number of times they cycle on average given the survey was administered
during the winter months when many typically cycle less. Administering the survey during a
different time of year might yield different responses to these specific survey items. Nonetheless,
the weather in Alabama was relatively mild. For instance, Tuscaloosa’s average temperature in
November was 68 degrees Fahrenheit (U.S. Climate Data, 2015).

103
Data was collected from a large residential campus. This limits how much the study can
be compared to neighboring urban universities. While they may have similar demographics and
academic structure, the infrastructure may differ enough that they are incomparable. The study
findings may be more meaningful and generalizable to similar residential and spacious campuses
that are self-contained and have low population density.
Furthermore, the study findings may only be limited to campus populations and not be
inferable to surrounding municipalities. The student population at this university may not
represent the general community. For the past few years, the number of out-of-state students in
the freshmen class surpassed in-state students. Last year, this was the case for total student
enrollment (University of Alabama, 2014b). This demographic change shifts the economic and
cultural background of the university as the majority of students are from other states or
countries.
Missing data of any kind typically underrepresents the issue that researchers must accept
in terms of limitation (Field, 2005). A number of respondents answered questions about their
cycling behavior and personal safety perceptions but provided limited if any demographic
information, including gender, age, and race which were key variables. The number of
participants who refused to answer these questions lessened the statistical usefulness of these
variables, but present data were sufficient to render possible analysis.
The cross-sectional nature of this study was another limitation given the information was
from one snapshot in time. This design allows only for correlations but does not allow for
causation over time. In addition, some variables (e.g., “perception of health” and “perception of
safety”) may be results of cycling as much as they may be predictors of it. Cross-sectional
studies are both acceptable and respected as a method of research. However, they are designed to
104
give information about a sample at a given point with further research to follow or as a baseline
for health promotion (Lundberg, 2003).
Implications for Health Education and Promotion
The findings concerning cycling behavior for the campus will be presented to campus
stakeholders to plan programs and campaigns aimed at increasing the number of cyclists. To
further promote cycling, future researchers and stakeholders should focus on the numerous
benefits derived from cycling including the physical, environmental, and economical benefits.
This will help curb the amount of motor vehicles present on campus.
By collecting the opinions of both cyclists and non-cyclists, university stakeholders will
be able to improve the infrastructure throughout the existing campus as well as integrate cyclist
friendly elements into future construction. In addition, knowing the student opinion will help
health educators build a sense of campus mindfulness.
A vital component of cycling for the campus is connecting the university to the
surrounding areas, including downtown, shopping areas, and off-campus work. These efforts
will enable students that live off campus to feel safer cycling the short commute to and from
campus as well as to the surrounding areas. If the university stakeholders and planners join
forces with city planners to create bikeways, it can lead to improved campus connectivity with
the city and overall infrastructure.
This research will also help other collegiate entities better understand the cycling
environment on large university campuses. With the number of people and motor vehicles
present on campuses and the urge to create a sustainable environment, it is important for
universities to partner in future research (Hall & Vredenburg, 2012). This research is

105
encouraged given the ease of cycling in a university environment of closely located amenities,
activities, and housing (Delmelle & Delmelle, 2012).
Finally, this study also acts as a baseline and insight for future Healthy Campus
objectives. The current objectives cover general guidelines for aerobic physical activity and
muscle-strengthening activity (ACHA, 2014). Additionally, there are no objectives that address
the importance of a healthy campus environment. Cycling studies like this and future studies can
impact the American College Health Association to also include environmental health as a future
objective.
Recommendations for Future Research
Future research for campus cycling at this university and others is highly recommended.
The purpose of this study was to examine college student perceptions of safety and factors
contributing to campus cycling from an ecological perspective. Results of this research will give
the Bike Advisory Group and other campus stakeholders the student perception of campus
cycling. Further studies to improve and better understand campus cycling is strongly
encouraged, specifically in relation to personal safety, community factors and improved policies.
In addition, studies should include the working population of the university, including faculty
and staff, to better infer the results to the entire population and not only the students.
The advancement of campus cycling from a health promotion and education perspective
could benefit tremendously from a larger study population to better infer to the total campus
population and have a better perspective of campus cycling. This will also help stakeholders to
address the largest two levels of the Social Ecological Model: community and policy. In
addition, stakeholders need to consider the interaction of motor vehicles and cyclists to create a

106
social norm of drivers and cyclists coexisting (Stigell, 2011). This could be collected through
data collected describing the perception of cycling from a motorist.
Research should also be conducted on other similar campuses in order to compare
populations and areas of success. This also includes further investigation of sub-demographics
including the international student population and Greek organizations. By regional or state
universities collaborating, it widens the overall picture of a more sustainable environment and
improves safety perceptions. These studies should also address qualitative information from
cyclists for improved routes and infrastructure (Stigell, 2011). Conducting surveillance of
cyclists will aid stakeholders in future decisions.
Summary
This chapter highlights the conclusions, implications, recommendations for future
research, and limitations of the present study. Based on the results of the research questions that
were investigated, conclusions were drawn about the influence of ecological levels and personal
safety perceptions on cycling, which have led to an increased understanding of the campus
cycling environment. Practical significance and final research results may expand understanding
of active commute from the student perception. The limitations of this study were delineated.
Finally, recommendations for future research described the need for additional research efforts as
well as important direction to advance campus cycling.
Each of the identified predictors, including perceived safety and improved infrastructure,
may be used in interventions to increase cycling and are receptive to modification. Information
about significant predictors of cycling in students can help target campus campaigns and other
interventions. Application of the Health Belief Model and Social Ecological Model may be

107
useful in developing such programs in order to relate to the population and infrastructure of the
university environment.

108
References
ACHA. (2013). Healthy campus 2020--about. Retrieved from http://www.acha.org/HealthyCampus/about.cfm
ACHA. (2013). Healthy campus 2020--faculty and staff objectives. Retrieved from http://www.acha.org/HealthyCampus/faculty-staff-obj.cfm
ACHA. (2013). Healthy campus 2020--student objectives. Retrieved from http://www.acha.org/HealthyCampus/student-obj.cfm
ACHA. (2013). Spring 2013 reference group data report. Hanover, MD: American College Health Association.
Agarwal, A., & North, A. (2012). Encouraging bicycling among university students: Lessons from queen's university, Kingston, Ontario. Canadian Journal of Urban Research, 21(1), 151-168.
Agras, W. S., Hammer, L. D., McNicholas, F., & Kraemer, H. C. (2004). Risk factors for childhood overweight: A prospective study from birth to 9.5 years. The Journal of Pediatrics, 145(1), 20-25.
Alabama Center for Health Statistics. (2013). Alabama vital statistics. Retrieved from http://www.adph.org/healthstats/assets/AVS2011.pdf
Alabama Code. (1975). Section 32-5A-260 traffic laws apply to persons riding bicycles, Title 32.
Alabama Department of Public Health. (2010). The risk of heart disease and stroke in Alabama: Burden document. Retrieved from http://www.adph.org/cvh/assets/2010_HeartDiseaseStroke_Alabama_Burden.pdf
Alabama Department of Public Safety. (2012). Texting while driving law. Montgomery, AL: Alabama Department of Public Safety.
Alabama Department of Public Safety. (2014). Alabama driver manual. Montgomery, AL: Alabama Department of Public Safety.
109
Albert, E. (1999). Dealing with danger: The normalization of risk in cycling. International Review for the Sociology of Sport, 34(2), 157-171.
American Academy of Pediatrics. (2009). The built environment: Designing communities to promote physical activity in children. Pediatrics, 123(6), 1591-1598.
American Bicycle Commuters. (2012). Alabama. In HOW MANY PEOPLE CYCLE TO WORK IN YOUR STATE? Retrieved from http://www.myassettag.com/state-cycling-statistics#AL
American College Health Association. (2011). 2011 university of Alabama survey results.
American College Health Association. (2012). Retrieved from http://www.acha-ncha.org/docs/ACHA-NCHA-II_ReferenceGroup_ExecutiveSummary_Fall2012.pdf
American College Health Association. (2012). Healthy campus 2020. Retrieved from http://www.acha.org/healthycampus/mapIT.cfm
American College of Sports Medicine. (2011). ACSM issues new recommendations on quantity and quality of exercise. Retrieved from http://www.acsm.org/about-acsm/media-room/news-releases/2011/08/01/acsm-issues-new-recommendations-on-quantity-and-quality-of-exercise
American Diabetes Association. (2008). Economic costs of diabetes in the US in 2007. Diabetes Care, 31, 596-615.
American Heart Association. (2011). Alabama state fact sheet. Retrieved from www.heart.org/idc/groups/heart-public/@wcm/.../ucm_307146.pdf
Anderson, L. B., Schnohr, P., Schroll, M., & Hein, H. O. (2000). All-cause mortality associated with physical activity during leisure time, work, sports and cycling to work. Archives of Internal Medicine, 160, 1621-1628.
Arnott, R. & Inci, E. (2006). An integrated model of downtown parking and traffic congestion. Journal of Urban Economics, 60(3), 418-442.
Badland, H., Knuiman, M., Hooper, P., & Giles-Corti, B. (2013). Socio-ecological predictors of the uptake of cycling for recreation and transport in adults: Results from the RESIDE study. Preventative Medicine, 57(4), 396-399.
Baker, L. (2009). How to get more bicyclists on the road: To boost urban cycling, figure out what women want. Scientific American, 301(4), 28-29.
Baker, T. L. (1994). Doing social research (2nd ed.). New York, NY: McGraw Hill Inc.
Balsas, C. (2003). Sustainable transportation planning on college campuses. Transport Policy, 10(1), 35-49.

110
Bandura, A. (1986). Social foundations of thought and action: A social cognitive theory. Englewood Cliffs, NJ: Prentice-Hall.
Barata, E., Cruz, L., & Ferreira, J. P. (2011). Parking at the UC campus: Problems and solutions. Cities, 28(5), 406-413.
Baudains, C., Styles, I., & Dingle, P. (2001). TravelSmart workplace: Walking and the journey to work. Road & Transport Research, 10(1), 26-33.
Beatley, T. (2000). Green urbanism: Learning from European cities. Washington, DC: Island Press.
Bhalla, K., Ezzati, M., Mahal, A., Salomon, J., & Reich, M. (2007). A risk-based method of modeling traffic fatalities. Risk Analysis, 27, 125-136.
Bicycle Friendly America. (2012, Bicycle friendly America guidebook 2012. American Bicyclist.
Bicycle League of America. (2012). 2012 bicycle friendly state rankings. Retrieved from http://www.bikeleague.org/programs/bicyclefriendlyamerica/bicyclefriendlystate/
Bicycling in American in 2003. (2003). Retrieved from http://www.bikeleague.org/media/facts/pdf/BicyclinginAmerica02to03.pdf
Biddle, S. J. H. (2000). Emotion, mood and physical activity. In S. J. H. Biddle, K. R. Fox & S. H. Boutcher (Eds.), Physical activity and psychological well-being (pp. 63-87). London, Routledge.
Bidwell, S. (2012). Review of studies that have quantified the economic benefits of interventions to increase walking and cycling for transport. Canterbury District Health Board.
Boelte, K. (March/April 2010). Look ma, no car! Pedaling toward a postcarbom future. Sierra Magazine, 46-49.
Bohte, W., Maat, K., & van Wee, B. (2009). Measuring attitudes in research on residential self-selection and travel behaviour: A review of theories and empirical research. Transport Reviews, 29(3), 325-357.
Bonham, J., & Koth, B. (2010). Universities and the cycling culture. Transportation Research Part D: Transport and Environment, 15(2), 94-102.
Bopp, M., Kaczynski, A., & Wittman, P. (2011). Active commuting patterns at a large, Midwestern college campus. Journal of American College Health, 59(7), 605-611.
Bracher, T. (1989). Policy and provision for cyclists in Europe. Commission of the European Communities, Brussels: Directorate General for Transport.

111
Bronfenbrenner, U. (1979). The ecology of human development. Cambridge, MA: Harvard University Press.
Brown, T. D., O'Connor, J. P., & Barkatsas, A. N. (2009). Instrumentation and motivations for organised cycling: The development of the cyclist motivation instrument (CMI). Journal of Sports Science & Medicine, 8(2), 211-218.
Bureau of Transportation Statistics (Ed.). (2000). Bicycle and pedestrian data: Sources, needs, & gaps. Washington, DC: US Department of Transportation.
Caiazzo, F., Ashok, A., Waitz, I. A., Yim, S. H. L., & Barrett, S. R. H. (2013). Air pollution and early deaths in the United States. part I: Quantifying the impact of major sectors in 2005. Atmospheric Environment, 79, 198-208.
Camacho, T. C., Roberts, R. E., Lazarus, N. B., Kaplan, G. A., & Cohen, R. D. (1991). Physical activity and depression: Evidence from the alameda country. American Journal of Epidemiology, 134, 220-231.
CAPS. (2012). 2011 Alabama traffic crash facts. Montgomery, AL: Alabama Department of Transportation.
Carlsson, C. (2002). Cycling under the radar--assertive desertion. Critical Mass.
Cavill, N. & Davis, A. (2003). Cycling and health. National Cycling Strategy, 1-50.
Cawley, J. (2010). The economics of childhood obesity. Health Affairs, 29(3), 364-371.
Centers for Disease Control. (2008). Alabama: Burden of chronic diseases. Retrieved from http://www.cdc.gov/chronicdisease/states/pdf/alabama.pdf
Centers for Disease Control and Prevention. (2011). Diabetes data for prevalence in Alabama. Retrieved from http://apps.nccd.cdc.gov/DDTSTRS/Index.aspx?stateId=1&state=Alabama&cat=prevalence&Data=data&view=TO&trend=prevalence&id=1
Centers for Disease Control and Prevention. (2011). Physical activity for everyone: The benefits of physical activity. Retrieved from http://www.cdc.gov/physicalactivity/everyone/health/
Centers for Disease Control and Prevention. (2013). FASTSTATS--chronic lower respiratory disease. Retrieved from http://www.cdc.gov/nchs/fastats/copd.htm
Champion, V. L., & Skinner, C. S. (2008). The health belief model. Health Behavior and Health Education: Theory, Research, and Practice, 4, 45-65.

112
Chan, A. (2009). Identifying and removing barriers to cycling as a viable means of transportation in Houston, Texas. (Unpublished MA Thesis). University of Texas School of Public Health, Houston, TX.
Children's Hospital of Philadelphia. (2007). Driving: Through the eyes of teens. Philadelphia, Pa.: Children's Hospital of Philadelphia: State Farm Insurance.
City of Auburn. (2012). Cycle. Retrieved from http://www.auburnalabama.org/cycle/Default.aspx?PageID=729
City of Tuscaloosa. (2012). Tuscaloosa forward: Generational plan. Retrieved from www.tuscaloosanews.com/assets/pdf/TL2315982.PDF
Clarke, A. (2000). Bicycling, pathway to the future. Transportation in the New Millennium.
Cleary, J., & McClintock, H. (2000). Evaluation of the cycle challenge project: A case study of the Nottingham cycle-friendly employers' project. Transport Policy, 7(2), 117-125.
Colditz, G. (1999). Economic costs of obesity and inactivity. Medicine and Science in Sports and Exercise, 31(S11), S663-S667.
Cole, R., Leslie, E., Donald, M., Cerin, E., Neller, A., & Owen, N. (2008). Motivational readiness for active commuting by university students: Incentives and barriers. Health Promotion Journal of Australia, 19(3), 210-215.
COMEAP. (2010). The mortality effects of long-term exposure to particulate air pollution in the United Kingdom. Committee on the Medical Effects of Air Pollutants.
Crimson White Staff. (2014). UA campaigns for bicycle safety. Crimson White.
CW Staff. (2014). UA campaigns for bicycle safety. The Crimson White.
Cyclists' Touring Club. (1997). Barriers to cycling: Perspective from existing and potential cyclists. Godalming, United Kingdom: Cyclists' Touring Club.
Daniel, W. W. (2004). Biostatistics: A foundation for analysis in the health sciences (8th ed.). Hoboken, NJ: John Wiley & Sonds.
Daniels, S. R., Arnett, D. K., Eckel, R. H., Gidding, S. S., Hayman, L. L., Kumanyika, S., Robinson, T. N., Scott, B. J., St. Jeor, S., & Williams, C. L. (2005). Overweight in children and adolescents: Pathophysiology, consequences, prevention and treatment. Circulation, 111, 1999-2012.
Daniels, S. R. (2006). The consequences of childhood overweight and obesity. Future of Children, 16(1), 47-67.

113
Davis, A. (2010). Value for money: An economic assessment of investment in walking and cycling. United Kingdom: Department of Health.
De Bruijn, G., Kremers, S., Schaalma, H., van Mechelen, W., & Brug, J. (2005). Determinants of adolescent bicycle use for transportation and snacking behavior. Preventive Medicine, 40(6), 658-667.
De Geus, B., De Bourdeaudhuij, I., Jannes, C., & Meeusen, R. (2008). Psychosocial and environmental factors associated with cycling for transport among a working population. Health Education Research, 23(4), 697-708.
De Hartog, J. J., Boogaard, H., Nijland, H., & Hoek, G. (2010). Do the health benefits of cycling outweigh the risks? Environmental Health Perspectives, 118(8), 1109-1116.
Delmelle, E. M., & Delmelle, E. C. (2012). Exploring spatio-temporal commuting patterns in a university environment. Transport Policy, 21, 1-9.
Department of the Environment Transport and the Regions. (1998). A new deal for transport: Better for everyone. London, England: The Stationary Office.
Dill, J. (2004). Measuring network connectivity for bicycling and walking. 83rd Annual Meeting of the Transportation Research Board, Washington, DC.
Dill, J., & Carr, T. (2003). Bicycle commuting and facilities in major US cities: If you build them, commuters will use them--another look. Transportation Research Board, 1828, 116-123.
Dill, J., & McNeil, N. (2013). Four types of cyclists? Examining a typology to better understand bicycling behavior and potential. Transportation, 17, 18-35.
Dill, J., & Voros, K. (2007). Factors affecting bicycling demand: Initial survey findings from the Portland, Oregon, region. Transportation Research Record: Journal of the Transportation Research Board, 2031, 9-17.
Driller, B. (2013). Results of the 2012-13 campus travel survey. (Research Report No. UCD-ITS-RR-13-18). University of California, Davis: Institute of Transportation Studies.
Dubuy, V., De Cocker, K., De Bourdeaudhuij, I., Maes, L., Seghers, J., Lefevre, J., de Martelaer, K. & Cardon, G. (2013). Evaluation of a workplace intervention to promote commuter cycling: A RE-AIM analysis. BMC Public Health, 13(1), 1-11.
Dubuy, V., De Cocker, K., De Bourdeaudhuij, I., Maes, L., Seghers, J., Lefevre, J., de Martelaer, K., & Cardon, G. (2013). Evaluation of a workplace intervention to promote commuter cycling: A RE-AIM analysis. BMC Public Health, 13(1), 1-11.

114
Ebrahim, S. H., Anderson, J. E., Correa-de-Araujo, R., Posner, S. F., & Atrash, H. K. (2009). Overcoming social and health inequalities among US women of reproductive age—challenges to the nation's health in the 21st century. Health Policy, 90(2), 196-205.
Elvik, R. (2009). The non-linearity of risk and the promotion of environmentally sustainable transport. Accident Analysis and Prevention, 41, 849-855.
EPA. (2009). HUD-DOT-EPA interagency partnership for sustainable communities. Washington, DC: Environmental Protection Agency.
EPA. (2013). Sustainability basic information. Retrieved from http://www.epa.gov/sustainability/basicinfo.htm
Eyermann, T. S. (2014). Bike and transportation survey.
Fann, N., Lamson, A. D., Anenburg, S. C., Wesson, K., Risley, D., & Hubbell, B. J. (2012). Estimating the national public health burden associated with exposure to ambient PM2.5 and ozone. Risk Analysis, 32, 81-95.
Farrokhi, F. (2012). Rethinking convenience sampling: Defining quality criteria. Theory and Practice in Language Studies, 2(4), 784-792.
Field, A. (2005). Discovering statistics using SPSS. Thousand Oaks, CA: Sage Publications.
Fishbein, M., & Yzer, M. C. (2003). Using theory to design effective health behavior interventions. Communication Theory, 13(2), 164-183.
Flusche, D. (2010). Highlights from the 2009 national household travel survey. League of American bicyclists. Washington, DC: League of American Bicyclists.
Forester, J. (2001). The bikeway controversy. Transportation Quarterly, 55(2).
Foulsham, T., Walker, E., & Kingstone, A. (2011). The where, what and when of gaze allocation in the lab and the natural environment. Vision Research, 51(17), 1920-1931.
Fox, K. R. (1999). The influence of physical activity on mental well-being. Public Health Nutrition, 2(3a), 411-418.
Fox, K. R. (2000). Self-esteem, self-perceptions and exercise. International Journal of Sports Psychology, 31, 228-240.
Fraser, D. S., & Lock, K. (2010). Cycling for transport and public health: A systematic review of the effect of the environment on cycling. European Journal of Public Health, 1-6.
Freedman, D. A. (2009). Statistical models and causal inference: A dialogue with the social sciences. Cambridge University Press.
115
Freedman, D. S., Zuguo, M., Srinivasan, S. R., Berenson, G. S., & Dietz, W. H. (2007). Cardiovascular risk factors and excess adiposity among overweight children and adolescents: The Bogalusa heart study. Journal of Pediatrics, 150(1), 12-17.
Garrard, J., Rose, G., & Lo, S. (2008). Promoting transportation cycling for women: The role of bicycle infrastructure. Preventative Medicine, 56, 55-59.
Gatersleben, B., & Appleton, K. M. (2007). Contemplating cycling to work: Attitudes and perceptions in different stages of change. Transportation Research Part A: Policy and Practice, 41(4), 302-312.
Giles-Corti, B. & Donavan, R. (2002). The relative influence of individual, social and physical environmental determinants of physical activity. Social Science & Medicine, 54, 1793-1812.
Giles-Corti, B., Knuiman, M., Timperio, A., van Niel, K., Pikora, T., Bull, F. C. L., Bull, T. S., & Bulsara, M. (2008). Evaluation of the implementation of a state government community design policy aimed at increasing local walking: Design issues and baseline results from RESIDE, Perth western Australia. Preventative Medicine, 46, 46-54.
Goldsmith, S. (1992). Reasons why bicycling and walking are not being used more extensive travel modes. Washington, DC: US Dept. of Transportation.
Guell, C., Panter, J., & Ogilvie, D. (2013). Walking and cycling to work despite reporting an unsupportive environment: Insights from a mixed-method exploration of counterintuitive findings. BMC Public Health, 13(1), 1-10.
Hakim, A. A., Petrovitch, H., Burchfiel, C. M., Ross, G. W., Rodriguez, B. L., White, L. R., Yano, K., Curb, J. D., & Abbott, R. D. (1998). Effects of walking on mortality among nonsmoking retired men. N Engl J Med, 338(2), 94-99.
Hall, J., & Vredenburg, H. (2012). The challenges of innovating for sustainable development. MIT Sloan Management Review, 45(1).
Ham, S. A., Martin, S., & Kohl, I., H. (2008). Changes in the percentage of students who walk or bike to school--United States, 1969 and 2001. Journal of Physical Activity & Health, 5(2), 205-215.
Hancock, L., & Nuttman, S. (2014). Engaging higher education institutions in the challenge of sustainability: Sustainable transport as a catalyst for action. Journal of Cleaner Production, 62(1), 62-71.
Handy, S. L., & Xing, Y. (2011). Factors correlated with bicycle commuting: A study in six small US cities. International Journal of Sustainable Transportation, 5(2), 91-110.
Handy, S. L., Xing, Y., & Buehler, T. J. (2010). Factors associated with bicycle ownership and use: A study of six small U.S. cities. Transportation, 37(6), 967-985.

116
Harris, K. W. (2011). Bike to the future. Futurist, 45(2), 25-28.
Hawthorne, W. (1989). Why Ontarians walk, why Ontarians don't walk more: A study of the walking habits of Ontarians. Ontario: Energy Probe Research Foundation.
Haynes, G., Dunnagan, T., & Christopher, S. (2003). Determinants of alcohol use in pregnant women at risk for alcohol consumption. Neurotoxicology and Teratology, 25(6), 659-666.
HealthyPeople.gov. (2013). MAP-IT healthy people 2020. Retrieved from http://www.healthypeople.gov/2020/implement/MapIt.aspx
Heinen, E., & Handy, S. L. (2012). Similarities in attitudes and norms and their effect on the decision to commute by bicycle: Evidence from two bicycle cities, Davis and Delft. International Journal of Sustainable Transportation, 6(5), 257-281.
Heinen, E., van Wee, B., & Maat, K. (2010). Commuting by bicycle: An overview of the literature. Transport Reviews, 30(1), 59-96.
Herlihy, D. V. (2004). Bicycle: The history. (pp. 216-217) Yale University Press.
Ho, J. Y., & Preston, S. H. (2010). US mortality in an international context: Age variations. Population and Development Review, 36(4), 749-773.
Hughes, T. (2010). City planners track cyclists, pedestrians to measure trail needs. Retrieved from http://usatoday30.usatoday.com/news/nation/2010-05-10-bike-counters_N.htm
Hunt, H. (2012). Bike friendly campus initiatives. (Unpublished). Indiana University, Bloomington, IN.
Institute of Medicine of the National Academies. (2013). US health in international perspective: Shorter lives, poorer health. Washington, DC: The National Institutes of Health.
Insurance Institute for Highway Safety Highway Loss Data Institute. (2015). Fatality facts: Pedestrians and bicyclists. Retrieved from http://www.iihs.org/iihs/topics/t/pedestrians-and-bicyclists/fatalityfacts/bicycles
Ising, H., Dienel, D., Gunther, T., & Markert, B. (1980). Health effects of traffic noise. International Archives of Occupational and Environmental Health, 47, 179-190.
Jacobsen, P. L. (2003). Safety in numbers: More walkers and bicyclists, safer walking and bicycling. Injury Prevention, 9, 205-209.
Jacobsen, P. L., Racioppi, F., & Rutter, H. (2009). Who owns the roads? How motorized traffic discourages walking and bicycling. Injury Prevention, 15(6), 369-373.

117
Jacobson, P. D., & Gostin, L. O. (2010). Reducing distracted driving: Regulation and education to avert traffic injuries and fatalities. Journal of the American Medical Association, 303(14), 1419-1420.
Jin-Hyung Lee, Scott, D., & Moore, R. L. (2002). Predicting motivations and attitudes of users of a multi-use suburban trail. Journal of Park & Recreation Administration, 20(3), 18-37.
John, A., & Najafi, F. Z. (2011). Influential factors of bicycle helmet use: A case study of the university of Florida in Alachua county. ASEE Southeast Section Conference, Charleston, SC.
Joshi, M. S., Senior, V., & Smith, G. P. (2001). A diary study of the risk perceptions of road users. Health, Risk & Society, 3(3), 261-279.
Kaczynski, A. T., Bopp, M. J., & Wittman, P. (2010). Association of workplace supports with active commuting. Preventing Chronic Disease, 7(6), A127.
Kaufman, F. R. (2002). Type 2 diabetes mellitus in children and youth: A new epidemic. J Pediatr Endocrinol Metab, Suppl 2, 737-744.
Kennedy, A., Sloman, F., Douglass, J. A., & Sawyer, S. M. (2007). Young people with chronic illness: The approach to transition. Internal Medicine Journal, 37(8), 555-560.
King, A. C., Jeffery, R. W., Fridinger, F., Dusenbury, L., Provence, S., Hedlund, S. A., & Spangler, K. (1995). Environmental and policy approaches to cardiovascular disease prevention through physical activity: Issues and opportunities. Health Education & Behavior, 22(4), 499-511.
Klein, G. R., Levine, B. R., Hozack, W. J., Strauss, E. J., D'Antonio, J. A., Macaulay, W., & Di Cesare, P. E. (2007). Consensus guidelines based on a survey of the hip society and American association of hip and knee surgeons. The Journal of Anthroplasty, 22(2), 171-175.
Kuhnimhof, T., Chlond, B., & Huang, P. (2010). Multimodal travel choices of bicyclists: Multiday data analysis of bicycle use in Germany. Transportation Research Record: Journal of the Transportation Research Board, (2190), 19-27.
Lavery, T. A., Paez, A., & Kanaroglou, P. S. (2013). Driving out of choices: An investigation of transport modality in a university sample. Transportation Research Part A: Policy and Practice, 57, 37-46.
Lawson, A. R., Pakrashi, V., Ghosh, B., & Szeto, W. Y. (2013). Perception of safety of cyclists in Dublin city. Accident Analysis and Prevention, 50, 499-511.
118
League of American Bicyclists. (2009). American community survey: Bicycling commuting trends, 2000 to 2008. Retrieved from http://bikeleague.org/content/bicycle-commuting-trends-2000-2008
League of American Bicyclists. (2012). Alabama BFS report card. Retrieved from http://www.bikeleague.org/programs/bicyclefriendlyamerica/bicyclefriendlystate/bfs_report_cards/alabama.pdf
League of American Bicyclists. (2012). Communities. Retrieved from http://www.bikeleague.org/content/communities
League of American Bicyclists. (2013). Bicycle friendly America program. Retrieved from http://www.bikeleague.org/programs/bicyclefriendlyamerica/index_about.php
League of American Bicyclists. (2013). Ride smart. Retrieved from http://bikeleague.org/ridesmart
League of American Bicyclists. (2014a). Bicycle friendly state: 2014 ranking. Retrieved from http://bikeleague.org/sites/default/files/2014_state_ranking_chart.pdf
League of American Bicyclists. (2014b). The building blocks of a bicycle friendly community. Retrieved from http://bikeleague.org/sites/default/files/BFC%20infographic.pdf
League of American Bicyclists. (2014c). Current bicycle friendly communities 2014. Retrieved from http://bikeleague.org/sites/default/files/BFC_Master_List%20Spring_2014%20Fall%202013%20Master%20List.pdf
League of American Bicyclists. (2014d). Bicycle friendly state: Washington 2014 report card. Retrieved from http://bikeleague.org/sites/default/files/BFS2014_Washington.pdf
League of American Bicyclists. (2014e). Bicycle friendly state: Alabama state 2014 report card. Retrieved from http://bikeleague.org/sites/default/files/BFS2014_Alabama.pdf
League of American Bicyclists. (2014f). Nine of top 10 national universities now BFUs. Retrieved from http://bikeleague.org/content/9-top-10-national-universities-now-bfus
League of American Bicyclists. (2014g). Bicycle friendly university all awards through 2014. Retrieved from http://bikeleague.org/sites/default/files/BFU_Master_Award_List_2014_.pdf
Lee, C. D., & Blair, S. N. (2002). Cardiorespiratory fitness and stroke mortality in men. Medicine and Science in Sports and Exercise, 34, 592-595.
Li, C., Ford, E. S., Zhao, G., & Mokdad, A. H. (2009). Prevalence of pre-diabetes and its association with clustering of cardiometabolic risk factors and hyperinsulinemia among US adolescents: NHANES 2005-2006. Diabetes Care, 32, 342-347.

119
Li, M. W., Orr, N., Bindon, J., & Rissel, C. (2005). Promoting active transport in a workplace setting: Evaluation of a pilot study in Australia. Health Promotion International, 20(2), 123-133.
Lowry, M. B., Callister, D., Gresham, M., & Moore, B. (2012). Using bicycle level of service to asses community-wide bikeability. Transportation Research Record: Journal of the Transportation Research Board, 1-15.
Lumsdon, L., & Tolley, R. (2001). The national cycle strategy in the UK: To what extent have local authorities adopted its mode strategy approach? Journal of Transport Geography, 9, 293-301.
Lundberg, C. C. (2003). Review of research design: Qualitative, quantitative, and mixed methods approaches. Organizational Research Methods, 6, 404-414.
Luoto, R., Latikka, P., Pukkala, E., Hakulinen, T., & Vihko, V. (2000). The effect of physical activity on breast cancer risk: A cohort study of 30,548 women. Eur J Epidemiol, 16, 973-980.
Lusk, A. C., Furth, P. G., Morency, P., Miranda-Moreno, L. F., Willett, W. C., & Dennerlein, J. T. (2010). Risk of injury for bicycling on cycle tracks versus in the street. Injury Prevention, 17(2), 131.
Lynott, J., Haase, J., Nelson, K., Taylor, A., Twaddell, H., Ulmer, J., McCann, B. & Stollof, E. R. (2009). Planning complete streets for an aging America. Washington, DC: AARP Policy Institute.
Macmillan, A., Connor, J., Witten, K., Kearns, R., Rees, D., & Woodward, A. (2014). The societal costs and benefits of commuter bicycling: Simulating the effect of specific policies using system dynamics modeling. Environmental Health Perspectives, 122, 335-344.
Mapes, J. (2009). Pedeling revolution. (2nd ed.). Corvalis, OR: Oregon State University Press.
McClean, M. (2012). Strategies for increasing bikeability: A closer look at the St. Louis regional bike plan. (Unpublished Master's). Washington University, St. Louis, MO.
McDonald, N. C., & Aalborg, A. E. (2009). Why parents drive children to school: Implications for safe routes to school programs. Journal of the American Planning Association, 75(3).
McKenzie, B. (2014). Modes less traveled--bicycling and walking to work in the United States: 2008-2012. (No. ACS-25). Washington, DC: United States Census Bureau.
Merom, D., Miller, Y., Lymer, S., & Bauman, A. (2005). Effect of Australia’s walk to work day campaign on adults' active commuting and physical activity behavior. American Journal of Health Promotion, 19(3), 159-159.

120
Merriam-Webster. (2015). Definition of velodrome. Retrieved from http://www.merriam-webster.com/dictionary/velodrome
Ministerie van Verkeer en Waterstaat. (2009). Cycling in the Netherlands. Retrieved from http://www.fietsberaad.nl/library/repository/bestanden/CyclingintheNetherlands2009.pdf
Miranda, M. L., Maxson, P., & Edwards, S. (2009). Environmental contributions to disparities in pregnancy outcomes. Epidemiologic Reviews, 31, 67-83.
Moritz, W. E. (1997). Survey of North American bicycle commuters: Design and aggregate results. Transportation Research Record, 1578, 91-101.
Morris, J. N., Heady, J. A., Raffle, P. A. B., Roberts, C. G., & Parks, J. W. (1953). Coronary heart disease and physical activity of work. The Lancet, 2, 1111-1120.
Moudon, A. V., Lee, C., Cheadle, A. D., Collier, C. W., Johnson, D., Schmid, T. L., & Weather, R. D. (2005). Cycling and the built environment, a US perspective. Transportation Research Part D: Transport and Environment, 10(3), 245-261.
Mutrie, N., Carney, C., Blamey, A., Crawford, F., Aitchison, T., & Whitelaw, A. (2002). "Walk in to walk out": A randomized controlled trial of self-help intervention to promote active commuting. J Epidemiol Community Health, (56), 407-412.
Nankervis, M. (1999). The effect of weather and climate on bicycle commuting. Transportation Research Part A: Policy and Practice, 33(6), 417-431.
NAYGA, R. M. (1997). Impact of sociodemographic factors on perceived importance of nutrition in food shopping. Journal of Consumer Affairs, 31(1), 1-9.
Nelson, A., & Allen, D. (1997). If you build them, commuters will use them: Association between bicycle facilities and bicycle commuting. Transportation Research Board, 1578, 79-83.
NHSTA. (2008). Volume I: Summary report. National survey of bicyclist and pedestrian attitudes and behavior.
NHSTA. (2012). Bikeability checklist. Retrieved from http://www.nhtsa.gov/people/injury/pedbimot/bike/bikeability/
NHTSA. (2014). Traffic safety facts: 2012 data. Washington, DC: Department of Transportation.
Northrup, D. (1996). Problem of the self-report in survey research. Institute of Social Research, 11(3), 834-835.
Office of Behavioral & Social Sciences Research. (2014). Important theories and their key constructs. Retrieved from http://www.esourceresearch.org/Default.aspx?TabId=736

121
Ogden, C. L., Carroll, M. D., Kit, B. L., & Flegal, K. M. (2014). Prevalence of childhood and adult obesity in the United States, 2011-2012. Journal of the American Medical Association, 311(8), 806-814.
Ogilvie, D., Bull, F., Powell, J., Cooper, A. R., Brand, C., Mutrie, N., Preston, J. & Rutter, H. (2011). An applied ecological framework for evaluating infrastructure to promote walking and cycling: The iConnect study. American Journal of Public Health, 101(3), 473-481.
Ogilvie, D., Egan, M., Hamilton, V., & Petticrew, M. (2004). Promoting walking and cycling as an alternative to using cars: Systematic review. British Medical Journal, 1-5.
Oja, P., Manttari, A., Heinonen, A., Kukkonen-Harjula, K., Laukkanen, R., Pasanen, M., & Vuori, I. (1991). Physiological effects of walking and cycling to work. Scandinavian Journal of Medicine, Science and Sports, 1, 151-157.
Oja, P., Vuori, I., & Paronen, O. (1998). Daily walking and cycling to work: Their utility as health-enhancing physical activity. Patient Education and Counseling, 33, S87-S94.
Paez, A., & Whalen, K. (2010). Enjoyment of commute: A comparison of different transportation modes. Transportation Research Part A: Policy and Practice, 44(7), 537-549.
Panter, J. R., & Jones, A. (2010). Attitudes and the environment as determinants of active travel in adults: What do and don't we know? Journal of Physical Activity & Health, 7(4), 551-561.
Parker, K. M., Gustat, J., & Rice, J. C. (2011). Installation of bicycle lanes and increased ridership in an urban, mixed-income setting in New Orleans, Louisiana. Journal of Physical Activity & Health, 8, S98-S102.
Pelz, J. B., & Rothkopf, C. (2007). Oculomotor behavior in natural and man-made environments. Eye movements: A window on mind and brain. Amsterdam: Elsevier.
Penedo, F. J., & Dahn, J. R. (2005). Exercise and well-being: A review of mental and physical health benefits associated with physical activity. Current Opinion in Psychiatry, 18(2), 189-193.
Pfaum, D. (2011). In Hamilton H., Hager J. (Eds.), Minneapolis bicycle master plan. Minneapolis, MN: Minneapolis Public Works.
Pikora, T., Giles-Corti, B., Bull, F., Jamrozik, K., & Donovan, R. (2003). Developing a framework for assessment of the environmental determinants of walking and cycling. Social Science & Medicine, 56, 1693-1703.
Polit, D. F., Beck, C. T., & Hungler, B. P. (2001). Essentials of nursing research: Methods, appraisal and utilization. (5th ed.). Philadelphia, PA: Lippincott.

122
Pongsiri, M. J., & Roman, J. (2007). Examining the links between biodiversity and human health: An interdisciplinary research initiative at the US environmental protection agency. Ecohealth, 4, 82-85.
Pooley, C. G., & Turnbull, J. (2000). Modal choice and modal change: The journey to work in Britain since 1980. Journal of Transport Geography, 8, 11-24.
Pope, N. B. (2010). An examination of the socio-demographic characteristics and perceptions of cycling among students at Georgia State University. (Unpublished Public Health Master's). Georgia State University.
Pucher, J. (2001). Cycling safety on bikeways vs. roads. Transportation Quarterly, 55(4), 1-3.
Pucher, J., & Buehler, R. (2008). Cycling for everyone: Lessons from Europe. Transportation Research Record: Journal of the Transportation Research Board, , 58-65.
Pucher, J., Buehler, R., & Seinen, M. (2011). Bicycling renaissance in North America? An update and re-appraisal of cycling trends and polices. Transportation Research Part A, 45, 451.
Pucher, J., & Dijkstra, L. (2000). Making walking and cycling safer: Lessons from Europe. Transportation Quarterly, 54(3), 2-33.
Pucher, J., & Dijkstra, L. (2003). Promoting safe walking and cycling to improve public health: Lessons from the Netherlands and Germany. American Journal of Public Health, 93(9), 1509-1517.
Pucher, J., Dill, J., & Handy, S. (2010). Infrastructure, programs, and policies to increase bicycling: An international review. Preventative Medicine, 50, s106-s125.
Pucher, J., Thorwaldson, L., Buehler, R., & Klein, N. (2010). Cycling in New York: Innovative policies at the urban frontier. World Transport Policy and Practice, 16, 1-54.
Pucher, J., Komanoff, C., & Schimek, P. (1999). Bicycling renaissance in North America? Recent trends and alternative policies to promote bicycling. Transportation Research Part A: Policy and Practice, 33(7-8), 625-654.
Qualtrics. (2014). Passing information through web services. Retrieved from http://www.qualtrics.com/university/researchsuite/developer-tools/api-integration/passing-information-through-web-services/
Quine, L., Rutter, D. R. & Arnold, L. (1998). Predicting and understanding safety helmet use among schoolboy cyclists: a comparison of the Theory of Planned Behavior and the Health Belief Model. Psychology and Health, 13(2), 251-269.

123
Raghunathan, T. E. (2004). What do we do with missing data: Some options for analysis of incomplete data. Annu Rev Public Health, 25, 99-117.
Rennings, K. (2000). Redefining innovation--eco-innovation research and the contribution from ecological economics. Ecological Economics, 32, 319-332.
Replogle, M. (1992). Bicycle and pedestrian policies and programs in Asia, Australia and New Zealand. Washington, DC: US Department of Transportation.
Retting, R. A., Ferguson, S. A., & McCartt, A. T. (2003). A review of evidence-based traffic engineering measures designed to reduce pedestrian-motor vehicle crashes. American Journal of Public Health, 93(9), 1456-1463.
Rissel, C., Mulley, C., & Ding, D. (2013). Travel mode and physical activity at Sydney University. International Journal of Environmental Research and Public Health, 10(8), 3563-3577.
Robinson, D. (2005). Safety in number in Australia: More walkers and bicyclists, safer walking and cycling. Health Promotion Journal of Australia, 16, 47-51.
Rojas-Rueda, D., de Nazelle, A., Tainio, M., & Nieuwenhuijsen, M. J. (2011). The health risks and benefits of cycling in urban environments compared with car use: Health impact assessment study. British Medical Journal, 343, d4521.
Rosenstock, I. (1974). Historical origins of the Health Belief Model. Health Behavior, 2(4), 328-335.
Ross, T. P., Thomson Ross, L., Rahman, A., & Cataldo, S. (2010). The bicycle helmet attitudes scale: Using the health belief model to predict helmet use among undergraduates. Journal of American College Health, 59(1), 29-36.
Rowell, A., & Fergusson, M. (1991). Bikes not fumes: The emission and health benefits of a modal shift from motor vehicles to cycling: A report for the cyclists' touring club. Godalming, Great Britain: Earth Resources Research Ltd.
Royal, D., & Miller-Steiger, D. (2008). Volume II: Findings report national survey of bicyclist and pedestrian attitudes and behavior. no. DOT HS 810 972. safety tips--bicycles. Retrieved from http://www.txdot.gov/safety/tips/bicycles.htm
Rybarczyk, G., & Gallagher, L. (2014). Measuring the potential for bicycling and walking at a metropolitan commuter university. Journal of Transport Geography, 39, 1-10.
Saelens, B. E., Sallis, J. F., & Frank, L. D. (2003). Environmental correlates of walking and cycling: Findings from the transportation, urban design, and planning literatures. Annals of Behavioral Medicine, 25(2), 80-91.

124
Sahlqvist, S. L., & Heesch, K. C. (2012). Characteristics of utility cyclists in Queensland, Australia: An examination of the associations between individual, social, and environmental factors and utility cycling. Journal of Physical Activity & Health, 9(6), 818-828.
Sallis, J. F., Cervero, R. B., Ascher, W., Henderson, K. A., Kraft, M. K., & Kerr, J. (2006). An ecological approach to creating active living communities. Annu Rev Public Health, 27, 297-322.
Sallis, J. F., Frank, L. D., Saelens, B. E., & Kraft, M. K. (2004). Active transportation and physical activity: Opportunities for collaboration on transportation and public health research. Transportation Research Part A: Policy and Practice, 38(4), 249-268.
Schneider, K. L., Clark, M. A., Rakowski, W., & Lapane, K. L. (2012). Evaluating the impact of non-response bias in the behavioral risk factor surveillance system (BRFSS). J Epidemiol Community Health, 66, 290-295.
Shang, H., Lin, W., & Huang, H. (2007). Empirical study of parking problem on university campus. Journal of Transportation Systems Engineering and Information Technology, 7(2), 135-140.
Shannon, T., Giles-Corti, B., Pikora, T., Bulsara, M., Bull, F., & Shilton, T. (2006). Active commuting in a university setting: Assessing commuting habits and potential for modal change. Transport Policy, 13(3), 240-253.
Sharman, J. E. (2005). Clinicians prescribing exercise: Is air pollution a hazard? The Medical Journal of Australia, 182(12), 606-607.
Shephard, R. J. (2008). Is active commuting the answer to population health? Sports Medicine, 38(9), 751.
Shinkle, D., & Teigen, A. (2008). Encouraging bicycling and walking: The state legislative role. Washington, DC: National Conference of State Legislatures.
Simon, M. K. (2011). Dissertation and scholarly research: Recipes for success. Seattle, WA: Dissertation Success, LLC.
Sisson, S. B., & Tudor-Locke, C. (2008). Comparison of cyclists' and motorists' utilitarian physical activity at an urban university. Preventative Medicine, 46(1), 77-792.
Smith, D. T., & Appleyard, D. (1981). Improving the residential street environment--final report. (No. FHWA-RD-81/031). Washington, DC: US Department of Transportation.
Sothern, M. S., Loftin, M., Suskind, R. M., Udall, J. N., & Blecker, U. (1999). The health benefits of physical activity in children and adolescents: Implications for chronic disease prevention. Eur J Pediatr, 158, 271-274.

125
Spielberg, F. (1989). The traditional neighborhood development: How will traffic engineers respond? ITE Journal, 59, 18.
Stigell, E. (2011). Assessment of active commuting behavior--walking and bicycling in greater Stockholm (Doctorate).
Stokols, D. (1996). Translating social ecological theory into guidelines for community health promotion. American Journal of Health Promotion, 10(4), 282-298.
Stokols, D. (2000). Social ecology and behavioral medicine: Implications for training, practice, and policy. Behavioral Medicine, 26, 129-138.
Stoler, F. D. (2013). Childhood obesity. Retrieved from http://www.acsm.org/docs/current-comments/childhoodobesitytemp.pdf
Szumilas, M. (2010). Explaining odds ratios. Journal of the Canadian Academy of Child and Adolescent Psychiatry, 19(3), 227-229.
Taylor, K., Kingham, S., & Koorey, G. (2009). Impacts of transport: Encouraging potential cyclists. Environmental Health, 8(47), 1-6.
Telfer, B., Rissel, C., Bindon, J., & Bosch, T. (2006). Encouraging cycling through a pilot cycling proficiency-training program among adults in central Sydney. Journal of Science and Medicine in Sport, 9(1), 151-156.
The Office of the Federal Environmental Executive. (2010). Implementing a successful bicycle and active commuting program in the Washington, DC metropolitan area. Washington, DC: Office of the Federal Environmental Executive.
Thornton, A., Evans, L., Bunt, K., Simon, A., King, S. & Webster, T. (2011). Climate change and transport choices. Retrieved from http://assets.dft.gov.uk/publications/climate-change-transport-choices/climate-change-transport-choices-full.pdf
Tilahun, N. Y., Levinson, D. M., & Krizek, K. J. (2007). Trails, lanes, or traffic: Valuing bicycle facilities with an adaptive stated preference survey. Transportation Research Part A: Policy and Practice, 41(4), 287-301.
Timperio, A., Ball, K., Salmon, J., Roberts, R., Giles-Corti, B., Simmons, D., Baur, L. A., & Crawford, D. (2006). Personal, family, social, and environmental correlates of active commuting to school. American Journal of Preventive Medicine, 30(1), 45-51.
Titze, S., Giles-Corti, B., Knuiman, M. W., Pikora, T. J., Timperio, A., Bull, F. C., & van Niel, K. (2010). Associations between intrapersonal and neighborhood environmental characteristics and cycling for transport and recreation in adults: Baseline results from the RESIDE study. Journal of Physical Activity & Health, 7(4), 423-431.

126
Titze, S., Stronegger, W. J., Janschitz, S., & Oja, P. (2007). Environmental, social, and personal correlates of cycling for transportation in a student population. Journal of Physical Activity & Health, 4(1), 66-79.
Titze, S., Stronegger, W. J., Janschitz, S., & Oja, P. (2008). Association of built-environment, social-environment and personal factors with bicycling as a mode of transportation among Austrian city dwellers. Preventative Medicine, 47(3), 252-259.
Tolley, R. (1996). Green campuses: Cutting the environmental cost of commuting. Journal of Transport Geography, 4(3), 213-217.
Toor, W., & Haylick, S. W. (2004). Transportation & sustainable campus communities: Issues, examples, and solutions. Washington, DC: Island Press.
Troped, P. J., Saunders, R. P., Pate, R. R., Reininger, B., & Addy, C. L. (2003). Correlates of recreation and transportation physical activity among adults in a New England community. Preventative Medicine, 37(4), 304-310.
UA News. (2013). Growing with quality. Retrieved from http://www.ua.edu/features/enrollment.html
UAPD. (2013). Cyclist involved accident report. Tuscaloosa, AL: UAPD.
UAPD. (2014). Cyclist involved accident report. Tuscaloosa, AL: UAPD.
UC Davis. (2012). Bicycling education & advice. Retrieved from http://taps.ucdavis.edu/bicycle/education
United Health Foundation. (2012). 2012 Alabama health statistics. Retrieved from http://www.americashealthrankings.org/AL
United States Department of Transportation Federal Highway Administration. (1992). National bicycling and walking study: Case study number one: Reasons why bicycling and walking are not being used more extensively as travel modes. Washington, DC.
University of Alabama. (2013). Growing with quality. Retrieved from http://www.ua.edu/features/enrollment.html
University of Alabama. (2014). History of UA. Retrieved from http://www.ua.edu/history.html
University of Alabama. (2014b). Quick facts: Demographics. Retrieved from http://www.ua.edu/quickfacts/demographics.html
University Planning. (2007). 2007 campus master plan. Tuscaloosa, AL: University of Alabama.
University Planning. (2012). 2012 campus master plan. Tuscaloosa, AL: University of Alabama.

127
US Census Bureau. (2010a). American fact finder: 1990 decennial census. Washington, DC: US Department of Commerce.
US Census Bureau. (2010b). American fact finder: 2000 decennial census. Washington, DC: US Department of Commerce.
US Census Bureau. (2010c). American fact finder: 2000-2008 American community survey, journey to work. Washington, DC: US Department of Commerce.
Public law 110-343, An ActU.S.C. Sec. 211 (2008). Emergency Economic Stabilization Act of 2008. Retrieved from http://www.gpo.gov/fdsys/pkg/PLAW-110publ343/html/PLAW-110publ343.htm
US Climate Data. (2015). Climate Tuscaloosa - AL. Retrieved from http://www.usclimatedata.com/climate/tuscaloosa/alabama/united-states/usal0542
US Congress. (1991). Intermodal surface transportation efficiency act of 1991. Public Law, 102-240.
US Congress. (1998). Transportation Equity Act for the 21st Century. Public Law, 105-178.
US Department of Health and Human Services. (2012). Vital and health statistics. Retrieved from http://www.cdc.gov/nchs/data/series/sr_10/sr10_256.pdf#page=9
US Department of Health and Human Services (HHS), Office of Disease Prevention and Health Promotion. (2008). Physical activity guidelines advisory committee report, 2008. Washington: HHS.
US Department of Transportation. (2010). National highway transportation survey. Retrieved from http://nhts.ornl.gov/det/Extraction3.aspx
US Department of Transportation. (2010). Policy statement on bicycle and pedestrian accommodation regulations and recommendations, Press Release. Retrieved from http://www. dot. gov/affairs/2010/bicycle-ped
US Department of Transportation. (2014). Bicycle and pedestrian policy accommodation. Retrieved from http://www.fhwa.dot.gov/environment/bicycle_pedestrian/overview/policy_accom.cfm
US Department of Transportation: National Highway traffic Safety Administration. (2013). Bikeability checklist. Retrieved from http://www.pedbikeinfo.org/pdf/bikeability_checklist.pdf
US EPA. (2011). Final report of the US environmental protection agency office of air and radiation. The benefits and costs of the clean air act: 1990 to 2020. (pp. 5-10)

128
USDHHS. (1996). Physical activity and health: A report of the surgeon general. Atlanta, GA: US Department of Health and Human Services, Centers for Disease Control and Prevention, National Center for Chronic Disease Prevention and Health Promotion.
USDHHS. (2014a). Environmental health--healthy people. Retrieved from http://www.healthypeople.gov/2020/topicsobjectives2020/objectiveslist.aspx?topicId=12
USDHHS. (2014b). History & development of healthy people. Retrieved from http://www.healthypeople.gov/2020/about/history.aspx
USDHHS. (2014c). Physical activity objectives--PA-1. Retrieved from http://www.healthypeople.gov/2020/topicsobjectives2020/objectiveslist.aspx?topicId=33
USDHHS. (2014d). Physical activity objectives--PA-2. Retrieved from http://www.healthypeople.gov/2020/topicsobjectives2020/objectiveslist.aspx?topicId=33
van Wijnen, J., Verhoeff, A., Jans, H., & van Bruggen, M. (1995). The exposure of cyclists, car drivers and pedestrians to traffic-related air pollutants. International Archives of Occupational and Environmental Health, 67(3), 187-193.
VanZerr, M. (2009). Resident perceptions of bicycle boulevards: A Portland, Oregon case study. (Unpublished Masters of Urban and Regional Planning Degree). Portland State University, Portland, OR.
Vettore, M. V., Gama, Silvana Granado Nogueira da, Lamarca, G. d. A., Schilithz, A. O. C., & Leal, M. d. C. (2010). Housing conditions as a social determinant of low birthweight and preterm low birthweight. Revista De Saúde Pública, 44(6), 1021-1031.
Vuori, I., Oja, P., & Paronen, O. (1994). Physically active commuting to work--testing its potential for exercise promotion. Medicine and Science in Sports and Exercise, 26(7), 844-850.
Wahlgren, L. & Schantz, P. (2011). Bikeability and methodological issues using the active commuting route environment scale (ACRES) in a metropolitan setting. BMC Medical Research Methodology, 11(6), 1-20.
Wannamethee, S. G., Shaper, A. G., & Alberti, K. G. M. M. (2000). Physical activity, metabolic factors and the incidence of coronary heart disease and type 2 diabetes. Archives of Internal Medicine, 30, 193-206.
Wegman, F., Zhang, F., & Dijkstra, A. (2012). How to make more cycling good for road safety? Accident Analysis and Prevention, 44, 19-29.
Wejnert, B. (2002). Integrating models of diffusion of innovations: A conceptual framework. Annual Review of Sociology, 28, 297-326.

129
WHO. (2006). Health risks of ozone from long-range transboundary air pollution. European Centre for Environment and Health, Bonn: Joint WHO/Convention Task Force on the Health Aspects of Air Pollution.
Wilkinson, R. G., & Marmot, M. G. (2003). Social determinants of health: The solid facts World Health Organization.
Winters, M., & Teschke, K. (2010). Route preferences among adults in the near market for bicycling: Findings of the cycling in cities study. American Journal of Health Promotion, 25(1), 40-47.
Witte, K., Stokols, D., Ituarte, P., & Schneider, M. (1993). Testing the Health Belief Model in a field study to promote bicycle safety helmets. Communication Research, 20(4), 564-586.
Woodcock, J., Edwards, P., Tonne, C., Armstrong, B., Ashiru, O., Banister, D., Beevers, S., & Roberts, I. (2009). Public health benefits of strategies to reduce greenhouse-gas emissions: Urban land transport. The Lancet, 374(9705), 1930-1943.
World Health Organization. (2002). Myths about physical activity; world health day factsheet. Retrieved from www.who.int/world-health-day
Wu, S., & Green, A. (2000). Projection of chronic illness prevalence and cost inflation. RAND Corporation.
Xing, Y., Handy, S. L., & Buehler, T. J. (2008). Factors associated with bicycle ownership and use: A study of 6 small US cities. Washington, DC: Transportation Research Board.
Yarbrough, S. S., & Braden, C. J. (2001). Utility of health belief model as a guide for explaining or predicting breast cancer screening behaviours. Journal of Advanced Nursing, 33(5), 677-688.
Zacharias, J. (2002). Bicycle in shanghai: Movement patterns, cyclist attitudes and the impact of traffic separation. Transport Reviews, 22(3), 309-322.
Zeeger, C. (1994). FHWA study tour for pedestrian and bicyclist safety in England, Germany, and the Netherlands. Washington, DC: US Department of Transportation.
130
APPENDIX A
INSTITUTIONAL REVIEW BOARD APPROVAL

131

132
APPENDIX B
INFORMED CONSENT

133

134
APPENDIX C
SURVEY

135
GENERAL INFORMATION ABOUT YOU AND HOW YOU GET TO CAMPUS
1. Gender Male Female 2. Age _____________ years 3. What is your race or ethnicity? Check all that
apply. American Indian/Alaska Native
Asian Black/African American Hispanic/Latino Native Hawaiian/Pacific Islander White Other:-
_________________________________________
Student 4. Are you an undergraduate or a graduate? Undergraduate
Skip to 5
Graduate
Skip to 7 Undergraduate 5. What year are you in college? Freshman
Sophomore
Junior
Senior
6. What is your major?
_________________________ Skip to 8
Graduate 7. What is your area of
study? _________________________
8. Where do you live? On Campus Residence Hall or Apartment.
Skip to 10
Off Campus
9. If off campus, how many miles is your commute
one-way to UA? _________ What is your home zip code?
___________________ Do not have
2nd mode Walk Bike Skate-
board Tuscaloosa Trolley
UA Bus
Carpool Automobile
Motorcycle
10. What is your primary mode of transportation to campus?
If you have a secondary mode of transportation, what is it?
11. Do you own or rent a bicycle here at UA? Yes
Skip to 12
No
Skip to 23
12. Is your bicycle registered? Yes
No
How many miles a week do you ride your bike?
_______miles
13. How do you use your bike? Check all that apply. Work
School
Shopping
Exercise
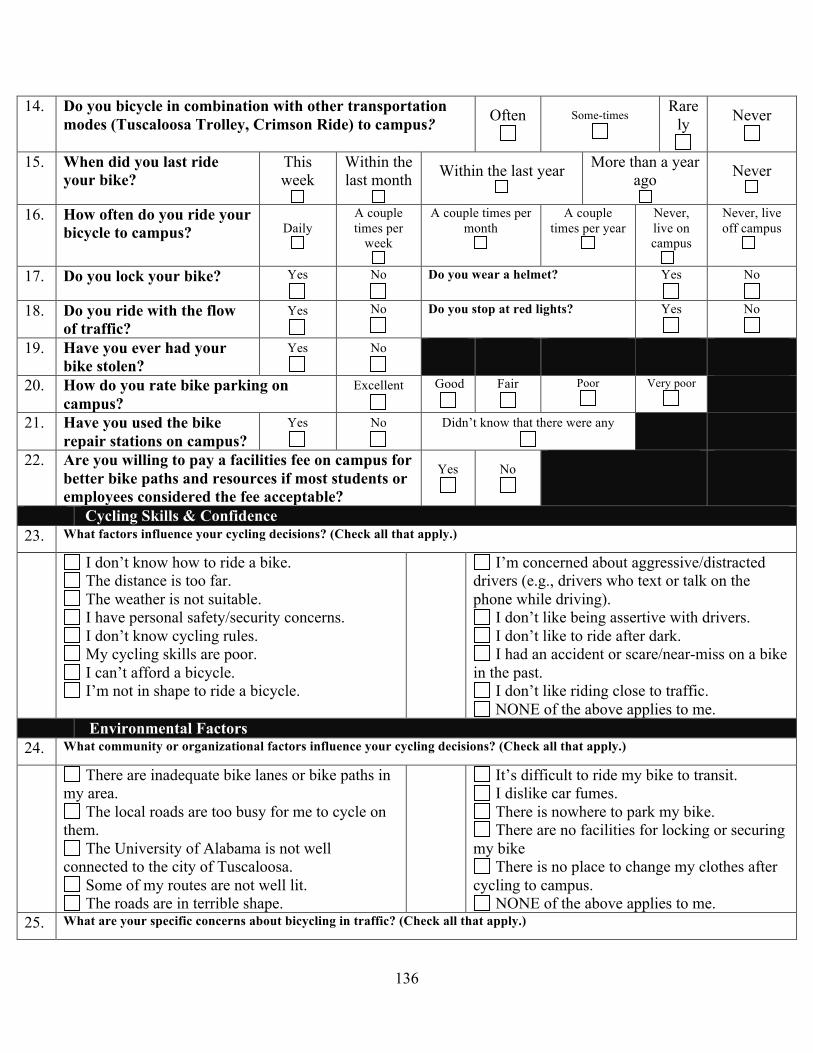
136
14. Do you bicycle in combination with other transportation modes (Tuscaloosa Trolley, Crimson Ride) to campus?
Often
Some-times
Rarely
Never
15. When did you last ride your bike?
This week
Within the last month
Within the last year
More than a year
ago
Never
16. How often do you ride your bicycle to campus? Daily
A couple times per
week
A couple times per month
A couple times per year
Never, live on campus
Never, live off campus
17. Do you lock your bike? Yes
No
Do you wear a helmet? Yes
No
18. Do you ride with the flow of traffic?
Yes
No
Do you stop at red lights? Yes
No
19. Have you ever had your bike stolen?
Yes
No
20. How do you rate bike parking on campus?
Excellent
Good
Fair
Poor
Very poor
21. Have you used the bike repair stations on campus?
Yes
No
Didn’t know that there were any
22. Are you willing to pay a facilities fee on campus for better bike paths and resources if most students or employees considered the fee acceptable?
Yes
No
Cycling Skills & Confidence 23. What factors influence your cycling decisions? (Check all that apply.)
I don’t know how to ride a bike. The distance is too far. The weather is not suitable. I have personal safety/security concerns. I don’t know cycling rules. My cycling skills are poor. I can’t afford a bicycle. I’m not in shape to ride a bicycle.
I’m concerned about aggressive/distracted drivers (e.g., drivers who text or talk on the phone while driving).
I don’t like being assertive with drivers. I don’t like to ride after dark. I had an accident or scare/near-miss on a bike
in the past. I don’t like riding close to traffic. NONE of the above applies to me.
Environmental Factors 24. What community or organizational factors influence your cycling decisions? (Check all that apply.)
There are inadequate bike lanes or bike paths in my area.
The local roads are too busy for me to cycle on them.
The University of Alabama is not well connected to the city of Tuscaloosa.
Some of my routes are not well lit. The roads are in terrible shape.
It’s difficult to ride my bike to transit. I dislike car fumes. There is nowhere to park my bike. There are no facilities for locking or securing
my bike There is no place to change my clothes after
cycling to campus. NONE of the above applies to me.
25. What are your specific concerns about bicycling in traffic? (Check all that apply.)

137
Volume of motor vehicles Speed of automobiles Moving vehicles Distracted driving (e.g., individuals who talk on
the phone, text, or use other devices while driving.) Possibility of bike being stolen while it’s parked Insufficient enforcement of both cycling and
traffic laws
Motorists who run red lights and stop signs. Vehicles turning right in front of me when
I’m going straight
Vehicles hitting me from behind when I’m cycling
Crossing at intersections NONE of the above applies to me.
26. What services/facilities would you be interested in using at UA if they were offered? (Check all that apply.)
Covered Parking Indoor Bike Parking Locker/shower Facilities Bike Lockers Bike Repair Classes Bike Safety Classes Ladies-only cycling classes Organized social cycling events Beginner cycling classes
More Direct Routes More bike lanes Wider lanes on the road Better Markings/Signage More Connectivity to Downtown/Shopping Better lighting along routes More bike racks near buildings More bike racks near commuter parking lots Ability to bring bike on Crimson Ride Other:
__________________________________________
Bike & Equipment 27. What specific issues about the bicycle influence your cycling decisions? (Check all that apply.)
I don’t know how to work the gears. I’m afraid that I’ll get stranded with a flat tire. I’m not confident in using a bike lock.
I can never get my brakes working right. I don’t know how to carry stuff on my bike. I am afraid that my bike will get stolen. NONE of these factors bother me.
Appearance 28. What appearance related factors influence your cycling decisions? (Check all that apply.)
My clothing while riding. Difficulty bringing spare clothing. Appearance after cycling (e.g., being red,
sweaty, disheveled). Helmets mess up my hair.
Looking/Feeling silly on a bike. No other people in area cycle. Other cyclists look fit and I don’t Inappropriate shoes NONE of the above.
How important would these factors be in
encouraging you to bicycle to campus more often?
Not at all Important
Not too Important
Neutral Somewhat
Important
Very Important
29. Need to purchase a bike/better bike 30. Bike racks closer to office/classes
31. More bike lanes on major streets.

138
32. Shower and changing facilities at the gym 33. Less or slower vehicular traffic on route to
campus. 34. Ability to take bicycle on Crimson Ride bus. 35. Other _______________________
If UA offered the following would it encourage you to bicycle to campus?
Very Likely Likely Unsure Unlikely Very Unlikely
36. Bicycle technique and safety classes 37. Bicycle maintenance classes
BIKE SHARE INFORMATION The University of Alabama provides free bicycles to use ON CAMPUS. If you checked one out, how often would you use them to…
Very Often Often Unsure
Sometimes
Not Very Often
38. Get from parking lots to classrooms or offices?
39. Get from offices/classrooms to other locations on campus (e.g. residence halls, The Ferg, library, The Strip, etc.)?
40. How likely would you be to use them to get from campus to other locations (Cobb Theater, Midtown Plaza, University Mall, Target, Walmart, other)?
Perceptions of Cycling Safety Disagree Somewhat
Disagree Unsure Somewhat
Agree Agree
41. I do not go fast enough to need head protection in a crash.
42. I feel that helmets are unnecessary for very short rides.
43. Bicycle helmets are less important for those who ride their bike infrequently.
44. When I’m bicycling, I am at risk of being injured by motor vehicles.
45. Bicycling is dangerous on slippery/wet roads. 46. There is a good chance that I could get hurt
while riding my bicycle.
47. If I am injured while riding my bike, it could seriously affect my social life.
48. If I am injured while riding my bike, it could seriously affect my ability to function at school.
49. Wearing a helmet would make me feel less anxious when I ride a bike.
50. Wearing a helmet while bicycling makes me feel safer.
51. I believe that wearing a helmet can prevent a serious head injury if I have a bicycle accident.
52. I would feel embarrassed wearing a bicycle helmet.

139
53. Quite frankly, wearing a helmet looks stupid. 54. The cost of helmets is generally more than
they are worth.
55. I would not want to spend money to buy a bicycle helmet.
56. I have several friends that routinely wear helmets when they ride.
57. My parents never made me wear a helmet when I was a child.
58. I recall seeing commercials, ads or posters about wearing a helmet while bicycling.
Physical Activity & Health On how many of the past 7 days did you: 0 1 2 3 4 5 6 7 59. Do moderate-intensity cardio or aerobic
exercise (such as a brisk walk) for at least 30 minutes?
60. Do vigorous-intensity cardio or aerobic exercise (such as jogging) for at least 20 minutes?
61. Do 8-10 strength-training exercises (such as resistance weight machines) for 8-12 repetitions each?
Poor Fair Good Very Good Excellent 62. How would you describe your general health?
63. What suggestions do you have for improving biking at UA?
Thank you!